
普罗米羞
177 Posts

普罗米羞
Report
Block User
Opinions are mine. Markets decide.共识形成前下注,共识形成后离场。
High-Frequency Trader
5.5 Years
11 Following
4 Followers
14 Liked
Posts
All
Quotes
Videos
·
--
BTC crashed to 67,181, and half a million people on the Square are sharing the same roadmap: 67K is a bear trap; once the shakeout is over, straight to 100K. AKE rose 187% that same day, and they were happier than anyone.
The money hasn’t left; people just aren’t willing to sit it out on $BTC anymore.
BTC crashed to 67,181, and half a million people on the Square are sharing the same roadmap: 67K is a bear trap; once the shakeout is over, straight to 100K. AKE rose 187% that same day, and they were happier than anyone.
The money hasn’t left; people just aren’t willing to sit it out on $BTC anymore.
The money hasn’t left; people just aren’t willing to sit it out on $BTC anymore.

62
·
--
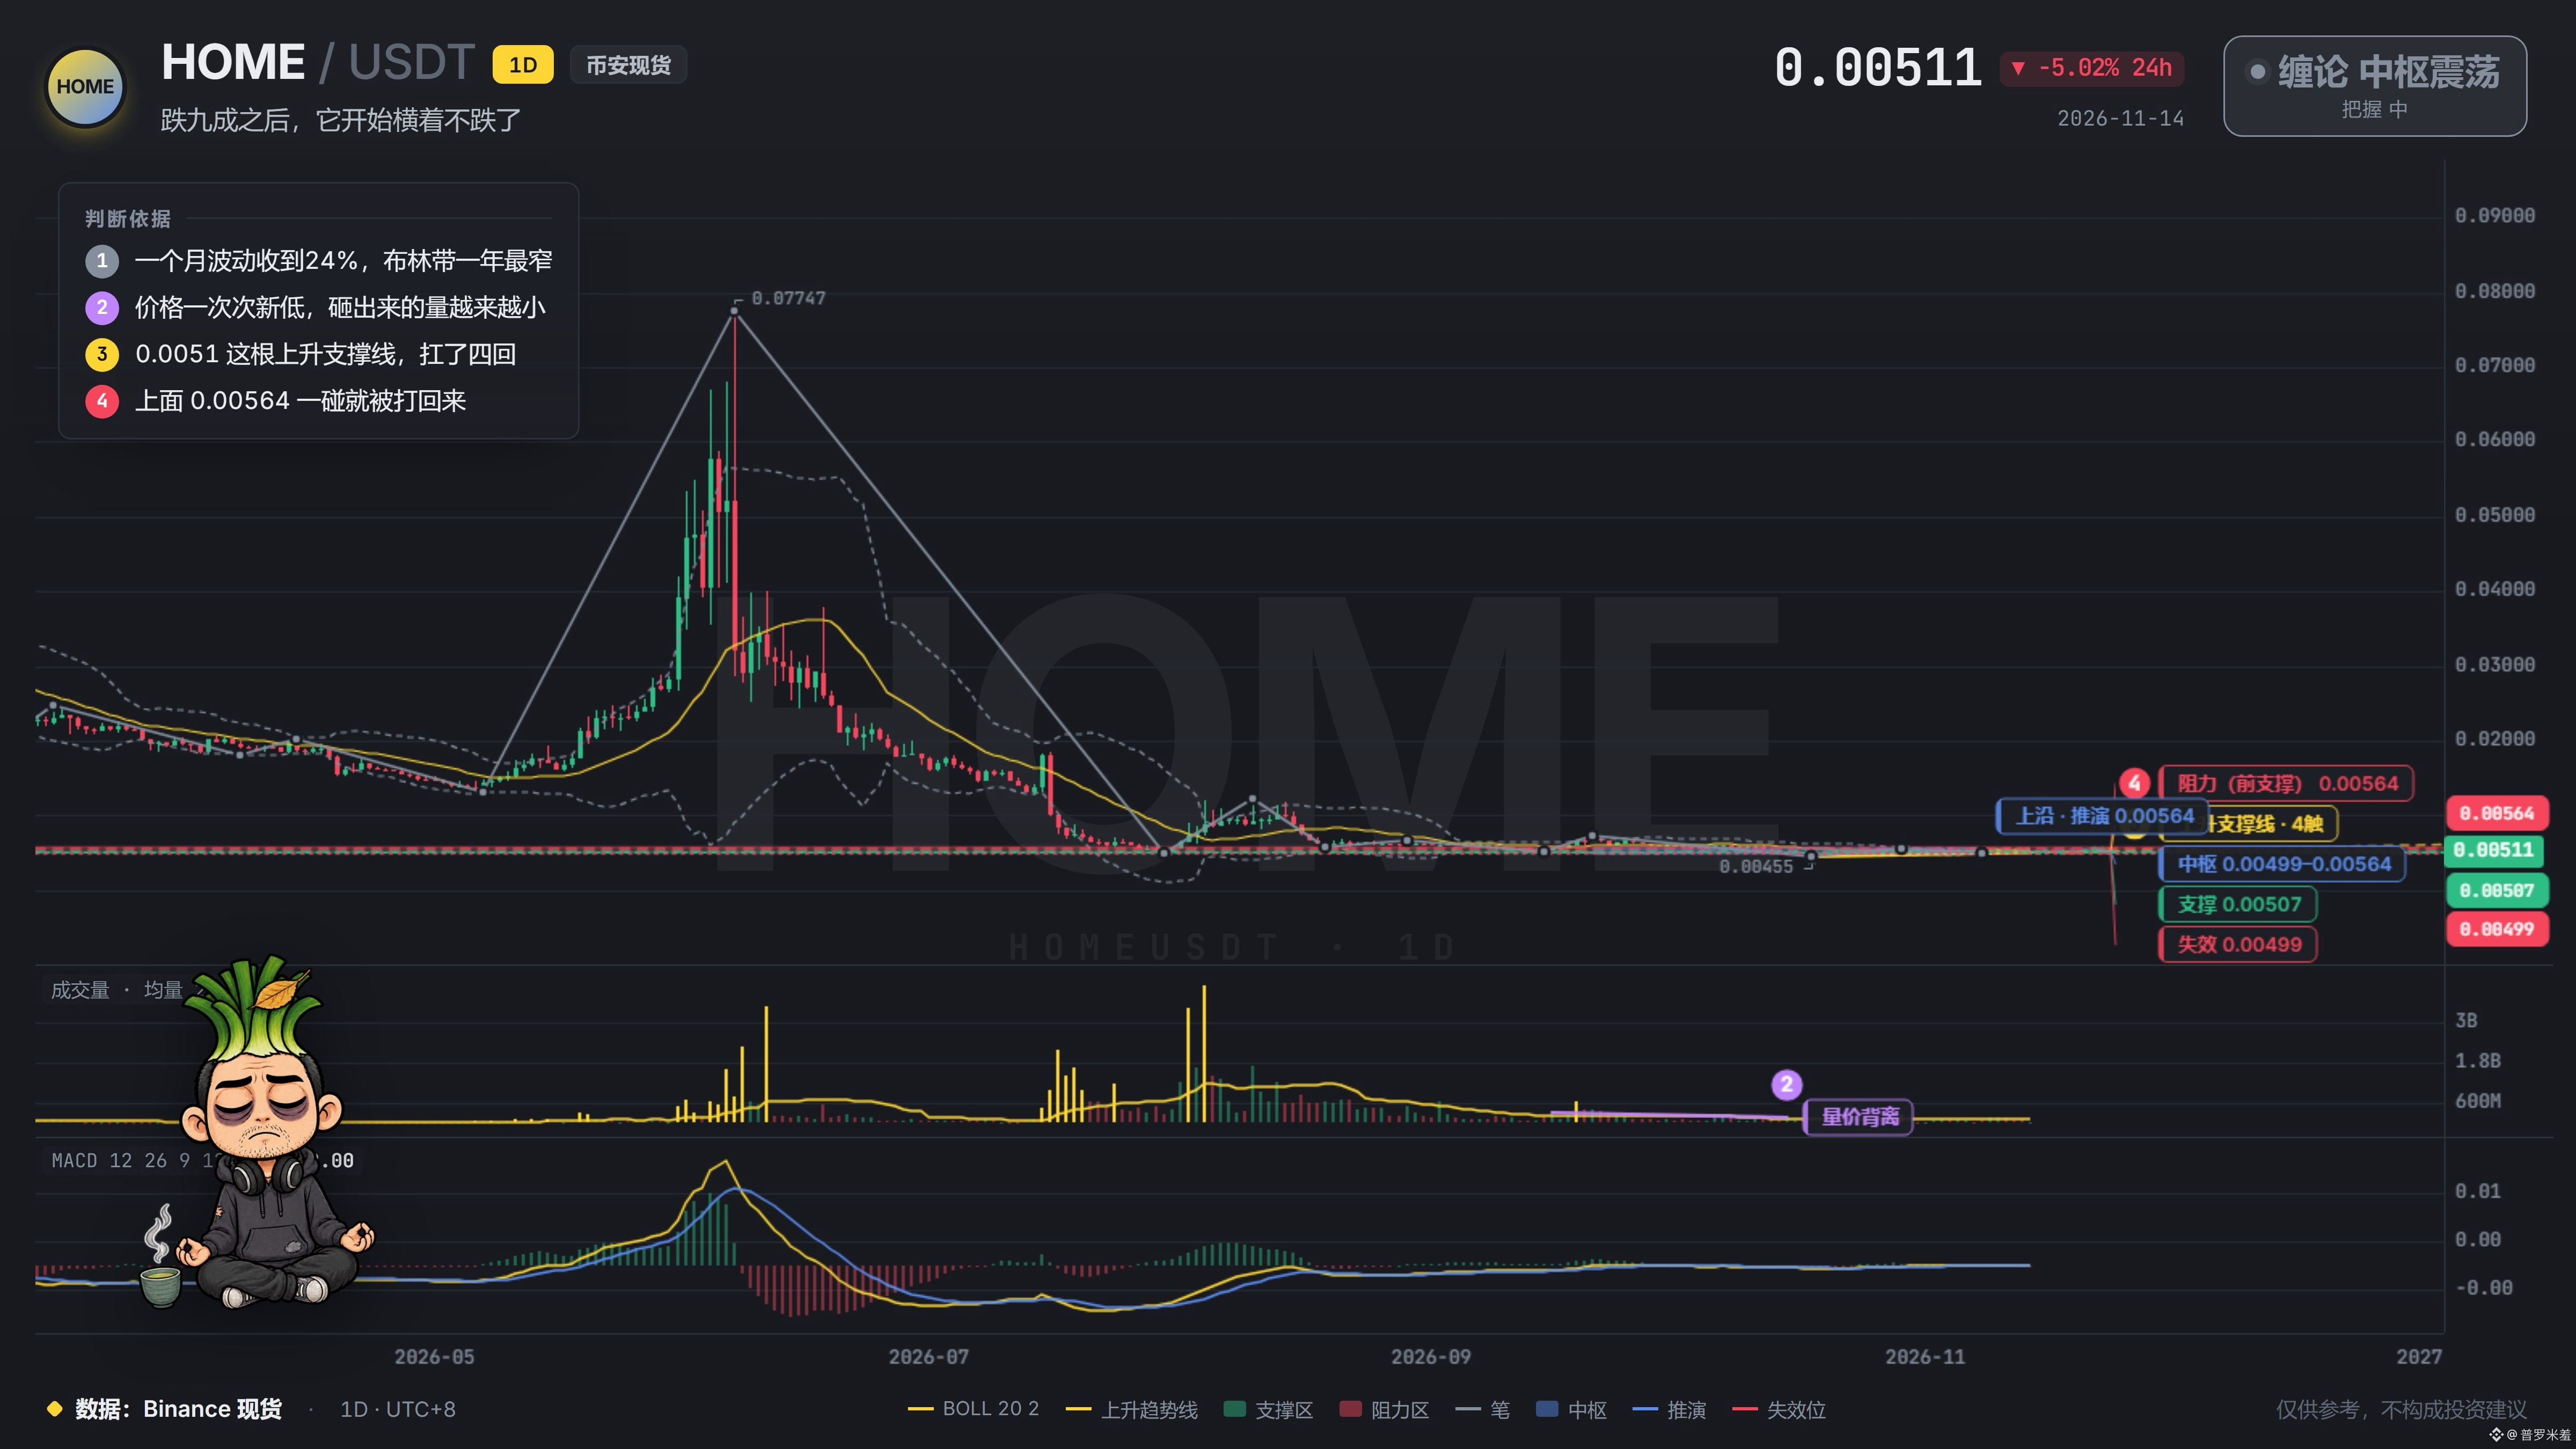
$HOME The most frustrating thing about this coin isn’t the drop—it’s that after dropping, it just stops moving. The daily range isn’t even enough to buy a meal. You open it for a quick look, and neither the red nor the green gets a reaction. You can’t even be bothered to curse the market maker.
But over the past 30 days, it’s been stuck swinging inside a 24% range, with the daily volatility narrowing to its lowest level in a year. It’s been hammered down more and more often, but each sell-off comes with less volume. It keeps making slightly lower lows, yet selling pressure has stopped following through.
The rising trendline at 0.0051 has held up four times without breaking. That doesn’t mean the bottom is in; it just means the sellers are running out of steam first. It still needs to clear 0.00564 above. If it can’t, it’ll keep moving sideways.
A bottom formed through sideways action is sturdier than one talked into existence. Just wait it out—there’s no point rushing.
$HOME The most frustrating thing about this coin isn’t the drop—it’s that after dropping, it just stops moving. The daily range isn’t even enough to buy a meal. You open it for a quick look, and neither the red nor the green gets a reaction. You can’t even be bothered to curse the market maker.
But over the past 30 days, it’s been stuck swinging inside a 24% range, with the daily volatility narrowing to its lowest level in a year. It’s been hammered down more and more often, but each sell-off comes with less volume. It keeps making slightly lower lows, yet selling pressure has stopped following through.
The rising trendline at 0.0051 has held up four times without breaking. That doesn’t mean the bottom is in; it just means the sellers are running out of steam first. It still needs to clear 0.00564 above. If it can’t, it’ll keep moving sideways.
A bottom formed through sideways action is sturdier than one talked into existence. Just wait it out—there’s no point rushing.
But over the past 30 days, it’s been stuck swinging inside a 24% range, with the daily volatility narrowing to its lowest level in a year. It’s been hammered down more and more often, but each sell-off comes with less volume. It keeps making slightly lower lows, yet selling pressure has stopped following through.
The rising trendline at 0.0051 has held up four times without breaking. That doesn’t mean the bottom is in; it just means the sellers are running out of steam first. It still needs to clear 0.00564 above. If it can’t, it’ll keep moving sideways.
A bottom formed through sideways action is sturdier than one talked into existence. Just wait it out—there’s no point rushing.
72
·
--
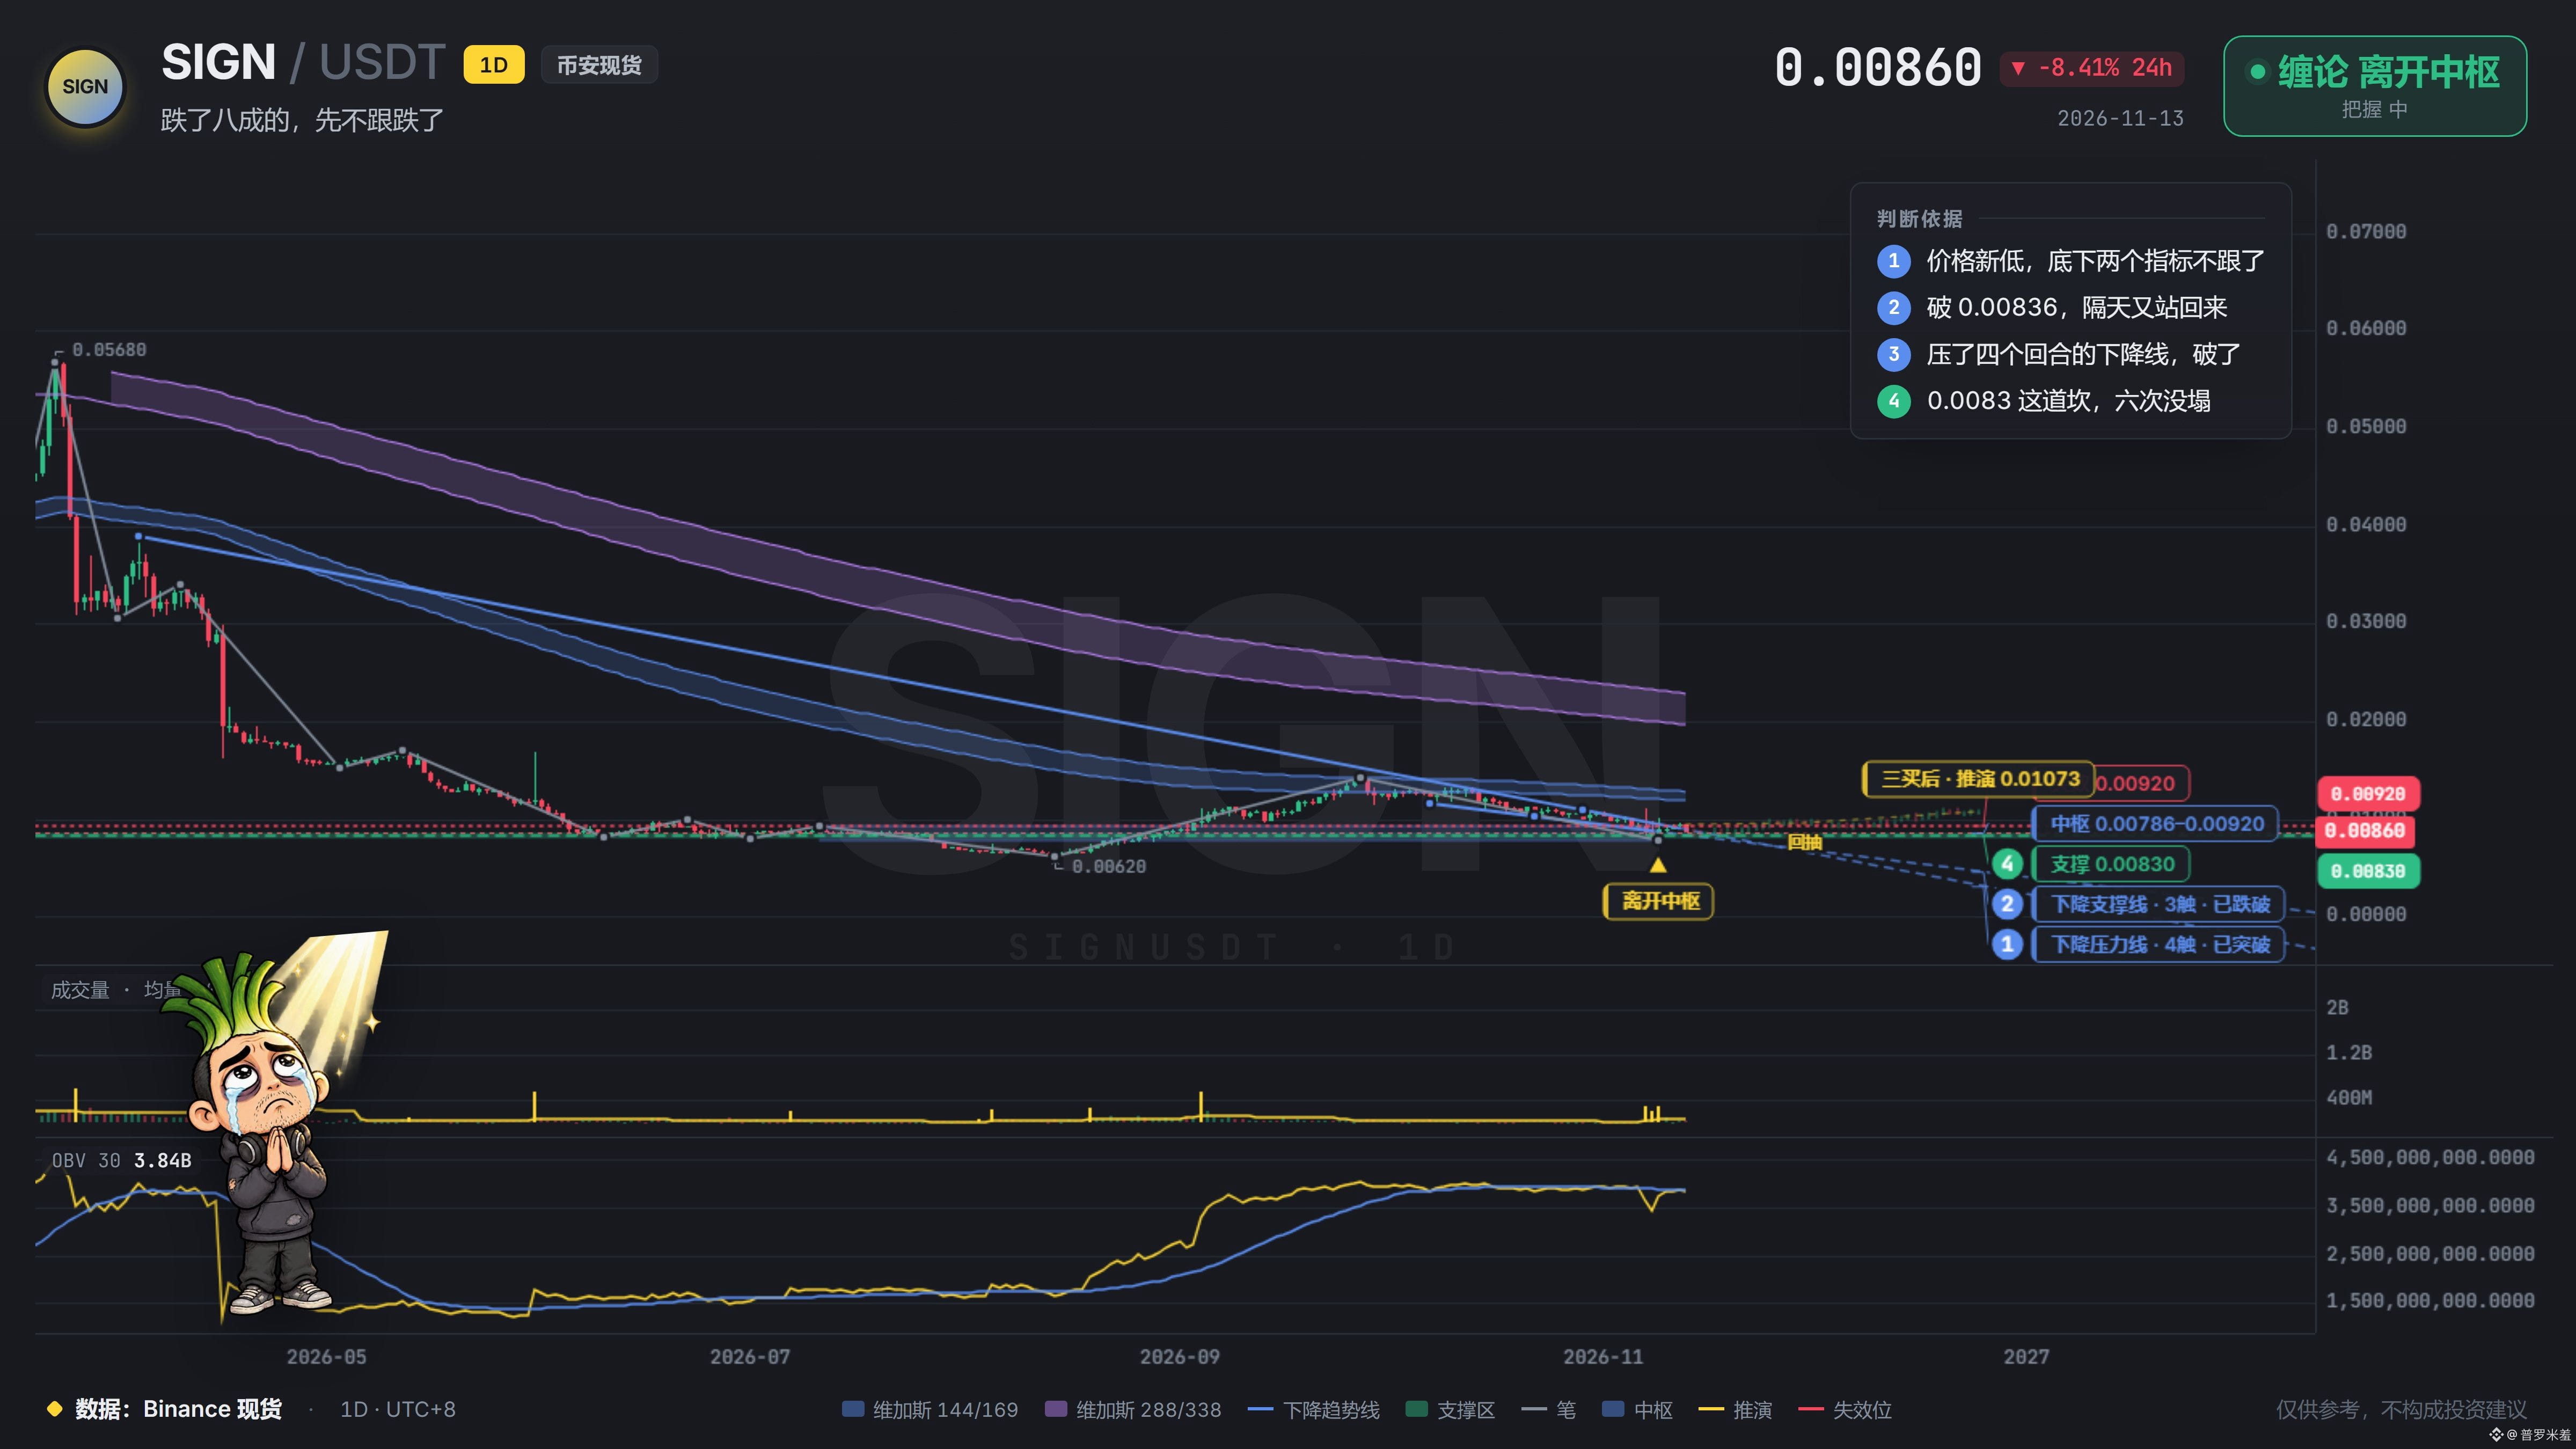
$SIGN is down 86%. Nobody in the group even mentions it anymore, and you’re too embarrassed to admit you’re still holding it. You can’t even be bothered to open it and take a look.
The daily chart is showing some change: the price keeps making lower lows, but the indicators underneath aren’t following suit. The last time it broke below 0.00836, buyers pushed it back up the very next day. This time, it’s also broken above the descending trendline that had capped it for four attempts.
A turnaround is still a long way off, but at least it doesn’t look like it’s sliding further down. If you’re still holding, just hang in there for now.
$SIGN is down 86%. Nobody in the group even mentions it anymore, and you’re too embarrassed to admit you’re still holding it. You can’t even be bothered to open it and take a look.
The daily chart is showing some change: the price keeps making lower lows, but the indicators underneath aren’t following suit. The last time it broke below 0.00836, buyers pushed it back up the very next day. This time, it’s also broken above the descending trendline that had capped it for four attempts.
A turnaround is still a long way off, but at least it doesn’t look like it’s sliding further down. If you’re still holding, just hang in there for now.
The daily chart is showing some change: the price keeps making lower lows, but the indicators underneath aren’t following suit. The last time it broke below 0.00836, buyers pushed it back up the very next day. This time, it’s also broken above the descending trendline that had capped it for four attempts.
A turnaround is still a long way off, but at least it doesn’t look like it’s sliding further down. If you’re still holding, just hang in there for now.
3
·
--
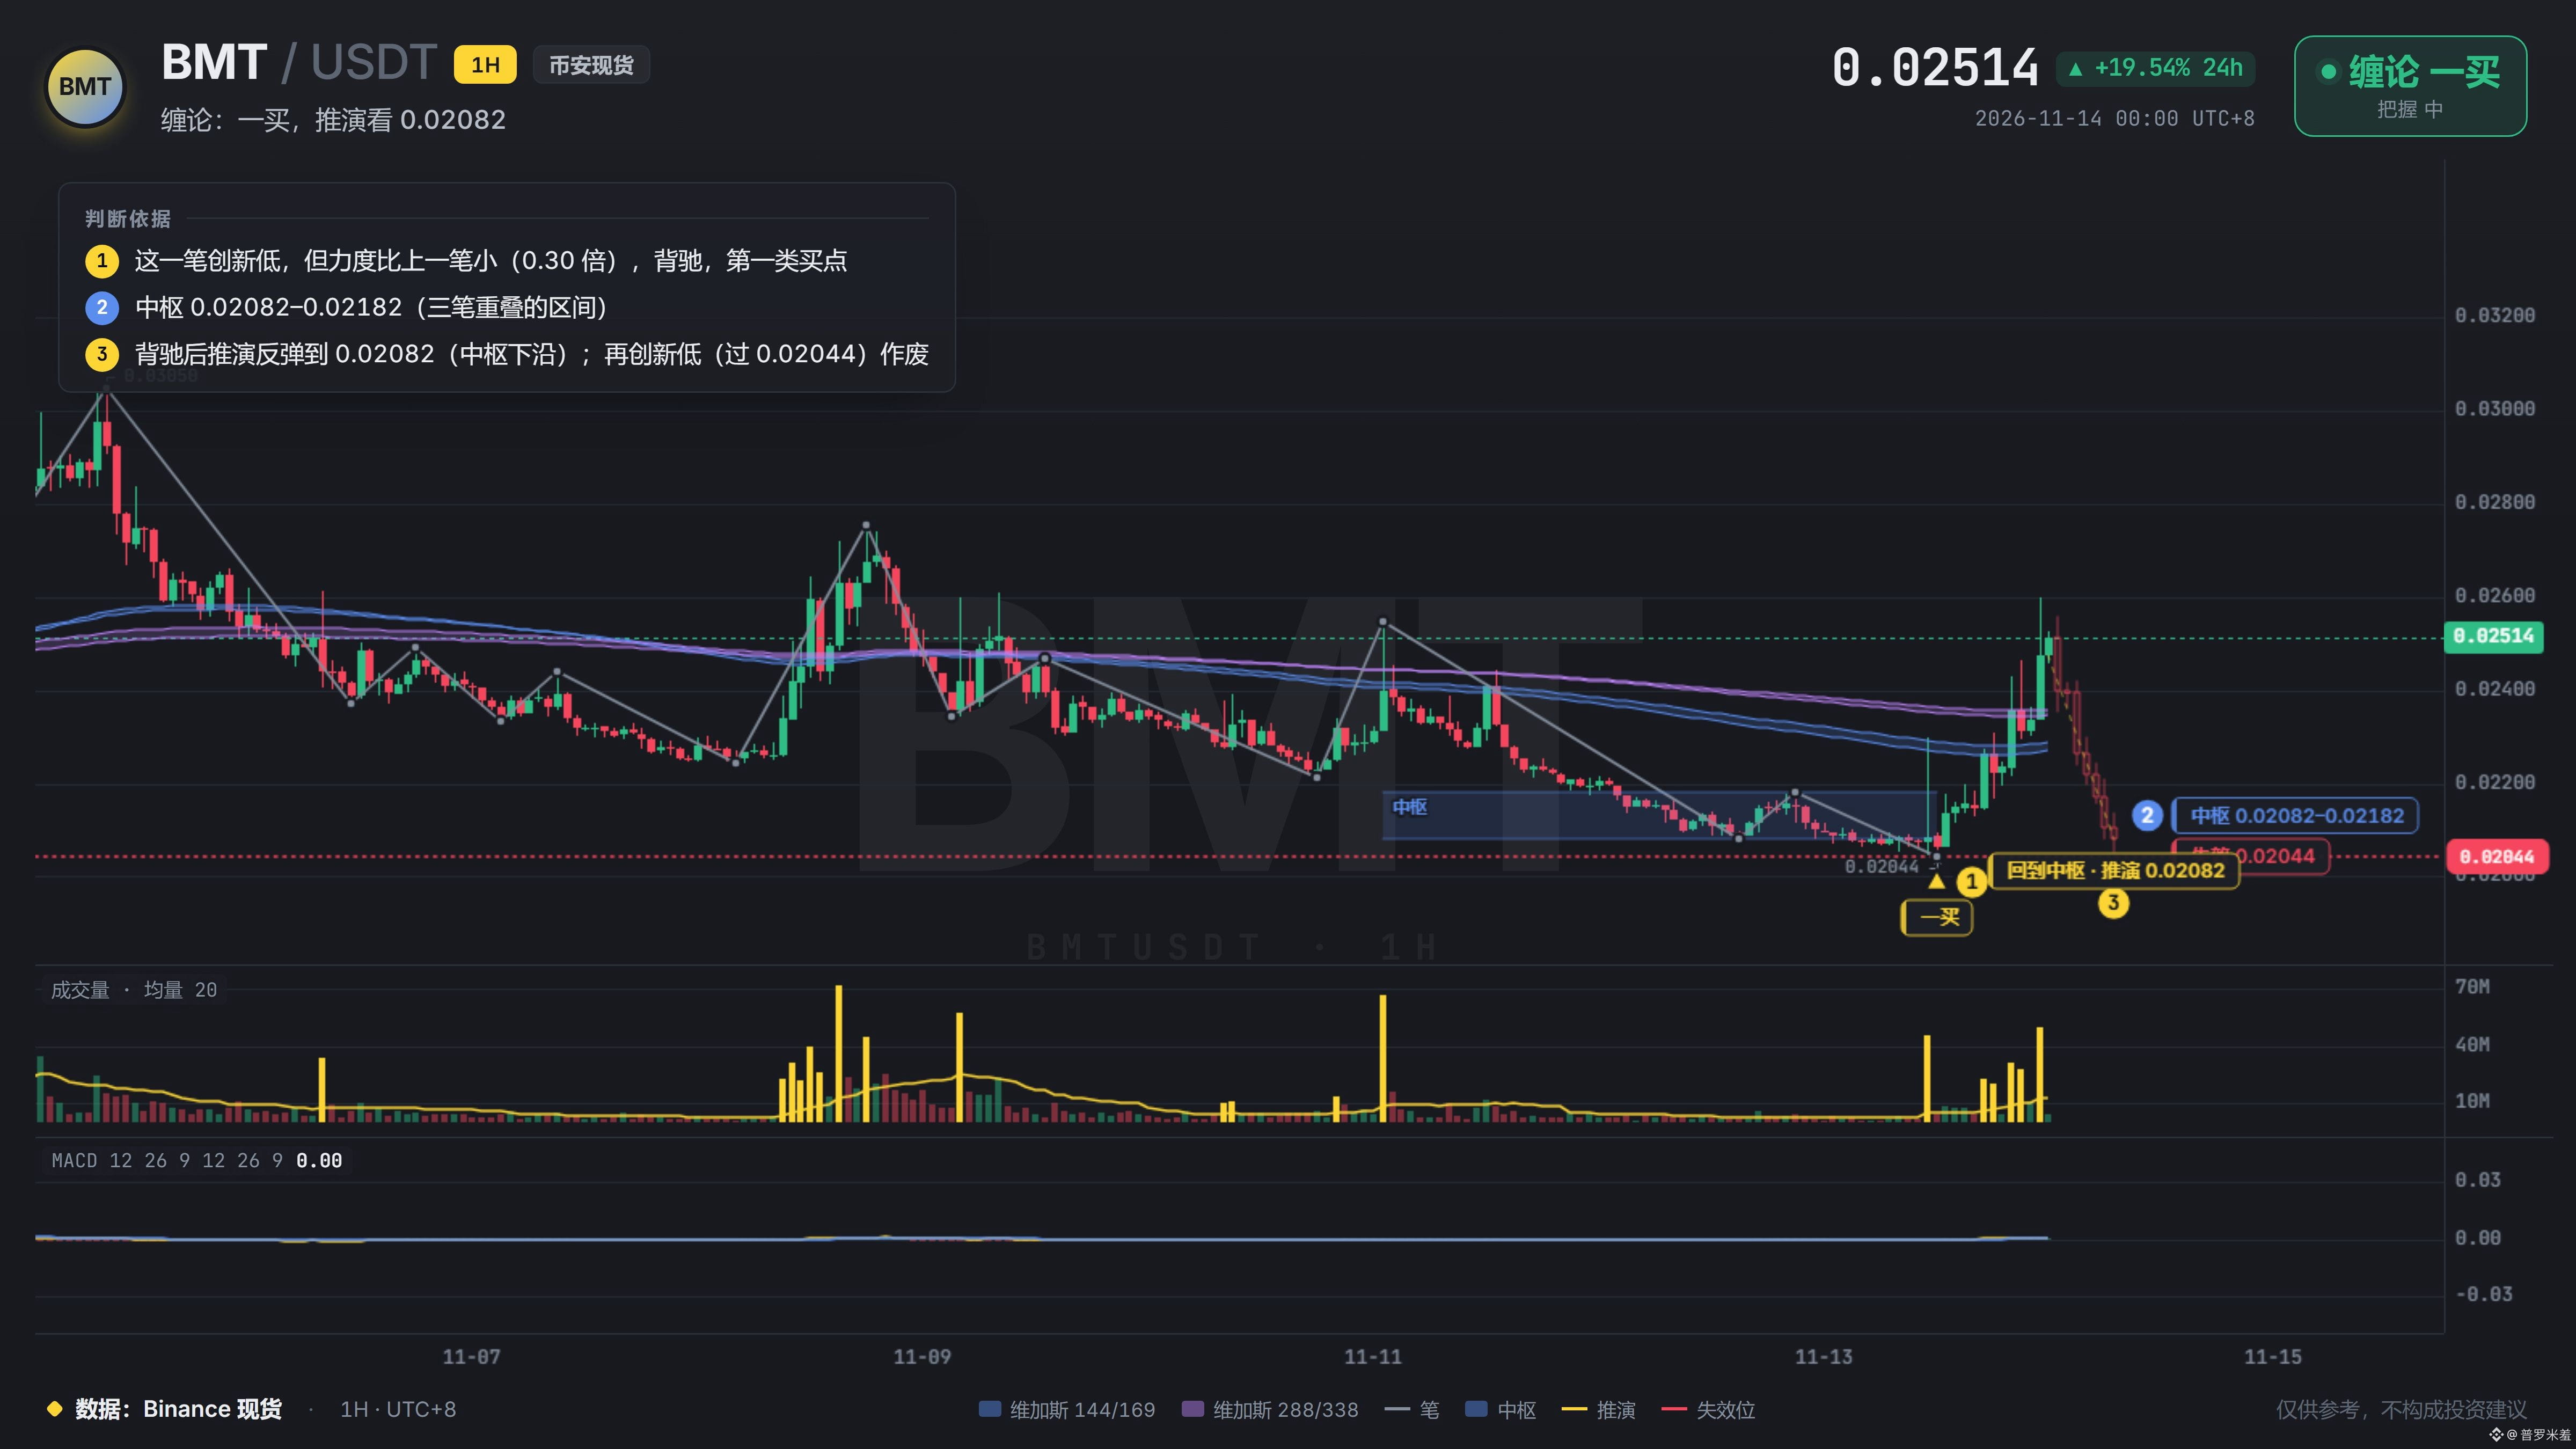
That divergence low down there—I watched it climb all the way up, reached for it, then pulled my hand back. I chickened out. Then one bullish candle on 3.8x volume blasted through the rising resistance line and swept away all my hesitation. Now it’s tested the 0.025 level for the 12th time. I’m afraid to chase it and get left holding the bag, but if I don’t, I can only sit here and watch it go. $BMT —I’ll own this one: I didn’t get in.
That divergence low down there—I watched it climb all the way up, reached for it, then pulled my hand back. I chickened out. Then one bullish candle on 3.8x volume blasted through the rising resistance line and swept away all my hesitation. Now it’s tested the 0.025 level for the 12th time. I’m afraid to chase it and get left holding the bag, but if I don’t, I can only sit here and watch it go. $BMT —I’ll own this one: I didn’t get in.
7
·
--
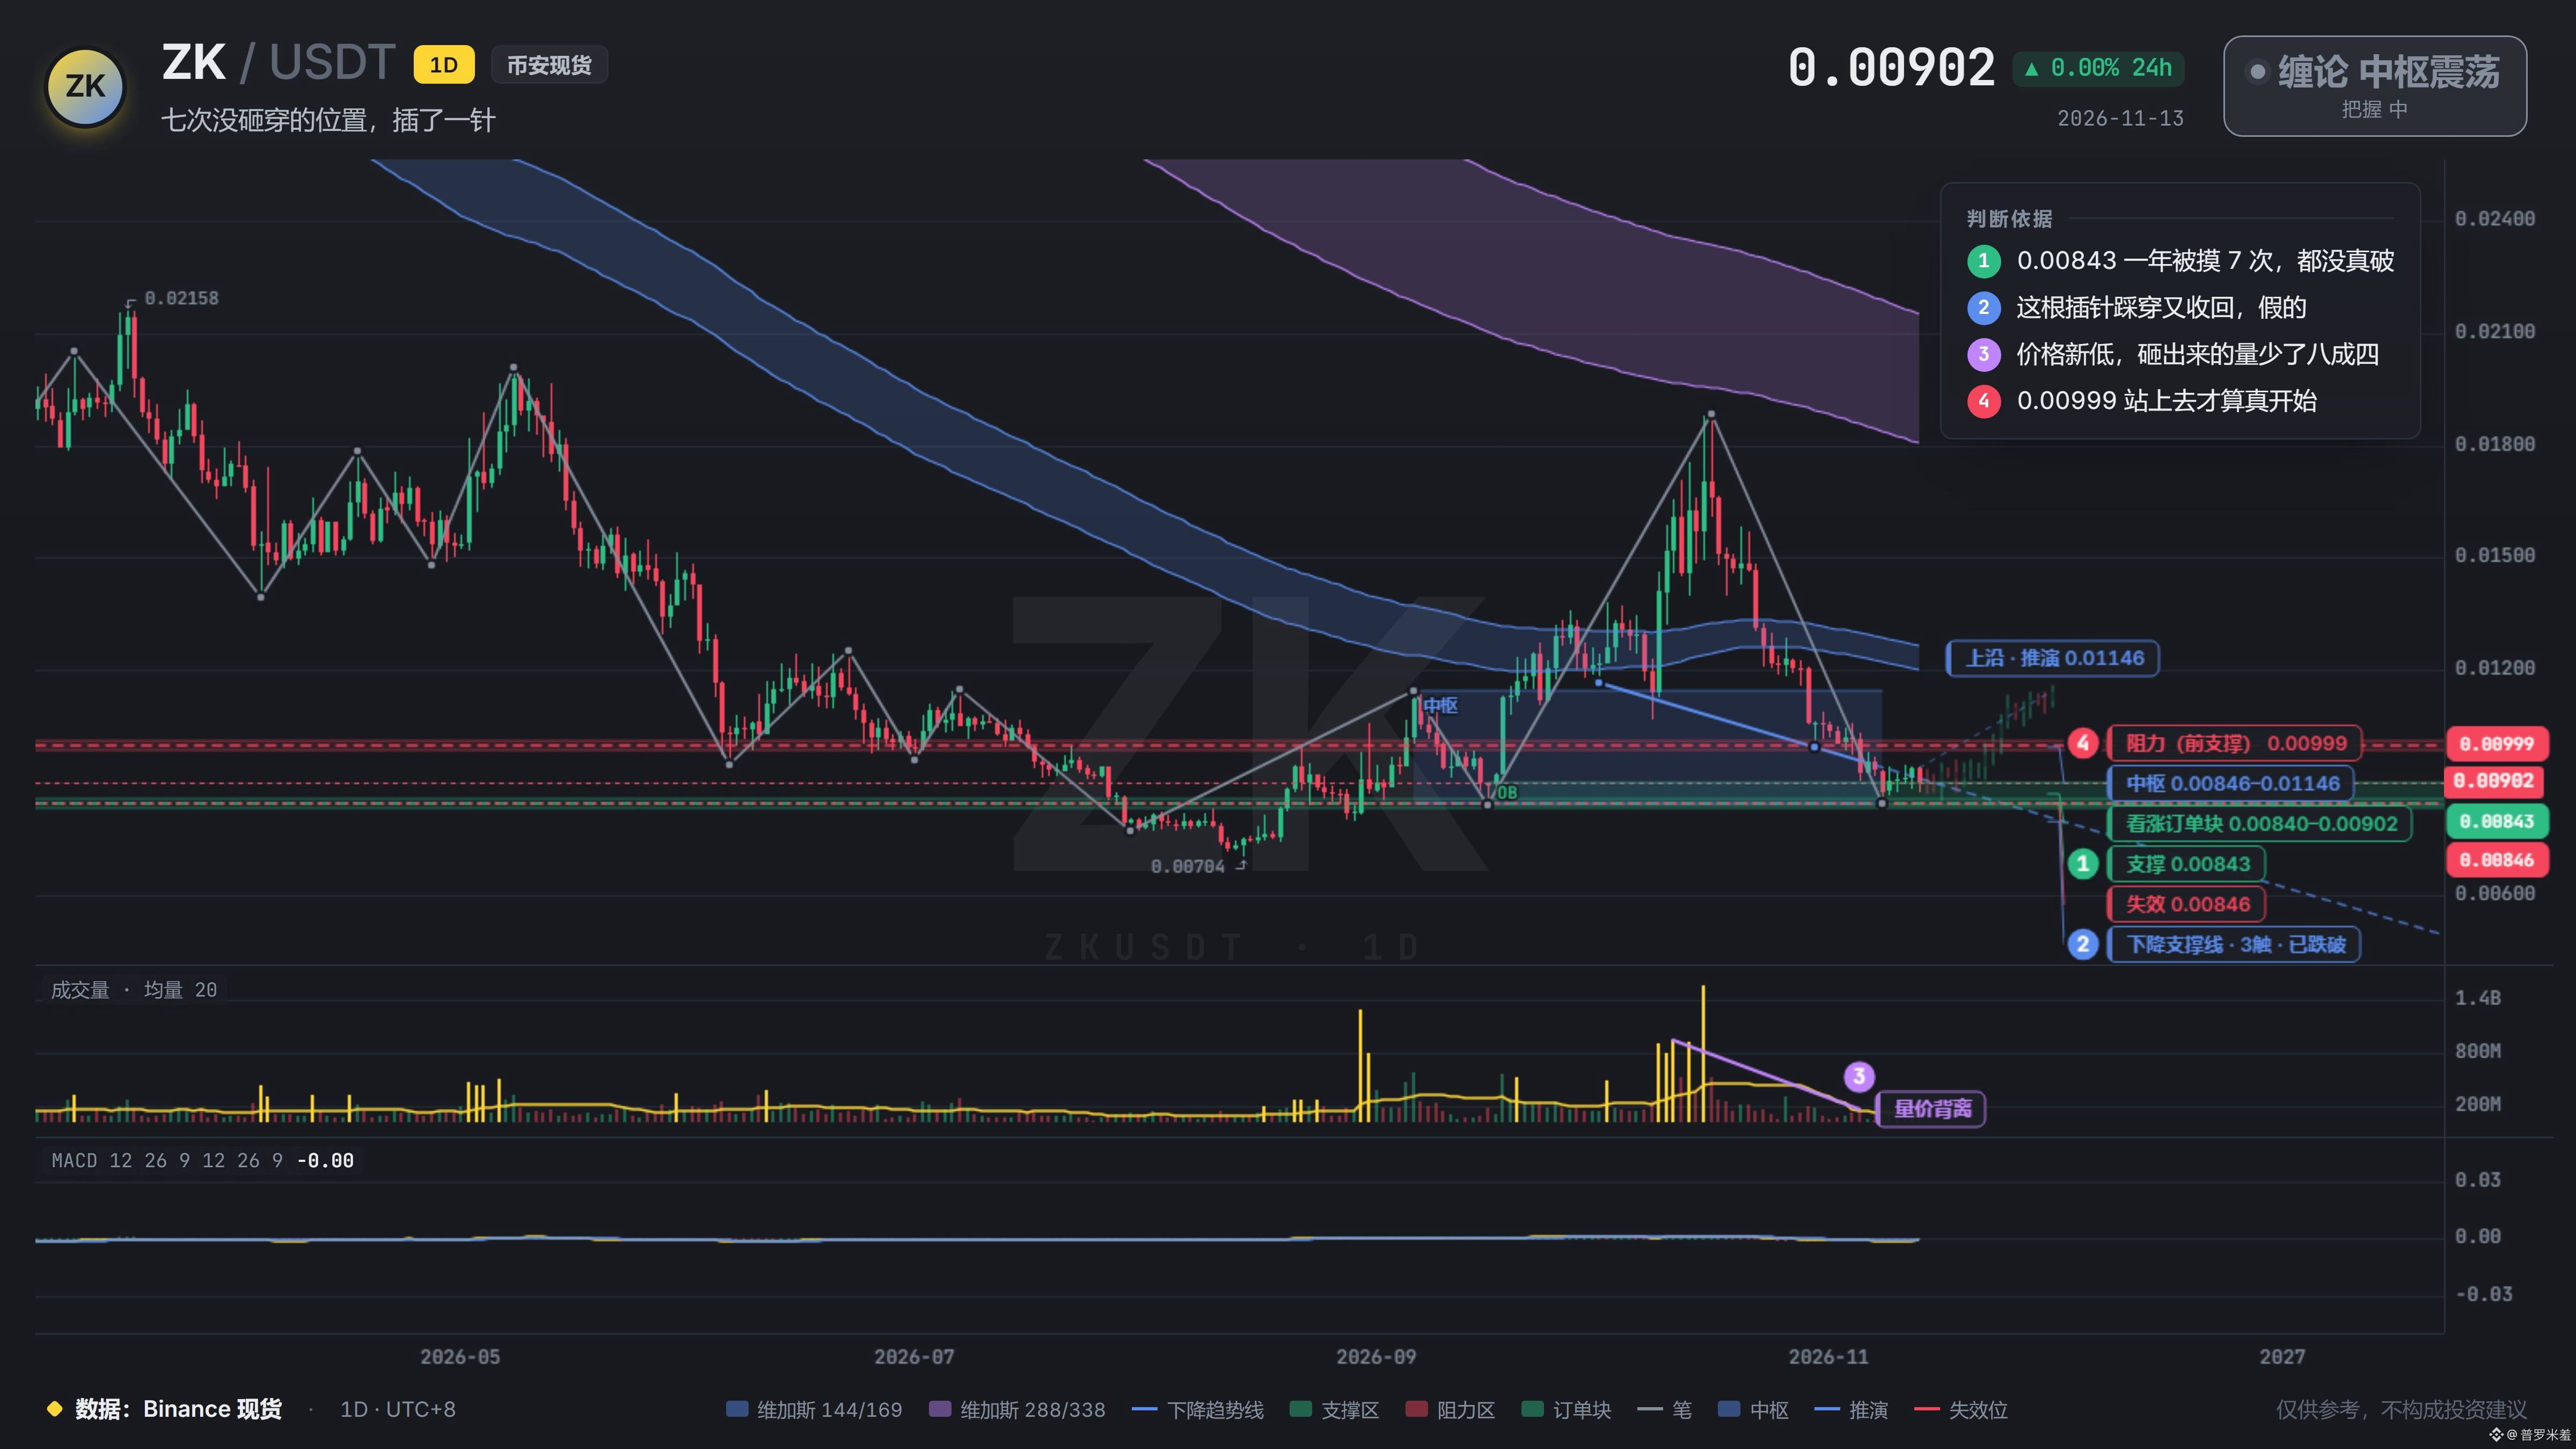
$ZK 0.0084 This area has been tested seven times in a year, and none of those times did it actually break down.
Last week, that wick plunged straight through, then climbed back above the line the next day. It swept the stop-losses sitting there, then went nowhere—this tactic has been done to death in crypto.
More interesting is the volume. The price keeps making lower lows, but each wave of selling comes with less volume than the last. The recent stretch is down by more than 80% compared with before. If people were really liquidating and leaving, they wouldn’t be so sparing with their ammo. The buyers are still there in the 0.00840–0.00902 zone below. The chart makes it clear who’s buying.
0.00999 is the hurdle above. Get above it, and the real move can begin; fail to hold above it, and it’ll keep grinding here. I can’t guarantee anything.
It’s just that 84% of the drop is already behind us. Don’t hand over your ticket in this final stretch.
$ZK 0.0084 This area has been tested seven times in a year, and none of those times did it actually break down.
Last week, that wick plunged straight through, then climbed back above the line the next day. It swept the stop-losses sitting there, then went nowhere—this tactic has been done to death in crypto.
More interesting is the volume. The price keeps making lower lows, but each wave of selling comes with less volume than the last. The recent stretch is down by more than 80% compared with before. If people were really liquidating and leaving, they wouldn’t be so sparing with their ammo. The buyers are still there in the 0.00840–0.00902 zone below. The chart makes it clear who’s buying.
0.00999 is the hurdle above. Get above it, and the real move can begin; fail to hold above it, and it’ll keep grinding here. I can’t guarantee anything.
It’s just that 84% of the drop is already behind us. Don’t hand over your ticket in this final stretch.
Last week, that wick plunged straight through, then climbed back above the line the next day. It swept the stop-losses sitting there, then went nowhere—this tactic has been done to death in crypto.
More interesting is the volume. The price keeps making lower lows, but each wave of selling comes with less volume than the last. The recent stretch is down by more than 80% compared with before. If people were really liquidating and leaving, they wouldn’t be so sparing with their ammo. The buyers are still there in the 0.00840–0.00902 zone below. The chart makes it clear who’s buying.
0.00999 is the hurdle above. Get above it, and the real move can begin; fail to hold above it, and it’ll keep grinding here. I can’t guarantee anything.
It’s just that 84% of the drop is already behind us. Don’t hand over your ticket in this final stretch.
9
·
--
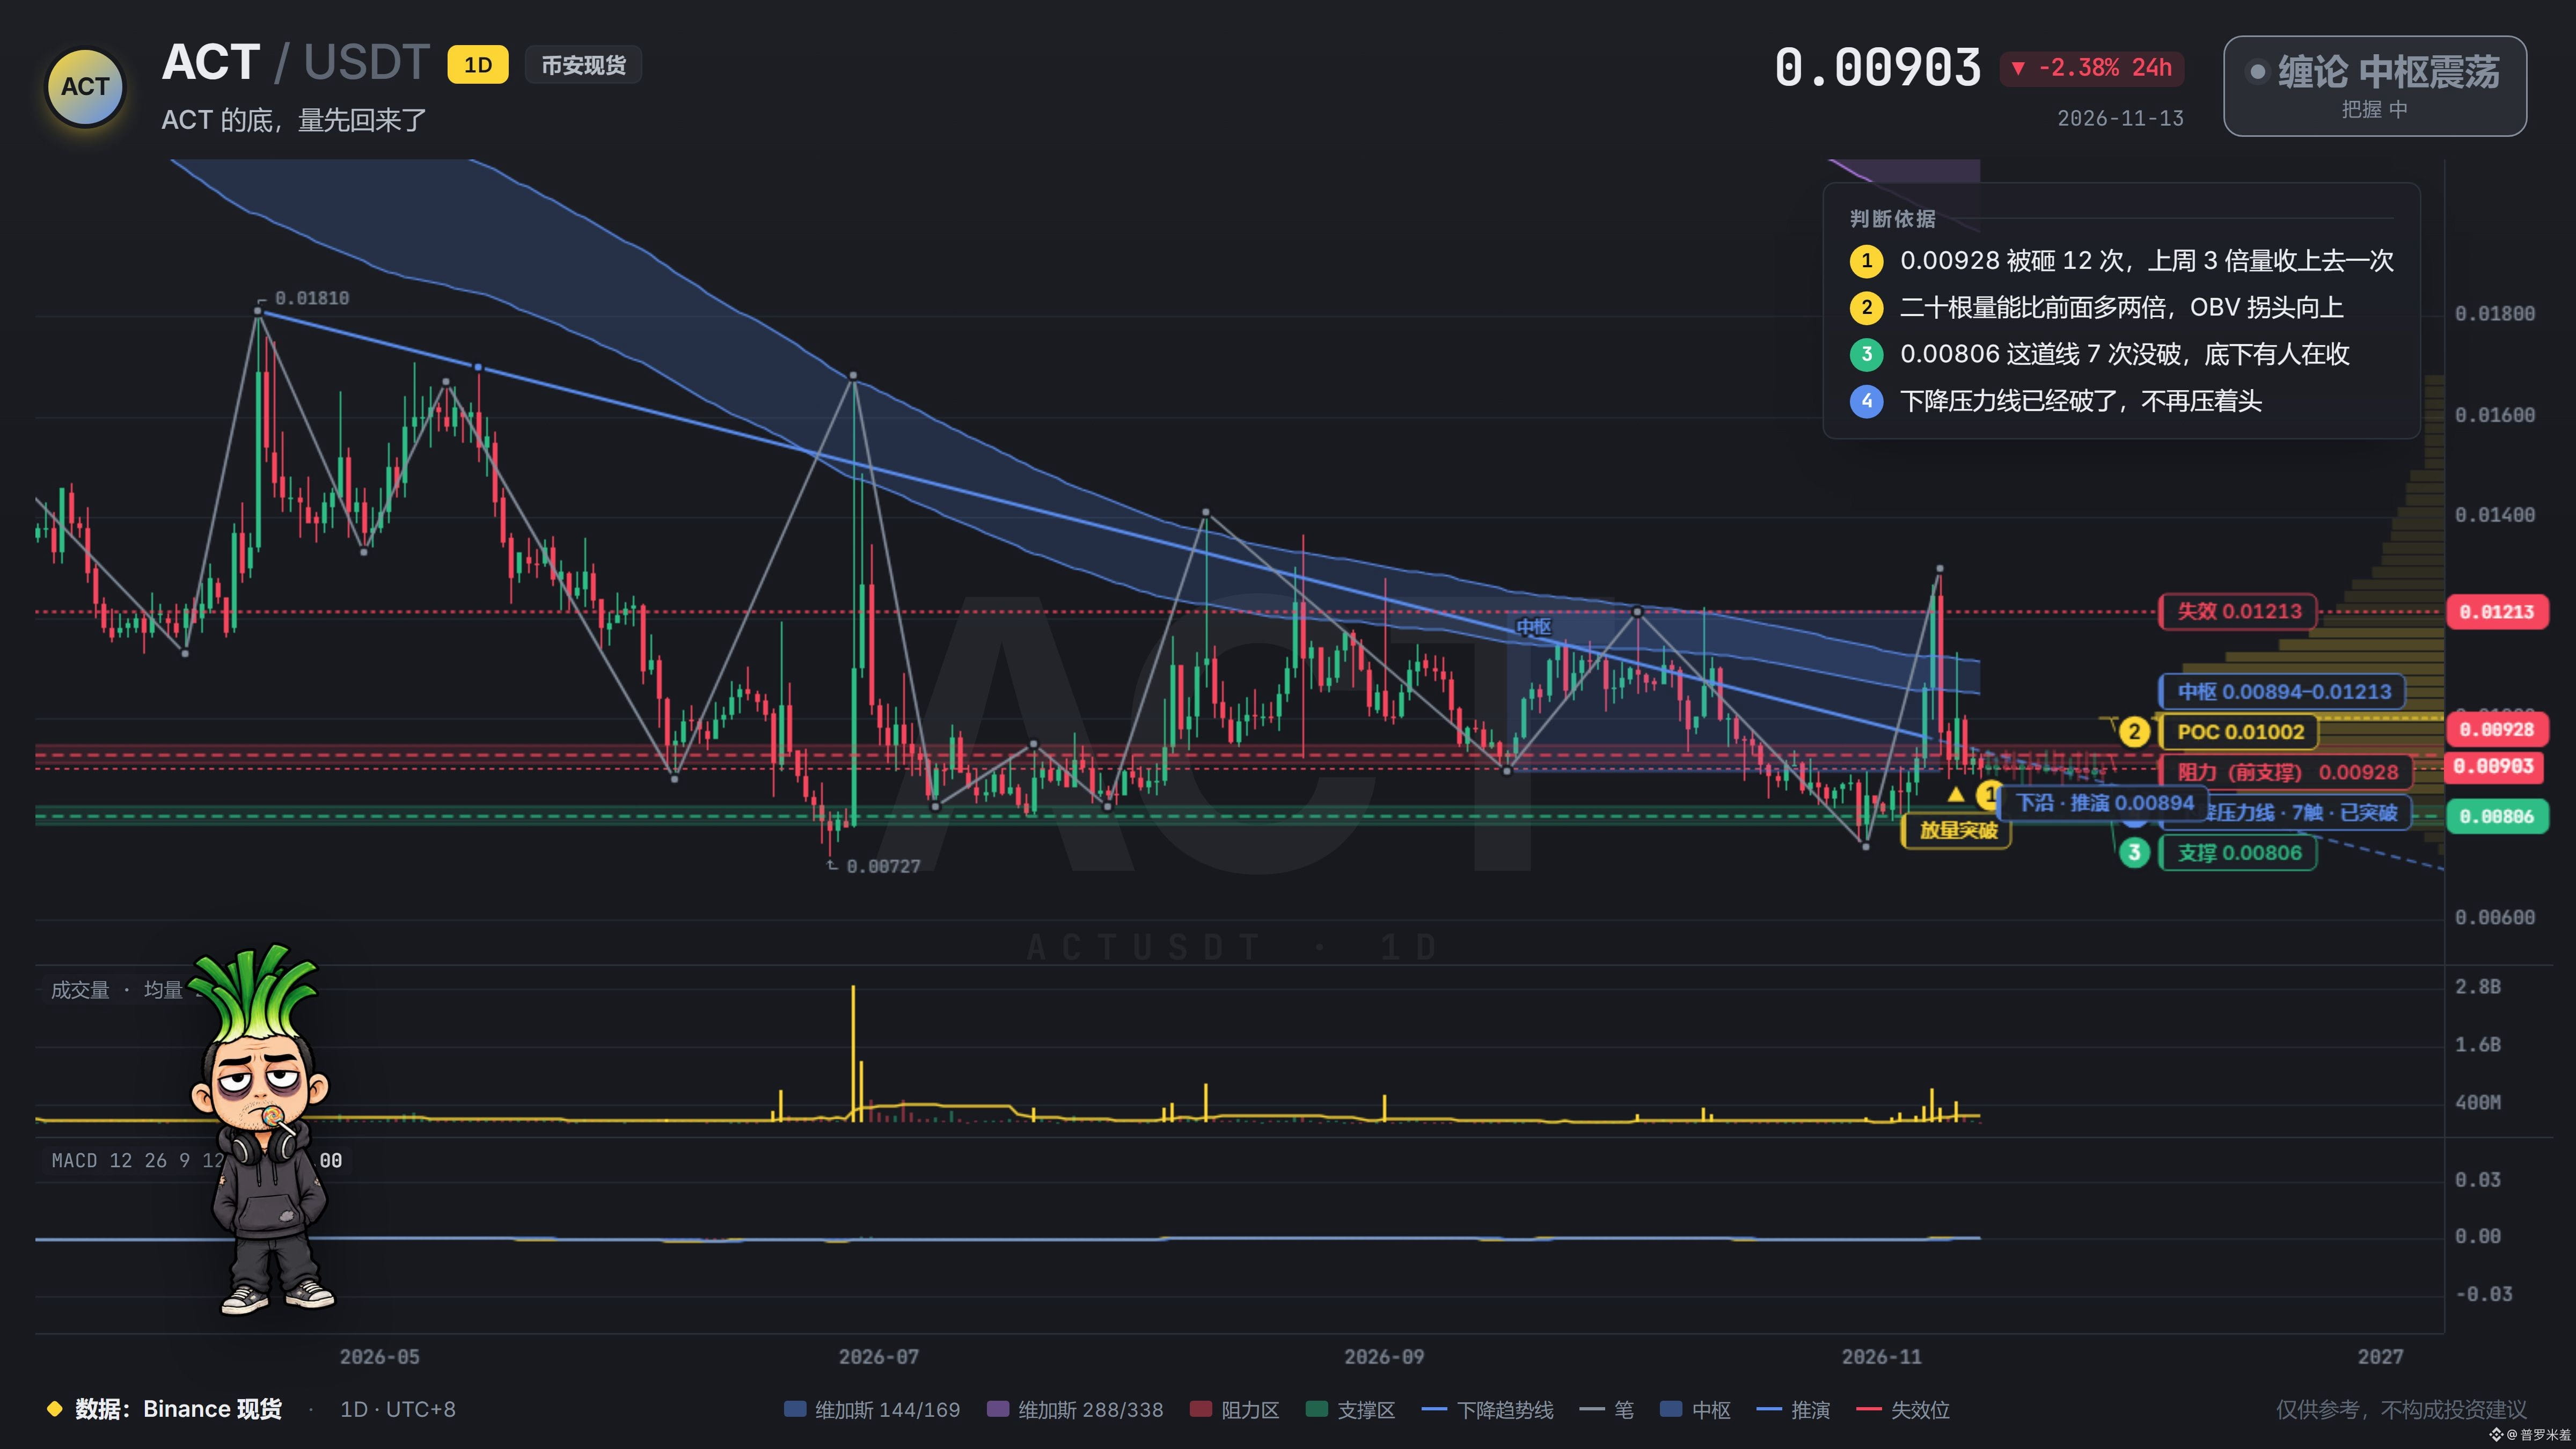
$ACT has fallen more than 80% from its highs, and no one in the group has mentioned it for ages. You can’t even be bothered to open it and look. The worst part of being stuck deep in the red isn’t losing money—it’s that you’ve lost even the energy to complain.
The daily chart does show a few signs of life: the 0.00928 level has been hammered 12 times this year, and last Monday a candle with three times the usual volume closed above it. Volume over the last twenty-odd candles is twice what it was before, and OBV has turned up too. A slow bleed happens on low volume; this stretch doesn’t look like that.
I can’t say whether the bottom is right at that 0.00806 line. But volume has come back first, and this money isn’t here to watch it slowly bleed lower.
If you’re still holding, don’t start tallying things up at the floor.
$ACT has fallen more than 80% from its highs, and no one in the group has mentioned it for ages. You can’t even be bothered to open it and look. The worst part of being stuck deep in the red isn’t losing money—it’s that you’ve lost even the energy to complain.
The daily chart does show a few signs of life: the 0.00928 level has been hammered 12 times this year, and last Monday a candle with three times the usual volume closed above it. Volume over the last twenty-odd candles is twice what it was before, and OBV has turned up too. A slow bleed happens on low volume; this stretch doesn’t look like that.
I can’t say whether the bottom is right at that 0.00806 line. But volume has come back first, and this money isn’t here to watch it slowly bleed lower.
If you’re still holding, don’t start tallying things up at the floor.
The daily chart does show a few signs of life: the 0.00928 level has been hammered 12 times this year, and last Monday a candle with three times the usual volume closed above it. Volume over the last twenty-odd candles is twice what it was before, and OBV has turned up too. A slow bleed happens on low volume; this stretch doesn’t look like that.
I can’t say whether the bottom is right at that 0.00806 line. But volume has come back first, and this money isn’t here to watch it slowly bleed lower.
If you’re still holding, don’t start tallying things up at the floor.
46
·
--
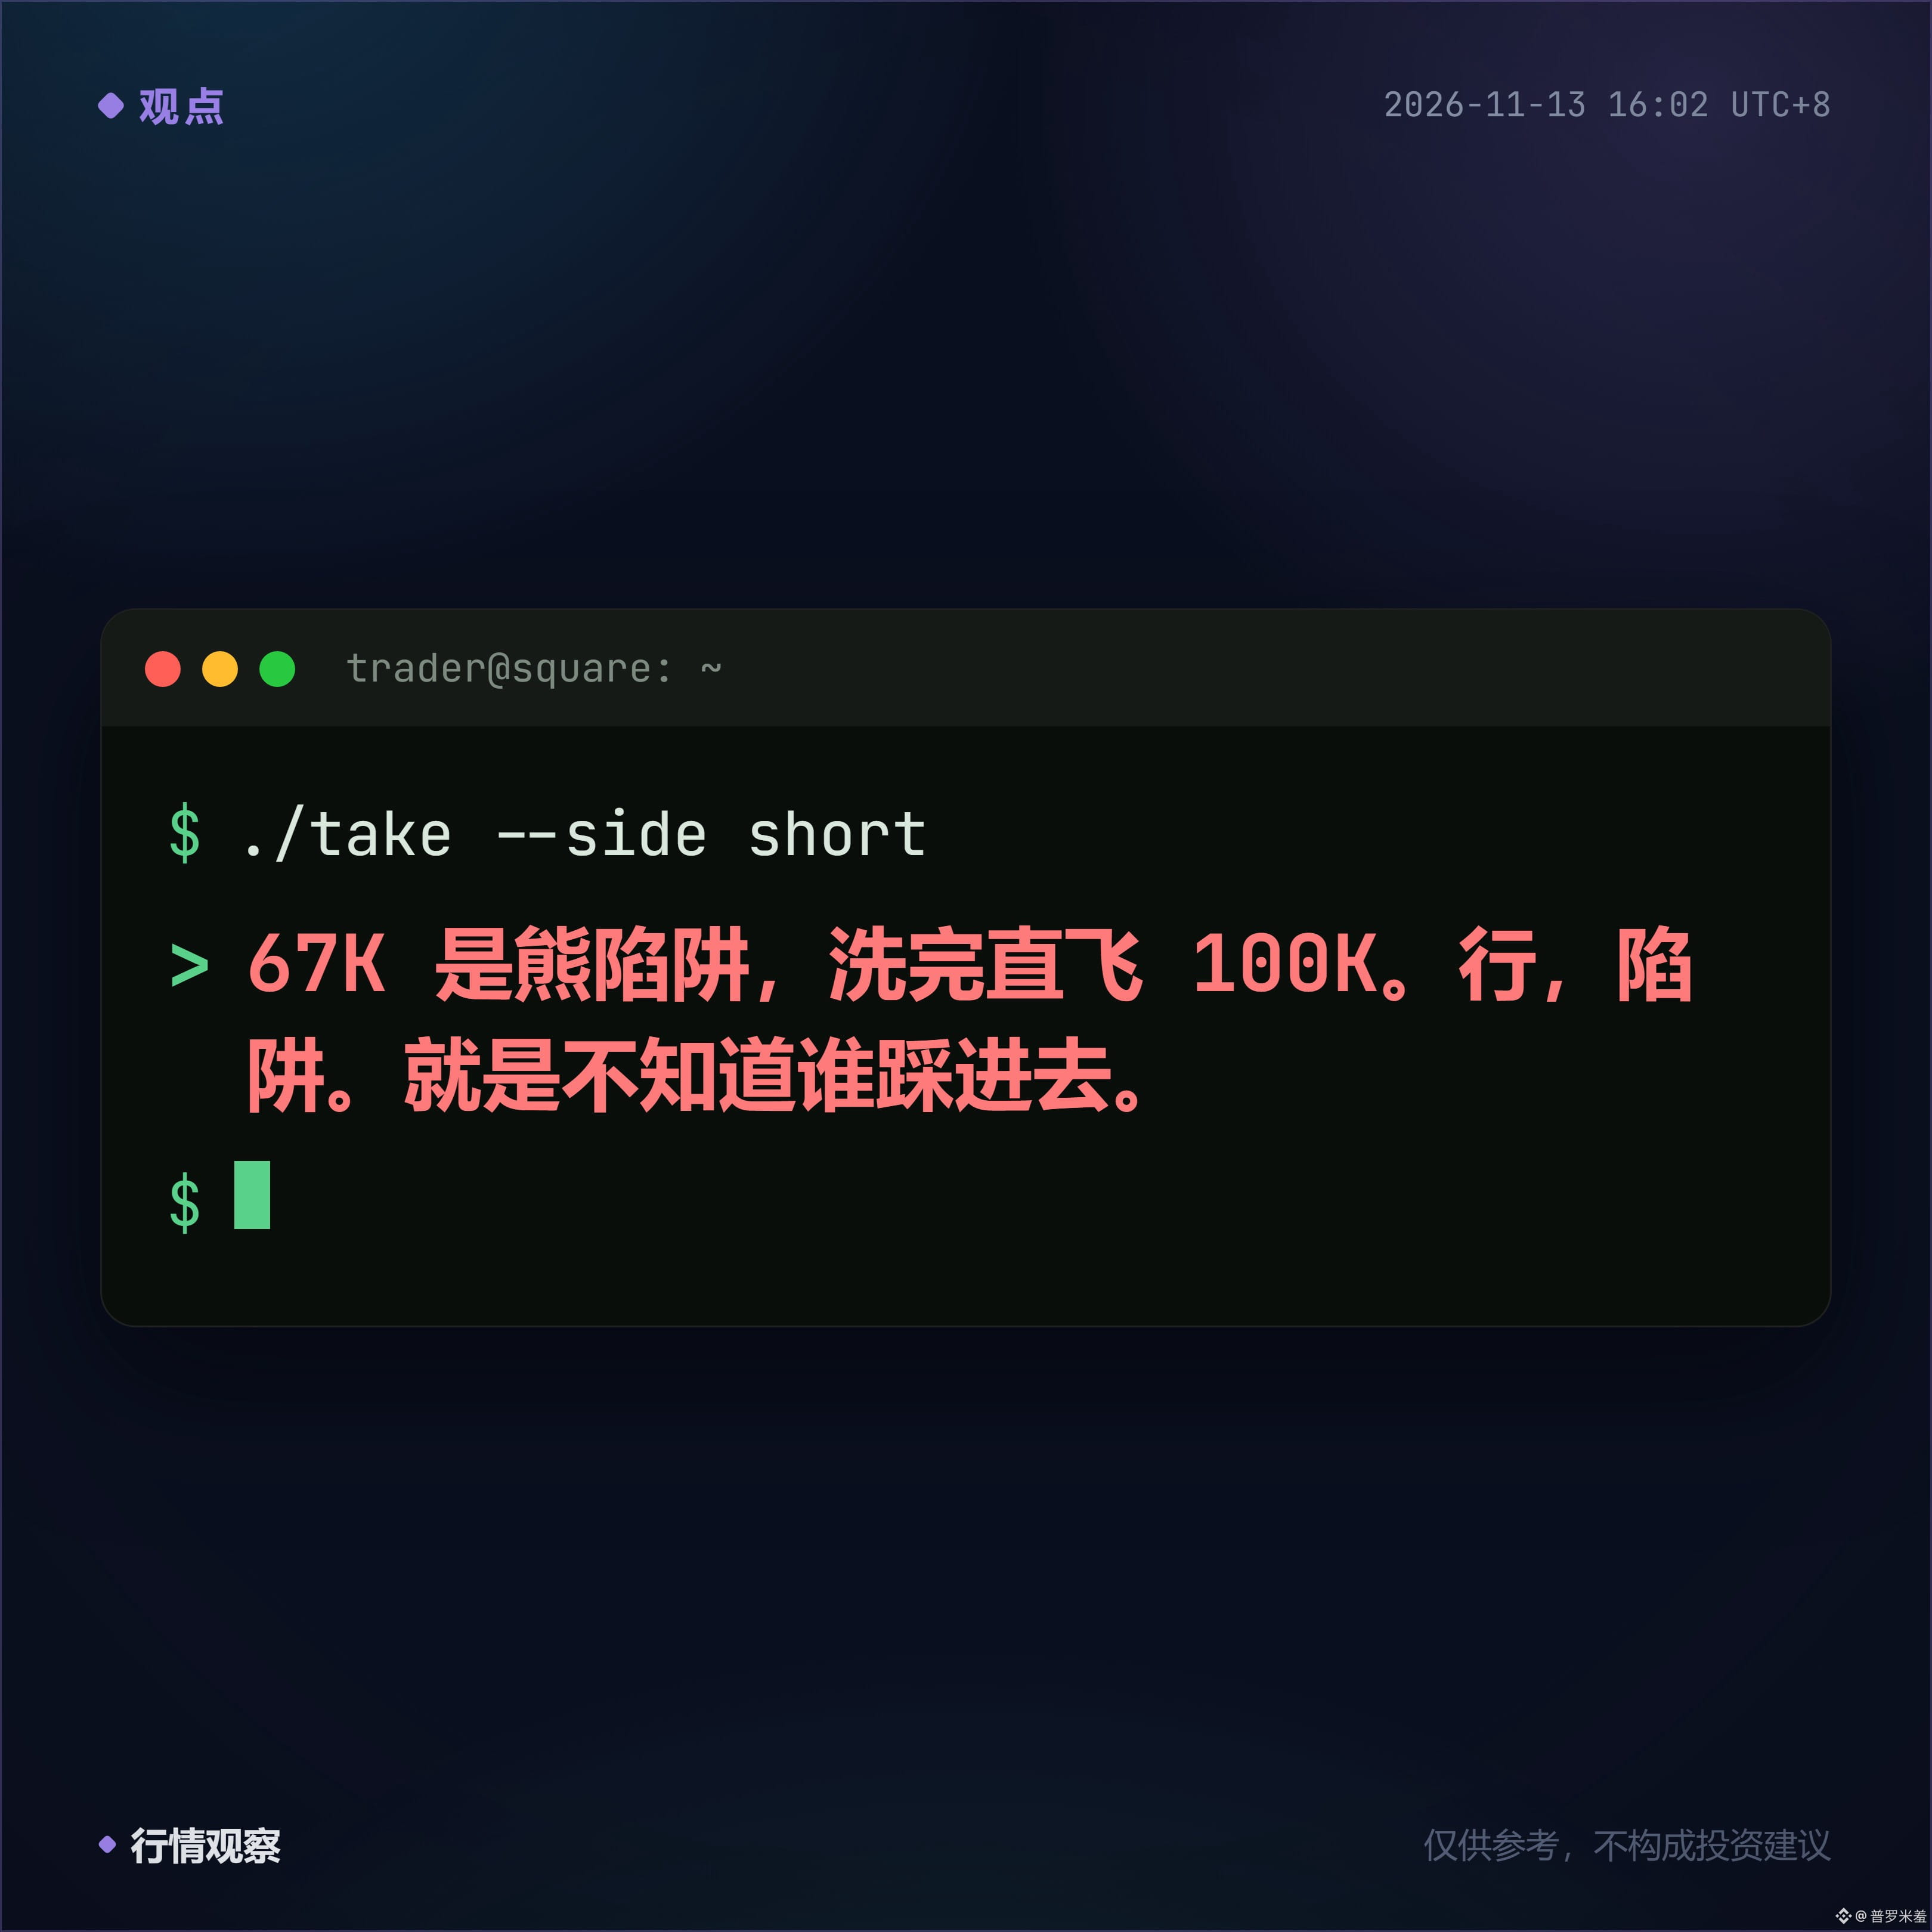
$BTC 7 broke the 10,000 mark, and the consensus on the timeline was frighteningly uniform: “67K is a bear trap; once the shakeout is over, straight to 100K.” I looked back at the volume on those few candles that broke support—price got hammered down on three times the average volume. You call that a trap? They’ve welded the door shut on you.
$BTC 7 broke the 10,000 mark, and the consensus on the timeline was frighteningly uniform: “67K is a bear trap; once the shakeout is over, straight to 100K.” I looked back at the volume on those few candles that broke support—price got hammered down on three times the average volume. You call that a trap? They’ve welded the door shut on you.
29
·
--
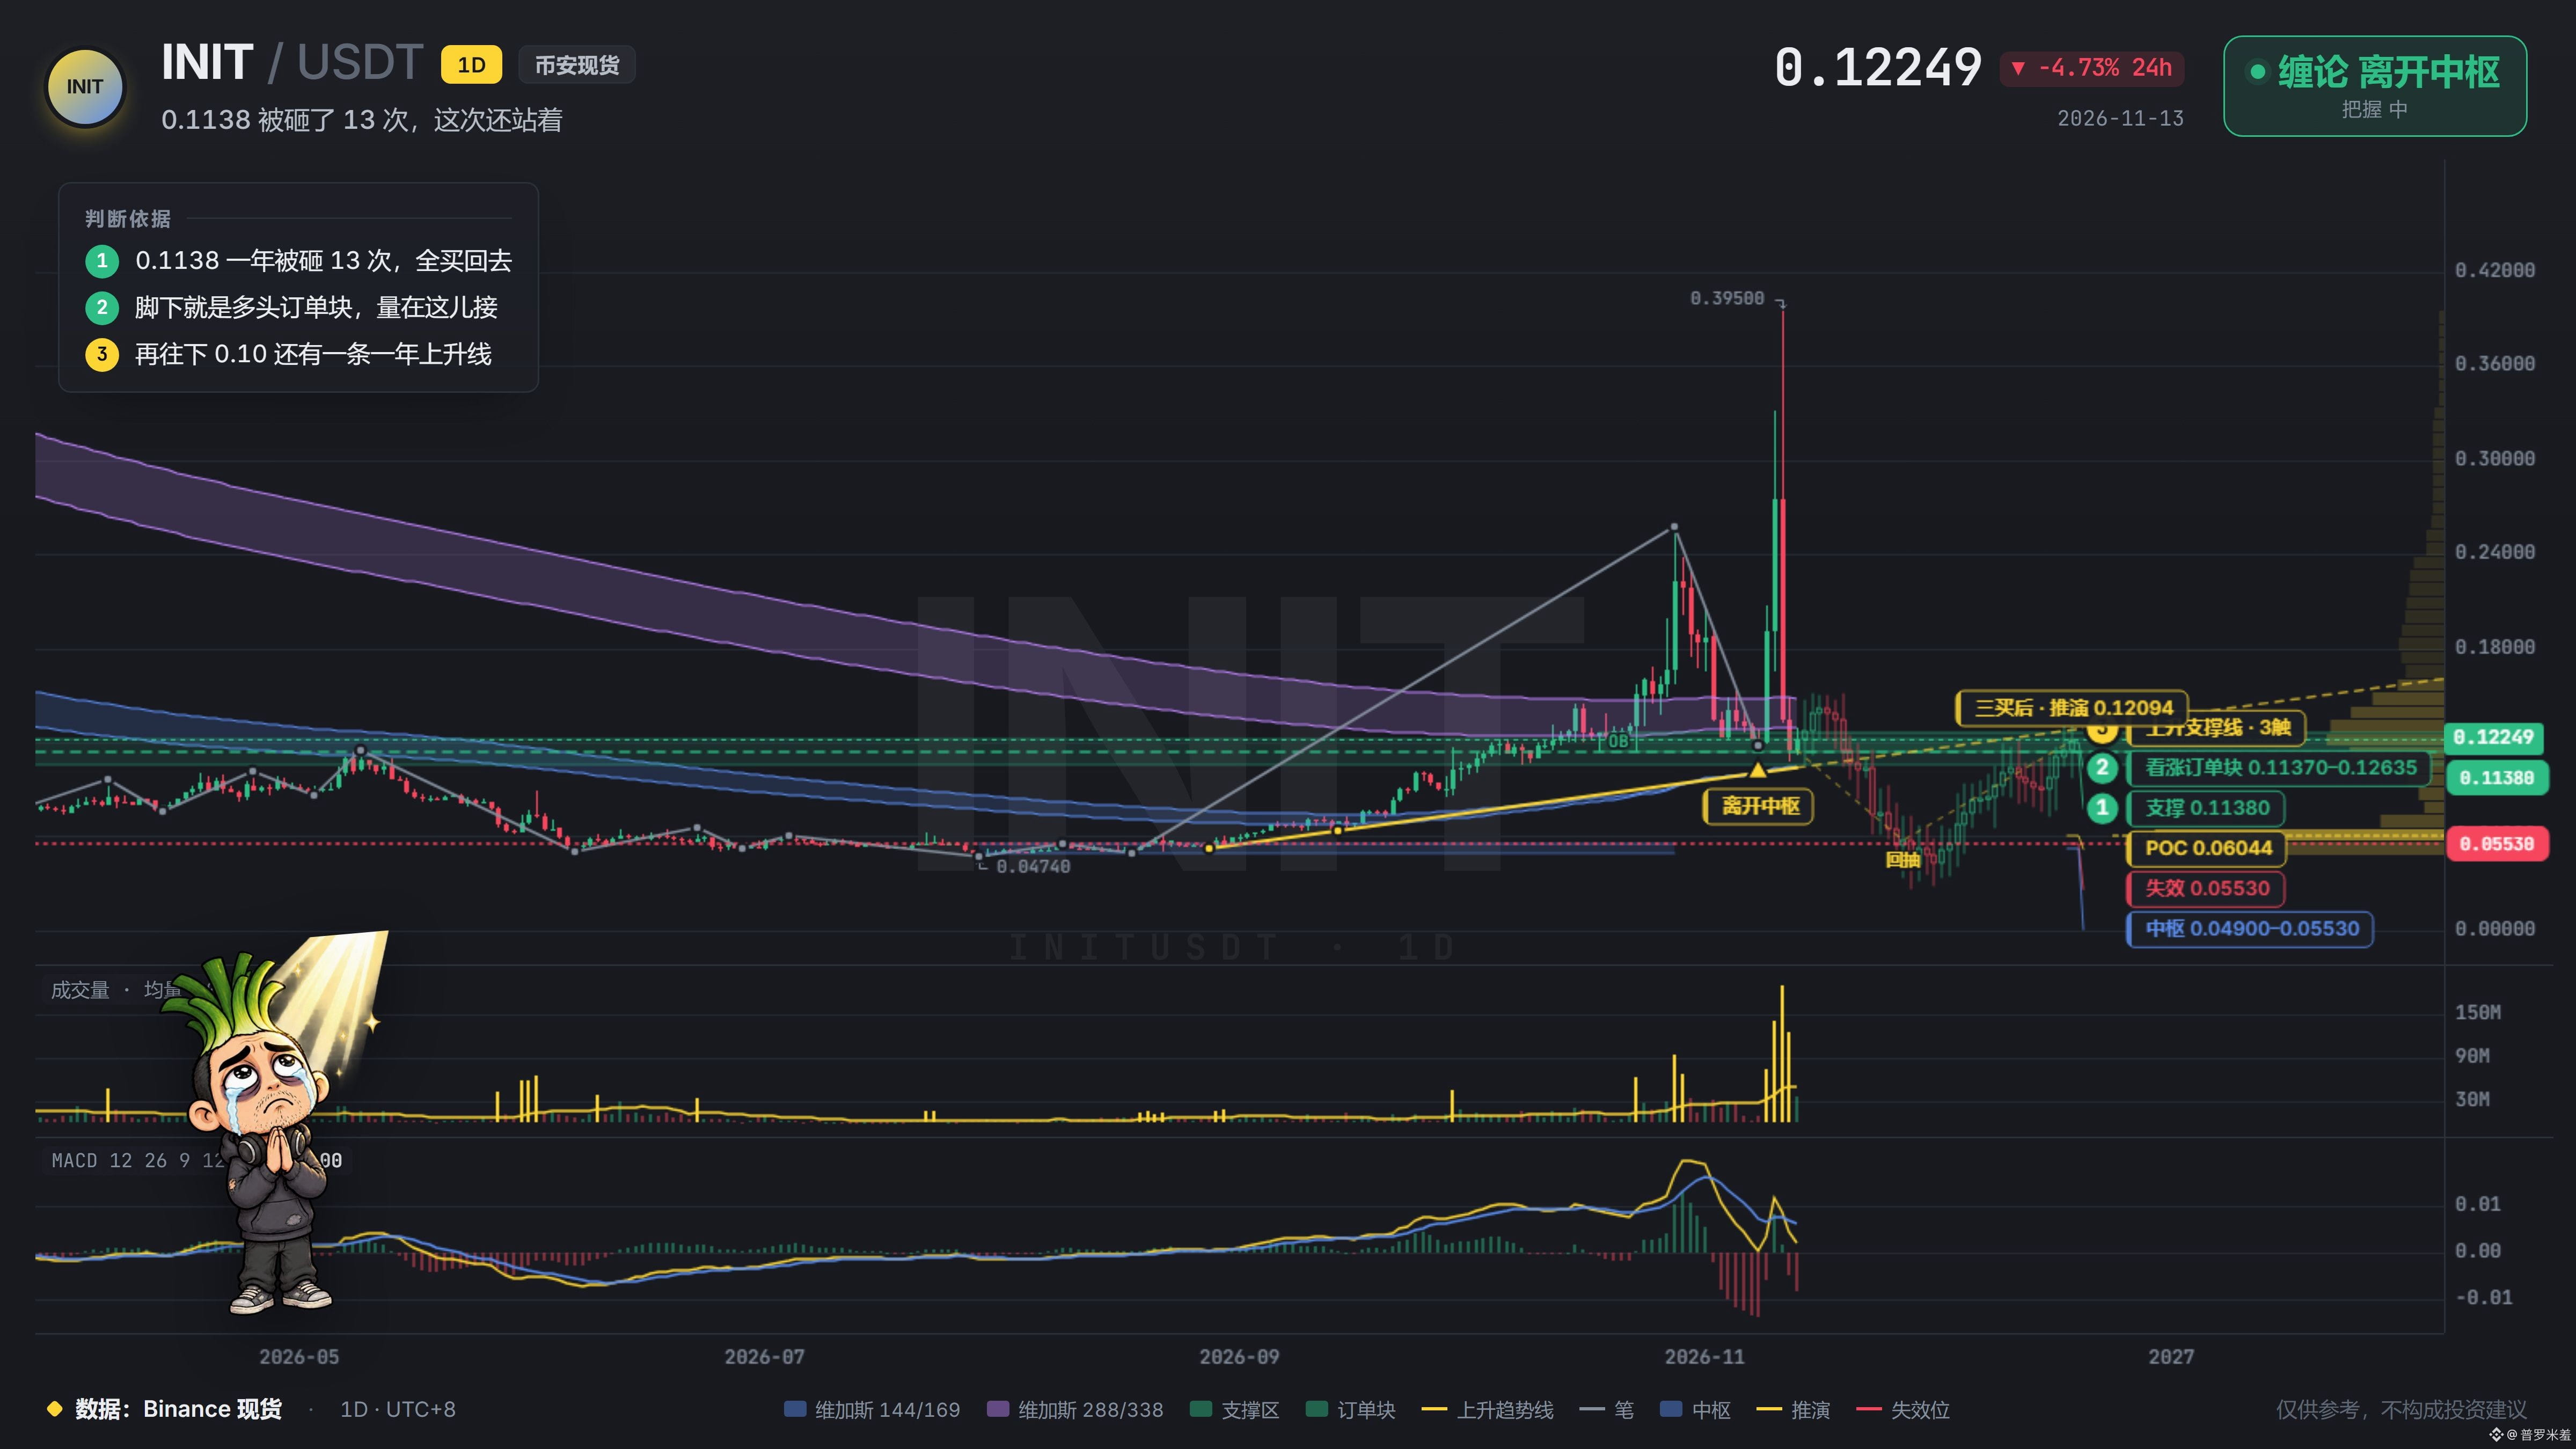
$INIT has fallen from 0.33 back to 0.12—more than 60% gone. The painful part isn’t losing money; it’s that nobody’s talking about this coin anymore. The group chat is so quiet, you’d think nobody was holding it. You can barely be bothered to open it and check.
But there’s one spot on the daily chart that’s really worth a look: 0.1138. It’s been slammed 13 times over the past year, and buyers stepped in every single time. Now the price is sitting right on top of it, with a bullish order block underneath. Trading volume this week is four times higher than it was over the previous 30 days, which suggests someone’s starting to make moves here.
I can’t say whether this is the bottom—I’m almost never right when I try to call one. But if you’re still holding, there’s no need to scare yourself out of it at this level.
$INIT has fallen from 0.33 back to 0.12—more than 60% gone. The painful part isn’t losing money; it’s that nobody’s talking about this coin anymore. The group chat is so quiet, you’d think nobody was holding it. You can barely be bothered to open it and check.
But there’s one spot on the daily chart that’s really worth a look: 0.1138. It’s been slammed 13 times over the past year, and buyers stepped in every single time. Now the price is sitting right on top of it, with a bullish order block underneath. Trading volume this week is four times higher than it was over the previous 30 days, which suggests someone’s starting to make moves here.
I can’t say whether this is the bottom—I’m almost never right when I try to call one. But if you’re still holding, there’s no need to scare yourself out of it at this level.
But there’s one spot on the daily chart that’s really worth a look: 0.1138. It’s been slammed 13 times over the past year, and buyers stepped in every single time. Now the price is sitting right on top of it, with a bullish order block underneath. Trading volume this week is four times higher than it was over the previous 30 days, which suggests someone’s starting to make moves here.
I can’t say whether this is the bottom—I’m almost never right when I try to call one. But if you’re still holding, there’s no need to scare yourself out of it at this level.
51
·
--
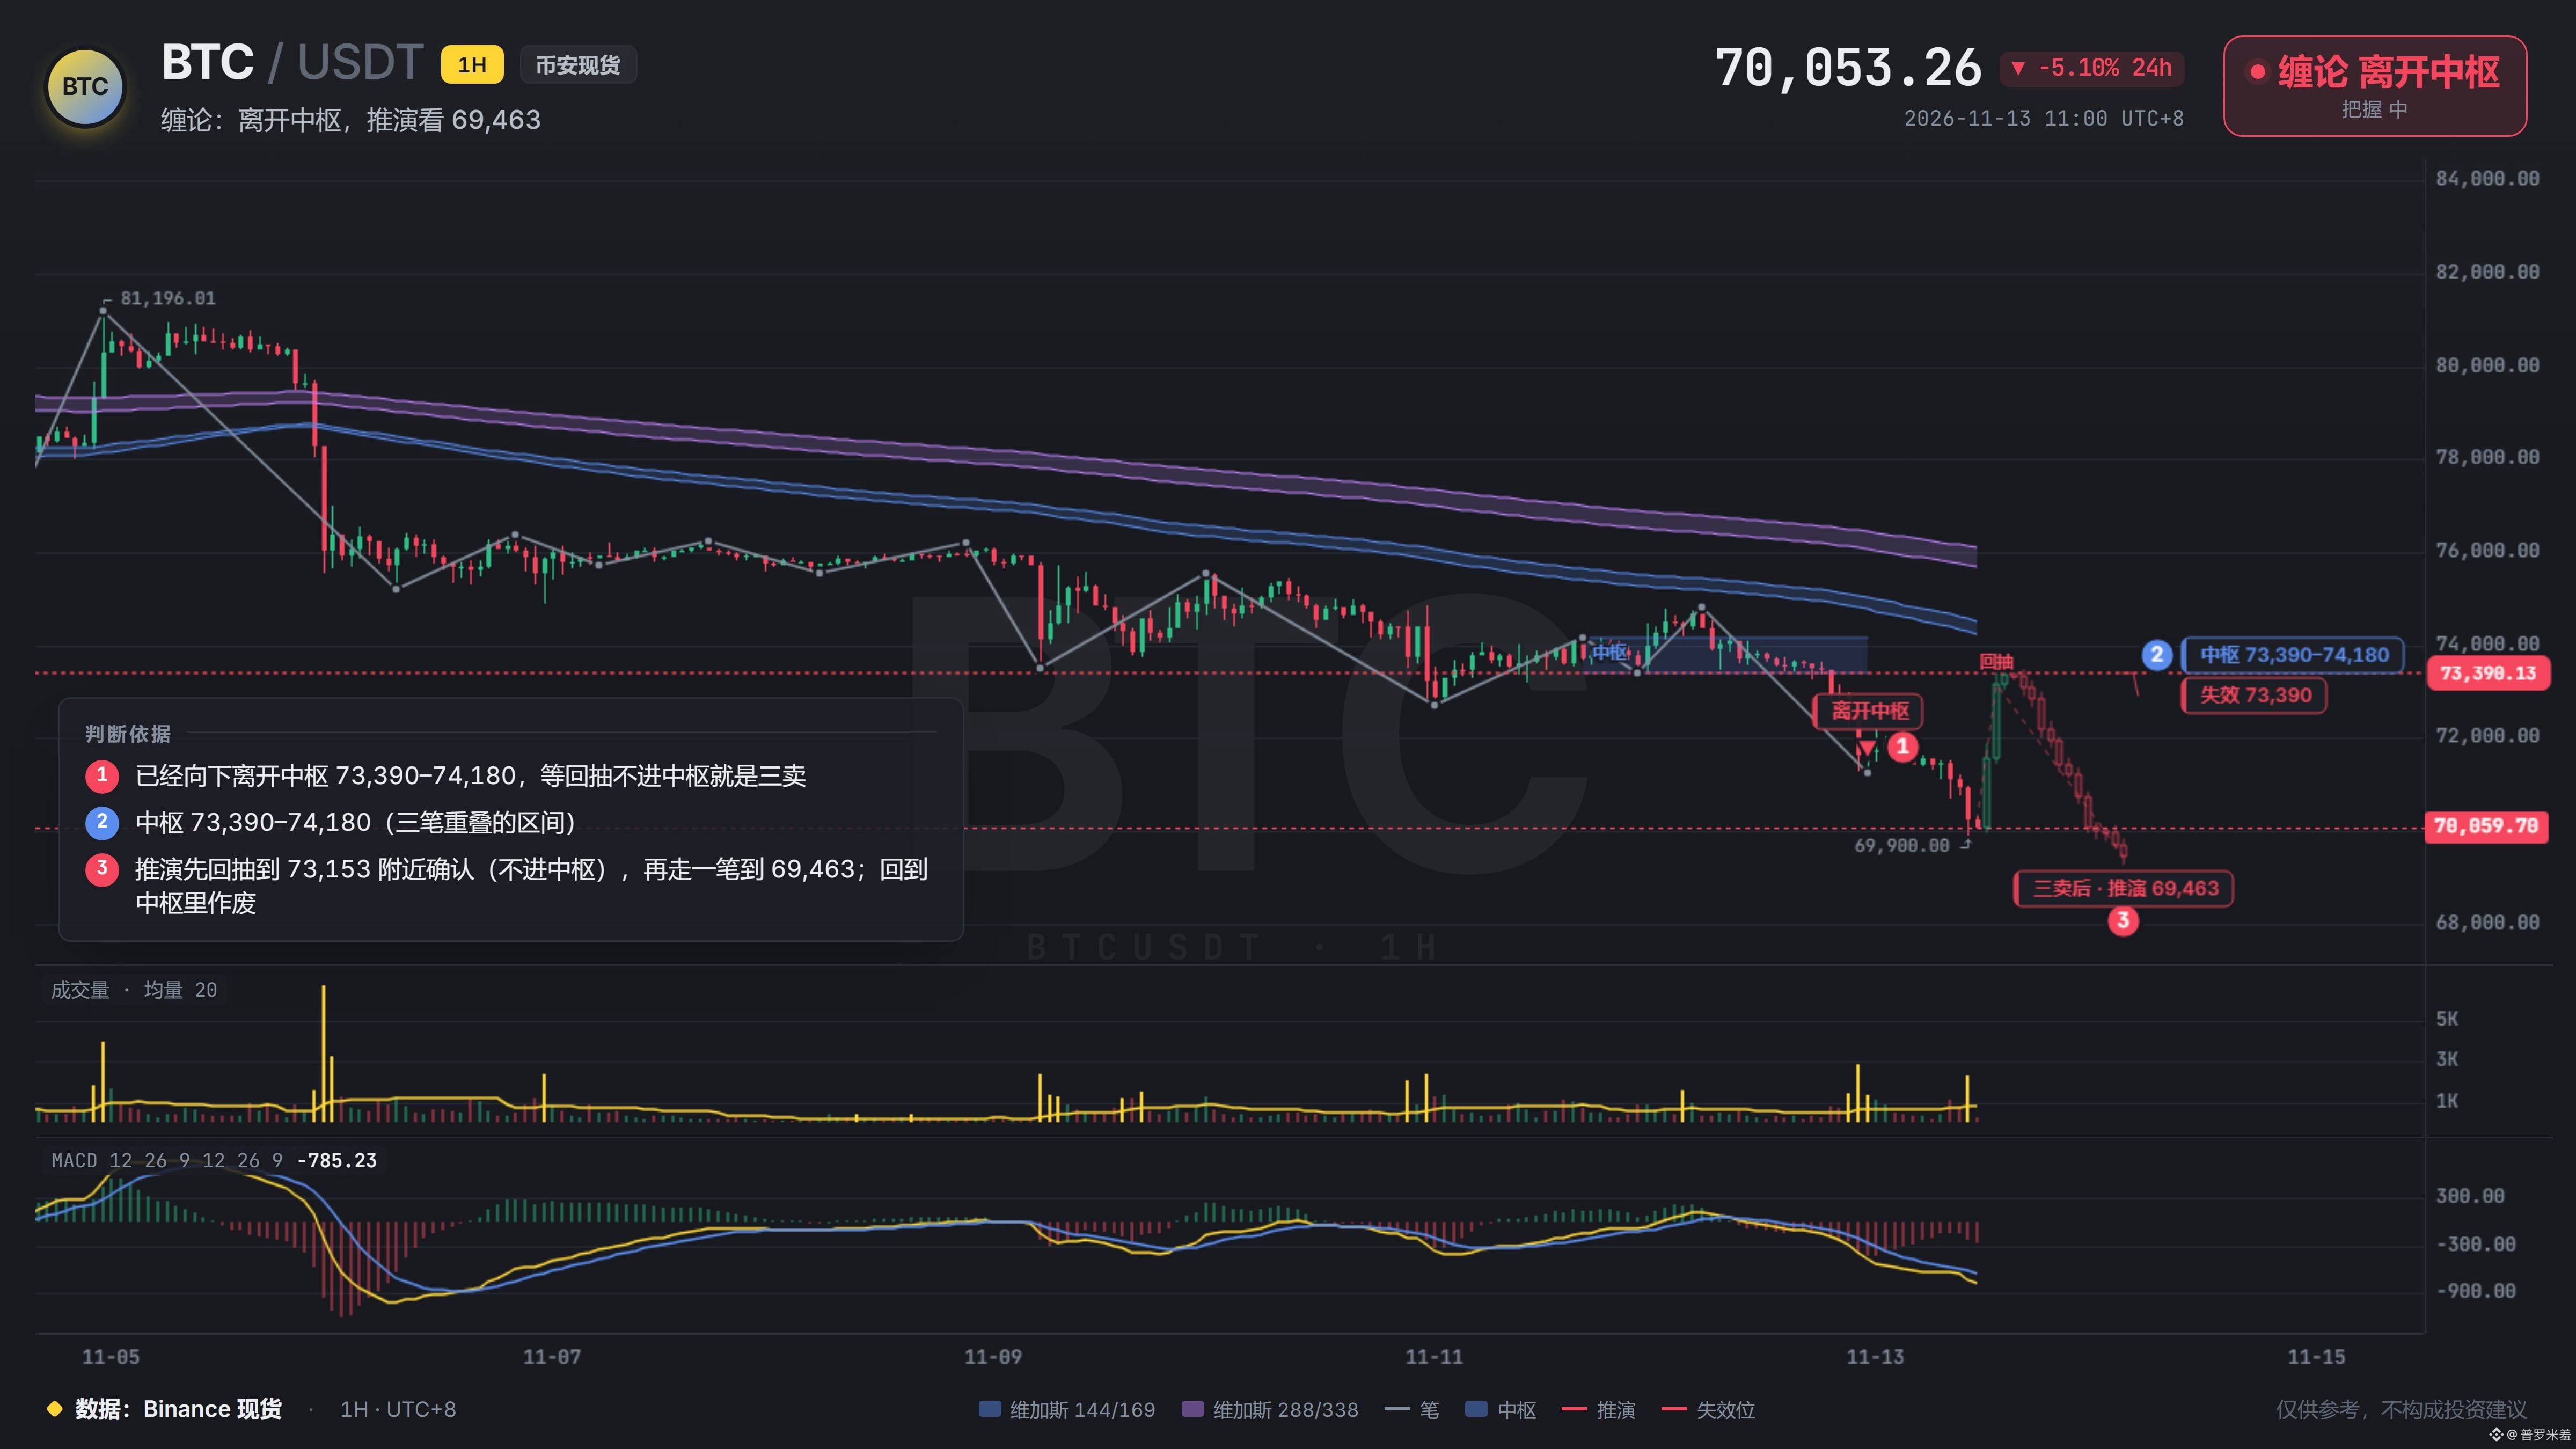
This level held six times, and every bounce made it feel like the bottom was right here. On the seventh test, volume at 2.7 times the usual amount smashed straight through, with no recovery. Holding six times isn’t support—it’s bait. They let you believe it, then pull the net closed.
The rebound afterward couldn’t reclaim 71,437 either, so stop fooling yourself. $BTC See you below at 69,463. I’m going short this time—don’t try to talk me out of it.
This level held six times, and every bounce made it feel like the bottom was right here. On the seventh test, volume at 2.7 times the usual amount smashed straight through, with no recovery. Holding six times isn’t support—it’s bait. They let you believe it, then pull the net closed.
The rebound afterward couldn’t reclaim 71,437 either, so stop fooling yourself. $BTC See you below at 69,463. I’m going short this time—don’t try to talk me out of it.
The rebound afterward couldn’t reclaim 71,437 either, so stop fooling yourself. $BTC See you below at 69,463. I’m going short this time—don’t try to talk me out of it.
53
·
--
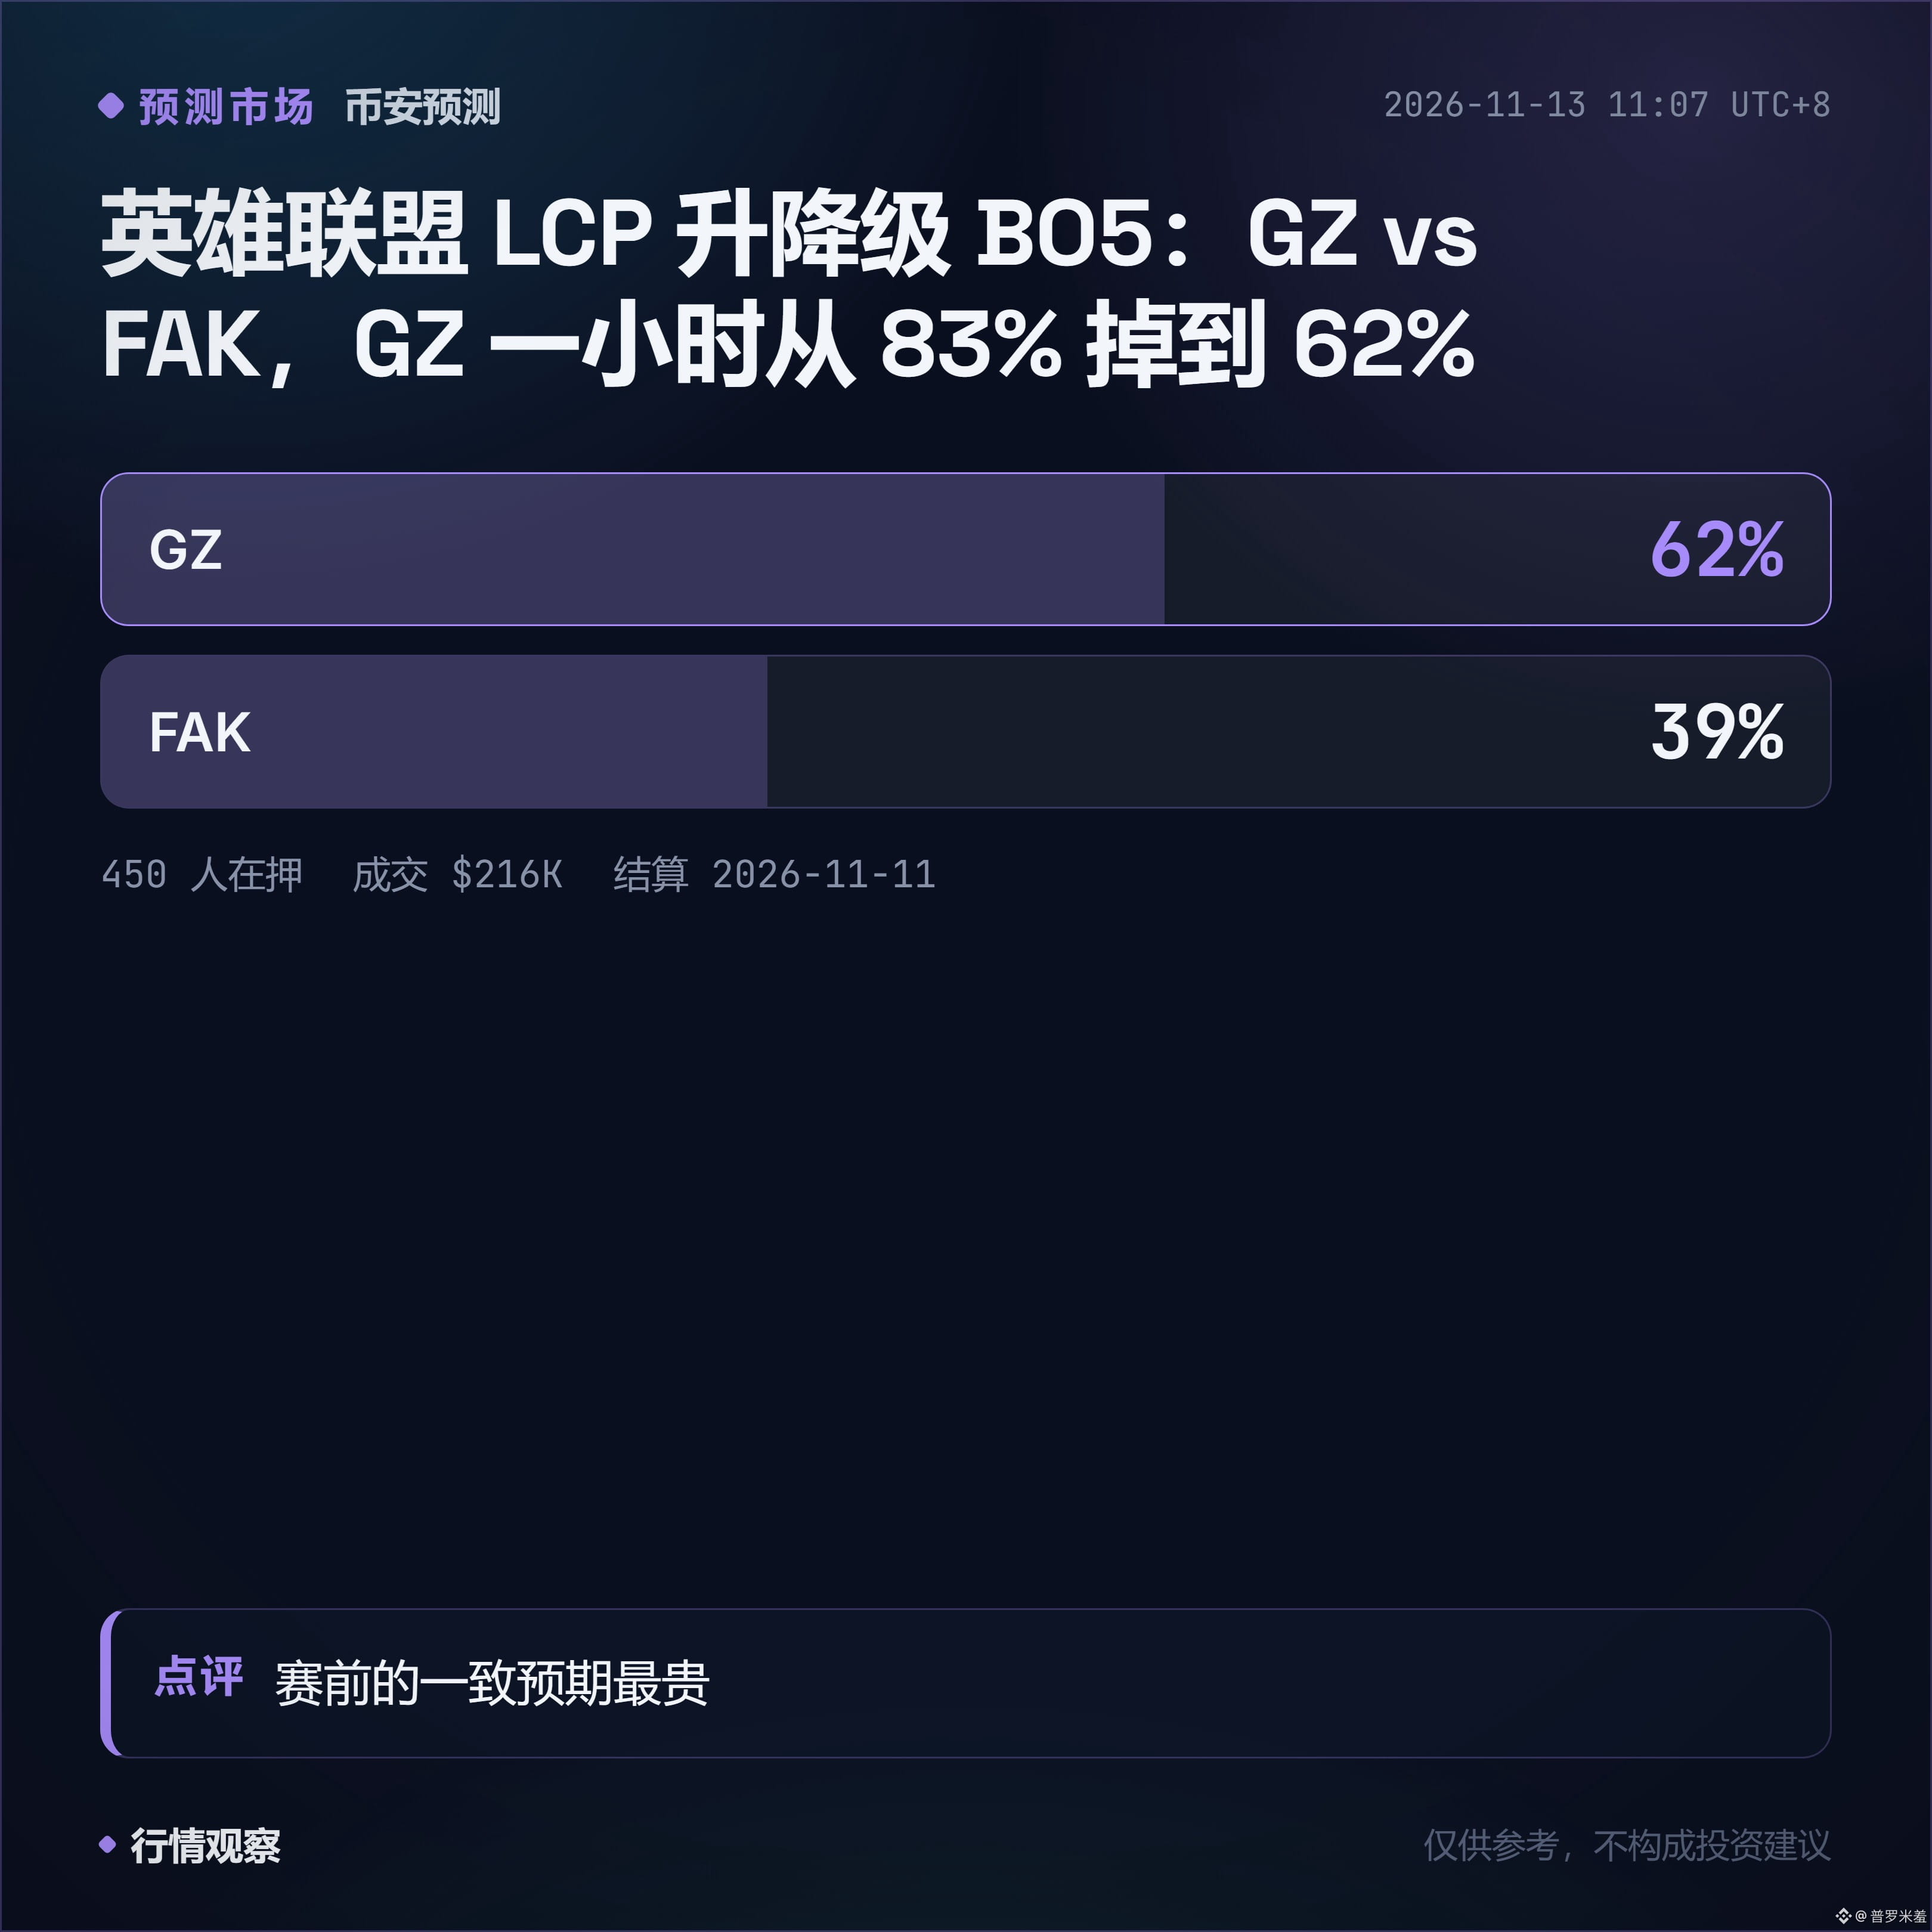
In one hour, the odds dropped from 83% to 62%. 450 people piled into an LCP promotion/relegation BO5 that everyone had written off as a free win before the match—then everything changed after just one game.
The probabilities on the betting market have never reflected skill; they reflect confidence built on money. A figure like 83% doesn’t mean it’s a sure thing. It means nobody seriously considered that they might lose.
The really interesting thing is the market itself: everyone says there’s no action, nothing worth doing, yet they’re all piling into prediction markets to bet on people playing video games. When people are this eager to place bets, it usually means things have been moving sideways for long enough.
In one hour, the odds dropped from 83% to 62%. 450 people piled into an LCP promotion/relegation BO5 that everyone had written off as a free win before the match—then everything changed after just one game.
The probabilities on the betting market have never reflected skill; they reflect confidence built on money. A figure like 83% doesn’t mean it’s a sure thing. It means nobody seriously considered that they might lose.
The really interesting thing is the market itself: everyone says there’s no action, nothing worth doing, yet they’re all piling into prediction markets to bet on people playing video games. When people are this eager to place bets, it usually means things have been moving sideways for long enough.
The probabilities on the betting market have never reflected skill; they reflect confidence built on money. A figure like 83% doesn’t mean it’s a sure thing. It means nobody seriously considered that they might lose.
The really interesting thing is the market itself: everyone says there’s no action, nothing worth doing, yet they’re all piling into prediction markets to bet on people playing video games. When people are this eager to place bets, it usually means things have been moving sideways for long enough.
57
·
--
$GNS This is the kind of coin that feels the worst: it’s down more than 70%, but selling feels like a waste, and holding it seems to go nowhere. I open the app fewer than three times a year.
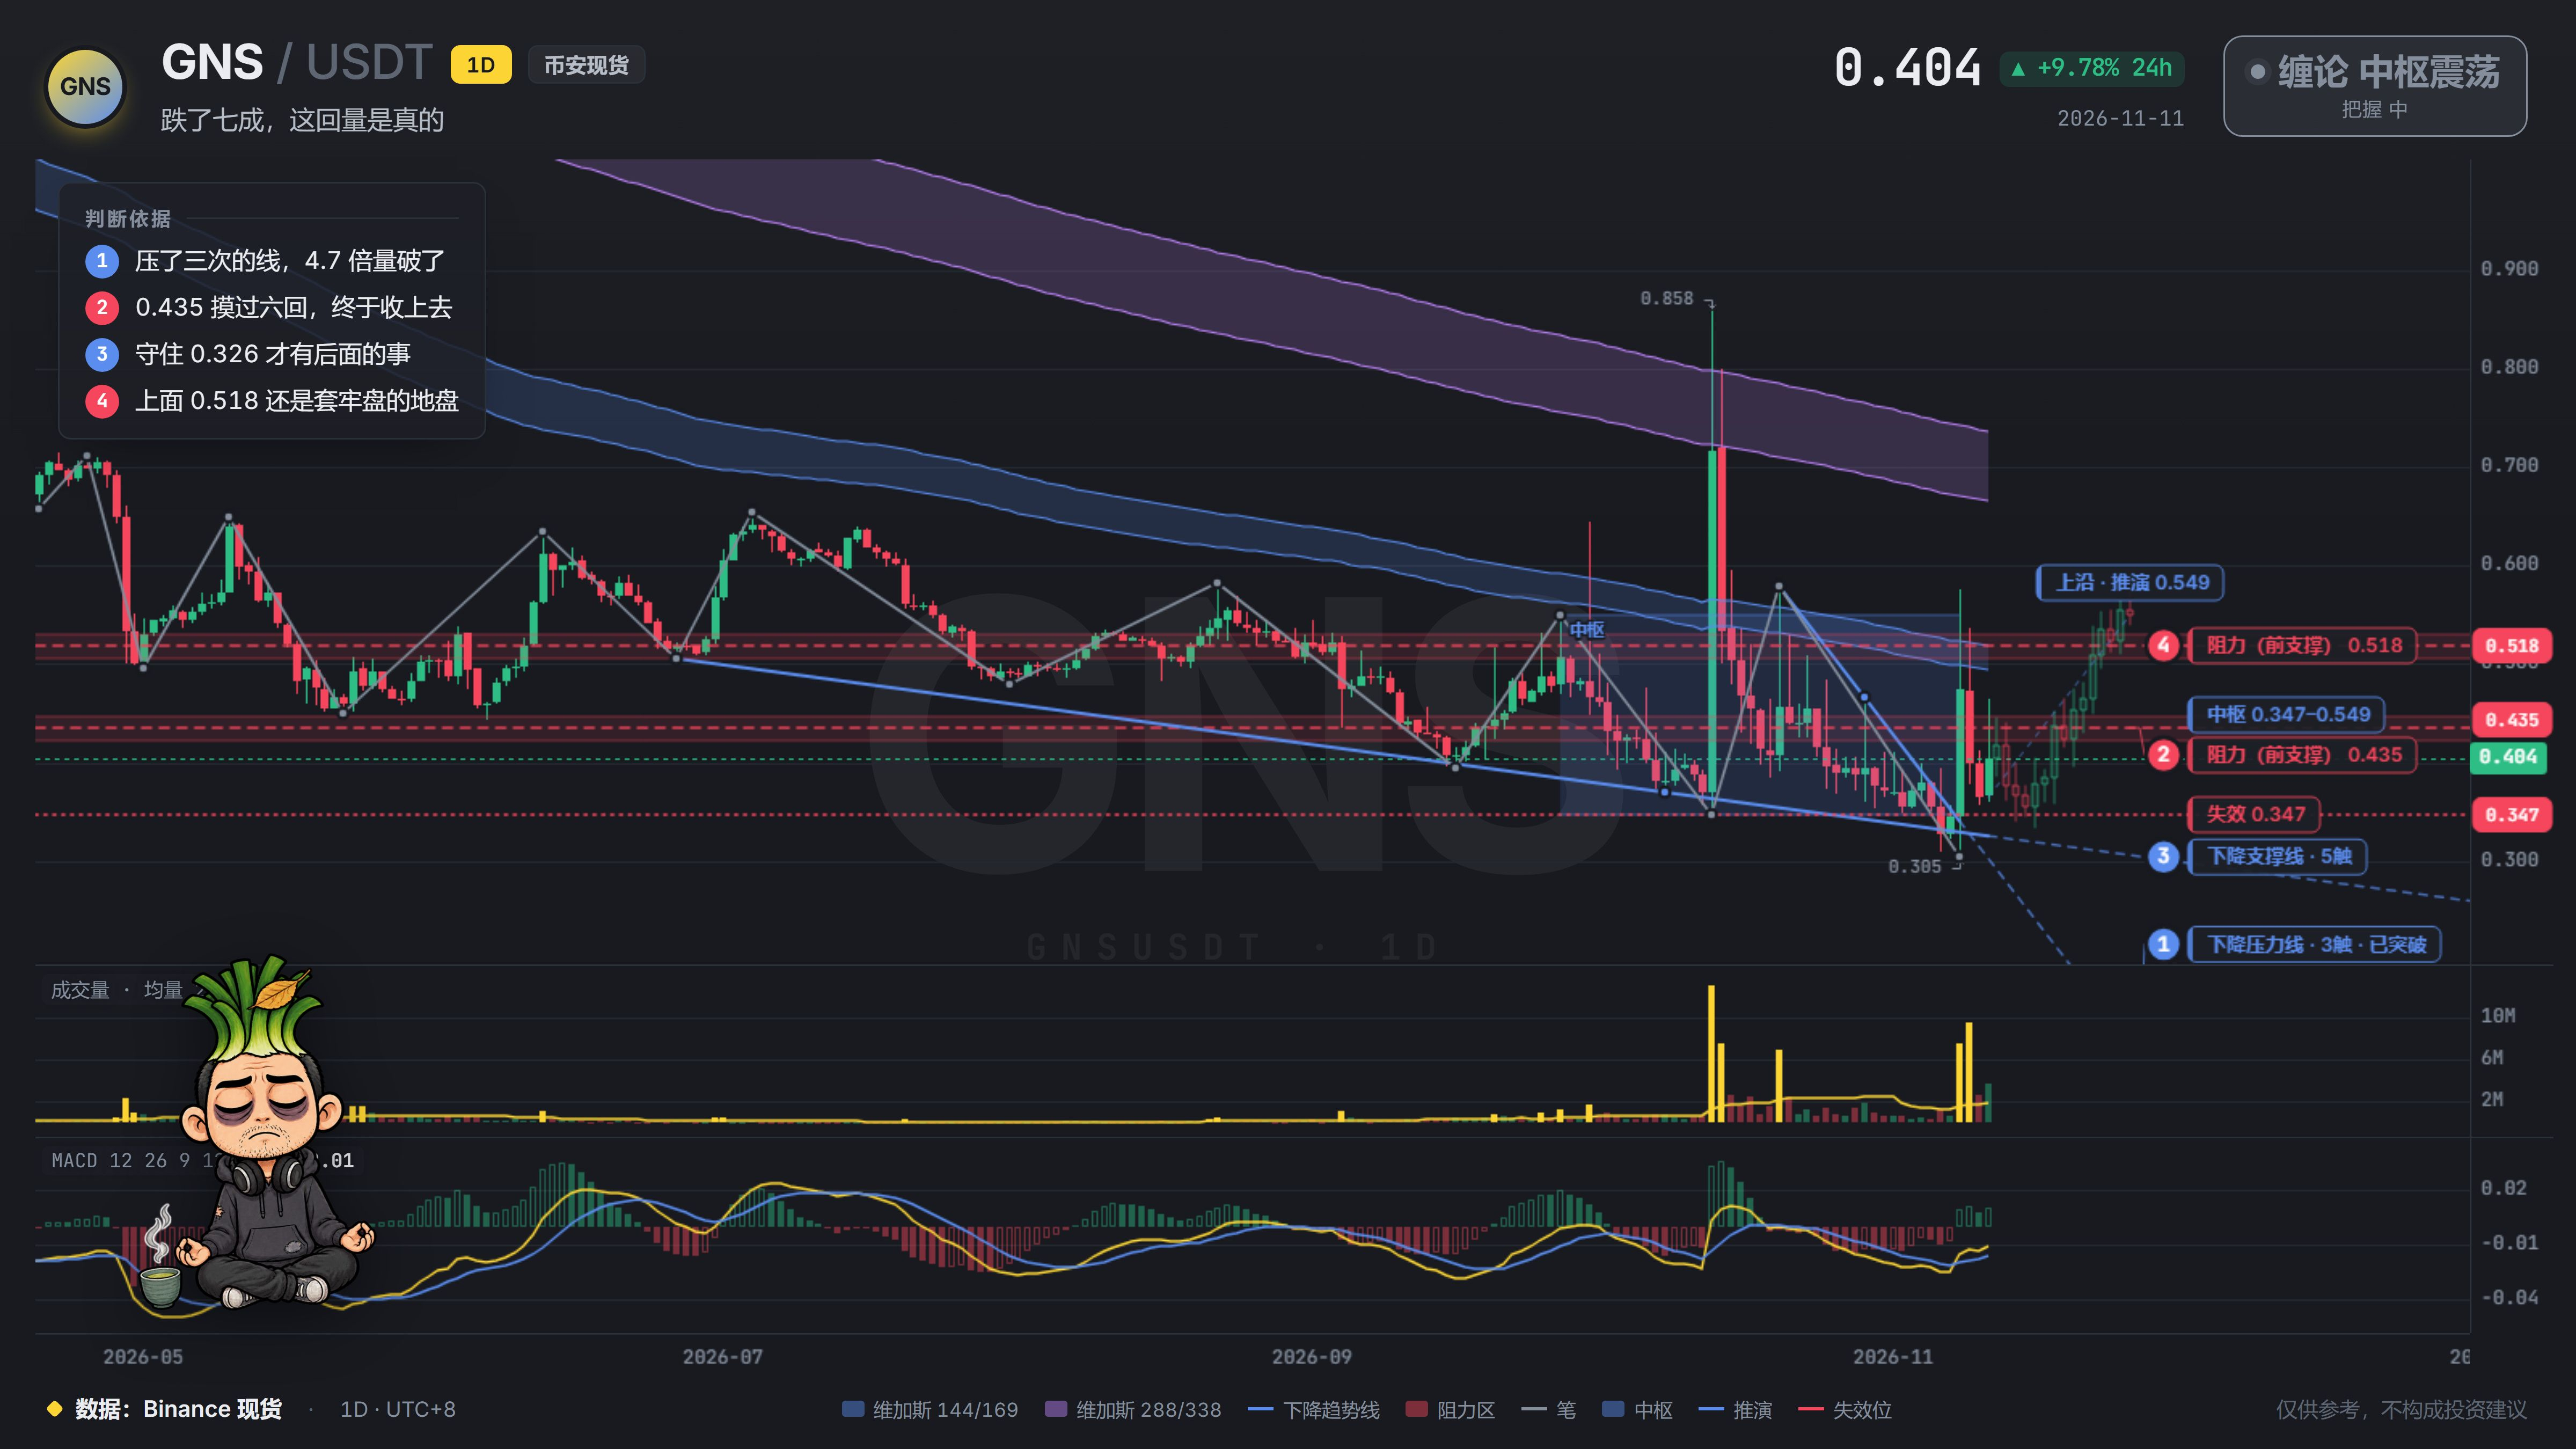
This week, it quietly gained 15%. The really interesting part isn’t the gain, though—it’s the volume. The descending trendline it had tested three times was broken on 4.7 times the usual volume; the 0.435 level, which it had touched six times, was reclaimed on 4.6 times the volume. Retail traders can’t pull off this kind of move.
I’m not going to promise this is the bottom. There’s a wall of resistance overhead at 0.518, where several former support levels have turned into resistance. If it bounces back up there, we’ll have to see whether the market lets it through. If you’re still holding, keep an eye on 0.326 for now—if it breaks, then rethink your strategy.
After falling 70% and spending more than a year down, it won’t get back up in a straight line. No rush—I’ll keep watching it with you.
$GNS This is the kind of coin that feels the worst: it’s down more than 70%, but selling feels like a waste, and holding it seems to go nowhere. I open the app fewer than three times a year.
This week, it quietly gained 15%. The really interesting part isn’t the gain, though—it’s the volume. The descending trendline it had tested three times was broken on 4.7 times the usual volume; the 0.435 level, which it had touched six times, was reclaimed on 4.6 times the volume. Retail traders can’t pull off this kind of move.
I’m not going to promise this is the bottom. There’s a wall of resistance overhead at 0.518, where several former support levels have turned into resistance. If it bounces back up there, we’ll have to see whether the market lets it through. If you’re still holding, keep an eye on 0.326 for now—if it breaks, then rethink your strategy.
After falling 70% and spending more than a year down, it won’t get back up in a straight line. No rush—I’ll keep watching it with you.
This week, it quietly gained 15%. The really interesting part isn’t the gain, though—it’s the volume. The descending trendline it had tested three times was broken on 4.7 times the usual volume; the 0.435 level, which it had touched six times, was reclaimed on 4.6 times the volume. Retail traders can’t pull off this kind of move.
I’m not going to promise this is the bottom. There’s a wall of resistance overhead at 0.518, where several former support levels have turned into resistance. If it bounces back up there, we’ll have to see whether the market lets it through. If you’re still holding, keep an eye on 0.326 for now—if it breaks, then rethink your strategy.
After falling 70% and spending more than a year down, it won’t get back up in a straight line. No rush—I’ll keep watching it with you.
4
·
--
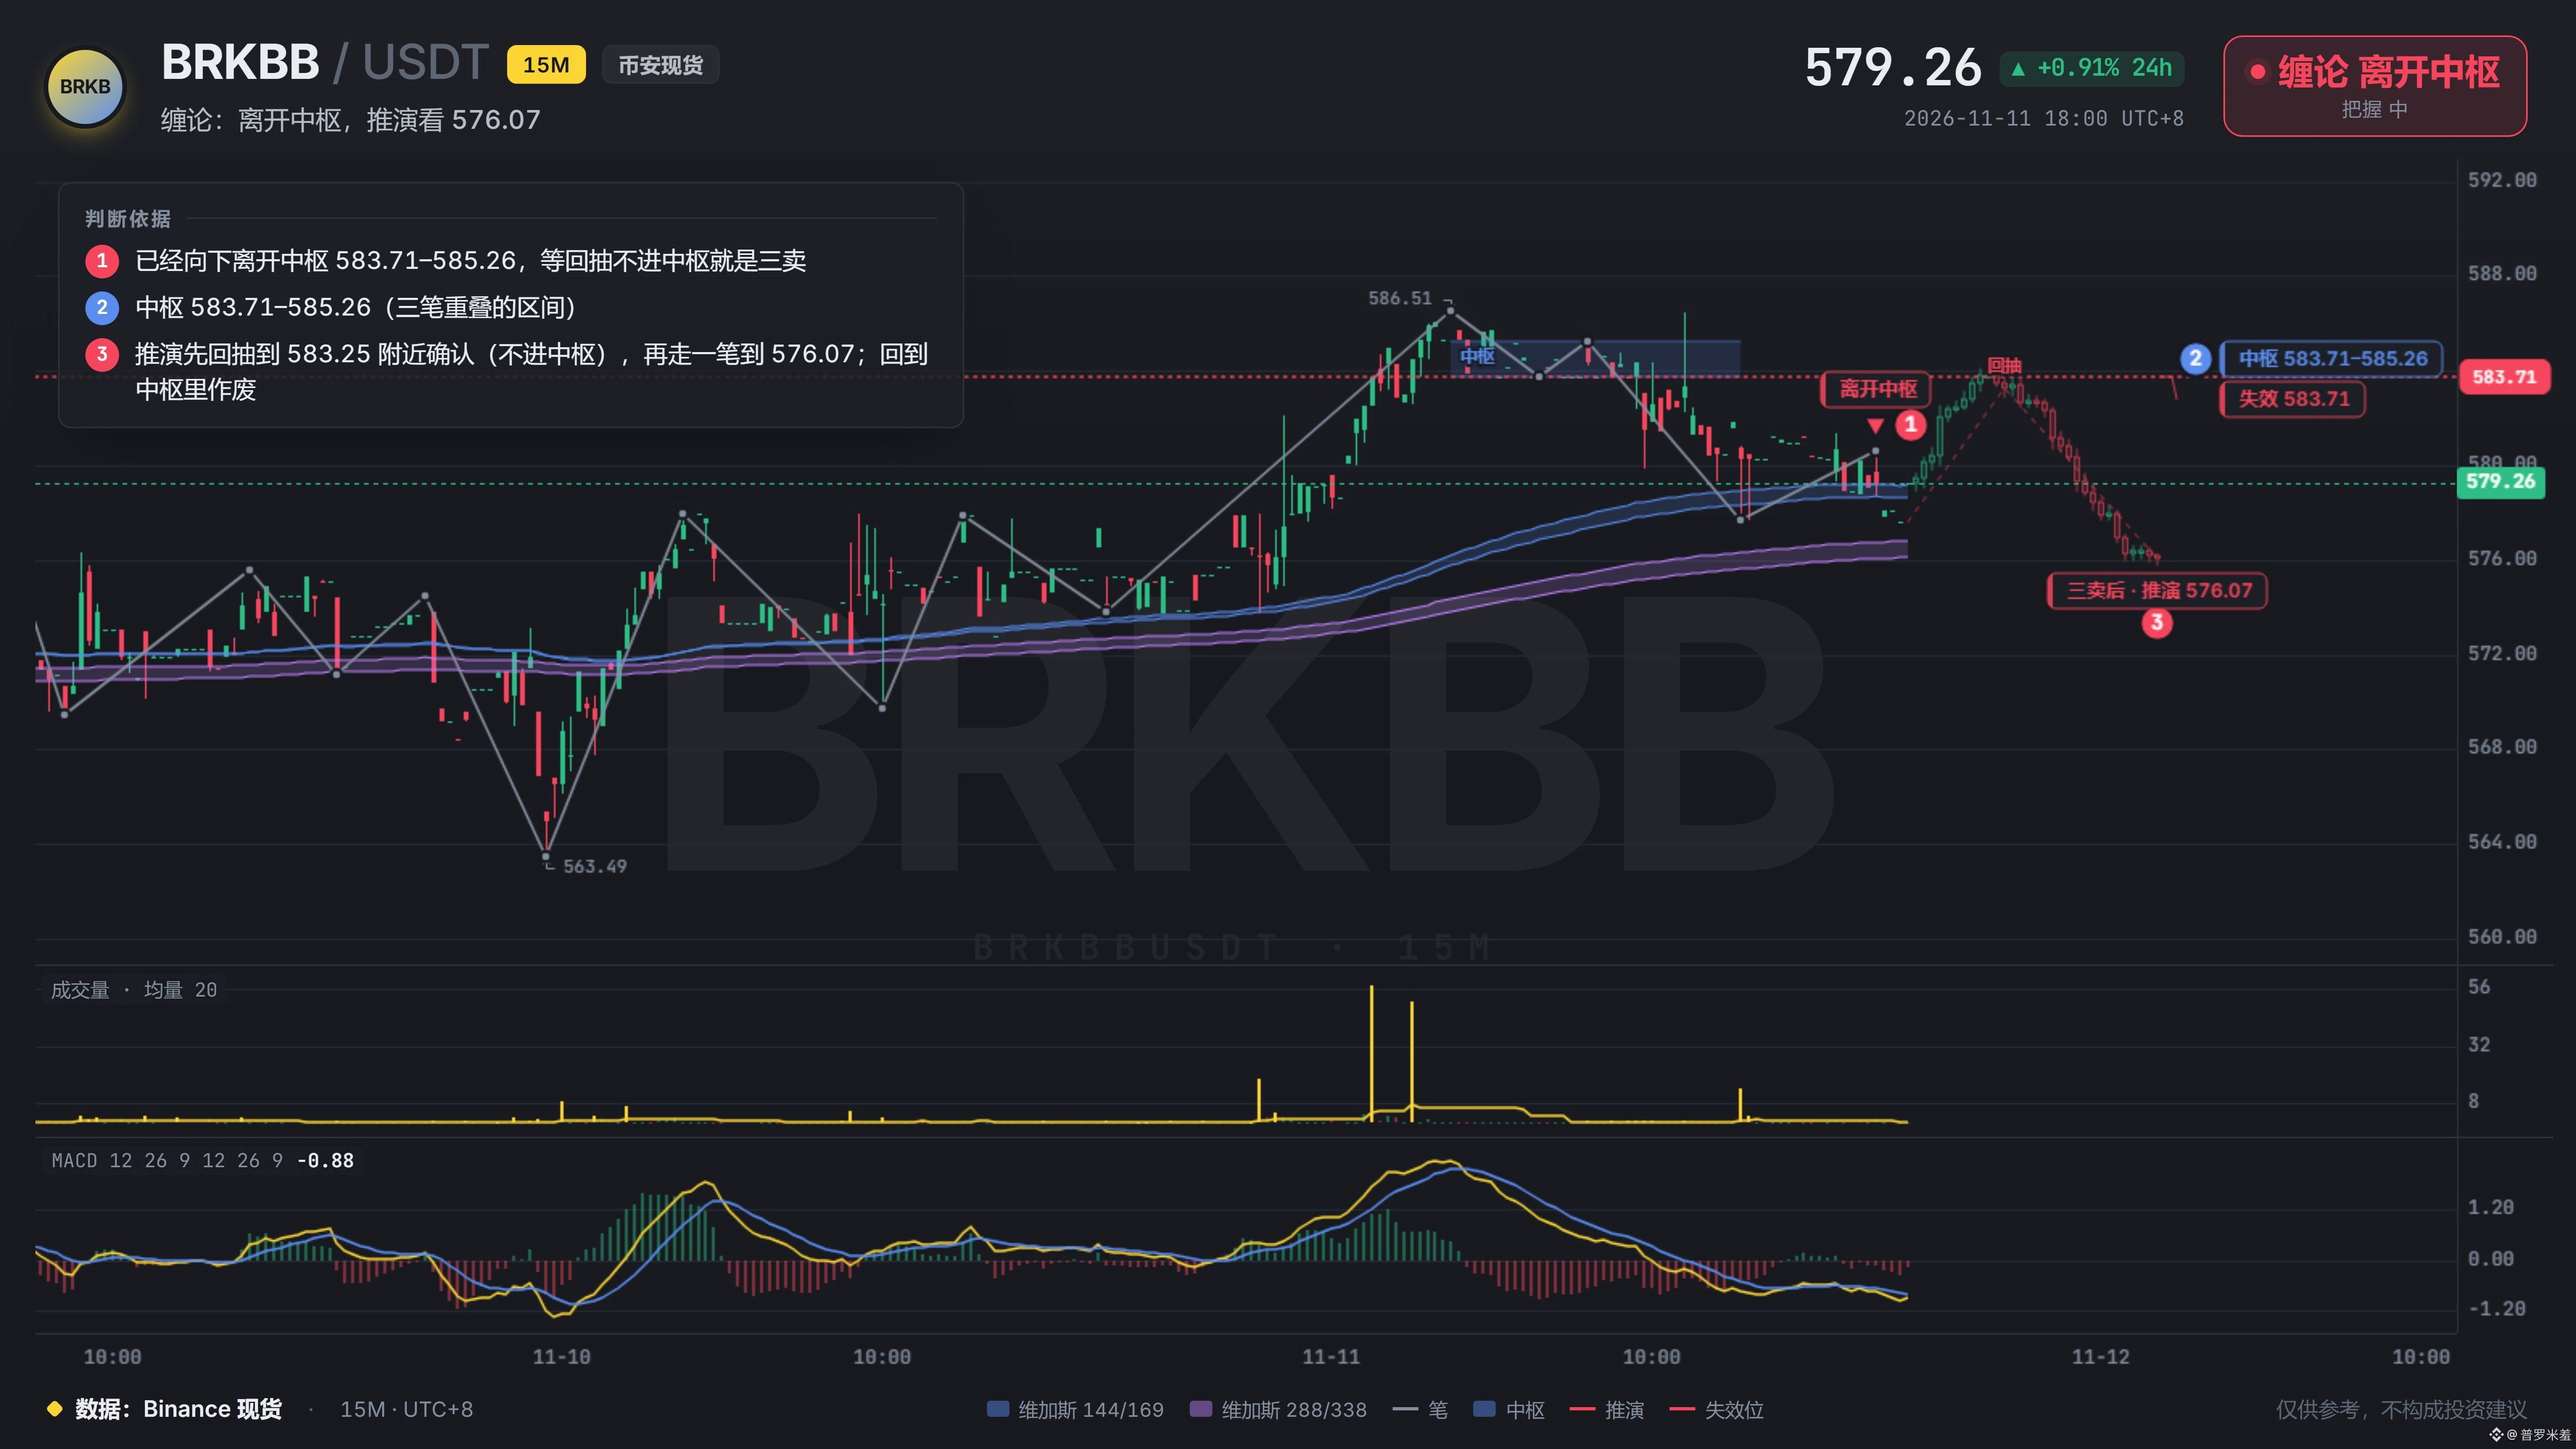
Once 577.69 breaks, the swing structure officially turns bearish. It’s crystal clear on the chart—there’s nothing to argue about.
But look back at the volume on those breakdown candles: it wasn’t even a fraction of the average. Is this a real breakdown or just a scare tactic? If they were really unloading, volume wouldn’t be this anaemic. The price makes a new low, yet selling pressure keeps fading. I can’t even be bothered to criticize a breakdown like this.
The structure is one thing, but I’ll say it again: the hole that damn market maker talks the price into, it’ll be the first one to jump into on the way back up. If the rebound can’t get back into the consolidation zone, then it’s really over.
Once 577.69 breaks, the swing structure officially turns bearish. It’s crystal clear on the chart—there’s nothing to argue about.
But look back at the volume on those breakdown candles: it wasn’t even a fraction of the average. Is this a real breakdown or just a scare tactic? If they were really unloading, volume wouldn’t be this anaemic. The price makes a new low, yet selling pressure keeps fading. I can’t even be bothered to criticize a breakdown like this.
The structure is one thing, but I’ll say it again: the hole that damn market maker talks the price into, it’ll be the first one to jump into on the way back up. If the rebound can’t get back into the consolidation zone, then it’s really over.
But look back at the volume on those breakdown candles: it wasn’t even a fraction of the average. Is this a real breakdown or just a scare tactic? If they were really unloading, volume wouldn’t be this anaemic. The price makes a new low, yet selling pressure keeps fading. I can’t even be bothered to criticize a breakdown like this.
The structure is one thing, but I’ll say it again: the hole that damn market maker talks the price into, it’ll be the first one to jump into on the way back up. If the rebound can’t get back into the consolidation zone, then it’s really over.
·
--
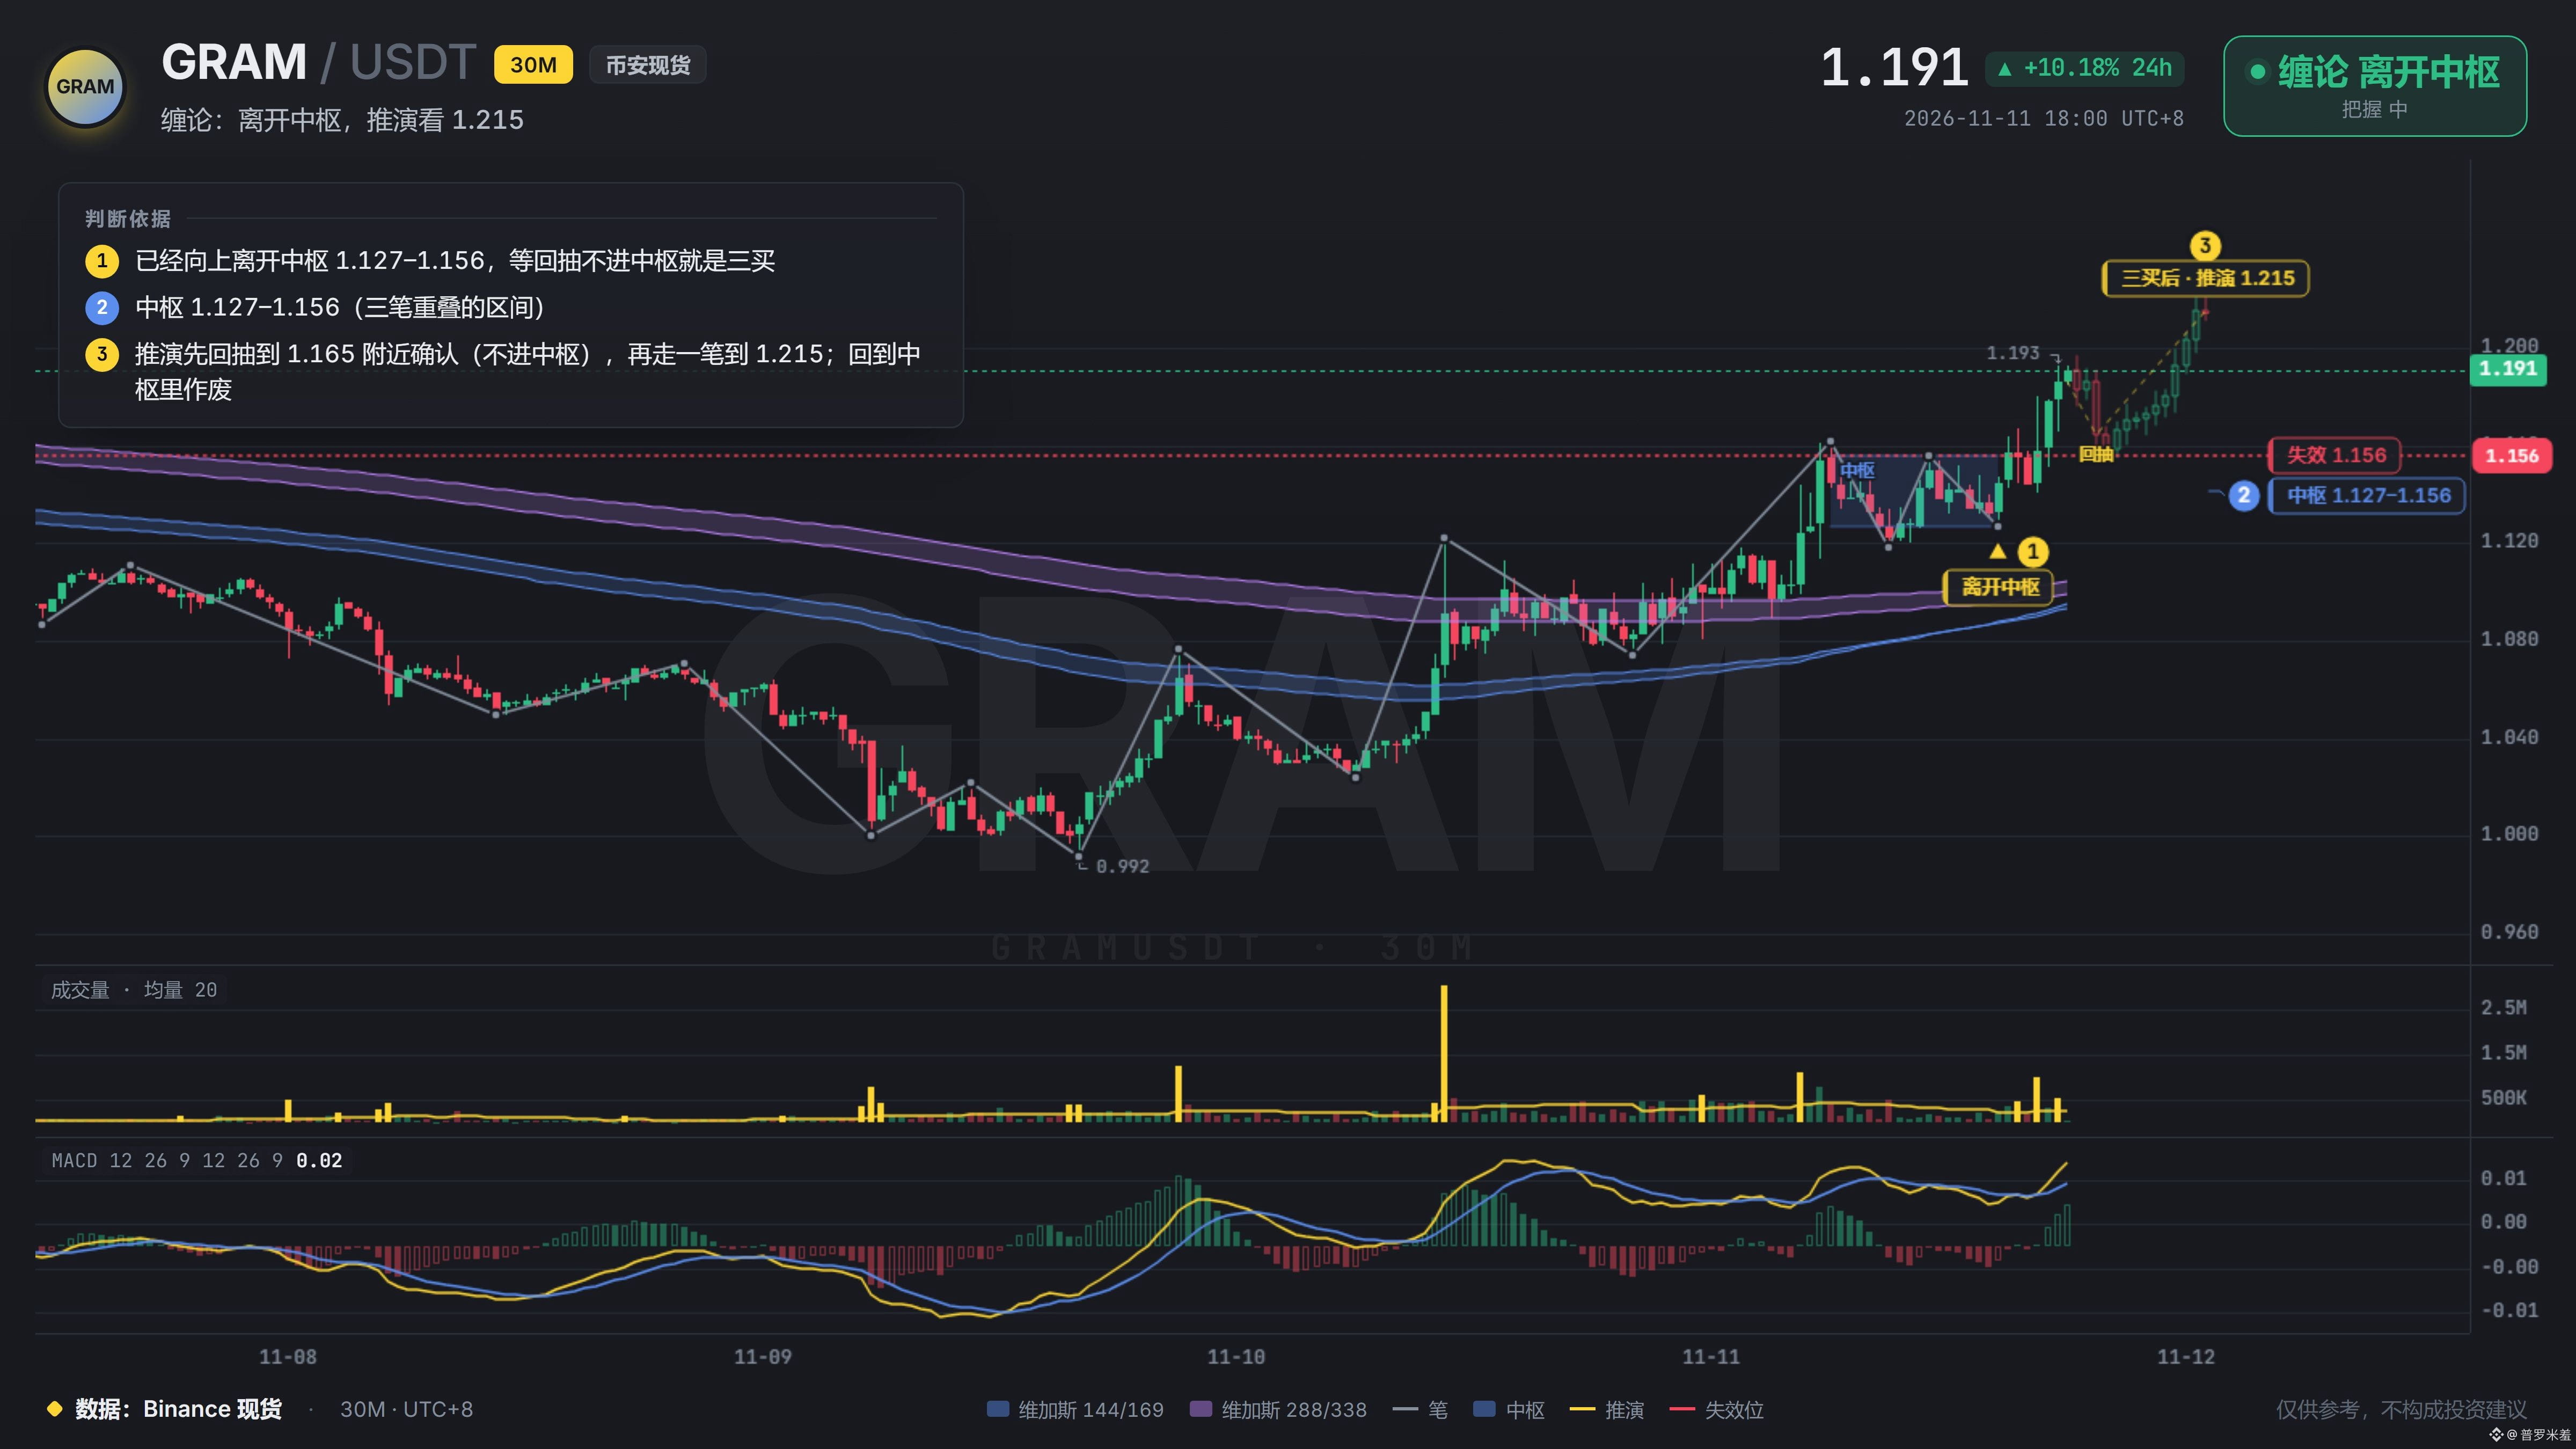
That fake breakdown a few days ago—I stared at the screen and didn’t dare put a finger on the buy button. Then they came back with twice the volume and took out 1.179, gaining ten points in a day. $GRAM Fine, I’ll keep watch, you keep going up. But the people stuck holding above 1.194 haven’t left yet, so don’t blame them if they dump on you when you rise too fast.
That fake breakdown a few days ago—I stared at the screen and didn’t dare put a finger on the buy button. Then they came back with twice the volume and took out 1.179, gaining ten points in a day. $GRAM Fine, I’ll keep watch, you keep going up. But the people stuck holding above 1.194 haven’t left yet, so don’t blame them if they dump on you when you rise too fast.
2
·
--
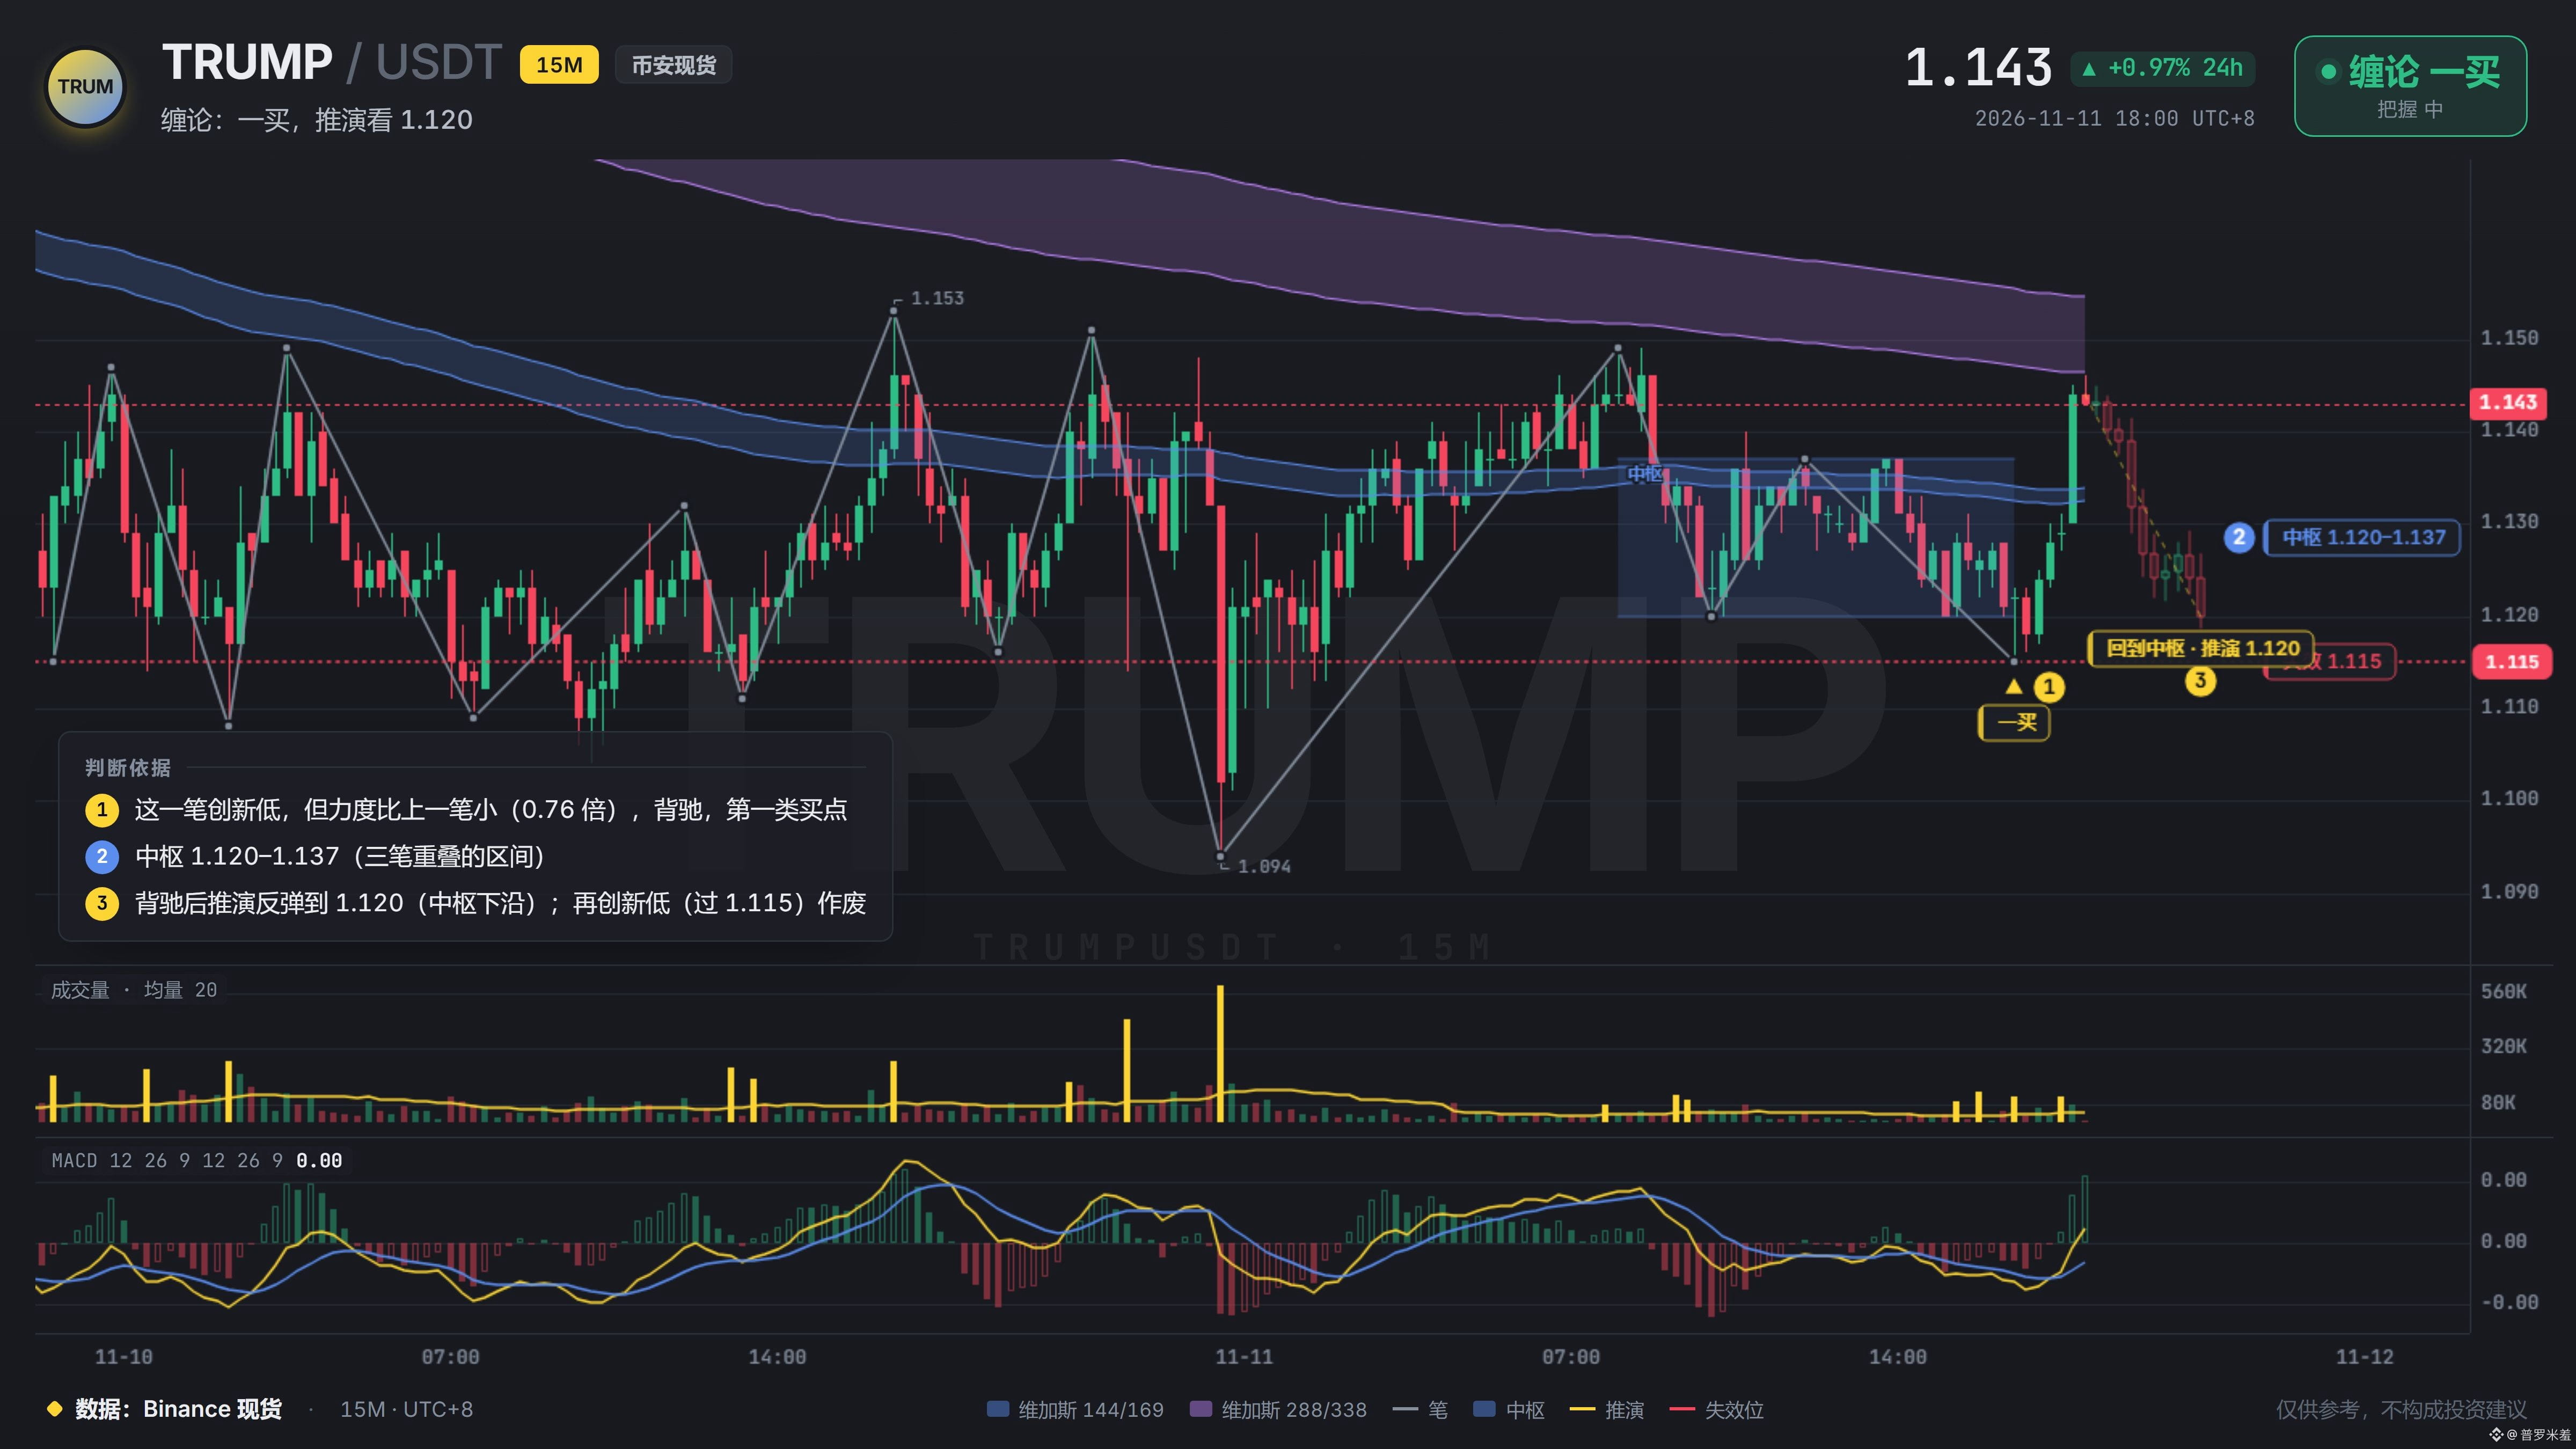
$TRUMP I've been waiting a week for this bullish candle. 1.140 held firm—I told you it wouldn't fall below this level.
$TRUMP I've been waiting a week for this bullish candle. 1.140 held firm—I told you it wouldn't fall below this level.
11
·
--
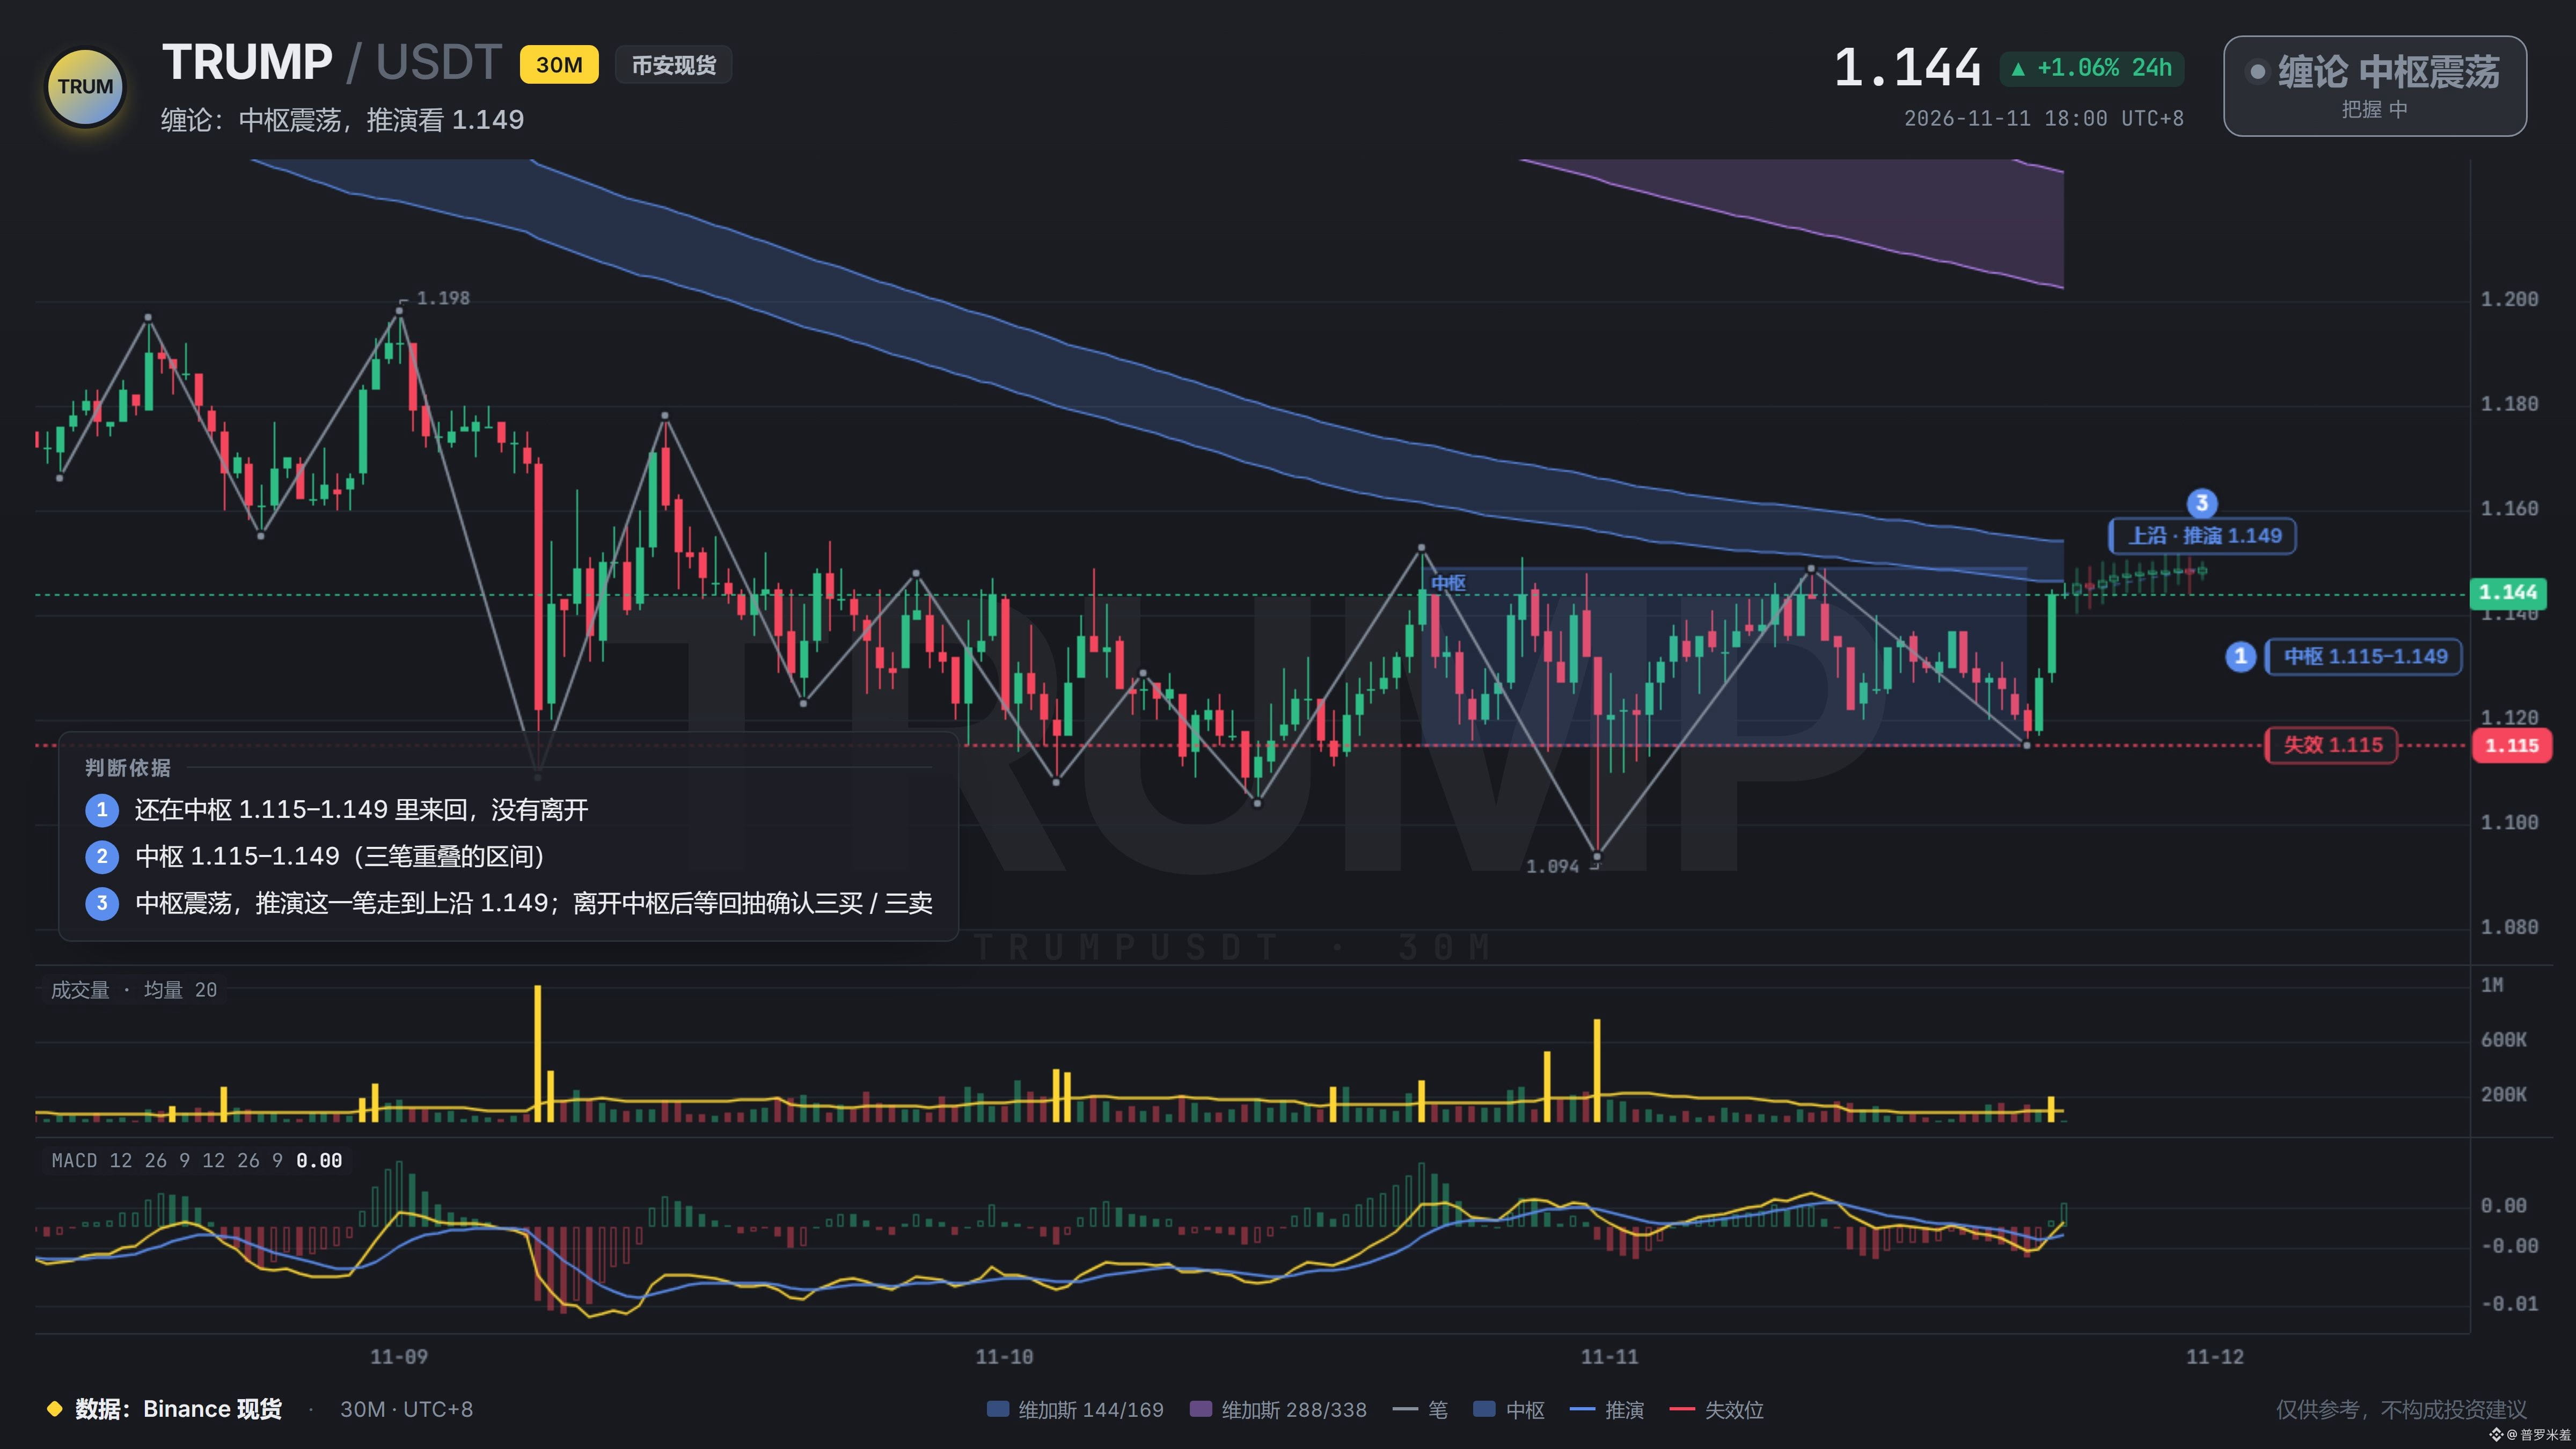
The downward trend line that $TRUMP had been pressed on 5 times was just pierced with heavy volume, and the breakout volume was more than double the average volume. This kind of move doesn’t look like something retail traders would have triggered.
But I’m not getting carried away. Above 1.15, it was suppressed 11 times, and the upper edge of the range is right there. I’ll first see whether it can even reach it, and after that whether there’s a pullback. If there’s no pullback, I won’t chase it; jumping in then would just mean standing guard.
The downward trend line that $TRUMP had been pressed on 5 times was just pierced with heavy volume, and the breakout volume was more than double the average volume. This kind of move doesn’t look like something retail traders would have triggered.
But I’m not getting carried away. Above 1.15, it was suppressed 11 times, and the upper edge of the range is right there. I’ll first see whether it can even reach it, and after that whether there’s a pullback. If there’s no pullback, I won’t chase it; jumping in then would just mean standing guard.
But I’m not getting carried away. Above 1.15, it was suppressed 11 times, and the upper edge of the range is right there. I’ll first see whether it can even reach it, and after that whether there’s a pullback. If there’s no pullback, I won’t chase it; jumping in then would just mean standing guard.
43
·
--
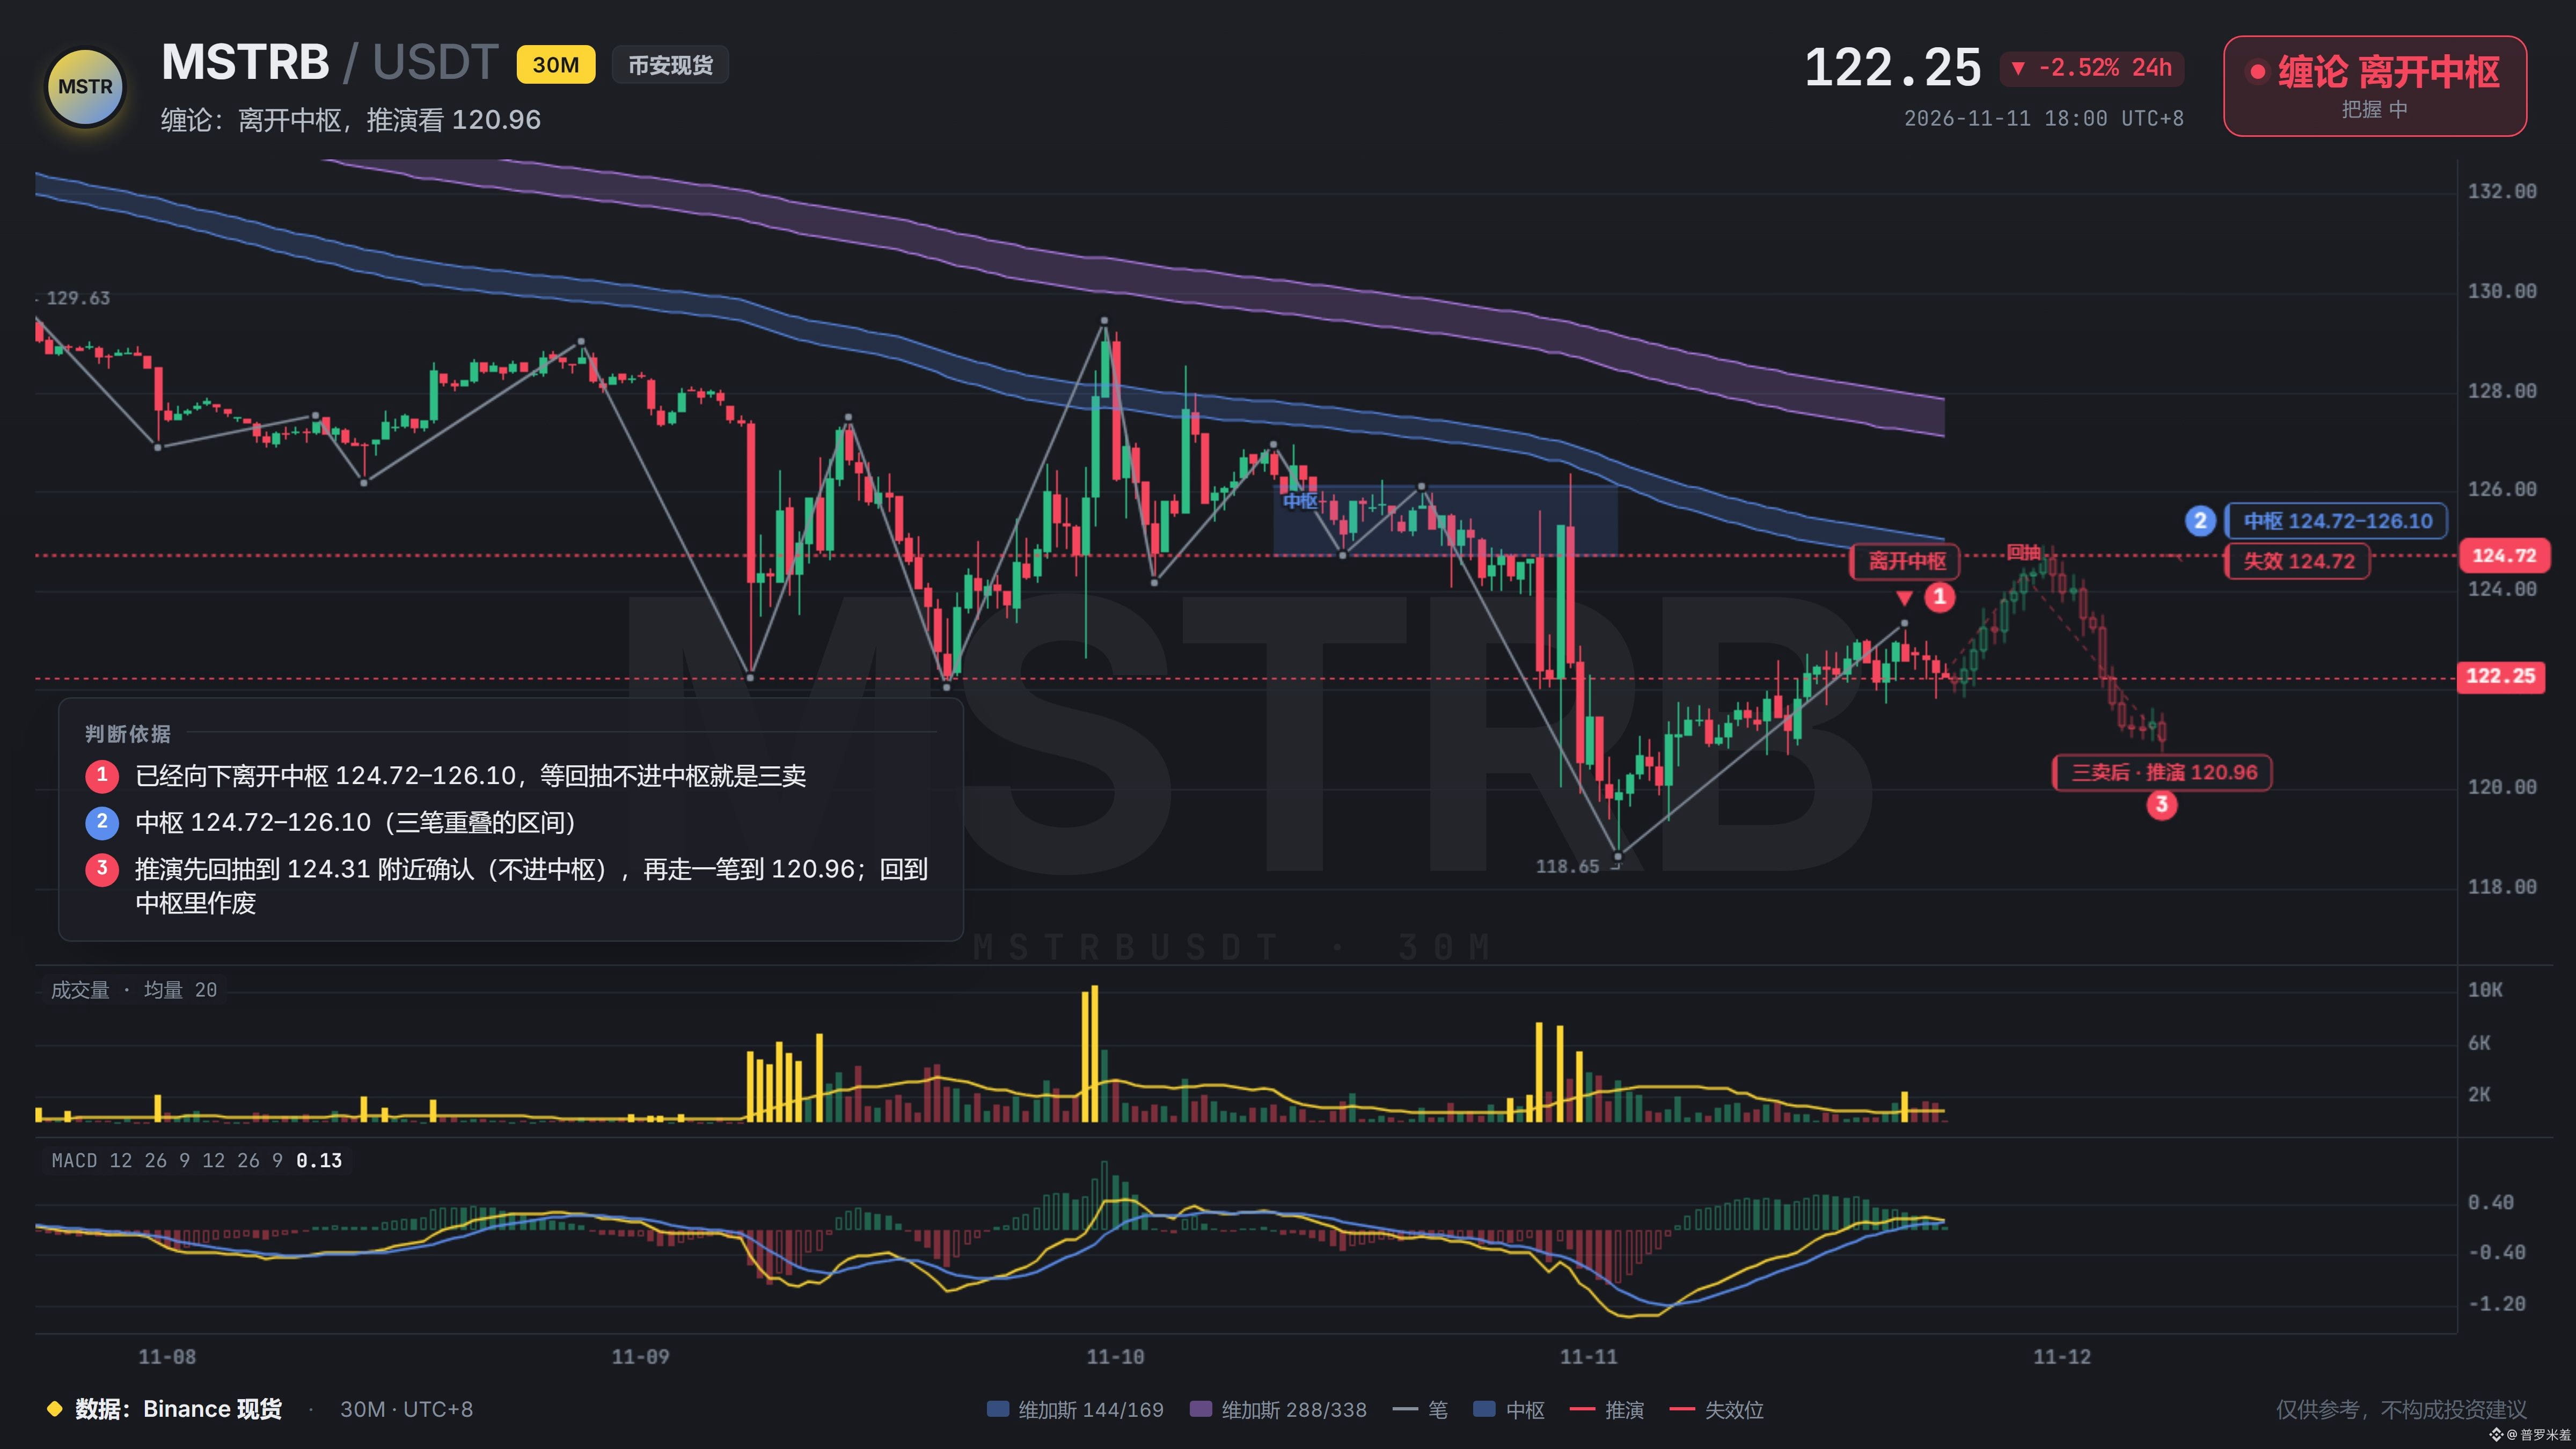
This line at 122.96 held four times. On the fifth, it crashed through on heavy volume—1.6 times the usual volume. The first four times weren’t signs of strong support; they were drawing people in. Once enough had gathered, they sprang the trap. Now, if the rebound can’t get back above 124.7, that’s a textbook third sell point. The low 120s are waiting below. $MSTRB I’ve been watching this line for days. It finally broke.
This line at 122.96 held four times. On the fifth, it crashed through on heavy volume—1.6 times the usual volume. The first four times weren’t signs of strong support; they were drawing people in. Once enough had gathered, they sprang the trap. Now, if the rebound can’t get back above 124.7, that’s a textbook third sell point. The low 120s are waiting below. $MSTRB I’ve been watching this line for days. It finally broke.
41
·
--
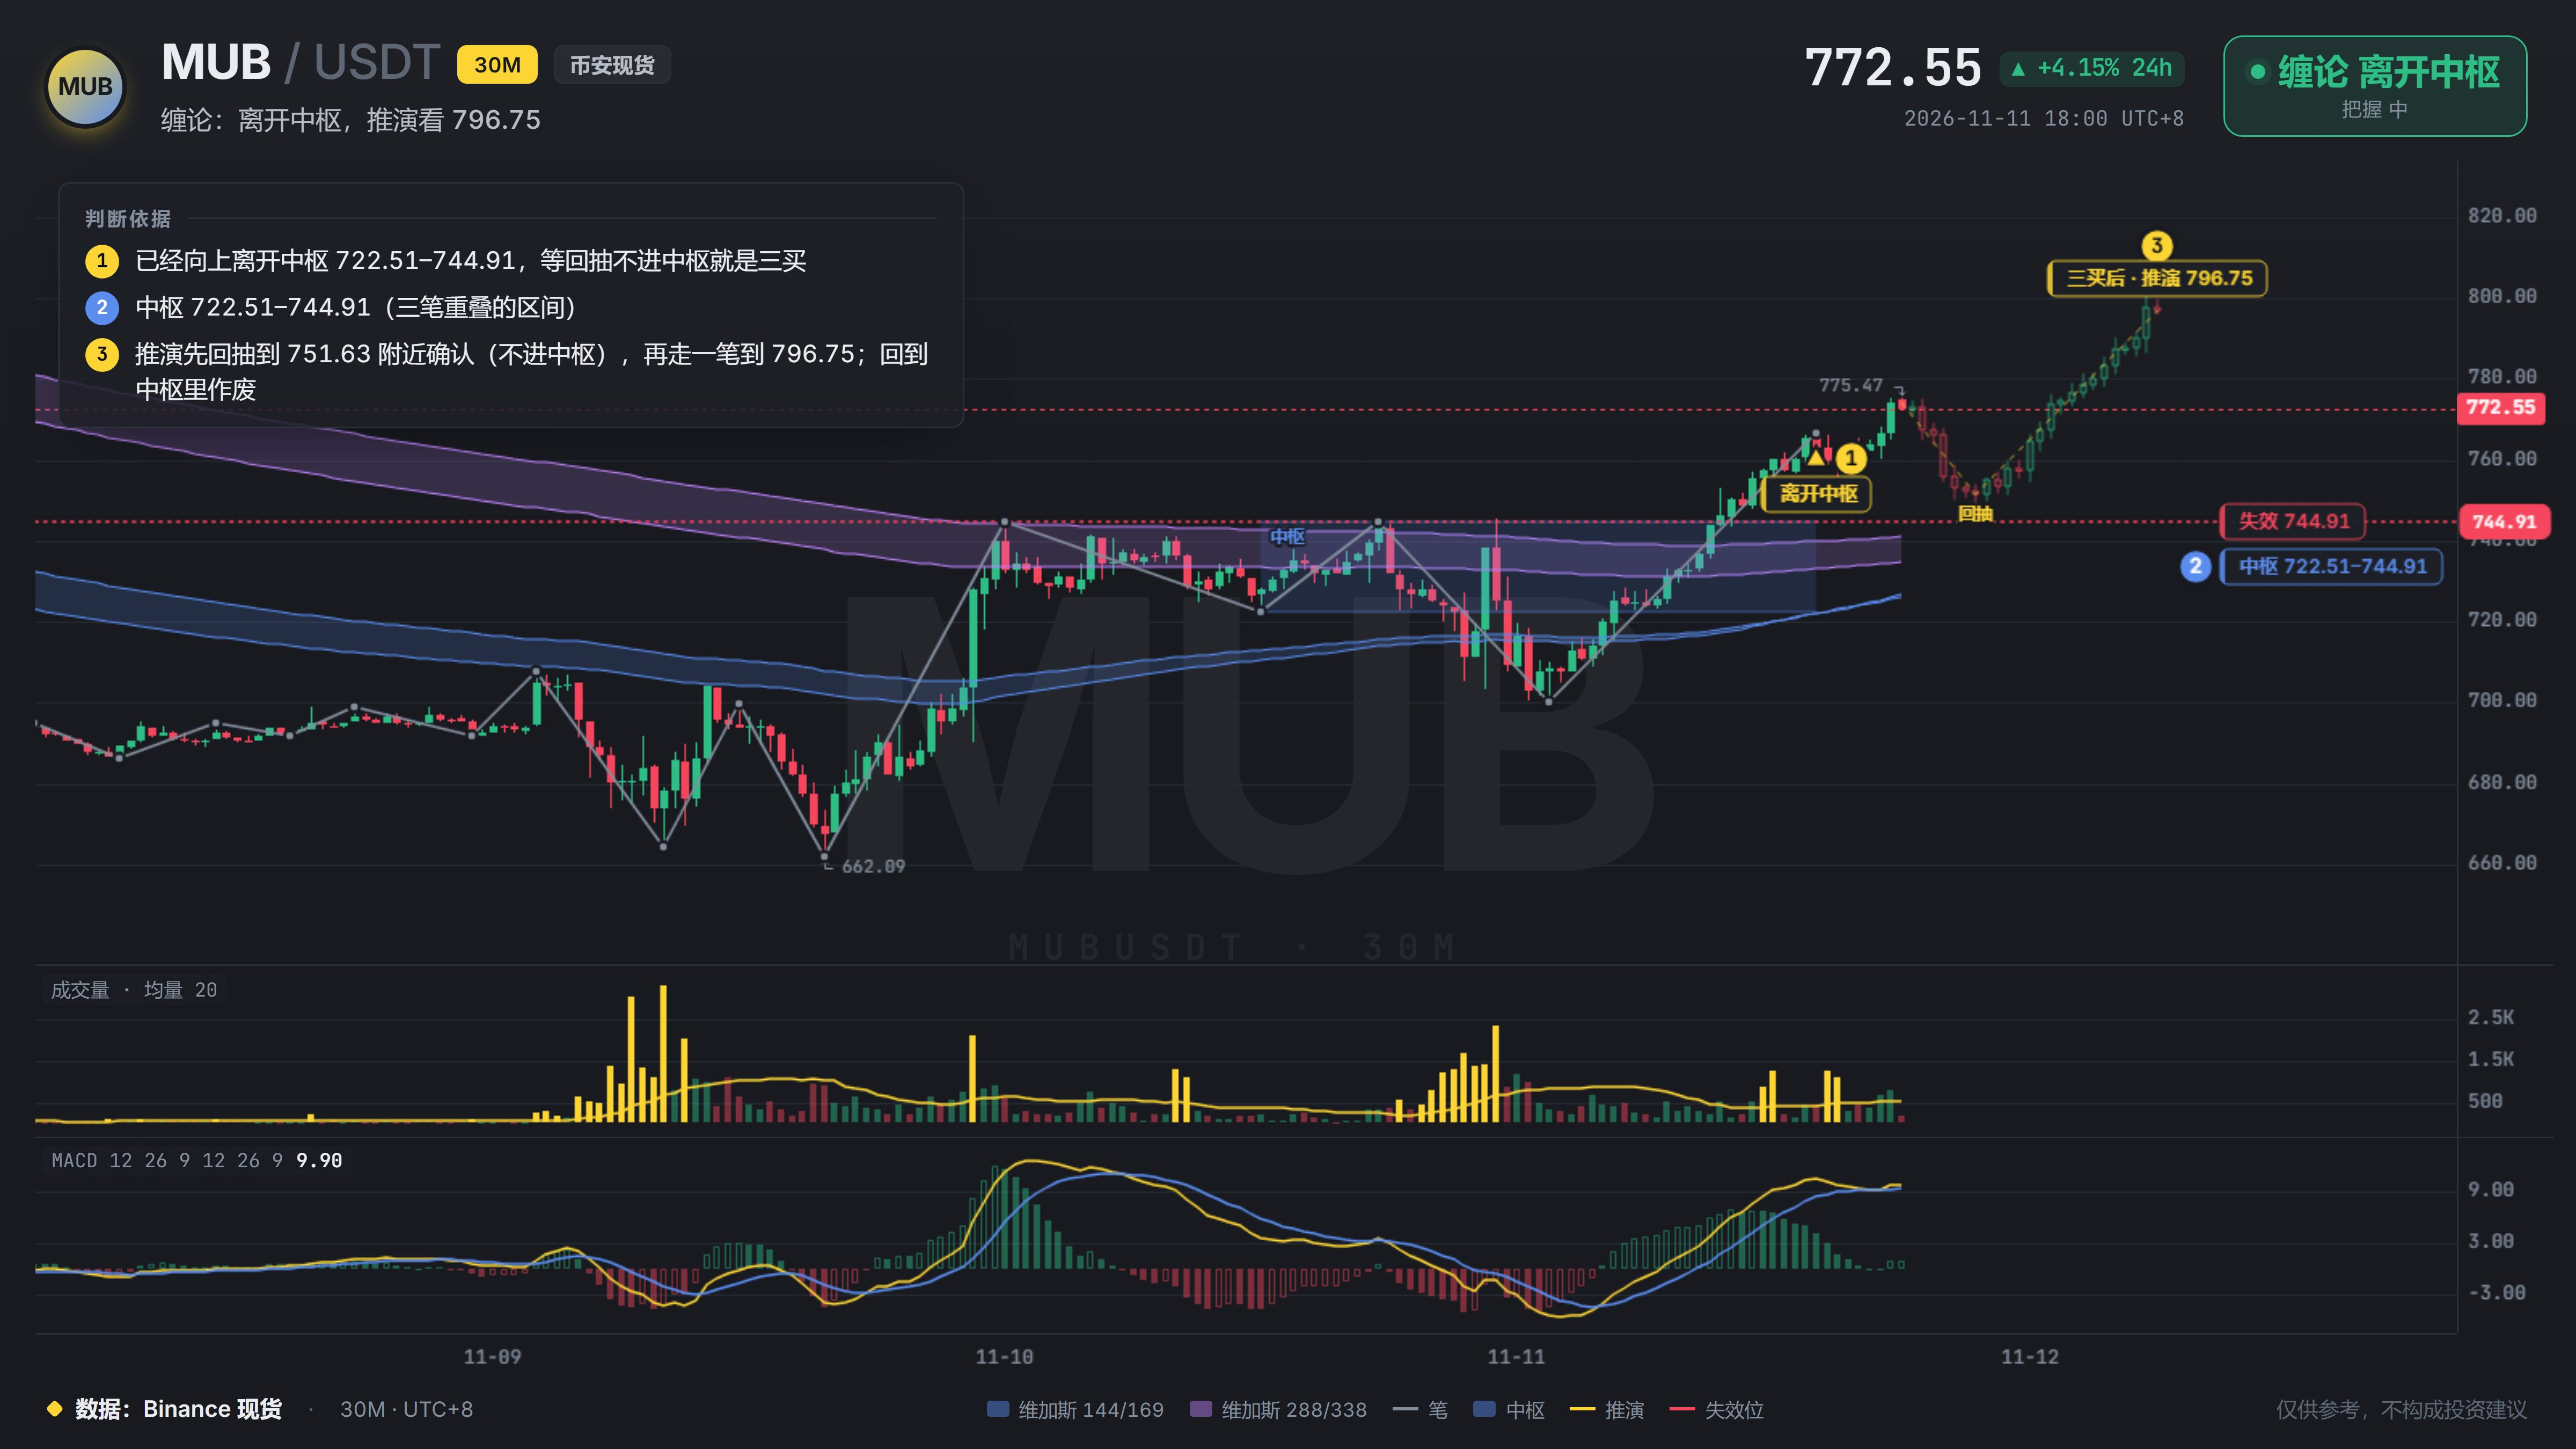
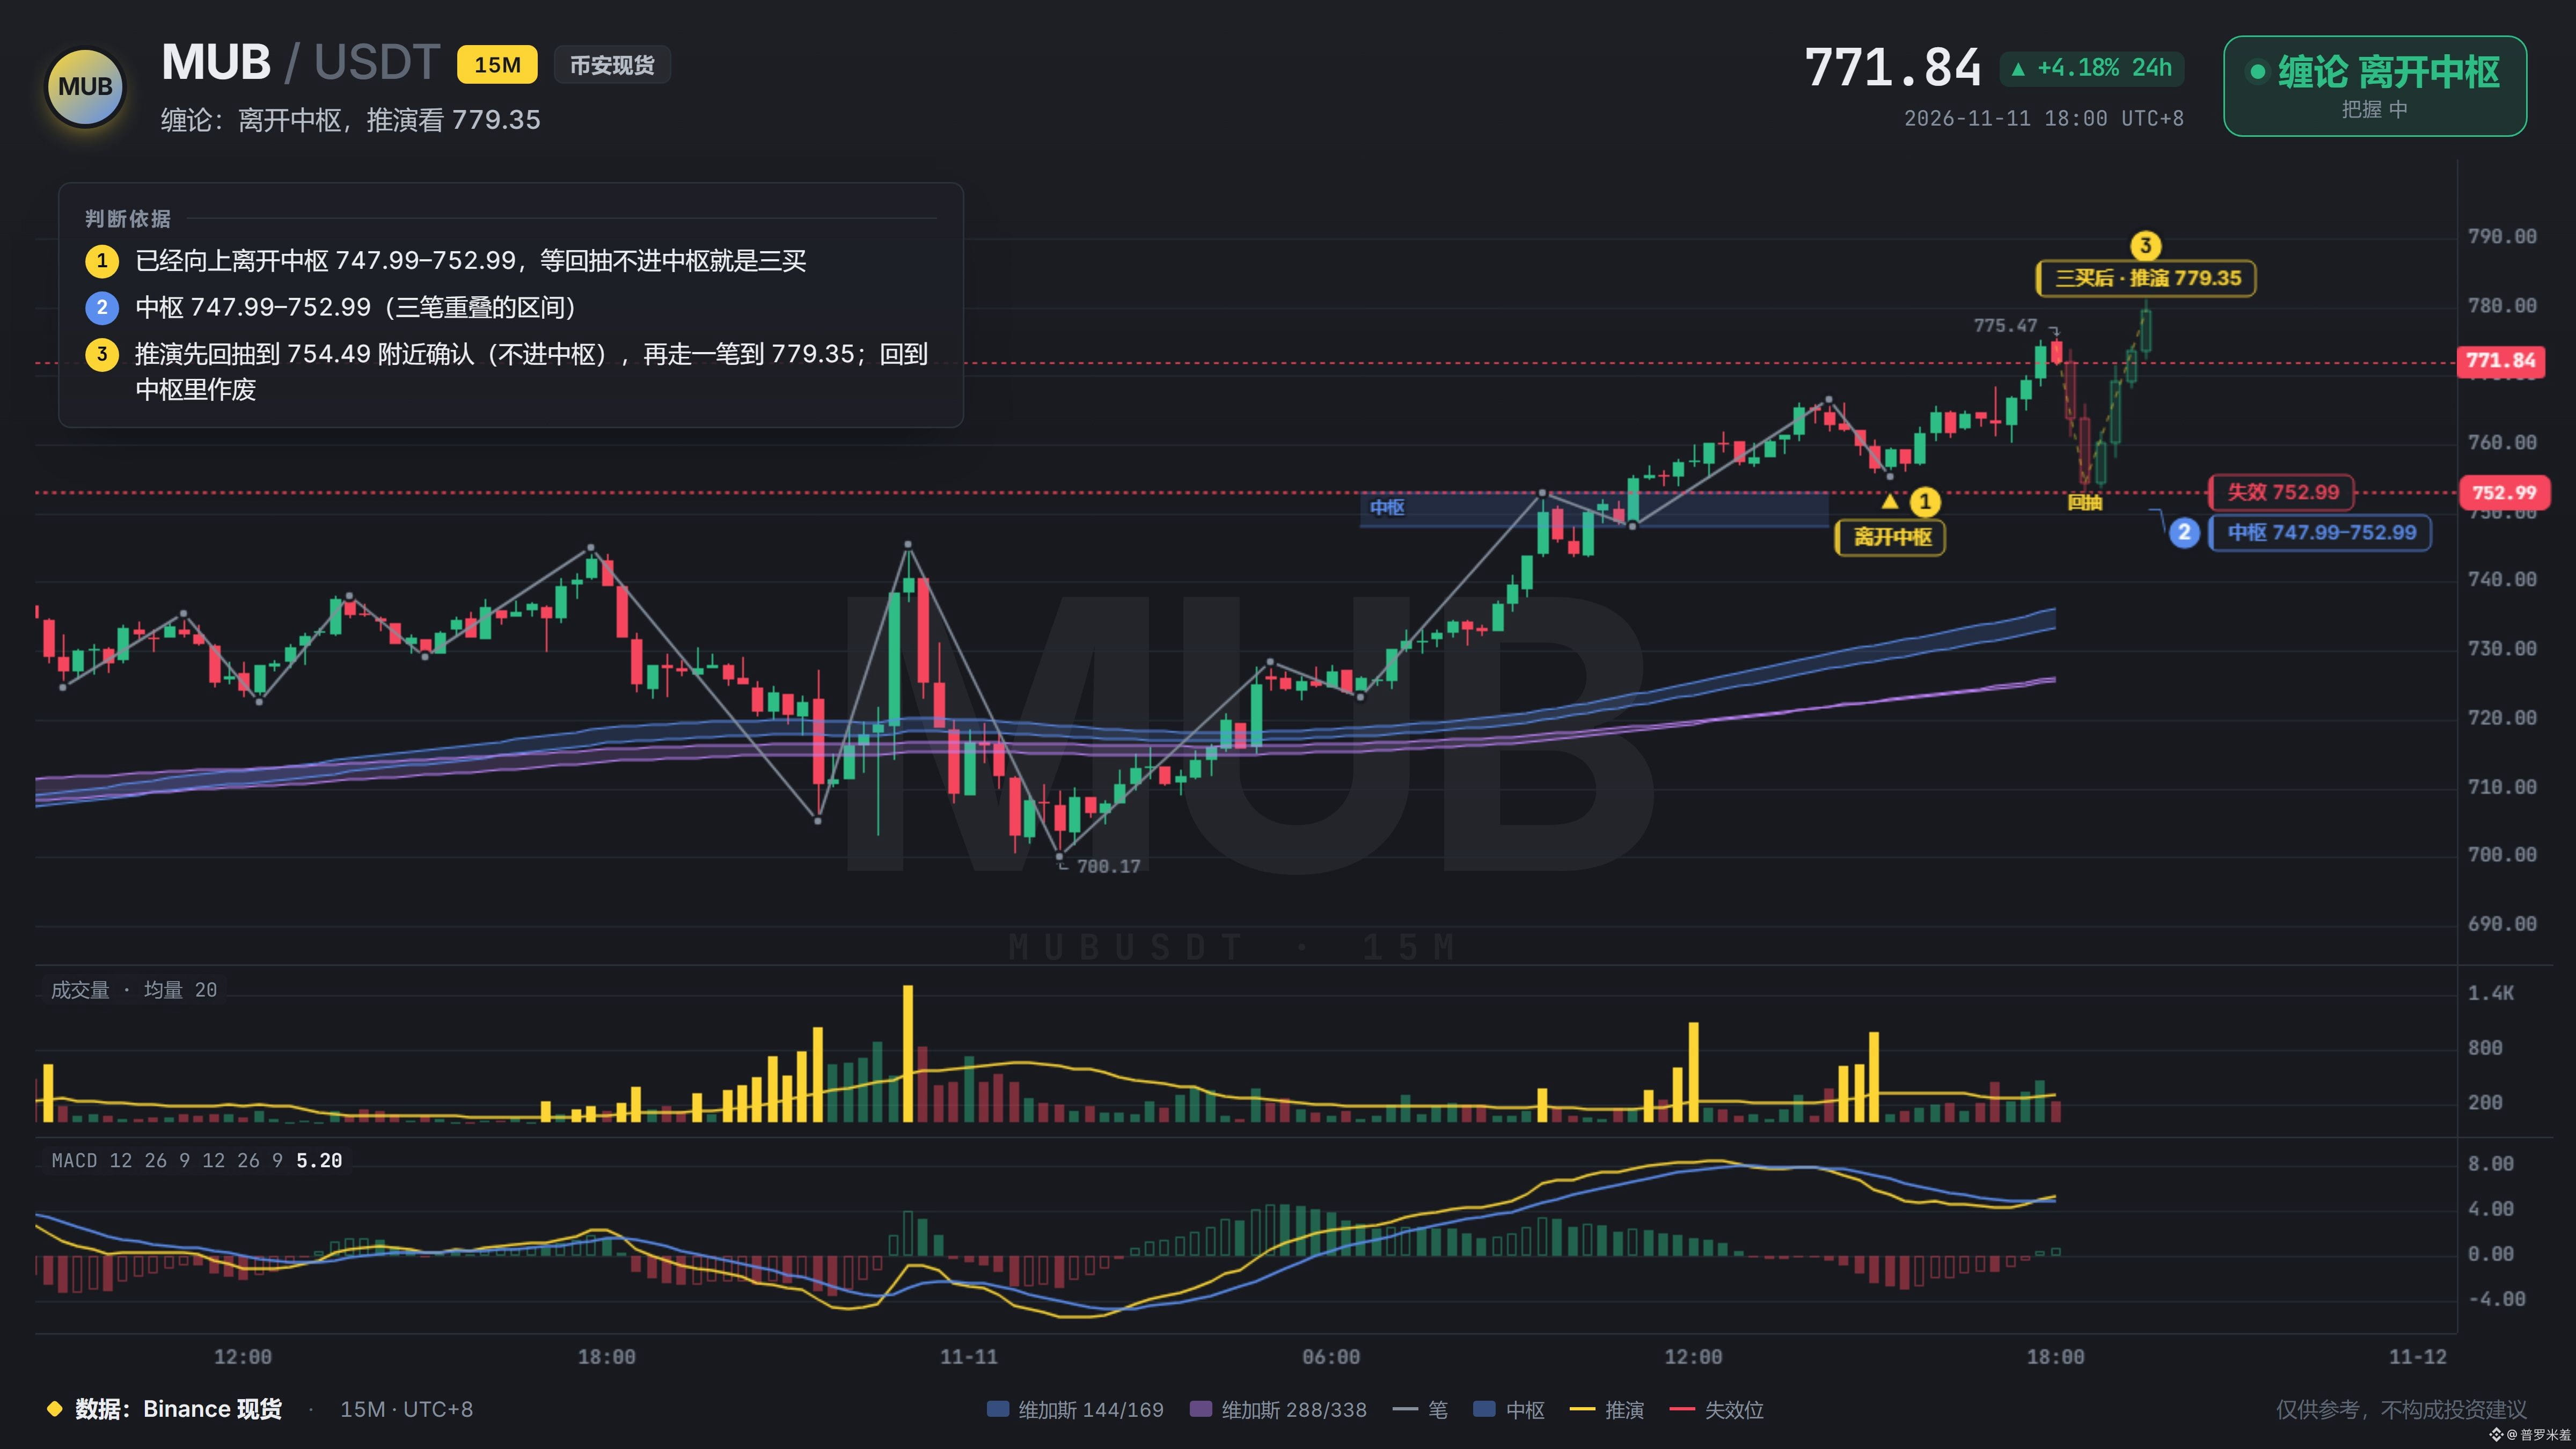
This resistance line held five times. I’d been watching it for almost two weeks, and I figured it wouldn’t break the first four times—and thought the same the fifth time. Then one candle on 1.5x volume closed straight above 768, while I was still sitting below with an order waiting for a pullback. The pullback came, too, but I just couldn’t bring myself to act on that 763 candle. Now it’s at 772, and either chasing or sitting out feels awful. Next I’ll just wait for a retrace to 751. If it doesn’t enter the range, I’m in; if it drops back down, pretend I didn’t say anything today. $MUB
This resistance line held five times. I’d been watching it for almost two weeks, and I figured it wouldn’t break the first four times—and thought the same the fifth time. Then one candle on 1.5x volume closed straight above 768, while I was still sitting below with an order waiting for a pullback. The pullback came, too, but I just couldn’t bring myself to act on that 763 candle. Now it’s at 772, and either chasing or sitting out feels awful. Next I’ll just wait for a retrace to 751. If it doesn’t enter the range, I’m in; if it drops back down, pretend I didn’t say anything today. $MUB
47
·
--
I waited a week for this bullish candlestick ($MUB ), and it firmly hit 765.48. How are those who missed out doing?
I waited a week for this bullish candlestick ($MUB ), and it firmly hit 765.48. How are those who missed out doing?
56
·
--
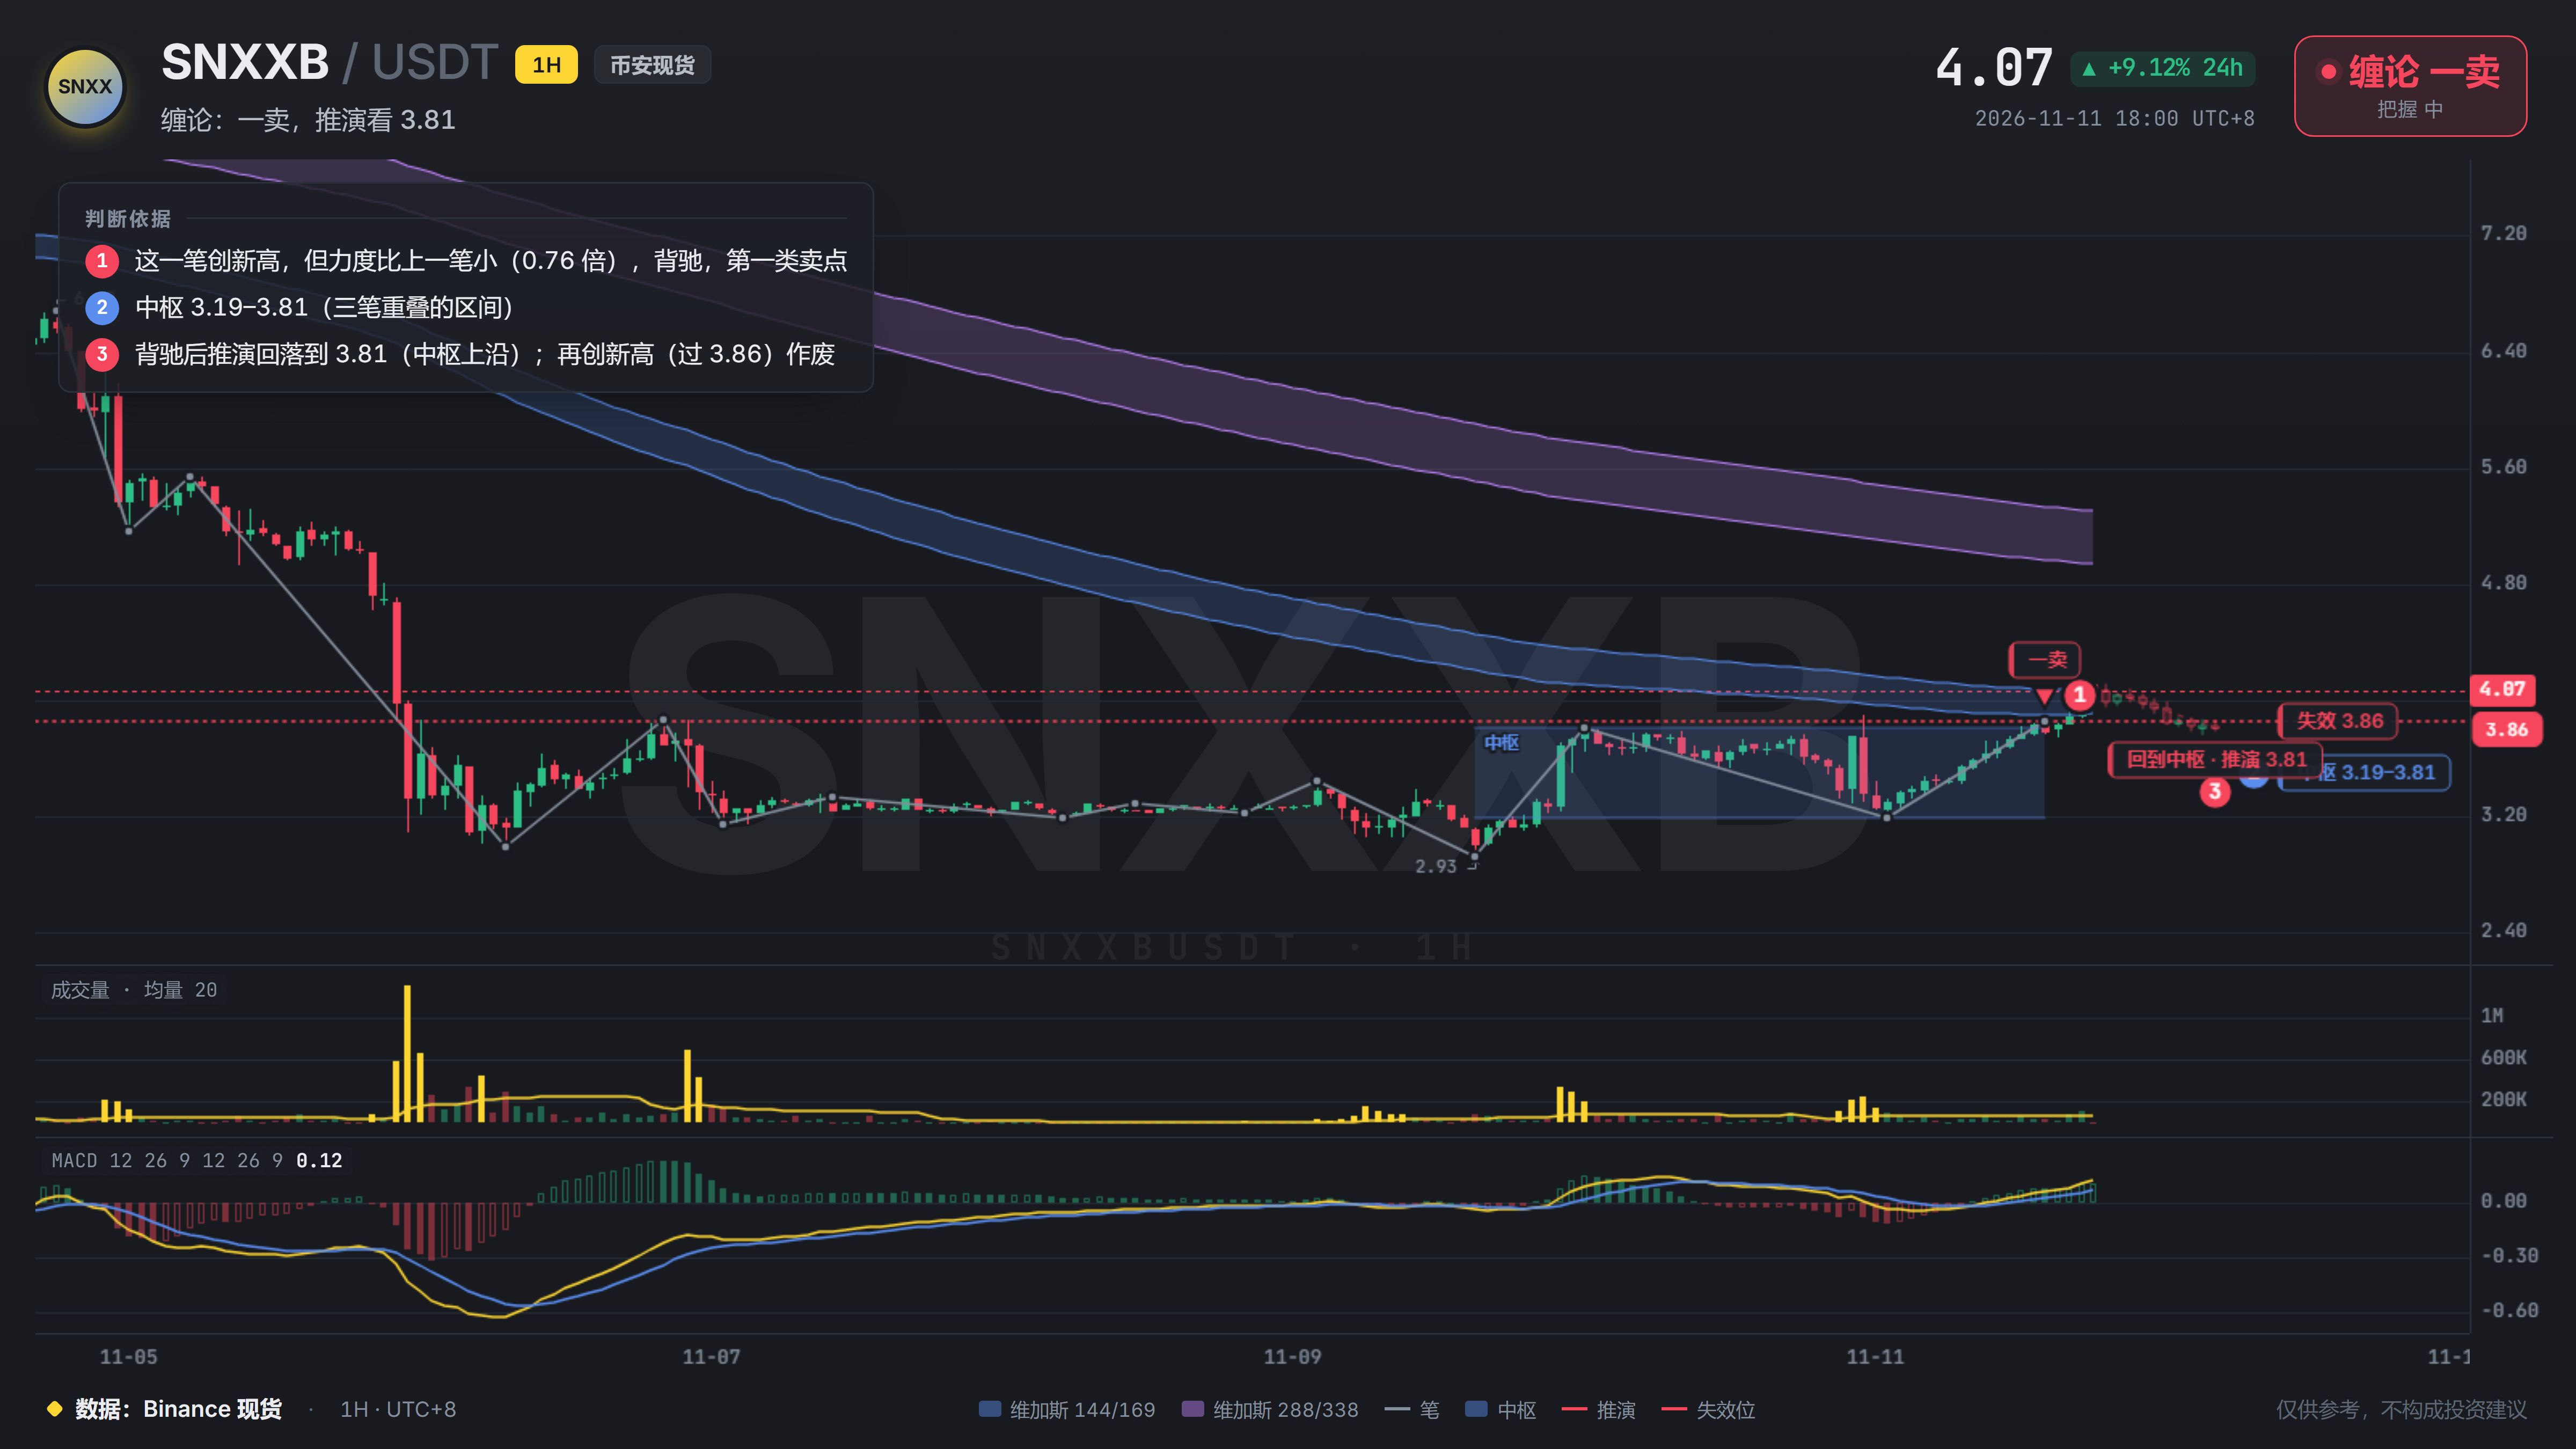
The line that had capped it four times was finally cleared today by a bullish candle on 1.6x volume, closing above 4.10. The fast tunnel has also moved back above it. I didn’t chase. At times like this, it’s even more important to keep things in perspective: price made a new high, but the volume peak was down by half. The gap between 4.12 and 4.66 is still open, waiting to be filled. A real breakout can withstand a pullback. Let’s see if it can hold above that old support at 3.90 before talking about higher levels. $SNXXB
The line that had capped it four times was finally cleared today by a bullish candle on 1.6x volume, closing above 4.10. The fast tunnel has also moved back above it. I didn’t chase. At times like this, it’s even more important to keep things in perspective: price made a new high, but the volume peak was down by half. The gap between 4.12 and 4.66 is still open, waiting to be filled. A real breakout can withstand a pullback. Let’s see if it can hold above that old support at 3.90 before talking about higher levels. $SNXXB
69
·
--
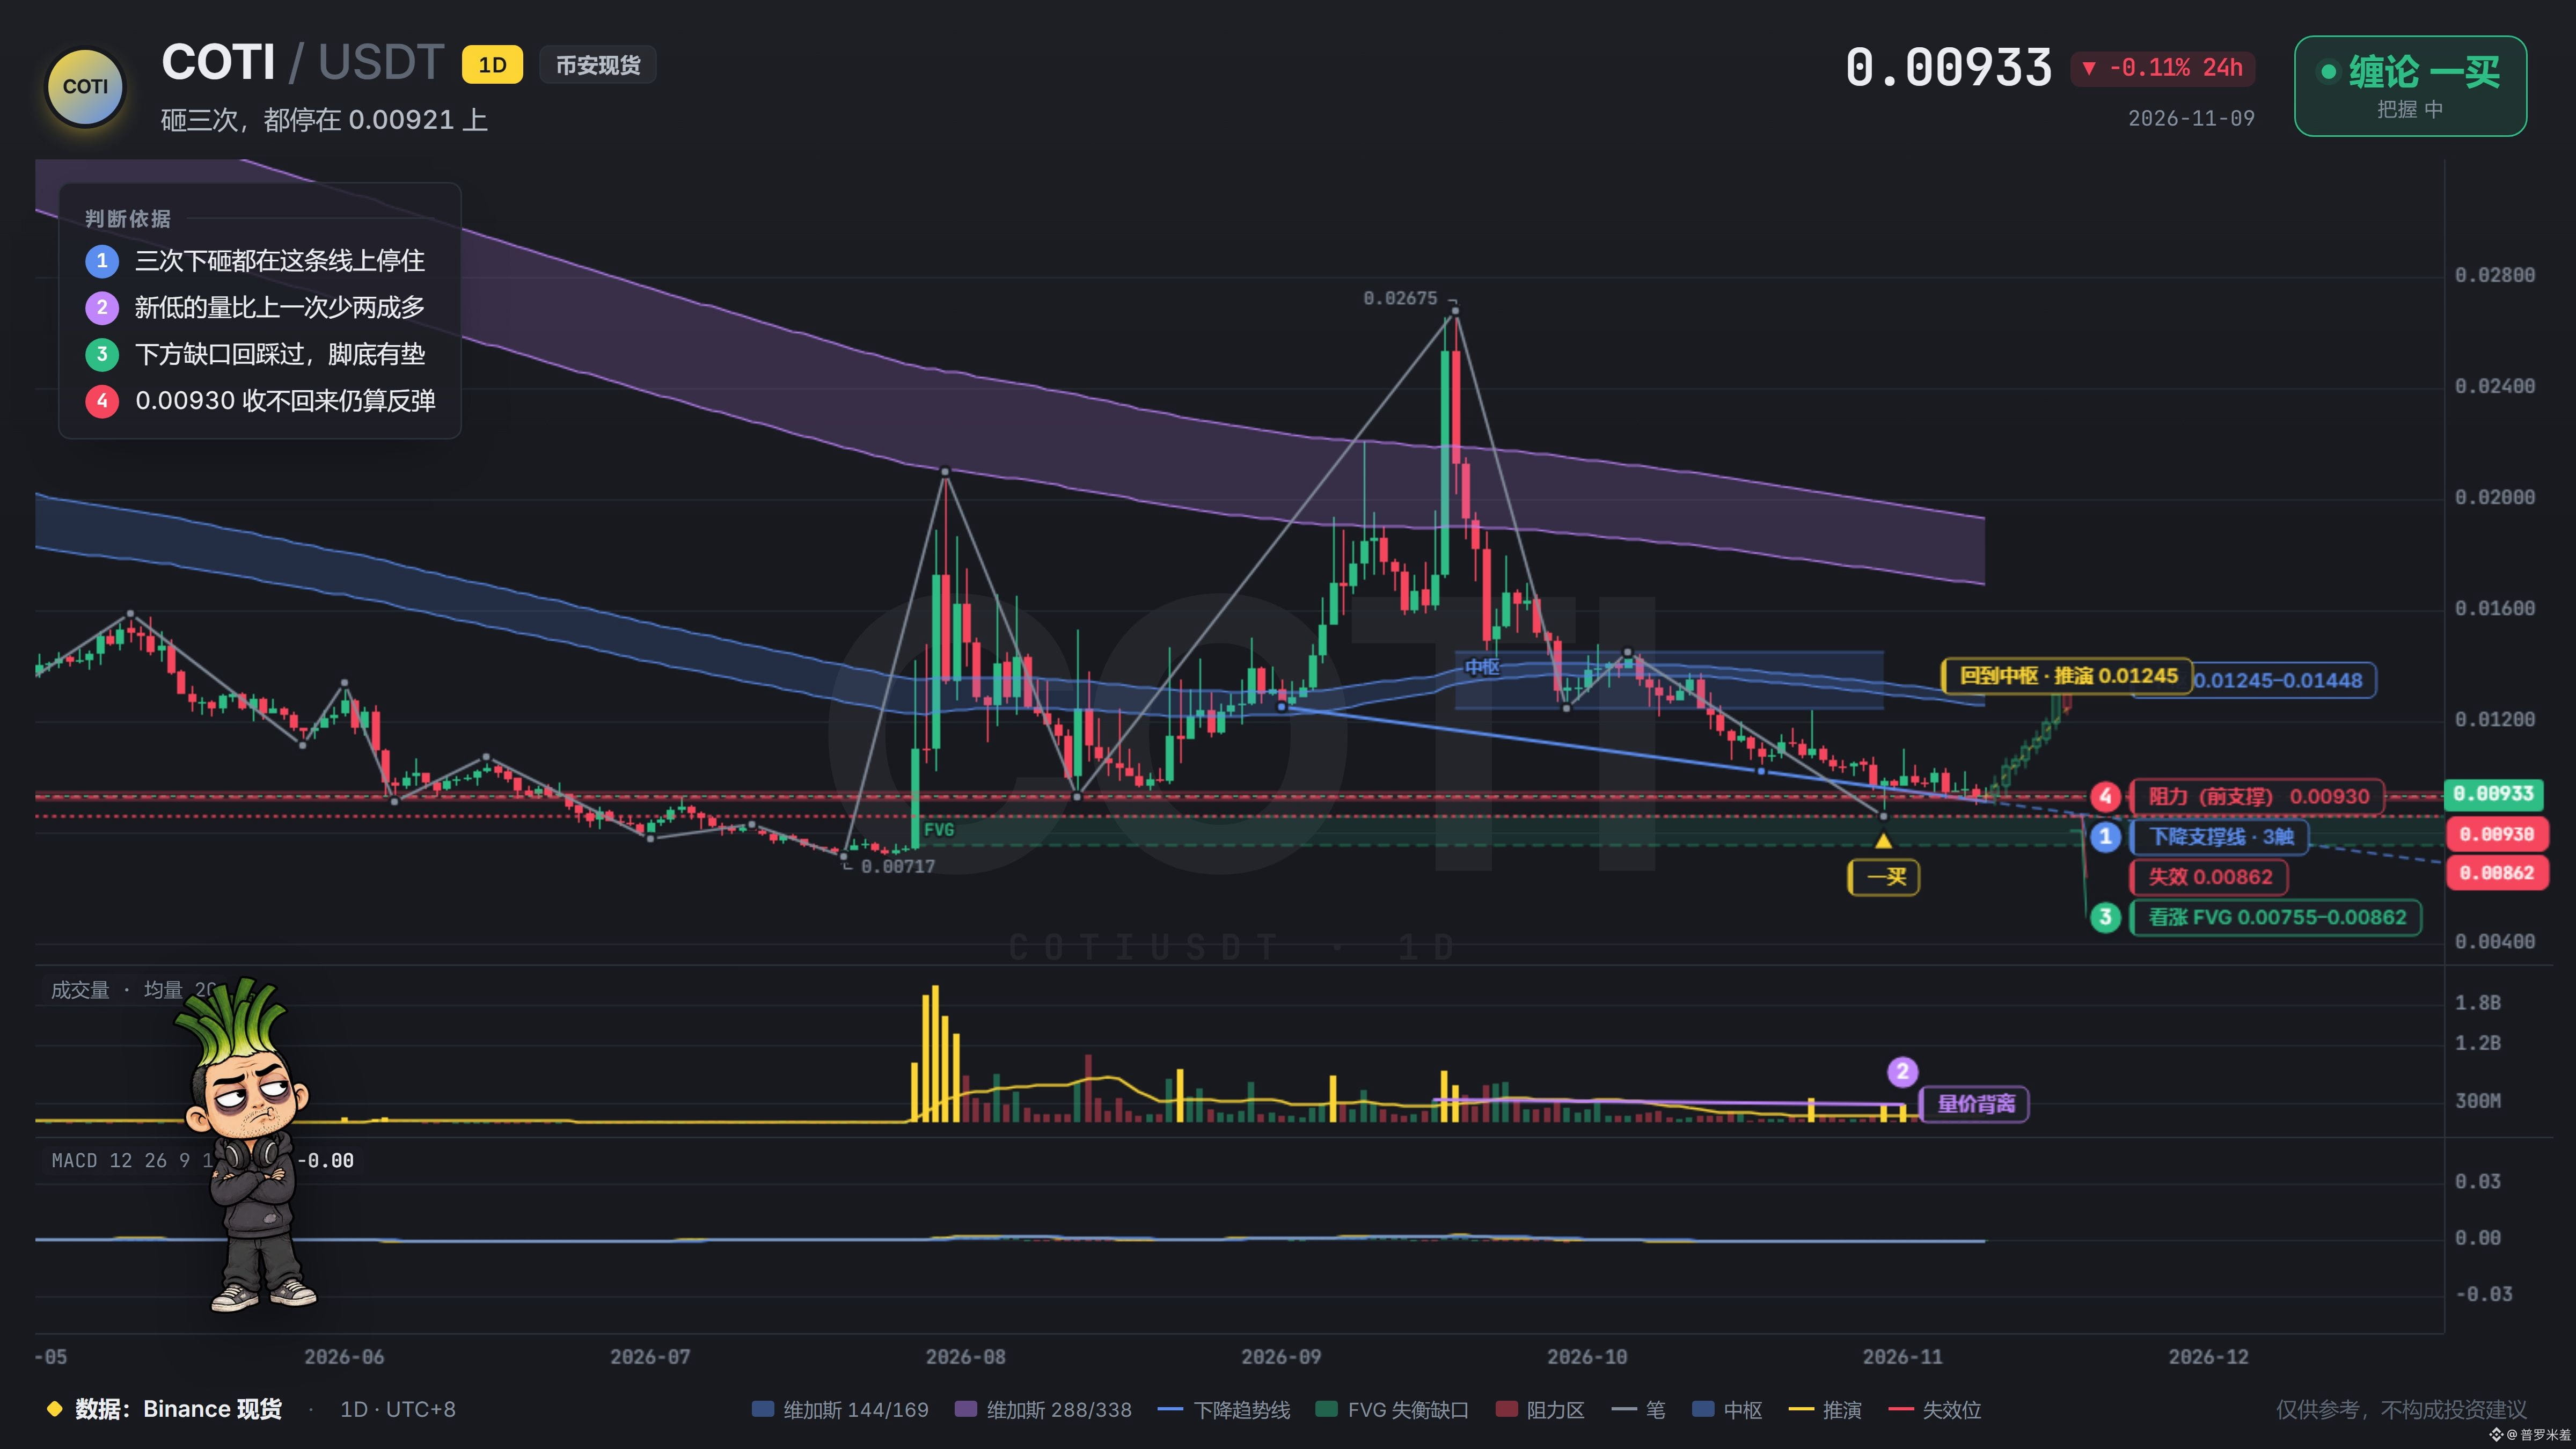
$COTI is down 85 points from its high. That number has been sitting in your account for nearly half a year, and you haven’t dared to look at it closely in a long time.
Lately, a few things on the chart have changed.
It’s been slammed down three times, and each time it stopped above 0.00921—it hasn’t truly broken through once. The volume on the latest new low was more than 20% lower than the previous one. The selling pressure is easing. The gap left below from earlier has been revisited, and there’s support underneath.
It’s still weak. It can’t reclaim 0.00930, and any rise can only be called a rebound.
I can’t guarantee anything, but I’m not selling either. If you’re still holding, don’t rush to blame yourself.
$COTI is down 85 points from its high. That number has been sitting in your account for nearly half a year, and you haven’t dared to look at it closely in a long time.
Lately, a few things on the chart have changed.
It’s been slammed down three times, and each time it stopped above 0.00921—it hasn’t truly broken through once. The volume on the latest new low was more than 20% lower than the previous one. The selling pressure is easing. The gap left below from earlier has been revisited, and there’s support underneath.
It’s still weak. It can’t reclaim 0.00930, and any rise can only be called a rebound.
I can’t guarantee anything, but I’m not selling either. If you’re still holding, don’t rush to blame yourself.
Lately, a few things on the chart have changed.
It’s been slammed down three times, and each time it stopped above 0.00921—it hasn’t truly broken through once. The volume on the latest new low was more than 20% lower than the previous one. The selling pressure is easing. The gap left below from earlier has been revisited, and there’s support underneath.
It’s still weak. It can’t reclaim 0.00930, and any rise can only be called a rebound.
I can’t guarantee anything, but I’m not selling either. If you’re still holding, don’t rush to blame yourself.
72
Log in to explore more content
Join global crypto users on Binance Square
⚡️ Get latest and useful information about crypto.
💬 Trusted by the world’s largest crypto exchange.
👍 Discover real insights from verified creators.
Email / Phone number
Trending Topics
WhoWillSucceedJensenHuangatNvidia?
33,515 views
472 Discussing
Nvidia Says No CEO Talks Underway as "Stand With Jensen" Petition Tops 77,900 Signatures
Binance News
·13 Likes
·15.5k views
WhatWillDriveCryptoandStocks’NextRebound?
341,934 views
2,438 Discussing
USPPIMissMayEaseBTCPressure
155,263 views
1,709 Discussing