
nexotradingcripto
81 Posts

nexotradingcripto
Report
Block User
Análisis técnico y lectura de mercado . Escenarios • Confirmación • Invalidación. Contenido educativo .No adivinamos el mercado. Lo analizamos.
High-Frequency Trader
2.1 Years
20 Following
25 Followers
72 Liked
Posts
All
Quotes
Videos
🚨 $ENAUSDT | NEXO TRADING — THIRD AUDIT FOLLOW-UP
📊 SCENARIO A UPDATE AND SCENARIO B FOLLOW-UP
In our previous post, we presented Scenario A, a hypothetical and early LONG entry.
The analysis was based on a prior structural breakout on the 4H chart. The price then developed a bullish structure on the 15-minute chart, confirmed the move, and made a retest, which we used as the basis for proposing the entry.
🎯 SCENARIO A — EARLY ENTRY
🟢 Entry: 0.19007 USDT
🔴 Stop loss: 0.18690 USDT
💰 First 1:2 target: 0.19641 USDT
🚀 Extended target: 0.22600 USDT
The trade was proposed before all the confirmations required by our primary model were complete.
The price later broke above the significant high of 0.19722 USDT and developed a new bullish move.
We are now auditing how the trade management would have played out: closing 50% at 1:2, moving the stop to break-even, or keeping the original technical stop.
🔎 SCENARIO B — STILL UNDER ANALYSIS
The first condition has already appeared: a bullish structural breakout on the 1H chart.
But we still do NOT have a second entry.
We are waiting for:
✅ Structural breakout observed on the 1H chart.
⏳ Effective retest of the 1H order block.
⏳ Reaction and structural confirmation on the 15-minute chart.
⏳ Assessment of a possible new expansion on the 4H chart.
We do not confuse a breakout with an entry.
If the price pulls back, confirms, and offers a valid structure, we will consider the trade. If it continues without retesting, we will not chase it.
📚 NEXO Trading does not seek to justify trades after the move. It aims to document hypotheses, confirmations, mistakes, and results to build an auditable system.
Patience is also part of the strategy.
#ENAUSDT #NEXOTrading #SmartMoney #TradingAudit #BinanceSquare
🚨 $ENAUSDT | NEXO TRADING — THIRD AUDIT FOLLOW-UP
📊 SCENARIO A UPDATE AND SCENARIO B FOLLOW-UP
In our previous post, we presented Scenario A, a hypothetical and early LONG entry.
The analysis was based on a prior structural breakout on the 4H chart. The price then developed a bullish structure on the 15-minute chart, confirmed the move, and made a retest, which we used as the basis for proposing the entry.
🎯 SCENARIO A — EARLY ENTRY
🟢 Entry: 0.19007 USDT
🔴 Stop loss: 0.18690 USDT
💰 First 1:2 target: 0.19641 USDT
🚀 Extended target: 0.22600 USDT
The trade was proposed before all the confirmations required by our primary model were complete.
The price later broke above the significant high of 0.19722 USDT and developed a new bullish move.
We are now auditing how the trade management would have played out: closing 50% at 1:2, moving the stop to break-even, or keeping the original technical stop.
🔎 SCENARIO B — STILL UNDER ANALYSIS
The first condition has already appeared: a bullish structural breakout on the 1H chart.
But we still do NOT have a second entry.
We are waiting for:
✅ Structural breakout observed on the 1H chart.
⏳ Effective retest of the 1H order block.
⏳ Reaction and structural confirmation on the 15-minute chart.
⏳ Assessment of a possible new expansion on the 4H chart.
We do not confuse a breakout with an entry.
If the price pulls back, confirms, and offers a valid structure, we will consider the trade. If it continues without retesting, we will not chase it.
📚 NEXO Trading does not seek to justify trades after the move. It aims to document hypotheses, confirmations, mistakes, and results to build an auditable system.
Patience is also part of the strategy.
#ENAUSDT #NEXOTrading #SmartMoney #TradingAudit #BinanceSquare
📊 SCENARIO A UPDATE AND SCENARIO B FOLLOW-UP
In our previous post, we presented Scenario A, a hypothetical and early LONG entry.
The analysis was based on a prior structural breakout on the 4H chart. The price then developed a bullish structure on the 15-minute chart, confirmed the move, and made a retest, which we used as the basis for proposing the entry.
🎯 SCENARIO A — EARLY ENTRY
🟢 Entry: 0.19007 USDT
🔴 Stop loss: 0.18690 USDT
💰 First 1:2 target: 0.19641 USDT
🚀 Extended target: 0.22600 USDT
The trade was proposed before all the confirmations required by our primary model were complete.
The price later broke above the significant high of 0.19722 USDT and developed a new bullish move.
We are now auditing how the trade management would have played out: closing 50% at 1:2, moving the stop to break-even, or keeping the original technical stop.
🔎 SCENARIO B — STILL UNDER ANALYSIS
The first condition has already appeared: a bullish structural breakout on the 1H chart.
But we still do NOT have a second entry.
We are waiting for:
✅ Structural breakout observed on the 1H chart.
⏳ Effective retest of the 1H order block.
⏳ Reaction and structural confirmation on the 15-minute chart.
⏳ Assessment of a possible new expansion on the 4H chart.
We do not confuse a breakout with an entry.
If the price pulls back, confirms, and offers a valid structure, we will consider the trade. If it continues without retesting, we will not chase it.
📚 NEXO Trading does not seek to justify trades after the move. It aims to document hypotheses, confirmations, mistakes, and results to build an auditable system.
Patience is also part of the strategy.
#ENAUSDT #NEXOTrading #SmartMoney #TradingAudit #BinanceSquare
1
118
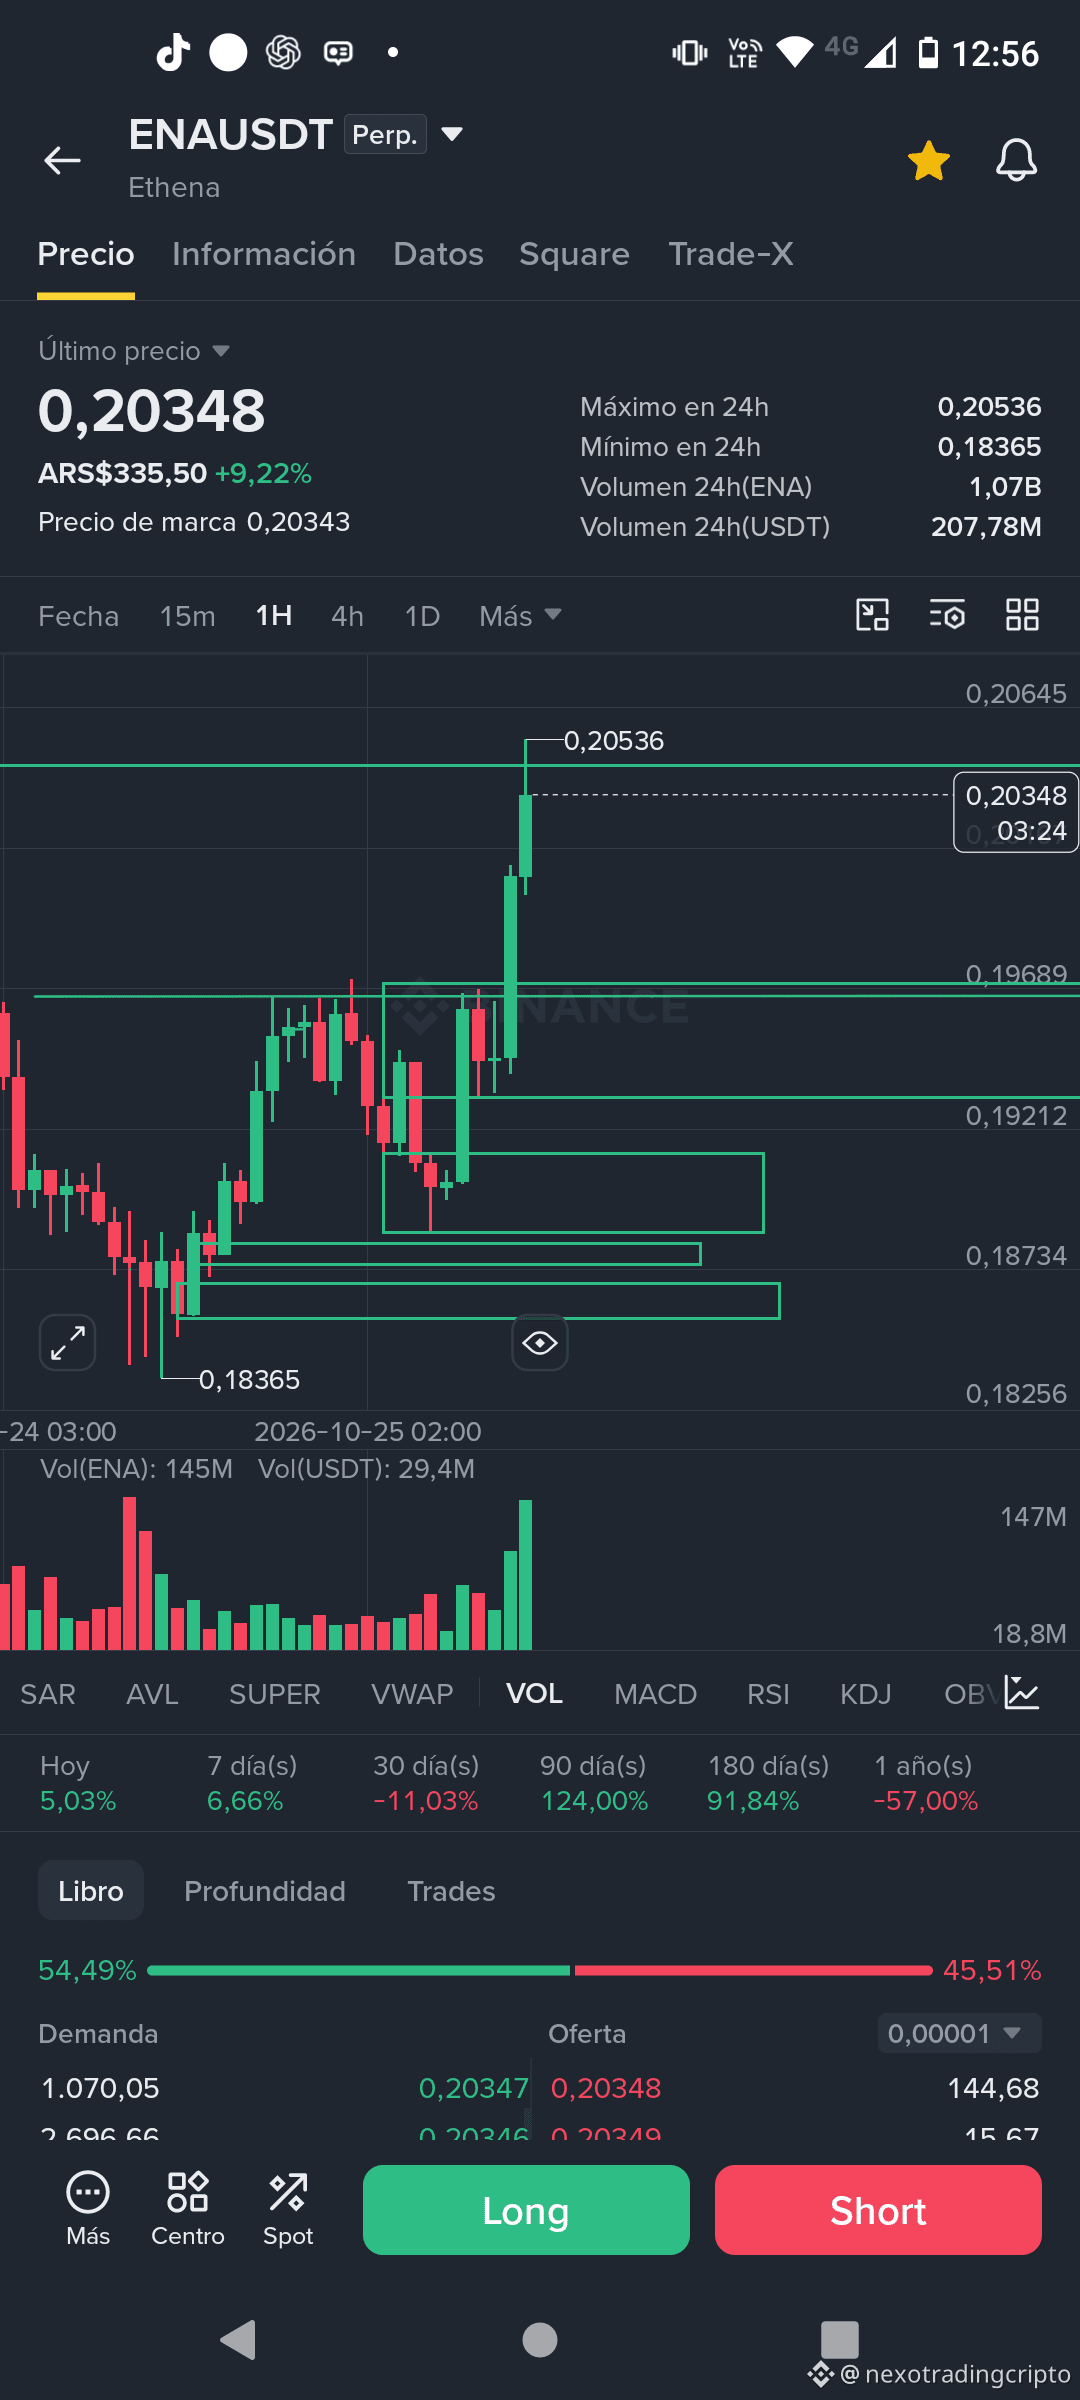
🚨 ENAUSDT | FIRST TARGET REACHED — NEXO TRADING
📊 THIRD AUDIT — STRUCTURAL LONG FOLLOW-UP
✅ 1:2 TARGET REACHED!
Our bullish thesis, published in advance, reached its first management target.
🟢 Original entry: 0.19007 USDT
🔴 Original stop loss: 0.18690 USDT
🎯 First 1:2 target: 0.19641 USDT
📈 Subsequent high observed: 0.19664 USDT
HYPOTHETICAL MANAGEMENT ACCORDING TO THE PUBLISHED PLAN:
✅ Close 50% of the position upon reaching 1:2, assuming execution at the expected price.
🔒 The remaining 50% stays under review, initially keeping the original technical stop.
🚀 Final extended target: 0.22600 USDT.
⚠️ Important: this is an educational audit of a simulated trade. The first price target was reached, but that does not guarantee further upside or prove the strategy is profitable.
We will continue documenting both wins and mistakes, without changing the original conditions after learning the outcome.
NEXO TRADING | We don't promise market moves. We study structures and manage risk.
#ENAUSDT #NexoTrading #SmartMoney #BinanceSquare #Trading
🚨 ENAUSDT | FIRST TARGET REACHED — NEXO TRADING
📊 THIRD AUDIT — STRUCTURAL LONG FOLLOW-UP
✅ 1:2 TARGET REACHED!
Our bullish thesis, published in advance, reached its first management target.
🟢 Original entry: 0.19007 USDT
🔴 Original stop loss: 0.18690 USDT
🎯 First 1:2 target: 0.19641 USDT
📈 Subsequent high observed: 0.19664 USDT
HYPOTHETICAL MANAGEMENT ACCORDING TO THE PUBLISHED PLAN:
✅ Close 50% of the position upon reaching 1:2, assuming execution at the expected price.
🔒 The remaining 50% stays under review, initially keeping the original technical stop.
🚀 Final extended target: 0.22600 USDT.
⚠️ Important: this is an educational audit of a simulated trade. The first price target was reached, but that does not guarantee further upside or prove the strategy is profitable.
We will continue documenting both wins and mistakes, without changing the original conditions after learning the outcome.
NEXO TRADING | We don't promise market moves. We study structures and manage risk.
#ENAUSDT #NexoTrading #SmartMoney #BinanceSquare #Trading
📊 THIRD AUDIT — STRUCTURAL LONG FOLLOW-UP
✅ 1:2 TARGET REACHED!
Our bullish thesis, published in advance, reached its first management target.
🟢 Original entry: 0.19007 USDT
🔴 Original stop loss: 0.18690 USDT
🎯 First 1:2 target: 0.19641 USDT
📈 Subsequent high observed: 0.19664 USDT
HYPOTHETICAL MANAGEMENT ACCORDING TO THE PUBLISHED PLAN:
✅ Close 50% of the position upon reaching 1:2, assuming execution at the expected price.
🔒 The remaining 50% stays under review, initially keeping the original technical stop.
🚀 Final extended target: 0.22600 USDT.
⚠️ Important: this is an educational audit of a simulated trade. The first price target was reached, but that does not guarantee further upside or prove the strategy is profitable.
We will continue documenting both wins and mistakes, without changing the original conditions after learning the outcome.
NEXO TRADING | We don't promise market moves. We study structures and manage risk.
#ENAUSDT #NexoTrading #SmartMoney #BinanceSquare #Trading
1
205
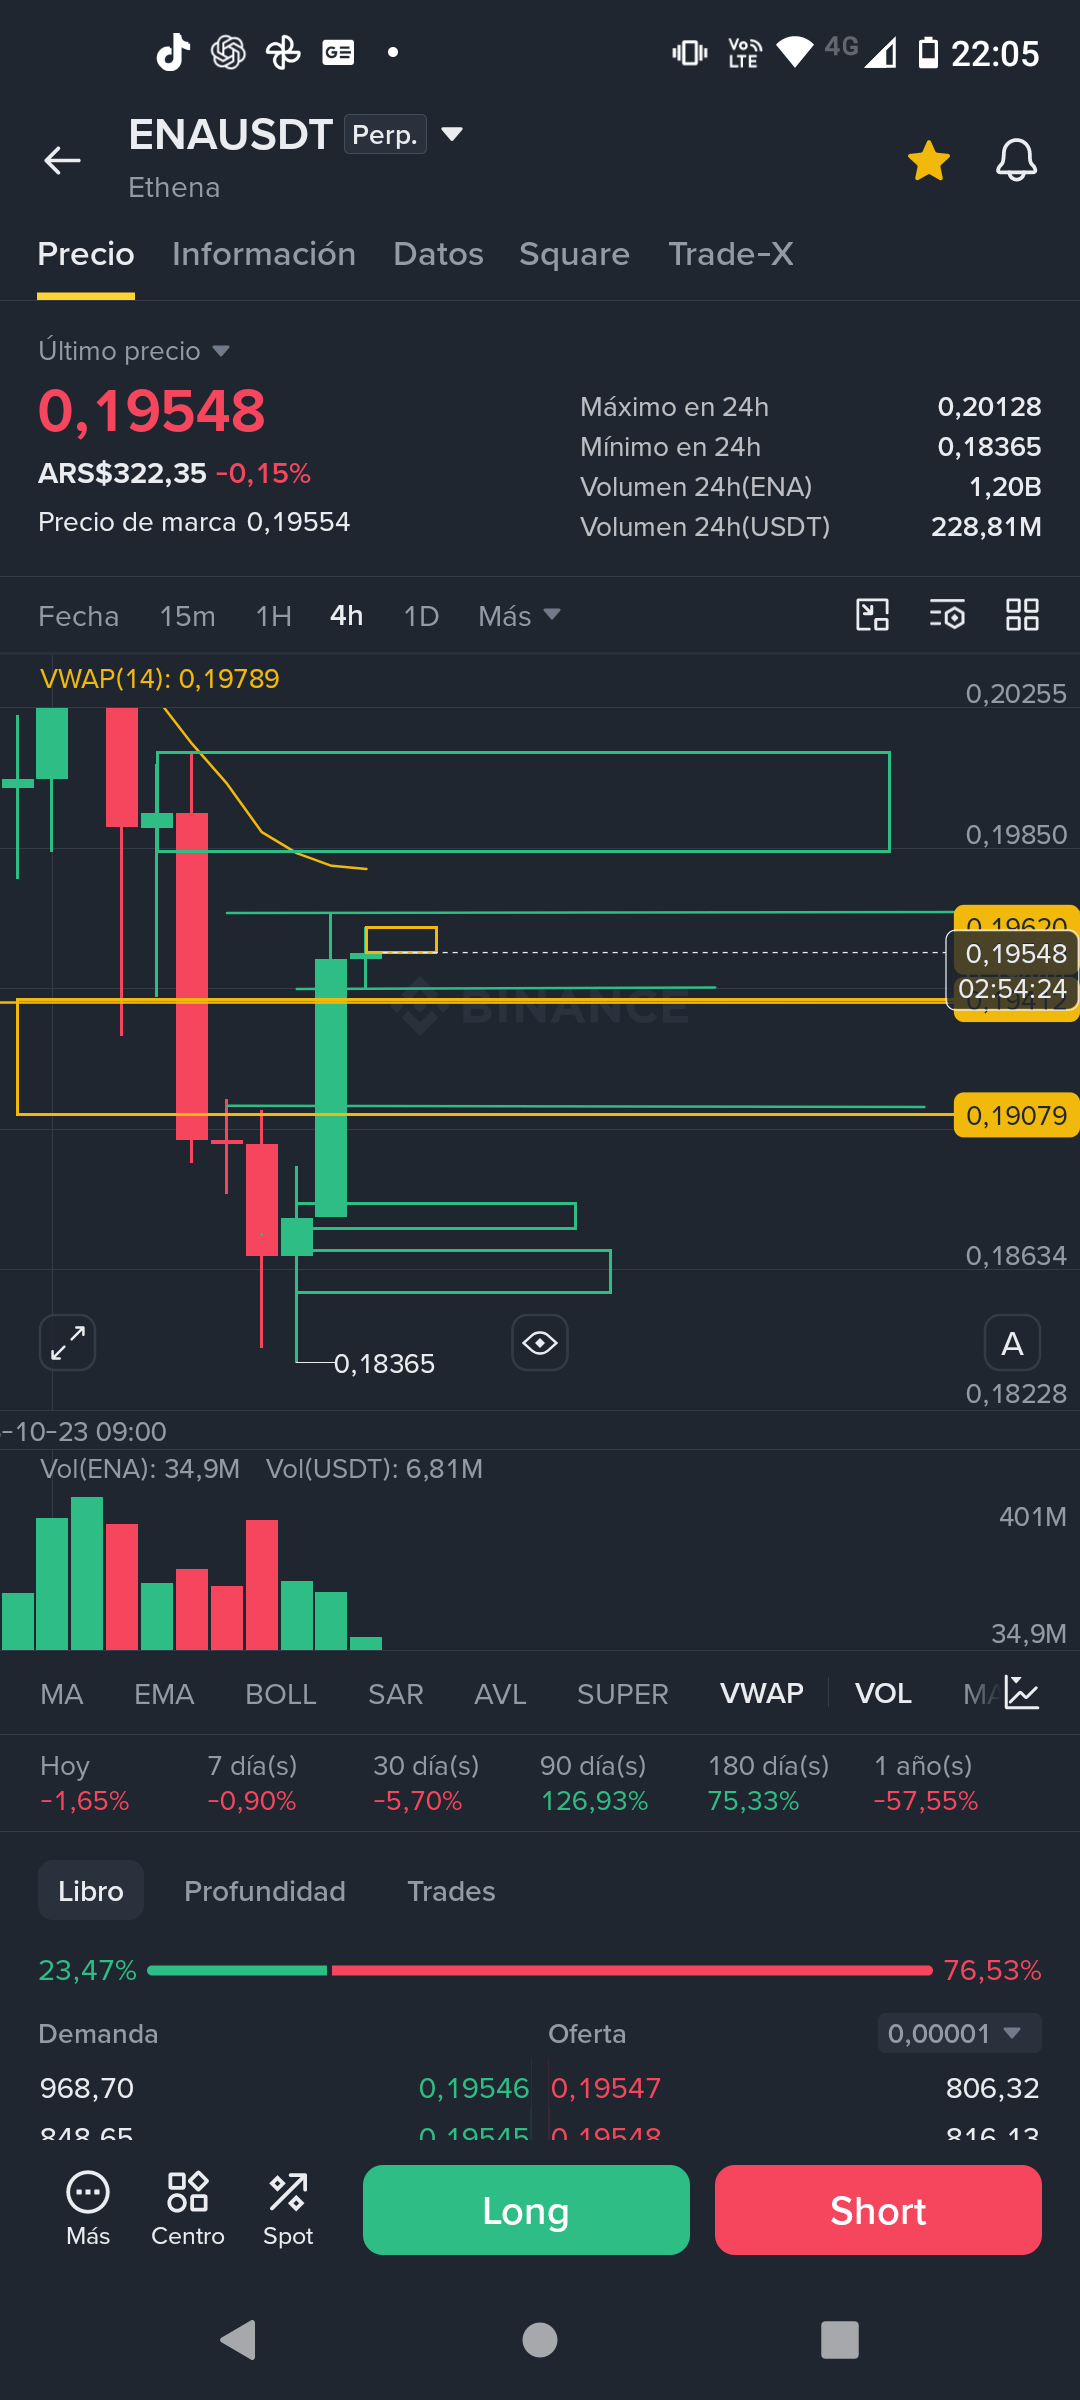
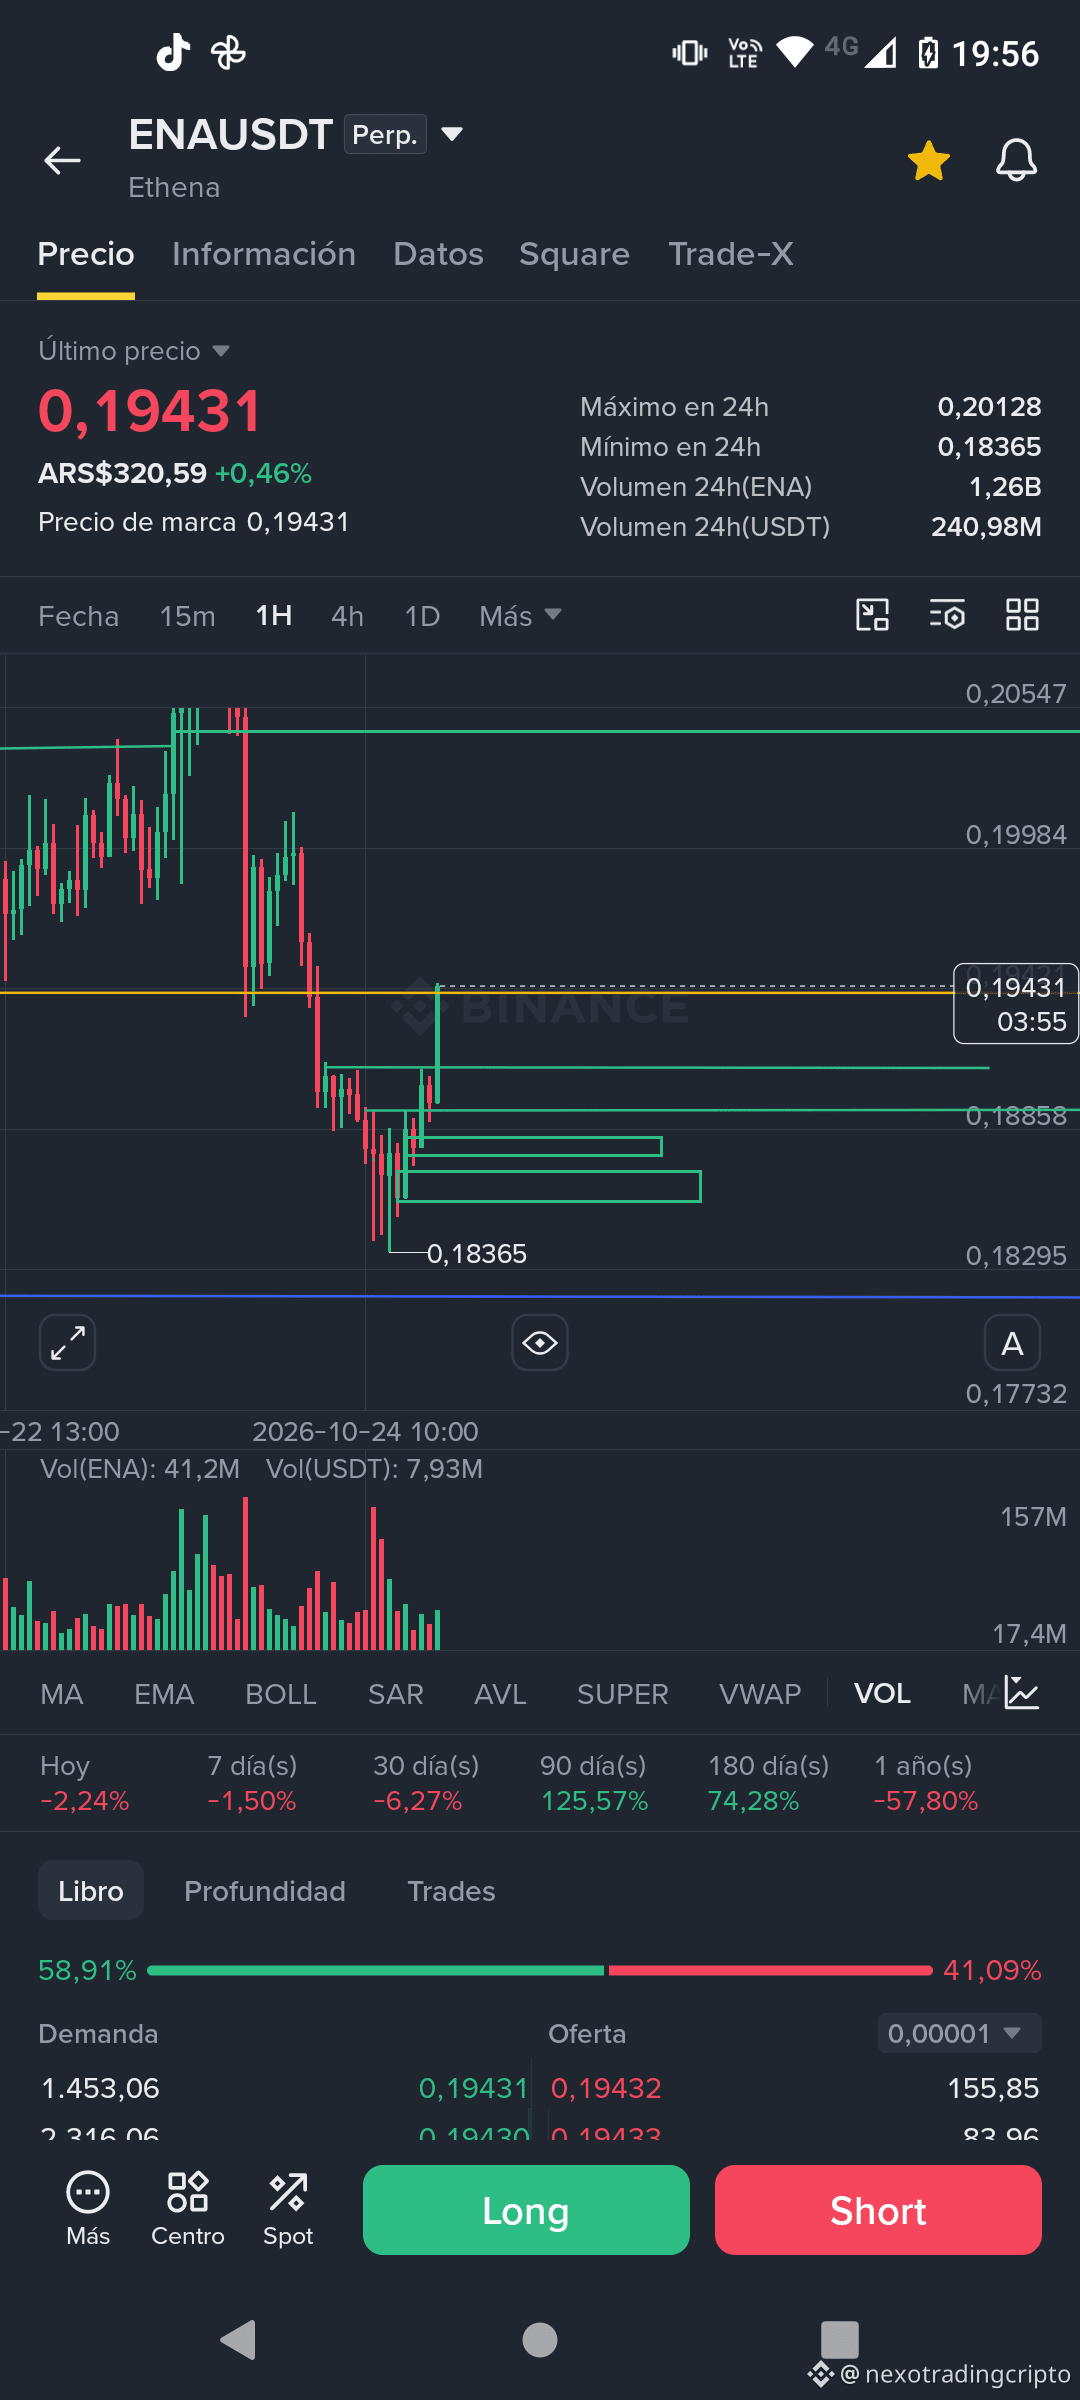
🚨 ENAUSDT | STRUCTURAL LONG UPDATE — NEXO TRADING
📊 THIRD AUDIT — MANAGING THE EXPANSION
Our previously published bullish thesis continues to develop.
Price began rebuilding structure on the 15-minute timeframe and subsequently showed bullish displacement on the 1H timeframe.
🎯 PROPOSED MANAGEMENT PLAN
🟢 Original entry: 0.19007 USDT
🔴 Original stop loss: 0.18690 USDT
💰 First 1:2 target: 0.19641 USDT
✅ Close 50% of the position upon reaching 1:2.
🔒 Initially keep the original technical stop for the remaining 50%, and consider adjustments only if a new structure emerges to justify them.
🚀 Final expansion target: 0.22600 USDT.
📈 We aim to capture a potential higher-timeframe expansion without abandoning risk management.
⚠️ 4H confirmation is still pending. The scenario may be invalidated, and targets are not guaranteed.
NEXO TRADING | The lower-timeframe structure anticipates. The higher-timeframe structure confirms.
#ENAUSDT #NexoTrading #SmartMoney #BinanceSquare #Trading
🚨 ENAUSDT | STRUCTURAL LONG UPDATE — NEXO TRADING
📊 THIRD AUDIT — MANAGING THE EXPANSION
Our previously published bullish thesis continues to develop.
Price began rebuilding structure on the 15-minute timeframe and subsequently showed bullish displacement on the 1H timeframe.
🎯 PROPOSED MANAGEMENT PLAN
🟢 Original entry: 0.19007 USDT
🔴 Original stop loss: 0.18690 USDT
💰 First 1:2 target: 0.19641 USDT
✅ Close 50% of the position upon reaching 1:2.
🔒 Initially keep the original technical stop for the remaining 50%, and consider adjustments only if a new structure emerges to justify them.
🚀 Final expansion target: 0.22600 USDT.
📈 We aim to capture a potential higher-timeframe expansion without abandoning risk management.
⚠️ 4H confirmation is still pending. The scenario may be invalidated, and targets are not guaranteed.
NEXO TRADING | The lower-timeframe structure anticipates. The higher-timeframe structure confirms.
#ENAUSDT #NexoTrading #SmartMoney #BinanceSquare #Trading
📊 THIRD AUDIT — MANAGING THE EXPANSION
Our previously published bullish thesis continues to develop.
Price began rebuilding structure on the 15-minute timeframe and subsequently showed bullish displacement on the 1H timeframe.
🎯 PROPOSED MANAGEMENT PLAN
🟢 Original entry: 0.19007 USDT
🔴 Original stop loss: 0.18690 USDT
💰 First 1:2 target: 0.19641 USDT
✅ Close 50% of the position upon reaching 1:2.
🔒 Initially keep the original technical stop for the remaining 50%, and consider adjustments only if a new structure emerges to justify them.
🚀 Final expansion target: 0.22600 USDT.
📈 We aim to capture a potential higher-timeframe expansion without abandoning risk management.
⚠️ 4H confirmation is still pending. The scenario may be invalidated, and targets are not guaranteed.
NEXO TRADING | The lower-timeframe structure anticipates. The higher-timeframe structure confirms.
#ENAUSDT #NexoTrading #SmartMoney #BinanceSquare #Trading
1
116
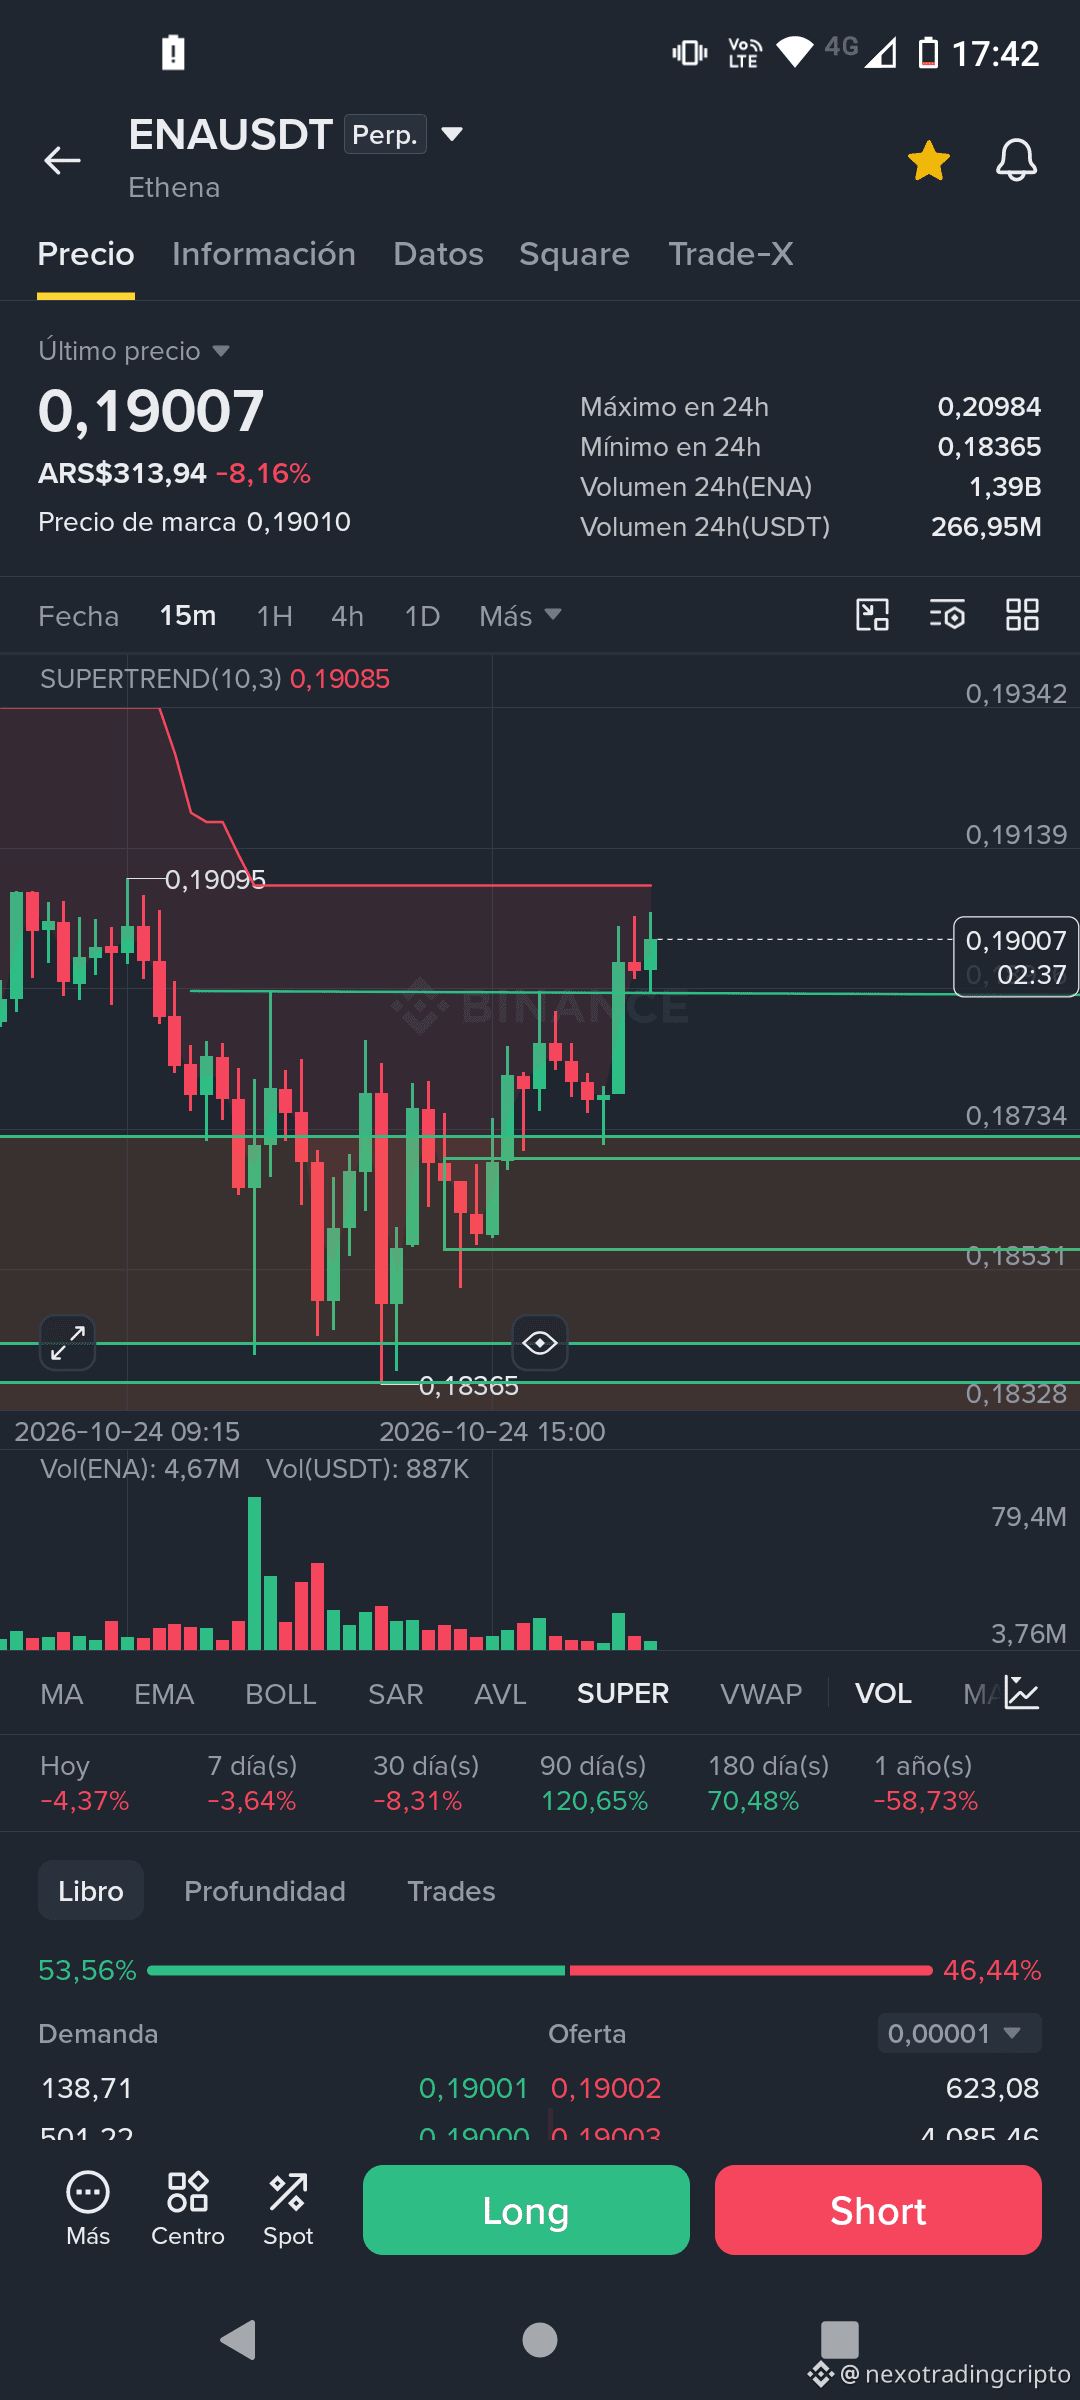
🚨 ENAUSDT | POSSIBLE STRUCTURAL LONG — NEXO TRADING
🔥 We’re looking to anticipate a possible bullish expansion.
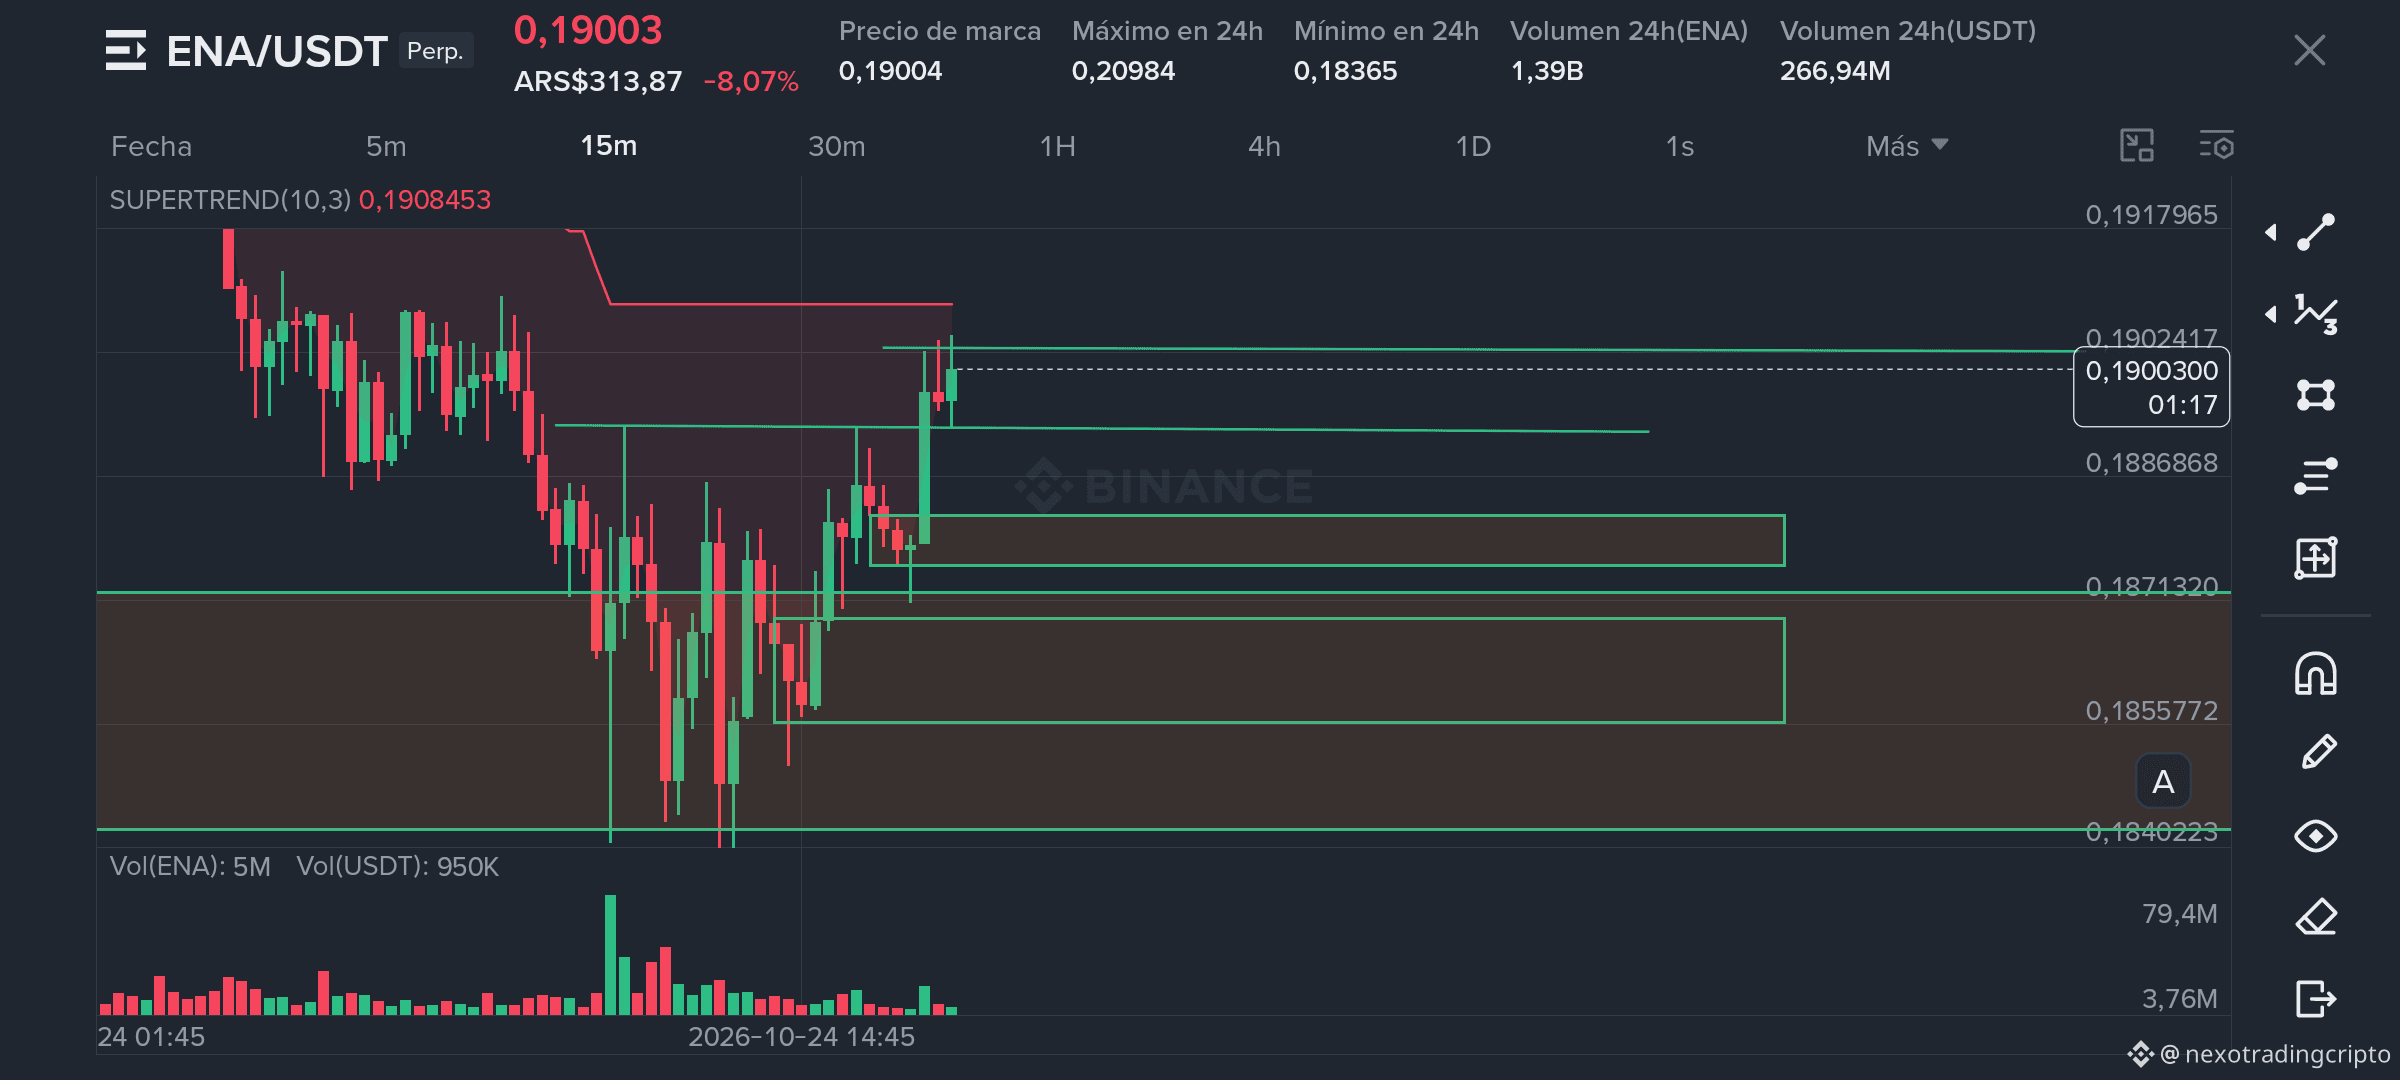
ENA swept liquidity down to 0.18365, reacted from a 4H demand zone, and began recovering its structure on the 15-minute timeframe.
📊 Hypothetical scenario:
🟢 Reference entry: 0.19007 USDT
🔴 Stop loss: 0.18690 USDT
🎯 Expansion target: 0.22600 USDT
📈 Theoretical risk/reward: 1:11.33
🔎 Technical rationale:
The hypothesis is that ENA may be forming a protected low ahead of a higher-timeframe expansion.
We’re monitoring the recovery of 0.19095, a break above the next resistance levels, and the defense of the 15m internal structure.
⚠️ A drop below 0.18700 would weaken this anticipated scenario. The target is not guaranteed, and 4H confirmation is still pending.
NEXO TRADING | Structure first, execution second.
#ENAUSDT #SmartMoney #BinanceSquare #PriceAction #NexoTrading
🚨 ENAUSDT | POSSIBLE STRUCTURAL LONG — NEXO TRADING
🔥 We’re looking to anticipate a possible bullish expansion.
ENA swept liquidity down to 0.18365, reacted from a 4H demand zone, and began recovering its structure on the 15-minute timeframe.
📊 Hypothetical scenario:
🟢 Reference entry: 0.19007 USDT
🔴 Stop loss: 0.18690 USDT
🎯 Expansion target: 0.22600 USDT
📈 Theoretical risk/reward: 1:11.33
🔎 Technical rationale:
The hypothesis is that ENA may be forming a protected low ahead of a higher-timeframe expansion.
We’re monitoring the recovery of 0.19095, a break above the next resistance levels, and the defense of the 15m internal structure.
⚠️ A drop below 0.18700 would weaken this anticipated scenario. The target is not guaranteed, and 4H confirmation is still pending.
NEXO TRADING | Structure first, execution second.
#ENAUSDT #SmartMoney #BinanceSquare #PriceAction #NexoTrading
🔥 We’re looking to anticipate a possible bullish expansion.
ENA swept liquidity down to 0.18365, reacted from a 4H demand zone, and began recovering its structure on the 15-minute timeframe.
📊 Hypothetical scenario:
🟢 Reference entry: 0.19007 USDT
🔴 Stop loss: 0.18690 USDT
🎯 Expansion target: 0.22600 USDT
📈 Theoretical risk/reward: 1:11.33
🔎 Technical rationale:
The hypothesis is that ENA may be forming a protected low ahead of a higher-timeframe expansion.
We’re monitoring the recovery of 0.19095, a break above the next resistance levels, and the defense of the 15m internal structure.
⚠️ A drop below 0.18700 would weaken this anticipated scenario. The target is not guaranteed, and 4H confirmation is still pending.
NEXO TRADING | Structure first, execution second.
#ENAUSDT #SmartMoney #BinanceSquare #PriceAction #NexoTrading
1
131
🚨 NEXO TRADING | ENA/USDT — POSSIBLE BULLISH EXPANSION 🚀
🔥 SMART MONEY | LONG SETUP
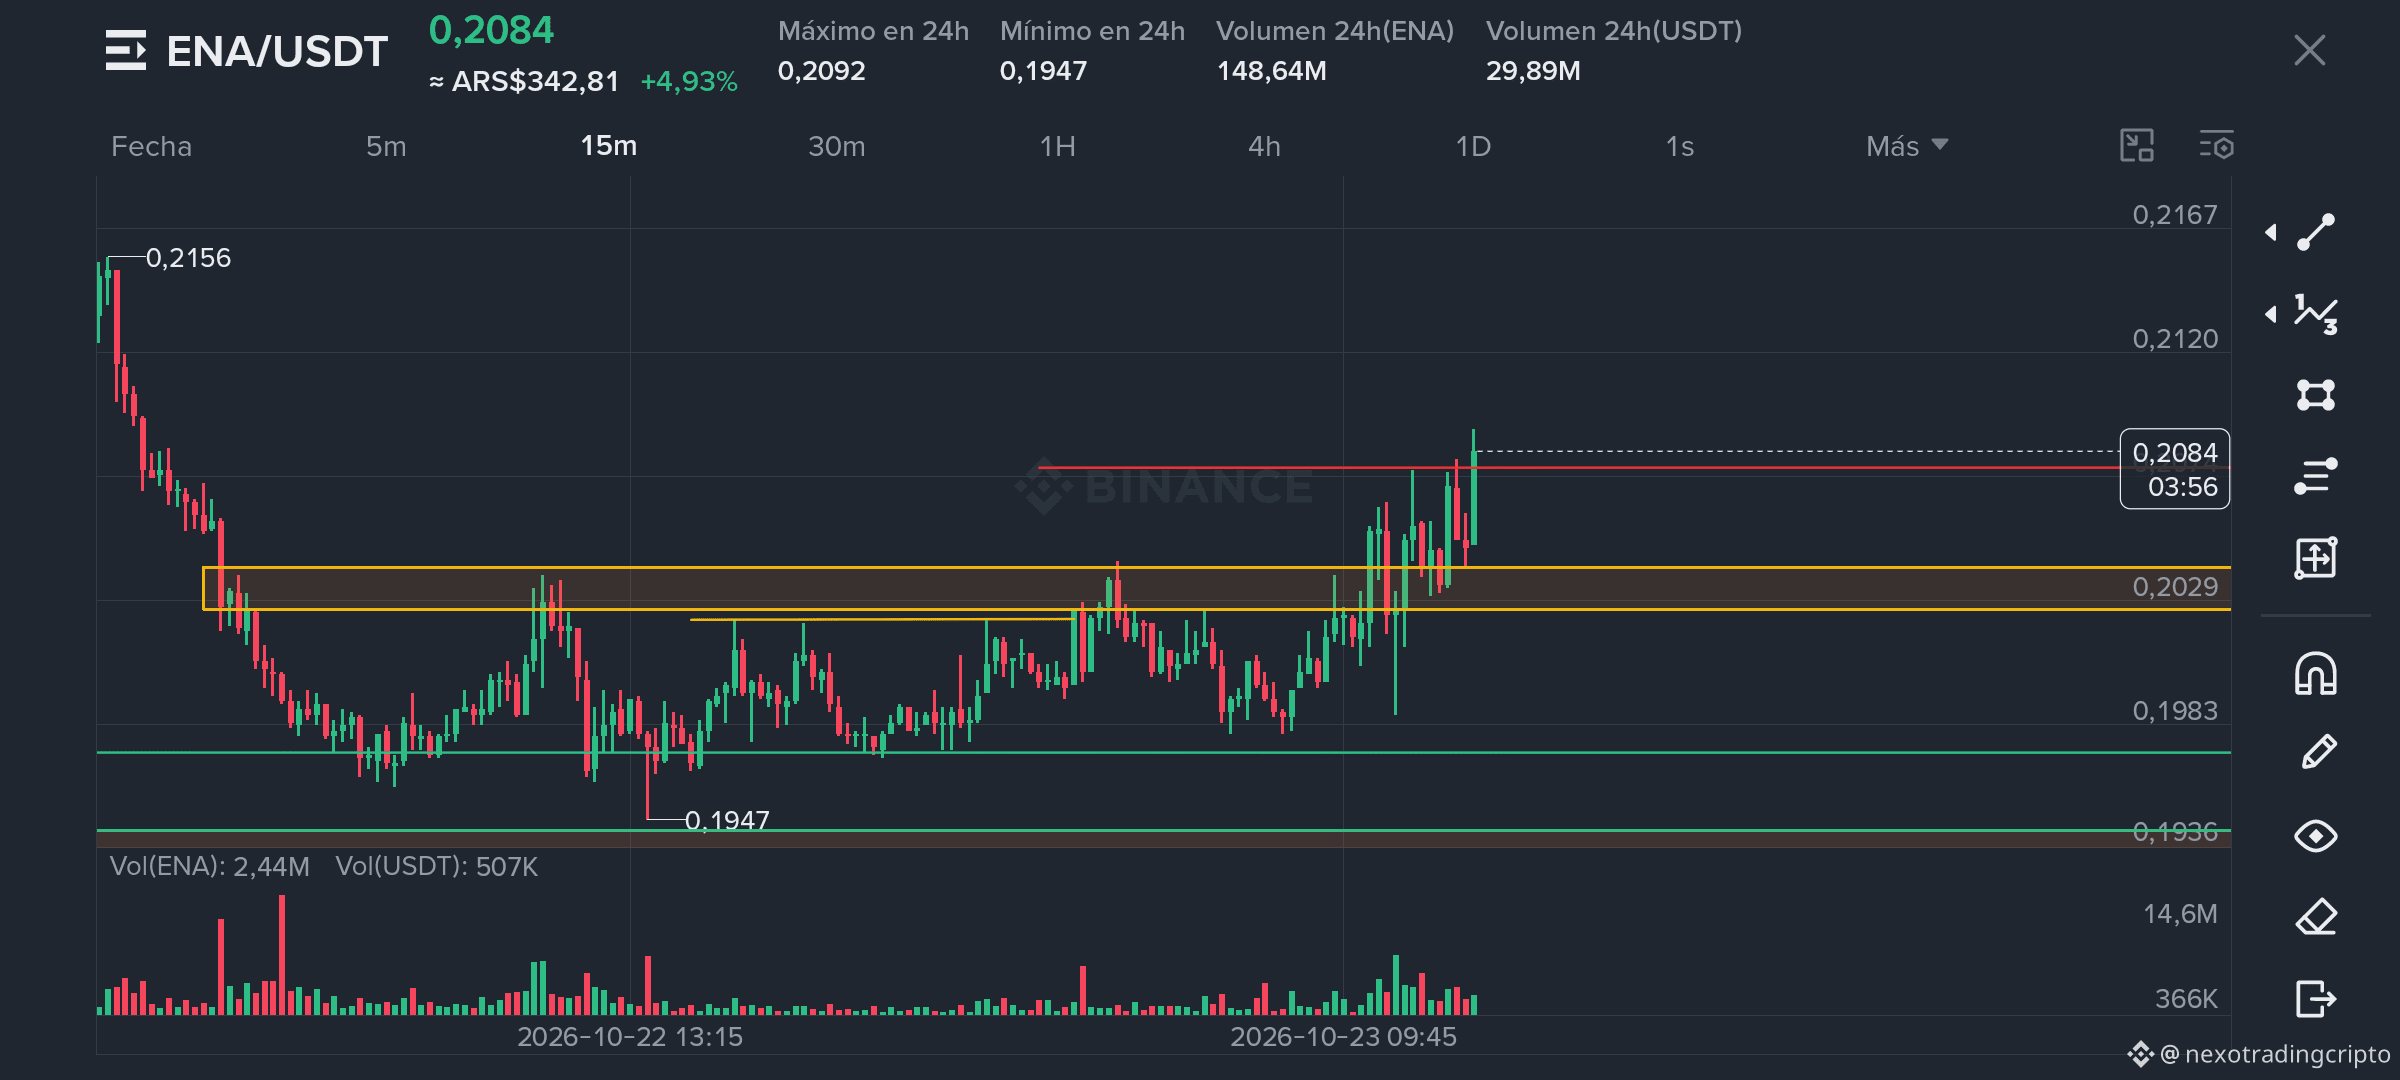
ENA is beginning to show a possible bullish structural transition.
📊 Multi-timeframe analysis
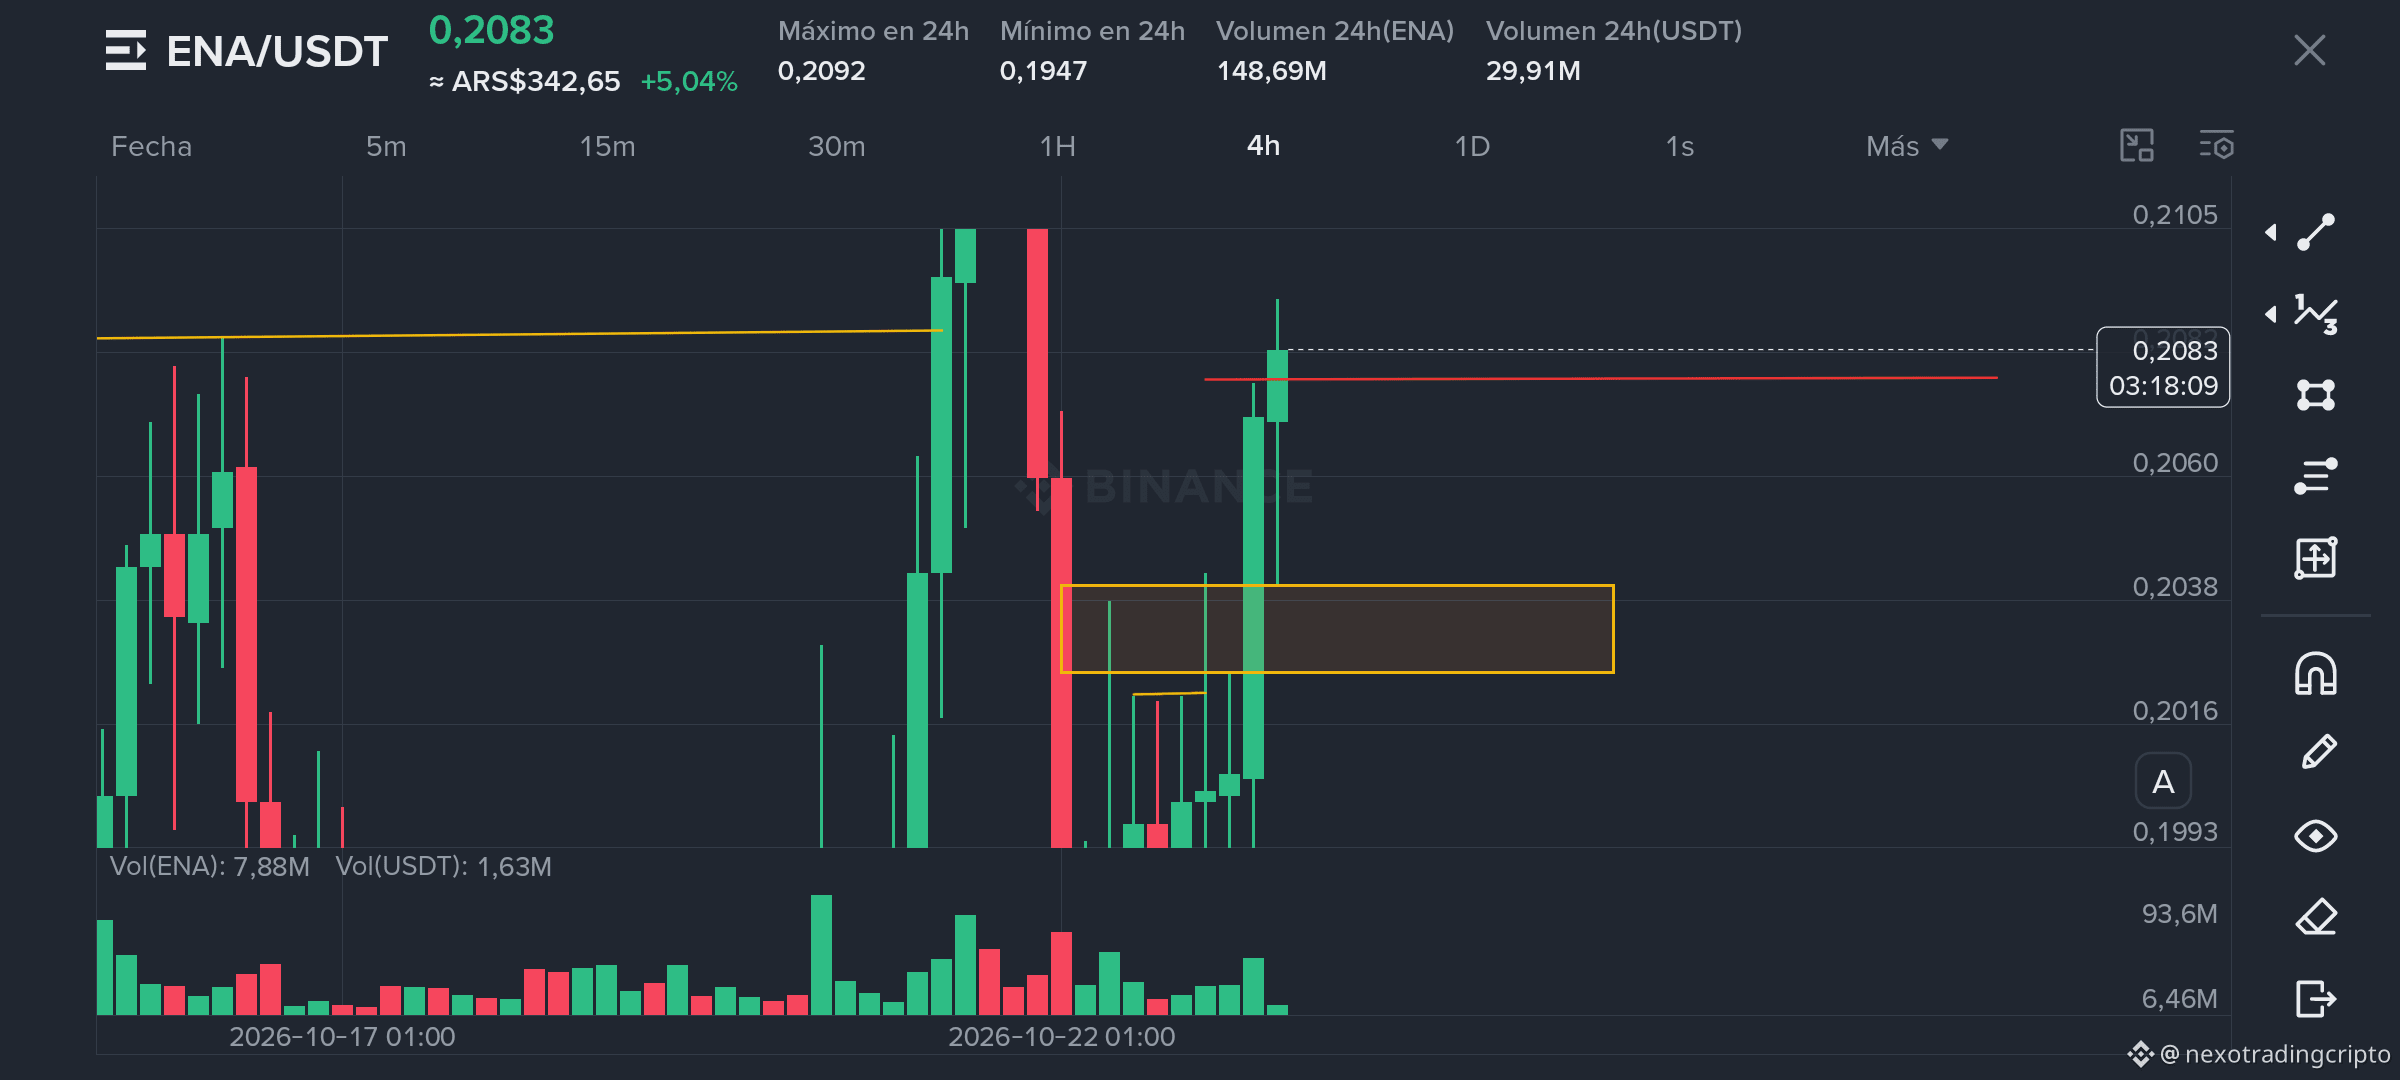
🔹 4H: hypothesis of a strong low forming and a possible new bullish expansion.
🔹 1H: accumulation, structural breakout with a body close, and buying continuation.
🔹 15M: Order Block mitigation, bullish reaction, and controlled pullback.
🔹 1M: microstructure recovery and buying displacement.
🎯 LONG TRADE PLAN
🟢 Reference entry: 0.2078 USDT
🔴 Invalidation / Stop Loss: below 0.2044 USDT, subject to confirming the exact protected low.
🏆 Main Take Profit: 0.2260 USDT
📈 Potential to TP: +8.76% without leverage.
⚡ Hypothesis: if a genuine expansion begins on the 4H, we expect bullish displacement and the possible formation of a Fair Value Gap (FVG). A break below the 15m protected low would invalidate this trade setup.
⚠️ We’re not trying to predict the market. We form a hypothesis, define the risk, and let price confirm or invalidate our analysis.
Educational analysis. Not financial advice. This scenario may fail.
#NEXOTrading #ENA #ENAUSDT #SmartMoney #Binance #PriceAction #Trading
🚨 NEXO TRADING | ENA/USDT — POSSIBLE BULLISH EXPANSION 🚀
🔥 SMART MONEY | LONG SETUP
ENA is beginning to show a possible bullish structural transition.
📊 Multi-timeframe analysis
🔹 4H: hypothesis of a strong low forming and a possible new bullish expansion.
🔹 1H: accumulation, structural breakout with a body close, and buying continuation.
🔹 15M: Order Block mitigation, bullish reaction, and controlled pullback.
🔹 1M: microstructure recovery and buying displacement.
🎯 LONG TRADE PLAN
🟢 Reference entry: 0.2078 USDT
🔴 Invalidation / Stop Loss: below 0.2044 USDT, subject to confirming the exact protected low.
🏆 Main Take Profit: 0.2260 USDT
📈 Potential to TP: +8.76% without leverage.
⚡ Hypothesis: if a genuine expansion begins on the 4H, we expect bullish displacement and the possible formation of a Fair Value Gap (FVG). A break below the 15m protected low would invalidate this trade setup.
⚠️ We’re not trying to predict the market. We form a hypothesis, define the risk, and let price confirm or invalidate our analysis.
Educational analysis. Not financial advice. This scenario may fail.
#NEXOTrading #ENA #ENAUSDT #SmartMoney #Binance #PriceAction #Trading
🔥 SMART MONEY | LONG SETUP
ENA is beginning to show a possible bullish structural transition.
📊 Multi-timeframe analysis
🔹 4H: hypothesis of a strong low forming and a possible new bullish expansion.
🔹 1H: accumulation, structural breakout with a body close, and buying continuation.
🔹 15M: Order Block mitigation, bullish reaction, and controlled pullback.
🔹 1M: microstructure recovery and buying displacement.
🎯 LONG TRADE PLAN
🟢 Reference entry: 0.2078 USDT
🔴 Invalidation / Stop Loss: below 0.2044 USDT, subject to confirming the exact protected low.
🏆 Main Take Profit: 0.2260 USDT
📈 Potential to TP: +8.76% without leverage.
⚡ Hypothesis: if a genuine expansion begins on the 4H, we expect bullish displacement and the possible formation of a Fair Value Gap (FVG). A break below the 15m protected low would invalidate this trade setup.
⚠️ We’re not trying to predict the market. We form a hypothesis, define the risk, and let price confirm or invalidate our analysis.
Educational analysis. Not financial advice. This scenario may fail.
#NEXOTrading #ENA #ENAUSDT #SmartMoney #Binance #PriceAction #Trading
230
🚨🚨 ATTENTION, ATTENTION! $WLDUSDT 🚨
🔥 IS A STRUCTURAL LONG SETUP FORMING?
👀 NEXO Trading is keeping a close eye on WLD.
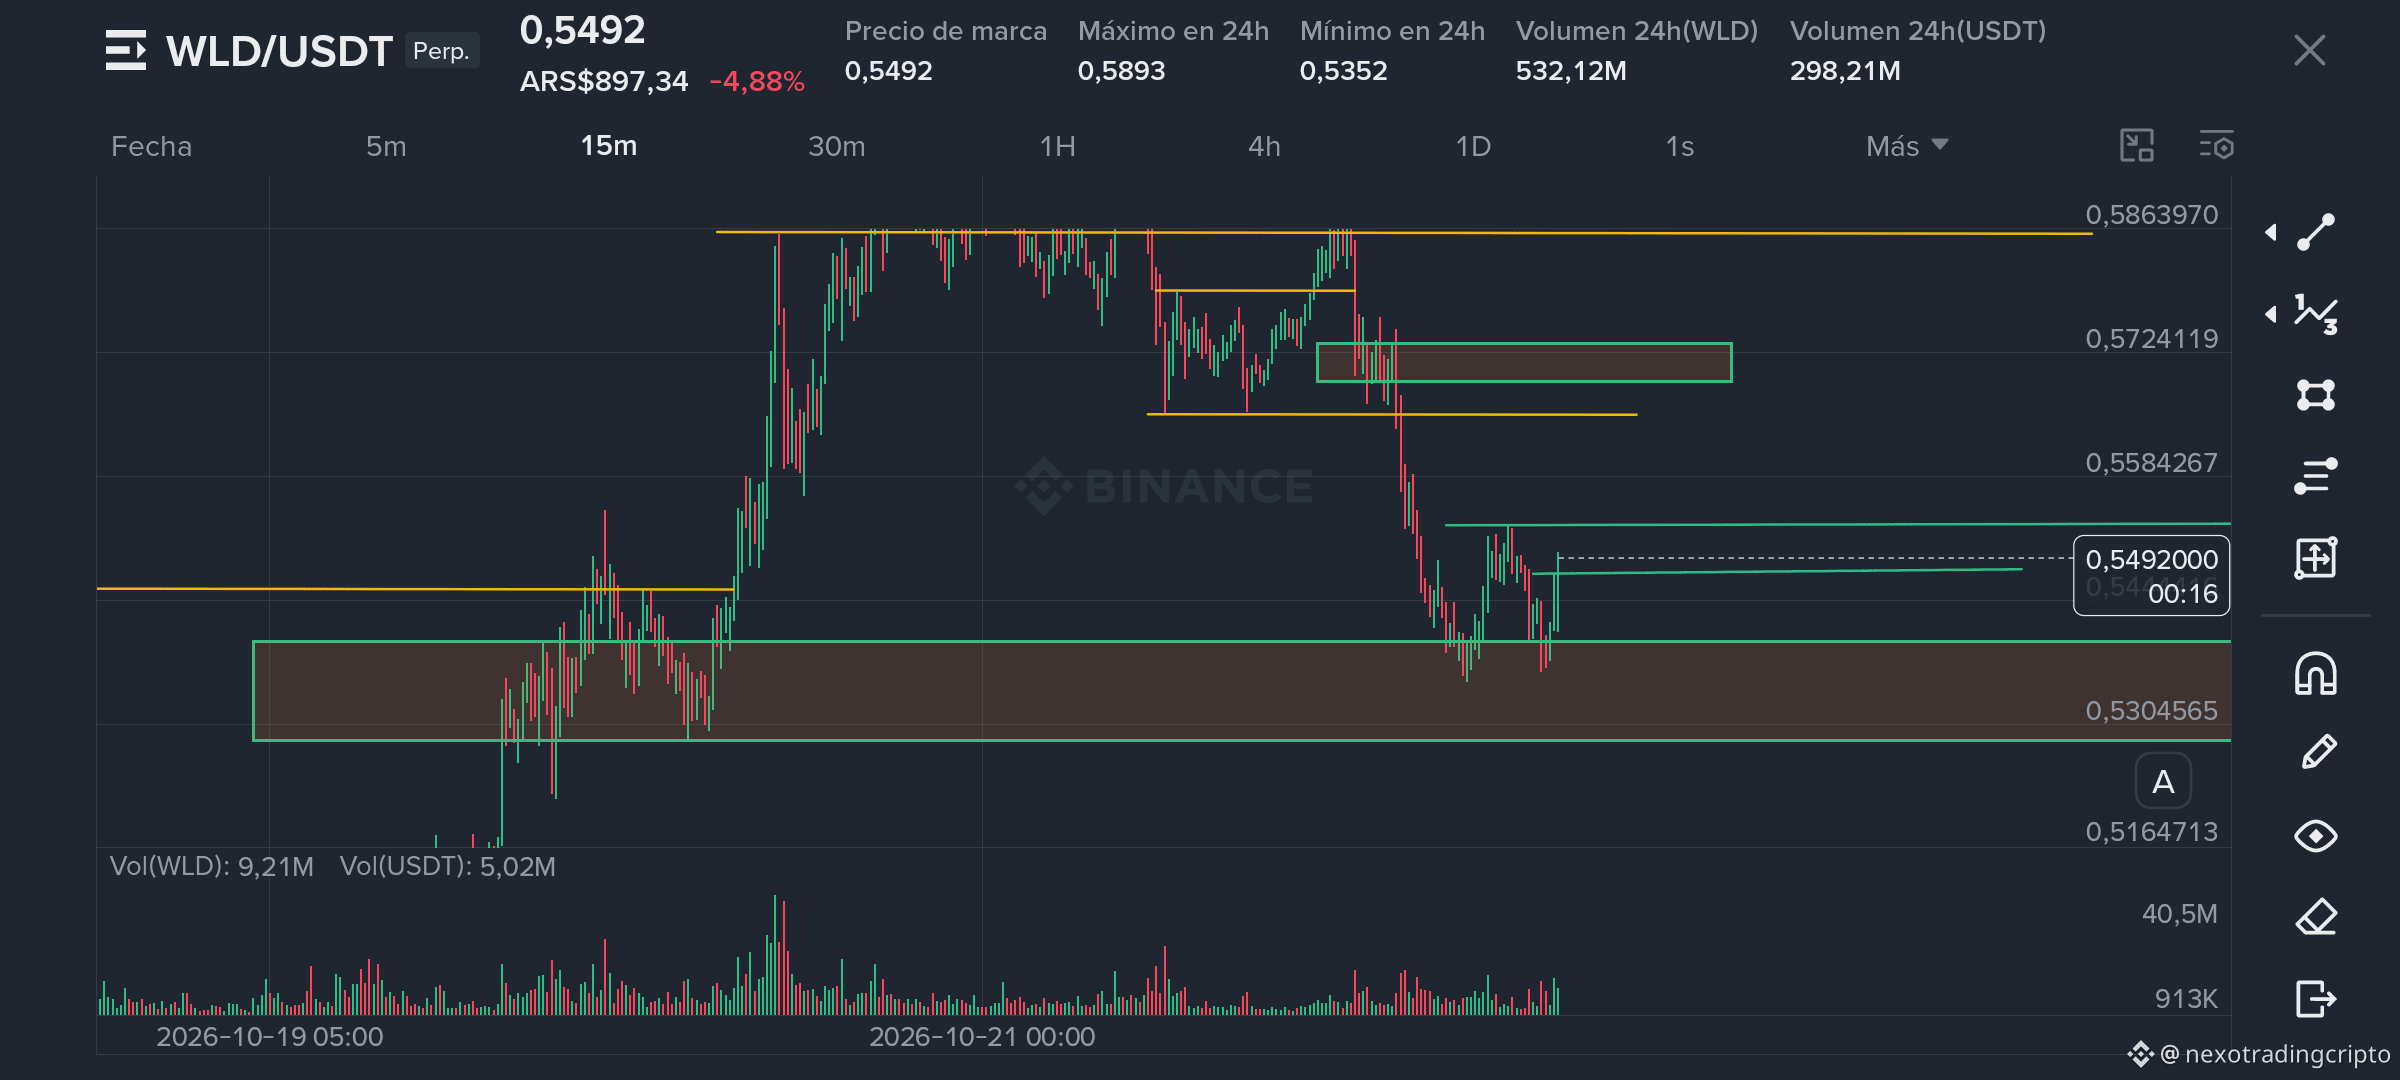
📈 After a sharp drop, the price bounced from the 0.5352 zone and is starting to show signs of recovery.
🎯 Key level: 0.5514.
⚠️ We're still waiting for a breakout with a 15m candle body close. If confirmed, we'll look for the Order Block and its retest.
🔥 A potential opportunity is developing!
🧠 We don't chase price. We wait for the market to confirm.
📊 Educational analysis. Not an entry signal.
#WLD #Binance #NexoTrading #SmartMoney #Crypto
🚨🚨 ATTENTION, ATTENTION! $WLDUSDT 🚨
🔥 IS A STRUCTURAL LONG SETUP FORMING?
👀 NEXO Trading is keeping a close eye on WLD.
📈 After a sharp drop, the price bounced from the 0.5352 zone and is starting to show signs of recovery.
🎯 Key level: 0.5514.
⚠️ We're still waiting for a breakout with a 15m candle body close. If confirmed, we'll look for the Order Block and its retest.
🔥 A potential opportunity is developing!
🧠 We don't chase price. We wait for the market to confirm.
📊 Educational analysis. Not an entry signal.
#WLD #Binance #NexoTrading #SmartMoney #Crypto
🔥 IS A STRUCTURAL LONG SETUP FORMING?
👀 NEXO Trading is keeping a close eye on WLD.
📈 After a sharp drop, the price bounced from the 0.5352 zone and is starting to show signs of recovery.
🎯 Key level: 0.5514.
⚠️ We're still waiting for a breakout with a 15m candle body close. If confirmed, we'll look for the Order Block and its retest.
🔥 A potential opportunity is developing!
🧠 We don't chase price. We wait for the market to confirm.
📊 Educational analysis. Not an entry signal.
#WLD #Binance #NexoTrading #SmartMoney #Crypto
3
596
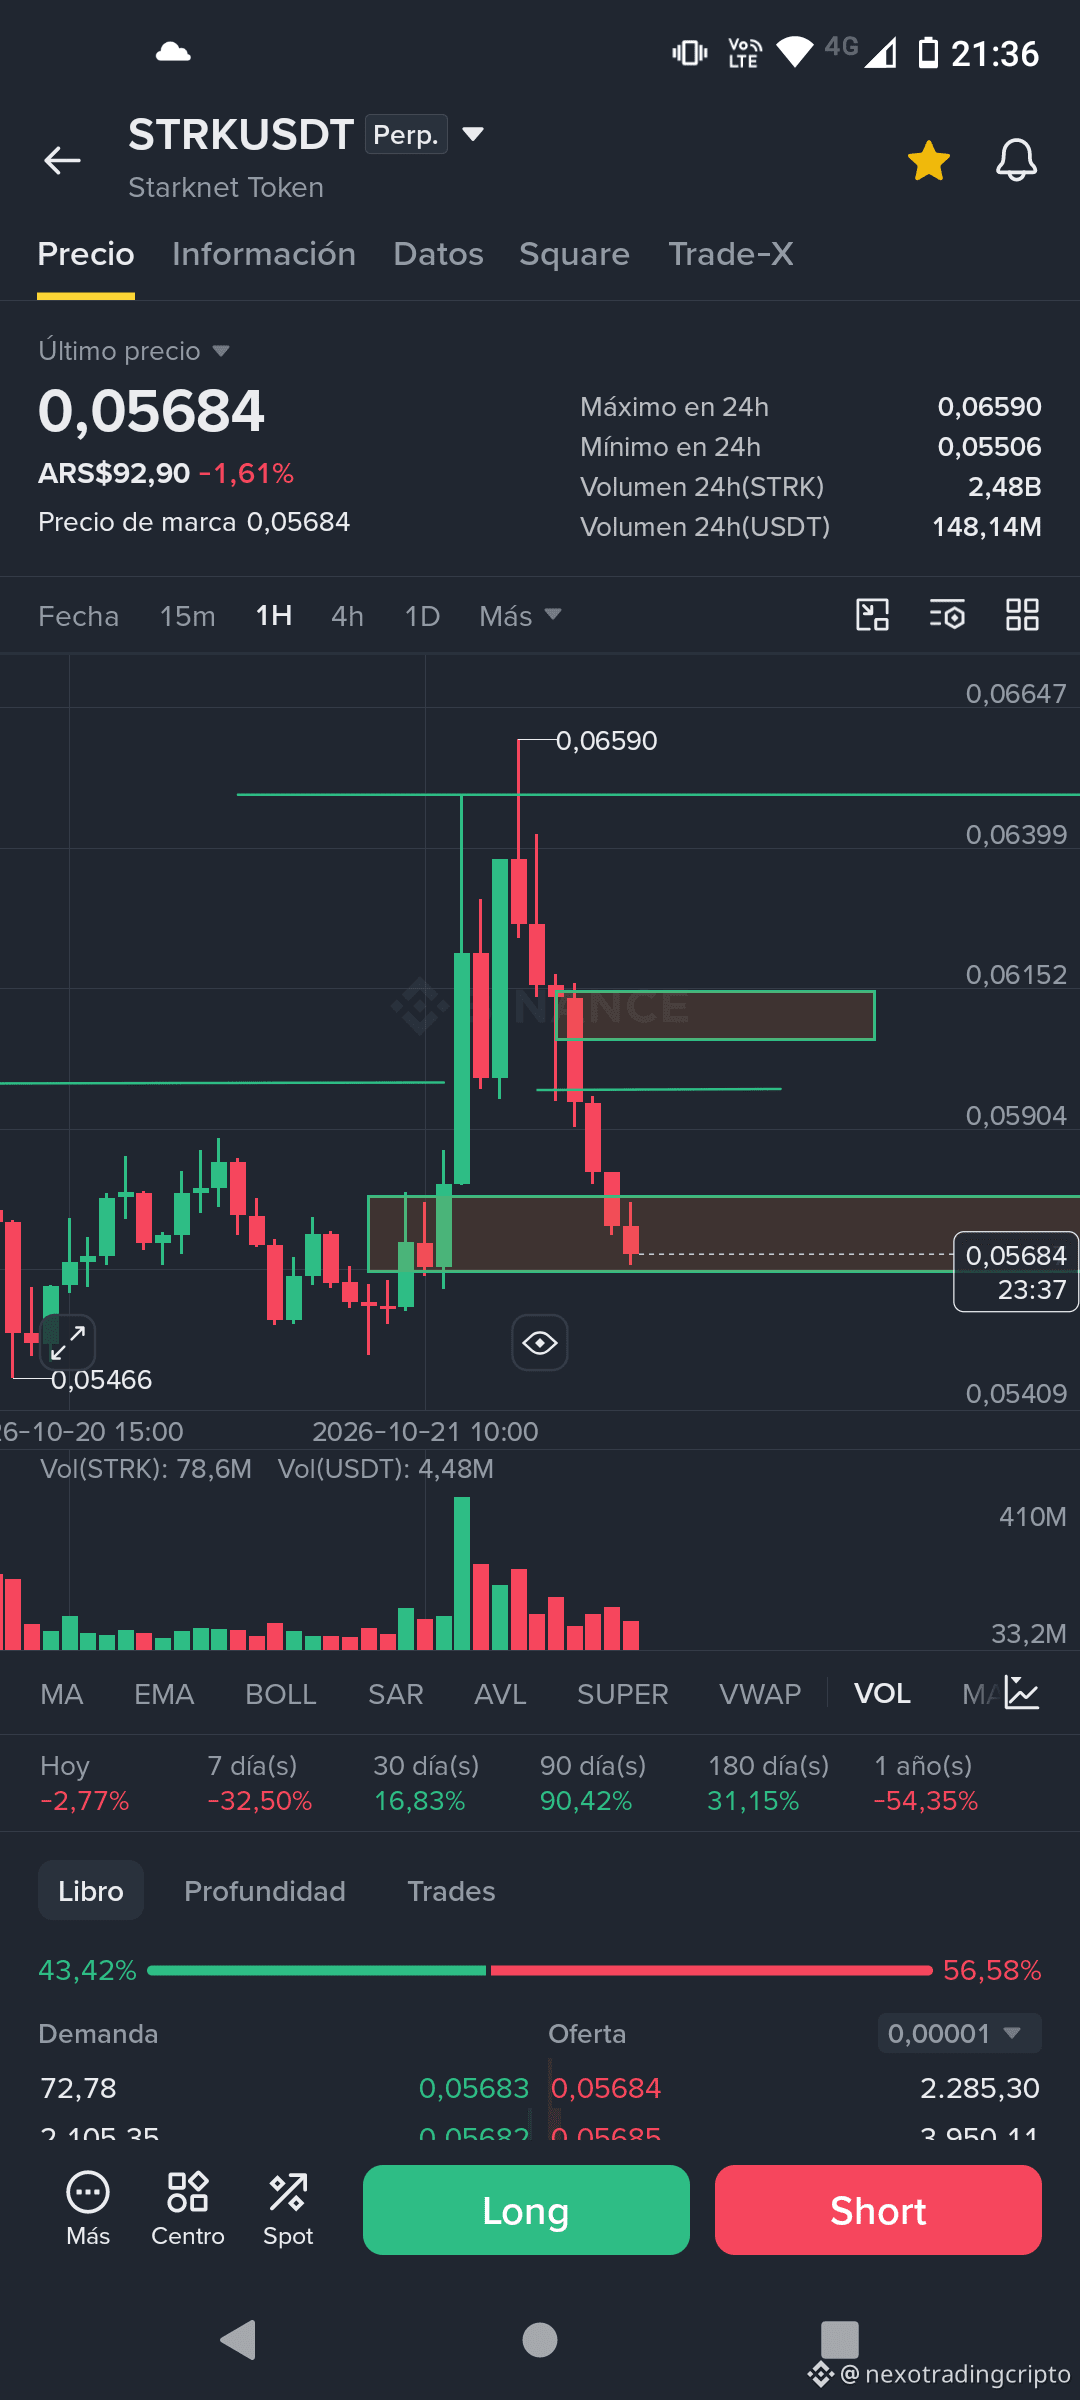
🚨 NEXO TRADING | STRKUSDT — UPDATE
📉 The market did not confirm our LONG scenario.
We had identified a demand zone and outlined a possible recovery toward 0.06590.
But the price failed to sustain the rebound.
❌ Lost structure on the 1H timeframe.
❌ No follow-through from buyers.
❌ Selling pressure pushed the price down to 0.05684.
🔴 Previous LONG scenario invalidated.
Were we wrong? Our bullish hypothesis did not play out. Acknowledging that is also part of trading.
At NEXO, we are not fortune-tellers. We work with probabilities, structure, confirmations, and invalidations.
🔎 What’s next?
Wait for a new confirmed structure. Don’t buy just because the price has fallen or try to guess the bottom.
📌 Educational follow-up trade, not actually executed.
The goal isn’t to always be right. It’s to manage risk when the market proves otherwise.
#NEXOTrading #STRKUSDT #SmartMoney #Binance #TradingEducativo
🚨 NEXO TRADING | STRKUSDT — UPDATE
📉 The market did not confirm our LONG scenario.
We had identified a demand zone and outlined a possible recovery toward 0.06590.
But the price failed to sustain the rebound.
❌ Lost structure on the 1H timeframe.
❌ No follow-through from buyers.
❌ Selling pressure pushed the price down to 0.05684.
🔴 Previous LONG scenario invalidated.
Were we wrong? Our bullish hypothesis did not play out. Acknowledging that is also part of trading.
At NEXO, we are not fortune-tellers. We work with probabilities, structure, confirmations, and invalidations.
🔎 What’s next?
Wait for a new confirmed structure. Don’t buy just because the price has fallen or try to guess the bottom.
📌 Educational follow-up trade, not actually executed.
The goal isn’t to always be right. It’s to manage risk when the market proves otherwise.
#NEXOTrading #STRKUSDT #SmartMoney #Binance #TradingEducativo
📉 The market did not confirm our LONG scenario.
We had identified a demand zone and outlined a possible recovery toward 0.06590.
But the price failed to sustain the rebound.
❌ Lost structure on the 1H timeframe.
❌ No follow-through from buyers.
❌ Selling pressure pushed the price down to 0.05684.
🔴 Previous LONG scenario invalidated.
Were we wrong? Our bullish hypothesis did not play out. Acknowledging that is also part of trading.
At NEXO, we are not fortune-tellers. We work with probabilities, structure, confirmations, and invalidations.
🔎 What’s next?
Wait for a new confirmed structure. Don’t buy just because the price has fallen or try to guess the bottom.
📌 Educational follow-up trade, not actually executed.
The goal isn’t to always be right. It’s to manage risk when the market proves otherwise.
#NEXOTrading #STRKUSDT #SmartMoney #Binance #TradingEducativo
197
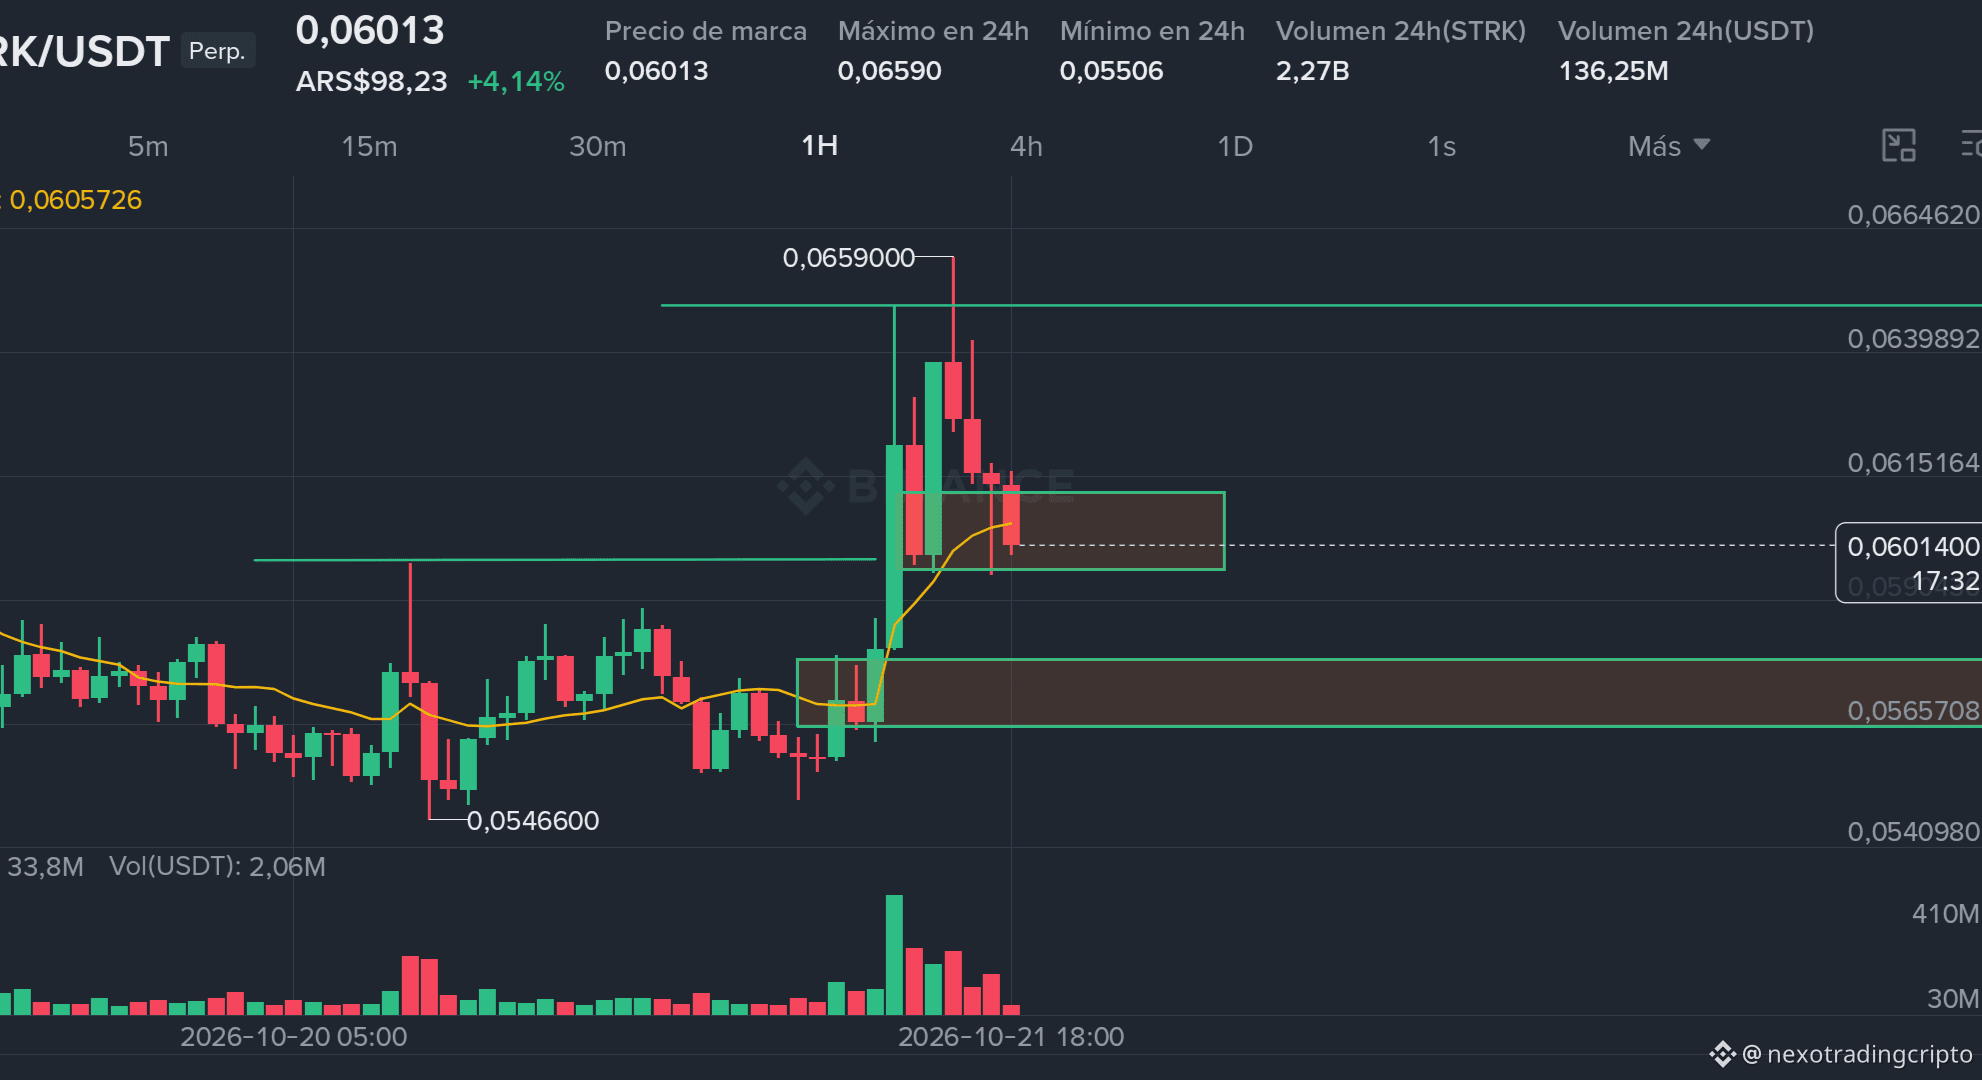
🚨 NEXO TRADING | STRKUSDT — LONG UPDATE
⚠️ Our bullish scenario is losing strength.
The price initially reacted in the demand zone, but failed to sustain its momentum. We continue to see selling pressure and a lack of bullish confirmation.
📉 We are considering closing the trade early to protect capital, without necessarily waiting for the stop loss.
🔎 Where might the next opportunity appear?
📍 0.05794 USDT: next area of interest on the 1H timeframe, pending confirmation of a reaction.
This does not mean buying automatically. We will wait for the price to reach the zone, defend it, and confirm the structure before considering another entry.
💡 We are not fortune-tellers. We work with scenarios, confirmations, and invalidations.
If the market does not respond as we expect, we adjust our decision. Each trader manages their own entries, exits, and risks.
At NEXO Trading, protecting capital is also part of the strategy.
#NEXOTrading #STRKUSDT #SmartMoney #Binance #TradingSignals
🚨 NEXO TRADING | STRKUSDT — LONG UPDATE
⚠️ Our bullish scenario is losing strength.
The price initially reacted in the demand zone, but failed to sustain its momentum. We continue to see selling pressure and a lack of bullish confirmation.
📉 We are considering closing the trade early to protect capital, without necessarily waiting for the stop loss.
🔎 Where might the next opportunity appear?
📍 0.05794 USDT: next area of interest on the 1H timeframe, pending confirmation of a reaction.
This does not mean buying automatically. We will wait for the price to reach the zone, defend it, and confirm the structure before considering another entry.
💡 We are not fortune-tellers. We work with scenarios, confirmations, and invalidations.
If the market does not respond as we expect, we adjust our decision. Each trader manages their own entries, exits, and risks.
At NEXO Trading, protecting capital is also part of the strategy.
#NEXOTrading #STRKUSDT #SmartMoney #Binance #TradingSignals
⚠️ Our bullish scenario is losing strength.
The price initially reacted in the demand zone, but failed to sustain its momentum. We continue to see selling pressure and a lack of bullish confirmation.
📉 We are considering closing the trade early to protect capital, without necessarily waiting for the stop loss.
🔎 Where might the next opportunity appear?
📍 0.05794 USDT: next area of interest on the 1H timeframe, pending confirmation of a reaction.
This does not mean buying automatically. We will wait for the price to reach the zone, defend it, and confirm the structure before considering another entry.
💡 We are not fortune-tellers. We work with scenarios, confirmations, and invalidations.
If the market does not respond as we expect, we adjust our decision. Each trader manages their own entries, exits, and risks.
At NEXO Trading, protecting capital is also part of the strategy.
#NEXOTrading #STRKUSDT #SmartMoney #Binance #TradingSignals
2
473
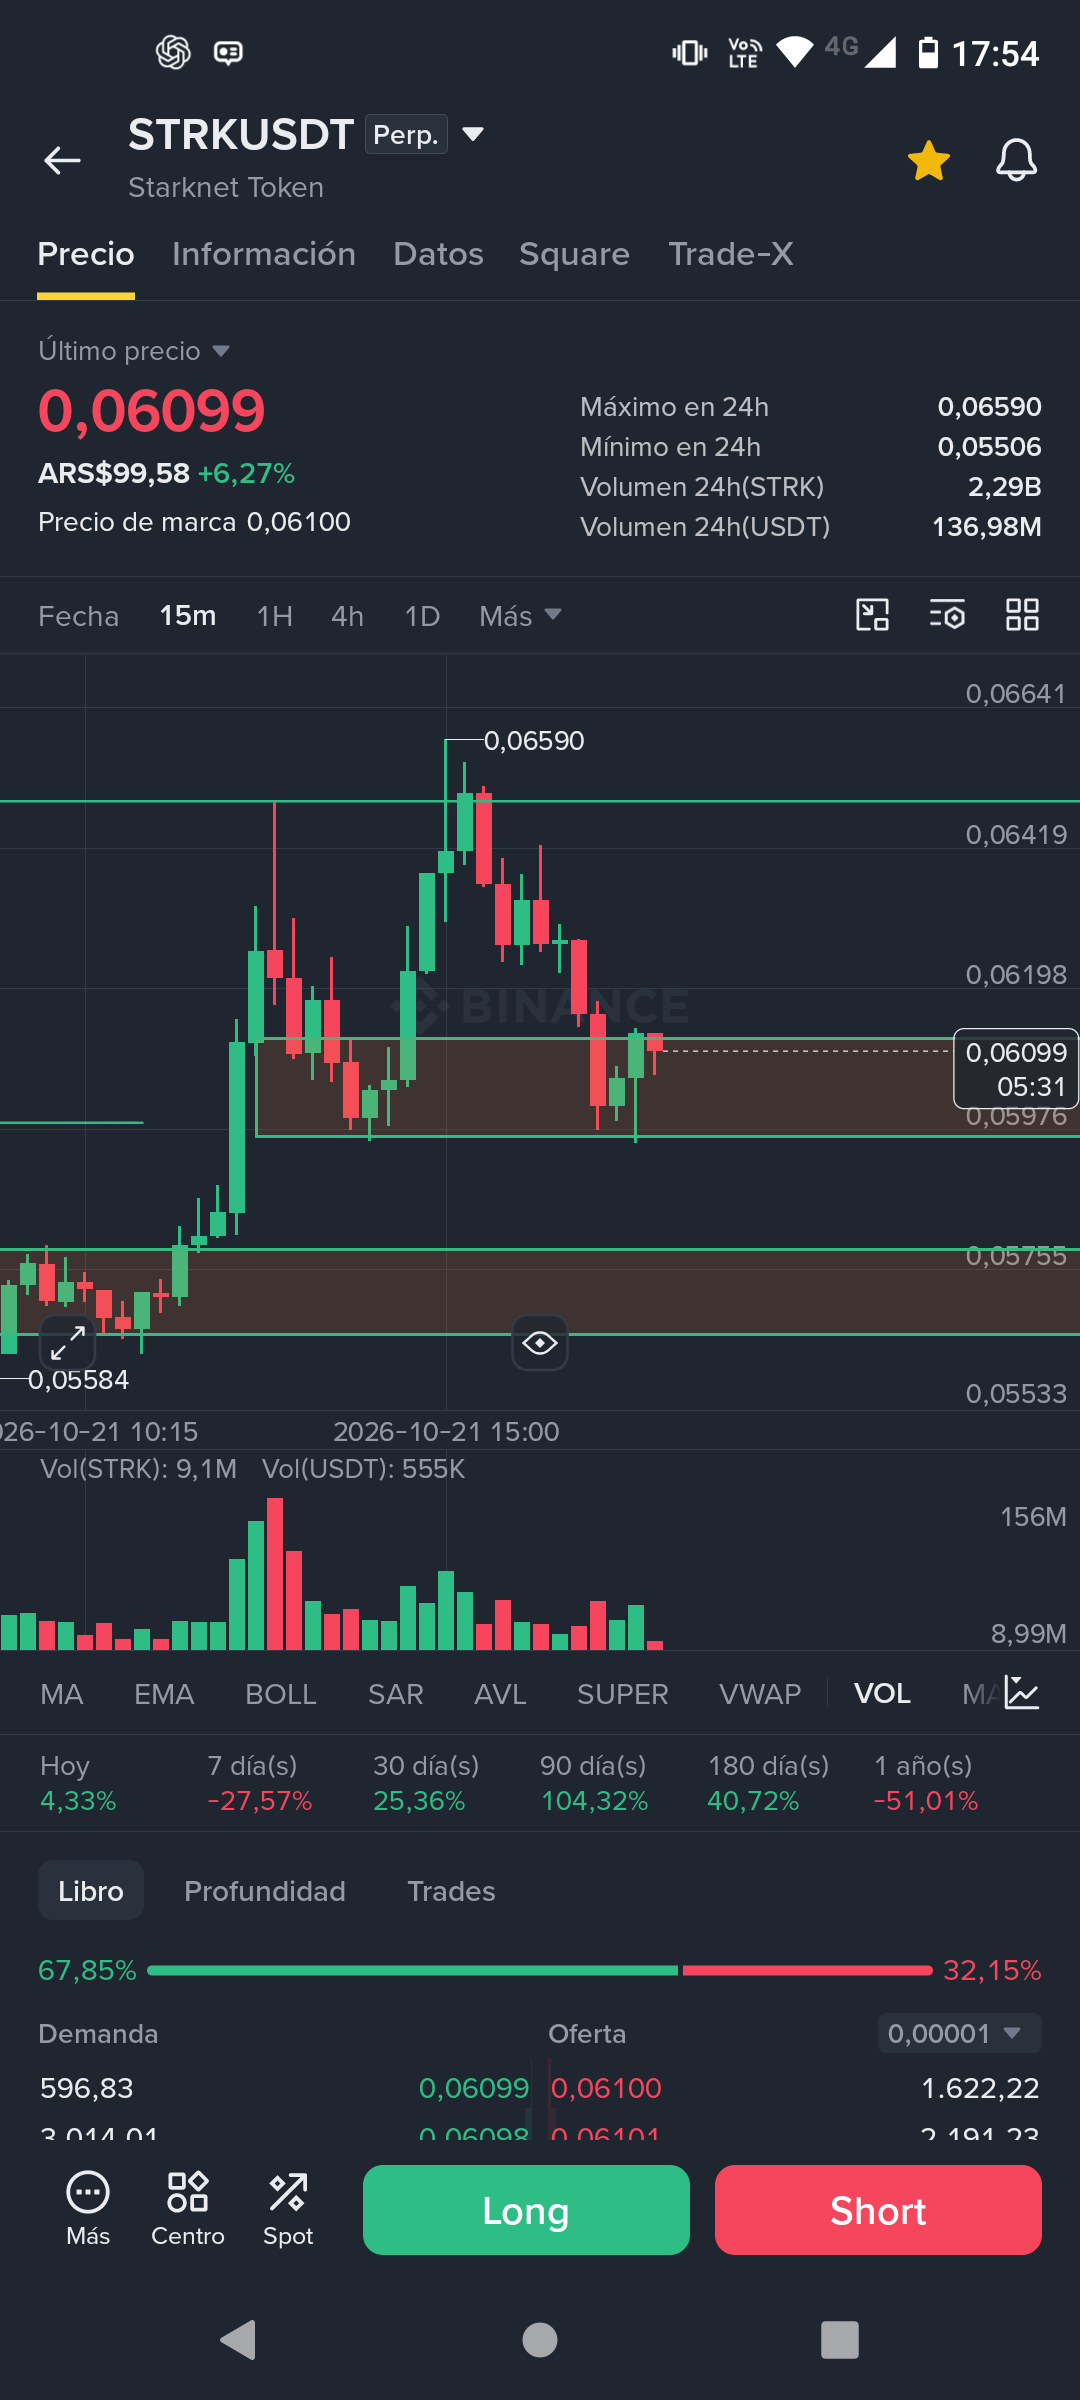
🚨 NEXO TRADING | STRKUSDT — LONG
📊 Smart Money Analysis
📍 Reference entry: 0,06105 USDT
🎯 TP1: 0,06500
🎯 TP2: 0,06590
🛑 SL: Below 0,05954
🔎 What are we observing?
The price reacted in a demand zone and showed a microstructure recovery on the 1-minute timeframe.
Our scenario anticipates continued upward movement toward the relevant highs, as long as the price maintains its structure.
⚠️ We are not visionaries, nor do we claim to predict the market. We share our analysis and the scenarios we consider possible.
Each trader decides on their own entry, risk management, stop loss, and targets. This post does not constitute a guaranteed signal or financial recommendation.
The market has the final say.
#NEXOTrading #STRKUSDT #SmartMoney #Binance #TradingSignals
🚨 NEXO TRADING | STRKUSDT — LONG
📊 Smart Money Analysis
📍 Reference entry: 0,06105 USDT
🎯 TP1: 0,06500
🎯 TP2: 0,06590
🛑 SL: Below 0,05954
🔎 What are we observing?
The price reacted in a demand zone and showed a microstructure recovery on the 1-minute timeframe.
Our scenario anticipates continued upward movement toward the relevant highs, as long as the price maintains its structure.
⚠️ We are not visionaries, nor do we claim to predict the market. We share our analysis and the scenarios we consider possible.
Each trader decides on their own entry, risk management, stop loss, and targets. This post does not constitute a guaranteed signal or financial recommendation.
The market has the final say.
#NEXOTrading #STRKUSDT #SmartMoney #Binance #TradingSignals
📊 Smart Money Analysis
📍 Reference entry: 0,06105 USDT
🎯 TP1: 0,06500
🎯 TP2: 0,06590
🛑 SL: Below 0,05954
🔎 What are we observing?
The price reacted in a demand zone and showed a microstructure recovery on the 1-minute timeframe.
Our scenario anticipates continued upward movement toward the relevant highs, as long as the price maintains its structure.
⚠️ We are not visionaries, nor do we claim to predict the market. We share our analysis and the scenarios we consider possible.
Each trader decides on their own entry, risk management, stop loss, and targets. This post does not constitute a guaranteed signal or financial recommendation.
The market has the final say.
#NEXOTrading #STRKUSDT #SmartMoney #Binance #TradingSignals
1
315
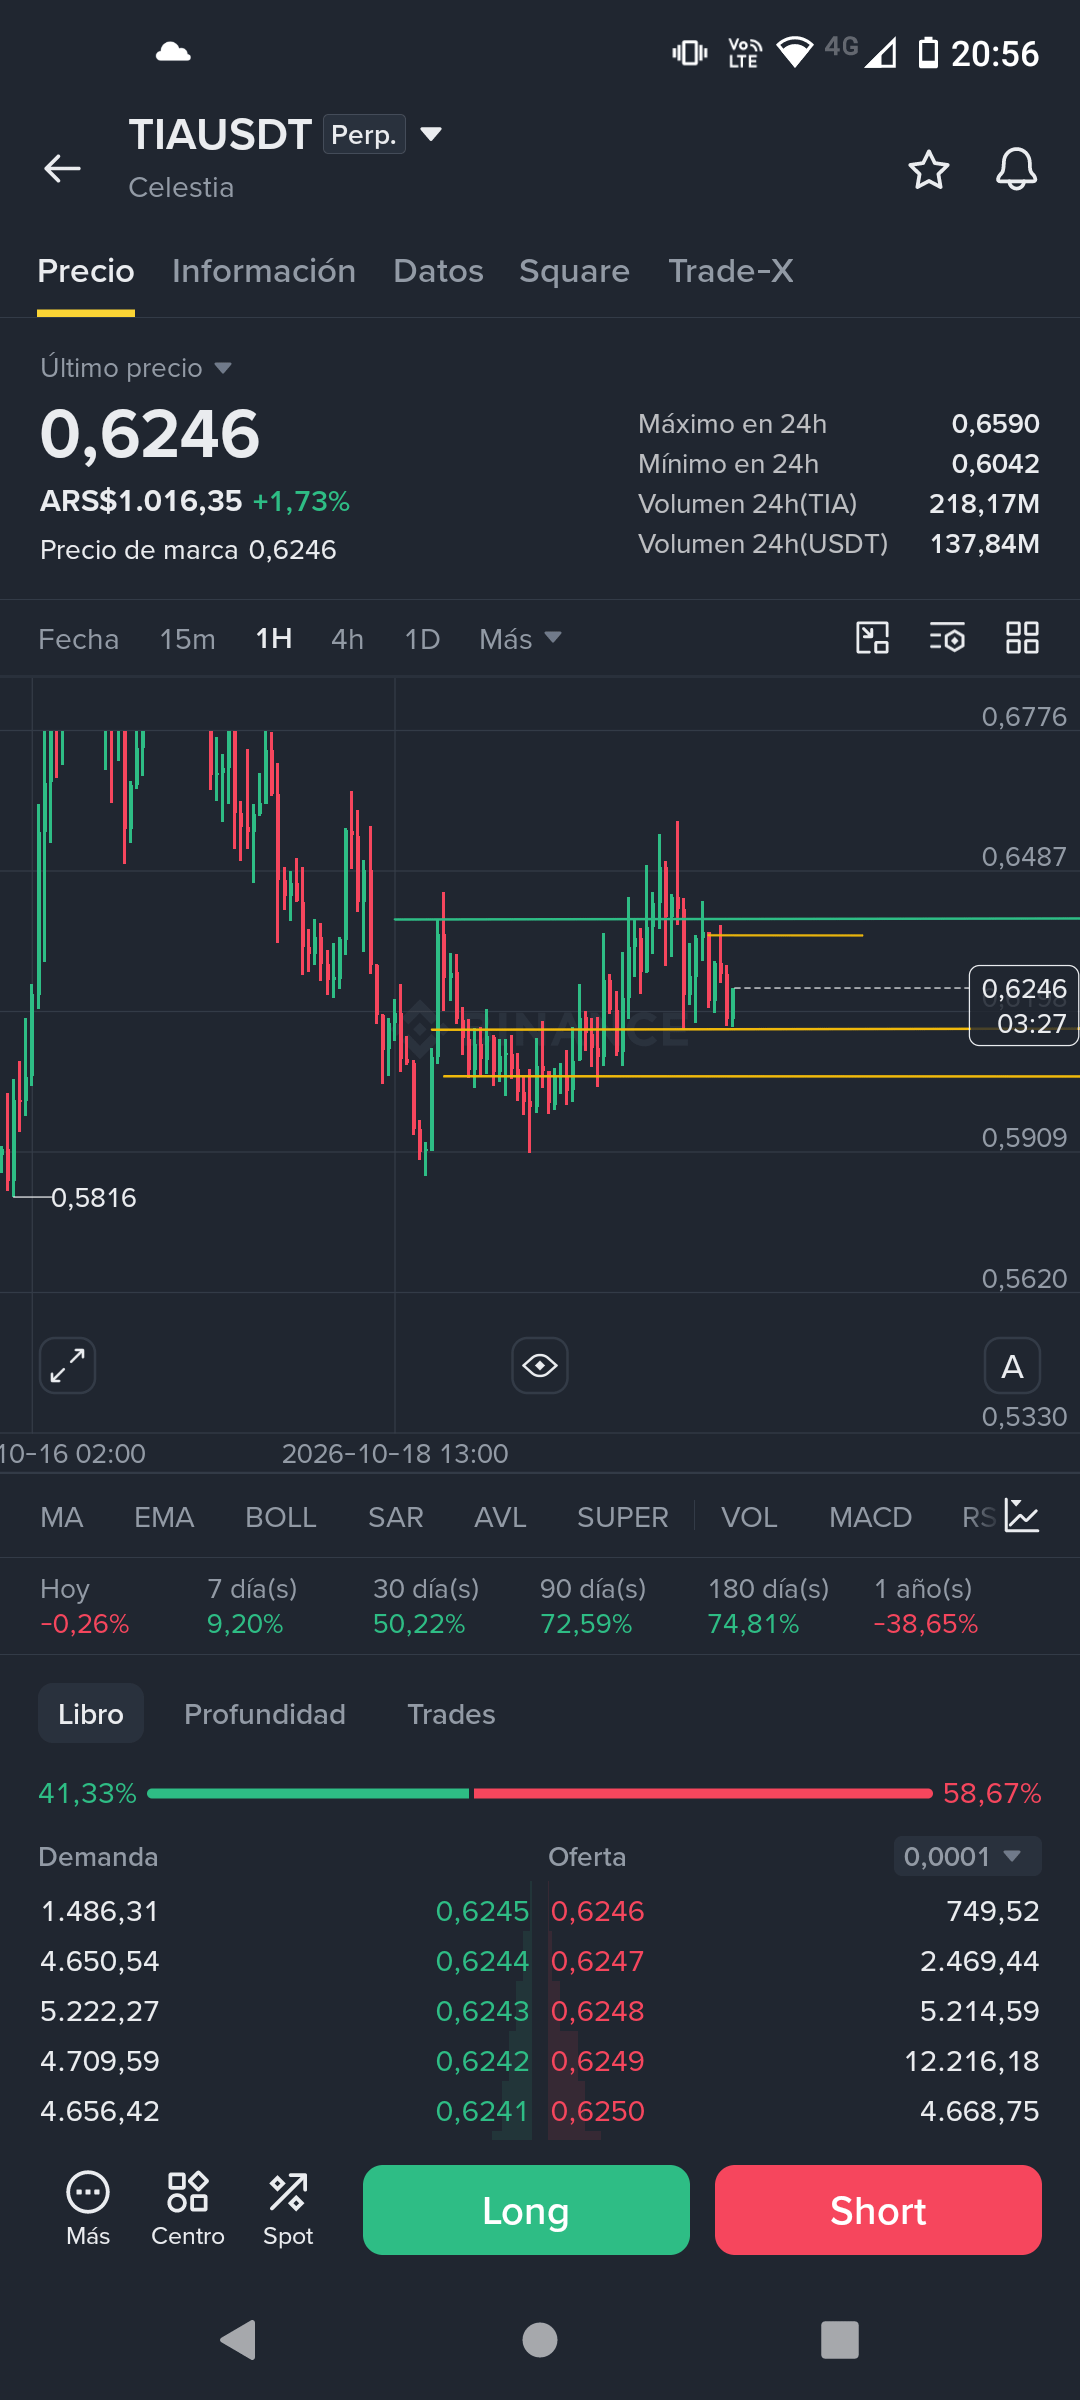
🚨 TIA/USDT | Breakout and retest on the 1H?
📊 We’ve been tracking a potential bullish setup in Celestia.
Price formed a range, swept liquidity below it, and then managed to break above its upper boundary.
Now we’re watching something key: can buyers defend the range they previously broke above?
🔎 Our NEXO scenario:
🟢 Defense zone: approx. 0.618–0.620.
🎯 First resistance: 0.634–0.638.
📈 If price defends the zone, reclaims structure on the 15m, and confirms continuation, we could look for the 1H highs again.
🔴 If price loses the range and accepts prices below it, the bullish thesis weakens and will need to be reassessed.
⚠️ We don’t anticipate the breakout: we wait for confirmation.
At NEXO Trading, we look for structure, liquidity, a retest, and clear triggers before trading.
Range defense or a false breakout? The market has the answer.
#TIA #Celestia #NEXOTrading #BinanceSquare #Trading
🚨 TIA/USDT | Breakout and retest on the 1H?
📊 We’ve been tracking a potential bullish setup in Celestia.
Price formed a range, swept liquidity below it, and then managed to break above its upper boundary.
Now we’re watching something key: can buyers defend the range they previously broke above?
🔎 Our NEXO scenario:
🟢 Defense zone: approx. 0.618–0.620.
🎯 First resistance: 0.634–0.638.
📈 If price defends the zone, reclaims structure on the 15m, and confirms continuation, we could look for the 1H highs again.
🔴 If price loses the range and accepts prices below it, the bullish thesis weakens and will need to be reassessed.
⚠️ We don’t anticipate the breakout: we wait for confirmation.
At NEXO Trading, we look for structure, liquidity, a retest, and clear triggers before trading.
Range defense or a false breakout? The market has the answer.
#TIA #Celestia #NEXOTrading #BinanceSquare #Trading
📊 We’ve been tracking a potential bullish setup in Celestia.
Price formed a range, swept liquidity below it, and then managed to break above its upper boundary.
Now we’re watching something key: can buyers defend the range they previously broke above?
🔎 Our NEXO scenario:
🟢 Defense zone: approx. 0.618–0.620.
🎯 First resistance: 0.634–0.638.
📈 If price defends the zone, reclaims structure on the 15m, and confirms continuation, we could look for the 1H highs again.
🔴 If price loses the range and accepts prices below it, the bullish thesis weakens and will need to be reassessed.
⚠️ We don’t anticipate the breakout: we wait for confirmation.
At NEXO Trading, we look for structure, liquidity, a retest, and clear triggers before trading.
Range defense or a false breakout? The market has the answer.
#TIA #Celestia #NEXOTrading #BinanceSquare #Trading
1
331
🚨 BTC: IS IT GETTING READY FOR THE U.S. ELECTIONS? 🇺🇸
📊 Bitcoin closed the week back above 80,000 USDT after sweeping the lows at 79,732.
The U.S. congressional elections are coming up on November 3.
👀 My hypothesis: What if BTC is building up an accumulation phase before a major move?
I see two possible scenarios:
🔹 Scenario 1: BTC continues moving sideways until the elections, then volatility expands sharply.
🔹 Scenario 2: BTC starts rising beforehand, reclaims 84,340, and targets 87,385 USDT.
📈 From its current price of 82,432, BTC only needs to rise 6% to reclaim that recent high.
Let’s remember that Bitcoin rallied sharply after the 2024 presidential election.
⚠️ That doesn’t mean it will happen again. It could also break downward.
🎯 At NEXO Trading, we don’t try to predict the future. We lay out scenarios and wait for confirmation.
💬 Is BTC accumulating ahead of November or preparing for another drop?
#BTC #Bitcoin #NEXOTrading #BinanceSquare #Crypto
🚨 BTC: IS IT GETTING READY FOR THE U.S. ELECTIONS? 🇺🇸
📊 Bitcoin closed the week back above 80,000 USDT after sweeping the lows at 79,732.
The U.S. congressional elections are coming up on November 3.
👀 My hypothesis: What if BTC is building up an accumulation phase before a major move?
I see two possible scenarios:
🔹 Scenario 1: BTC continues moving sideways until the elections, then volatility expands sharply.
🔹 Scenario 2: BTC starts rising beforehand, reclaims 84,340, and targets 87,385 USDT.
📈 From its current price of 82,432, BTC only needs to rise 6% to reclaim that recent high.
Let’s remember that Bitcoin rallied sharply after the 2024 presidential election.
⚠️ That doesn’t mean it will happen again. It could also break downward.
🎯 At NEXO Trading, we don’t try to predict the future. We lay out scenarios and wait for confirmation.
💬 Is BTC accumulating ahead of November or preparing for another drop?
#BTC #Bitcoin #NEXOTrading #BinanceSquare #Crypto
📊 Bitcoin closed the week back above 80,000 USDT after sweeping the lows at 79,732.
The U.S. congressional elections are coming up on November 3.
👀 My hypothesis: What if BTC is building up an accumulation phase before a major move?
I see two possible scenarios:
🔹 Scenario 1: BTC continues moving sideways until the elections, then volatility expands sharply.
🔹 Scenario 2: BTC starts rising beforehand, reclaims 84,340, and targets 87,385 USDT.
📈 From its current price of 82,432, BTC only needs to rise 6% to reclaim that recent high.
Let’s remember that Bitcoin rallied sharply after the 2024 presidential election.
⚠️ That doesn’t mean it will happen again. It could also break downward.
🎯 At NEXO Trading, we don’t try to predict the future. We lay out scenarios and wait for confirmation.
💬 Is BTC accumulating ahead of November or preparing for another drop?
#BTC #Bitcoin #NEXOTrading #BinanceSquare #Crypto
1
2
629
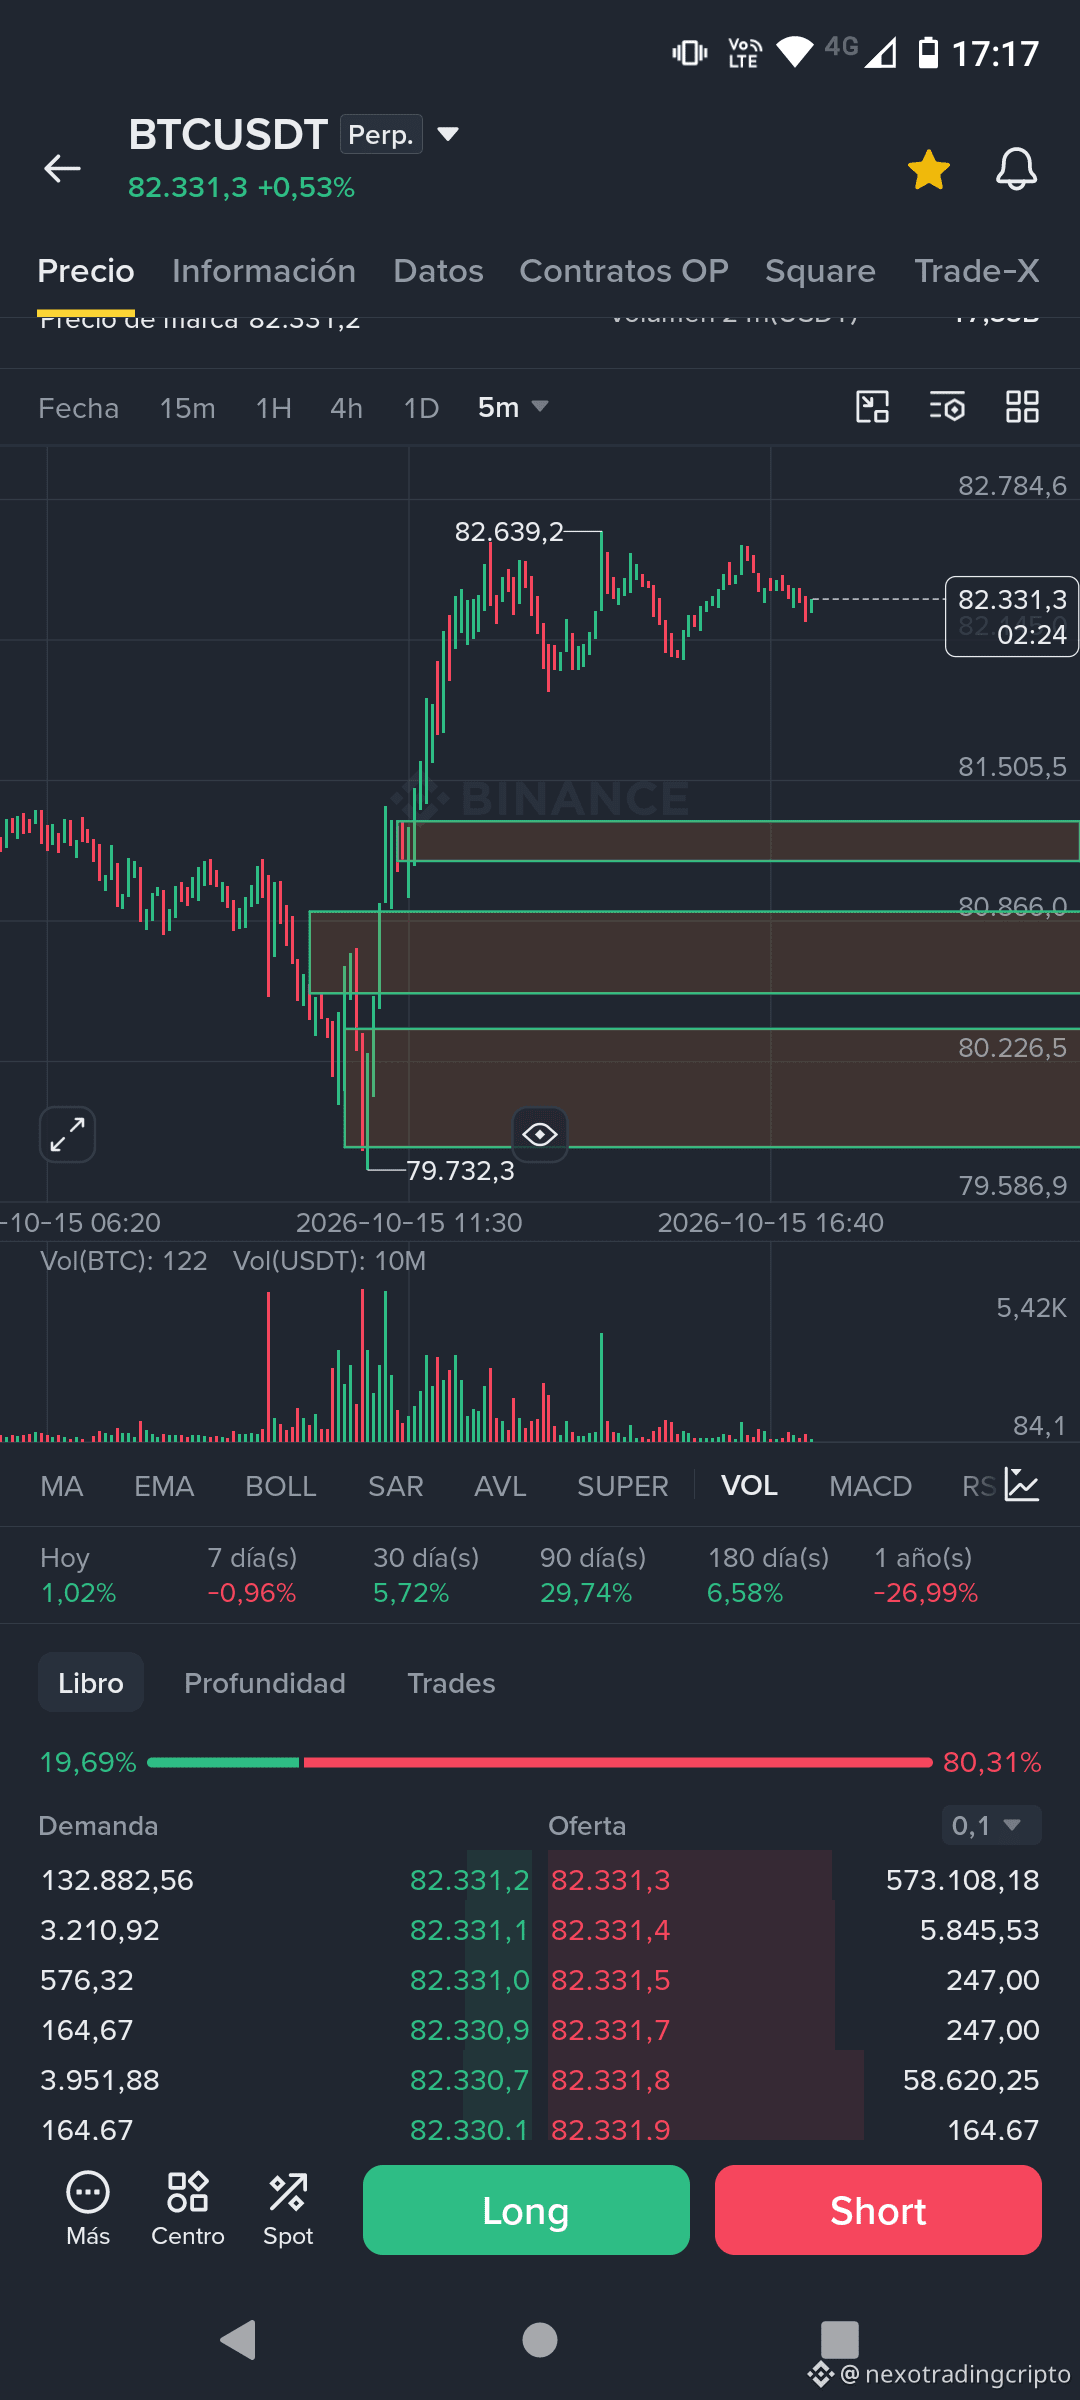
> 🚨 BTC: Where could the next reaction occur?
The sweep below 80.985 has already happened, and BTC recovered to 81.600–82.000.
Now I don’t want to chase price. I want to see where demand shows up again.
🟢 1. Direct continuation
If it breaks 82.600–82.650, holds above and retests, that zone could become new demand.
🟡 2. Intermediate pullback
Zone to watch: 81.900–82.100.
I want to see rejection, lack of acceptance below, and a recovery of structure.
🟢 3. Deep pullback
5m demand: 81.100–81.300.
If it comes back there, I won’t buy blindly:
demand → rejection/sweep → recovery → microstructure break → retest.
If that zone fails and price is accepted below it, 80.200–80.900 comes back into play, followed by 79.700–80.200.
The idea remains the same:
don’t guess the move; wait for confirmation.
Above, 82.600–82.650 remains the first test.
> 🚨 BTC: Where could the next reaction occur?
The sweep below 80.985 has already happened, and BTC recovered to 81.600–82.000.
Now I don’t want to chase price. I want to see where demand shows up again.
🟢 1. Direct continuation
If it breaks 82.600–82.650, holds above and retests, that zone could become new demand.
🟡 2. Intermediate pullback
Zone to watch: 81.900–82.100.
I want to see rejection, lack of acceptance below, and a recovery of structure.
🟢 3. Deep pullback
5m demand: 81.100–81.300.
If it comes back there, I won’t buy blindly:
demand → rejection/sweep → recovery → microstructure break → retest.
If that zone fails and price is accepted below it, 80.200–80.900 comes back into play, followed by 79.700–80.200.
The idea remains the same:
don’t guess the move; wait for confirmation.
Above, 82.600–82.650 remains the first test.
The sweep below 80.985 has already happened, and BTC recovered to 81.600–82.000.
Now I don’t want to chase price. I want to see where demand shows up again.
🟢 1. Direct continuation
If it breaks 82.600–82.650, holds above and retests, that zone could become new demand.
🟡 2. Intermediate pullback
Zone to watch: 81.900–82.100.
I want to see rejection, lack of acceptance below, and a recovery of structure.
🟢 3. Deep pullback
5m demand: 81.100–81.300.
If it comes back there, I won’t buy blindly:
demand → rejection/sweep → recovery → microstructure break → retest.
If that zone fails and price is accepted below it, 80.200–80.900 comes back into play, followed by 79.700–80.200.
The idea remains the same:
don’t guess the move; wait for confirmation.
Above, 82.600–82.650 remains the first test.
3
732
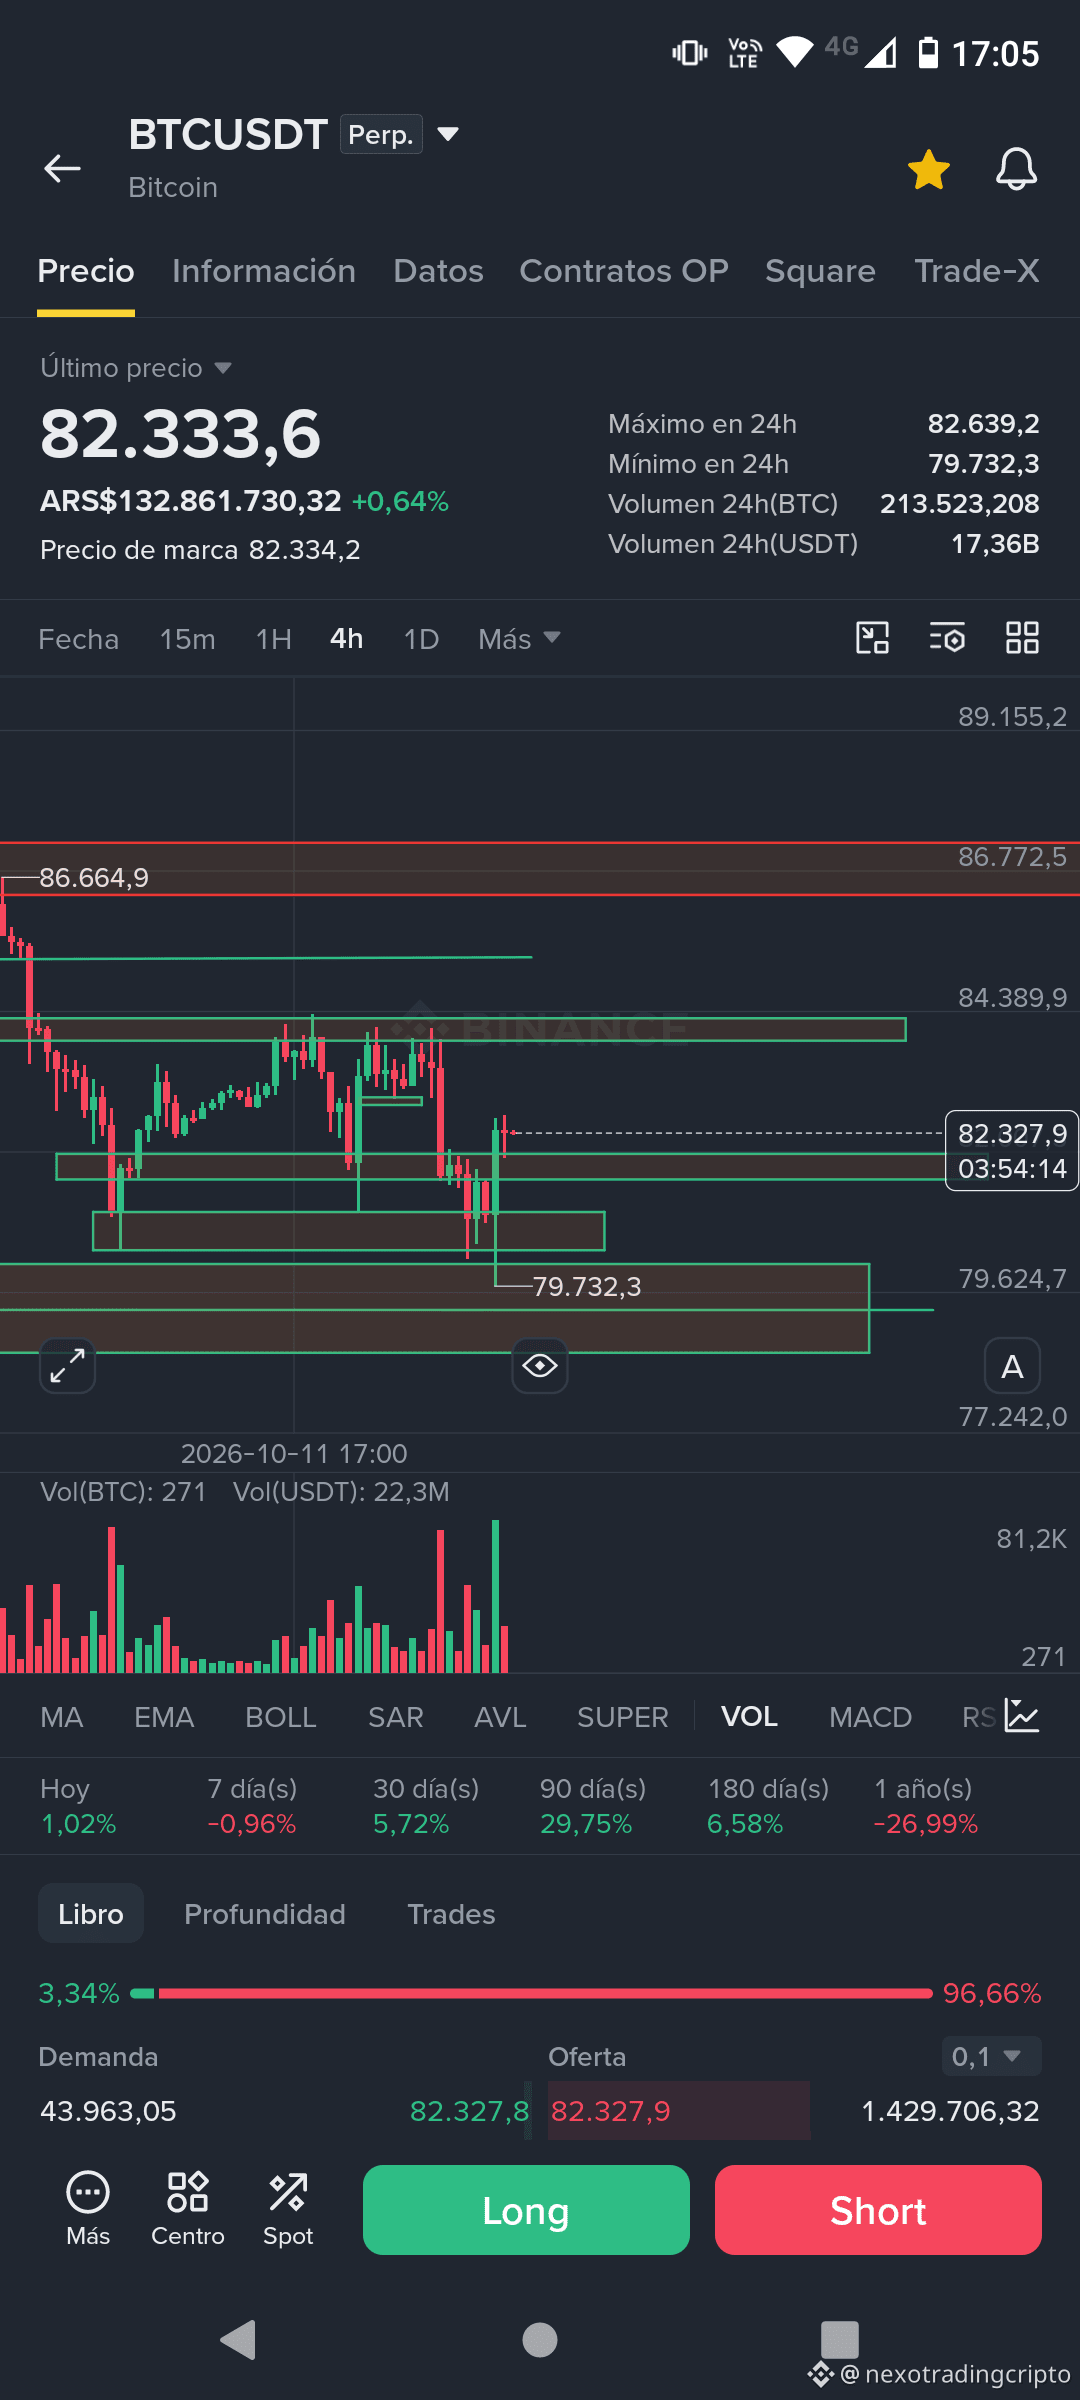
🚨 BTC: The sweep happened. Now it’s time to look up.
In my previous post, I laid out a very simple condition:
🔴 If sellers were really in control, BTC had to break 80.985 and accept price below it.
Price did something different.
It dropped to the 79.700 area, took liquidity below 80.985, and then quickly recovered to 81.600–82.000.
That doesn’t mean BTC is automatically bullish.
It means that, for now, the breakdown failed to gain acceptance.
And now the question changes.
I’m no longer looking only at what happens below the range.
👀 Now I want to see what BTC does at the top of the range.
First: 82.600–82.650.
If it breaks through, holds, and accepts above, the next structural target is in the 83.800–84.300 area.
And that’s the real test.
🟢 Recovery + acceptance above = potential for further expansion.
🔴 Strong rejection at the top of the range = the range is still intact, and there’s still no bullish confirmation.
The important thing wasn’t to guess the bottom.
It was to wait for the market to show whether that drop was a real breakdown or a liquidity grab.
For now, liquidity was taken and price moved back inside.
Now let’s see what the top of the range has to say.
📌 This is not an entry signal. It’s a read of the structure and possible scenarios.
🚨 BTC: The sweep happened. Now it’s time to look up.
In my previous post, I laid out a very simple condition:
🔴 If sellers were really in control, BTC had to break 80.985 and accept price below it.
Price did something different.
It dropped to the 79.700 area, took liquidity below 80.985, and then quickly recovered to 81.600–82.000.
That doesn’t mean BTC is automatically bullish.
It means that, for now, the breakdown failed to gain acceptance.
And now the question changes.
I’m no longer looking only at what happens below the range.
👀 Now I want to see what BTC does at the top of the range.
First: 82.600–82.650.
If it breaks through, holds, and accepts above, the next structural target is in the 83.800–84.300 area.
And that’s the real test.
🟢 Recovery + acceptance above = potential for further expansion.
🔴 Strong rejection at the top of the range = the range is still intact, and there’s still no bullish confirmation.
The important thing wasn’t to guess the bottom.
It was to wait for the market to show whether that drop was a real breakdown or a liquidity grab.
For now, liquidity was taken and price moved back inside.
Now let’s see what the top of the range has to say.
📌 This is not an entry signal. It’s a read of the structure and possible scenarios.
In my previous post, I laid out a very simple condition:
🔴 If sellers were really in control, BTC had to break 80.985 and accept price below it.
Price did something different.
It dropped to the 79.700 area, took liquidity below 80.985, and then quickly recovered to 81.600–82.000.
That doesn’t mean BTC is automatically bullish.
It means that, for now, the breakdown failed to gain acceptance.
And now the question changes.
I’m no longer looking only at what happens below the range.
👀 Now I want to see what BTC does at the top of the range.
First: 82.600–82.650.
If it breaks through, holds, and accepts above, the next structural target is in the 83.800–84.300 area.
And that’s the real test.
🟢 Recovery + acceptance above = potential for further expansion.
🔴 Strong rejection at the top of the range = the range is still intact, and there’s still no bullish confirmation.
The important thing wasn’t to guess the bottom.
It was to wait for the market to show whether that drop was a real breakdown or a liquidity grab.
For now, liquidity was taken and price moved back inside.
Now let’s see what the top of the range has to say.
📌 This is not an entry signal. It’s a read of the structure and possible scenarios.
5
5k
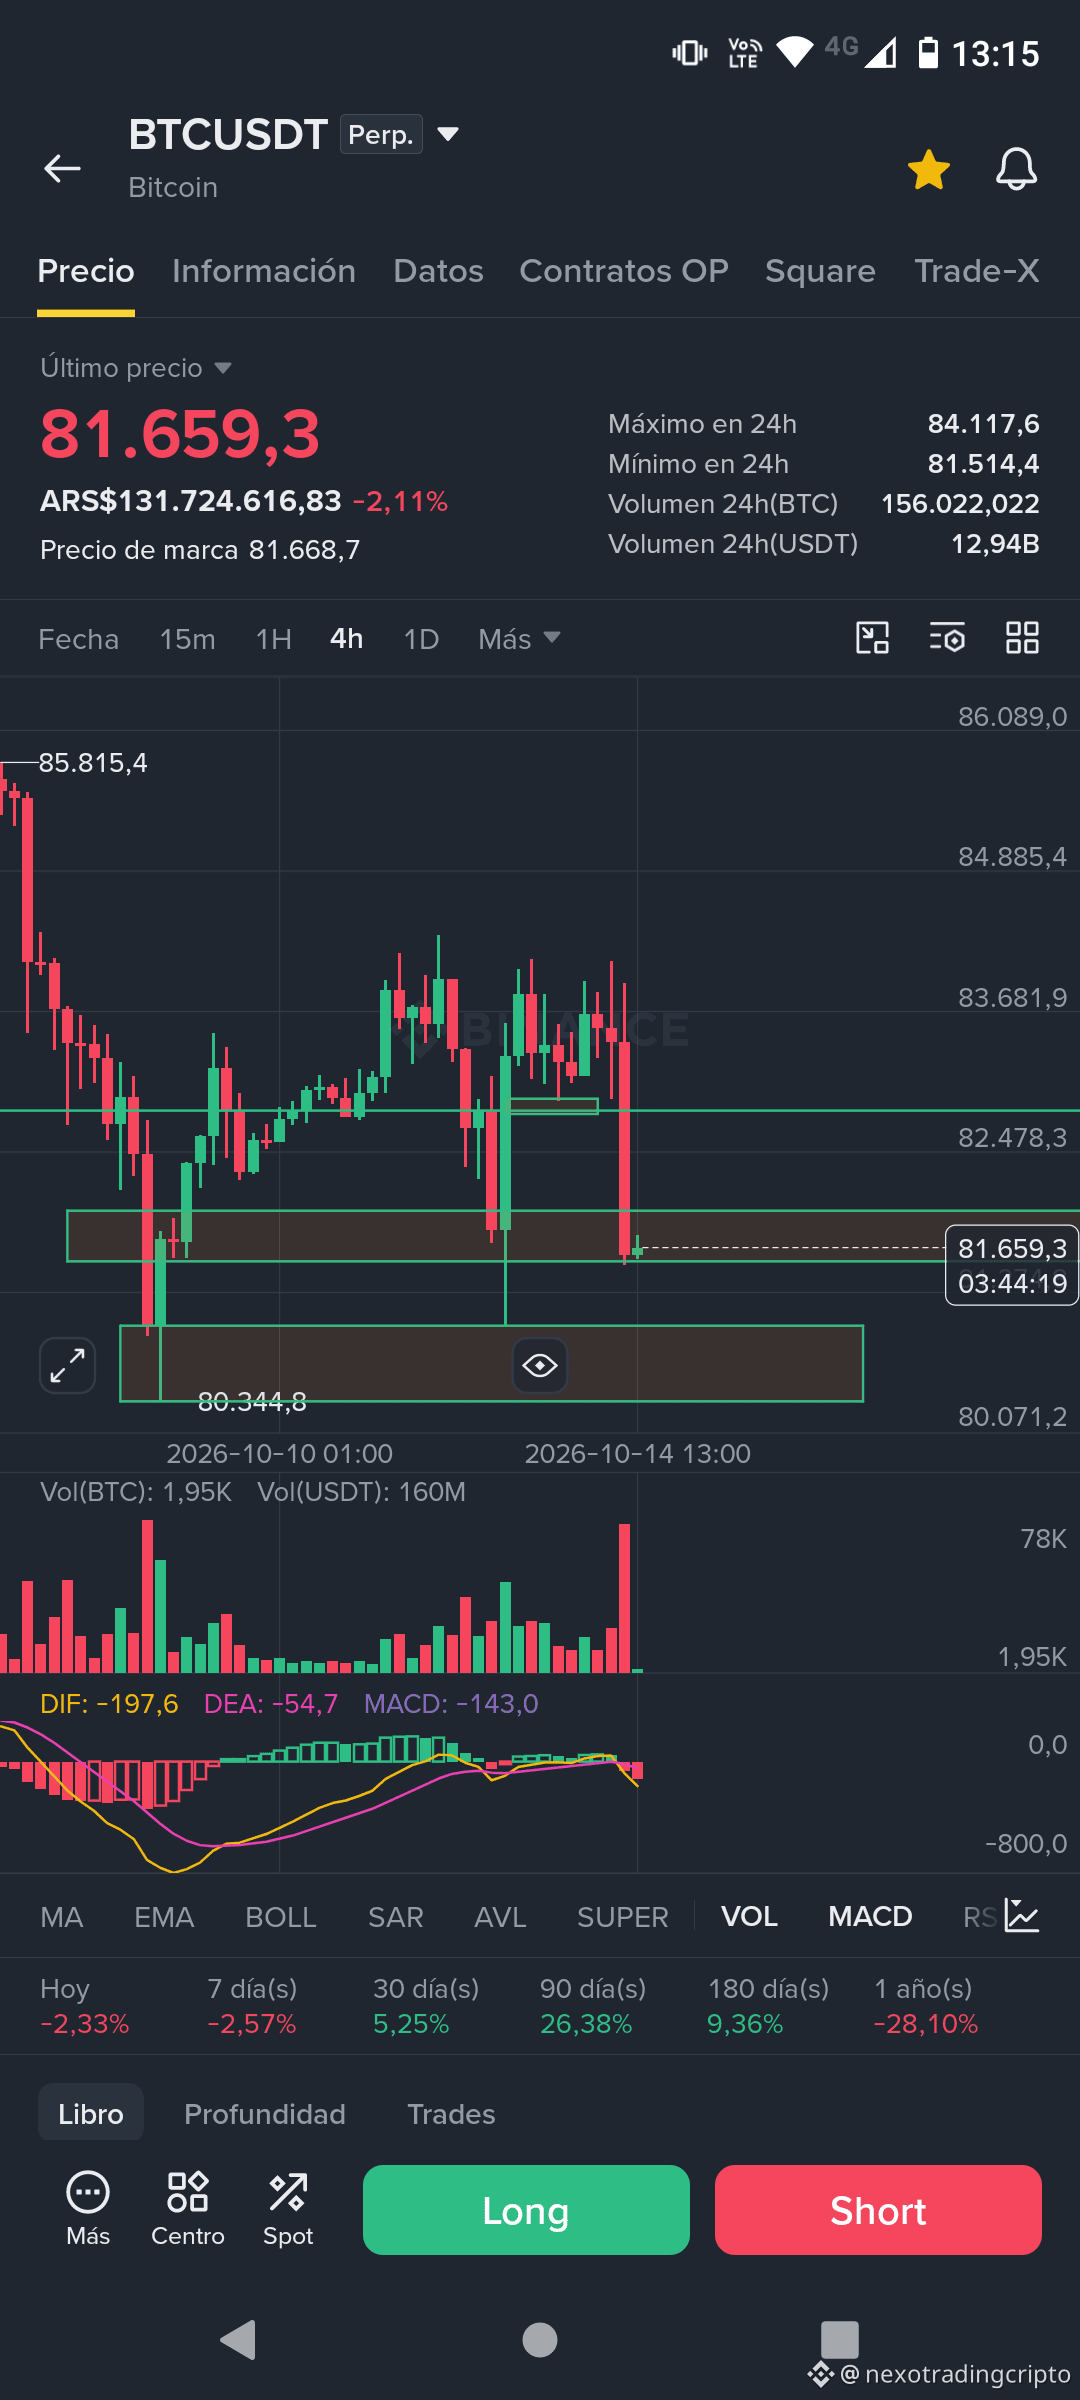
> 🚨 BTC: this move is starting to remind me way too much of Friday…
A massive bearish 4H candle. Huge volume. The price was violently pushed down and, at first glance, it looks like everything has broken.
But one important thing is still missing: the main 4H structure is still intact.
The zone I’ve marked is around 80.985 USDT.
And this is where things get interesting.
On Friday, we saw something similar: a sharp move down, the feeling of a complete breakdown… and then the market ended up recovering its structure.
I’m not saying it will happen again.
But I’m not going to sell BTC just because a huge red candle appeared.
If sellers are really in control, I want to see them do something very simple:
🔴 break 80.985 and accept prices below it.
If they can’t do that, sweep that zone, and BTC starts recovering 81.600–82.000, then I’ll start asking myself something:
Did all this selling volume really manage to break the market… or did it just clear liquidity before a recovery?
Because a lot of volume + a big move, without breaking the structural low, can turn into a very different signal from what it seems at first glance.
⚠️ No LONG yet.
⚠️ I don’t want to chase a SHORT after the plunge either.
NEXO is waiting for the reaction.
First, let the market show who really won this battle.
👀 80.985. That’s the gateway.
#BTC #Bitcoin #Trading #Crypto #BinanceSquare #NEXOTrading
> 🚨 BTC: this move is starting to remind me way too much of Friday…
A massive bearish 4H candle. Huge volume. The price was violently pushed down and, at first glance, it looks like everything has broken.
But one important thing is still missing: the main 4H structure is still intact.
The zone I’ve marked is around 80.985 USDT.
And this is where things get interesting.
On Friday, we saw something similar: a sharp move down, the feeling of a complete breakdown… and then the market ended up recovering its structure.
I’m not saying it will happen again.
But I’m not going to sell BTC just because a huge red candle appeared.
If sellers are really in control, I want to see them do something very simple:
🔴 break 80.985 and accept prices below it.
If they can’t do that, sweep that zone, and BTC starts recovering 81.600–82.000, then I’ll start asking myself something:
Did all this selling volume really manage to break the market… or did it just clear liquidity before a recovery?
Because a lot of volume + a big move, without breaking the structural low, can turn into a very different signal from what it seems at first glance.
⚠️ No LONG yet.
⚠️ I don’t want to chase a SHORT after the plunge either.
NEXO is waiting for the reaction.
First, let the market show who really won this battle.
👀 80.985. That’s the gateway.
#BTC #Bitcoin #Trading #Crypto #BinanceSquare #NEXOTrading
A massive bearish 4H candle. Huge volume. The price was violently pushed down and, at first glance, it looks like everything has broken.
But one important thing is still missing: the main 4H structure is still intact.
The zone I’ve marked is around 80.985 USDT.
And this is where things get interesting.
On Friday, we saw something similar: a sharp move down, the feeling of a complete breakdown… and then the market ended up recovering its structure.
I’m not saying it will happen again.
But I’m not going to sell BTC just because a huge red candle appeared.
If sellers are really in control, I want to see them do something very simple:
🔴 break 80.985 and accept prices below it.
If they can’t do that, sweep that zone, and BTC starts recovering 81.600–82.000, then I’ll start asking myself something:
Did all this selling volume really manage to break the market… or did it just clear liquidity before a recovery?
Because a lot of volume + a big move, without breaking the structural low, can turn into a very different signal from what it seems at first glance.
⚠️ No LONG yet.
⚠️ I don’t want to chase a SHORT after the plunge either.
NEXO is waiting for the reaction.
First, let the market show who really won this battle.
👀 80.985. That’s the gateway.
#BTC #Bitcoin #Trading #Crypto #BinanceSquare #NEXOTrading
1
4
3.3k
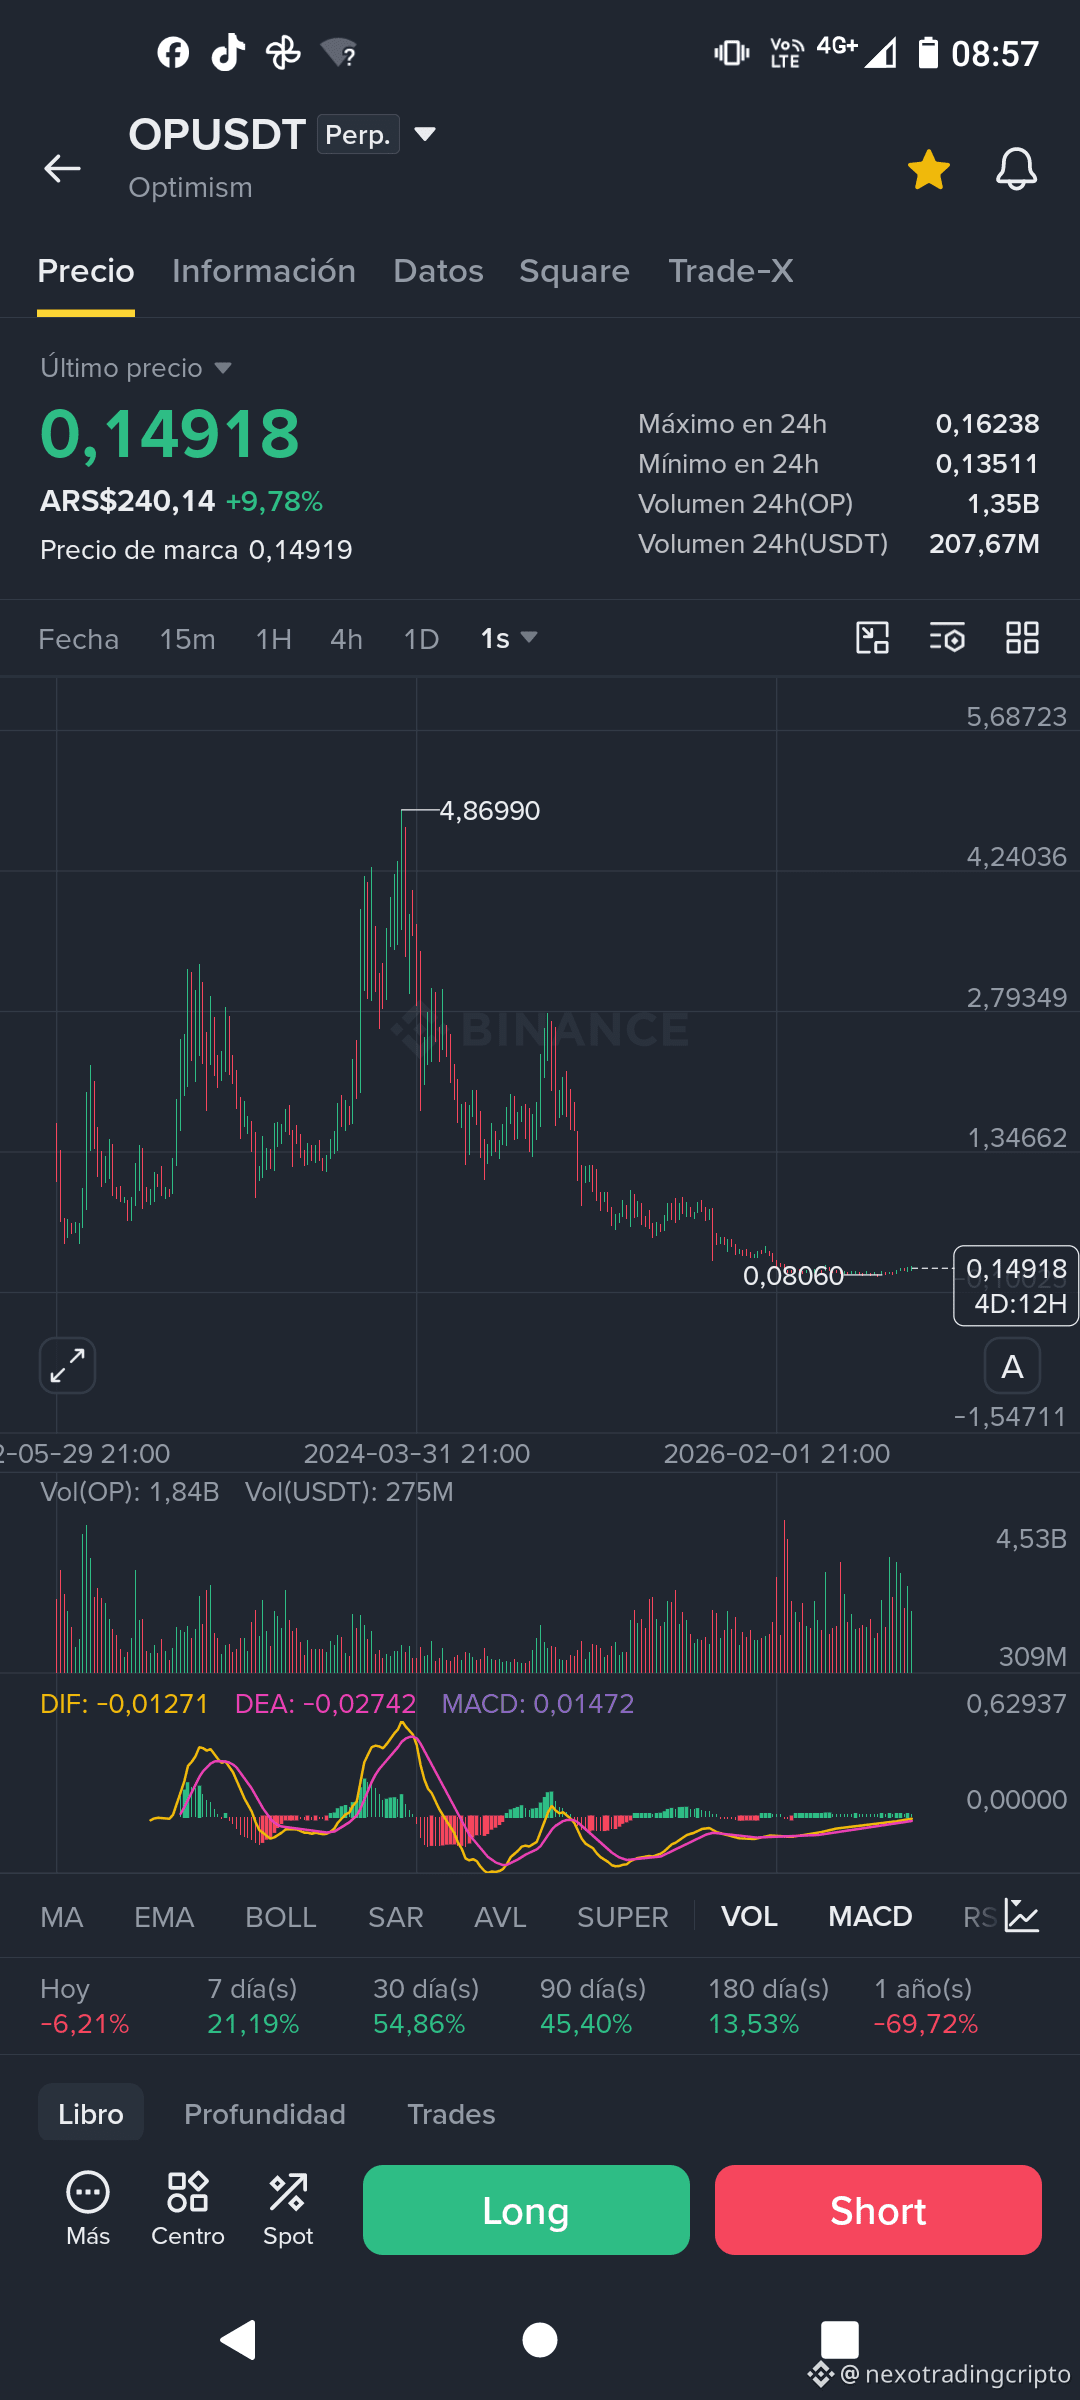
OP (Optimism): long-term opportunity or low-price trap?
OP is trading near USD 0.149 today. It has fallen dramatically from its all-time highs, which can make it look “like a bargain.” But a low price doesn’t automatically mean an asset is cheap.
What’s interesting is that Optimism has a real project behind it: infrastructure for scaling Ethereum, the OP Stack, and the idea of the Superchain, which aims to connect multiple networks built on that technology.
The weak point is the token: for a long time, ecosystem growth didn’t translate directly into demand for OP. There’s also still a risk of dilution from tokens that aren’t in circulation.
The positive side is that Optimism is trying to improve this value capture, including OP buyback programs funded with part of the ecosystem’s revenue.
So the thesis wouldn’t be:
❌ “It’s worth USD 0.15, so it’s sure to go back to USD 4.”
It would be:
✅ “There’s technology, adoption, and an effort to improve the token’s economics. If that works, a small position at these prices could offer an interesting risk/reward profile.”
For example, USD 100 today would buy approximately 669 OP. If the project fails, that capital could lose much of its value. But if OP captures value again over the next several years and returns to much higher levels, a small position could become an interesting asymmetric bet.
This isn’t a buy recommendation. It’s an idea to explore with capital you can afford to hold and potentially lose.
📌 With investments like this, the important thing isn’t guessing the next move, but understanding what we’re buying, how much we’re risking, and what would need to happen for the thesis to make sense.
Do you see a future for Optimism, or do you think the OP token’s value-capture problem is still too big?
#$OP #$Optimism #Ethereum #Crypto #Altcoins #LongTerm #BinanceSquare
OP (Optimism): long-term opportunity or low-price trap?
OP is trading near USD 0.149 today. It has fallen dramatically from its all-time highs, which can make it look “like a bargain.” But a low price doesn’t automatically mean an asset is cheap.
What’s interesting is that Optimism has a real project behind it: infrastructure for scaling Ethereum, the OP Stack, and the idea of the Superchain, which aims to connect multiple networks built on that technology.
The weak point is the token: for a long time, ecosystem growth didn’t translate directly into demand for OP. There’s also still a risk of dilution from tokens that aren’t in circulation.
The positive side is that Optimism is trying to improve this value capture, including OP buyback programs funded with part of the ecosystem’s revenue.
So the thesis wouldn’t be:
❌ “It’s worth USD 0.15, so it’s sure to go back to USD 4.”
It would be:
✅ “There’s technology, adoption, and an effort to improve the token’s economics. If that works, a small position at these prices could offer an interesting risk/reward profile.”
For example, USD 100 today would buy approximately 669 OP. If the project fails, that capital could lose much of its value. But if OP captures value again over the next several years and returns to much higher levels, a small position could become an interesting asymmetric bet.
This isn’t a buy recommendation. It’s an idea to explore with capital you can afford to hold and potentially lose.
📌 With investments like this, the important thing isn’t guessing the next move, but understanding what we’re buying, how much we’re risking, and what would need to happen for the thesis to make sense.
Do you see a future for Optimism, or do you think the OP token’s value-capture problem is still too big?
#$OP #$Optimism #Ethereum #Crypto #Altcoins #LongTerm #BinanceSquare
OP is trading near USD 0.149 today. It has fallen dramatically from its all-time highs, which can make it look “like a bargain.” But a low price doesn’t automatically mean an asset is cheap.
What’s interesting is that Optimism has a real project behind it: infrastructure for scaling Ethereum, the OP Stack, and the idea of the Superchain, which aims to connect multiple networks built on that technology.
The weak point is the token: for a long time, ecosystem growth didn’t translate directly into demand for OP. There’s also still a risk of dilution from tokens that aren’t in circulation.
The positive side is that Optimism is trying to improve this value capture, including OP buyback programs funded with part of the ecosystem’s revenue.
So the thesis wouldn’t be:
❌ “It’s worth USD 0.15, so it’s sure to go back to USD 4.”
It would be:
✅ “There’s technology, adoption, and an effort to improve the token’s economics. If that works, a small position at these prices could offer an interesting risk/reward profile.”
For example, USD 100 today would buy approximately 669 OP. If the project fails, that capital could lose much of its value. But if OP captures value again over the next several years and returns to much higher levels, a small position could become an interesting asymmetric bet.
This isn’t a buy recommendation. It’s an idea to explore with capital you can afford to hold and potentially lose.
📌 With investments like this, the important thing isn’t guessing the next move, but understanding what we’re buying, how much we’re risking, and what would need to happen for the thesis to make sense.
Do you see a future for Optimism, or do you think the OP token’s value-capture problem is still too big?
#$OP #$Optimism #Ethereum #Crypto #Altcoins #LongTerm #BinanceSquare
1
161
Question for those who trade Futures 👇
I've been following BTC for several days, and according to my system, no complete setup has appeared yet to justify an entry.
There have been moves. There have been sweeps. There have been impulses.
But movement doesn't mean opportunity.
My question is:
How many of you actually wait for your ENTIRE setup to play out before trading?
Did you trade BTC this past week?
If so, what structure or confirmation did you use?
A screenshot would be even better. I want to compare setups, not PnL.
Sometimes not trading is also part of the system.
#BTC #Futures #Trading #NEXOTrading
Question for those who trade Futures 👇
I've been following BTC for several days, and according to my system, no complete setup has appeared yet to justify an entry.
There have been moves. There have been sweeps. There have been impulses.
But movement doesn't mean opportunity.
My question is:
How many of you actually wait for your ENTIRE setup to play out before trading?
Did you trade BTC this past week?
If so, what structure or confirmation did you use?
A screenshot would be even better. I want to compare setups, not PnL.
Sometimes not trading is also part of the system.
#BTC #Futures #Trading #NEXOTrading
I've been following BTC for several days, and according to my system, no complete setup has appeared yet to justify an entry.
There have been moves. There have been sweeps. There have been impulses.
But movement doesn't mean opportunity.
My question is:
How many of you actually wait for your ENTIRE setup to play out before trading?
Did you trade BTC this past week?
If so, what structure or confirmation did you use?
A screenshot would be even better. I want to compare setups, not PnL.
Sometimes not trading is also part of the system.
#BTC #Futures #Trading #NEXOTrading
137
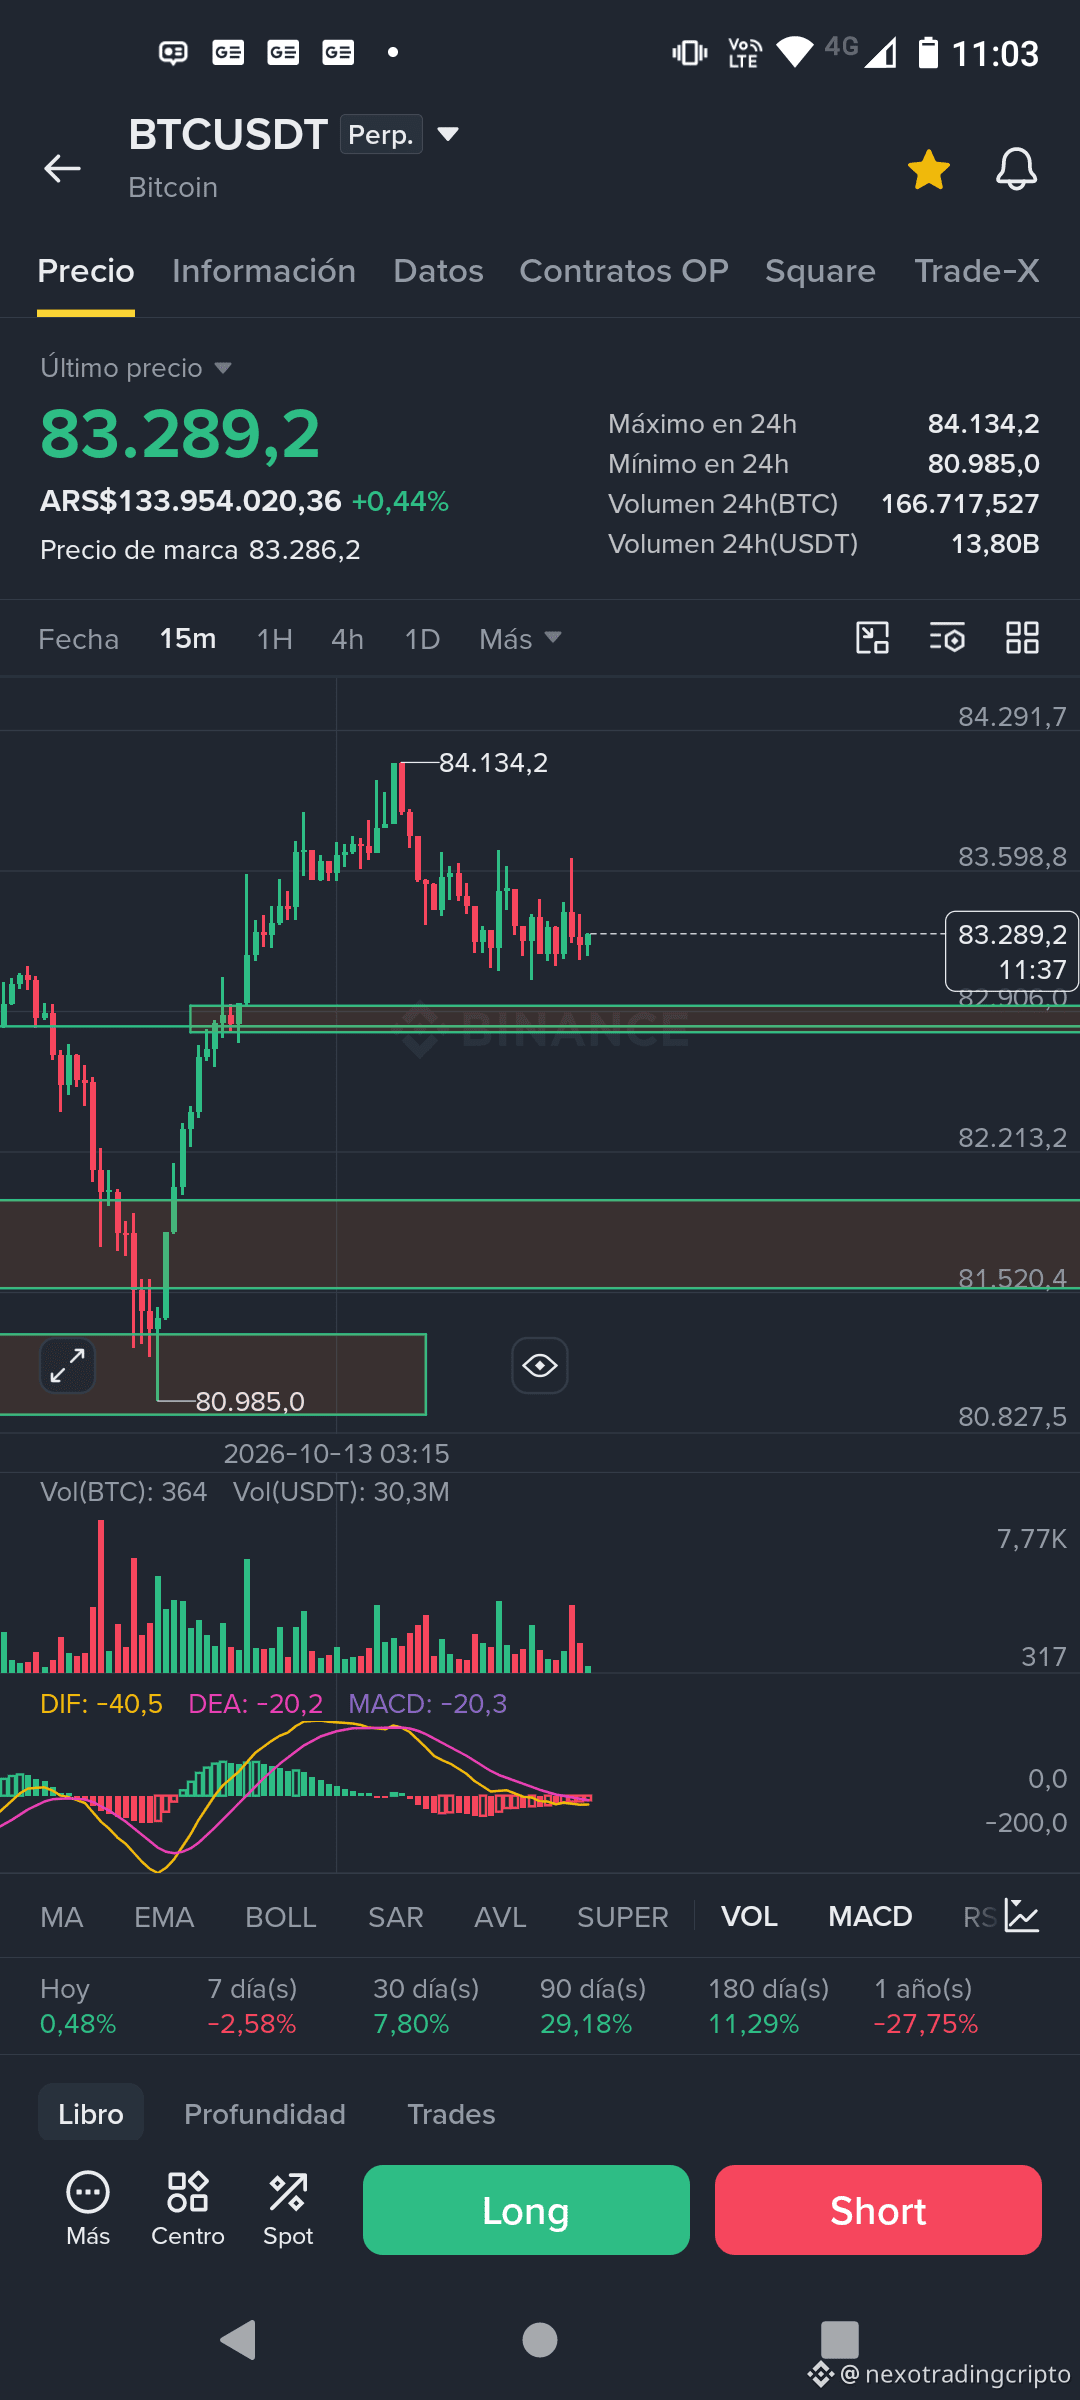
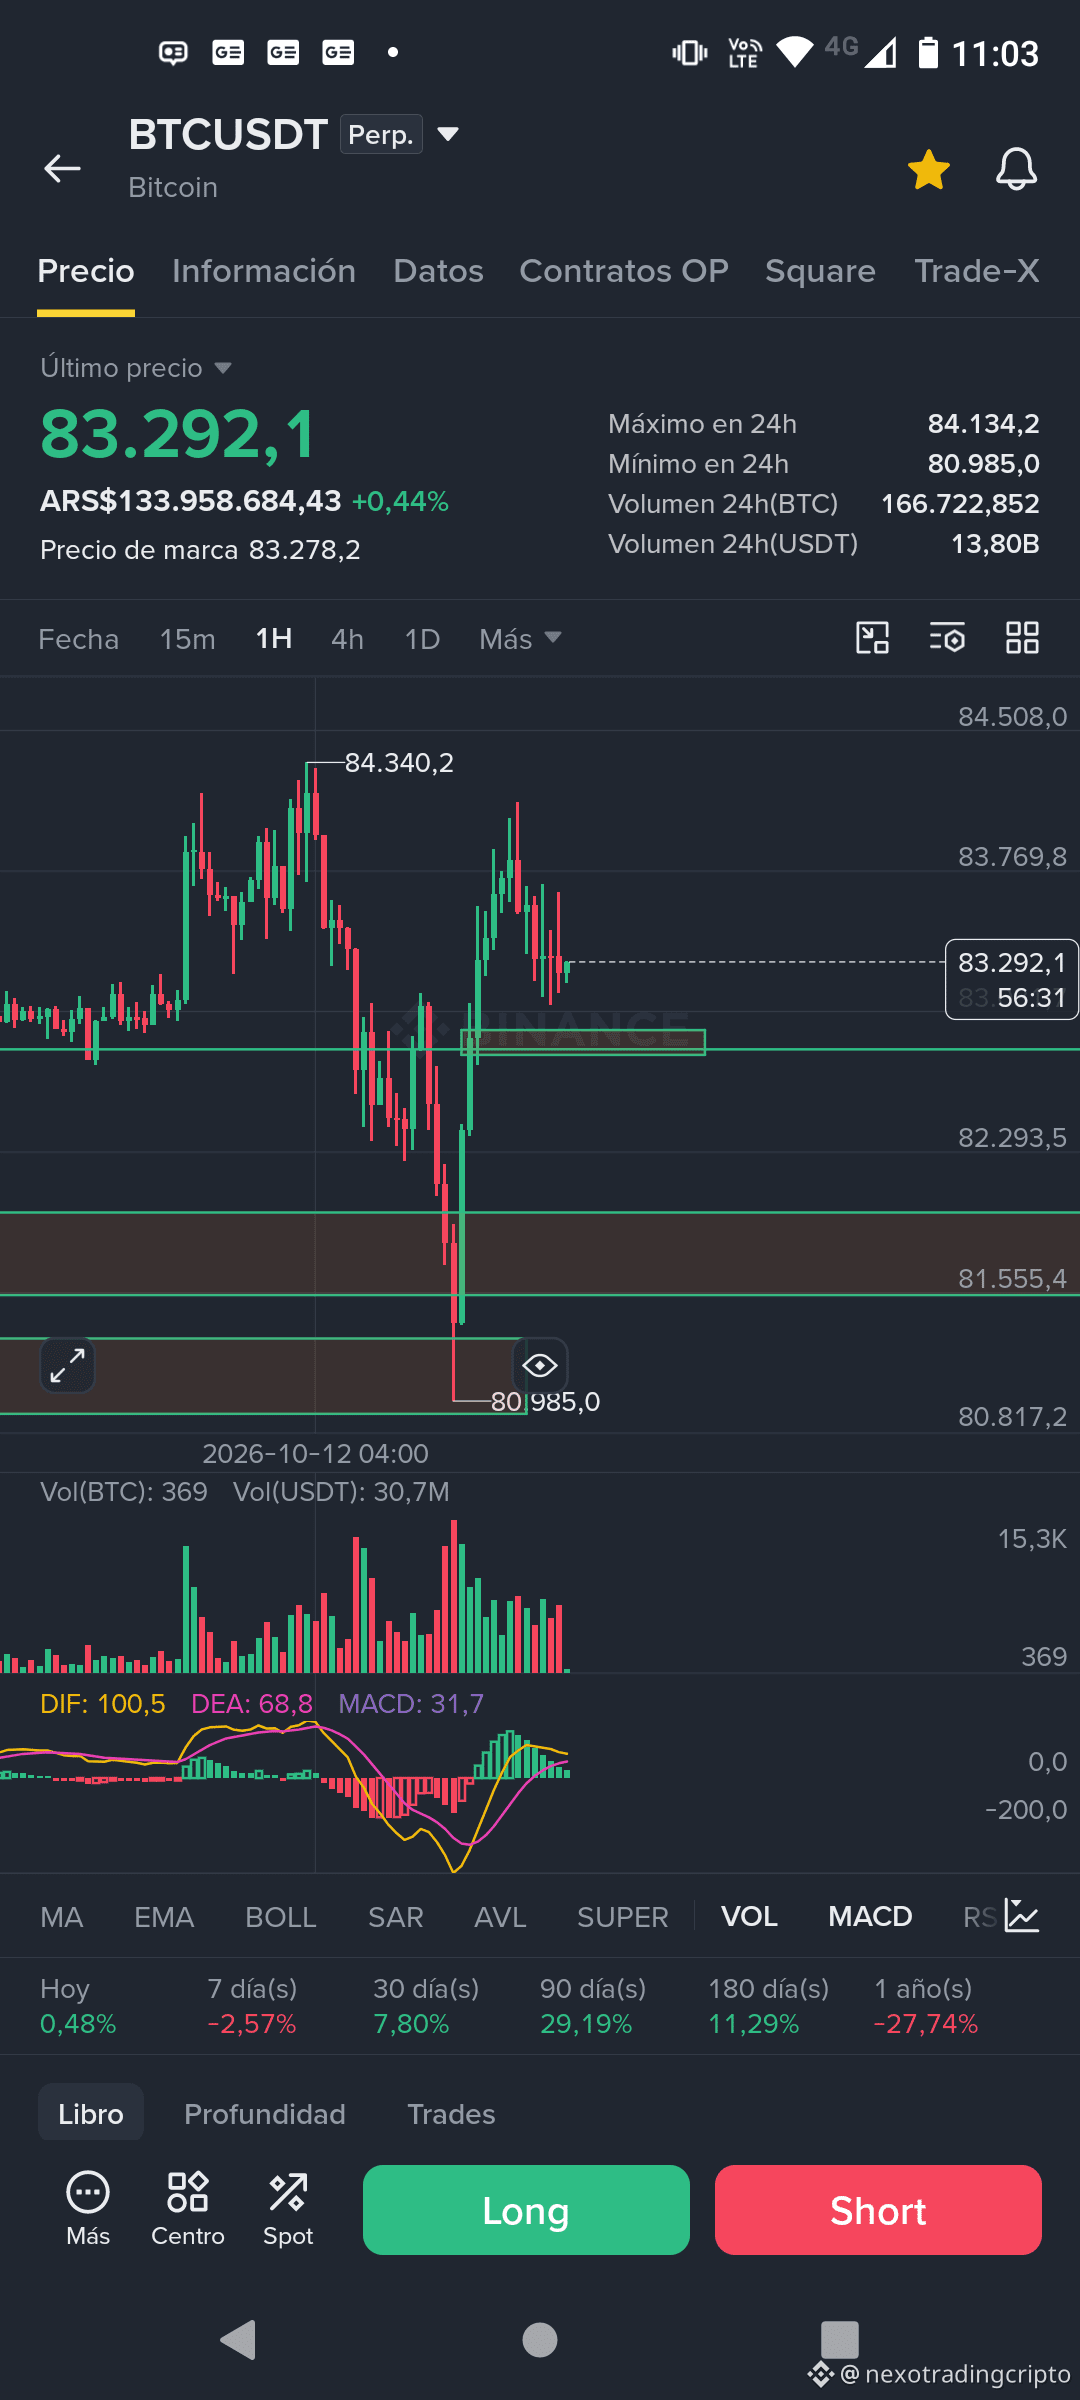
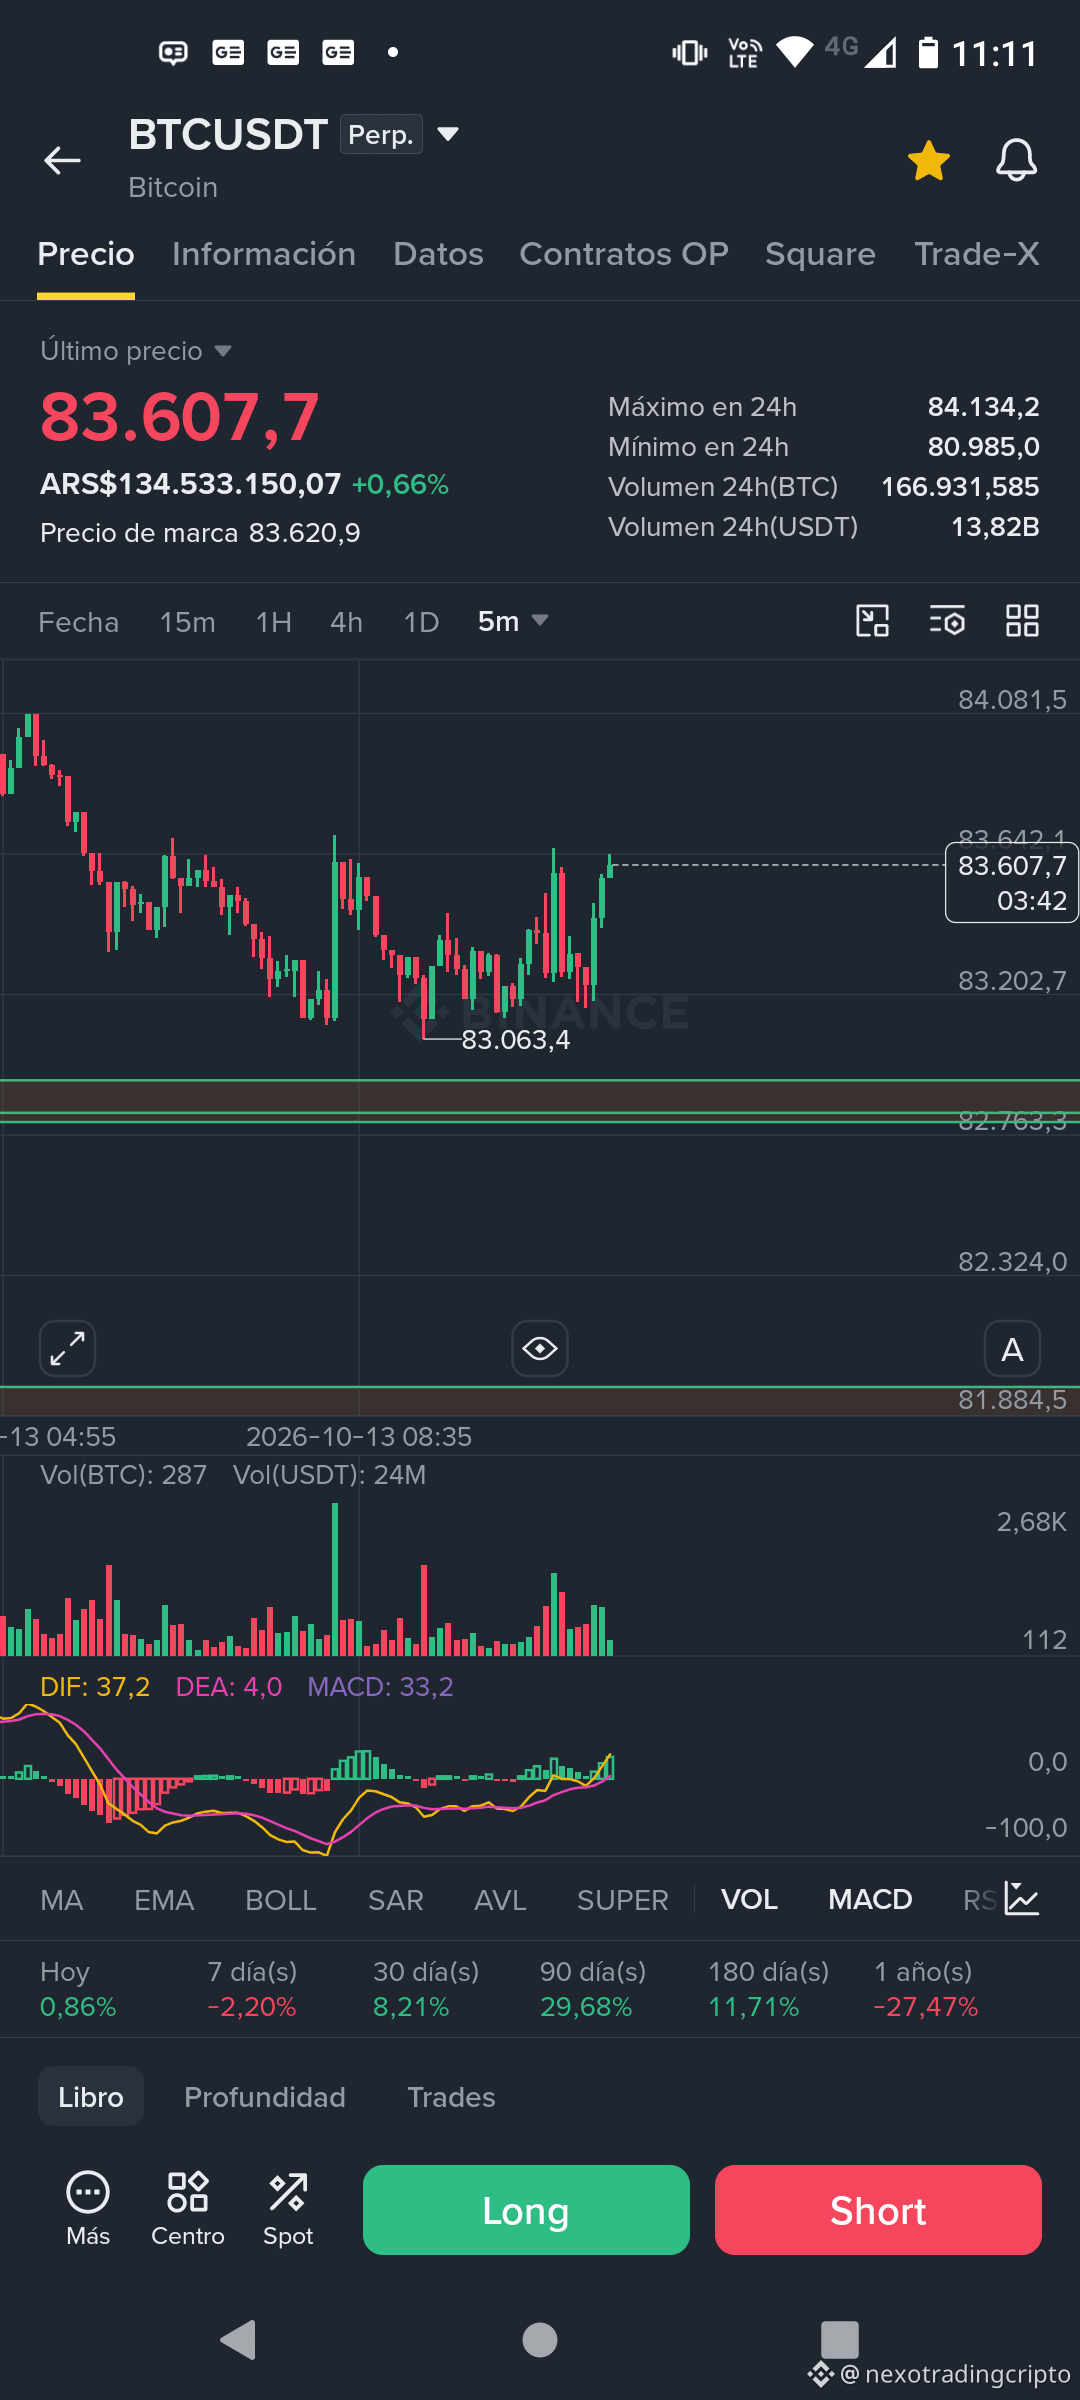
BTC | Structure tracking
On the 5m chart, something interesting is starting to emerge: after the low at 83.063, sellers tried to continue lower but failed to form a new low.
That gives us a clear read:
selling without follow-through → floor defended → microstructure recovery → renewed pressure toward 83.60K.
The context still favors the LONG hypothesis, but we shouldn’t get ahead of ourselves.
The sequence we’re looking for remains:
1H signals → 15m confirms the structure → 5m triggers.
As long as BTC keeps the 83.06K–83.20K zone defended and manages to hold above 83.60K, the bullish read gains strength.
If it loses 83.063 with acceptance, this microstructure is invalidated and it’s time to reassess.
It’s not about guessing the bottom; it’s about waiting for the market to show who’s in control.
#BTC #Bitcoin #PriceAction #Trading #BinanceSquare #NEXOTrading
BTC | Structure tracking
On the 5m chart, something interesting is starting to emerge: after the low at 83.063, sellers tried to continue lower but failed to form a new low.
That gives us a clear read:
selling without follow-through → floor defended → microstructure recovery → renewed pressure toward 83.60K.
The context still favors the LONG hypothesis, but we shouldn’t get ahead of ourselves.
The sequence we’re looking for remains:
1H signals → 15m confirms the structure → 5m triggers.
As long as BTC keeps the 83.06K–83.20K zone defended and manages to hold above 83.60K, the bullish read gains strength.
If it loses 83.063 with acceptance, this microstructure is invalidated and it’s time to reassess.
It’s not about guessing the bottom; it’s about waiting for the market to show who’s in control.
#BTC #Bitcoin #PriceAction #Trading #BinanceSquare #NEXOTrading
On the 5m chart, something interesting is starting to emerge: after the low at 83.063, sellers tried to continue lower but failed to form a new low.
That gives us a clear read:
selling without follow-through → floor defended → microstructure recovery → renewed pressure toward 83.60K.
The context still favors the LONG hypothesis, but we shouldn’t get ahead of ourselves.
The sequence we’re looking for remains:
1H signals → 15m confirms the structure → 5m triggers.
As long as BTC keeps the 83.06K–83.20K zone defended and manages to hold above 83.60K, the bullish read gains strength.
If it loses 83.063 with acceptance, this microstructure is invalidated and it’s time to reassess.
It’s not about guessing the bottom; it’s about waiting for the market to show who’s in control.
#BTC #Bitcoin #PriceAction #Trading #BinanceSquare #NEXOTrading
130
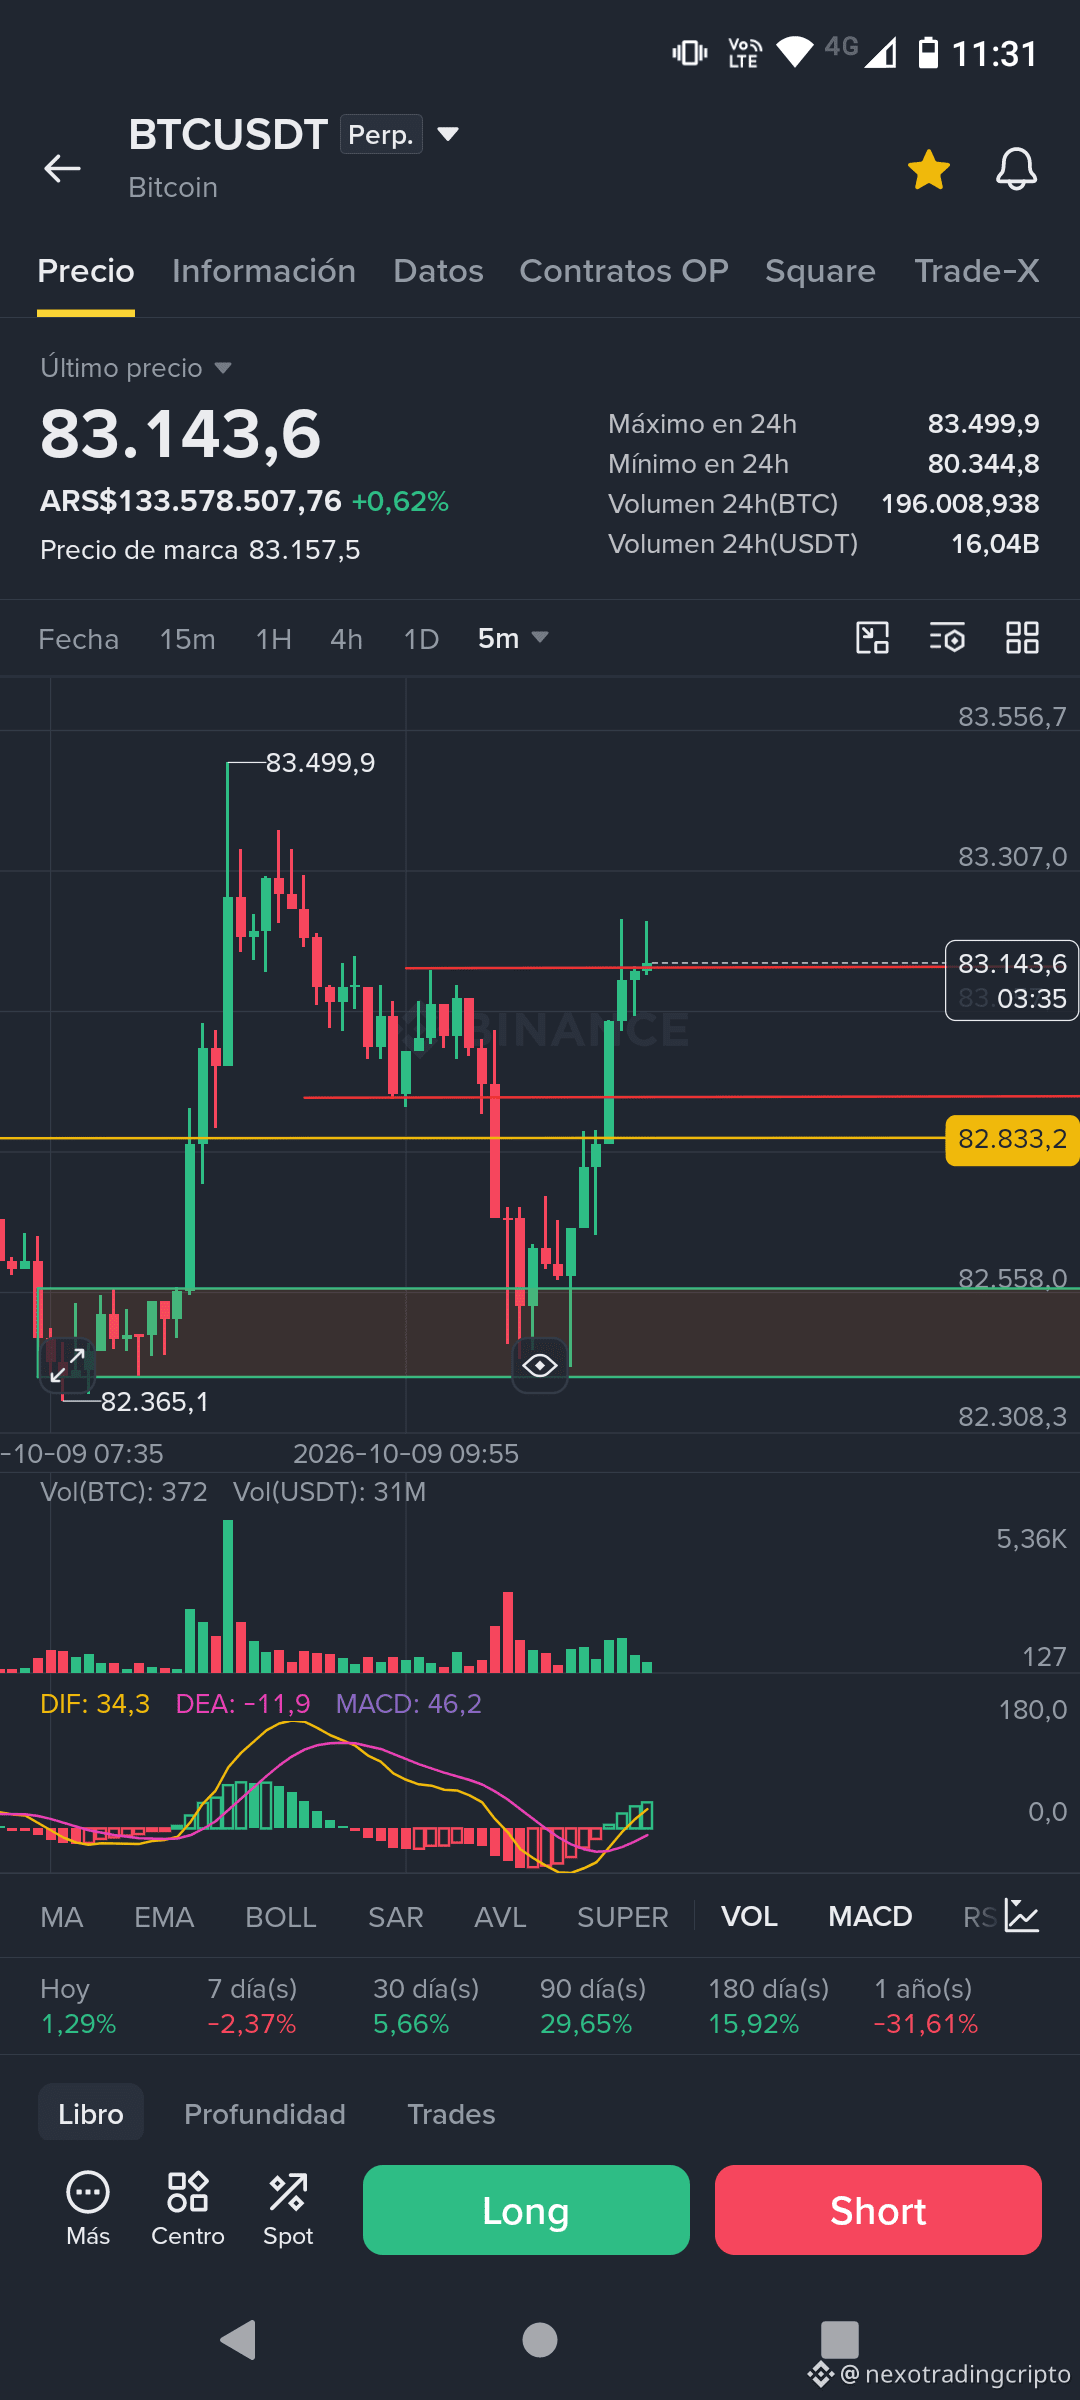
🚨 BTC LONG — NEXO SETUP TO BE CONFIRMED
BTC reclaimed 82.840, regained its microstructure, and is now testing the 5m internal high.
Entry is conditional on a 5m close above 83.10–83.15k. If it doesn’t close above, there’s no trade.
📍 Entry: 83.10–83.18k
🛑 Stop Loss: 82.78k
🎯 TP1: 83.50k
🎯 TP2: 84.20–84.50k
🎯 TP3: 85.20–85.30k
Confirmations: ✅ Liquidity sweep below
✅ Reclaimed 82.840
✅ Bullish displacement
✅ Microstructure reclaimed
⏳ Only the 5m close above the current high is still needed
If it closes above, we interpret that as buyers having regained short-term control.
If it moves back below 82.840 and accepts price there, the setup is invalidated and we’ll reassess from scratch.
⚠️ Study trade: the 4H candle is still open, and the broader context is still taking shape.
NEXO Trading | Context → structure → confirmation → execution.
Educational content, not financial advice.
🚨 BTC LONG — NEXO SETUP TO BE CONFIRMED
BTC reclaimed 82.840, regained its microstructure, and is now testing the 5m internal high.
Entry is conditional on a 5m close above 83.10–83.15k. If it doesn’t close above, there’s no trade.
📍 Entry: 83.10–83.18k
🛑 Stop Loss: 82.78k
🎯 TP1: 83.50k
🎯 TP2: 84.20–84.50k
🎯 TP3: 85.20–85.30k
Confirmations: ✅ Liquidity sweep below
✅ Reclaimed 82.840
✅ Bullish displacement
✅ Microstructure reclaimed
⏳ Only the 5m close above the current high is still needed
If it closes above, we interpret that as buyers having regained short-term control.
If it moves back below 82.840 and accepts price there, the setup is invalidated and we’ll reassess from scratch.
⚠️ Study trade: the 4H candle is still open, and the broader context is still taking shape.
NEXO Trading | Context → structure → confirmation → execution.
Educational content, not financial advice.
BTC reclaimed 82.840, regained its microstructure, and is now testing the 5m internal high.
Entry is conditional on a 5m close above 83.10–83.15k. If it doesn’t close above, there’s no trade.
📍 Entry: 83.10–83.18k
🛑 Stop Loss: 82.78k
🎯 TP1: 83.50k
🎯 TP2: 84.20–84.50k
🎯 TP3: 85.20–85.30k
Confirmations: ✅ Liquidity sweep below
✅ Reclaimed 82.840
✅ Bullish displacement
✅ Microstructure reclaimed
⏳ Only the 5m close above the current high is still needed
If it closes above, we interpret that as buyers having regained short-term control.
If it moves back below 82.840 and accepts price there, the setup is invalidated and we’ll reassess from scratch.
⚠️ Study trade: the 4H candle is still open, and the broader context is still taking shape.
NEXO Trading | Context → structure → confirmation → execution.
Educational content, not financial advice.
91
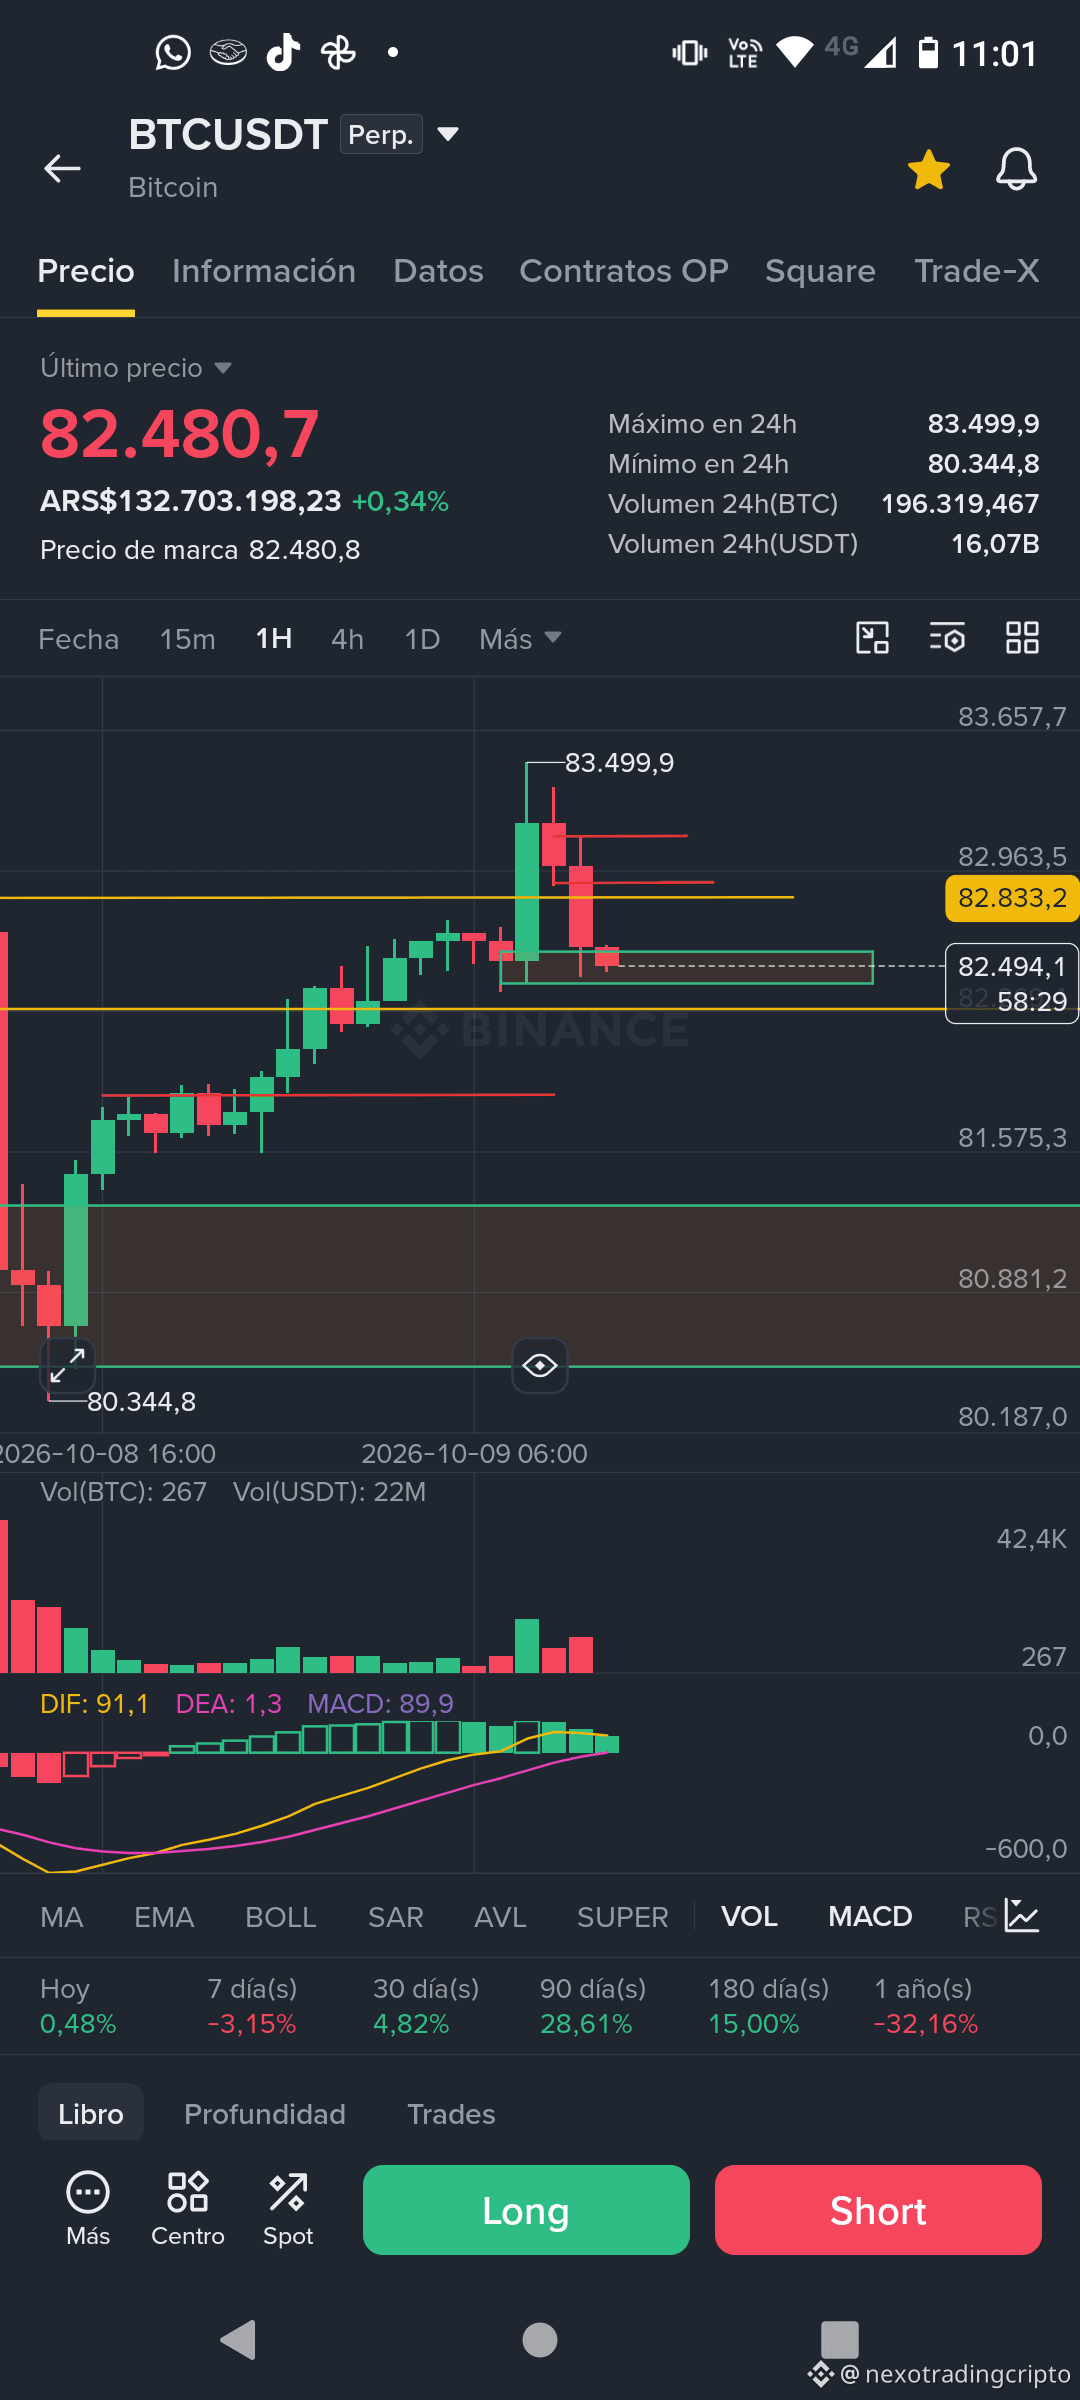
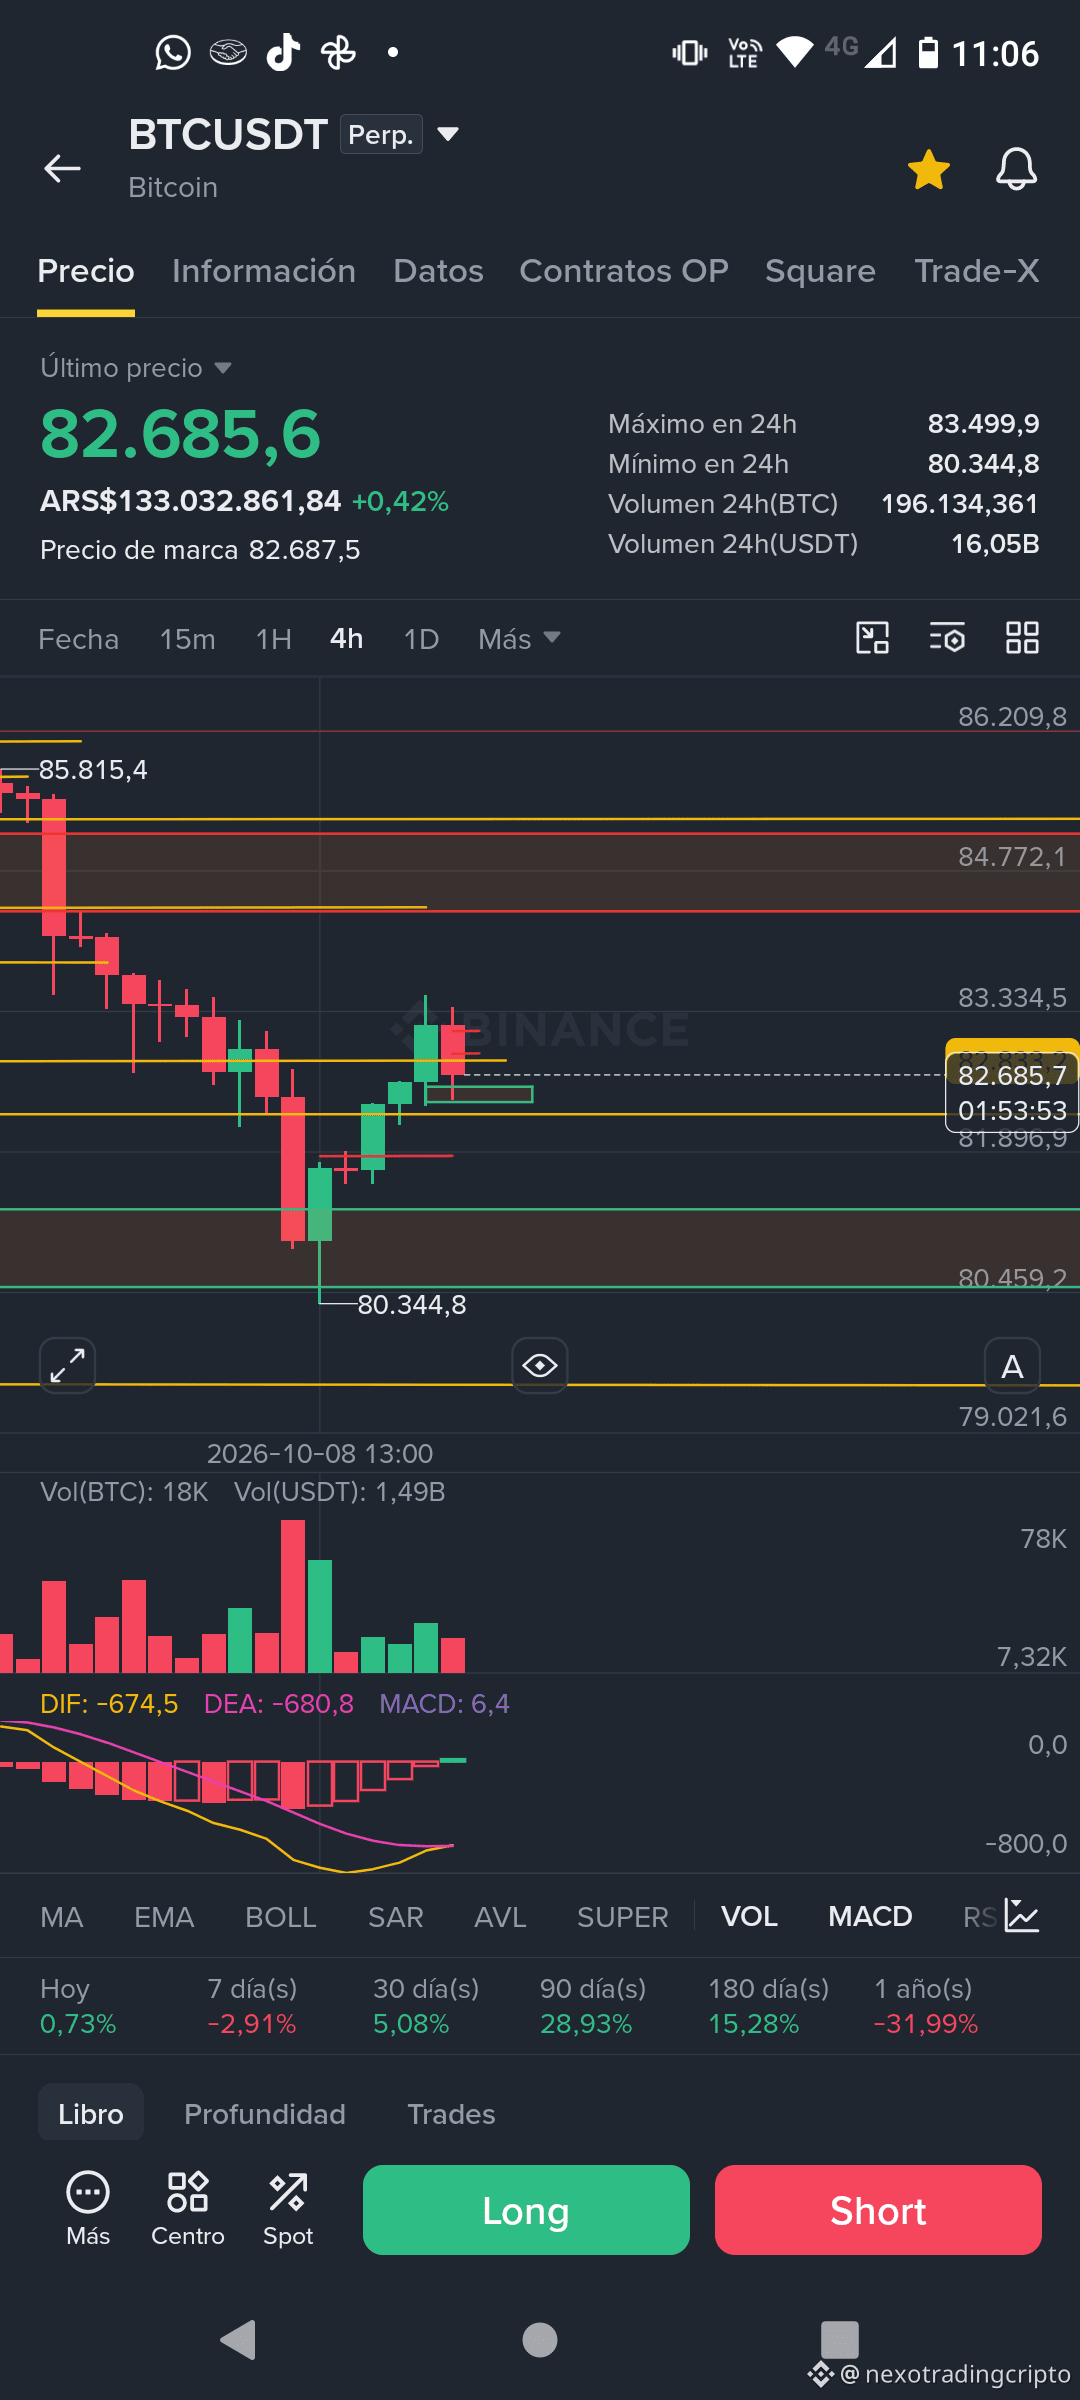
📊 BTC — 1H confirmed the breakdown, but 4H still has the final say
BTC lost 82.840 on the 1H timeframe and closed below it. That is already a sign of weakness.
But there’s one key detail:
the 4H candle is still open.
So we still have two valid scenarios.
🟢 Recovery scenario
4H reclaims 82.840 before the close.
5m/15m rebuild a bullish structure.
Price starts accepting levels above it again.
In that case, the 1H breakdown could turn out to be an internal sweep, and we would study a LONG again.
🔴 Sell scenario
4H closes with its body below 82.840.
Then a pullback appears but fails to reclaim the level.
15m/1H show bearish displacement again.
That could open up a potential SHORT opportunity.
🎯 First logical target: retest 80.344.
If that low breaks with acceptance, price could seek liquidity further down.
The idea is not to guess the direction.
1H has already shown weakness.
4H still has the final say.
Reclaims it: we study a LONG.
Confirms the breakdown: we study a SHORT.
NEXO Trading | Context → structure → confirmation → execution.
Educational content, not financial advice.
📊 BTC — 1H confirmed the breakdown, but 4H still has the final say
BTC lost 82.840 on the 1H timeframe and closed below it. That is already a sign of weakness.
But there’s one key detail:
the 4H candle is still open.
So we still have two valid scenarios.
🟢 Recovery scenario
4H reclaims 82.840 before the close.
5m/15m rebuild a bullish structure.
Price starts accepting levels above it again.
In that case, the 1H breakdown could turn out to be an internal sweep, and we would study a LONG again.
🔴 Sell scenario
4H closes with its body below 82.840.
Then a pullback appears but fails to reclaim the level.
15m/1H show bearish displacement again.
That could open up a potential SHORT opportunity.
🎯 First logical target: retest 80.344.
If that low breaks with acceptance, price could seek liquidity further down.
The idea is not to guess the direction.
1H has already shown weakness.
4H still has the final say.
Reclaims it: we study a LONG.
Confirms the breakdown: we study a SHORT.
NEXO Trading | Context → structure → confirmation → execution.
Educational content, not financial advice.
BTC lost 82.840 on the 1H timeframe and closed below it. That is already a sign of weakness.
But there’s one key detail:
the 4H candle is still open.
So we still have two valid scenarios.
🟢 Recovery scenario
4H reclaims 82.840 before the close.
5m/15m rebuild a bullish structure.
Price starts accepting levels above it again.
In that case, the 1H breakdown could turn out to be an internal sweep, and we would study a LONG again.
🔴 Sell scenario
4H closes with its body below 82.840.
Then a pullback appears but fails to reclaim the level.
15m/1H show bearish displacement again.
That could open up a potential SHORT opportunity.
🎯 First logical target: retest 80.344.
If that low breaks with acceptance, price could seek liquidity further down.
The idea is not to guess the direction.
1H has already shown weakness.
4H still has the final say.
Reclaims it: we study a LONG.
Confirms the breakdown: we study a SHORT.
NEXO Trading | Context → structure → confirmation → execution.
Educational content, not financial advice.
963
📊 BTC — Intracandle loss ≠ confirmed invalidation
We’re tracking a structural recovery, and BTC has now temporarily lost an important zone on the 5m/15m timeframes.
But there’s one key detail:
the 1H candle is still open.
Until that hourly candle closes, this can still happen:
level loss → liquidity sweep → reclaim of 82.840 → 5m microstructure recovery
If that happens before the 1H close, the outlook changes completely. What looked like a breakdown could turn out to be a sweep followed by a recovery.
By contrast, if the 1H candle:
- closes with its body below 82.840,
- fails to reclaim the 5m structure,
- and starts accepting price below,
then the bullish thesis loses much more credibility.
The idea isn’t to anticipate.
The idea is to distinguish between:
intracandle noise
vs.
structural acceptance
📌 NEXO rule:
> A loss on a lower timeframe can be a warning. Confirmation comes when the timeframe supporting the thesis closes below the level.
Now the question is simple:
Will BTC reclaim 82.840 before the 1H candle closes, or accept price below?
That’s what we’re waiting to see.
NEXO Trading | Educational example, not financial advice.
📊 BTC — Intracandle loss ≠ confirmed invalidation
We’re tracking a structural recovery, and BTC has now temporarily lost an important zone on the 5m/15m timeframes.
But there’s one key detail:
the 1H candle is still open.
Until that hourly candle closes, this can still happen:
level loss → liquidity sweep → reclaim of 82.840 → 5m microstructure recovery
If that happens before the 1H close, the outlook changes completely. What looked like a breakdown could turn out to be a sweep followed by a recovery.
By contrast, if the 1H candle:
- closes with its body below 82.840,
- fails to reclaim the 5m structure,
- and starts accepting price below,
then the bullish thesis loses much more credibility.
The idea isn’t to anticipate.
The idea is to distinguish between:
intracandle noise
vs.
structural acceptance
📌 NEXO rule:
> A loss on a lower timeframe can be a warning. Confirmation comes when the timeframe supporting the thesis closes below the level.
Now the question is simple:
Will BTC reclaim 82.840 before the 1H candle closes, or accept price below?
That’s what we’re waiting to see.
NEXO Trading | Educational example, not financial advice.
We’re tracking a structural recovery, and BTC has now temporarily lost an important zone on the 5m/15m timeframes.
But there’s one key detail:
the 1H candle is still open.
Until that hourly candle closes, this can still happen:
level loss → liquidity sweep → reclaim of 82.840 → 5m microstructure recovery
If that happens before the 1H close, the outlook changes completely. What looked like a breakdown could turn out to be a sweep followed by a recovery.
By contrast, if the 1H candle:
- closes with its body below 82.840,
- fails to reclaim the 5m structure,
- and starts accepting price below,
then the bullish thesis loses much more credibility.
The idea isn’t to anticipate.
The idea is to distinguish between:
intracandle noise
vs.
structural acceptance
📌 NEXO rule:
> A loss on a lower timeframe can be a warning. Confirmation comes when the timeframe supporting the thesis closes below the level.
Now the question is simple:
Will BTC reclaim 82.840 before the 1H candle closes, or accept price below?
That’s what we’re waiting to see.
NEXO Trading | Educational example, not financial advice.
440
Log in to explore more content
Join global crypto users on Binance Square
⚡️ Get latest and useful information about crypto.
💬 Trusted by the world’s largest crypto exchange.
👍 Discover real insights from verified creators.
Email / Phone number
Trending Topics
A Packed Week of Earnings and Data Tests Markets
50,215 views
337 Discussing
🚨🇺🇸 BIG WEEK AHEAD FOR THE MARKETS!
Markets are pricing in a Fed rate hike in December and $BTC could see some big moves next week.
Here's what's coming:
• Monday: Fed Chair Warsh speaks
• Tuesday: US Retail Sales + $NVDA earnings
• Wednesday: FOMC Minutes
• Thursday: Jobless Claims + Philly Fed Index
• Friday: Consumer Sentiment + Fed speeches
All eyes on $BTC as another important week begins.
#bitcoin
Mookie
·14 Likes
·6.1k views
AnthropicIPOTestsInvestorAppetiteForAI
83,823 views
1,193 Discussing
BitcoinExtendsLosingStreakToSixWeeks
45,278 views
544 Discussing