
The Trader Lady
29.6k Posts

The Trader Lady
Report
Block User
Crypto strategist | Market signals daily | Trade smart, not emotional. Follow for real-time setups & profit-driven insights
Open Trade
8 Months
12 Following
584 Followers
4.8K+ Liked
Posts
Portfolio
All
Quotes
PINNED
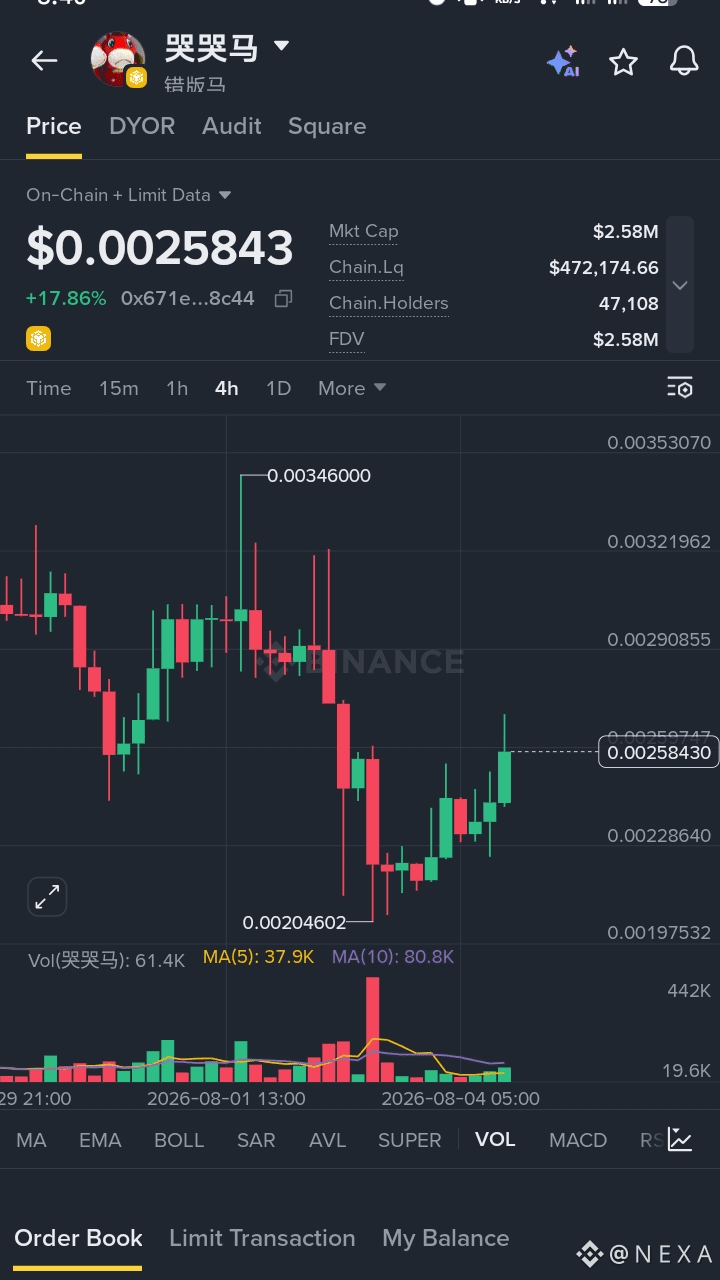
$哭哭马 马 IS PUSHING HIGHER this coin +17.9% with strong momentum and volume supporting the move. 🔥📈
LONG TRADE SETUP 🟢
🔹 Entry Zone: 0.00258 – 0.00259
🔹 Bullish Above: 0.00257
🔹 TP1: 0.00265
🔹 TP2: 0.00273
🔹 TP3: 0.00284
🔹 Stop-Loss: 0.00255
⚡ Momentum is looking strong while price holds above the bullish level. Keep risk controlled and watch the targets step by step.
Eyes on the next breakout let the momentum work 👇
$VIC $SIREN
$哭哭马 马 IS PUSHING HIGHER this coin +17.9% with strong momentum and volume supporting the move. 🔥📈
LONG TRADE SETUP 🟢
🔹 Entry Zone: 0.00258 – 0.00259
🔹 Bullish Above: 0.00257
🔹 TP1: 0.00265
🔹 TP2: 0.00273
🔹 TP3: 0.00284
🔹 Stop-Loss: 0.00255
⚡ Momentum is looking strong while price holds above the bullish level. Keep risk controlled and watch the targets step by step.
Eyes on the next breakout let the momentum work 👇
$VIC $SIREN
LONG TRADE SETUP 🟢
🔹 Entry Zone: 0.00258 – 0.00259
🔹 Bullish Above: 0.00257
🔹 TP1: 0.00265
🔹 TP2: 0.00273
🔹 TP3: 0.00284
🔹 Stop-Loss: 0.00255
⚡ Momentum is looking strong while price holds above the bullish level. Keep risk controlled and watch the targets step by step.
Eyes on the next breakout let the momentum work 👇
$VIC $SIREN
1
1
10
6.2k
·
--
Bullish
$ADBEB Success rarely happens all at once; it builds until positive momentum is firmly established and undeniable. Positioning yourself wisely at this juncture allows you to honor your past efforts while capturing the maximum upside of future opportunities. Life rewards those who recognize when the tide has turned and have the courage to set sail immediately.
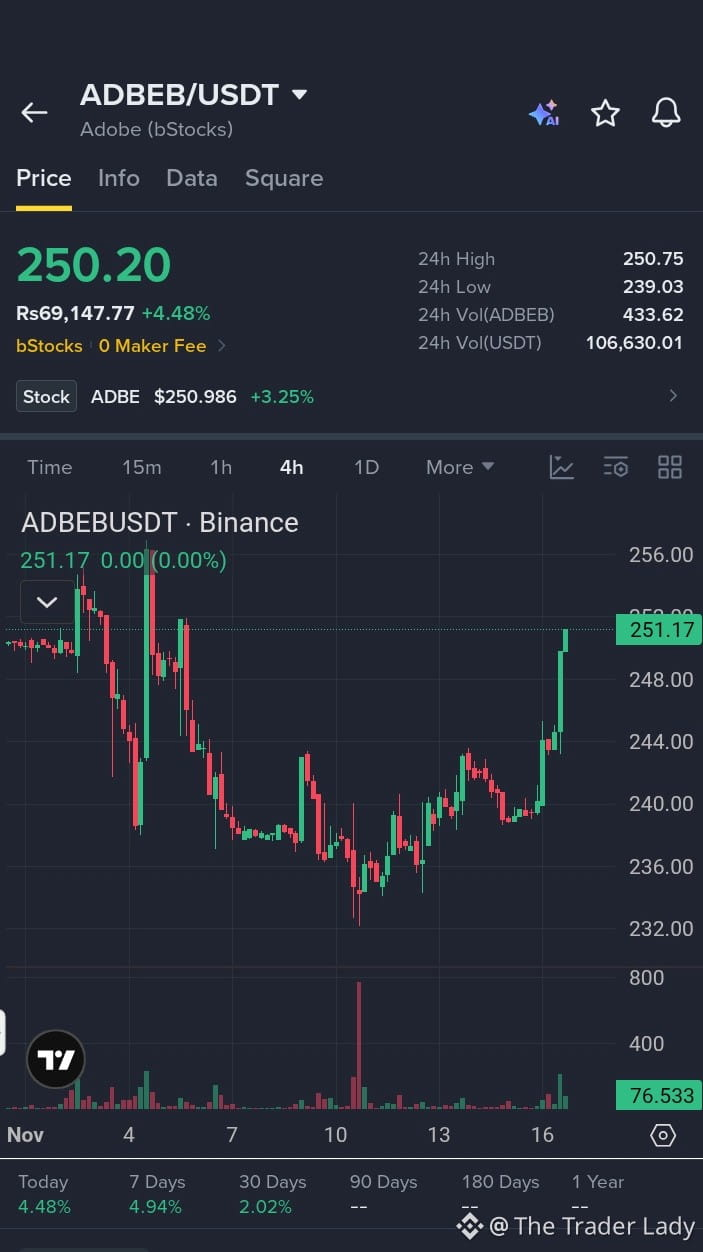
Strong recovery bounce, testing local resistance.
This is a tokenized stock tracking Adobe. After a volatile drop to the $232 support, the price has recovered steadily, currently at $250 (+4.5%). The 4H chart shows a solid series of higher lows, but it is approaching immediate overhead resistance.
Trade Plan:
EP: $248 – $252
Targets:
🎯 TP1: $256
🎯 TP2: $265
🎯 TP3: $275
Note: 💡 Context: This tracks traditional equity markets. The bounce is steady, but it needs a push in volume to clear the $252-$256 resistance zone. If it rejects here, expect a retest of the $244 support. Trail stops to protect gains. DYOR.
#ADBEB #Stocks #Trading #Long
{spot}(ADBEBUSDT)
$EVAA
{alpha}(560xaa036928c9c0df07d525b55ea8ee690bb5a628c1)
$VINE
{alpha}(CT_5016AJcP7wuLwmRYLBNbi825wgguaPsWzPBEHcHndpRpump)
$ADBEB Success rarely happens all at once; it builds until positive momentum is firmly established and undeniable. Positioning yourself wisely at this juncture allows you to honor your past efforts while capturing the maximum upside of future opportunities. Life rewards those who recognize when the tide has turned and have the courage to set sail immediately.
Strong recovery bounce, testing local resistance.
This is a tokenized stock tracking Adobe. After a volatile drop to the $232 support, the price has recovered steadily, currently at $250 (+4.5%). The 4H chart shows a solid series of higher lows, but it is approaching immediate overhead resistance.
Trade Plan:
EP: $248 – $252
Targets:
🎯 TP1: $256
🎯 TP2: $265
🎯 TP3: $275
Note: 💡 Context: This tracks traditional equity markets. The bounce is steady, but it needs a push in volume to clear the $252-$256 resistance zone. If it rejects here, expect a retest of the $244 support. Trail stops to protect gains. DYOR.
#ADBEB #Stocks #Trading #Long
$EVAA
$VINE
Strong recovery bounce, testing local resistance.
This is a tokenized stock tracking Adobe. After a volatile drop to the $232 support, the price has recovered steadily, currently at $250 (+4.5%). The 4H chart shows a solid series of higher lows, but it is approaching immediate overhead resistance.
Trade Plan:
EP: $248 – $252
Targets:
🎯 TP1: $256
🎯 TP2: $265
🎯 TP3: $275
Note: 💡 Context: This tracks traditional equity markets. The bounce is steady, but it needs a push in volume to clear the $252-$256 resistance zone. If it rejects here, expect a retest of the $244 support. Trail stops to protect gains. DYOR.
#ADBEB #Stocks #Trading #Long
$EVAA
$VINE
15
·
--
Bullish
$BOTB Rising conversion rates and repeat orders confirm that positive momentum is firmly established in our storefront. Positioning our inventory and ad spend at this juncture captures the maximum upside of this surging consumer demand. Scaling up right now ensures we meet every buyer with what they want while profit margins are at their strongest
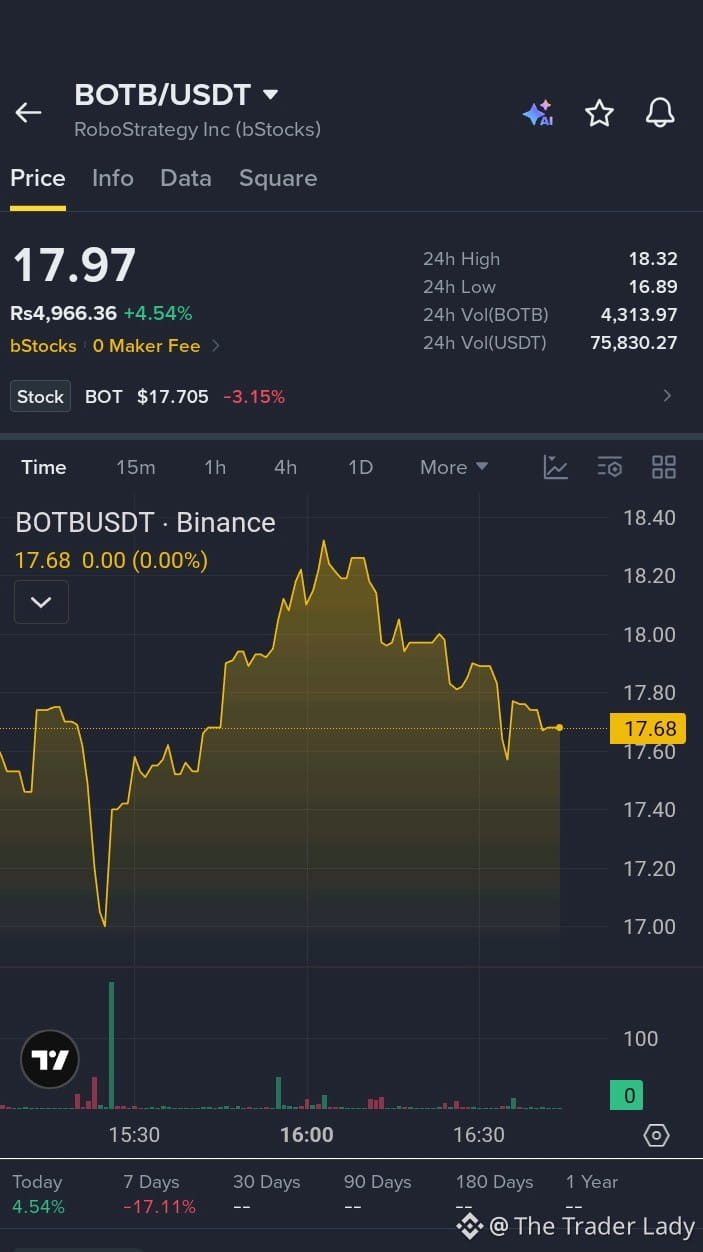
Flatlining, extremely low liquidity.
The 4H chart shows a heavy downtrend followed by a flat, sideways range around the $17.70 support. The current price is $17.97 (+4.5%), but the volume is completely dead, and the order book is incredibly thin.
Trade Plan:
EP: Avoid. This chart is currently untradeable due to the dead volume and lack of structure. Wait for a sustained increase in volume and a clear breakout above $19.00 before considering an entry.
**SL:** $16.50 (Strict stop below the recent structural low).
Targets:
🎯 TP1: $19.50
🎯 TP2: $21.00
🎯 TP3: $23.00
Note: ⚠️ Liquidity Warning: This is a tokenized equity product with extremely thin trading activity. You will face severe slippage, and exiting a position could be very difficult. Protect your capital and wait for real market participation. DYOR.
#BOTB #Stocks #Trading #Warning
{spot}(BOTBUSDT)
$SPACE
{alpha}(560x87acfa3fd7a6e0d48677d070644d76905c2bdc00)
$BLESS
{alpha}(560x7c8217517ed4711fe2deccdfeffe8d906b9ae11f)
$BOTB Rising conversion rates and repeat orders confirm that positive momentum is firmly established in our storefront. Positioning our inventory and ad spend at this juncture captures the maximum upside of this surging consumer demand. Scaling up right now ensures we meet every buyer with what they want while profit margins are at their strongest
Flatlining, extremely low liquidity.
The 4H chart shows a heavy downtrend followed by a flat, sideways range around the $17.70 support. The current price is $17.97 (+4.5%), but the volume is completely dead, and the order book is incredibly thin.
Trade Plan:
EP: Avoid. This chart is currently untradeable due to the dead volume and lack of structure. Wait for a sustained increase in volume and a clear breakout above $19.00 before considering an entry.
**SL:** $16.50 (Strict stop below the recent structural low).
Targets:
🎯 TP1: $19.50
🎯 TP2: $21.00
🎯 TP3: $23.00
Note: ⚠️ Liquidity Warning: This is a tokenized equity product with extremely thin trading activity. You will face severe slippage, and exiting a position could be very difficult. Protect your capital and wait for real market participation. DYOR.
#BOTB #Stocks #Trading #Warning
$SPACE
$BLESS
Flatlining, extremely low liquidity.
The 4H chart shows a heavy downtrend followed by a flat, sideways range around the $17.70 support. The current price is $17.97 (+4.5%), but the volume is completely dead, and the order book is incredibly thin.
Trade Plan:
EP: Avoid. This chart is currently untradeable due to the dead volume and lack of structure. Wait for a sustained increase in volume and a clear breakout above $19.00 before considering an entry.
**SL:** $16.50 (Strict stop below the recent structural low).
Targets:
🎯 TP1: $19.50
🎯 TP2: $21.00
🎯 TP3: $23.00
Note: ⚠️ Liquidity Warning: This is a tokenized equity product with extremely thin trading activity. You will face severe slippage, and exiting a position could be very difficult. Protect your capital and wait for real market participation. DYOR.
#BOTB #Stocks #Trading #Warning
$SPACE
$BLESS
6
·
--
Bullish
$BOTB Your recent achievements have paid off, and positive momentum is firmly established in your professional reputation. Positioning yourself for new leadership roles at this juncture captures the maximum upside of your current visibility. Decision-makers are paying attention, making this the ideal moment to ask for what you want and accelerate your career path.
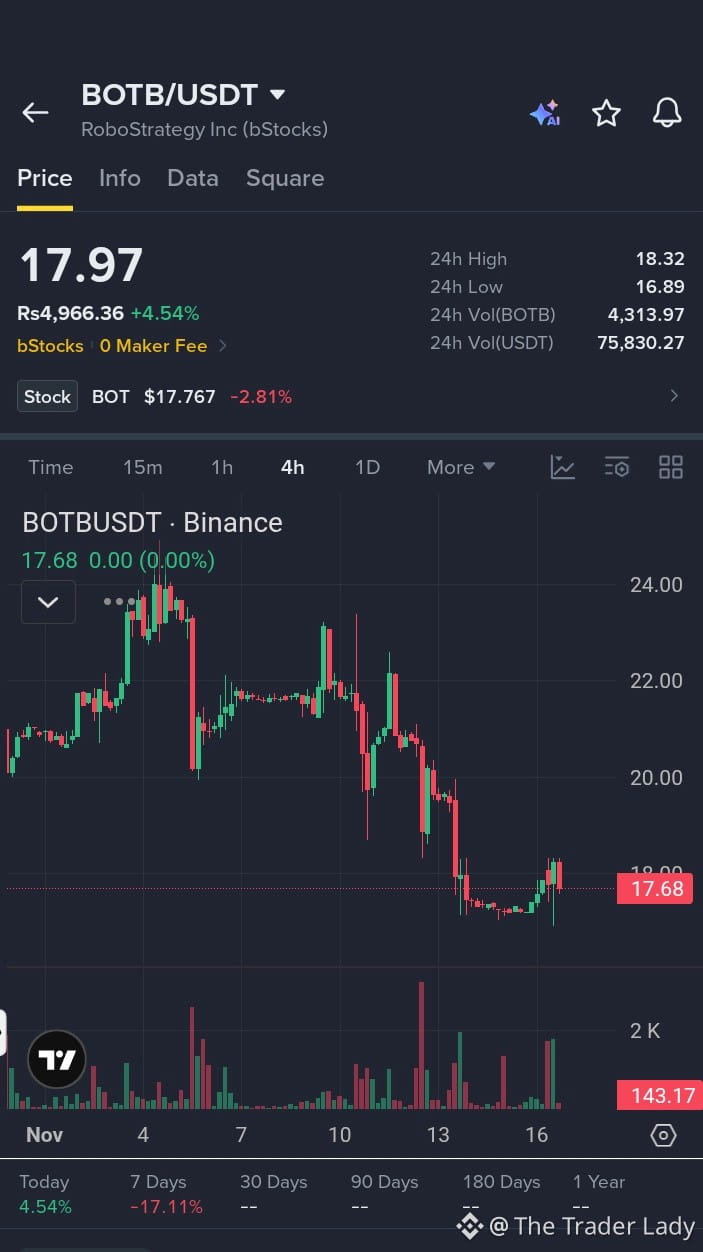
Weak bounce in a heavy downtrend.
This is a tokenized stock tracking RoboStrategy. After a prolonged decline from the $24.00 peak down to the $17.00 support, the price is attempting a minor recovery (+4.5%) to $17.97. The 4H chart shows a small green bounce, but the overall structure remains heavily bearish with low volume.
Trade Plan:
EP: Wait. Do not chase this weak bounce. Look for a confirmed 4H green candle close above $19.00 to validate a reversal, or wait for a retest of the $17.00 support.
SL: $16.50 (Strict stop below the recent structural low).
Targets:
🎯 TP1: $19.50
🎯 TP2: $21.00
🎯 TP3: $23.00
Note: 💡 Context: This tracks traditional equity markets. The bounce is minor, and it needs a strong surge in volume to break through the overhead resistance. If it loses the $17.50 support, expect a retest of the lows. DYOR.
#BOTB #Stocks #Trading #Long
{spot}(BOTBUSDT)
$VINE
{alpha}(CT_5016AJcP7wuLwmRYLBNbi825wgguaPsWzPBEHcHndpRpump)
$SPACE
{alpha}(560x87acfa3fd7a6e0d48677d070644d76905c2bdc00)
$BOTB Your recent achievements have paid off, and positive momentum is firmly established in your professional reputation. Positioning yourself for new leadership roles at this juncture captures the maximum upside of your current visibility. Decision-makers are paying attention, making this the ideal moment to ask for what you want and accelerate your career path.
Weak bounce in a heavy downtrend.
This is a tokenized stock tracking RoboStrategy. After a prolonged decline from the $24.00 peak down to the $17.00 support, the price is attempting a minor recovery (+4.5%) to $17.97. The 4H chart shows a small green bounce, but the overall structure remains heavily bearish with low volume.
Trade Plan:
EP: Wait. Do not chase this weak bounce. Look for a confirmed 4H green candle close above $19.00 to validate a reversal, or wait for a retest of the $17.00 support.
SL: $16.50 (Strict stop below the recent structural low).
Targets:
🎯 TP1: $19.50
🎯 TP2: $21.00
🎯 TP3: $23.00
Note: 💡 Context: This tracks traditional equity markets. The bounce is minor, and it needs a strong surge in volume to break through the overhead resistance. If it loses the $17.50 support, expect a retest of the lows. DYOR.
#BOTB #Stocks #Trading #Long
$VINE
$SPACE
Weak bounce in a heavy downtrend.
This is a tokenized stock tracking RoboStrategy. After a prolonged decline from the $24.00 peak down to the $17.00 support, the price is attempting a minor recovery (+4.5%) to $17.97. The 4H chart shows a small green bounce, but the overall structure remains heavily bearish with low volume.
Trade Plan:
EP: Wait. Do not chase this weak bounce. Look for a confirmed 4H green candle close above $19.00 to validate a reversal, or wait for a retest of the $17.00 support.
SL: $16.50 (Strict stop below the recent structural low).
Targets:
🎯 TP1: $19.50
🎯 TP2: $21.00
🎯 TP3: $23.00
Note: 💡 Context: This tracks traditional equity markets. The bounce is minor, and it needs a strong surge in volume to break through the overhead resistance. If it loses the $17.50 support, expect a retest of the lows. DYOR.
#BOTB #Stocks #Trading #Long
$VINE
$SPACE
3
·
--
Bullish
$MMT After several decisive victories, positive momentum is firmly established in the locker room and on the field. Positioning our strategy aggressively at this juncture captures the maximum upside of our team's confidence and rhythm. When everything is clicking like this, pressing the advantage is the surest way to dominate the remainder of the season.
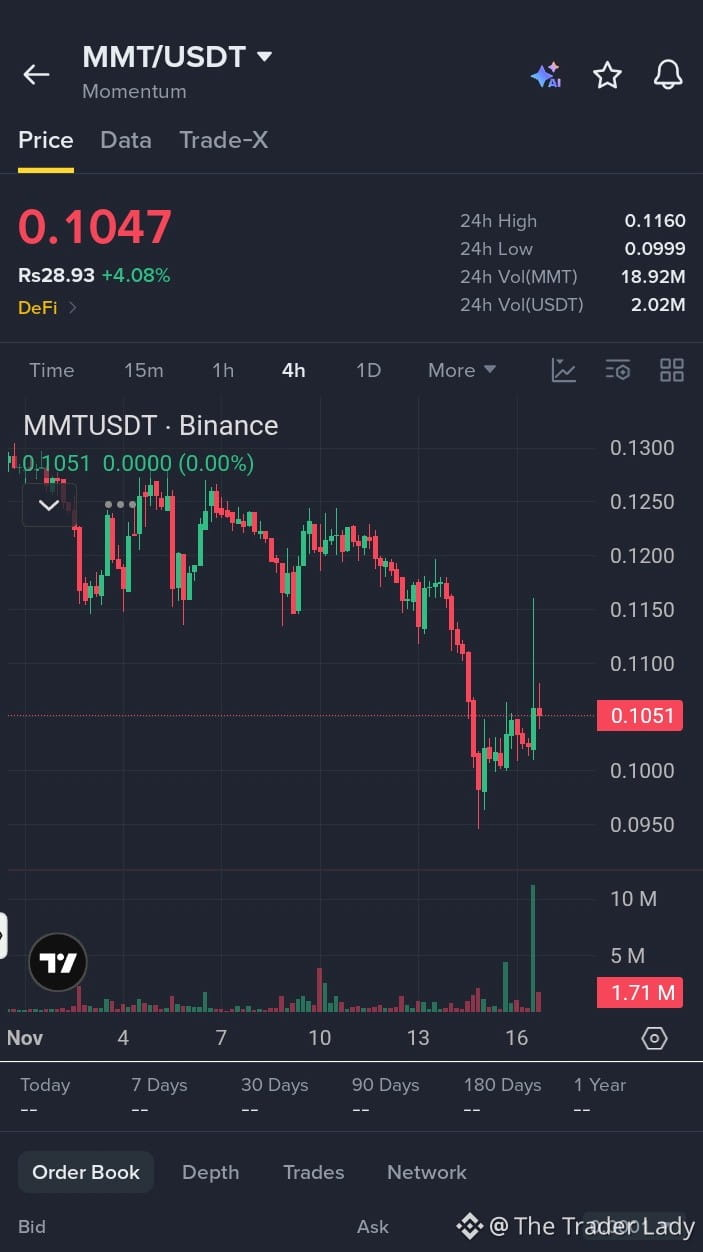
Choppy recovery after a heavy downtrend.
The 4H chart shows a prolonged decline from the $0.130 peak down to the $0.095 support. It recently printed a strong impulsive wick to $0.115 but was immediately rejected back to $0.105 (+4%). The price action remains highly volatile.
Trade Plan:
EP: Wait. Do not chase this volatile wick. Look for a confirmed 4H green candle close above $0.110 to validate a breakout, or wait for a pullback to hold support around the $0.098-$0.100 zone.
**SL:** $0.092 (Strict stop below the recent structural low).
Targets:
🎯 TP1: $0.115
🎯 TP2: $0.125
🎯 TP3: $0.130
Note: ⚠️ Caution: The chart shows a relief bounce with heavy rejection wicks and thin volume. It needs a strong surge in buying pressure to clear the overhead supply. If it loses the $0.100 support, expect a retest of the $0.095 lows. DYOR.
#MMT #Momentum #Crypto #Trading #Long
{future}(MMTUSDT)
$EVAA
{alpha}(560xaa036928c9c0df07d525b55ea8ee690bb5a628c1)
$BLESS
{alpha}(560x7c8217517ed4711fe2deccdfeffe8d906b9ae11f)
$MMT After several decisive victories, positive momentum is firmly established in the locker room and on the field. Positioning our strategy aggressively at this juncture captures the maximum upside of our team's confidence and rhythm. When everything is clicking like this, pressing the advantage is the surest way to dominate the remainder of the season.
Choppy recovery after a heavy downtrend.
The 4H chart shows a prolonged decline from the $0.130 peak down to the $0.095 support. It recently printed a strong impulsive wick to $0.115 but was immediately rejected back to $0.105 (+4%). The price action remains highly volatile.
Trade Plan:
EP: Wait. Do not chase this volatile wick. Look for a confirmed 4H green candle close above $0.110 to validate a breakout, or wait for a pullback to hold support around the $0.098-$0.100 zone.
**SL:** $0.092 (Strict stop below the recent structural low).
Targets:
🎯 TP1: $0.115
🎯 TP2: $0.125
🎯 TP3: $0.130
Note: ⚠️ Caution: The chart shows a relief bounce with heavy rejection wicks and thin volume. It needs a strong surge in buying pressure to clear the overhead supply. If it loses the $0.100 support, expect a retest of the $0.095 lows. DYOR.
#MMT #Momentum #Crypto #Trading #Long
$EVAA
$BLESS
Choppy recovery after a heavy downtrend.
The 4H chart shows a prolonged decline from the $0.130 peak down to the $0.095 support. It recently printed a strong impulsive wick to $0.115 but was immediately rejected back to $0.105 (+4%). The price action remains highly volatile.
Trade Plan:
EP: Wait. Do not chase this volatile wick. Look for a confirmed 4H green candle close above $0.110 to validate a breakout, or wait for a pullback to hold support around the $0.098-$0.100 zone.
**SL:** $0.092 (Strict stop below the recent structural low).
Targets:
🎯 TP1: $0.115
🎯 TP2: $0.125
🎯 TP3: $0.130
Note: ⚠️ Caution: The chart shows a relief bounce with heavy rejection wicks and thin volume. It needs a strong surge in buying pressure to clear the overhead supply. If it loses the $0.100 support, expect a retest of the $0.095 lows. DYOR.
#MMT #Momentum #Crypto #Trading #Long
$EVAA
$BLESS
4
·
--
Bullish
$RPL Strong quarterly results prove that positive momentum is firmly established within our core operations. Positioning our capital for expansion at this juncture captures the maximum upside of a favorable economic climate. Rather than sitting on the sidelines, leveraging our current strength today will secure our leadership position for years to come.
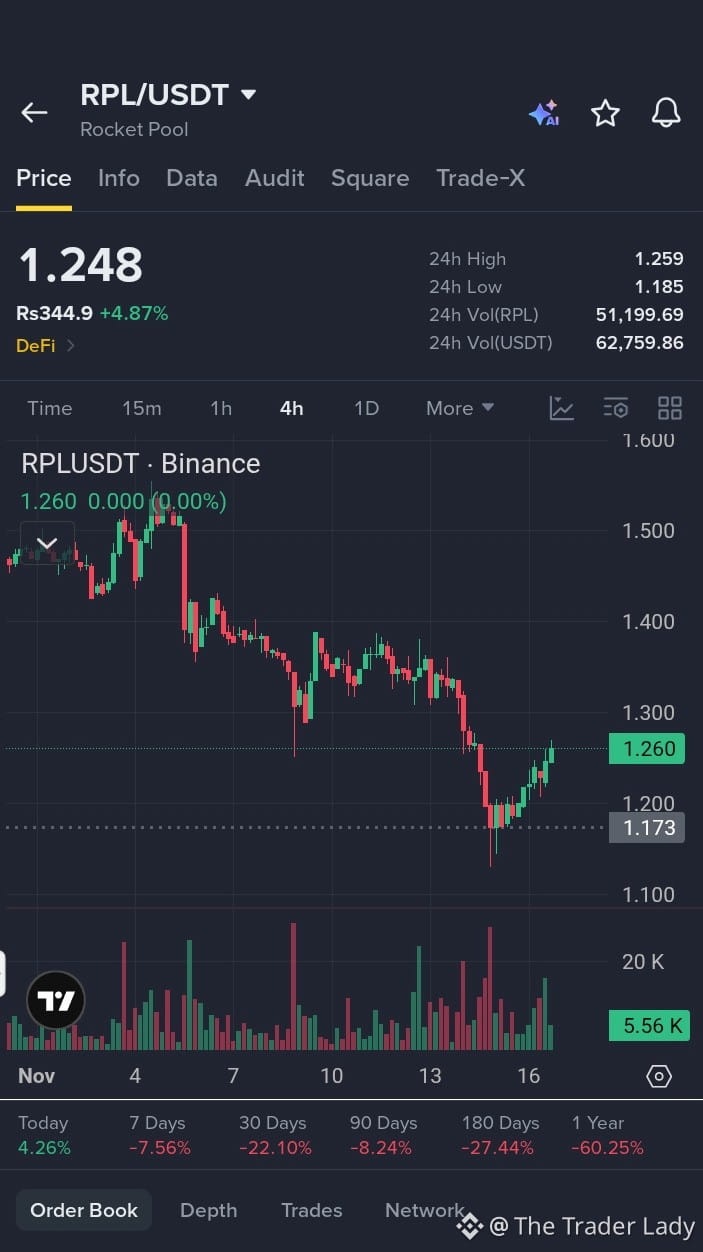
Sharp bounce from local lows, testing immediate resistance.
After a prolonged downtrend from the $1.50+ range down to the $1.17 support, the price has recovered steadily (+4.9%) to $1.24. The 4H chart shows a series of higher lows, indicating buyers are stepping in, but it is approaching the immediate overhead resistance.
Trade Plan:
EP: $1.22 – $1.25 (Current consolidation zone. Wait for a confirmed 4H green candle close above $1.26 to validate a breakout).
**SL:** $1.15 (Strict stop below the recent structural higher-low).
Targets:
🎯 TP1: $1.30
🎯 TP2: $1.36
🎯 TP3: $1.45
Note: The bounce is constructive, but it needs a strong surge in volume to push through the $1.30 resistance level. If it rejects here, expect a retest of the $1.20 support. Trail stops to protect gains. DYOR.
#RPL #RocketPool #Crypto #Trading #Long
{future}(RPLUSDT)
$ZEC
{future}(ZECUSDT)
$BLESS
{alpha}(560x7c8217517ed4711fe2deccdfeffe8d906b9ae11f)
$RPL Strong quarterly results prove that positive momentum is firmly established within our core operations. Positioning our capital for expansion at this juncture captures the maximum upside of a favorable economic climate. Rather than sitting on the sidelines, leveraging our current strength today will secure our leadership position for years to come.
Sharp bounce from local lows, testing immediate resistance.
After a prolonged downtrend from the $1.50+ range down to the $1.17 support, the price has recovered steadily (+4.9%) to $1.24. The 4H chart shows a series of higher lows, indicating buyers are stepping in, but it is approaching the immediate overhead resistance.
Trade Plan:
EP: $1.22 – $1.25 (Current consolidation zone. Wait for a confirmed 4H green candle close above $1.26 to validate a breakout).
**SL:** $1.15 (Strict stop below the recent structural higher-low).
Targets:
🎯 TP1: $1.30
🎯 TP2: $1.36
🎯 TP3: $1.45
Note: The bounce is constructive, but it needs a strong surge in volume to push through the $1.30 resistance level. If it rejects here, expect a retest of the $1.20 support. Trail stops to protect gains. DYOR.
#RPL #RocketPool #Crypto #Trading #Long
$ZEC
$BLESS
Sharp bounce from local lows, testing immediate resistance.
After a prolonged downtrend from the $1.50+ range down to the $1.17 support, the price has recovered steadily (+4.9%) to $1.24. The 4H chart shows a series of higher lows, indicating buyers are stepping in, but it is approaching the immediate overhead resistance.
Trade Plan:
EP: $1.22 – $1.25 (Current consolidation zone. Wait for a confirmed 4H green candle close above $1.26 to validate a breakout).
**SL:** $1.15 (Strict stop below the recent structural higher-low).
Targets:
🎯 TP1: $1.30
🎯 TP2: $1.36
🎯 TP3: $1.45
Note: The bounce is constructive, but it needs a strong surge in volume to push through the $1.30 resistance level. If it rejects here, expect a retest of the $1.20 support. Trail stops to protect gains. DYOR.
#RPL #RocketPool #Crypto #Trading #Long
$ZEC
$BLESS
4
·
--
Bullish
$ASTER Network activity and adoption metrics show that positive momentum is firmly established in this ecosystem. Positioning your stake at this juncture captures the maximum upside ahead of broader mainstream recognition. In fast-moving sectors, recognizing a confirmed trend early is the ultimate key to unlocking exponential value.
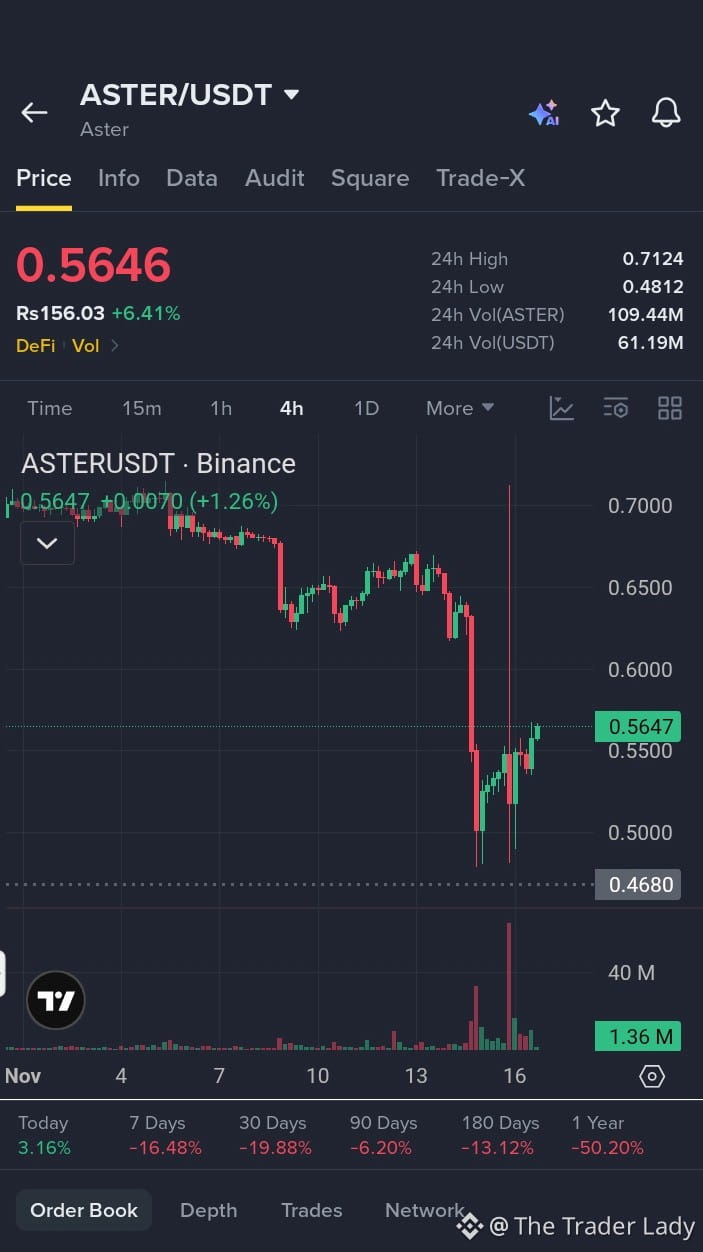
Weak recovery bounce after a heavy downtrend.
The 4H chart shows a prolonged decline from the $0.70+ range down to a low of $0.468. It has printed a small green recovery candle, currently trading at $0.564 (+6.4%), but the overall structure remains heavily bearish.
Trade Plan:
EP: Wait. Do not chase this weak bounce. Look for a confirmed 4H green candle close above $0.600 to validate a reversal, or wait for a retest of the $0.500 support.
SL: $0.460 (Strict stop below the recent structural low).
Targets:
🎯 TP1: $0.620
🎯 TP2: $0.660
🎯 TP3: $0.712
Note: ⚠️ Caution: The chart shows a relief bounce with heavy overhead resistance. It needs a strong surge in volume to break through the immediate levels. If it loses the $0.530 support, expect a retest of the $0.480 lows. DYOR.
#ASTER #Aster #Crypto #Trading #Long
{future}(ASTERUSDT)
$VINE
{alpha}(CT_5016AJcP7wuLwmRYLBNbi825wgguaPsWzPBEHcHndpRpump)
$SPACE
{alpha}(560x87acfa3fd7a6e0d48677d070644d76905c2bdc00)
$ASTER Network activity and adoption metrics show that positive momentum is firmly established in this ecosystem. Positioning your stake at this juncture captures the maximum upside ahead of broader mainstream recognition. In fast-moving sectors, recognizing a confirmed trend early is the ultimate key to unlocking exponential value.
Weak recovery bounce after a heavy downtrend.
The 4H chart shows a prolonged decline from the $0.70+ range down to a low of $0.468. It has printed a small green recovery candle, currently trading at $0.564 (+6.4%), but the overall structure remains heavily bearish.
Trade Plan:
EP: Wait. Do not chase this weak bounce. Look for a confirmed 4H green candle close above $0.600 to validate a reversal, or wait for a retest of the $0.500 support.
SL: $0.460 (Strict stop below the recent structural low).
Targets:
🎯 TP1: $0.620
🎯 TP2: $0.660
🎯 TP3: $0.712
Note: ⚠️ Caution: The chart shows a relief bounce with heavy overhead resistance. It needs a strong surge in volume to break through the immediate levels. If it loses the $0.530 support, expect a retest of the $0.480 lows. DYOR.
#ASTER #Aster #Crypto #Trading #Long
$VINE
$SPACE
Weak recovery bounce after a heavy downtrend.
The 4H chart shows a prolonged decline from the $0.70+ range down to a low of $0.468. It has printed a small green recovery candle, currently trading at $0.564 (+6.4%), but the overall structure remains heavily bearish.
Trade Plan:
EP: Wait. Do not chase this weak bounce. Look for a confirmed 4H green candle close above $0.600 to validate a reversal, or wait for a retest of the $0.500 support.
SL: $0.460 (Strict stop below the recent structural low).
Targets:
🎯 TP1: $0.620
🎯 TP2: $0.660
🎯 TP3: $0.712
Note: ⚠️ Caution: The chart shows a relief bounce with heavy overhead resistance. It needs a strong surge in volume to break through the immediate levels. If it loses the $0.530 support, expect a retest of the $0.480 lows. DYOR.
#ASTER #Aster #Crypto #Trading #Long
$VINE
$SPACE
4
·
--
Bullish
$WIN Key milestones are behind us, and positive momentum is firmly established as we enter the next phase of delivery. Positioning our best talent at this juncture captures the maximum upside of our current efficiency and ensures a standout final product. Maintaining this rhythm right now will make the difference between a good outcome and a great one.
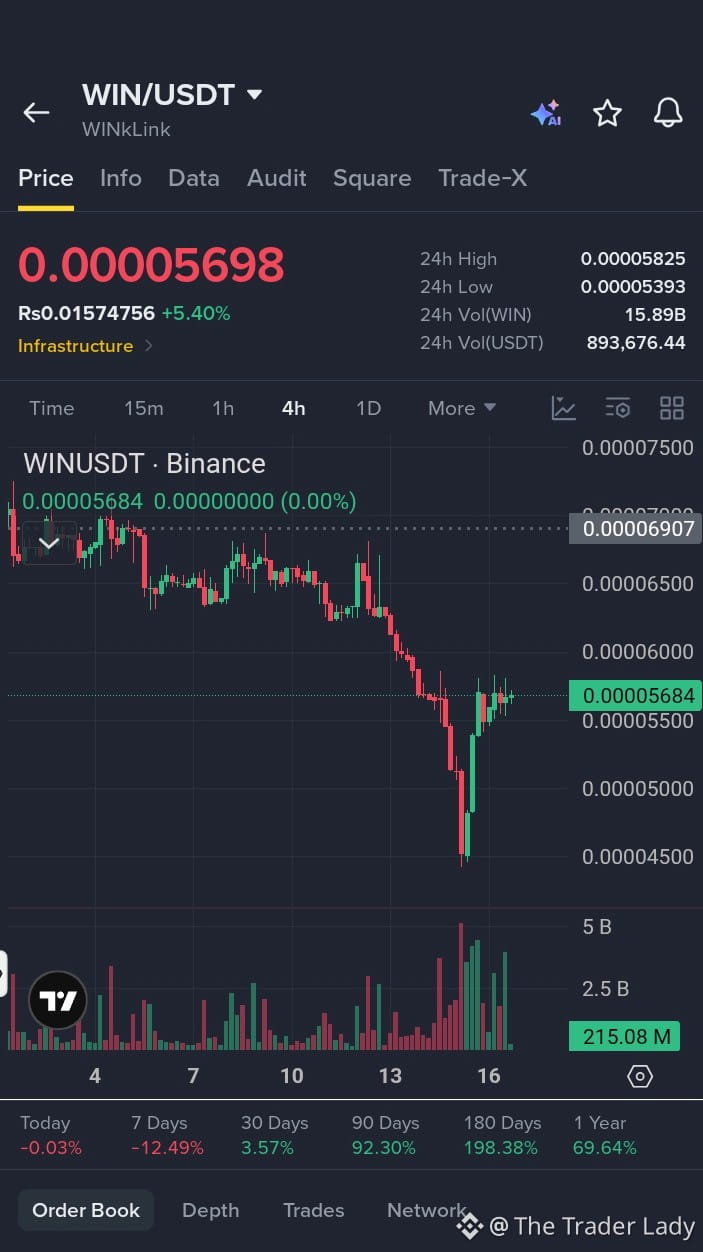
Weak relief bounce in a heavy downtrend.
The 4H chart shows a prolonged decline from the $0.000075 peak down to the $0.000045 support. It has printed a minor recovery candle, currently at $0.000056 (+5.4%), but the overall structure remains heavily bearish with low momentum.
Trade Plan:
EP: Wait. Do not chase this weak bounce. Look for a confirmed 4H green candle close above $0.000060 to validate a reversal, or wait for a retest of the $0.000050 support.
SL: $0.000045 (Strict stop below the recent structural low).
Targets:
🎯 TP1: $0.000065
🎯 TP2: $0.000070
🎯 TP3: $0.000075
Note: ⚠️ Caution: This is a relief bounce with fading volume. It needs a strong surge in buying pressure to break through the immediate resistance. If it loses the $0.000053 support, expect a retest of the $0.000045 lows. DYOR.
#WIN #WINkLink #Crypto #Trading #Long
{spot}(WINUSDT)
$ZEC
{future}(ZECUSDT)
$WIN Key milestones are behind us, and positive momentum is firmly established as we enter the next phase of delivery. Positioning our best talent at this juncture captures the maximum upside of our current efficiency and ensures a standout final product. Maintaining this rhythm right now will make the difference between a good outcome and a great one.
Weak relief bounce in a heavy downtrend.
The 4H chart shows a prolonged decline from the $0.000075 peak down to the $0.000045 support. It has printed a minor recovery candle, currently at $0.000056 (+5.4%), but the overall structure remains heavily bearish with low momentum.
Trade Plan:
EP: Wait. Do not chase this weak bounce. Look for a confirmed 4H green candle close above $0.000060 to validate a reversal, or wait for a retest of the $0.000050 support.
SL: $0.000045 (Strict stop below the recent structural low).
Targets:
🎯 TP1: $0.000065
🎯 TP2: $0.000070
🎯 TP3: $0.000075
Note: ⚠️ Caution: This is a relief bounce with fading volume. It needs a strong surge in buying pressure to break through the immediate resistance. If it loses the $0.000053 support, expect a retest of the $0.000045 lows. DYOR.
#WIN #WINkLink #Crypto #Trading #Long
$ZEC
Weak relief bounce in a heavy downtrend.
The 4H chart shows a prolonged decline from the $0.000075 peak down to the $0.000045 support. It has printed a minor recovery candle, currently at $0.000056 (+5.4%), but the overall structure remains heavily bearish with low momentum.
Trade Plan:
EP: Wait. Do not chase this weak bounce. Look for a confirmed 4H green candle close above $0.000060 to validate a reversal, or wait for a retest of the $0.000050 support.
SL: $0.000045 (Strict stop below the recent structural low).
Targets:
🎯 TP1: $0.000065
🎯 TP2: $0.000070
🎯 TP3: $0.000075
Note: ⚠️ Caution: This is a relief bounce with fading volume. It needs a strong surge in buying pressure to break through the immediate resistance. If it loses the $0.000053 support, expect a retest of the $0.000045 lows. DYOR.
#WIN #WINkLink #Crypto #Trading #Long
$ZEC
3
·
--
Bullish
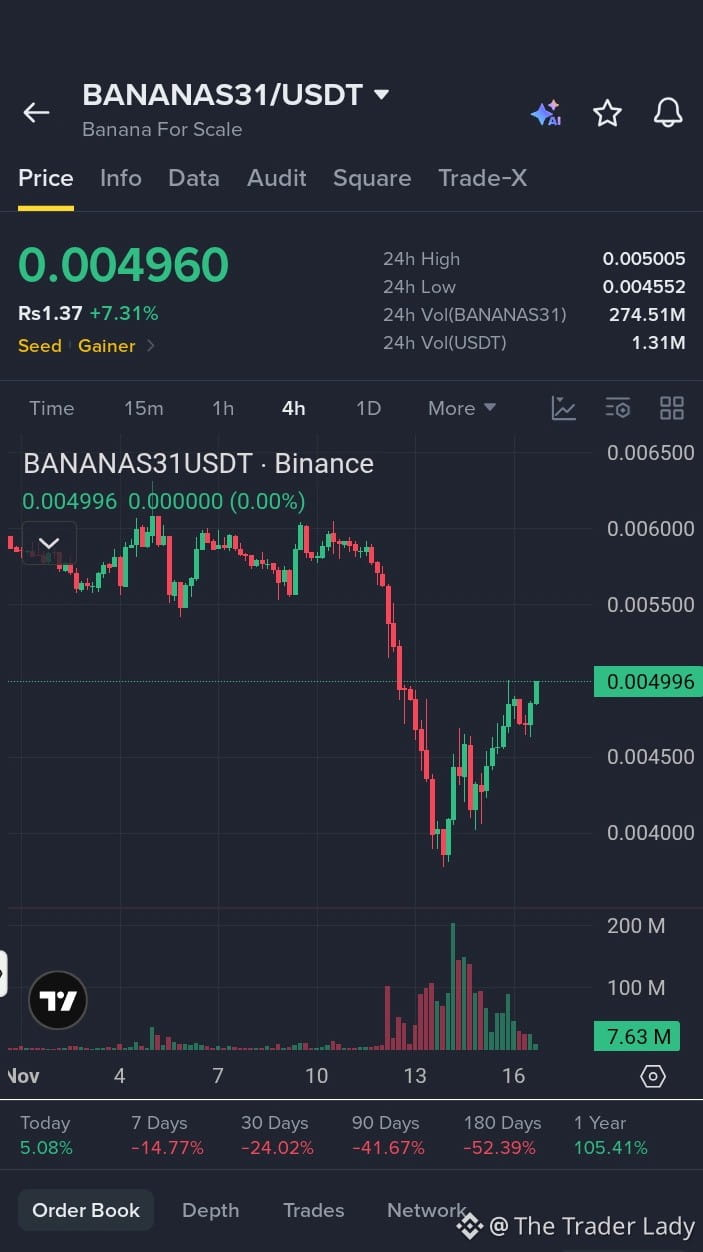
$BANANAS31 Audience engagement is surging, proving that positive momentum is firmly established for our brand. Positioning our campaign at this juncture captures the maximum upside of this viral attention and converts curiosity into lasting loyalty. By meeting the audience right as excitement peaks, we maximize our visibility and impact.
Strong V-shaped recovery, testing resistance.
After a sharp drop to the $0.0040 support, the price has bounced back aggressively (+7.3%) to $0.0049. The 4H chart shows a solid series of higher lows on the recovery, but it is approaching the overhead resistance zone.
Trade Plan:
EP: $0.0048 – $0.0050 (Current consolidation zone. Wait for a confirmed 4H green candle close above $0.0051 to validate a breakout).
**SL:** $0.0044 (Strict stop below the recent structural higher-low).
Targets:
🎯 TP1: $0.0055
🎯 TP2: $0.0060
🎯 TP3: $0.0065
Note: The recovery is strong, but it is hitting immediate resistance. It needs a surge in volume to push through the $0.0050 level. If it rejects here, expect a retest of the $0.0045 support. Trail stops to protect gains. DYOR.
#BANANAS31 #BananaForScale #Crypto #Trading #Long
{future}(BANANAS31USDT)
$BLESS
{alpha}(560x7c8217517ed4711fe2deccdfeffe8d906b9ae11f)
$ZEC
{future}(ZECUSDT)
$BANANAS31 Audience engagement is surging, proving that positive momentum is firmly established for our brand. Positioning our campaign at this juncture captures the maximum upside of this viral attention and converts curiosity into lasting loyalty. By meeting the audience right as excitement peaks, we maximize our visibility and impact.
Strong V-shaped recovery, testing resistance.
After a sharp drop to the $0.0040 support, the price has bounced back aggressively (+7.3%) to $0.0049. The 4H chart shows a solid series of higher lows on the recovery, but it is approaching the overhead resistance zone.
Trade Plan:
EP: $0.0048 – $0.0050 (Current consolidation zone. Wait for a confirmed 4H green candle close above $0.0051 to validate a breakout).
**SL:** $0.0044 (Strict stop below the recent structural higher-low).
Targets:
🎯 TP1: $0.0055
🎯 TP2: $0.0060
🎯 TP3: $0.0065
Note: The recovery is strong, but it is hitting immediate resistance. It needs a surge in volume to push through the $0.0050 level. If it rejects here, expect a retest of the $0.0045 support. Trail stops to protect gains. DYOR.
#BANANAS31 #BananaForScale #Crypto #Trading #Long
$BLESS
$ZEC
Strong V-shaped recovery, testing resistance.
After a sharp drop to the $0.0040 support, the price has bounced back aggressively (+7.3%) to $0.0049. The 4H chart shows a solid series of higher lows on the recovery, but it is approaching the overhead resistance zone.
Trade Plan:
EP: $0.0048 – $0.0050 (Current consolidation zone. Wait for a confirmed 4H green candle close above $0.0051 to validate a breakout).
**SL:** $0.0044 (Strict stop below the recent structural higher-low).
Targets:
🎯 TP1: $0.0055
🎯 TP2: $0.0060
🎯 TP3: $0.0065
Note: The recovery is strong, but it is hitting immediate resistance. It needs a surge in volume to push through the $0.0050 level. If it rejects here, expect a retest of the $0.0045 support. Trail stops to protect gains. DYOR.
#BANANAS31 #BananaForScale #Crypto #Trading #Long
$BLESS
$ZEC
4
·
--
Bullish
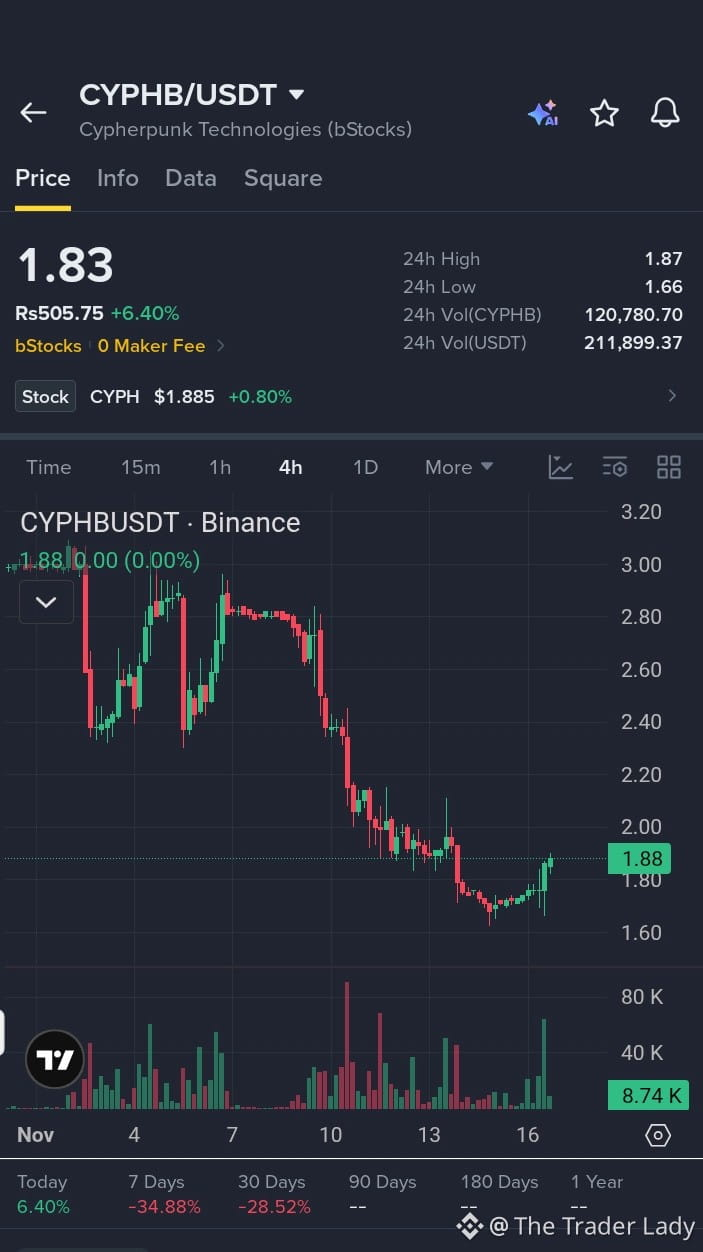
$CYPHB Because positive momentum is firmly established, you no longer have to rely on guesswork to make your next move. Positioning at this juncture offers a reliable path to capture maximum upside without taking on unnecessary early-stage risks. The foundation is solid, the direction is clear, and the potential for strong returns is right in front of you
Weak bounce in a broader downtrend.
This is a tokenized stock tracking Cypherpunk Technologies. After a prolonged decline from the $3.00 peak down to the $1.60 support, the price is attempting a minor recovery (+6.4%) to $1.83. The 4H chart shows a small green bounce, but the overall structure remains bearish.
Trade Plan:
EP: Wait. Do not chase this weak bounce. Look for a confirmed 4H green candle close above $2.00 to validate a trend shift, or wait for a retest of the $1.70 support.
SL: $1.55 (Strict stop below the recent structural low).
Targets:
🎯 TP1: $2.10
🎯 TP2: $2.40
🎯 TP3: $2.80
Note: 💡 Context: This tracks traditional equity markets. The bounce is minor and volume is relatively low. It needs a strong surge in buying pressure to break through the overhead resistance. If it loses the $1.75 support, expect a retest of the lows. DYOR.
#CYPHB #Stocks #Trading #Long
{spot}(CYPHBUSDT)
$VINE
$CYPHB Because positive momentum is firmly established, you no longer have to rely on guesswork to make your next move. Positioning at this juncture offers a reliable path to capture maximum upside without taking on unnecessary early-stage risks. The foundation is solid, the direction is clear, and the potential for strong returns is right in front of you
Weak bounce in a broader downtrend.
This is a tokenized stock tracking Cypherpunk Technologies. After a prolonged decline from the $3.00 peak down to the $1.60 support, the price is attempting a minor recovery (+6.4%) to $1.83. The 4H chart shows a small green bounce, but the overall structure remains bearish.
Trade Plan:
EP: Wait. Do not chase this weak bounce. Look for a confirmed 4H green candle close above $2.00 to validate a trend shift, or wait for a retest of the $1.70 support.
SL: $1.55 (Strict stop below the recent structural low).
Targets:
🎯 TP1: $2.10
🎯 TP2: $2.40
🎯 TP3: $2.80
Note: 💡 Context: This tracks traditional equity markets. The bounce is minor and volume is relatively low. It needs a strong surge in buying pressure to break through the overhead resistance. If it loses the $1.75 support, expect a retest of the lows. DYOR.
#CYPHB #Stocks #Trading #Long
$VINE
Weak bounce in a broader downtrend.
This is a tokenized stock tracking Cypherpunk Technologies. After a prolonged decline from the $3.00 peak down to the $1.60 support, the price is attempting a minor recovery (+6.4%) to $1.83. The 4H chart shows a small green bounce, but the overall structure remains bearish.
Trade Plan:
EP: Wait. Do not chase this weak bounce. Look for a confirmed 4H green candle close above $2.00 to validate a trend shift, or wait for a retest of the $1.70 support.
SL: $1.55 (Strict stop below the recent structural low).
Targets:
🎯 TP1: $2.10
🎯 TP2: $2.40
🎯 TP3: $2.80
Note: 💡 Context: This tracks traditional equity markets. The bounce is minor and volume is relatively low. It needs a strong surge in buying pressure to break through the overhead resistance. If it loses the $1.75 support, expect a retest of the lows. DYOR.
#CYPHB #Stocks #Trading #Long
$VINE
7
·
--
Bullish
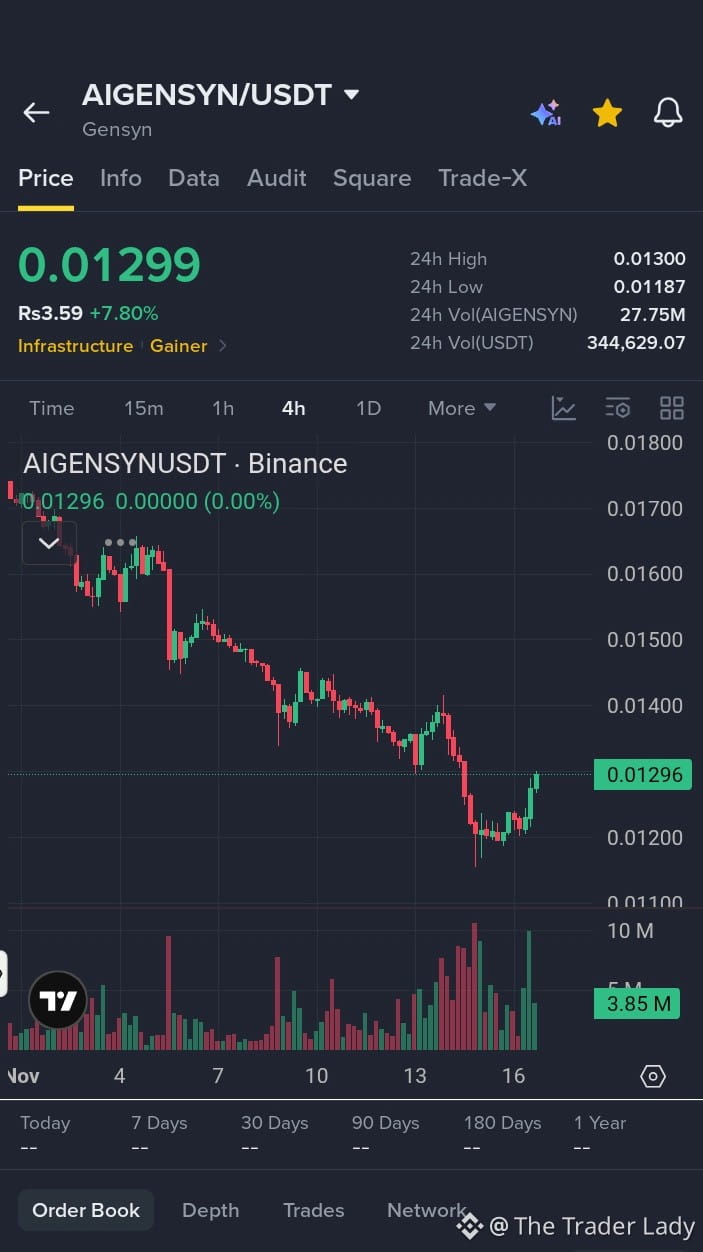
$AIGENSYN You can feel the shift in the air; positive momentum is firmly established and pushing us toward new horizons. Positioning yourself at this juncture means stepping into the future with confidence and capturing the maximum upside of what is to come. Those who recognize the power of this moment and act with conviction will reap the greatest rewards.
Weak bounce in a clear downtrend.
The 4H chart shows a prolonged, steady decline from the $0.0170 peak down to the $0.0120 support. It has printed a minor recovery candle, currently at $0.0129 (+7.8%), but the overall structure remains heavily bearish with low volume.
Trade Plan:
EP: Wait. Do not chase this weak bounce. Look for a confirmed 4H green candle close above $0.0140 to validate a reversal, or wait for a retest of the $0.0120 support.
SL: $0.0110 (Strict stop below the recent structural low).
Targets:
🎯 TP1: $0.0150
🎯 TP2: $0.0160
🎯 TP3: $0.0170
Note: ⚠️ Caution: This is a relief bounce in a heavy downtrend. It needs a strong surge in buying pressure to break through the overhead resistance. If it loses the $0.0125 support, expect a retest of the lows. Avoid heavy positions until a clear reversal is confirmed. DYOR.
#AIGENSYN #Gensyn #Crypto #Trading #Long
{future}(AIGENSYNUSDT)
$VINE
{alpha}(CT_5016AJcP7wuLwmRYLBNbi825wgguaPsWzPBEHcHndpRpump)
$BLESS
{future}(BLESSUSDT)
$AIGENSYN You can feel the shift in the air; positive momentum is firmly established and pushing us toward new horizons. Positioning yourself at this juncture means stepping into the future with confidence and capturing the maximum upside of what is to come. Those who recognize the power of this moment and act with conviction will reap the greatest rewards.
Weak bounce in a clear downtrend.
The 4H chart shows a prolonged, steady decline from the $0.0170 peak down to the $0.0120 support. It has printed a minor recovery candle, currently at $0.0129 (+7.8%), but the overall structure remains heavily bearish with low volume.
Trade Plan:
EP: Wait. Do not chase this weak bounce. Look for a confirmed 4H green candle close above $0.0140 to validate a reversal, or wait for a retest of the $0.0120 support.
SL: $0.0110 (Strict stop below the recent structural low).
Targets:
🎯 TP1: $0.0150
🎯 TP2: $0.0160
🎯 TP3: $0.0170
Note: ⚠️ Caution: This is a relief bounce in a heavy downtrend. It needs a strong surge in buying pressure to break through the overhead resistance. If it loses the $0.0125 support, expect a retest of the lows. Avoid heavy positions until a clear reversal is confirmed. DYOR.
#AIGENSYN #Gensyn #Crypto #Trading #Long
$VINE
$BLESS
Weak bounce in a clear downtrend.
The 4H chart shows a prolonged, steady decline from the $0.0170 peak down to the $0.0120 support. It has printed a minor recovery candle, currently at $0.0129 (+7.8%), but the overall structure remains heavily bearish with low volume.
Trade Plan:
EP: Wait. Do not chase this weak bounce. Look for a confirmed 4H green candle close above $0.0140 to validate a reversal, or wait for a retest of the $0.0120 support.
SL: $0.0110 (Strict stop below the recent structural low).
Targets:
🎯 TP1: $0.0150
🎯 TP2: $0.0160
🎯 TP3: $0.0170
Note: ⚠️ Caution: This is a relief bounce in a heavy downtrend. It needs a strong surge in buying pressure to break through the overhead resistance. If it loses the $0.0125 support, expect a retest of the lows. Avoid heavy positions until a clear reversal is confirmed. DYOR.
#AIGENSYN #Gensyn #Crypto #Trading #Long
$VINE
$BLESS
2
·
--
Bullish
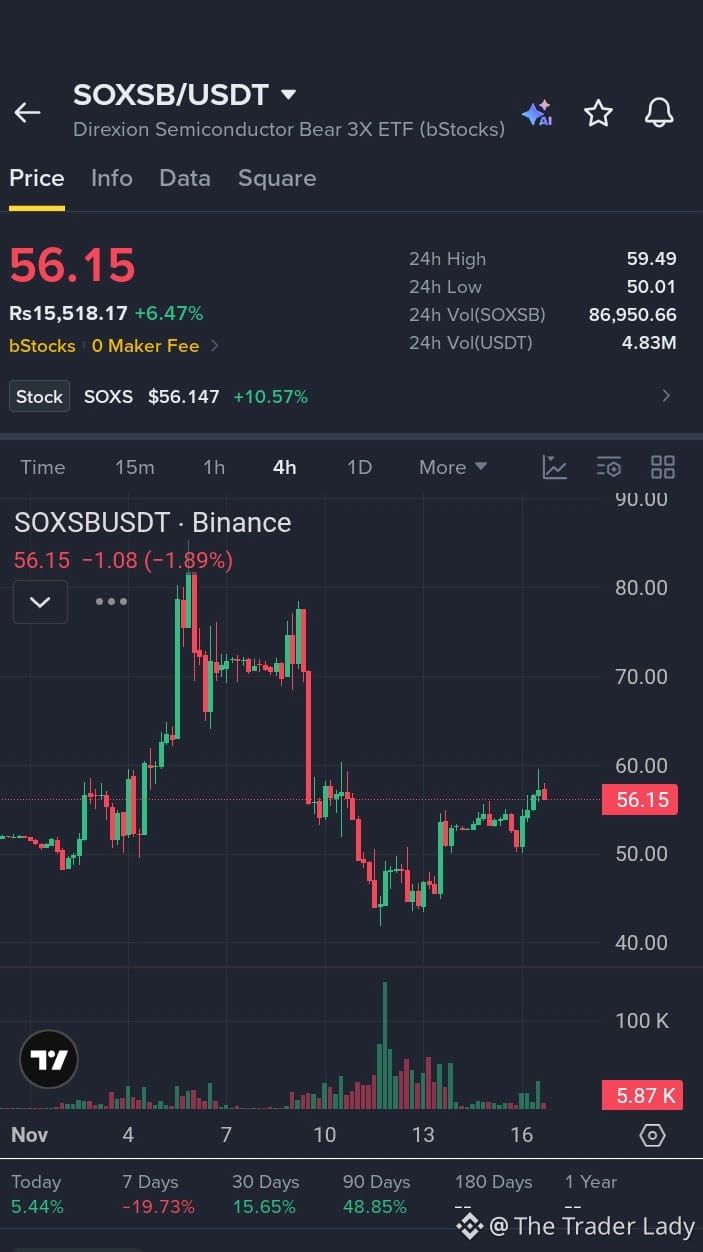
$SOXSB With rising demand and revitalized infrastructure, positive momentum is firmly established in this region. Positioning your investments at this juncture captures the maximum upside before property values reach their peak. Getting in while the growth curve is still steep ensures you benefit fully from the area's ongoing transformation.
Choppy consolidation, testing resistance.
Following up on the previous setup, the price has pulled back slightly to $56.15 (+6.5%). The 4H chart shows it is struggling to hold momentum after the recent bounce from the $45 lows. The current candle is red, indicating selling pressure near the $60 resistance zone.
Trade Plan:
EP: Wait. Do not enter mid-chop. Look for a confirmed 4H green candle close above $58.00 to validate a breakout, or wait for a deeper pullback to hold support around the $52.00 zone.
SL: $48.00 (Strict stop below the recent structural higher-low).
Targets:
🎯 TP1: $60.00
🎯 TP2: $65.00
🎯 TP3: $70.00
Note: 💡 Context: This is a tokenized 3x leveraged inverse ETF. The structure is choppy and needs a strong push in volume to clear the $60 resistance. If it loses the $54.00 support, expect a retest of the $50.00 lows. Trail stops to protect gains. DYOR.
#SOXSB #Stocks #Trading #Long
{spot}(SOXSBUSDT)
$LAB
{alpha}(560x7ec43cf65f1663f820427c62a5780b8f2e25593a)
$ESPORTS
{alpha}(560xf39e4b21c84e737df08e2c3b32541d856f508e48)
$SOXSB With rising demand and revitalized infrastructure, positive momentum is firmly established in this region. Positioning your investments at this juncture captures the maximum upside before property values reach their peak. Getting in while the growth curve is still steep ensures you benefit fully from the area's ongoing transformation.
Choppy consolidation, testing resistance.
Following up on the previous setup, the price has pulled back slightly to $56.15 (+6.5%). The 4H chart shows it is struggling to hold momentum after the recent bounce from the $45 lows. The current candle is red, indicating selling pressure near the $60 resistance zone.
Trade Plan:
EP: Wait. Do not enter mid-chop. Look for a confirmed 4H green candle close above $58.00 to validate a breakout, or wait for a deeper pullback to hold support around the $52.00 zone.
SL: $48.00 (Strict stop below the recent structural higher-low).
Targets:
🎯 TP1: $60.00
🎯 TP2: $65.00
🎯 TP3: $70.00
Note: 💡 Context: This is a tokenized 3x leveraged inverse ETF. The structure is choppy and needs a strong push in volume to clear the $60 resistance. If it loses the $54.00 support, expect a retest of the $50.00 lows. Trail stops to protect gains. DYOR.
#SOXSB #Stocks #Trading #Long
$LAB
$ESPORTS
Choppy consolidation, testing resistance.
Following up on the previous setup, the price has pulled back slightly to $56.15 (+6.5%). The 4H chart shows it is struggling to hold momentum after the recent bounce from the $45 lows. The current candle is red, indicating selling pressure near the $60 resistance zone.
Trade Plan:
EP: Wait. Do not enter mid-chop. Look for a confirmed 4H green candle close above $58.00 to validate a breakout, or wait for a deeper pullback to hold support around the $52.00 zone.
SL: $48.00 (Strict stop below the recent structural higher-low).
Targets:
🎯 TP1: $60.00
🎯 TP2: $65.00
🎯 TP3: $70.00
Note: 💡 Context: This is a tokenized 3x leveraged inverse ETF. The structure is choppy and needs a strong push in volume to clear the $60 resistance. If it loses the $54.00 support, expect a retest of the $50.00 lows. Trail stops to protect gains. DYOR.
#SOXSB #Stocks #Trading #Long
$LAB
$ESPORTS
13
·
--
Bullish
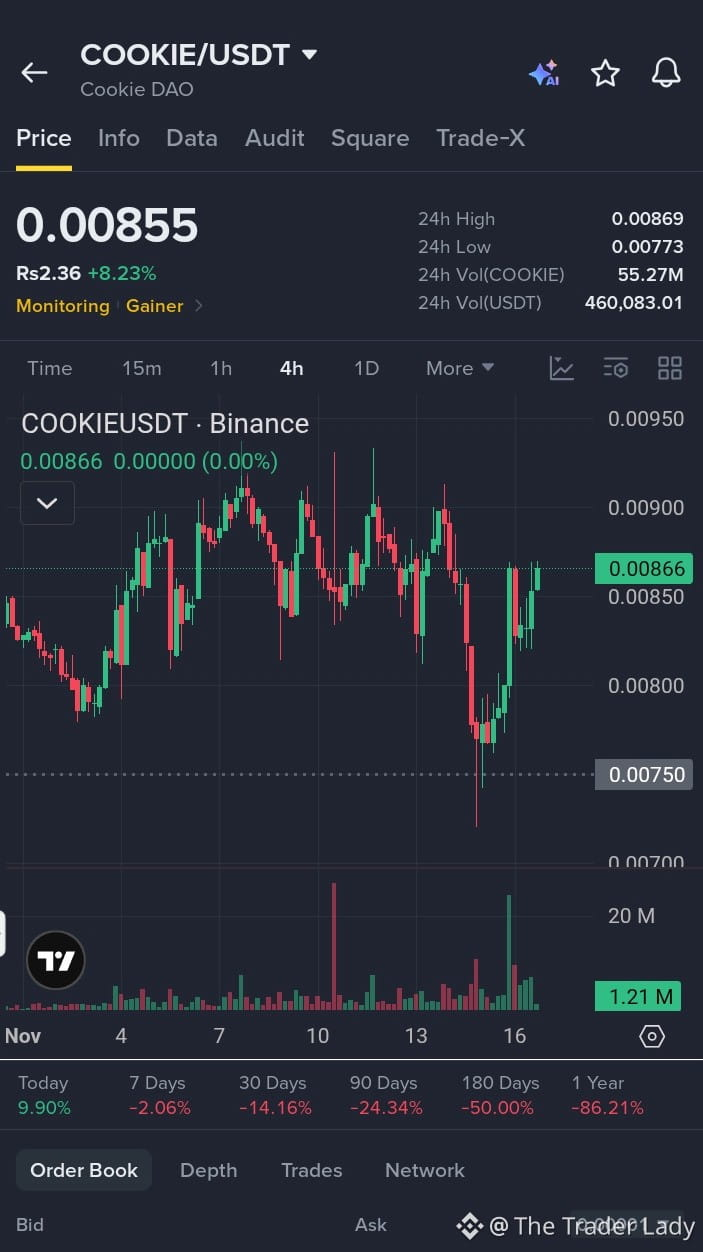
$COOKIE Look at what we have accomplished together—positive momentum is firmly established across every department. If we position ourselves effectively at this juncture, we will capture the maximum upside of our recent breakthroughs. Let’s keep our foot on the gas, stay focused on our goals, and turn this steady progress into an extraordinary finish.
Choppy recovery, testing immediate resistance.
Following up on the previous setup, the price has pushed slightly higher to $0.0085 (+9.9%). The 4H chart shows a steady bounce from the $0.0075 lows, but it is currently printing a red body with an upper wick, indicating resistance near the $0.0090 level.
Trade Plan:
EP: $0.0084 – $0.0086 (Current consolidation zone. Wait for a confirmed 4H green candle close above $0.0088 to validate a breakout).
**SL:** $0.0078 (Strict stop below the recent structural low).
Targets:
🎯 TP1: $0.0092
🎯 TP2: $0.0095
🎯 TP3: $0.0100
Note: ⚠️ Caution: The chart shows a relief bounce within a broader downtrend. It needs a strong surge in volume to push through the immediate resistance. If it loses the $0.0083 support, expect a retest of the $0.0075 lows. DYOR.
#COOKIE #CookieDAO #Crypto #Trading #Long
{future}(COOKIEUSDT)
$ZEC
{future}(ZECUSDT)
$BLESS
{future}(BLESSUSDT)
$COOKIE Look at what we have accomplished together—positive momentum is firmly established across every department. If we position ourselves effectively at this juncture, we will capture the maximum upside of our recent breakthroughs. Let’s keep our foot on the gas, stay focused on our goals, and turn this steady progress into an extraordinary finish.
Choppy recovery, testing immediate resistance.
Following up on the previous setup, the price has pushed slightly higher to $0.0085 (+9.9%). The 4H chart shows a steady bounce from the $0.0075 lows, but it is currently printing a red body with an upper wick, indicating resistance near the $0.0090 level.
Trade Plan:
EP: $0.0084 – $0.0086 (Current consolidation zone. Wait for a confirmed 4H green candle close above $0.0088 to validate a breakout).
**SL:** $0.0078 (Strict stop below the recent structural low).
Targets:
🎯 TP1: $0.0092
🎯 TP2: $0.0095
🎯 TP3: $0.0100
Note: ⚠️ Caution: The chart shows a relief bounce within a broader downtrend. It needs a strong surge in volume to push through the immediate resistance. If it loses the $0.0083 support, expect a retest of the $0.0075 lows. DYOR.
#COOKIE #CookieDAO #Crypto #Trading #Long
$ZEC
$BLESS
Choppy recovery, testing immediate resistance.
Following up on the previous setup, the price has pushed slightly higher to $0.0085 (+9.9%). The 4H chart shows a steady bounce from the $0.0075 lows, but it is currently printing a red body with an upper wick, indicating resistance near the $0.0090 level.
Trade Plan:
EP: $0.0084 – $0.0086 (Current consolidation zone. Wait for a confirmed 4H green candle close above $0.0088 to validate a breakout).
**SL:** $0.0078 (Strict stop below the recent structural low).
Targets:
🎯 TP1: $0.0092
🎯 TP2: $0.0095
🎯 TP3: $0.0100
Note: ⚠️ Caution: The chart shows a relief bounce within a broader downtrend. It needs a strong surge in volume to push through the immediate resistance. If it loses the $0.0083 support, expect a retest of the $0.0075 lows. DYOR.
#COOKIE #CookieDAO #Crypto #Trading #Long
$ZEC
$BLESS
12
·
--
Bullish
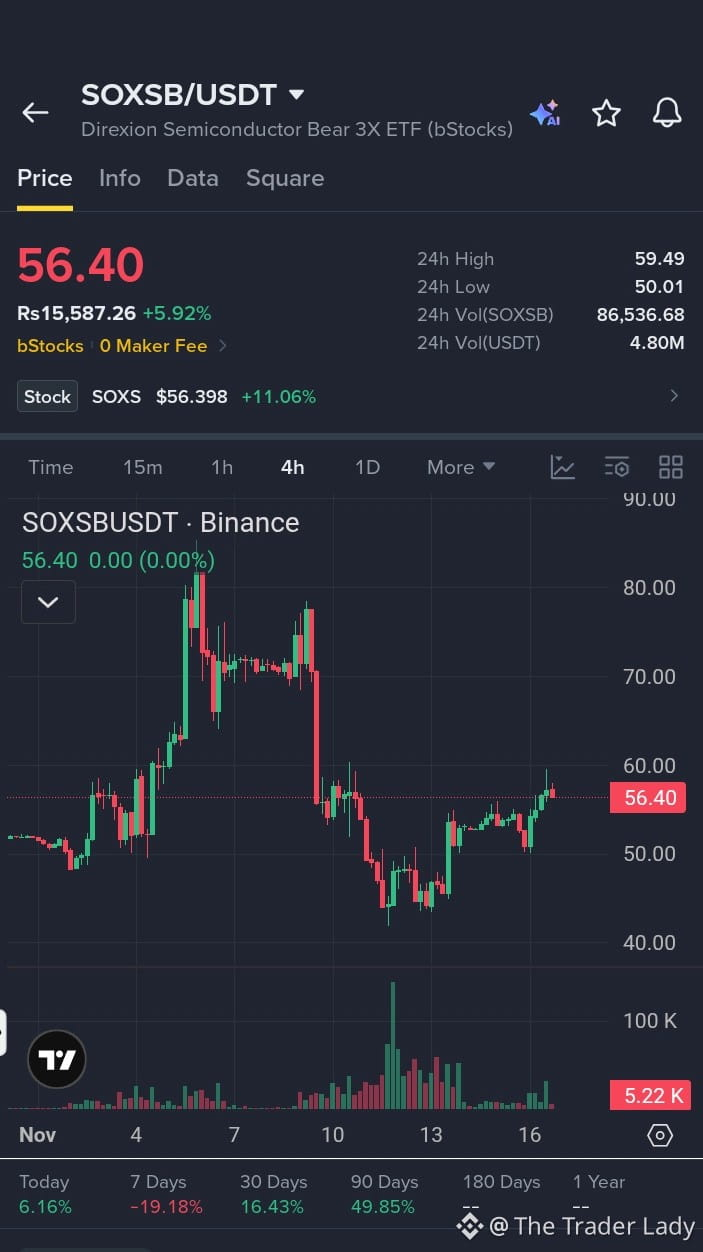
$SOXSB A sustained upward trend means that positive momentum is firmly established, shifting the focus from capital preservation to strategic growth. Positioning your assets at this juncture allows you to capture the maximum upside of the current cycle. By aligning with the prevailing strength early on, you set the stage for compounding gains over the long term
Choppy recovery after a heavy pullback.
Following up on the previous setup, the price is holding at $56.40 (+5.9%). The 4H chart shows a steady recovery from the $45.00 support, but it is currently facing resistance near the $60.00 psychological level.
Trade Plan:
EP: $54.00 – $56.50 (Current consolidation zone. Wait for a confirmed 4H green candle close above $58.00 to validate a breakout).
**SL:** $48.00 (Strict stop below the recent structural higher-low).
Targets:
🎯 TP1: $60.00
🎯 TP2: $65.00
🎯 TP3: $70.00
Note: 💡 Context: This is a tokenized 3x leveraged inverse ETF. The structure is recovering, but it needs a strong push in volume to clear the $60 resistance. If it rejects here, expect a retest of the $52 support. Trail stops to protect gains. DYOR.
#SOXSB #Stocks #Trading #Long
{spot}(SOXSBUSDT)
$BLESS
{alpha}(560x7c8217517ed4711fe2deccdfeffe8d906b9ae11f)
$VINE
{alpha}(CT_5016AJcP7wuLwmRYLBNbi825wgguaPsWzPBEHcHndpRpump)
$SOXSB A sustained upward trend means that positive momentum is firmly established, shifting the focus from capital preservation to strategic growth. Positioning your assets at this juncture allows you to capture the maximum upside of the current cycle. By aligning with the prevailing strength early on, you set the stage for compounding gains over the long term
Choppy recovery after a heavy pullback.
Following up on the previous setup, the price is holding at $56.40 (+5.9%). The 4H chart shows a steady recovery from the $45.00 support, but it is currently facing resistance near the $60.00 psychological level.
Trade Plan:
EP: $54.00 – $56.50 (Current consolidation zone. Wait for a confirmed 4H green candle close above $58.00 to validate a breakout).
**SL:** $48.00 (Strict stop below the recent structural higher-low).
Targets:
🎯 TP1: $60.00
🎯 TP2: $65.00
🎯 TP3: $70.00
Note: 💡 Context: This is a tokenized 3x leveraged inverse ETF. The structure is recovering, but it needs a strong push in volume to clear the $60 resistance. If it rejects here, expect a retest of the $52 support. Trail stops to protect gains. DYOR.
#SOXSB #Stocks #Trading #Long
$BLESS
$VINE
Choppy recovery after a heavy pullback.
Following up on the previous setup, the price is holding at $56.40 (+5.9%). The 4H chart shows a steady recovery from the $45.00 support, but it is currently facing resistance near the $60.00 psychological level.
Trade Plan:
EP: $54.00 – $56.50 (Current consolidation zone. Wait for a confirmed 4H green candle close above $58.00 to validate a breakout).
**SL:** $48.00 (Strict stop below the recent structural higher-low).
Targets:
🎯 TP1: $60.00
🎯 TP2: $65.00
🎯 TP3: $70.00
Note: 💡 Context: This is a tokenized 3x leveraged inverse ETF. The structure is recovering, but it needs a strong push in volume to clear the $60 resistance. If it rejects here, expect a retest of the $52 support. Trail stops to protect gains. DYOR.
#SOXSB #Stocks #Trading #Long
$BLESS
$VINE
1
·
--
Bullish
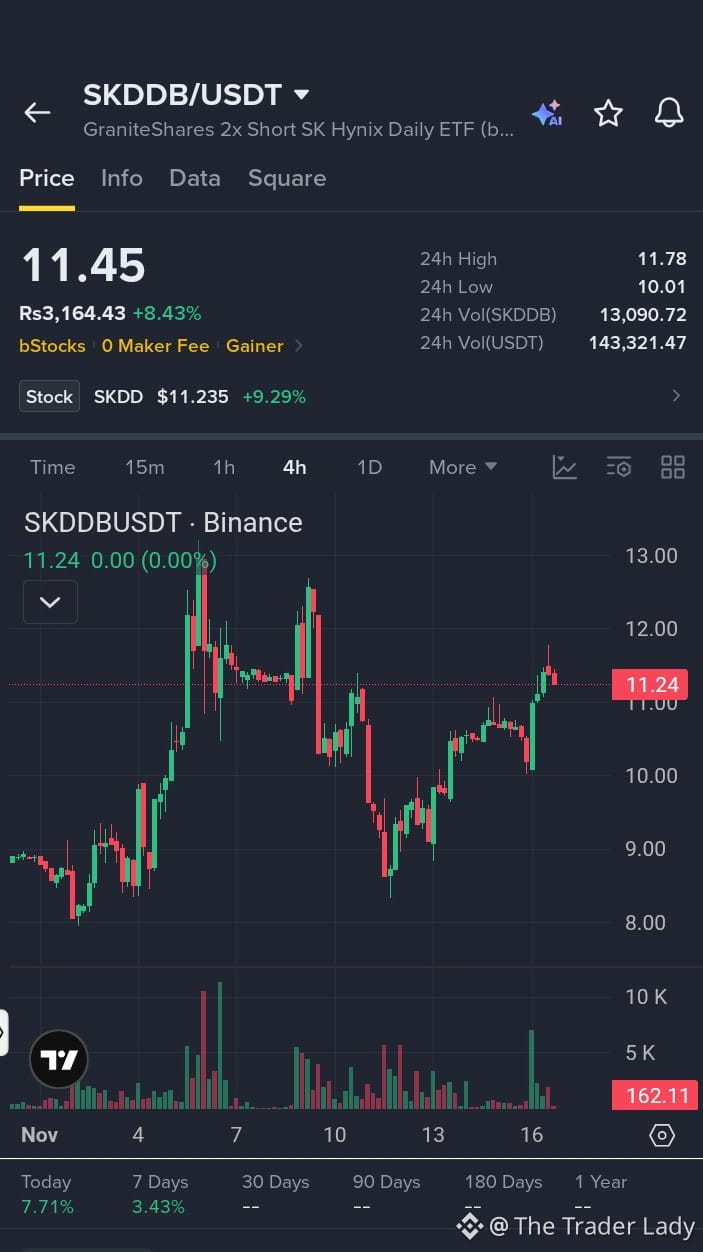
$SKDDB Traction is no longer just a projection; positive momentum is firmly established and driving real user adoption. For early supporters and team members, positioning at this juncture captures the maximum upside of our upcoming scaling phase. We have moved past the initial hurdles and are entering a high-growth period where today’s commitment translates into tomorrow's biggest wins.
Choppy consolidation after a volatile swing.
Following up on the previous setup, the price is hovering at $11.45 (+8.4%). The 4H chart shows it is recovering from the recent dip to the $8.50 support, but the current candle is printing a red body with an upper wick, indicating resistance near the $12.00 level.
Trade Plan:
EP: $11.00 – $11.50 (Current consolidation zone. Wait for a confirmed 4H green candle close above $11.80 to validate a breakout).
**SL:** $10.00 (Strict stop below the recent structural higher-low).
Targets:
🎯 TP1: $12.00
🎯 TP2: $12.80
🎯 TP3: $13.50
Note: 💡 Context: This is a tokenized 2x leveraged inverse ETF. The trend is choppy. It needs a strong push in volume to clear the overhead resistance. If it loses the $10.50 support, expect a retest of the $9.00 lows. Trail stops to protect gains. DYOR.
#SKDDB #Stocks #Trading #Long
{spot}(SKDDBUSDT)
$EVAA
{alpha}(560xaa036928c9c0df07d525b55ea8ee690bb5a628c1)
$SPACE
{alpha}(560x87acfa3fd7a6e0d48677d070644d76905c2bdc00)
$SKDDB Traction is no longer just a projection; positive momentum is firmly established and driving real user adoption. For early supporters and team members, positioning at this juncture captures the maximum upside of our upcoming scaling phase. We have moved past the initial hurdles and are entering a high-growth period where today’s commitment translates into tomorrow's biggest wins.
Choppy consolidation after a volatile swing.
Following up on the previous setup, the price is hovering at $11.45 (+8.4%). The 4H chart shows it is recovering from the recent dip to the $8.50 support, but the current candle is printing a red body with an upper wick, indicating resistance near the $12.00 level.
Trade Plan:
EP: $11.00 – $11.50 (Current consolidation zone. Wait for a confirmed 4H green candle close above $11.80 to validate a breakout).
**SL:** $10.00 (Strict stop below the recent structural higher-low).
Targets:
🎯 TP1: $12.00
🎯 TP2: $12.80
🎯 TP3: $13.50
Note: 💡 Context: This is a tokenized 2x leveraged inverse ETF. The trend is choppy. It needs a strong push in volume to clear the overhead resistance. If it loses the $10.50 support, expect a retest of the $9.00 lows. Trail stops to protect gains. DYOR.
#SKDDB #Stocks #Trading #Long
$EVAA
$SPACE
Choppy consolidation after a volatile swing.
Following up on the previous setup, the price is hovering at $11.45 (+8.4%). The 4H chart shows it is recovering from the recent dip to the $8.50 support, but the current candle is printing a red body with an upper wick, indicating resistance near the $12.00 level.
Trade Plan:
EP: $11.00 – $11.50 (Current consolidation zone. Wait for a confirmed 4H green candle close above $11.80 to validate a breakout).
**SL:** $10.00 (Strict stop below the recent structural higher-low).
Targets:
🎯 TP1: $12.00
🎯 TP2: $12.80
🎯 TP3: $13.50
Note: 💡 Context: This is a tokenized 2x leveraged inverse ETF. The trend is choppy. It needs a strong push in volume to clear the overhead resistance. If it loses the $10.50 support, expect a retest of the $9.00 lows. Trail stops to protect gains. DYOR.
#SKDDB #Stocks #Trading #Long
$EVAA
$SPACE
4
·
--
Bullish
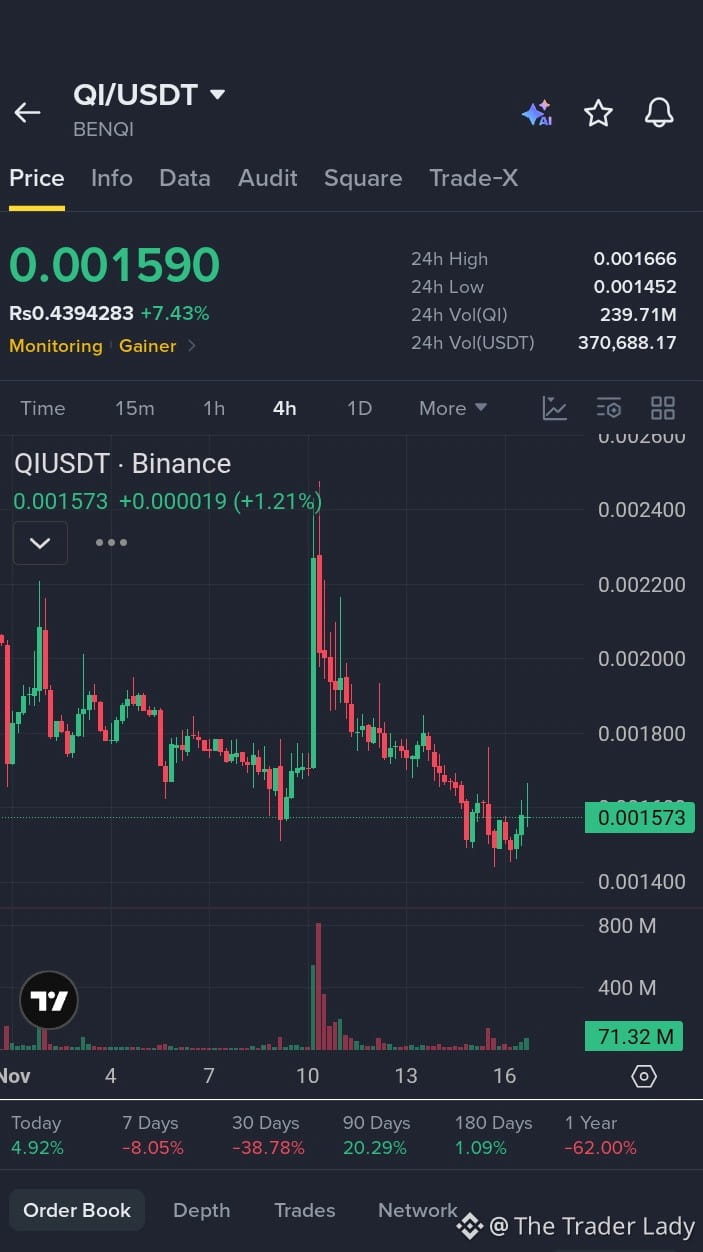
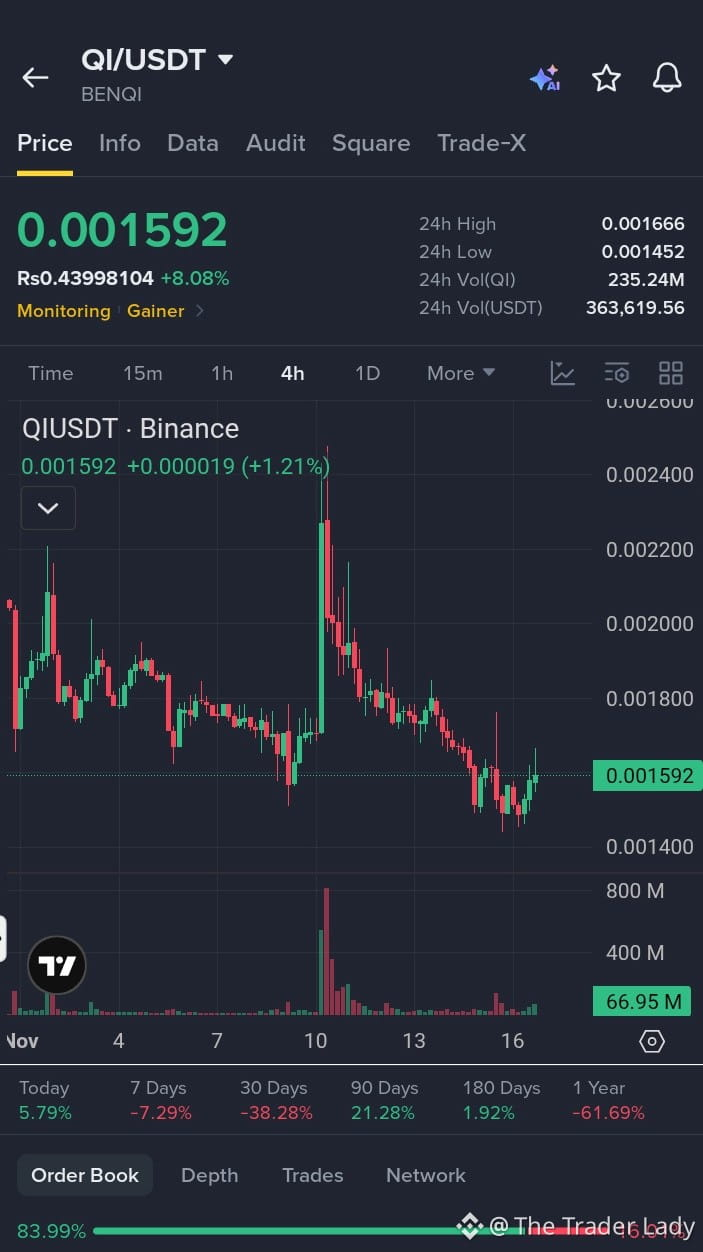
$QI Recent performance data confirms that positive momentum is firmly established, reducing the uncertainty that often clouds early decisions. Consequently, positioning at this juncture represents a calculated move that captures maximum upside while the trend still has plenty of room to run. Entering now strikes the ideal balance between confirmed strength and high growth potential.
Weak bounce, fading momentum.
Following up on the previous setup, the price is holding around $0.0015 (+7.4%). The 4H chart shows the relief bounce has stalled, with the current candle printing a red body and a long upper wick. Volume remains low.
Trade Plan:
EP: Wait. Do not chase this weak bounce. Look for a confirmed 4H green candle close above $0.0017 to validate a reversal, or wait for a retest of the $0.0014 support.
SL: $0.0013 (Strict stop below the recent structural low).
Targets:
🎯 TP1: $0.0018
🎯 TP2: $0.0020
🎯 TP3: $0.0022
Note: ⚠️ Caution: The chart shows a weak relief bounce with thin volume. It needs a strong surge in buying pressure to clear the overhead resistance. If it loses the $0.0015 support, expect a retest of the $0.0014 lows. DYOR.
#QI #BENQI #Crypto #Trading #Long
{spot}(QIUSDT)
$BLESS
{alpha}(560x7c8217517ed4711fe2deccdfeffe8d906b9ae11f)
$VINE
{alpha}(CT_5016AJcP7wuLwmRYLBNbi825wgguaPsWzPBEHcHndpRpump)
$QI Recent performance data confirms that positive momentum is firmly established, reducing the uncertainty that often clouds early decisions. Consequently, positioning at this juncture represents a calculated move that captures maximum upside while the trend still has plenty of room to run. Entering now strikes the ideal balance between confirmed strength and high growth potential.
Weak bounce, fading momentum.
Following up on the previous setup, the price is holding around $0.0015 (+7.4%). The 4H chart shows the relief bounce has stalled, with the current candle printing a red body and a long upper wick. Volume remains low.
Trade Plan:
EP: Wait. Do not chase this weak bounce. Look for a confirmed 4H green candle close above $0.0017 to validate a reversal, or wait for a retest of the $0.0014 support.
SL: $0.0013 (Strict stop below the recent structural low).
Targets:
🎯 TP1: $0.0018
🎯 TP2: $0.0020
🎯 TP3: $0.0022
Note: ⚠️ Caution: The chart shows a weak relief bounce with thin volume. It needs a strong surge in buying pressure to clear the overhead resistance. If it loses the $0.0015 support, expect a retest of the $0.0014 lows. DYOR.
#QI #BENQI #Crypto #Trading #Long
$BLESS
$VINE
Weak bounce, fading momentum.
Following up on the previous setup, the price is holding around $0.0015 (+7.4%). The 4H chart shows the relief bounce has stalled, with the current candle printing a red body and a long upper wick. Volume remains low.
Trade Plan:
EP: Wait. Do not chase this weak bounce. Look for a confirmed 4H green candle close above $0.0017 to validate a reversal, or wait for a retest of the $0.0014 support.
SL: $0.0013 (Strict stop below the recent structural low).
Targets:
🎯 TP1: $0.0018
🎯 TP2: $0.0020
🎯 TP3: $0.0022
Note: ⚠️ Caution: The chart shows a weak relief bounce with thin volume. It needs a strong surge in buying pressure to clear the overhead resistance. If it loses the $0.0015 support, expect a retest of the $0.0014 lows. DYOR.
#QI #BENQI #Crypto #Trading #Long
$BLESS
$VINE
3
·
--
Bullish
$QI Make no mistake—positive momentum is firmly established, and the window of opportunity is wide open. Positioning yourself at this exact juncture is the smartest move you can make to capture maximum upside. As more people recognize this upward shift, the entry point will become less favorable, making immediate action essential for securing top-tier results
Weak bounce in a broader downtrend.
Following up on the previous setup, the price is holding around $0.0015 (+8%). The 4H chart shows a minor recovery from the recent lows, but the overall structure remains bearish after the massive drop from the $0.0024 peak. Volume is fading.
Trade Plan:
EP: Wait. Do not chase this weak bounce. Look for a confirmed 4H green candle close above $0.0017 to validate a reversal, or wait for a retest of the $0.0014 support.
SL: $0.0013 (Strict stop below the recent structural low).
Targets:
🎯 TP1: $0.0018
🎯 TP2: $0.0020
🎯 TP3: $0.0022
Note: ⚠️ Caution: The chart shows a relief bounce with thin volume and low momentum. It needs a strong surge in buying pressure to clear the overhead resistance. If it loses the $0.0015 support, expect a retest of the $0.0014 lows. DYOR.
#QI #BENQI #Crypto #Trading #Long
{spot}(QIUSDT)
$VINE
{alpha}(CT_5016AJcP7wuLwmRYLBNbi825wgguaPsWzPBEHcHndpRpump)
$BLESS
{future}(BLESSUSDT)
$QI Make no mistake—positive momentum is firmly established, and the window of opportunity is wide open. Positioning yourself at this exact juncture is the smartest move you can make to capture maximum upside. As more people recognize this upward shift, the entry point will become less favorable, making immediate action essential for securing top-tier results
Weak bounce in a broader downtrend.
Following up on the previous setup, the price is holding around $0.0015 (+8%). The 4H chart shows a minor recovery from the recent lows, but the overall structure remains bearish after the massive drop from the $0.0024 peak. Volume is fading.
Trade Plan:
EP: Wait. Do not chase this weak bounce. Look for a confirmed 4H green candle close above $0.0017 to validate a reversal, or wait for a retest of the $0.0014 support.
SL: $0.0013 (Strict stop below the recent structural low).
Targets:
🎯 TP1: $0.0018
🎯 TP2: $0.0020
🎯 TP3: $0.0022
Note: ⚠️ Caution: The chart shows a relief bounce with thin volume and low momentum. It needs a strong surge in buying pressure to clear the overhead resistance. If it loses the $0.0015 support, expect a retest of the $0.0014 lows. DYOR.
#QI #BENQI #Crypto #Trading #Long
$VINE
$BLESS
Weak bounce in a broader downtrend.
Following up on the previous setup, the price is holding around $0.0015 (+8%). The 4H chart shows a minor recovery from the recent lows, but the overall structure remains bearish after the massive drop from the $0.0024 peak. Volume is fading.
Trade Plan:
EP: Wait. Do not chase this weak bounce. Look for a confirmed 4H green candle close above $0.0017 to validate a reversal, or wait for a retest of the $0.0014 support.
SL: $0.0013 (Strict stop below the recent structural low).
Targets:
🎯 TP1: $0.0018
🎯 TP2: $0.0020
🎯 TP3: $0.0022
Note: ⚠️ Caution: The chart shows a relief bounce with thin volume and low momentum. It needs a strong surge in buying pressure to clear the overhead resistance. If it loses the $0.0015 support, expect a retest of the $0.0014 lows. DYOR.
#QI #BENQI #Crypto #Trading #Long
$VINE
$BLESS
10
·
--
Bullish
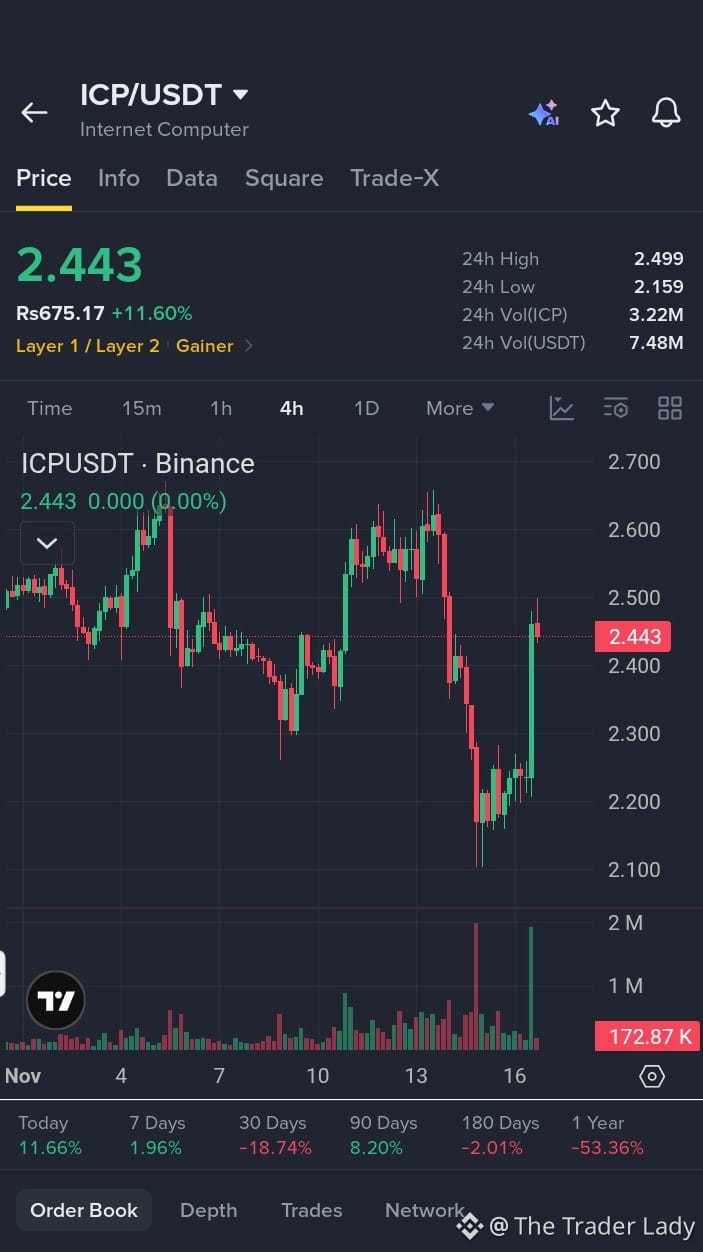
$ICP Customer interest and positive momentum are firmly established, creating an environment ripe for rapid expansion. Positioning our offerings aggressively at this juncture enables us to capture the maximum upside in market share and revenue. The market is ready to buy, and aligning our efforts right now guarantees we get the greatest possible return on our outreach.
Strong recovery, testing overhead resistance.
Following up on the previous setup, the price is holding at $2.44 (+11.6%) after bouncing from the $2.15 support. The 4H chart shows a solid green recovery candle, but it is currently facing selling pressure near the $2.50 level, leaving an upper wick.
Trade Plan:
EP: $2.40 – $2.46 (Current consolidation zone. Wait for a confirmed 4H green candle close above $2.50 to validate a breakout).
**SL:** $2.20 (Strict stop below the recent structural higher-low).
Targets:
🎯 TP1: $2.60
🎯 TP2: $2.70 (Previous major high)
🎯 TP3: $2.85
Note: The bounce is aggressive, but it needs a surge in volume to push through the immediate resistance. If it rejects here, expect a retest of the $2.35 support. Trail stops to protect gains. DYOR.
#ICP #InternetComputer #Crypto #Trading #Long
{future}(ICPUSDT)
$EVAA
{alpha}(560xaa036928c9c0df07d525b55ea8ee690bb5a628c1)
$SPACE
{future}(SPACEUSDT)
$ICP Customer interest and positive momentum are firmly established, creating an environment ripe for rapid expansion. Positioning our offerings aggressively at this juncture enables us to capture the maximum upside in market share and revenue. The market is ready to buy, and aligning our efforts right now guarantees we get the greatest possible return on our outreach.
Strong recovery, testing overhead resistance.
Following up on the previous setup, the price is holding at $2.44 (+11.6%) after bouncing from the $2.15 support. The 4H chart shows a solid green recovery candle, but it is currently facing selling pressure near the $2.50 level, leaving an upper wick.
Trade Plan:
EP: $2.40 – $2.46 (Current consolidation zone. Wait for a confirmed 4H green candle close above $2.50 to validate a breakout).
**SL:** $2.20 (Strict stop below the recent structural higher-low).
Targets:
🎯 TP1: $2.60
🎯 TP2: $2.70 (Previous major high)
🎯 TP3: $2.85
Note: The bounce is aggressive, but it needs a surge in volume to push through the immediate resistance. If it rejects here, expect a retest of the $2.35 support. Trail stops to protect gains. DYOR.
#ICP #InternetComputer #Crypto #Trading #Long
$EVAA
$SPACE
Strong recovery, testing overhead resistance.
Following up on the previous setup, the price is holding at $2.44 (+11.6%) after bouncing from the $2.15 support. The 4H chart shows a solid green recovery candle, but it is currently facing selling pressure near the $2.50 level, leaving an upper wick.
Trade Plan:
EP: $2.40 – $2.46 (Current consolidation zone. Wait for a confirmed 4H green candle close above $2.50 to validate a breakout).
**SL:** $2.20 (Strict stop below the recent structural higher-low).
Targets:
🎯 TP1: $2.60
🎯 TP2: $2.70 (Previous major high)
🎯 TP3: $2.85
Note: The bounce is aggressive, but it needs a surge in volume to push through the immediate resistance. If it rejects here, expect a retest of the $2.35 support. Trail stops to protect gains. DYOR.
#ICP #InternetComputer #Crypto #Trading #Long
$EVAA
$SPACE
3
·
--
Bullish
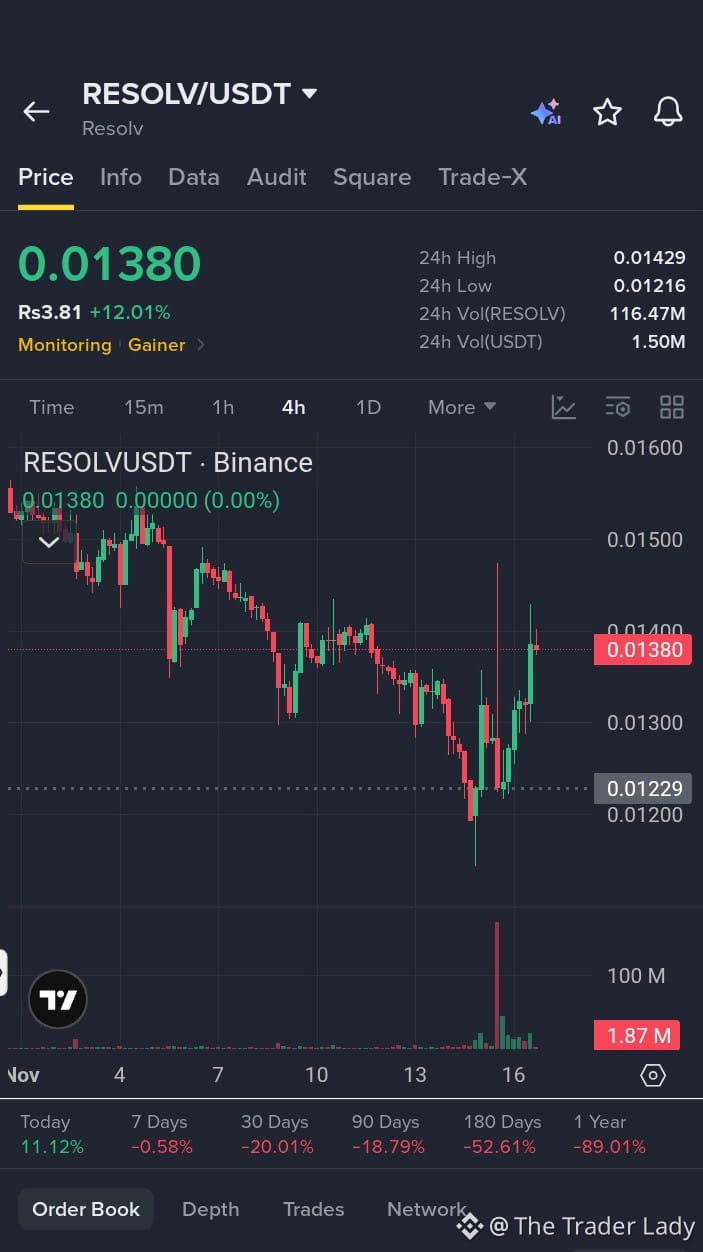
$RESOLV When positive momentum is firmly established in your life or career, hesitation is your biggest enemy. Positioning yourself boldly at this juncture allows you to ride that wave of energy and capture the maximum upside of your hard work. Everything is aligning in your favor, so lean into the progress you have made and seize the full potential of this moment
Choppy consolidation, fading momentum.
Following up on the previous setup, the price is holding around $0.0138 (+12%). The 4H chart shows the recent bounce has stalled, with the current candle printing a red body and a long upper wick. Volume remains extremely low.
Trade Plan:
EP: Wait. Do not chase this weak bounce. Look for a confirmed 4H green candle close above $0.0145 to validate a breakout, or wait for a pullback to hold support around the $0.0128-$0.0130 zone.
**SL:** $0.0115 (Strict stop below the recent structural low).
Targets:
🎯 TP1: $0.0150
🎯 TP2: $0.0160
🎯 TP3: $0.0175
Note: ⚠️ Caution: The chart shows a relief bounce with heavy rejection wicks and thin volume. It needs a strong surge in buying pressure to clear the overhead resistance. If it loses the $0.0130 support, expect a retest of the $0.0120 lows. DYOR.
#RESOLV #Resolv #Crypto #Trading #Long
{future}(RESOLVUSDT)
$VINE
{alpha}(CT_5016AJcP7wuLwmRYLBNbi825wgguaPsWzPBEHcHndpRpump)
$BLESS
{alpha}(560x7c8217517ed4711fe2deccdfeffe8d906b9ae11f)
$RESOLV When positive momentum is firmly established in your life or career, hesitation is your biggest enemy. Positioning yourself boldly at this juncture allows you to ride that wave of energy and capture the maximum upside of your hard work. Everything is aligning in your favor, so lean into the progress you have made and seize the full potential of this moment
Choppy consolidation, fading momentum.
Following up on the previous setup, the price is holding around $0.0138 (+12%). The 4H chart shows the recent bounce has stalled, with the current candle printing a red body and a long upper wick. Volume remains extremely low.
Trade Plan:
EP: Wait. Do not chase this weak bounce. Look for a confirmed 4H green candle close above $0.0145 to validate a breakout, or wait for a pullback to hold support around the $0.0128-$0.0130 zone.
**SL:** $0.0115 (Strict stop below the recent structural low).
Targets:
🎯 TP1: $0.0150
🎯 TP2: $0.0160
🎯 TP3: $0.0175
Note: ⚠️ Caution: The chart shows a relief bounce with heavy rejection wicks and thin volume. It needs a strong surge in buying pressure to clear the overhead resistance. If it loses the $0.0130 support, expect a retest of the $0.0120 lows. DYOR.
#RESOLV #Resolv #Crypto #Trading #Long
$VINE
$BLESS
Choppy consolidation, fading momentum.
Following up on the previous setup, the price is holding around $0.0138 (+12%). The 4H chart shows the recent bounce has stalled, with the current candle printing a red body and a long upper wick. Volume remains extremely low.
Trade Plan:
EP: Wait. Do not chase this weak bounce. Look for a confirmed 4H green candle close above $0.0145 to validate a breakout, or wait for a pullback to hold support around the $0.0128-$0.0130 zone.
**SL:** $0.0115 (Strict stop below the recent structural low).
Targets:
🎯 TP1: $0.0150
🎯 TP2: $0.0160
🎯 TP3: $0.0175
Note: ⚠️ Caution: The chart shows a relief bounce with heavy rejection wicks and thin volume. It needs a strong surge in buying pressure to clear the overhead resistance. If it loses the $0.0130 support, expect a retest of the $0.0120 lows. DYOR.
#RESOLV #Resolv #Crypto #Trading #Long
$VINE
$BLESS
1
·
--
Bullish
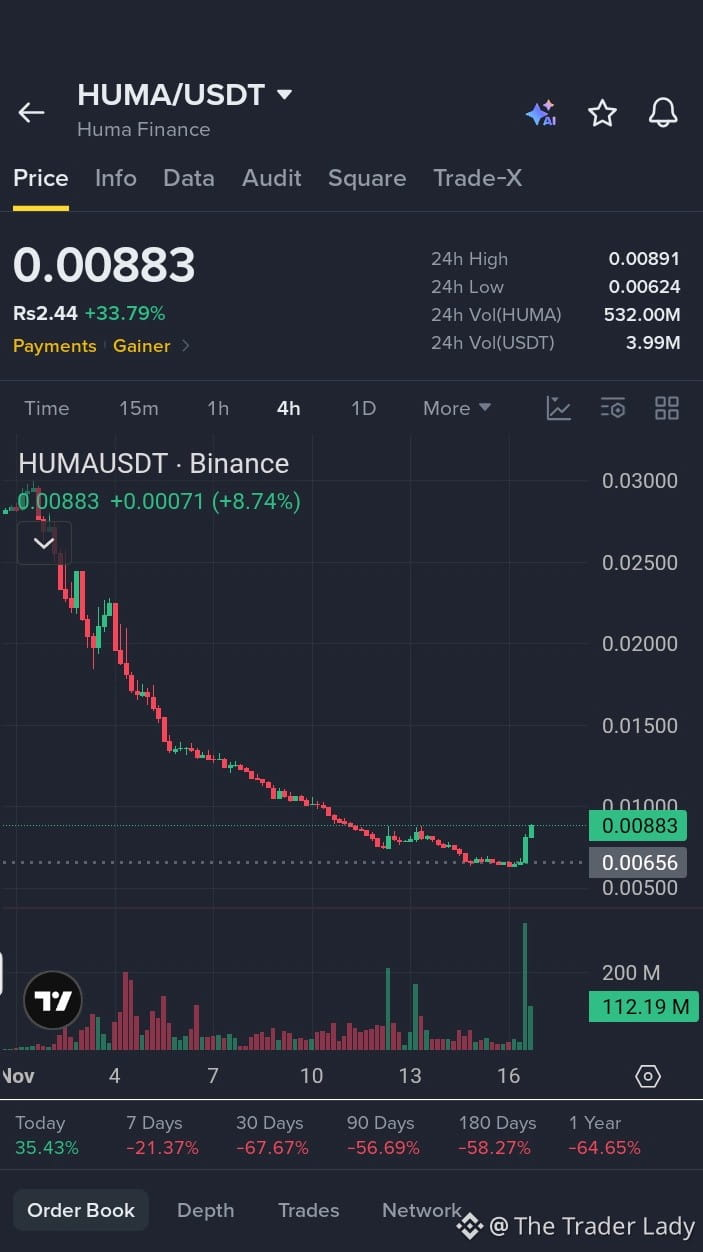
$HUMA All indicators show that positive momentum is solidly underway, giving our organization a rare strategic advantage. Stepping in and committing resources at this exact juncture ensures we capture the maximum upside before competitors can react. The groundwork has been laid, the trend is undeniable, and taking decisive action today will yield the strongest possible returns down the line.
Strong bounce approaching local resistance.
Following up on the previous setup, the price has pushed higher, currently at $0.0088 (+33.7%), nearing the 24h high of $0.0089. The 4H chart shows a solid recovery from the $0.0062 lows, but the current candle is printing a small upper wick, indicating resistance at this level.
Trade Plan:
EP: $0.0085 – $0.0089 (Current zone. Wait for a confirmed 4H green candle close above $0.0090 to validate a breakout).
**SL:** $0.0075 (Strict stop below the recent structural higher-low).
Targets:
🎯 TP1: $0.0095
🎯 TP2: $0.0105
🎯 TP3: $0.0120
Note: The bounce is aggressive, but the overall chart remains in a heavy downtrend. It needs a strong surge in volume to clear the $0.0090 resistance. If it loses the $0.0080 support, expect a retest of the $0.0070 lows. Trail stops to protect gains. DYOR.
#HUMA #HumaFinance #Crypto #Trading #Long
{future}(HUMAUSDT)
$BLESS
{alpha}(560x7c8217517ed4711fe2deccdfeffe8d906b9ae11f)
$VINE
{alpha}(CT_5016AJcP7wuLwmRYLBNbi825wgguaPsWzPBEHcHndpRpump)
$HUMA All indicators show that positive momentum is solidly underway, giving our organization a rare strategic advantage. Stepping in and committing resources at this exact juncture ensures we capture the maximum upside before competitors can react. The groundwork has been laid, the trend is undeniable, and taking decisive action today will yield the strongest possible returns down the line.
Strong bounce approaching local resistance.
Following up on the previous setup, the price has pushed higher, currently at $0.0088 (+33.7%), nearing the 24h high of $0.0089. The 4H chart shows a solid recovery from the $0.0062 lows, but the current candle is printing a small upper wick, indicating resistance at this level.
Trade Plan:
EP: $0.0085 – $0.0089 (Current zone. Wait for a confirmed 4H green candle close above $0.0090 to validate a breakout).
**SL:** $0.0075 (Strict stop below the recent structural higher-low).
Targets:
🎯 TP1: $0.0095
🎯 TP2: $0.0105
🎯 TP3: $0.0120
Note: The bounce is aggressive, but the overall chart remains in a heavy downtrend. It needs a strong surge in volume to clear the $0.0090 resistance. If it loses the $0.0080 support, expect a retest of the $0.0070 lows. Trail stops to protect gains. DYOR.
#HUMA #HumaFinance #Crypto #Trading #Long
$BLESS
$VINE
Strong bounce approaching local resistance.
Following up on the previous setup, the price has pushed higher, currently at $0.0088 (+33.7%), nearing the 24h high of $0.0089. The 4H chart shows a solid recovery from the $0.0062 lows, but the current candle is printing a small upper wick, indicating resistance at this level.
Trade Plan:
EP: $0.0085 – $0.0089 (Current zone. Wait for a confirmed 4H green candle close above $0.0090 to validate a breakout).
**SL:** $0.0075 (Strict stop below the recent structural higher-low).
Targets:
🎯 TP1: $0.0095
🎯 TP2: $0.0105
🎯 TP3: $0.0120
Note: The bounce is aggressive, but the overall chart remains in a heavy downtrend. It needs a strong surge in volume to clear the $0.0090 resistance. If it loses the $0.0080 support, expect a retest of the $0.0070 lows. Trail stops to protect gains. DYOR.
#HUMA #HumaFinance #Crypto #Trading #Long
$BLESS
$VINE
Log in to explore more content
Join global crypto users on Binance Square
⚡️ Get latest and useful information about crypto.
💬 Trusted by the world’s largest crypto exchange.
👍 Discover real insights from verified creators.
Email / Phone number
Trending Topics
A Packed Week of Earnings and Data Tests Markets
58,002 views
381 Discussing
🚨🇺🇸 BIG WEEK AHEAD FOR THE MARKETS!
Markets are pricing in a Fed rate hike in December and $BTC could see some big moves next week.
Here's what's coming:
• Monday: Fed Chair Warsh speaks
• Tuesday: US Retail Sales + $NVDA earnings
• Wednesday: FOMC Minutes
• Thursday: Jobless Claims + Philly Fed Index
• Friday: Consumer Sentiment + Fed speeches
All eyes on $BTC as another important week begins.
#bitcoin
Mookie
·15 Likes
·6.2k views
AnthropicIPOTestsInvestorAppetiteForAI
105,267 views
1,303 Discussing
BitcoinExtendsLosingStreakToSixWeeks
75,468 views
670 Discussing