

nayrbryanGaming
1k Posts

nayrbryanGaming
Report
Block User
Content Creator | Trader | Web3 & Crypto | Photographer| CEO @NNG_ESPORT | Esports pioneer est. 2010 | IG/Twitch: @nayrbryan_gaming | TikTok:@nayrbryanGaming

SOL Holder
Frequent Trader
1.9 Years
924 Following
419 Followers
357 Liked
Posts
All
Quotes
·
--
Bullish
TRADER MOTIVATION / MINI INSIGHT
🧠 Insight of the Day
“Do not chase momentum before knowing where resistance is.”
Why This Matters
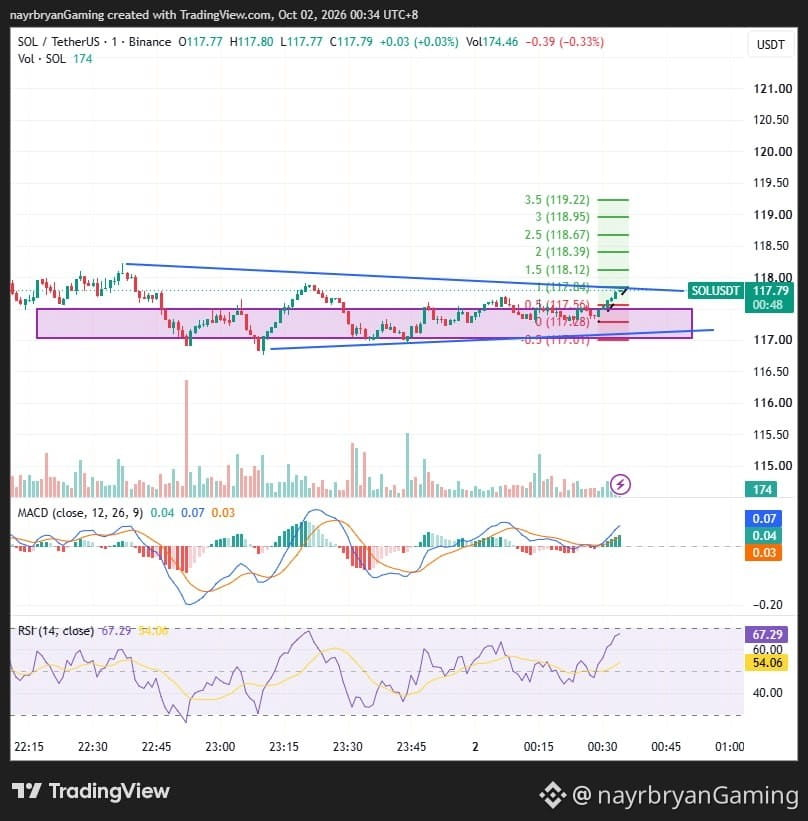
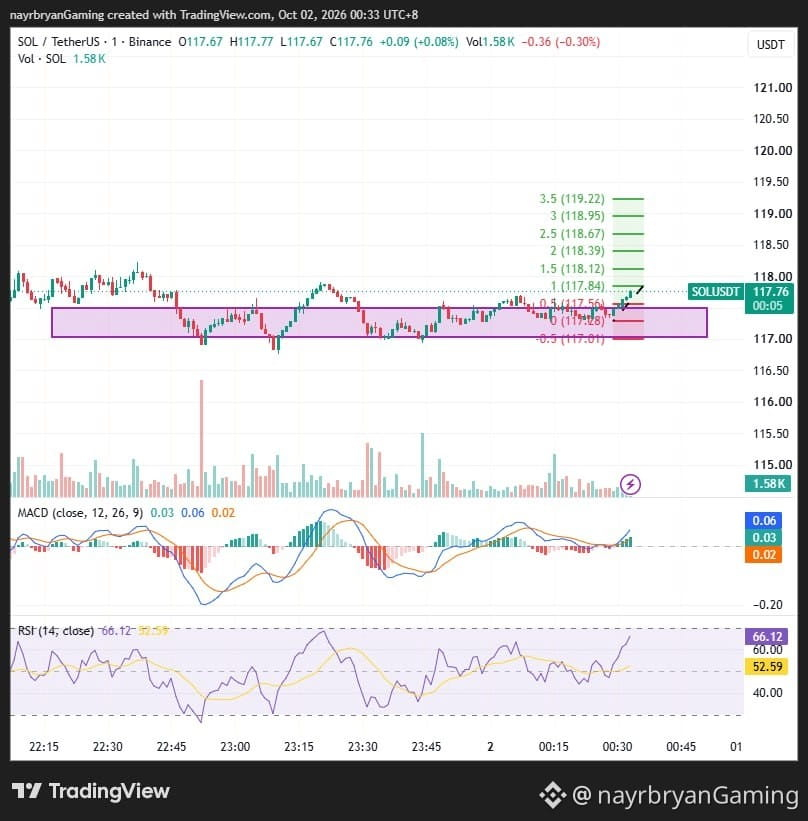
SOL has recovered strongly from the lower support structure and is now approaching the descending trendline.
Momentum is improving, but strong momentum does not automatically mean unlimited upside.
The next reaction around 117.84–118.12 can provide important information about whether buyers can continue the move.
🎯 Trader Checklist
Mark the 117.00–117.30 support
Watch 117.56 reclaim
Monitor 117.84 breakout
Respect 118.12–118.39 resistance
Watch the descending trendline
Avoid chasing extended candles
Protect capital
🧠 Mini Challenge
Before entering, ask:
“Am I entering because structure confirmed — or because the candle looks strong?”
— @nayrbryanGaming #TraderMindset #TradingDiscipline #NoFOMO #CryptoMindset #DYOR #PriceAction #SOLUSDT
🔔 Follow my Binance Square & X (@nayrbryanGaming) for daily chart insights.
TRADER MOTIVATION / MINI INSIGHT
🧠 Insight of the Day
“Do not chase momentum before knowing where resistance is.”
Why This Matters
SOL has recovered strongly from the lower support structure and is now approaching the descending trendline.
Momentum is improving, but strong momentum does not automatically mean unlimited upside.
The next reaction around 117.84–118.12 can provide important information about whether buyers can continue the move.
🎯 Trader Checklist
Mark the 117.00–117.30 support
Watch 117.56 reclaim
Monitor 117.84 breakout
Respect 118.12–118.39 resistance
Watch the descending trendline
Avoid chasing extended candles
Protect capital
🧠 Mini Challenge
Before entering, ask:
“Am I entering because structure confirmed — or because the candle looks strong?”
— @nayrbryanGaming #TraderMindset #TradingDiscipline #NoFOMO #CryptoMindset #DYOR #PriceAction #SOLUSDT
🔔 Follow my Binance Square & X (@nayrbryanGaming) for daily chart insights.
🧠 Insight of the Day
“Do not chase momentum before knowing where resistance is.”
Why This Matters
SOL has recovered strongly from the lower support structure and is now approaching the descending trendline.
Momentum is improving, but strong momentum does not automatically mean unlimited upside.
The next reaction around 117.84–118.12 can provide important information about whether buyers can continue the move.
🎯 Trader Checklist
Mark the 117.00–117.30 support
Watch 117.56 reclaim
Monitor 117.84 breakout
Respect 118.12–118.39 resistance
Watch the descending trendline
Avoid chasing extended candles
Protect capital
🧠 Mini Challenge
Before entering, ask:
“Am I entering because structure confirmed — or because the candle looks strong?”
— @nayrbryanGaming #TraderMindset #TradingDiscipline #NoFOMO #CryptoMindset #DYOR #PriceAction #SOLUSDT
🔔 Follow my Binance Square & X (@nayrbryanGaming) for daily chart insights.
72
·
--
Bullish
LIGHT ANALYSIS / CHART SETUP — SOL/USDT
📈 Structure Overview
Market phase: Support reaction → Recovery → Resistance test
Key support zone: 117.00 – 117.30
Key reclaim: 117.56
Immediate resistance: 117.84
Major resistance: 118.12 – 118.39
Higher resistance: 118.67
📌 What I’m Watching
Scenario A — Bullish Continuation
If SOL holds above 117.56 and clears 117.84, price may rotate toward:
118.12 → 118.39 → 118.67 → 118.95 → 119.22
The descending trendline remains an important confirmation area.
Scenario B — Resistance Rejection
If price fails around 117.84–118.12, SOL may rotate back toward:
117.56 → 117.30 → 117.00
A loss of the lower purple structure would weaken the current recovery setup.
📊 Indicator Check
MACD: Positive and recovering
RSI: 67.29 → strong short-term momentum
Price Structure: Recovery from support + resistance test
Key Confirmation: 117.84 reclaim / 117.56 hold
Note: This is a chart framework, not a trade recommendation. Use it to support your own DYOR-based execution plan.
— @nayrbryanGaming #SOLAnalysis #ChartSetup #PriceAction #SmartMoney #Fibonacci #CryptoTrading #DYOR #NFA
LIGHT ANALYSIS / CHART SETUP — SOL/USDT
📈 Structure Overview
Market phase: Support reaction → Recovery → Resistance test
Key support zone: 117.00 – 117.30
Key reclaim: 117.56
Immediate resistance: 117.84
Major resistance: 118.12 – 118.39
Higher resistance: 118.67
📌 What I’m Watching
Scenario A — Bullish Continuation
If SOL holds above 117.56 and clears 117.84, price may rotate toward:
118.12 → 118.39 → 118.67 → 118.95 → 119.22
The descending trendline remains an important confirmation area.
Scenario B — Resistance Rejection
If price fails around 117.84–118.12, SOL may rotate back toward:
117.56 → 117.30 → 117.00
A loss of the lower purple structure would weaken the current recovery setup.
📊 Indicator Check
MACD: Positive and recovering
RSI: 67.29 → strong short-term momentum
Price Structure: Recovery from support + resistance test
Key Confirmation: 117.84 reclaim / 117.56 hold
Note: This is a chart framework, not a trade recommendation. Use it to support your own DYOR-based execution plan.
— @nayrbryanGaming #SOLAnalysis #ChartSetup #PriceAction #SmartMoney #Fibonacci #CryptoTrading #DYOR #NFA
📈 Structure Overview
Market phase: Support reaction → Recovery → Resistance test
Key support zone: 117.00 – 117.30
Key reclaim: 117.56
Immediate resistance: 117.84
Major resistance: 118.12 – 118.39
Higher resistance: 118.67
📌 What I’m Watching
Scenario A — Bullish Continuation
If SOL holds above 117.56 and clears 117.84, price may rotate toward:
118.12 → 118.39 → 118.67 → 118.95 → 119.22
The descending trendline remains an important confirmation area.
Scenario B — Resistance Rejection
If price fails around 117.84–118.12, SOL may rotate back toward:
117.56 → 117.30 → 117.00
A loss of the lower purple structure would weaken the current recovery setup.
📊 Indicator Check
MACD: Positive and recovering
RSI: 67.29 → strong short-term momentum
Price Structure: Recovery from support + resistance test
Key Confirmation: 117.84 reclaim / 117.56 hold
Note: This is a chart framework, not a trade recommendation. Use it to support your own DYOR-based execution plan.
— @nayrbryanGaming #SOLAnalysis #ChartSetup #PriceAction #SmartMoney #Fibonacci #CryptoTrading #DYOR #NFA
60
·
--
Bullish
DAILY SIGNAL — SOL/USDT
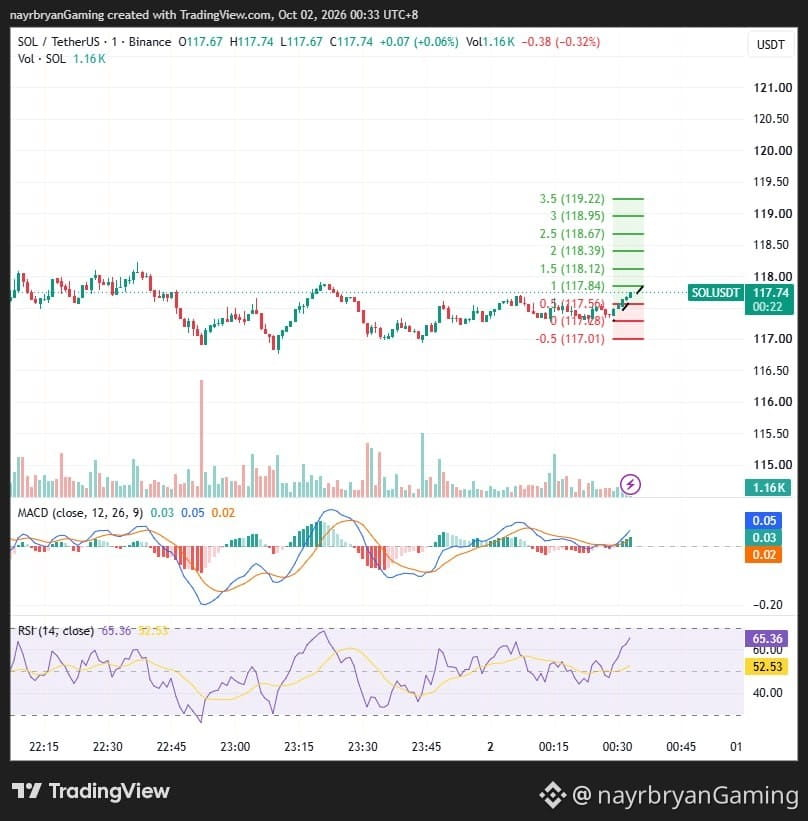
Date: 02 Oct 2026 Timeframe: 1m Intraday Bias: Bullish recovery → resistance test
📊 Market Bias
SOL is recovering from the lower support structure after repeatedly reacting around the 117.00–117.30 area.
Price has reclaimed the 117.56 Fibonacci level and is now trading around 117.79, approaching the descending blue trendline.
The current structure is shifting toward a bullish reaction, but price is entering an important resistance area.
🔹 Key Levels From Chart
Current Price: 117.79
Key Reclaim: 117.56
Immediate Resistance: 117.84
Major Resistance: 118.12 → 118.39
Higher Resistance: 118.67
Key Support Zone: 117.00 → 117.30
🎯 Fibonacci Upside Levels
TP1 → 117.84 (1.0 Fib) TP2 → 118.12 (1.5 Fib) TP3 → 118.39 (2.0 Fib) TP4 → 118.67 (2.5 Fib) TP5 → 118.95 (3.0 Fib) TP6 → 119.22 (3.5 Fib)
📈 Technical Breakdown
SOL has formed a series of reactions from the lower purple support zone.
Price then reclaimed the 117.56 level and pushed toward 117.79, placing the market close to the descending blue trendline.
MACD is currently positive, with the histogram building upward.
RSI is around 67.29, showing strong short-term momentum but also approaching the upper momentum zone.
A sustained reclaim above 117.84 could open the next Fibonacci levels toward 118.12 and 118.39.
However, rejection near the descending trendline could send price back toward the 117.56 area.
🧠 Quick Insight
“Momentum can open the door, but resistance decides whether price can stay above it.”
⚠️ Disclaimer
This is personal market analysis, not financial advice. This chart framework is for educational purposes only.
Always DYOR / DYODD, manage risk properly, and avoid emotional trading.
— @nayrbryanGaming #SOL #SOLUSDT #Crypto #Trading #TechnicalAnalysis #PriceAction #Fibonacci #Binance #DYOR #NFA #NoFOMO
DAILY SIGNAL — SOL/USDT
Date: 02 Oct 2026 Timeframe: 1m Intraday Bias: Bullish recovery → resistance test
📊 Market Bias
SOL is recovering from the lower support structure after repeatedly reacting around the 117.00–117.30 area.
Price has reclaimed the 117.56 Fibonacci level and is now trading around 117.79, approaching the descending blue trendline.
The current structure is shifting toward a bullish reaction, but price is entering an important resistance area.
🔹 Key Levels From Chart
Current Price: 117.79
Key Reclaim: 117.56
Immediate Resistance: 117.84
Major Resistance: 118.12 → 118.39
Higher Resistance: 118.67
Key Support Zone: 117.00 → 117.30
🎯 Fibonacci Upside Levels
TP1 → 117.84 (1.0 Fib) TP2 → 118.12 (1.5 Fib) TP3 → 118.39 (2.0 Fib) TP4 → 118.67 (2.5 Fib) TP5 → 118.95 (3.0 Fib) TP6 → 119.22 (3.5 Fib)
📈 Technical Breakdown
SOL has formed a series of reactions from the lower purple support zone.
Price then reclaimed the 117.56 level and pushed toward 117.79, placing the market close to the descending blue trendline.
MACD is currently positive, with the histogram building upward.
RSI is around 67.29, showing strong short-term momentum but also approaching the upper momentum zone.
A sustained reclaim above 117.84 could open the next Fibonacci levels toward 118.12 and 118.39.
However, rejection near the descending trendline could send price back toward the 117.56 area.
🧠 Quick Insight
“Momentum can open the door, but resistance decides whether price can stay above it.”
⚠️ Disclaimer
This is personal market analysis, not financial advice. This chart framework is for educational purposes only.
Always DYOR / DYODD, manage risk properly, and avoid emotional trading.
— @nayrbryanGaming #SOL #SOLUSDT #Crypto #Trading #TechnicalAnalysis #PriceAction #Fibonacci #Binance #DYOR #NFA #NoFOMO
Date: 02 Oct 2026 Timeframe: 1m Intraday Bias: Bullish recovery → resistance test
📊 Market Bias
SOL is recovering from the lower support structure after repeatedly reacting around the 117.00–117.30 area.
Price has reclaimed the 117.56 Fibonacci level and is now trading around 117.79, approaching the descending blue trendline.
The current structure is shifting toward a bullish reaction, but price is entering an important resistance area.
🔹 Key Levels From Chart
Current Price: 117.79
Key Reclaim: 117.56
Immediate Resistance: 117.84
Major Resistance: 118.12 → 118.39
Higher Resistance: 118.67
Key Support Zone: 117.00 → 117.30
🎯 Fibonacci Upside Levels
TP1 → 117.84 (1.0 Fib) TP2 → 118.12 (1.5 Fib) TP3 → 118.39 (2.0 Fib) TP4 → 118.67 (2.5 Fib) TP5 → 118.95 (3.0 Fib) TP6 → 119.22 (3.5 Fib)
📈 Technical Breakdown
SOL has formed a series of reactions from the lower purple support zone.
Price then reclaimed the 117.56 level and pushed toward 117.79, placing the market close to the descending blue trendline.
MACD is currently positive, with the histogram building upward.
RSI is around 67.29, showing strong short-term momentum but also approaching the upper momentum zone.
A sustained reclaim above 117.84 could open the next Fibonacci levels toward 118.12 and 118.39.
However, rejection near the descending trendline could send price back toward the 117.56 area.
🧠 Quick Insight
“Momentum can open the door, but resistance decides whether price can stay above it.”
⚠️ Disclaimer
This is personal market analysis, not financial advice. This chart framework is for educational purposes only.
Always DYOR / DYODD, manage risk properly, and avoid emotional trading.
— @nayrbryanGaming #SOL #SOLUSDT #Crypto #Trading #TechnicalAnalysis #PriceAction #Fibonacci #Binance #DYOR #NFA #NoFOMO
106
·
--
Bullish
TRADER MINDSET
🧠 Momentum Is Not Confirmation
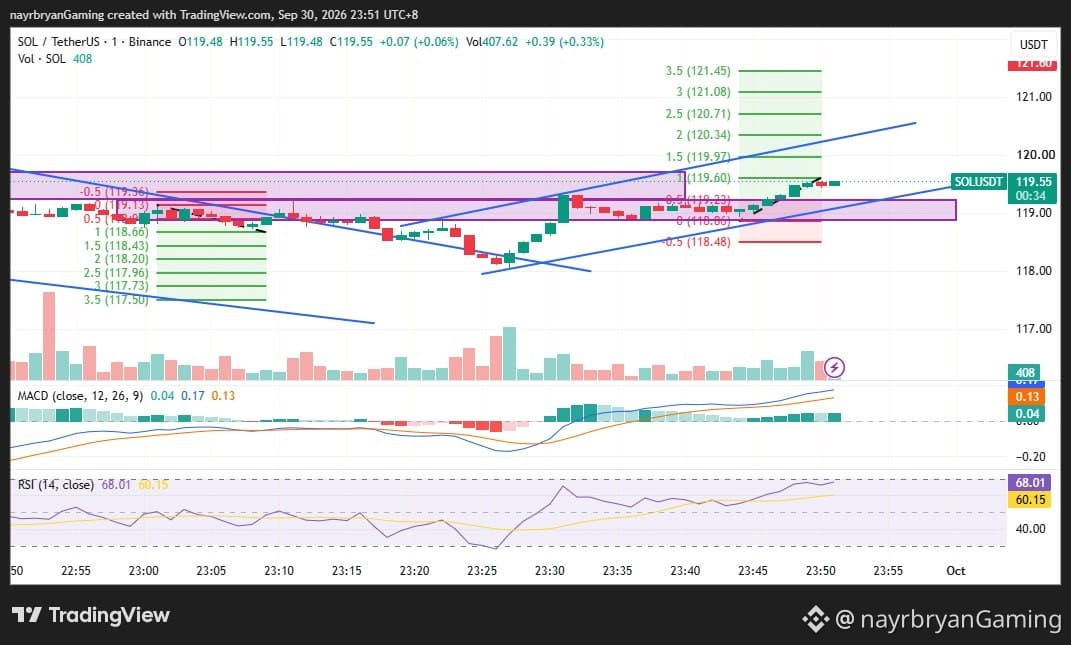
SOL has moved strongly from the lower structure.
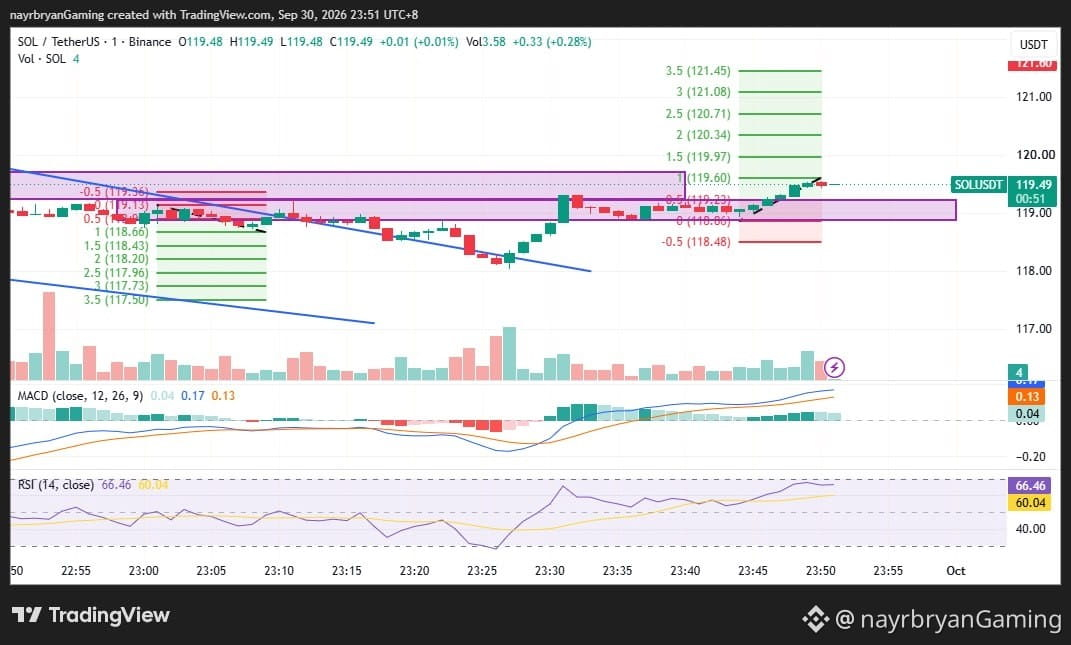
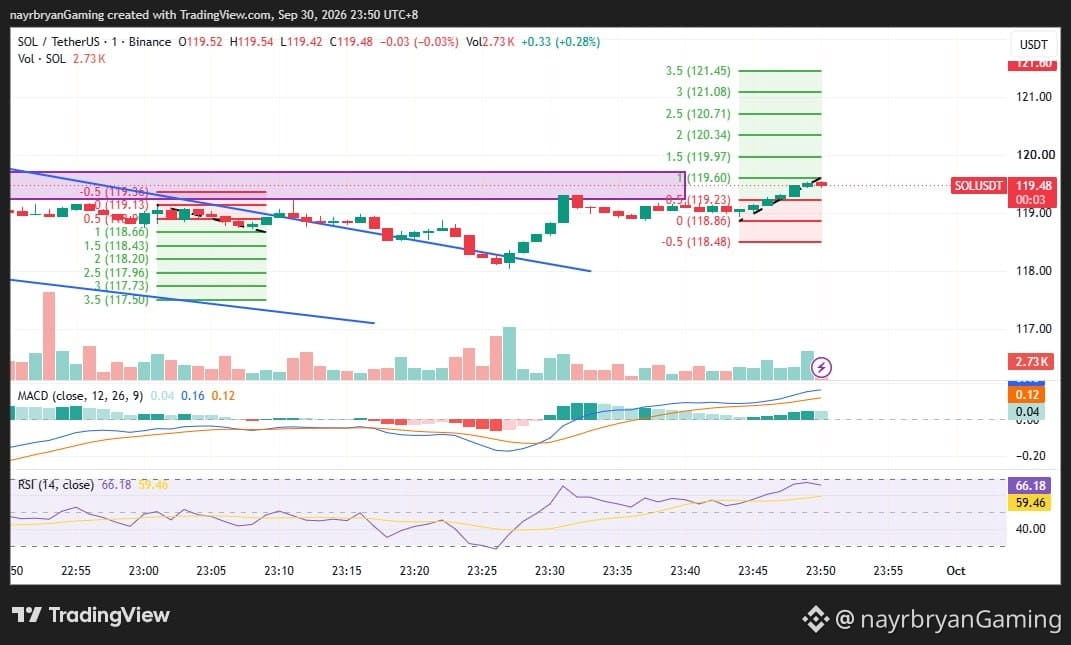
Now price is sitting directly below 119.60.
This is where traders often make the mistake of chasing.
The chart gives us a simple framework:
118.66
→ base
119.23
→ intermediate Fib
119.60
→ breakout decision
119.97 → 120.34 → 120.71
→ expansion levels
The question isn't:
“SOL is going up, so should I chase?”
The better question is:
“Can SOL break 119.60 and actually hold it?”
If yes, the market has provided confirmation.
If not, the current move can still turn into a pullback.
Don't chase momentum.
Wait for structure to confirm it.
— @nayrbryanGaming
#TraderMindset #Discipline #NoFOMO #SOL #DYOR #NFA
TRADER MINDSET
🧠 Momentum Is Not Confirmation
SOL has moved strongly from the lower structure.
Now price is sitting directly below 119.60.
This is where traders often make the mistake of chasing.
The chart gives us a simple framework:
118.66
→ base
119.23
→ intermediate Fib
119.60
→ breakout decision
119.97 → 120.34 → 120.71
→ expansion levels
The question isn't:
“SOL is going up, so should I chase?”
The better question is:
“Can SOL break 119.60 and actually hold it?”
If yes, the market has provided confirmation.
If not, the current move can still turn into a pullback.
Don't chase momentum.
Wait for structure to confirm it.
— @nayrbryanGaming
#TraderMindset #Discipline #NoFOMO #SOL #DYOR #NFA
🧠 Momentum Is Not Confirmation
SOL has moved strongly from the lower structure.
Now price is sitting directly below 119.60.
This is where traders often make the mistake of chasing.
The chart gives us a simple framework:
118.66
→ base
119.23
→ intermediate Fib
119.60
→ breakout decision
119.97 → 120.34 → 120.71
→ expansion levels
The question isn't:
“SOL is going up, so should I chase?”
The better question is:
“Can SOL break 119.60 and actually hold it?”
If yes, the market has provided confirmation.
If not, the current move can still turn into a pullback.
Don't chase momentum.
Wait for structure to confirm it.
— @nayrbryanGaming
#TraderMindset #Discipline #NoFOMO #SOL #DYOR #NFA
57
·
--
Bullish
LIGHT ANALYSIS / CHART SETUP
SOL/USDT — 1m
Price: 119.55
Structure: Recovery / ascending support
Key Levels
Support: 118.66–119.23
Breakout level: 119.60
Upside levels:
119.97
120.34
120.71
121.08
121.45
Lower invalidation reference: 118.48
Scenario A — Bullish Expansion
SOL breaks 119.60 and holds above it.
Next levels:
119.97 → 120.34 → 120.71 → 121.08 → 121.45
The setup becomes stronger if the breakout is followed by a successful retest.
Scenario B — Rejection
SOL rejects 119.60.
Watch:
119.23 → 118.66
A move below 118.66 would weaken the current recovery structure.
Indicator Check
RSI: 68.01
MACD: Positive
Momentum is bullish, but RSI is already elevated.
Strong momentum does not mean unlimited upside.
DYOR / NFA.
— @nayrbryanGaming
#SOLAnalysis #SOLUSDT #CryptoTrading #DYOR
LIGHT ANALYSIS / CHART SETUP
SOL/USDT — 1m
Price: 119.55
Structure: Recovery / ascending support
Key Levels
Support: 118.66–119.23
Breakout level: 119.60
Upside levels:
119.97
120.34
120.71
121.08
121.45
Lower invalidation reference: 118.48
Scenario A — Bullish Expansion
SOL breaks 119.60 and holds above it.
Next levels:
119.97 → 120.34 → 120.71 → 121.08 → 121.45
The setup becomes stronger if the breakout is followed by a successful retest.
Scenario B — Rejection
SOL rejects 119.60.
Watch:
119.23 → 118.66
A move below 118.66 would weaken the current recovery structure.
Indicator Check
RSI: 68.01
MACD: Positive
Momentum is bullish, but RSI is already elevated.
Strong momentum does not mean unlimited upside.
DYOR / NFA.
— @nayrbryanGaming
#SOLAnalysis #SOLUSDT #CryptoTrading #DYOR
SOL/USDT — 1m
Price: 119.55
Structure: Recovery / ascending support
Key Levels
Support: 118.66–119.23
Breakout level: 119.60
Upside levels:
119.97
120.34
120.71
121.08
121.45
Lower invalidation reference: 118.48
Scenario A — Bullish Expansion
SOL breaks 119.60 and holds above it.
Next levels:
119.97 → 120.34 → 120.71 → 121.08 → 121.45
The setup becomes stronger if the breakout is followed by a successful retest.
Scenario B — Rejection
SOL rejects 119.60.
Watch:
119.23 → 118.66
A move below 118.66 would weaken the current recovery structure.
Indicator Check
RSI: 68.01
MACD: Positive
Momentum is bullish, but RSI is already elevated.
Strong momentum does not mean unlimited upside.
DYOR / NFA.
— @nayrbryanGaming
#SOLAnalysis #SOLUSDT #CryptoTrading #DYOR
74
·
--
Bullish
DAILY MARKET SIGNAL — SOL/USDT
📊 Market Structure
SOL has recovered from the 118.48–118.66 area and pushed back above the previous consolidation zone.
Price is now trading around 119.55, directly below the 119.60 Fib 1 level.
The short-term structure has improved, with higher lows developing along the rising support line.
The immediate question is whether SOL can break and hold above 119.60.
🔹 Key Levels
Current Price
119.55
Support / Reaction Zone
118.66–119.23
Fib 0
118.66
Fib 0.5
119.23
Breakout / Fib 1
119.60
Fib 1.5
119.97
Fib 2
120.34
Fib 2.5
120.71
Fib 3
121.08
Fib 3.5
121.45
Lower Invalidation Reference
118.48
📈 Bullish Scenario
If SOL breaks above 119.60 and holds the level on a retest, the next Fibonacci expansion areas are:
119.97 → 120.34 → 120.71 → 121.08 → 121.45
A sustained move above the nearby descending/overhead resistance would provide stronger confirmation of the recovery.
📉 Rejection Scenario
If SOL fails to hold above 119.60, price could rotate back toward:
119.23 → 118.66
A loss of 118.66 would weaken the current recovery structure.
Below 118.48, the bullish setup would be significantly weakened.
📊 Indicator Check
RSI: 68.01
Momentum is clearly stronger than in the previous chart, but RSI is approaching the traditionally elevated zone.
That means momentum is strong, but chasing becomes increasingly risky.
MACD: Positive.
MACD supports the current recovery momentum.
Still, price confirmation remains the primary signal.
🧠 Bottom Line
SOL has recovered strongly and is now testing 119.60.
119.60 is the key decision level.
Break + hold → expansion scenario.
Rejection → pullback toward 119.23 / 118.66 remains possible.
Momentum is strong.
Confirmation still matters.
DYOR / NFA.
— @nayrbryanGaming
#SOL #SOLUSDT #Crypto #TechnicalAnalysis #DYOR #NFA
DAILY MARKET SIGNAL — SOL/USDT
📊 Market Structure
SOL has recovered from the 118.48–118.66 area and pushed back above the previous consolidation zone.
Price is now trading around 119.55, directly below the 119.60 Fib 1 level.
The short-term structure has improved, with higher lows developing along the rising support line.
The immediate question is whether SOL can break and hold above 119.60.
🔹 Key Levels
Current Price
119.55
Support / Reaction Zone
118.66–119.23
Fib 0
118.66
Fib 0.5
119.23
Breakout / Fib 1
119.60
Fib 1.5
119.97
Fib 2
120.34
Fib 2.5
120.71
Fib 3
121.08
Fib 3.5
121.45
Lower Invalidation Reference
118.48
📈 Bullish Scenario
If SOL breaks above 119.60 and holds the level on a retest, the next Fibonacci expansion areas are:
119.97 → 120.34 → 120.71 → 121.08 → 121.45
A sustained move above the nearby descending/overhead resistance would provide stronger confirmation of the recovery.
📉 Rejection Scenario
If SOL fails to hold above 119.60, price could rotate back toward:
119.23 → 118.66
A loss of 118.66 would weaken the current recovery structure.
Below 118.48, the bullish setup would be significantly weakened.
📊 Indicator Check
RSI: 68.01
Momentum is clearly stronger than in the previous chart, but RSI is approaching the traditionally elevated zone.
That means momentum is strong, but chasing becomes increasingly risky.
MACD: Positive.
MACD supports the current recovery momentum.
Still, price confirmation remains the primary signal.
🧠 Bottom Line
SOL has recovered strongly and is now testing 119.60.
119.60 is the key decision level.
Break + hold → expansion scenario.
Rejection → pullback toward 119.23 / 118.66 remains possible.
Momentum is strong.
Confirmation still matters.
DYOR / NFA.
— @nayrbryanGaming
#SOL #SOLUSDT #Crypto #TechnicalAnalysis #DYOR #NFA
📊 Market Structure
SOL has recovered from the 118.48–118.66 area and pushed back above the previous consolidation zone.
Price is now trading around 119.55, directly below the 119.60 Fib 1 level.
The short-term structure has improved, with higher lows developing along the rising support line.
The immediate question is whether SOL can break and hold above 119.60.
🔹 Key Levels
Current Price
119.55
Support / Reaction Zone
118.66–119.23
Fib 0
118.66
Fib 0.5
119.23
Breakout / Fib 1
119.60
Fib 1.5
119.97
Fib 2
120.34
Fib 2.5
120.71
Fib 3
121.08
Fib 3.5
121.45
Lower Invalidation Reference
118.48
📈 Bullish Scenario
If SOL breaks above 119.60 and holds the level on a retest, the next Fibonacci expansion areas are:
119.97 → 120.34 → 120.71 → 121.08 → 121.45
A sustained move above the nearby descending/overhead resistance would provide stronger confirmation of the recovery.
📉 Rejection Scenario
If SOL fails to hold above 119.60, price could rotate back toward:
119.23 → 118.66
A loss of 118.66 would weaken the current recovery structure.
Below 118.48, the bullish setup would be significantly weakened.
📊 Indicator Check
RSI: 68.01
Momentum is clearly stronger than in the previous chart, but RSI is approaching the traditionally elevated zone.
That means momentum is strong, but chasing becomes increasingly risky.
MACD: Positive.
MACD supports the current recovery momentum.
Still, price confirmation remains the primary signal.
🧠 Bottom Line
SOL has recovered strongly and is now testing 119.60.
119.60 is the key decision level.
Break + hold → expansion scenario.
Rejection → pullback toward 119.23 / 118.66 remains possible.
Momentum is strong.
Confirmation still matters.
DYOR / NFA.
— @nayrbryanGaming
#SOL #SOLUSDT #Crypto #TechnicalAnalysis #DYOR #NFA
110
·
--
Bearish
TRADER MOTIVATION / MINI INSIGHT
🧠 Insight of the Day
“Do not confuse a rebound with a reversal.”
Why This Matters
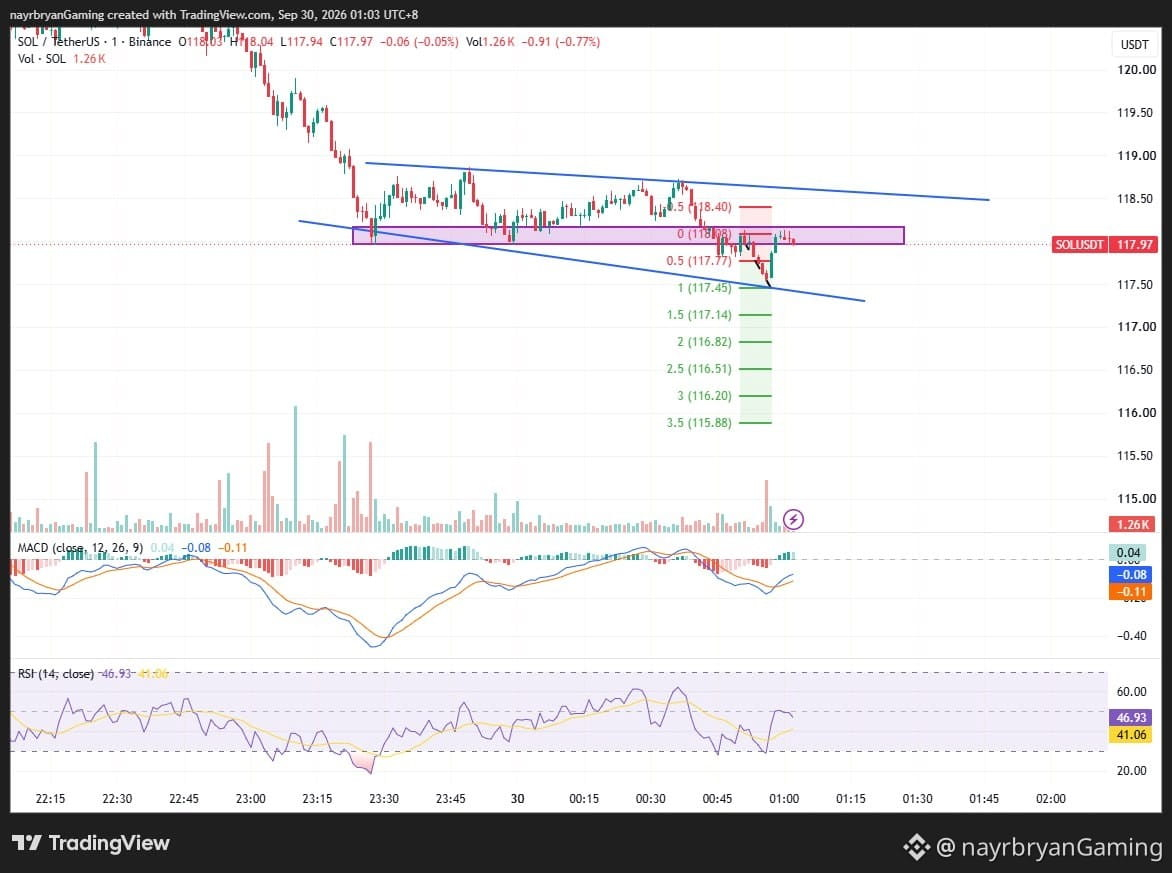
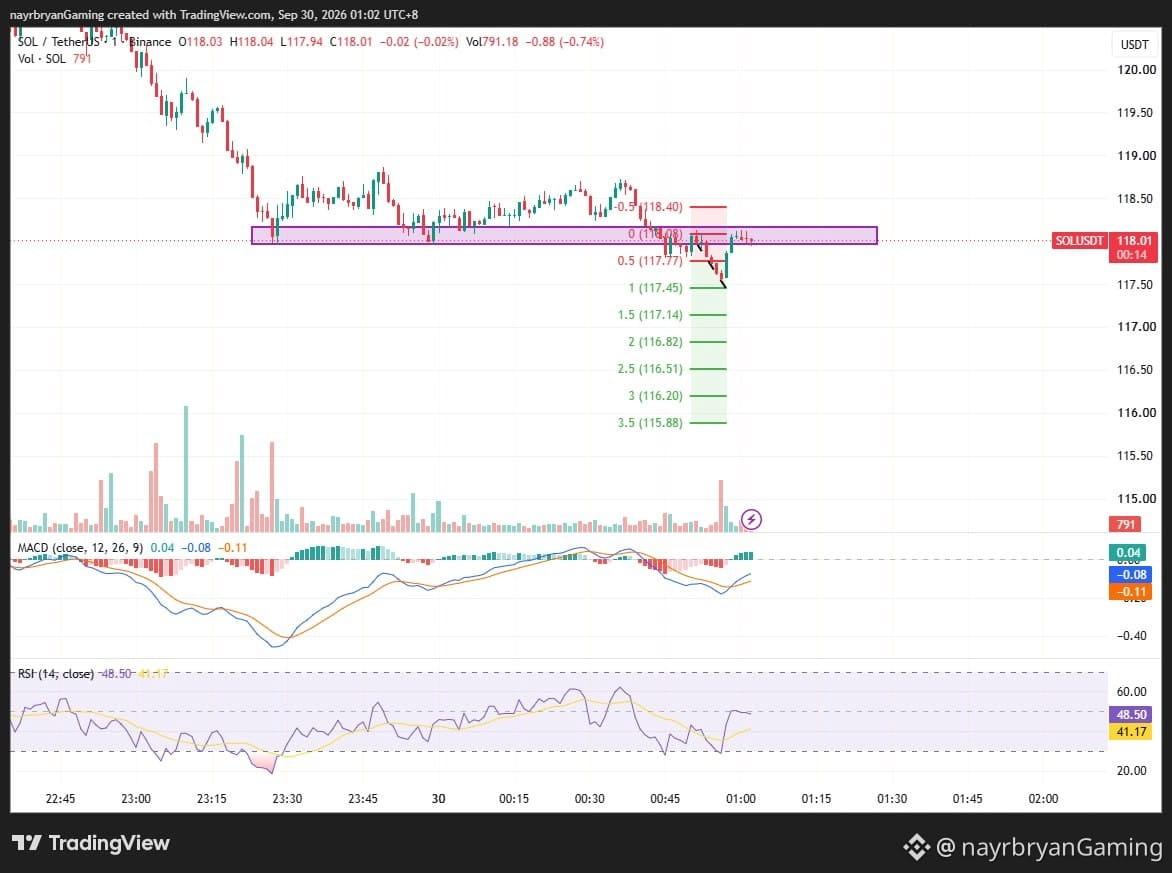
SOL bounced from the 117.45 area and returned toward the 117.95–118.20 structure zone.
That reaction alone does not confirm a trend reversal.
The important question is whether price can reclaim resistance and hold it.
Smart execution focuses on:
• Structure • Confirmation • Reaction • Invalidation • Risk control
🎯 Trader Checklist
Mark 117.95–118.20
Watch 118.40 resistance
Monitor 117.77 support
Respect the descending trendline
Avoid chasing candles
Protect capital
🧠 Mini Challenge
Before entering, ask:
“Am I trading confirmed structure — or simply reacting to a rebound?”
— @nayrbryanGaming #TraderMindset #TradingDiscipline #NoFOMO #CryptoMindset #DYOR #PriceAction #SOLUSDT
🔔 Follow my Binance Square & X (@nayrbryanGaming) for daily chart insights.
TRADER MOTIVATION / MINI INSIGHT
🧠 Insight of the Day
“Do not confuse a rebound with a reversal.”
Why This Matters
SOL bounced from the 117.45 area and returned toward the 117.95–118.20 structure zone.
That reaction alone does not confirm a trend reversal.
The important question is whether price can reclaim resistance and hold it.
Smart execution focuses on:
• Structure • Confirmation • Reaction • Invalidation • Risk control
🎯 Trader Checklist
Mark 117.95–118.20
Watch 118.40 resistance
Monitor 117.77 support
Respect the descending trendline
Avoid chasing candles
Protect capital
🧠 Mini Challenge
Before entering, ask:
“Am I trading confirmed structure — or simply reacting to a rebound?”
— @nayrbryanGaming #TraderMindset #TradingDiscipline #NoFOMO #CryptoMindset #DYOR #PriceAction #SOLUSDT
🔔 Follow my Binance Square & X (@nayrbryanGaming) for daily chart insights.
🧠 Insight of the Day
“Do not confuse a rebound with a reversal.”
Why This Matters
SOL bounced from the 117.45 area and returned toward the 117.95–118.20 structure zone.
That reaction alone does not confirm a trend reversal.
The important question is whether price can reclaim resistance and hold it.
Smart execution focuses on:
• Structure • Confirmation • Reaction • Invalidation • Risk control
🎯 Trader Checklist
Mark 117.95–118.20
Watch 118.40 resistance
Monitor 117.77 support
Respect the descending trendline
Avoid chasing candles
Protect capital
🧠 Mini Challenge
Before entering, ask:
“Am I trading confirmed structure — or simply reacting to a rebound?”
— @nayrbryanGaming #TraderMindset #TradingDiscipline #NoFOMO #CryptoMindset #DYOR #PriceAction #SOLUSDT
🔔 Follow my Binance Square & X (@nayrbryanGaming) for daily chart insights.
89
·
--
Bearish
LIGHT ANALYSIS / CHART SETUP — SOL/USDT
📈 Structure Overview
Market phase: Selloff → Rebound → Resistance test
Structure: Descending channel / trendline
Key zone: 117.95 – 118.20
Upper resistance: 118.40
Downside trigger: 117.77
Major downside levels: 117.45 → 117.14 → 116.82 → 116.51 → 116.20 → 115.88
📌 What I’m Watching
Scenario A — Bearish Continuation
If SOL rejects the 117.95–118.20 zone and loses 117.77, price may rotate toward:
117.45 → 117.14 → 116.82 → 116.51 → 116.20 → 115.88
Scenario B — Structure Reclaim
If SOL reclaims 118.20 and then clears 118.40, the immediate bearish structure weakens.
The descending trendline would then become the next important structure to monitor.
📊 Indicator Check
MACD: Recovering but still below zero
RSI: 46.93 → neutral-to-weak momentum
Price Structure: Descending trendline + resistance test
Key Confirmation: 117.77 breakdown / 118.40 reclaim
Note: This is a chart framework, not a trade recommendation. Use it to support your own DYOR-based execution plan.
— @nayrbryanGaming #SOLAnalysis #ChartSetup #PriceAction #SmartMoney #Fibonacci #CryptoTrading #DYOR #NFA
LIGHT ANALYSIS / CHART SETUP — SOL/USDT
📈 Structure Overview
Market phase: Selloff → Rebound → Resistance test
Structure: Descending channel / trendline
Key zone: 117.95 – 118.20
Upper resistance: 118.40
Downside trigger: 117.77
Major downside levels: 117.45 → 117.14 → 116.82 → 116.51 → 116.20 → 115.88
📌 What I’m Watching
Scenario A — Bearish Continuation
If SOL rejects the 117.95–118.20 zone and loses 117.77, price may rotate toward:
117.45 → 117.14 → 116.82 → 116.51 → 116.20 → 115.88
Scenario B — Structure Reclaim
If SOL reclaims 118.20 and then clears 118.40, the immediate bearish structure weakens.
The descending trendline would then become the next important structure to monitor.
📊 Indicator Check
MACD: Recovering but still below zero
RSI: 46.93 → neutral-to-weak momentum
Price Structure: Descending trendline + resistance test
Key Confirmation: 117.77 breakdown / 118.40 reclaim
Note: This is a chart framework, not a trade recommendation. Use it to support your own DYOR-based execution plan.
— @nayrbryanGaming #SOLAnalysis #ChartSetup #PriceAction #SmartMoney #Fibonacci #CryptoTrading #DYOR #NFA
📈 Structure Overview
Market phase: Selloff → Rebound → Resistance test
Structure: Descending channel / trendline
Key zone: 117.95 – 118.20
Upper resistance: 118.40
Downside trigger: 117.77
Major downside levels: 117.45 → 117.14 → 116.82 → 116.51 → 116.20 → 115.88
📌 What I’m Watching
Scenario A — Bearish Continuation
If SOL rejects the 117.95–118.20 zone and loses 117.77, price may rotate toward:
117.45 → 117.14 → 116.82 → 116.51 → 116.20 → 115.88
Scenario B — Structure Reclaim
If SOL reclaims 118.20 and then clears 118.40, the immediate bearish structure weakens.
The descending trendline would then become the next important structure to monitor.
📊 Indicator Check
MACD: Recovering but still below zero
RSI: 46.93 → neutral-to-weak momentum
Price Structure: Descending trendline + resistance test
Key Confirmation: 117.77 breakdown / 118.40 reclaim
Note: This is a chart framework, not a trade recommendation. Use it to support your own DYOR-based execution plan.
— @nayrbryanGaming #SOLAnalysis #ChartSetup #PriceAction #SmartMoney #Fibonacci #CryptoTrading #DYOR #NFA
51
·
--
Bearish
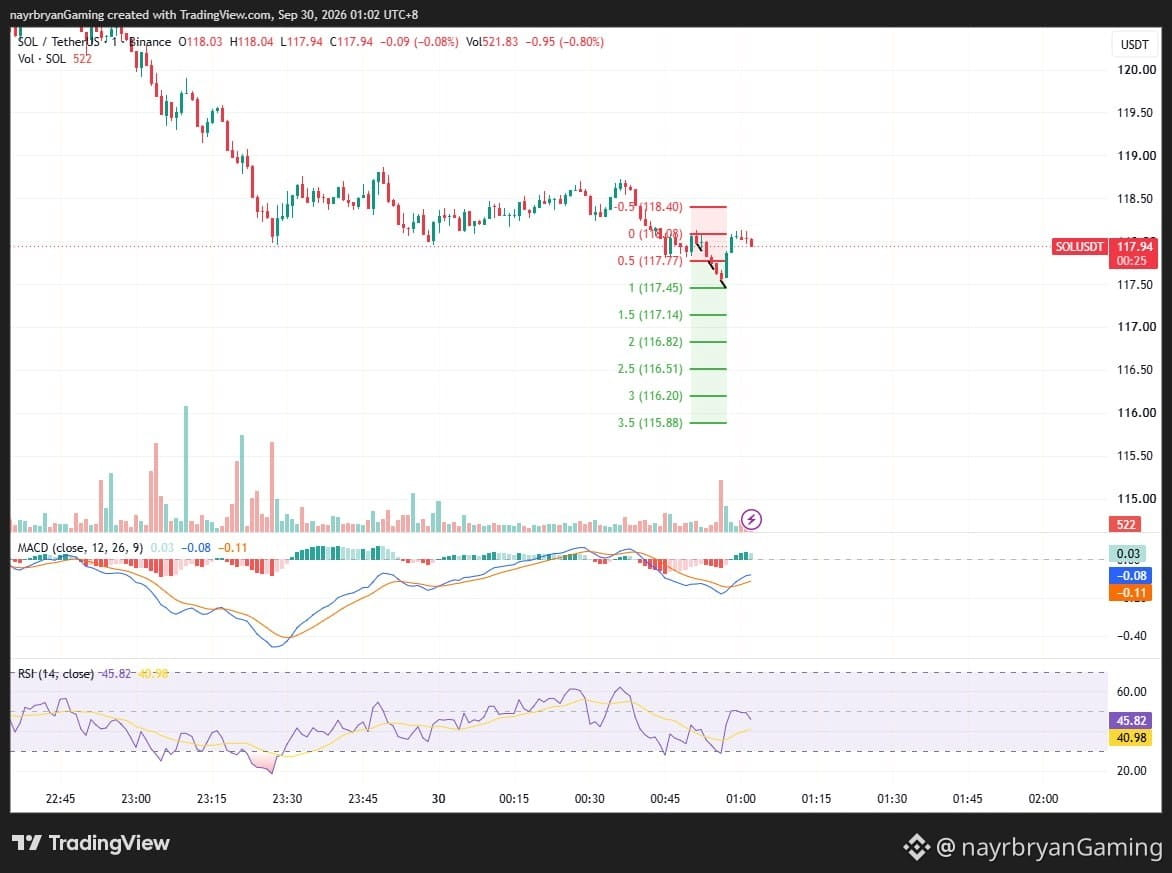
DAILY SIGNAL — SOL/USDT
Date: 30 Sep 2026 Timeframe: 1m Intraday Bias: Bearish structure → rejection → downside continuation
📊 Market Bias
SOL remains inside a short-term descending structure after the earlier selloff from the 120+ area.
Price is currently around 117.97, trading near the lower part of the purple resistance/support zone.
The latest rebound from the 117.45 area has returned price toward 117.95–118.20, but the broader descending trendline remains overhead.
🔹 Key Levels From Chart
Current Price: 117.97
Key Structure Zone: 117.95 → 118.20
Upper Resistance: 118.40
Downside Confirmation: 117.77 → 117.45
Invalidation: Above 118.40
🎯 Downside Fibonacci Targets
TP1 → 117.77 (0.5 Fib) TP2 → 117.45 (1.0 Fib) TP3 → 117.14 (1.5 Fib) TP4 → 116.82 (2.0 Fib) TP5 → 116.51 (2.5 Fib) TP6 → 116.20 (3.0 Fib) TP7 → 115.88 (3.5 Fib)
📈 Technical Breakdown
SOL continues to trade beneath the descending blue trendline.
Price recently dropped toward 117.45, reacted upward, and recovered back toward the purple structure zone.
The current reaction is testing whether 117.95–118.20 can be reclaimed and held.
MACD has recovered from the recent negative momentum, but remains below the zero line.
RSI is around 46.93, showing neutral-to-weak momentum rather than an overbought condition.
A rejection from the current structure followed by a break below 117.77 would keep the Fibonacci downside levels in focus.
A sustained reclaim above 118.20–118.40 would weaken the current bearish framework.
🧠 Quick Insight
“Relief rebounds can test resistance without changing the larger structure.”
⚠️ Disclaimer
This is personal market analysis, not financial advice. This chart framework is for educational purposes only.
Always DYOR / DYODD, manage risk properly, and avoid emotional trading.
— @nayrbryanGaming #SOL #SOLUSDT #Crypto #Trading #TechnicalAnalysis #PriceAction #Fibonacci #Binance #DYOR #NFA #NoFOMO
DAILY SIGNAL — SOL/USDT
Date: 30 Sep 2026 Timeframe: 1m Intraday Bias: Bearish structure → rejection → downside continuation
📊 Market Bias
SOL remains inside a short-term descending structure after the earlier selloff from the 120+ area.
Price is currently around 117.97, trading near the lower part of the purple resistance/support zone.
The latest rebound from the 117.45 area has returned price toward 117.95–118.20, but the broader descending trendline remains overhead.
🔹 Key Levels From Chart
Current Price: 117.97
Key Structure Zone: 117.95 → 118.20
Upper Resistance: 118.40
Downside Confirmation: 117.77 → 117.45
Invalidation: Above 118.40
🎯 Downside Fibonacci Targets
TP1 → 117.77 (0.5 Fib) TP2 → 117.45 (1.0 Fib) TP3 → 117.14 (1.5 Fib) TP4 → 116.82 (2.0 Fib) TP5 → 116.51 (2.5 Fib) TP6 → 116.20 (3.0 Fib) TP7 → 115.88 (3.5 Fib)
📈 Technical Breakdown
SOL continues to trade beneath the descending blue trendline.
Price recently dropped toward 117.45, reacted upward, and recovered back toward the purple structure zone.
The current reaction is testing whether 117.95–118.20 can be reclaimed and held.
MACD has recovered from the recent negative momentum, but remains below the zero line.
RSI is around 46.93, showing neutral-to-weak momentum rather than an overbought condition.
A rejection from the current structure followed by a break below 117.77 would keep the Fibonacci downside levels in focus.
A sustained reclaim above 118.20–118.40 would weaken the current bearish framework.
🧠 Quick Insight
“Relief rebounds can test resistance without changing the larger structure.”
⚠️ Disclaimer
This is personal market analysis, not financial advice. This chart framework is for educational purposes only.
Always DYOR / DYODD, manage risk properly, and avoid emotional trading.
— @nayrbryanGaming #SOL #SOLUSDT #Crypto #Trading #TechnicalAnalysis #PriceAction #Fibonacci #Binance #DYOR #NFA #NoFOMO
Date: 30 Sep 2026 Timeframe: 1m Intraday Bias: Bearish structure → rejection → downside continuation
📊 Market Bias
SOL remains inside a short-term descending structure after the earlier selloff from the 120+ area.
Price is currently around 117.97, trading near the lower part of the purple resistance/support zone.
The latest rebound from the 117.45 area has returned price toward 117.95–118.20, but the broader descending trendline remains overhead.
🔹 Key Levels From Chart
Current Price: 117.97
Key Structure Zone: 117.95 → 118.20
Upper Resistance: 118.40
Downside Confirmation: 117.77 → 117.45
Invalidation: Above 118.40
🎯 Downside Fibonacci Targets
TP1 → 117.77 (0.5 Fib) TP2 → 117.45 (1.0 Fib) TP3 → 117.14 (1.5 Fib) TP4 → 116.82 (2.0 Fib) TP5 → 116.51 (2.5 Fib) TP6 → 116.20 (3.0 Fib) TP7 → 115.88 (3.5 Fib)
📈 Technical Breakdown
SOL continues to trade beneath the descending blue trendline.
Price recently dropped toward 117.45, reacted upward, and recovered back toward the purple structure zone.
The current reaction is testing whether 117.95–118.20 can be reclaimed and held.
MACD has recovered from the recent negative momentum, but remains below the zero line.
RSI is around 46.93, showing neutral-to-weak momentum rather than an overbought condition.
A rejection from the current structure followed by a break below 117.77 would keep the Fibonacci downside levels in focus.
A sustained reclaim above 118.20–118.40 would weaken the current bearish framework.
🧠 Quick Insight
“Relief rebounds can test resistance without changing the larger structure.”
⚠️ Disclaimer
This is personal market analysis, not financial advice. This chart framework is for educational purposes only.
Always DYOR / DYODD, manage risk properly, and avoid emotional trading.
— @nayrbryanGaming #SOL #SOLUSDT #Crypto #Trading #TechnicalAnalysis #PriceAction #Fibonacci #Binance #DYOR #NFA #NoFOMO
1
278
·
--
Bearish
TRADER MOTIVATION / MINI INSIGHT
🧠 Insight of the Day
“Don’t chase the candle. Wait for the structure to confirm the move.”
Why This Matters
SOL has already shown a reaction from the 118.40–118.65 resistance area.
The important question is not whether one candle moves lower.
The important question is whether sellers can maintain control below the key structure levels.
Professional execution focuses on:
• Structure • Confirmation • Reaction • Invalidation • Risk control
🎯 Trader Checklist
Mark the resistance zone
Watch the descending trendline
Wait for confirmation below 117.90
Respect 118.65 invalidation
Avoid emotional entries
Protect capital
🧠 Mini Challenge
Before entering, ask:
“Am I trading confirmed structure — or simply reacting to the latest candle?”
— @nayrbryanGaming #TraderMindset #TradingDiscipline #NoFOMO #CryptoMindset #DYOR #PriceAction #SOLUSDT
🔔 Follow my Binance Square & X (@nayrbryanGaming) for daily chart insights.
TRADER MOTIVATION / MINI INSIGHT
🧠 Insight of the Day
“Don’t chase the candle. Wait for the structure to confirm the move.”
Why This Matters
SOL has already shown a reaction from the 118.40–118.65 resistance area.
The important question is not whether one candle moves lower.
The important question is whether sellers can maintain control below the key structure levels.
Professional execution focuses on:
• Structure • Confirmation • Reaction • Invalidation • Risk control
🎯 Trader Checklist
Mark the resistance zone
Watch the descending trendline
Wait for confirmation below 117.90
Respect 118.65 invalidation
Avoid emotional entries
Protect capital
🧠 Mini Challenge
Before entering, ask:
“Am I trading confirmed structure — or simply reacting to the latest candle?”
— @nayrbryanGaming #TraderMindset #TradingDiscipline #NoFOMO #CryptoMindset #DYOR #PriceAction #SOLUSDT
🔔 Follow my Binance Square & X (@nayrbryanGaming) for daily chart insights.
🧠 Insight of the Day
“Don’t chase the candle. Wait for the structure to confirm the move.”
Why This Matters
SOL has already shown a reaction from the 118.40–118.65 resistance area.
The important question is not whether one candle moves lower.
The important question is whether sellers can maintain control below the key structure levels.
Professional execution focuses on:
• Structure • Confirmation • Reaction • Invalidation • Risk control
🎯 Trader Checklist
Mark the resistance zone
Watch the descending trendline
Wait for confirmation below 117.90
Respect 118.65 invalidation
Avoid emotional entries
Protect capital
🧠 Mini Challenge
Before entering, ask:
“Am I trading confirmed structure — or simply reacting to the latest candle?”
— @nayrbryanGaming #TraderMindset #TradingDiscipline #NoFOMO #CryptoMindset #DYOR #PriceAction #SOLUSDT
🔔 Follow my Binance Square & X (@nayrbryanGaming) for daily chart insights.
75
·
--
Bearish
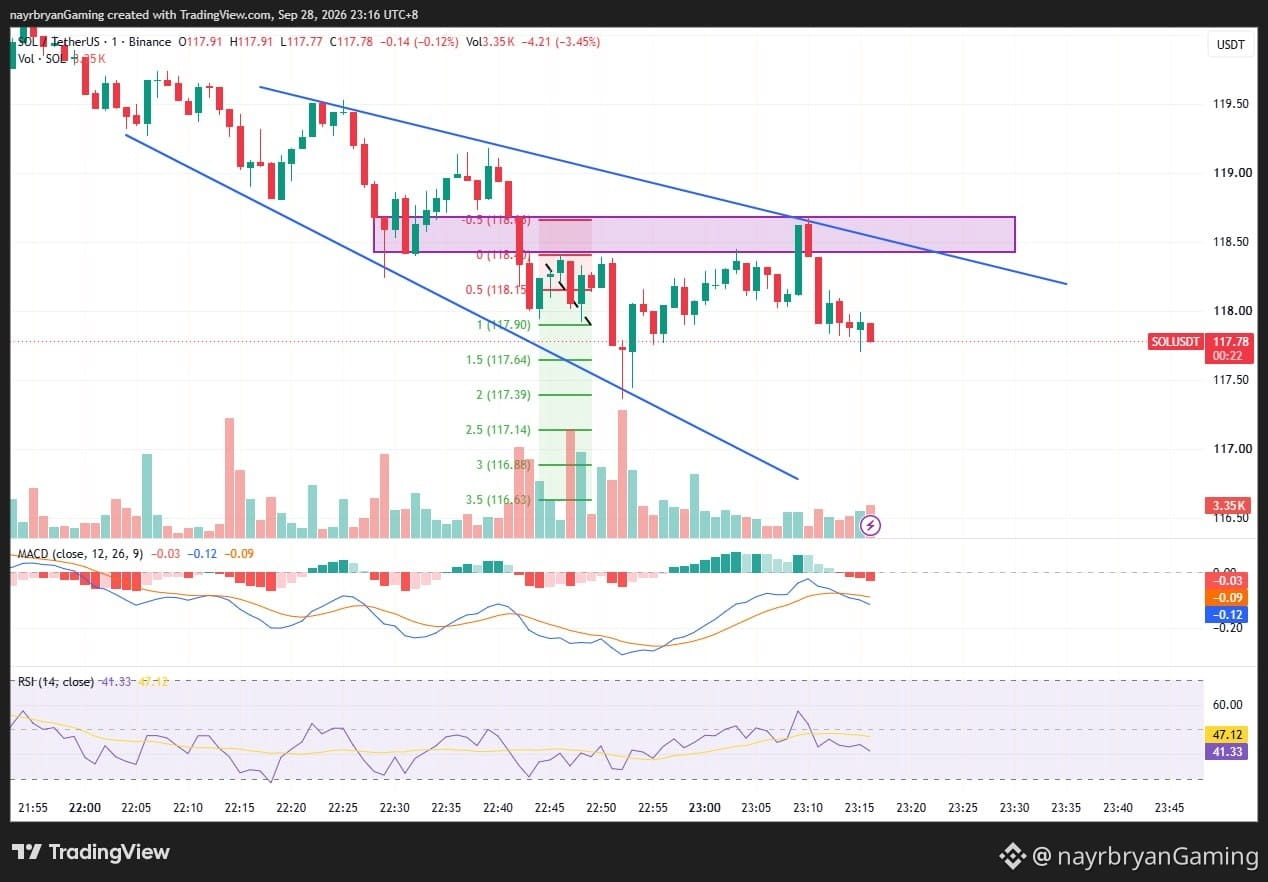
LIGHT ANALYSIS / CHART SETUP — SOL/USDT
📈 Structure Overview
Market phase: Downtrend → Rebound → Resistance Rejection
Channel structure: Descending channel
Key resistance zone: 118.40 – 118.65
Secondary resistance: 118.15
Downside confirmation: Below 117.90
Invalidation: 118.65
📌 What I’m Watching
Scenario A — Bearish Continuation
If SOL remains below the 118.40–118.65 resistance zone and continues below 117.90, price may rotate toward:
117.64 → 117.39 → 117.14 → 116.88 → 116.63
These levels correspond with the Fibonacci extensions marked on the chart.
Scenario B — Resistance Reclaim
If SOL reclaims 118.40 and establishes acceptance above 118.65, the immediate bearish structure weakens.
A sustained reclaim would require reassessing the descending-channel setup.
📊 Indicator Check
MACD: Below zero → bearish momentum
RSI: 41.33 → weak momentum
Price Structure: Descending channel + resistance rejection
Key Confirmation: 117.90 breakdown / 118.65 reclaim
Note: This is a chart framework, not a trade recommendation. Use it to support your own DYOR-based execution plan.
— @nayrbryanGaming #SOLAnalysis #ChartSetup #PriceAction #SmartMoney #Fibonacci #CryptoTrading #DYOR #NFA
LIGHT ANALYSIS / CHART SETUP — SOL/USDT
📈 Structure Overview
Market phase: Downtrend → Rebound → Resistance Rejection
Channel structure: Descending channel
Key resistance zone: 118.40 – 118.65
Secondary resistance: 118.15
Downside confirmation: Below 117.90
Invalidation: 118.65
📌 What I’m Watching
Scenario A — Bearish Continuation
If SOL remains below the 118.40–118.65 resistance zone and continues below 117.90, price may rotate toward:
117.64 → 117.39 → 117.14 → 116.88 → 116.63
These levels correspond with the Fibonacci extensions marked on the chart.
Scenario B — Resistance Reclaim
If SOL reclaims 118.40 and establishes acceptance above 118.65, the immediate bearish structure weakens.
A sustained reclaim would require reassessing the descending-channel setup.
📊 Indicator Check
MACD: Below zero → bearish momentum
RSI: 41.33 → weak momentum
Price Structure: Descending channel + resistance rejection
Key Confirmation: 117.90 breakdown / 118.65 reclaim
Note: This is a chart framework, not a trade recommendation. Use it to support your own DYOR-based execution plan.
— @nayrbryanGaming #SOLAnalysis #ChartSetup #PriceAction #SmartMoney #Fibonacci #CryptoTrading #DYOR #NFA
📈 Structure Overview
Market phase: Downtrend → Rebound → Resistance Rejection
Channel structure: Descending channel
Key resistance zone: 118.40 – 118.65
Secondary resistance: 118.15
Downside confirmation: Below 117.90
Invalidation: 118.65
📌 What I’m Watching
Scenario A — Bearish Continuation
If SOL remains below the 118.40–118.65 resistance zone and continues below 117.90, price may rotate toward:
117.64 → 117.39 → 117.14 → 116.88 → 116.63
These levels correspond with the Fibonacci extensions marked on the chart.
Scenario B — Resistance Reclaim
If SOL reclaims 118.40 and establishes acceptance above 118.65, the immediate bearish structure weakens.
A sustained reclaim would require reassessing the descending-channel setup.
📊 Indicator Check
MACD: Below zero → bearish momentum
RSI: 41.33 → weak momentum
Price Structure: Descending channel + resistance rejection
Key Confirmation: 117.90 breakdown / 118.65 reclaim
Note: This is a chart framework, not a trade recommendation. Use it to support your own DYOR-based execution plan.
— @nayrbryanGaming #SOLAnalysis #ChartSetup #PriceAction #SmartMoney #Fibonacci #CryptoTrading #DYOR #NFA
71
·
--
Bearish
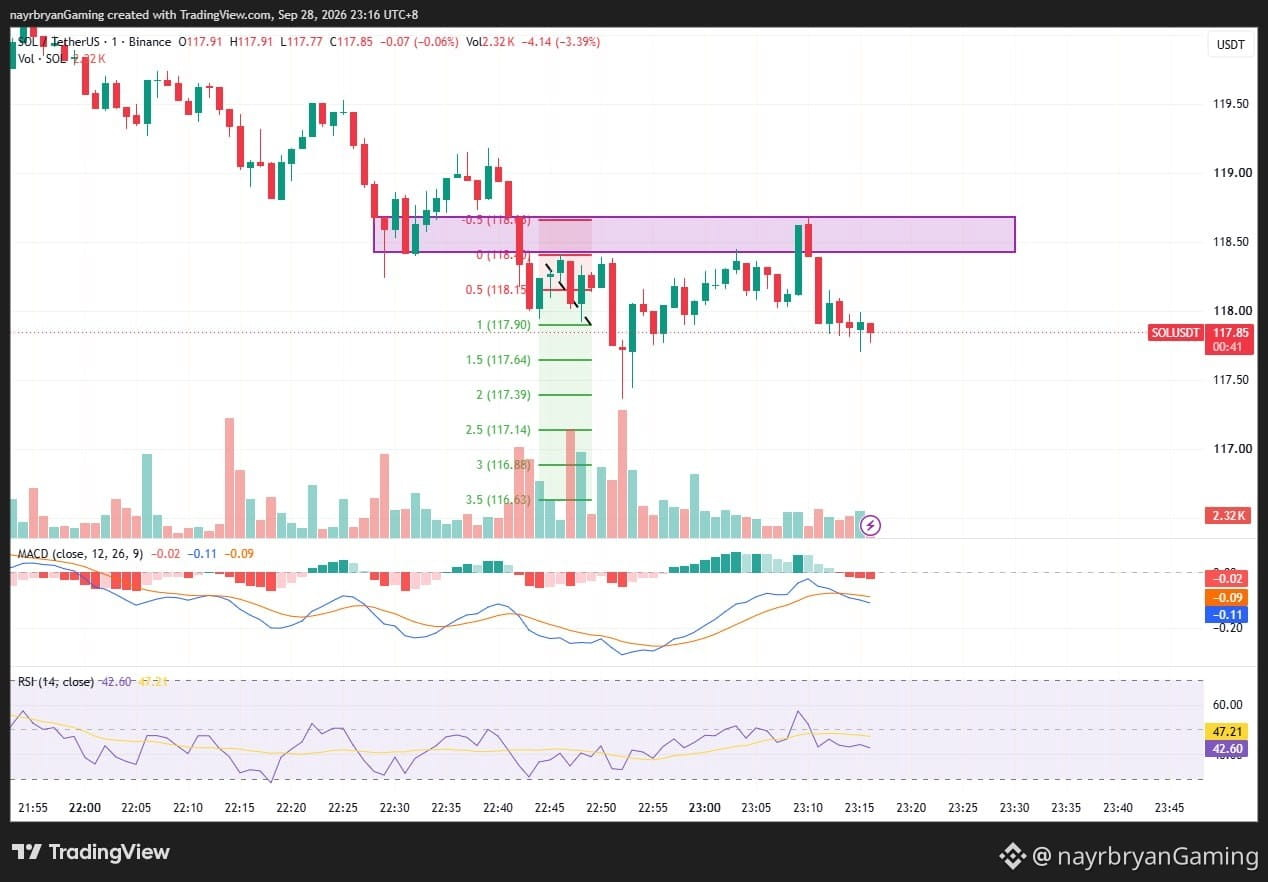
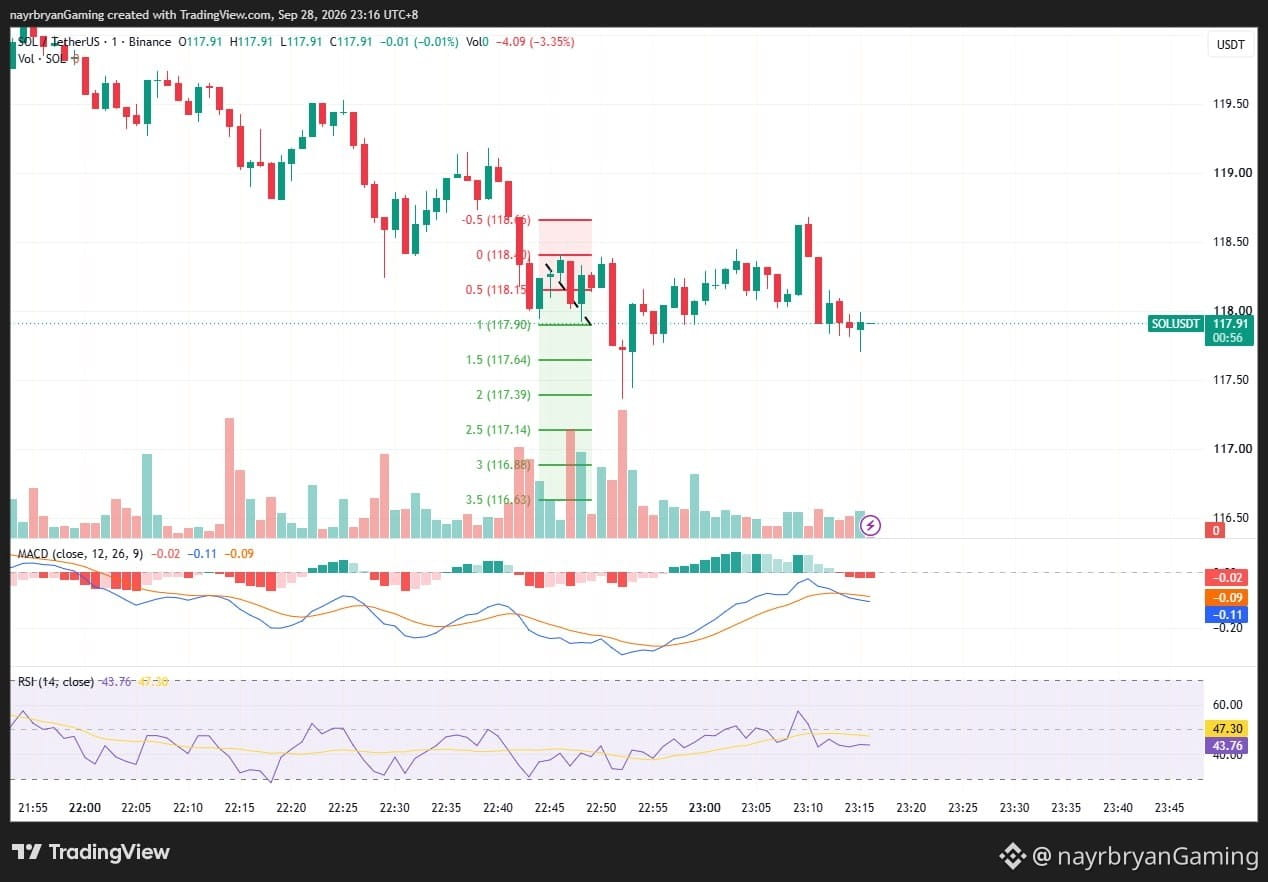
DAILY SIGNAL — SOL/USDT
Date: 28 Sep 2026 Timeframe: 1m Intraday Bias: Bearish continuation → resistance rejection → downside liquidity
📊 Market Bias
SOL remains inside a short-term descending channel after failing to sustain the recovery toward the upper structure.
Price recently rejected the 118.40–118.65 purple resistance zone and has rotated lower toward 117.78.
The descending trendline continues to cap upside attempts, keeping the short-term structure bearish.
🔹 Key Levels From Chart
Current Price: 117.78
Key Resistance Zone: 118.40 → 118.65
Secondary Resistance: 118.15
Invalidation: Above 118.65
Key Downside Reference: 117.90
🎯 Downside Fibonacci Targets
TP1 → 117.90 (1.0 Fib) TP2 → 117.64 (1.5 Fib) TP3 → 117.39 (2.0 Fib) TP4 → 117.14 (2.5 Fib) TP5 → 116.88 (3.0 Fib) TP6 → 116.63 (3.5 Fib)
📈 Technical Breakdown
SOL is trading beneath a descending trendline after rejecting the upper purple structure zone.
The latest recovery pushed price back toward the 118.40–118.65 area, but the move was rejected and price returned toward 117.78.
MACD is below the zero line, with the latest histogram showing negative momentum.
RSI is around 41.33, indicating weak momentum without being deeply oversold.
A continued move below 117.90 would keep the downside Fibonacci structure active.
If SOL instead reclaims 118.40–118.65, the bearish setup should be reassessed.
🧠 Quick Insight
“Repeated rejection at resistance keeps the structure vulnerable until price proves otherwise.”
⚠️ Disclaimer
This is personal market analysis, not financial advice. This chart framework is for educational purposes only.
Always DYOR / DYODD, manage risk properly, and avoid emotional trading.
— @nayrbryanGaming #SOL #SOLUSDT #Crypto #Trading #TechnicalAnalysis #PriceAction #Fibonacci #Binance #DYOR #NFA #NoFOMO
DAILY SIGNAL — SOL/USDT
Date: 28 Sep 2026 Timeframe: 1m Intraday Bias: Bearish continuation → resistance rejection → downside liquidity
📊 Market Bias
SOL remains inside a short-term descending channel after failing to sustain the recovery toward the upper structure.
Price recently rejected the 118.40–118.65 purple resistance zone and has rotated lower toward 117.78.
The descending trendline continues to cap upside attempts, keeping the short-term structure bearish.
🔹 Key Levels From Chart
Current Price: 117.78
Key Resistance Zone: 118.40 → 118.65
Secondary Resistance: 118.15
Invalidation: Above 118.65
Key Downside Reference: 117.90
🎯 Downside Fibonacci Targets
TP1 → 117.90 (1.0 Fib) TP2 → 117.64 (1.5 Fib) TP3 → 117.39 (2.0 Fib) TP4 → 117.14 (2.5 Fib) TP5 → 116.88 (3.0 Fib) TP6 → 116.63 (3.5 Fib)
📈 Technical Breakdown
SOL is trading beneath a descending trendline after rejecting the upper purple structure zone.
The latest recovery pushed price back toward the 118.40–118.65 area, but the move was rejected and price returned toward 117.78.
MACD is below the zero line, with the latest histogram showing negative momentum.
RSI is around 41.33, indicating weak momentum without being deeply oversold.
A continued move below 117.90 would keep the downside Fibonacci structure active.
If SOL instead reclaims 118.40–118.65, the bearish setup should be reassessed.
🧠 Quick Insight
“Repeated rejection at resistance keeps the structure vulnerable until price proves otherwise.”
⚠️ Disclaimer
This is personal market analysis, not financial advice. This chart framework is for educational purposes only.
Always DYOR / DYODD, manage risk properly, and avoid emotional trading.
— @nayrbryanGaming #SOL #SOLUSDT #Crypto #Trading #TechnicalAnalysis #PriceAction #Fibonacci #Binance #DYOR #NFA #NoFOMO
Date: 28 Sep 2026 Timeframe: 1m Intraday Bias: Bearish continuation → resistance rejection → downside liquidity
📊 Market Bias
SOL remains inside a short-term descending channel after failing to sustain the recovery toward the upper structure.
Price recently rejected the 118.40–118.65 purple resistance zone and has rotated lower toward 117.78.
The descending trendline continues to cap upside attempts, keeping the short-term structure bearish.
🔹 Key Levels From Chart
Current Price: 117.78
Key Resistance Zone: 118.40 → 118.65
Secondary Resistance: 118.15
Invalidation: Above 118.65
Key Downside Reference: 117.90
🎯 Downside Fibonacci Targets
TP1 → 117.90 (1.0 Fib) TP2 → 117.64 (1.5 Fib) TP3 → 117.39 (2.0 Fib) TP4 → 117.14 (2.5 Fib) TP5 → 116.88 (3.0 Fib) TP6 → 116.63 (3.5 Fib)
📈 Technical Breakdown
SOL is trading beneath a descending trendline after rejecting the upper purple structure zone.
The latest recovery pushed price back toward the 118.40–118.65 area, but the move was rejected and price returned toward 117.78.
MACD is below the zero line, with the latest histogram showing negative momentum.
RSI is around 41.33, indicating weak momentum without being deeply oversold.
A continued move below 117.90 would keep the downside Fibonacci structure active.
If SOL instead reclaims 118.40–118.65, the bearish setup should be reassessed.
🧠 Quick Insight
“Repeated rejection at resistance keeps the structure vulnerable until price proves otherwise.”
⚠️ Disclaimer
This is personal market analysis, not financial advice. This chart framework is for educational purposes only.
Always DYOR / DYODD, manage risk properly, and avoid emotional trading.
— @nayrbryanGaming #SOL #SOLUSDT #Crypto #Trading #TechnicalAnalysis #PriceAction #Fibonacci #Binance #DYOR #NFA #NoFOMO
96
·
--
Bearish
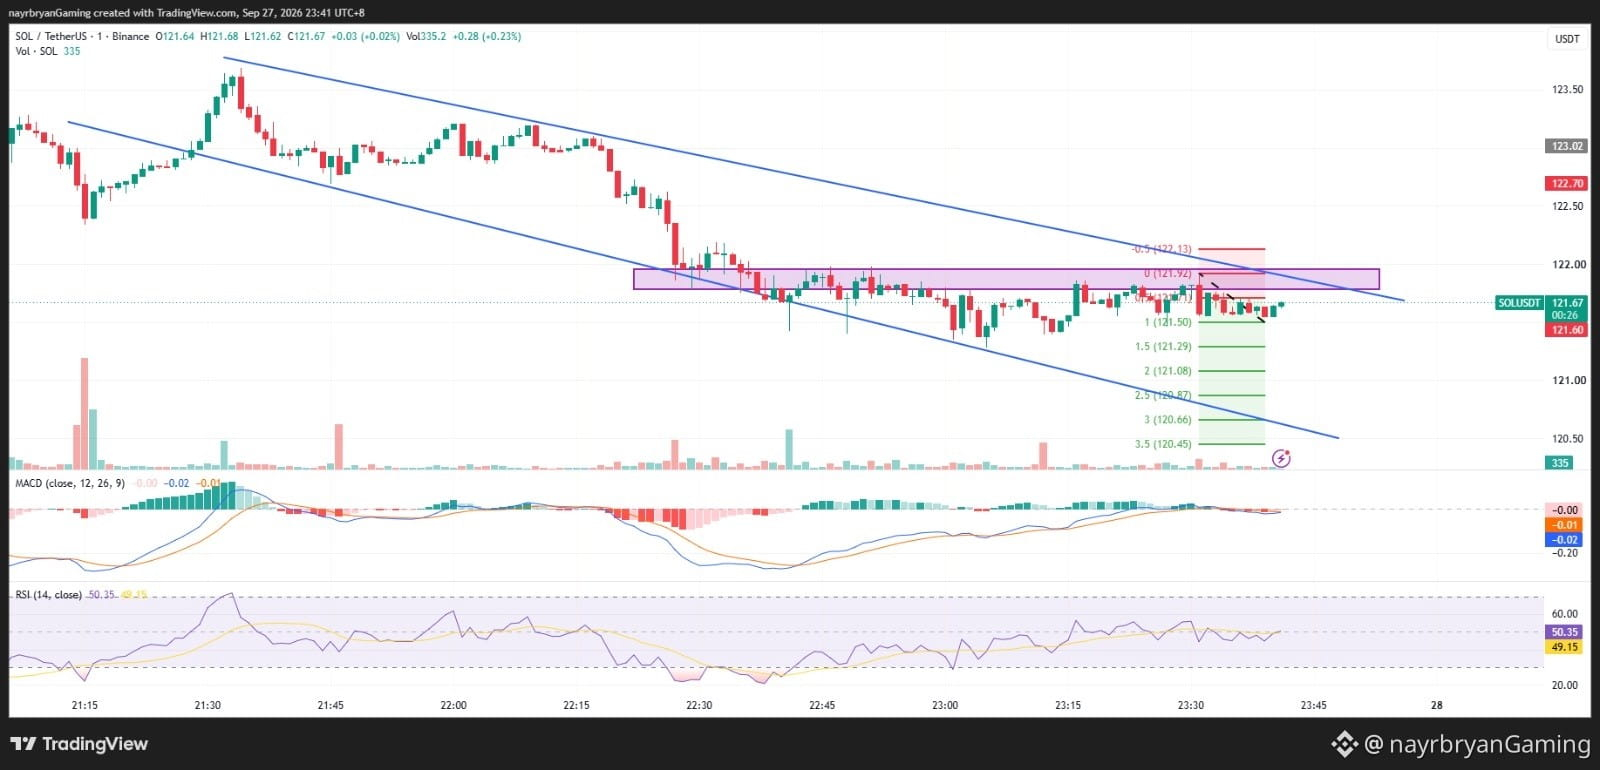
SOL/USDT — 1m
SOL is consolidating beneath descending resistance.
Current: 121.67
Support: 121.50–121.71
Reclaim zone: 121.75–121.99
Fib 0: 121.92
Upper extension: 122.13
If reclaimed:
121.99 → 122.13
A sustained breakout through the descending resistance would strengthen the recovery scenario.
If rejected:
121.50 → 121.29 → 121.08 → 120.87
RSI: 50.35
MACD: Near zero / slightly negative
Momentum is currently neutral.
The setup isn't about predicting the direction.
It's about watching the 121.75–121.99 decision zone.
Breakout = confirmation.
Rejection = information.
DYOR / NFA
— @nayrbryanGaming
#SOL #SOLUSDT #Crypto #Trading #TechnicalAnalysis #DYOR #NFA #NOFOMO
SOL/USDT — 1m
SOL is consolidating beneath descending resistance.
Current: 121.67
Support: 121.50–121.71
Reclaim zone: 121.75–121.99
Fib 0: 121.92
Upper extension: 122.13
If reclaimed:
121.99 → 122.13
A sustained breakout through the descending resistance would strengthen the recovery scenario.
If rejected:
121.50 → 121.29 → 121.08 → 120.87
RSI: 50.35
MACD: Near zero / slightly negative
Momentum is currently neutral.
The setup isn't about predicting the direction.
It's about watching the 121.75–121.99 decision zone.
Breakout = confirmation.
Rejection = information.
DYOR / NFA
— @nayrbryanGaming
#SOL #SOLUSDT #Crypto #Trading #TechnicalAnalysis #DYOR #NFA #NOFOMO
SOL is consolidating beneath descending resistance.
Current: 121.67
Support: 121.50–121.71
Reclaim zone: 121.75–121.99
Fib 0: 121.92
Upper extension: 122.13
If reclaimed:
121.99 → 122.13
A sustained breakout through the descending resistance would strengthen the recovery scenario.
If rejected:
121.50 → 121.29 → 121.08 → 120.87
RSI: 50.35
MACD: Near zero / slightly negative
Momentum is currently neutral.
The setup isn't about predicting the direction.
It's about watching the 121.75–121.99 decision zone.
Breakout = confirmation.
Rejection = information.
DYOR / NFA
— @nayrbryanGaming
#SOL #SOLUSDT #Crypto #Trading #TechnicalAnalysis #DYOR #NFA #NOFOMO
65
·
--
Bearish
TRADER MINDSET
🧠 Don't Force a Direction
SOL is not giving a clean directional confirmation yet.
Price is sitting beneath a descending resistance while consolidating around the 121.50–121.99 area.
That creates two possible outcomes:
Reclaim resistance
→ recovery attempt
Reject resistance
→ continuation of the existing structure
The important levels are already visible.
You don't need to predict the next candle.
You need to wait for the market to reveal which side has control.
When the chart is undecided,
patience is a position too.
Before entering, ask:
“Has price confirmed the breakout, or am I anticipating it?”
— @nayrbryanGaming
#TraderMindset #Discipline #NoFOMO #SOL #DYOR #NFA
TRADER MINDSET
🧠 Don't Force a Direction
SOL is not giving a clean directional confirmation yet.
Price is sitting beneath a descending resistance while consolidating around the 121.50–121.99 area.
That creates two possible outcomes:
Reclaim resistance
→ recovery attempt
Reject resistance
→ continuation of the existing structure
The important levels are already visible.
You don't need to predict the next candle.
You need to wait for the market to reveal which side has control.
When the chart is undecided,
patience is a position too.
Before entering, ask:
“Has price confirmed the breakout, or am I anticipating it?”
— @nayrbryanGaming
#TraderMindset #Discipline #NoFOMO #SOL #DYOR #NFA
🧠 Don't Force a Direction
SOL is not giving a clean directional confirmation yet.
Price is sitting beneath a descending resistance while consolidating around the 121.50–121.99 area.
That creates two possible outcomes:
Reclaim resistance
→ recovery attempt
Reject resistance
→ continuation of the existing structure
The important levels are already visible.
You don't need to predict the next candle.
You need to wait for the market to reveal which side has control.
When the chart is undecided,
patience is a position too.
Before entering, ask:
“Has price confirmed the breakout, or am I anticipating it?”
— @nayrbryanGaming
#TraderMindset #Discipline #NoFOMO #SOL #DYOR #NFA
65
·
--
Bearish
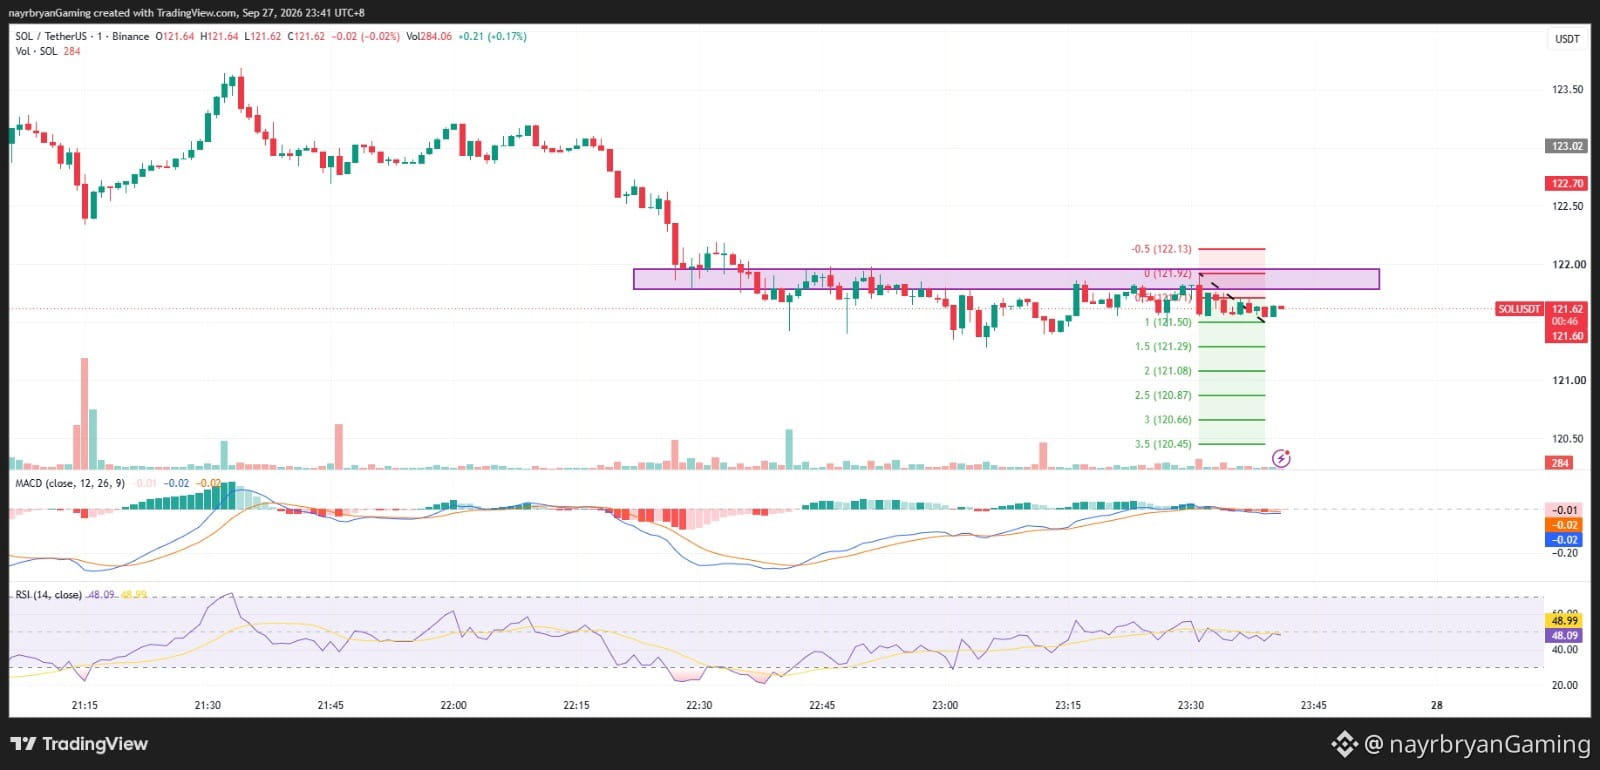
LIGHT ANALYSIS / CHART SETUP
SOL/USDT — 1m
Price: 121.67
Structure: Descending Channel
Key Levels
Support: 121.50–121.71
Reclaim Zone: 121.75–121.99
Fib 0: 121.92
Upper Extension: 122.13
Downside:
121.50 → 121.29 → 121.08 → 120.87 → 120.65 → 120.45
Scenario A — Bullish Reclaim
SOL breaks above 121.75–121.99 and holds.
Next level:
122.13
A breakout through the descending resistance would provide stronger confirmation.
Scenario B — Rejection
SOL fails to reclaim the resistance zone.
Watch:
121.50 → 121.29 → 121.08
A deeper breakdown could expose the lower Fib levels toward 120.65–120.45.
Indicator Check
RSI: 50.35
MACD: Near zero / slightly negative
Momentum is currently neutral.
Price confirmation > indicator prediction
DYOR / NFA.
— @nayrbryanGaming
#SOLAnalysis #SOLUSDT #CryptoTrading #DYOR
LIGHT ANALYSIS / CHART SETUP
SOL/USDT — 1m
Price: 121.67
Structure: Descending Channel
Key Levels
Support: 121.50–121.71
Reclaim Zone: 121.75–121.99
Fib 0: 121.92
Upper Extension: 122.13
Downside:
121.50 → 121.29 → 121.08 → 120.87 → 120.65 → 120.45
Scenario A — Bullish Reclaim
SOL breaks above 121.75–121.99 and holds.
Next level:
122.13
A breakout through the descending resistance would provide stronger confirmation.
Scenario B — Rejection
SOL fails to reclaim the resistance zone.
Watch:
121.50 → 121.29 → 121.08
A deeper breakdown could expose the lower Fib levels toward 120.65–120.45.
Indicator Check
RSI: 50.35
MACD: Near zero / slightly negative
Momentum is currently neutral.
Price confirmation > indicator prediction
DYOR / NFA.
— @nayrbryanGaming
#SOLAnalysis #SOLUSDT #CryptoTrading #DYOR
SOL/USDT — 1m
Price: 121.67
Structure: Descending Channel
Key Levels
Support: 121.50–121.71
Reclaim Zone: 121.75–121.99
Fib 0: 121.92
Upper Extension: 122.13
Downside:
121.50 → 121.29 → 121.08 → 120.87 → 120.65 → 120.45
Scenario A — Bullish Reclaim
SOL breaks above 121.75–121.99 and holds.
Next level:
122.13
A breakout through the descending resistance would provide stronger confirmation.
Scenario B — Rejection
SOL fails to reclaim the resistance zone.
Watch:
121.50 → 121.29 → 121.08
A deeper breakdown could expose the lower Fib levels toward 120.65–120.45.
Indicator Check
RSI: 50.35
MACD: Near zero / slightly negative
Momentum is currently neutral.
Price confirmation > indicator prediction
DYOR / NFA.
— @nayrbryanGaming
#SOLAnalysis #SOLUSDT #CryptoTrading #DYOR
89
·
--
Bearish
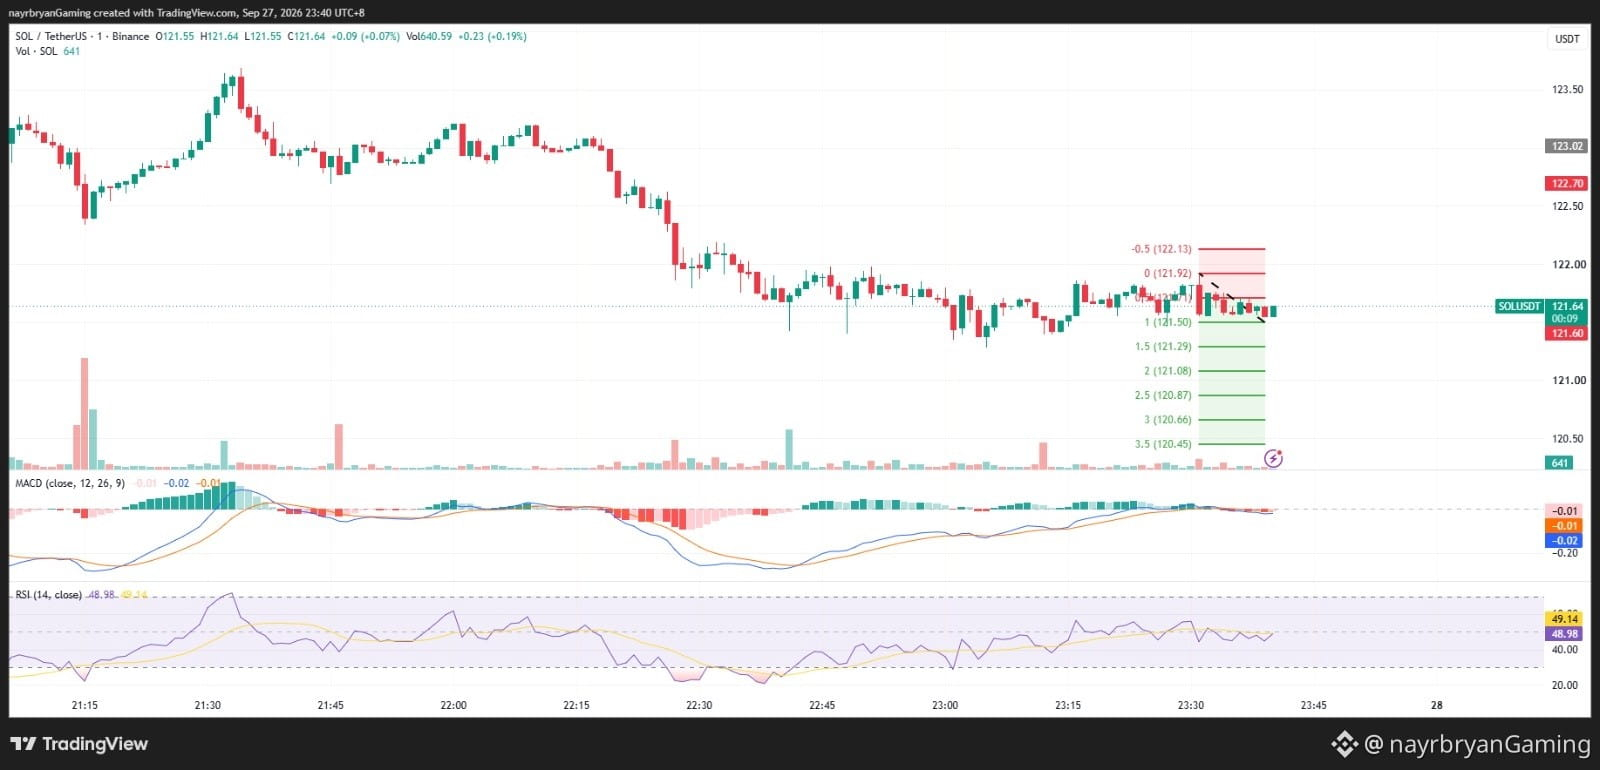
DAILY MARKET SIGNAL — SOL/USDT
📊 Market Structure
SOL remains inside a broader descending channel after the previous decline from the 123+ area.
Price is currently consolidating around 121.67, just below the upper resistance structure.
The purple zone around 121.75–121.99 remains the main reaction and reclaim area.
The market is now approaching a decision point:
Reclaim resistance → recovery scenario.
Reject resistance → continuation of the descending structure.
🔹 Key Levels
Current Price
121.67
Reaction / Support Area
121.50–121.71
Key Reclaim Zone
121.75–121.99
Fib 0
121.92
Fib -0.5 / Upper Extension
122.13
Downside Fib Levels
121.50 — Fib 1
121.29 — Fib 1.5
121.08 — Fib 2
120.87 — Fib 2.5
120.65 — Fib 3
120.45 — Fib 3.5
📈 Bullish Scenario
If SOL reclaims the 121.75–121.99 zone and holds above the descending resistance, the next level to watch is:
122.13
A sustained breakout above the descending channel would provide stronger evidence that the short-term structure is changing.
📉 Bearish Scenario
If SOL fails to reclaim 121.75–121.99, the current descending structure remains intact.
A move below 121.50 could expose:
121.29 → 121.08 → 120.87 → 120.65 → 120.45
The bearish continuation scenario becomes stronger if price breaks the lower channel structure.
📊 Indicator Check
RSI: 50.35
RSI is near the neutral 50 area, showing that momentum is currently balanced.
MACD: Near zero / slightly negative.
Momentum is not providing strong directional confirmation yet.
That makes the price structure and reclaim level more important.
🧠 Bottom Line
SOL is compressed beneath descending resistance.
121.75–121.99 = decision zone.
Above it → recovery scenario strengthens.
Below it → consolidation / downside continuation remains possible.
The market is at resistance.
Let the breakout—or rejection—confirm the direction
DYOR / NFA.
— @nayrbryanGaming
#SOL #SOLUSDT #Crypto #TechnicalAnalysis #DYOR #NFA
DAILY MARKET SIGNAL — SOL/USDT
📊 Market Structure
SOL remains inside a broader descending channel after the previous decline from the 123+ area.
Price is currently consolidating around 121.67, just below the upper resistance structure.
The purple zone around 121.75–121.99 remains the main reaction and reclaim area.
The market is now approaching a decision point:
Reclaim resistance → recovery scenario.
Reject resistance → continuation of the descending structure.
🔹 Key Levels
Current Price
121.67
Reaction / Support Area
121.50–121.71
Key Reclaim Zone
121.75–121.99
Fib 0
121.92
Fib -0.5 / Upper Extension
122.13
Downside Fib Levels
121.50 — Fib 1
121.29 — Fib 1.5
121.08 — Fib 2
120.87 — Fib 2.5
120.65 — Fib 3
120.45 — Fib 3.5
📈 Bullish Scenario
If SOL reclaims the 121.75–121.99 zone and holds above the descending resistance, the next level to watch is:
122.13
A sustained breakout above the descending channel would provide stronger evidence that the short-term structure is changing.
📉 Bearish Scenario
If SOL fails to reclaim 121.75–121.99, the current descending structure remains intact.
A move below 121.50 could expose:
121.29 → 121.08 → 120.87 → 120.65 → 120.45
The bearish continuation scenario becomes stronger if price breaks the lower channel structure.
📊 Indicator Check
RSI: 50.35
RSI is near the neutral 50 area, showing that momentum is currently balanced.
MACD: Near zero / slightly negative.
Momentum is not providing strong directional confirmation yet.
That makes the price structure and reclaim level more important.
🧠 Bottom Line
SOL is compressed beneath descending resistance.
121.75–121.99 = decision zone.
Above it → recovery scenario strengthens.
Below it → consolidation / downside continuation remains possible.
The market is at resistance.
Let the breakout—or rejection—confirm the direction
DYOR / NFA.
— @nayrbryanGaming
#SOL #SOLUSDT #Crypto #TechnicalAnalysis #DYOR #NFA
📊 Market Structure
SOL remains inside a broader descending channel after the previous decline from the 123+ area.
Price is currently consolidating around 121.67, just below the upper resistance structure.
The purple zone around 121.75–121.99 remains the main reaction and reclaim area.
The market is now approaching a decision point:
Reclaim resistance → recovery scenario.
Reject resistance → continuation of the descending structure.
🔹 Key Levels
Current Price
121.67
Reaction / Support Area
121.50–121.71
Key Reclaim Zone
121.75–121.99
Fib 0
121.92
Fib -0.5 / Upper Extension
122.13
Downside Fib Levels
121.50 — Fib 1
121.29 — Fib 1.5
121.08 — Fib 2
120.87 — Fib 2.5
120.65 — Fib 3
120.45 — Fib 3.5
📈 Bullish Scenario
If SOL reclaims the 121.75–121.99 zone and holds above the descending resistance, the next level to watch is:
122.13
A sustained breakout above the descending channel would provide stronger evidence that the short-term structure is changing.
📉 Bearish Scenario
If SOL fails to reclaim 121.75–121.99, the current descending structure remains intact.
A move below 121.50 could expose:
121.29 → 121.08 → 120.87 → 120.65 → 120.45
The bearish continuation scenario becomes stronger if price breaks the lower channel structure.
📊 Indicator Check
RSI: 50.35
RSI is near the neutral 50 area, showing that momentum is currently balanced.
MACD: Near zero / slightly negative.
Momentum is not providing strong directional confirmation yet.
That makes the price structure and reclaim level more important.
🧠 Bottom Line
SOL is compressed beneath descending resistance.
121.75–121.99 = decision zone.
Above it → recovery scenario strengthens.
Below it → consolidation / downside continuation remains possible.
The market is at resistance.
Let the breakout—or rejection—confirm the direction
DYOR / NFA.
— @nayrbryanGaming
#SOL #SOLUSDT #Crypto #TechnicalAnalysis #DYOR #NFA
106
·
--
Bullish
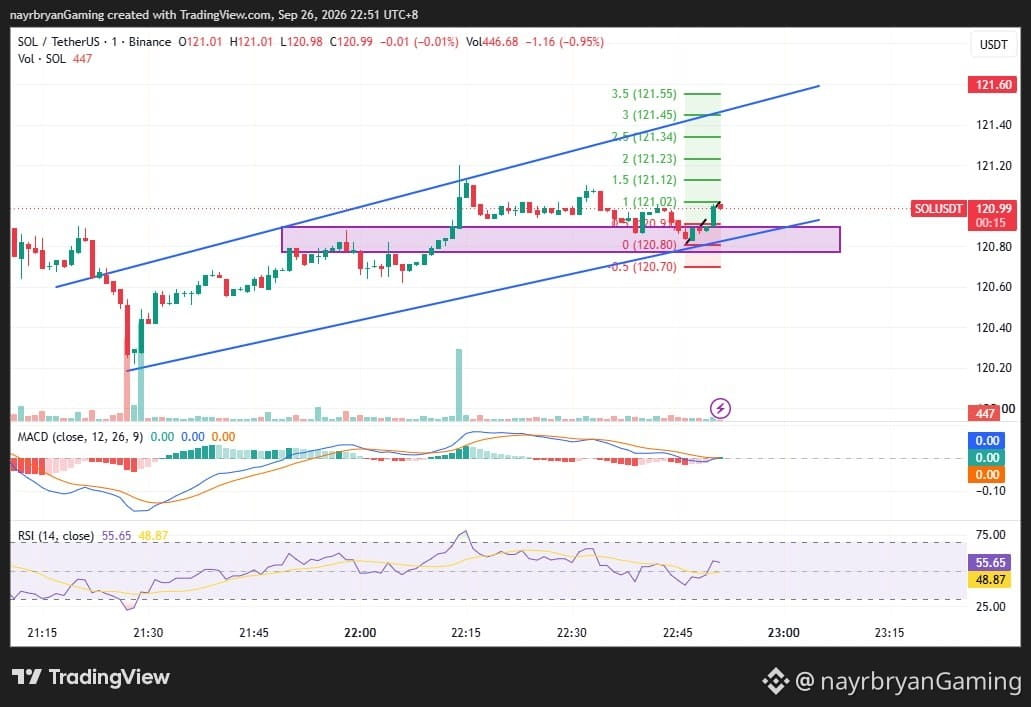
TRADER MOTIVATION / MINI INSIGHT
🧠 Insight of the Day
“Don’t chase the breakout. Watch how price behaves around the reclaimed structure.”
Why This Matters
SOL has already reacted from the 120.80 area and returned toward 121.00.
The next important test is whether price can establish acceptance above 121.02–121.12.
A candle moving higher is not confirmation by itself.
Good execution focuses on:
• Structure • Confirmation • Reaction • Invalidation • Risk control
🎯 Trader Checklist
Mark 120.80–120.90
Watch 121.02–121.12
Monitor the ascending channel
Respect 120.70 invalidation
Avoid chasing candles
Protect capital
🧠 Mini Challenge
Before entering, ask:
“Am I trading confirmed structure — or simply reacting to movement?”
— @nayrbryanGaming #TraderMindset #TradingDiscipline #NoFOMO #CryptoMindset #DYOR #PriceAction #SOLUSDT
🔔 Follow my Binance Square & X (@nayrbryanGaming) for daily chart insights.
TRADER MOTIVATION / MINI INSIGHT
🧠 Insight of the Day
“Don’t chase the breakout. Watch how price behaves around the reclaimed structure.”
Why This Matters
SOL has already reacted from the 120.80 area and returned toward 121.00.
The next important test is whether price can establish acceptance above 121.02–121.12.
A candle moving higher is not confirmation by itself.
Good execution focuses on:
• Structure • Confirmation • Reaction • Invalidation • Risk control
🎯 Trader Checklist
Mark 120.80–120.90
Watch 121.02–121.12
Monitor the ascending channel
Respect 120.70 invalidation
Avoid chasing candles
Protect capital
🧠 Mini Challenge
Before entering, ask:
“Am I trading confirmed structure — or simply reacting to movement?”
— @nayrbryanGaming #TraderMindset #TradingDiscipline #NoFOMO #CryptoMindset #DYOR #PriceAction #SOLUSDT
🔔 Follow my Binance Square & X (@nayrbryanGaming) for daily chart insights.
🧠 Insight of the Day
“Don’t chase the breakout. Watch how price behaves around the reclaimed structure.”
Why This Matters
SOL has already reacted from the 120.80 area and returned toward 121.00.
The next important test is whether price can establish acceptance above 121.02–121.12.
A candle moving higher is not confirmation by itself.
Good execution focuses on:
• Structure • Confirmation • Reaction • Invalidation • Risk control
🎯 Trader Checklist
Mark 120.80–120.90
Watch 121.02–121.12
Monitor the ascending channel
Respect 120.70 invalidation
Avoid chasing candles
Protect capital
🧠 Mini Challenge
Before entering, ask:
“Am I trading confirmed structure — or simply reacting to movement?”
— @nayrbryanGaming #TraderMindset #TradingDiscipline #NoFOMO #CryptoMindset #DYOR #PriceAction #SOLUSDT
🔔 Follow my Binance Square & X (@nayrbryanGaming) for daily chart insights.
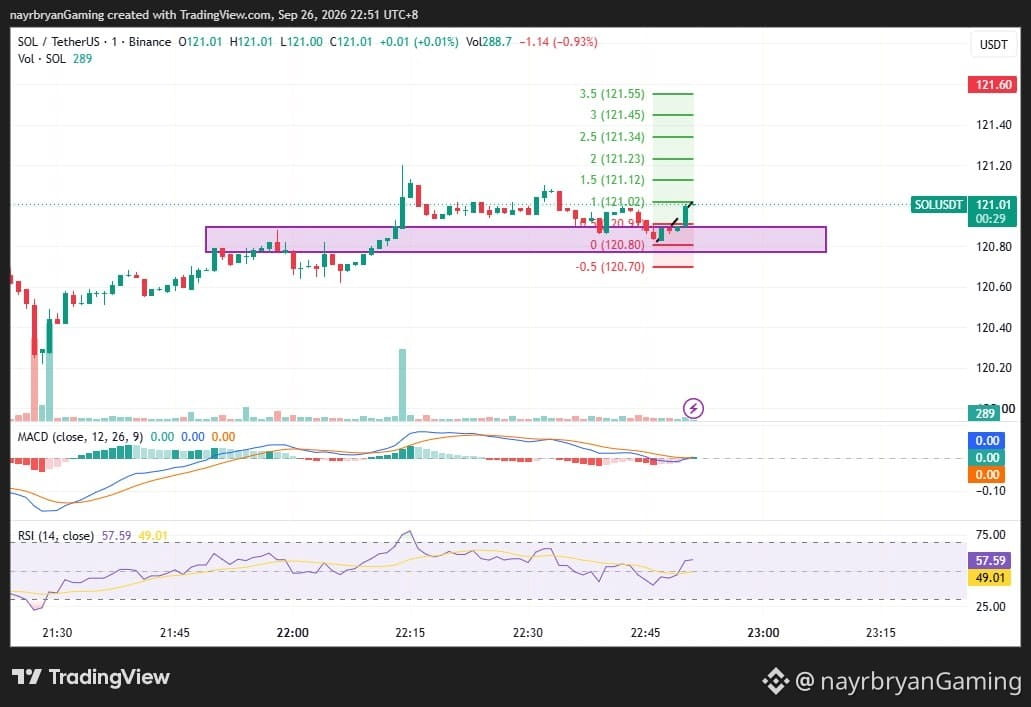
61
·
--
Bullish
LIGHT ANALYSIS / CHART SETUP — SOL/USDT
📈 Structure Overview
Market phase: Recovery → Structure reclaim → Consolidation
Channel structure: Ascending channel
Key support zone: 120.80 – 120.90
Immediate resistance: 121.02 – 121.12
Major breakout level: 121.23
Invalidation: 120.70
📌 What I’m Watching
Scenario A — Bullish Continuation
If SOL holds above 120.80–120.90 and reclaims 121.02–121.12, price may rotate toward:
121.23 → 121.34 → 121.45 → 121.55
These levels correspond with the Fibonacci extensions marked on the chart.
Scenario B — Support Failure
If SOL loses 120.80, the current recovery structure weakens.
A break below 120.70 would invalidate the current Fibonacci reaction framework.
📊 Indicator Check
MACD: Around zero → momentum currently limited
RSI: 55.65 → moderate bullish momentum
Price Structure: Ascending channel + support reaction
Key Confirmation: 121.02–121.12 reclaim
Note: This is a chart framework, not a trade recommendation. Use it to support your own DYOR-based execution plan.
— @nayrbryanGaming #SOLAnalysis #ChartSetup #PriceAction #SmartMoney #Fibonacci #CryptoTrading #DYOR #NFA
LIGHT ANALYSIS / CHART SETUP — SOL/USDT
📈 Structure Overview
Market phase: Recovery → Structure reclaim → Consolidation
Channel structure: Ascending channel
Key support zone: 120.80 – 120.90
Immediate resistance: 121.02 – 121.12
Major breakout level: 121.23
Invalidation: 120.70
📌 What I’m Watching
Scenario A — Bullish Continuation
If SOL holds above 120.80–120.90 and reclaims 121.02–121.12, price may rotate toward:
121.23 → 121.34 → 121.45 → 121.55
These levels correspond with the Fibonacci extensions marked on the chart.
Scenario B — Support Failure
If SOL loses 120.80, the current recovery structure weakens.
A break below 120.70 would invalidate the current Fibonacci reaction framework.
📊 Indicator Check
MACD: Around zero → momentum currently limited
RSI: 55.65 → moderate bullish momentum
Price Structure: Ascending channel + support reaction
Key Confirmation: 121.02–121.12 reclaim
Note: This is a chart framework, not a trade recommendation. Use it to support your own DYOR-based execution plan.
— @nayrbryanGaming #SOLAnalysis #ChartSetup #PriceAction #SmartMoney #Fibonacci #CryptoTrading #DYOR #NFA
📈 Structure Overview
Market phase: Recovery → Structure reclaim → Consolidation
Channel structure: Ascending channel
Key support zone: 120.80 – 120.90
Immediate resistance: 121.02 – 121.12
Major breakout level: 121.23
Invalidation: 120.70
📌 What I’m Watching
Scenario A — Bullish Continuation
If SOL holds above 120.80–120.90 and reclaims 121.02–121.12, price may rotate toward:
121.23 → 121.34 → 121.45 → 121.55
These levels correspond with the Fibonacci extensions marked on the chart.
Scenario B — Support Failure
If SOL loses 120.80, the current recovery structure weakens.
A break below 120.70 would invalidate the current Fibonacci reaction framework.
📊 Indicator Check
MACD: Around zero → momentum currently limited
RSI: 55.65 → moderate bullish momentum
Price Structure: Ascending channel + support reaction
Key Confirmation: 121.02–121.12 reclaim
Note: This is a chart framework, not a trade recommendation. Use it to support your own DYOR-based execution plan.
— @nayrbryanGaming #SOLAnalysis #ChartSetup #PriceAction #SmartMoney #Fibonacci #CryptoTrading #DYOR #NFA
66
·
--
Bullish
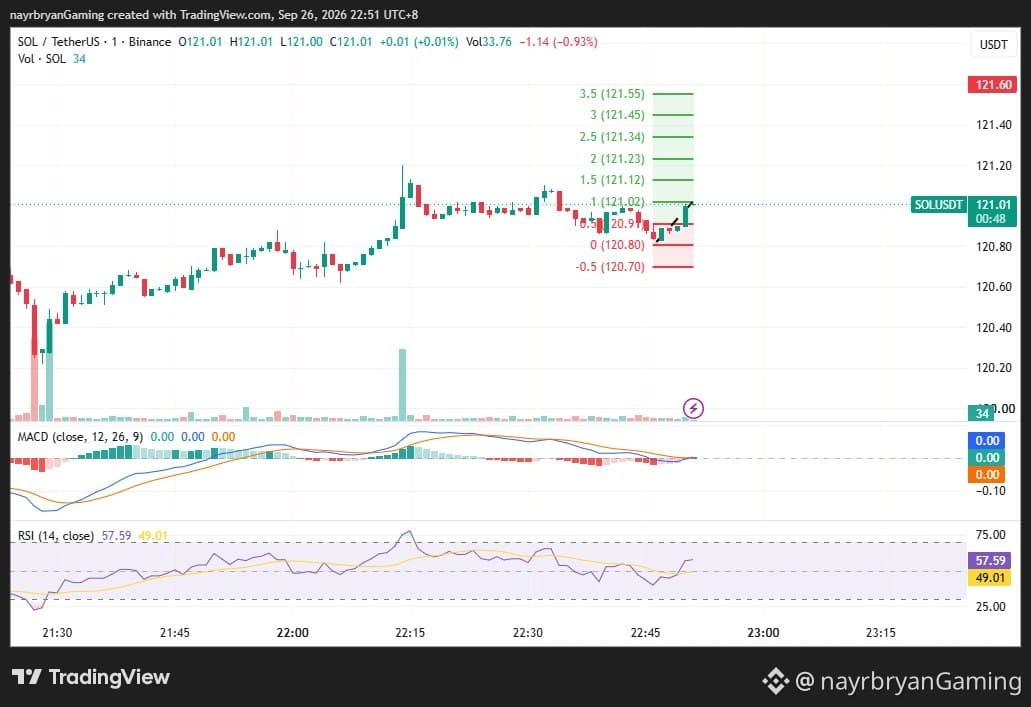
DAILY SIGNAL — SOL/USDT
Date: 26 Sep 2026 Timeframe: 1m Intraday Bias: Bullish reaction → structure hold → potential upside continuation
📊 Market Bias
SOL is trading inside an ascending channel after recovering from the lower structure.
Price recently reacted from the 120.80 Fibonacci base and reclaimed the purple structure zone around 120.80–120.90.
Current price is around 120.99, with price now testing the 121.02 Fibonacci level.
🔹 Key Levels From Chart
Current Price: 120.99
Key Structure Zone: 120.80 → 120.90
Immediate Resistance: 121.02 → 121.12
Key Breakout Level: 121.23
Invalidation: Below 120.70
🎯 Upside Fibonacci Targets
TP1 → 121.02 (1.0 Fib) TP2 → 121.12 (1.5 Fib) TP3 → 121.23 (2.0 Fib) TP4 → 121.34 (2.5 Fib) TP5 → 121.45 (3.0 Fib) TP6 → 121.55 (3.5 Fib)
📈 Technical Breakdown
SOL remains within the ascending channel visible on the chart.
Price previously pushed above the purple structure zone, then pulled back toward 120.80, where buyers reacted.
The latest candles have recovered toward 121.00, keeping the short-term structure constructive.
MACD is currently around the zero line, showing limited momentum at the latest candle.
RSI is around 55.65, indicating moderate bullish momentum without being overbought.
A sustained move above 121.02–121.12 could expose the higher Fibonacci levels.
If price loses 120.80, the current bullish structure weakens. A move below 120.70 would invalidate the displayed Fibonacci reaction framework.
🧠 Quick Insight
“Structure matters most when price returns to the level it just reclaimed.”
⚠️ Disclaimer
This is personal market analysis, not financial advice. This chart framework is for educational purposes only.
Always DYOR / DYODD, manage risk properly, and avoid emotional trading.
— @nayrbryanGaming #SOL #SOLUSDT #Crypto #Trading #TechnicalAnalysis #PriceAction #Fibonacci #Binance #DYOR #NFA #NoFOMO
DAILY SIGNAL — SOL/USDT
Date: 26 Sep 2026 Timeframe: 1m Intraday Bias: Bullish reaction → structure hold → potential upside continuation
📊 Market Bias
SOL is trading inside an ascending channel after recovering from the lower structure.
Price recently reacted from the 120.80 Fibonacci base and reclaimed the purple structure zone around 120.80–120.90.
Current price is around 120.99, with price now testing the 121.02 Fibonacci level.
🔹 Key Levels From Chart
Current Price: 120.99
Key Structure Zone: 120.80 → 120.90
Immediate Resistance: 121.02 → 121.12
Key Breakout Level: 121.23
Invalidation: Below 120.70
🎯 Upside Fibonacci Targets
TP1 → 121.02 (1.0 Fib) TP2 → 121.12 (1.5 Fib) TP3 → 121.23 (2.0 Fib) TP4 → 121.34 (2.5 Fib) TP5 → 121.45 (3.0 Fib) TP6 → 121.55 (3.5 Fib)
📈 Technical Breakdown
SOL remains within the ascending channel visible on the chart.
Price previously pushed above the purple structure zone, then pulled back toward 120.80, where buyers reacted.
The latest candles have recovered toward 121.00, keeping the short-term structure constructive.
MACD is currently around the zero line, showing limited momentum at the latest candle.
RSI is around 55.65, indicating moderate bullish momentum without being overbought.
A sustained move above 121.02–121.12 could expose the higher Fibonacci levels.
If price loses 120.80, the current bullish structure weakens. A move below 120.70 would invalidate the displayed Fibonacci reaction framework.
🧠 Quick Insight
“Structure matters most when price returns to the level it just reclaimed.”
⚠️ Disclaimer
This is personal market analysis, not financial advice. This chart framework is for educational purposes only.
Always DYOR / DYODD, manage risk properly, and avoid emotional trading.
— @nayrbryanGaming #SOL #SOLUSDT #Crypto #Trading #TechnicalAnalysis #PriceAction #Fibonacci #Binance #DYOR #NFA #NoFOMO
Date: 26 Sep 2026 Timeframe: 1m Intraday Bias: Bullish reaction → structure hold → potential upside continuation
📊 Market Bias
SOL is trading inside an ascending channel after recovering from the lower structure.
Price recently reacted from the 120.80 Fibonacci base and reclaimed the purple structure zone around 120.80–120.90.
Current price is around 120.99, with price now testing the 121.02 Fibonacci level.
🔹 Key Levels From Chart
Current Price: 120.99
Key Structure Zone: 120.80 → 120.90
Immediate Resistance: 121.02 → 121.12
Key Breakout Level: 121.23
Invalidation: Below 120.70
🎯 Upside Fibonacci Targets
TP1 → 121.02 (1.0 Fib) TP2 → 121.12 (1.5 Fib) TP3 → 121.23 (2.0 Fib) TP4 → 121.34 (2.5 Fib) TP5 → 121.45 (3.0 Fib) TP6 → 121.55 (3.5 Fib)
📈 Technical Breakdown
SOL remains within the ascending channel visible on the chart.
Price previously pushed above the purple structure zone, then pulled back toward 120.80, where buyers reacted.
The latest candles have recovered toward 121.00, keeping the short-term structure constructive.
MACD is currently around the zero line, showing limited momentum at the latest candle.
RSI is around 55.65, indicating moderate bullish momentum without being overbought.
A sustained move above 121.02–121.12 could expose the higher Fibonacci levels.
If price loses 120.80, the current bullish structure weakens. A move below 120.70 would invalidate the displayed Fibonacci reaction framework.
🧠 Quick Insight
“Structure matters most when price returns to the level it just reclaimed.”
⚠️ Disclaimer
This is personal market analysis, not financial advice. This chart framework is for educational purposes only.
Always DYOR / DYODD, manage risk properly, and avoid emotional trading.
— @nayrbryanGaming #SOL #SOLUSDT #Crypto #Trading #TechnicalAnalysis #PriceAction #Fibonacci #Binance #DYOR #NFA #NoFOMO
73
·
--
Bullish
TRADER MOTIVATION / MINI INSIGHT
🧠 Insight of the Day
“Momentum is useful, but structure tells you where patience matters.”
Why This Matters
SOL has already made a strong upward move from the 121.25–121.60 structure zone.
After that expansion, price pulled back from the 122.70 area and is now testing the 122.29 Fibonacci level.
This is where chasing becomes less useful than watching the reaction.
The important question is not:
“Has SOL already moved?”
The better question is:
“Can the reclaimed structure continue to hold?”
🎯 Trader Checklist
Mark 122.29
Watch 122.70–122.81
Monitor the ascending channel
Respect 121.60 structure weakness
Respect 121.23 invalidation
Avoid emotional entries
Protect capital
🧠 Mini Challenge
Before entering, ask:
“Am I following confirmed structure — or chasing the previous candle?”
— @nayrbryanGaming #TraderMindset #TradingDiscipline #NoFOMO #CryptoMindset #DYOR #PriceAction #SOLUSDT
🔔 Follow my Binance Square & X (@nayrbryanGaming) for daily chart insights.
TRADER MOTIVATION / MINI INSIGHT
🧠 Insight of the Day
“Momentum is useful, but structure tells you where patience matters.”
Why This Matters
SOL has already made a strong upward move from the 121.25–121.60 structure zone.
After that expansion, price pulled back from the 122.70 area and is now testing the 122.29 Fibonacci level.
This is where chasing becomes less useful than watching the reaction.
The important question is not:
“Has SOL already moved?”
The better question is:
“Can the reclaimed structure continue to hold?”
🎯 Trader Checklist
Mark 122.29
Watch 122.70–122.81
Monitor the ascending channel
Respect 121.60 structure weakness
Respect 121.23 invalidation
Avoid emotional entries
Protect capital
🧠 Mini Challenge
Before entering, ask:
“Am I following confirmed structure — or chasing the previous candle?”
— @nayrbryanGaming #TraderMindset #TradingDiscipline #NoFOMO #CryptoMindset #DYOR #PriceAction #SOLUSDT
🔔 Follow my Binance Square & X (@nayrbryanGaming) for daily chart insights.
🧠 Insight of the Day
“Momentum is useful, but structure tells you where patience matters.”
Why This Matters
SOL has already made a strong upward move from the 121.25–121.60 structure zone.
After that expansion, price pulled back from the 122.70 area and is now testing the 122.29 Fibonacci level.
This is where chasing becomes less useful than watching the reaction.
The important question is not:
“Has SOL already moved?”
The better question is:
“Can the reclaimed structure continue to hold?”
🎯 Trader Checklist
Mark 122.29
Watch 122.70–122.81
Monitor the ascending channel
Respect 121.60 structure weakness
Respect 121.23 invalidation
Avoid emotional entries
Protect capital
🧠 Mini Challenge
Before entering, ask:
“Am I following confirmed structure — or chasing the previous candle?”
— @nayrbryanGaming #TraderMindset #TradingDiscipline #NoFOMO #CryptoMindset #DYOR #PriceAction #SOLUSDT
🔔 Follow my Binance Square & X (@nayrbryanGaming) for daily chart insights.
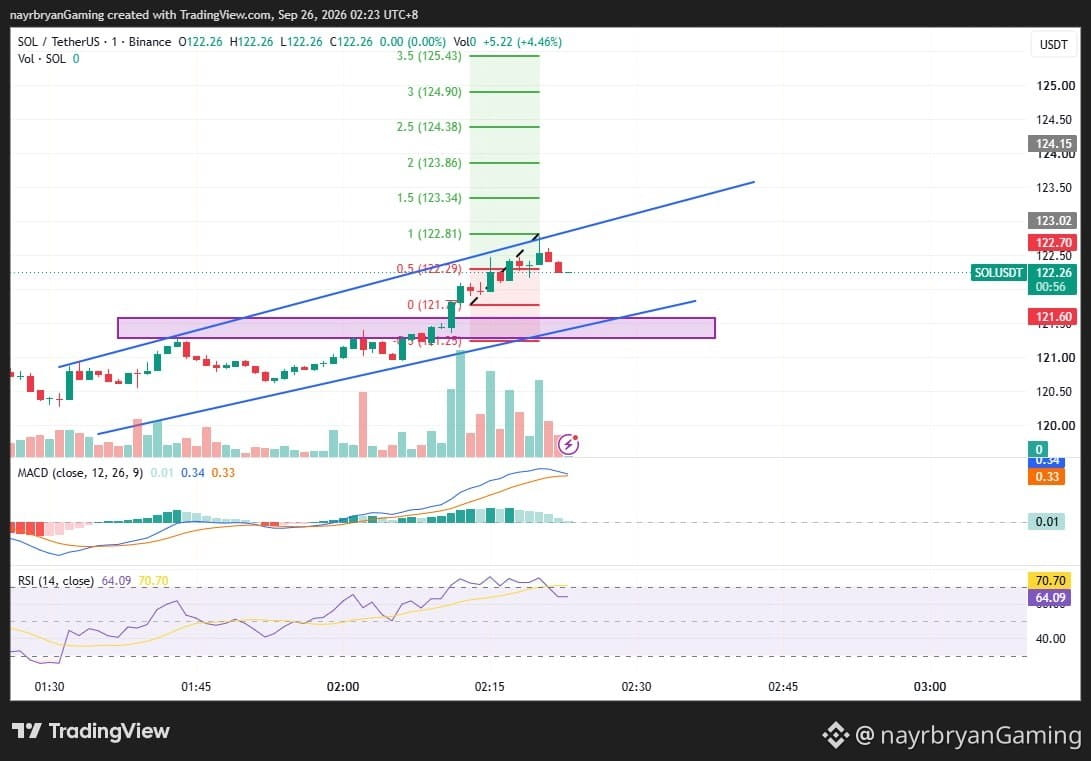
75
Log in to explore more content
Join global crypto users on Binance Square
⚡️ Get latest and useful information about crypto.
💬 Trusted by the world’s largest crypto exchange.
👍 Discover real insights from verified creators.
Email / Phone number
Trending Topics
NEARFallsToAround$4.70Down14%
14,466 views
25 Discussing
🚨 $NEAR — FROM ETF HYPE TO A 14% SLAP IN THE FACE.
NEAR has dropped toward $4.70, giving back a big chunk of its recent run after briefly trading above $5.50. The selloff also came as NEAR Intents disclosed a security incident tied to its cross-chain infrastructure, with reported losses around $3.8M. The underlying NEAR blockchain itself was not reported as compromised.
Here’s the part traders should care about:
$4.69–$4.74 is now the key support zone.
Hold it, and this could simply be a violent retest after the September breakout.
Lose it?
The next downside references sit closer to $4.58, then ~$4.30.
And the irony?
The new Bitwise NEAR ETF was still seeing positive inflows around launch week.
So this isn’t a simple “nobody wants NEAR” story.
It’s a battle between:
fresh institutional access
vs.
post-rally profit-taking + security fear.
$NEAR doesn’t need hype right now. It needs $4.70 to hold. 👀
#NEARFallsToAround$4.70Down14% #EvernorthPlansNasdaqListingOct8 #SECProposesCryptoCustodyFramework #IMFApproves$139MDisbursementToElSalvador #AnthropicTargetsIPOAsSoonAsMidNovember
KimHotbae
·0 Likes
·265 views
EthereumFoundationLaunchesZkAPIOnMainnet
5,677 views
154 Discussing
EvernorthPlansNasdaqListingOct8
16,356 views
155 Discussing