Mignolet

Square Verified
The Blockchain 100 | 2026 Awardee Founder of ForeDex, an on-chain data analytics platform. X : https://x.com/mignoletkr
2 Following
1.5K+ Followers
84 Liked
Posts
PINNED
·
--
I made it into Binance THE BLOCKCHAIN 100 2026! 🎉 Huge thanks to everyone who voted for me every day and supported me throughout the campaign! I couldn't have done it without you! 🙏 I'm mainly active on X, but I'll also be spending more time on Binance Square, sharing my market analysis and insights. Looking forward to connecting with more of you here! Thanks again for all your support!
I made it into Binance THE BLOCKCHAIN 100 2026! 🎉
Huge thanks to everyone who voted for me every day and supported me throughout the campaign! I couldn't have done it without you! 🙏

I'm mainly active on X, but I'll also be spending more time on Binance Square, sharing my market analysis and insights.
Looking forward to connecting with more of you here!

Thanks again for all your support!
PINNED
🎉🎉2026 BINANCE THE BLOCKCHAIN 100 I've been nominated for the Content Creator – Best Longform Creator category! First of all, a big thank you to everyone who nominated me! If you've been following my market analysis and supporting my content, I'd really appreciate your vote! I'd love to make it into the final THE BLOCKCHAIN 100 this year! 🙏 Vote for Mignolet for the Blockchain 100 Awards! Voting is simple: 1.** Visit my profile on Binance Square: @Mignoletkr 2.** On my profile, find **“The Blockchain 100 Awards 2026”** 3.** Click **“Vote”** and you’re done!
🎉🎉2026 BINANCE THE BLOCKCHAIN 100
I've been nominated for the Content Creator – Best Longform Creator category!

First of all, a big thank you to everyone who nominated me!

If you've been following my market analysis and supporting my content, I'd really appreciate your vote!

I'd love to make it into the final THE BLOCKCHAIN 100 this year!
🙏

Vote for Mignolet for the Blockchain 100 Awards!

Voting is simple:

1.** Visit my profile on Binance Square: @Mignolet

2.** On my profile, find **“The Blockchain 100 Awards 2026”**

3.** Click **“Vote”** and you’re done!
Article
"My Worst-Case Scenario for Bitcoin"Today, I want to discuss a scenario that I considered only a remote possibility earlier this year, but one that, as we approach the end of the year, I now believe deserves serious consideration as a potential worst-case outcome for Bitcoin. First, after selling my entire Bitcoin position in late September, I established a detailed plan outlining the specific criteria and conditions that would need to be met before I would consider buying again. However, as time passes, the various market datasets I have been monitoring continue to deteriorate rather than improve. In fact, the worst-case scenario I'm about to discuss was not even part of my original investment plan. The reason I'm bringing it up now is simple. Current market conditions look concerning enough that I believe it's necessary to take a much longer-term perspective when evaluating the market and planning my next moves. Even if Bitcoin is currently trading at its price bottom, the absence of meaningful accumulation suggests that the market could remain in a prolonged consolidation phase, potentially lasting much longer than many investors expect. The psychological pressure, frustration, and exhaustion that come with an extended period of sideways price action should never be underestimated. 1. Three Conditions That Could Trigger My Worst-Case Scenario For the worst-case scenario I'm concerned about to materialize, three key conditions would need to persist. Condition 1. Sustained U.S. dollar strength Condition 2. A decline in the U.S. stock market Condition 3. Continued selling pressure from Binance whales If these three conditions persist, we may reach a point where we need to seriously consider the possibility that Bitcoin is not simply experiencing another correction within its familiar four-year cycle, but rather a much larger, long-term correction involving the price structure formed throughout Bitcoin's entire history since 2010. Historically, we have analyzed Bitcoin's price advances and corrections primarily through the recurring halving cycles that have shaped its market behavior. (See Figure 2.) However, the approval of spot Bitcoin ETFs brought significant changes to the market. Think about the paradigm shifts that have been discussed over the past several years. - We have witnessed a shift in Bitcoin ownership, with holdings moving from traditional "Old Whales" toward a new generation of institutionally driven "New Whales" entering through ETFs. - Following spot ETF approval, Bitcoin has become more deeply integrated into traditional financial markets and increasingly sensitive to macroeconomic conditions and broader market cycles. - A growing number of institutional investors have incorporated Bitcoin into their investment portfolios. These developments have not been limited to market narratives. Actual on-chain cycle data has also revealed clear structural changes compared with previous cycles, while several valuation models that had historically been reliable failed to accurately reflect Bitcoin's peak last year. I do not consider this a coincidence. In my view, these developments are the result of fundamental changes in market participants, capital flows, and the underlying structure of Bitcoin trading. By next January, it will have been three years since the approval of U.S. spot Bitcoin ETFs. Think about how much the market structure may have changed over that period. Against this backdrop, we frequently hear narratives such as "An entirely new market structure is emerging in crypto." "Blockchain is no longer exclusive to the cryptocurrency ecosystem." "The growth of the real-world asset (RWA) market will lead Bitcoin and Ethereum to develop increasingly distinct market structures and price behavior." I believe there is considerable merit to these arguments. But let's consider the implications from another perspective. If we acknowledge that Bitcoin's market structure has fundamentally changed, can we really dismiss the possibility that the current correction is not merely another downturn within the traditional four-year cycle, but instead a much broader correction of Bitcoin's long-term price structure spanning its entire history? I don't think that possibility is unreasonable at all. 2. Concerning Structures Emerging in Long-Term Technical Analysis (TA) In technical analysis, patterns that develop over longer timeframes can generally carry greater significance than short-term price movements. And when I examine Bitcoin's long-term chart, its structure is becoming increasingly similar to the classic Ending Diagonal pattern described in Elliott Wave Theory. Of course, no single technical pattern can reliably determine where prices will go in the future. However, I believe we now need to examine not only the broader chart structure, but also the developing candlestick patterns and the breakdown of important long-term trends. There is one particularly important point to consider. If Bitcoin fails to stage a meaningful recovery before the end of this year and closes the annual candle in negative territory, it would mark the first time in Bitcoin's history that it has recorded two consecutive bearish annual candles. I believe such a development could carry implications far beyond a simple negative annual return. It could provide further evidence that Bitcoin is behaving differently from the recurring patterns associated with its traditional halving cycles, potentially requiring us to reassess how we interpret its long-term market structure. The current long-term technical structure and candlestick formations are already concerning, and Bitcoin has begun showing signs of breaking below important trend structures. I briefly discussed this possibility earlier this year. But there is a specific reason why I am now taking this scenario much more seriously. The concerning patterns emerging from technical analysis are increasingly being reinforced by actual signs of deteriorating market liquidity. This is not simply a case of the charts looking bearish. Across multiple datasets, including buy-side liquidity entering the market, capital flows from major market participants, and whale trading activity, I am struggling to find meaningful evidence of improvement. At the same time, I do not expect the current strength of the U.S. dollar to reverse easily. I have repeatedly discussed which liquidity indicators are showing deterioration, so I will not go through each individual dataset again in this article. 3. How Far Could Bitcoin Fall If the Worst-Case Scenario Materializes? This brings us to perhaps the most important question. "If this scenario actually unfolds, how far could Bitcoin decline?" I believe that many of the average acquisition cost metrics and valuation benchmarks used in traditional on-chain cycle analysis have become significantly distorted since the approval of spot Bitcoin ETFs. I have already explained the reasons behind these distortions in previous analyses, so I will not repeat them here. Instead, I want to focus on the cost structure of the Bitcoin mining industry, which is directly connected to the real economic activity supporting the Bitcoin network. One of the most important benchmarks I am watching is Operational Floor Cost, which represents the direct operating costs incurred by Bitcoin mining companies. This reflects the essential costs miners must bear to maintain their mining operations. In an extreme market environment, I consider it a potentially important reference point for assessing downside risk. Today, many publicly listed Bitcoin mining companies are allocating substantial resources not only to their traditional mining businesses, but also to AI data center operations. But consider what could happen if investor sentiment toward the AI sector deteriorates sharply while Bitcoin simultaneously experiences another major decline. Under those circumstances, mining companies could face significant pressure across both business segments at the same time. Even in such an extreme environment, I consider Operational Floor Cost a critical level that needs to hold. If Bitcoin were to fall below that threshold, the financial stability and long-term viability of some publicly listed mining companies could come under serious pressure. Taking these factors into account, I am leaving open the possibility that Bitcoin could decline into the low-$40,000 range under my worst-case scenario. This does not mean I expect Bitcoin to reach that level with certainty. Rather, it is a downside scenario I am considering under the assumption that the three conditions outlined earlier remain in place and market liquidity deteriorates further. 4. Why I'm Discussing This Scenario Now Let me emphasize this once again. This is my worst-case scenario, not a prediction that I am certain will come true. The reason I am discussing it publicly is that the market conditions and underlying data I am currently observing are simply not encouraging. As I mentioned earlier, I have already established my criteria and plan for reentering the market. However, having a buying plan and having a reason to buy right now are two entirely different things. Under current conditions, rather than allowing short-term price rebounds to influence my decisions, I intend to evaluate the market over a much longer timeframe and maintain sufficient distance before taking action. Even if Bitcoin has already reached its price bottom, without meaningful accumulation, it could take considerably longer than expected for a sustainable uptrend to emerge. And that prolonged period of sideways consolidation could prove far more frustrating and psychologically challenging than many investors anticipate. At this point, I still do not view the current decline as an opportunity that justifies aggressive buying. At least, not according to my own investment criteria. A significant price decline, by itself, does not provide sufficient justification for entering the market. What I am waiting for is not simply a lower Bitcoin price. I am waiting for genuine improvement in market liquidity and meaningful signs of accumulation from major market participants. I sincerely hope market liquidity begins to recover as soon as possible and that we start seeing clear signs of accumulation from the key players driving this market.

"My Worst-Case Scenario for Bitcoin"

Today, I want to discuss a scenario that I considered only a remote possibility earlier this year, but one that, as we approach the end of the year, I now believe deserves serious consideration as a potential worst-case outcome for Bitcoin.
First, after selling my entire Bitcoin position in late September, I established a detailed plan outlining the specific criteria and conditions that would need to be met before I would consider buying again.
However, as time passes, the various market datasets I have been monitoring continue to deteriorate rather than improve.
In fact, the worst-case scenario I'm about to discuss was not even part of my original investment plan.
The reason I'm bringing it up now is simple.
Current market conditions look concerning enough that I believe it's necessary to take a much longer-term perspective when evaluating the market and planning my next moves.
Even if Bitcoin is currently trading at its price bottom, the absence of meaningful accumulation suggests that the market could remain in a prolonged consolidation phase, potentially lasting much longer than many investors expect.
The psychological pressure, frustration, and exhaustion that come with an extended period of sideways price action should never be underestimated.
1. Three Conditions That Could Trigger My Worst-Case Scenario
For the worst-case scenario I'm concerned about to materialize, three key conditions would need to persist.
Condition 1. Sustained U.S. dollar strength
Condition 2. A decline in the U.S. stock market
Condition 3. Continued selling pressure from Binance whales
If these three conditions persist, we may reach a point where we need to seriously consider the possibility that Bitcoin is not simply experiencing another correction within its familiar four-year cycle, but rather a much larger, long-term correction involving the price structure formed throughout Bitcoin's entire history since 2010.
Historically, we have analyzed Bitcoin's price advances and corrections primarily through the recurring halving cycles that have shaped its market behavior. (See Figure 2.)
However, the approval of spot Bitcoin ETFs brought significant changes to the market.
Think about the paradigm shifts that have been discussed over the past several years.
- We have witnessed a shift in Bitcoin ownership, with holdings moving from traditional "Old Whales" toward a new generation of institutionally driven "New Whales" entering through ETFs.
- Following spot ETF approval, Bitcoin has become more deeply integrated into traditional financial markets and increasingly sensitive to macroeconomic conditions and broader market cycles.
- A growing number of institutional investors have incorporated Bitcoin into their investment portfolios.
These developments have not been limited to market narratives.
Actual on-chain cycle data has also revealed clear structural changes compared with previous cycles, while several valuation models that had historically been reliable failed to accurately reflect Bitcoin's peak last year.
I do not consider this a coincidence.
In my view, these developments are the result of fundamental changes in market participants, capital flows, and the underlying structure of Bitcoin trading.
By next January, it will have been three years since the approval of U.S. spot Bitcoin ETFs.
Think about how much the market structure may have changed over that period.
Against this backdrop, we frequently hear narratives such as
"An entirely new market structure is emerging in crypto."
"Blockchain is no longer exclusive to the cryptocurrency ecosystem."
"The growth of the real-world asset (RWA) market will lead Bitcoin and Ethereum to develop increasingly distinct market structures and price behavior."
I believe there is considerable merit to these arguments.
But let's consider the implications from another perspective.
If we acknowledge that Bitcoin's market structure has fundamentally changed, can we really dismiss the possibility that the current correction is not merely another downturn within the traditional four-year cycle, but instead a much broader correction of Bitcoin's long-term price structure spanning its entire history?
I don't think that possibility is unreasonable at all.
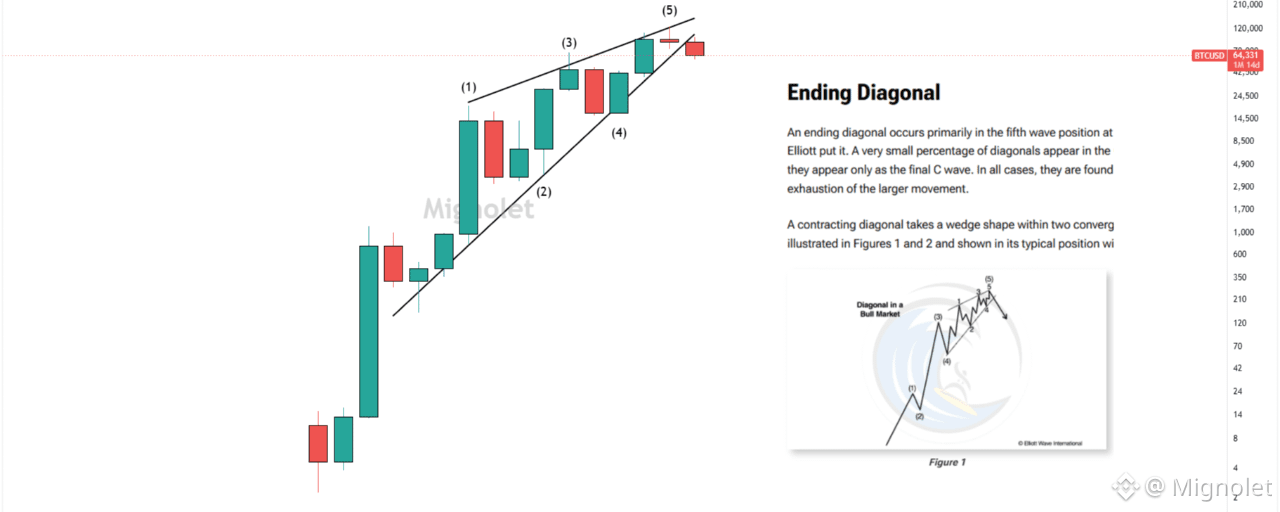
2. Concerning Structures Emerging in Long-Term Technical Analysis (TA)
In technical analysis, patterns that develop over longer timeframes can generally carry greater significance than short-term price movements.
And when I examine Bitcoin's long-term chart, its structure is becoming increasingly similar to the classic Ending Diagonal pattern described in Elliott Wave Theory.
Of course, no single technical pattern can reliably determine where prices will go in the future.
However, I believe we now need to examine not only the broader chart structure, but also the developing candlestick patterns and the breakdown of important long-term trends.
There is one particularly important point to consider.
If Bitcoin fails to stage a meaningful recovery before the end of this year and closes the annual candle in negative territory, it would mark the first time in Bitcoin's history that it has recorded two consecutive bearish annual candles.
I believe such a development could carry implications far beyond a simple negative annual return.
It could provide further evidence that Bitcoin is behaving differently from the recurring patterns associated with its traditional halving cycles, potentially requiring us to reassess how we interpret its long-term market structure.
The current long-term technical structure and candlestick formations are already concerning, and Bitcoin has begun showing signs of breaking below important trend structures.
I briefly discussed this possibility earlier this year.
But there is a specific reason why I am now taking this scenario much more seriously.
The concerning patterns emerging from technical analysis are increasingly being reinforced by actual signs of deteriorating market liquidity.
This is not simply a case of the charts looking bearish.
Across multiple datasets, including buy-side liquidity entering the market, capital flows from major market participants, and whale trading activity, I am struggling to find meaningful evidence of improvement.
At the same time, I do not expect the current strength of the U.S. dollar to reverse easily.
I have repeatedly discussed which liquidity indicators are showing deterioration, so I will not go through each individual dataset again in this article.
3. How Far Could Bitcoin Fall If the Worst-Case Scenario Materializes?
This brings us to perhaps the most important question.
"If this scenario actually unfolds, how far could Bitcoin decline?"
I believe that many of the average acquisition cost metrics and valuation benchmarks used in traditional on-chain cycle analysis have become significantly distorted since the approval of spot Bitcoin ETFs.
I have already explained the reasons behind these distortions in previous analyses, so I will not repeat them here.
Instead, I want to focus on the cost structure of the Bitcoin mining industry, which is directly connected to the real economic activity supporting the Bitcoin network.
One of the most important benchmarks I am watching is Operational Floor Cost, which represents the direct operating costs incurred by Bitcoin mining companies.
This reflects the essential costs miners must bear to maintain their mining operations.
In an extreme market environment, I consider it a potentially important reference point for assessing downside risk.
Today, many publicly listed Bitcoin mining companies are allocating substantial resources not only to their traditional mining businesses, but also to AI data center operations.
But consider what could happen if investor sentiment toward the AI sector deteriorates sharply while Bitcoin simultaneously experiences another major decline.
Under those circumstances, mining companies could face significant pressure across both business segments at the same time.
Even in such an extreme environment, I consider Operational Floor Cost a critical level that needs to hold.
If Bitcoin were to fall below that threshold, the financial stability and long-term viability of some publicly listed mining companies could come under serious pressure.
Taking these factors into account, I am leaving open the possibility that Bitcoin could decline into the low-$40,000 range under my worst-case scenario.
This does not mean I expect Bitcoin to reach that level with certainty.
Rather, it is a downside scenario I am considering under the assumption that the three conditions outlined earlier remain in place and market liquidity deteriorates further.
4. Why I'm Discussing This Scenario Now
Let me emphasize this once again.
This is my worst-case scenario, not a prediction that I am certain will come true.
The reason I am discussing it publicly is that the market conditions and underlying data I am currently observing are simply not encouraging.
As I mentioned earlier, I have already established my criteria and plan for reentering the market.
However, having a buying plan and having a reason to buy right now are two entirely different things.
Under current conditions, rather than allowing short-term price rebounds to influence my decisions, I intend to evaluate the market over a much longer timeframe and maintain sufficient distance before taking action.
Even if Bitcoin has already reached its price bottom, without meaningful accumulation, it could take considerably longer than expected for a sustainable uptrend to emerge.
And that prolonged period of sideways consolidation could prove far more frustrating and psychologically challenging than many investors anticipate.
At this point, I still do not view the current decline as an opportunity that justifies aggressive buying.
At least, not according to my own investment criteria.
A significant price decline, by itself, does not provide sufficient justification for entering the market.
What I am waiting for is not simply a lower Bitcoin price.
I am waiting for genuine improvement in market liquidity and meaningful signs of accumulation from major market participants.
I sincerely hope market liquidity begins to recover as soon as possible and that we start seeing clear signs of accumulation from the key players driving this market.
Rather than getting caught up in extreme price volatility, now is the time to stay calm and assess the market objectively. My perspective remains unchanged. I believe Bitcoin still needs a much longer accumulation period before a sustainable uptrend can begin. That's precisely why I sold all my Bitcoin on September 26. If meaningful accumulation had emerged during this sharp decline, I would have considered the possibility of a faster recovery. But so far, I'm seeing no meaningful signs of accumulation. Buy-side liquidity remains severely constrained, while institutional selling flows continue moving onto exchanges. The sustained buying pressure needed for a genuine recovery simply isn't there. Under these conditions, I see no reason to rush. Think about it. When Bitcoin was above $80,000, many people confidently said: "If the price crashes, I'll just buy more. What's there to worry about?" But when the market actually crashes, those same people often struggle to buy. That's what makes investing difficult. It's not just about predicting prices, but sticking to your principles when the situation actually unfolds. Now imagine buying simply because Bitcoin has fallen sharply, without clear investment criteria. What if the market doesn't recover and instead enters a prolonged period of sideways consolidation? The profits you expected never materialize. Doubt and anxiety gradually take over. Eventually, even small price fluctuations begin to shake your confidence. A position entered without clear criteria can ultimately be undermined more by your own emotions than by the market itself. That's exactly what I want to avoid. Given the current liquidity conditions and lack of accumulation, I still see no convincing signs of improvement. That's why I have no intention of taking any action right now. Even if this turns out to be the bottom, it doesn't mean a new uptrend will begin immediately. Finding a bottom and establishing a sustainable uptrend through sufficient accumulation are two entirely different things. I'm not going to rush. This simply isn't the time.
Rather than getting caught up in extreme price volatility, now is the time to stay calm and assess the market objectively.

My perspective remains unchanged.
I believe Bitcoin still needs a much longer accumulation period before a sustainable uptrend can begin.
That's precisely why I sold all my Bitcoin on September 26.

If meaningful accumulation had emerged during this sharp decline, I would have considered the possibility of a faster recovery.
But so far, I'm seeing no meaningful signs of accumulation.

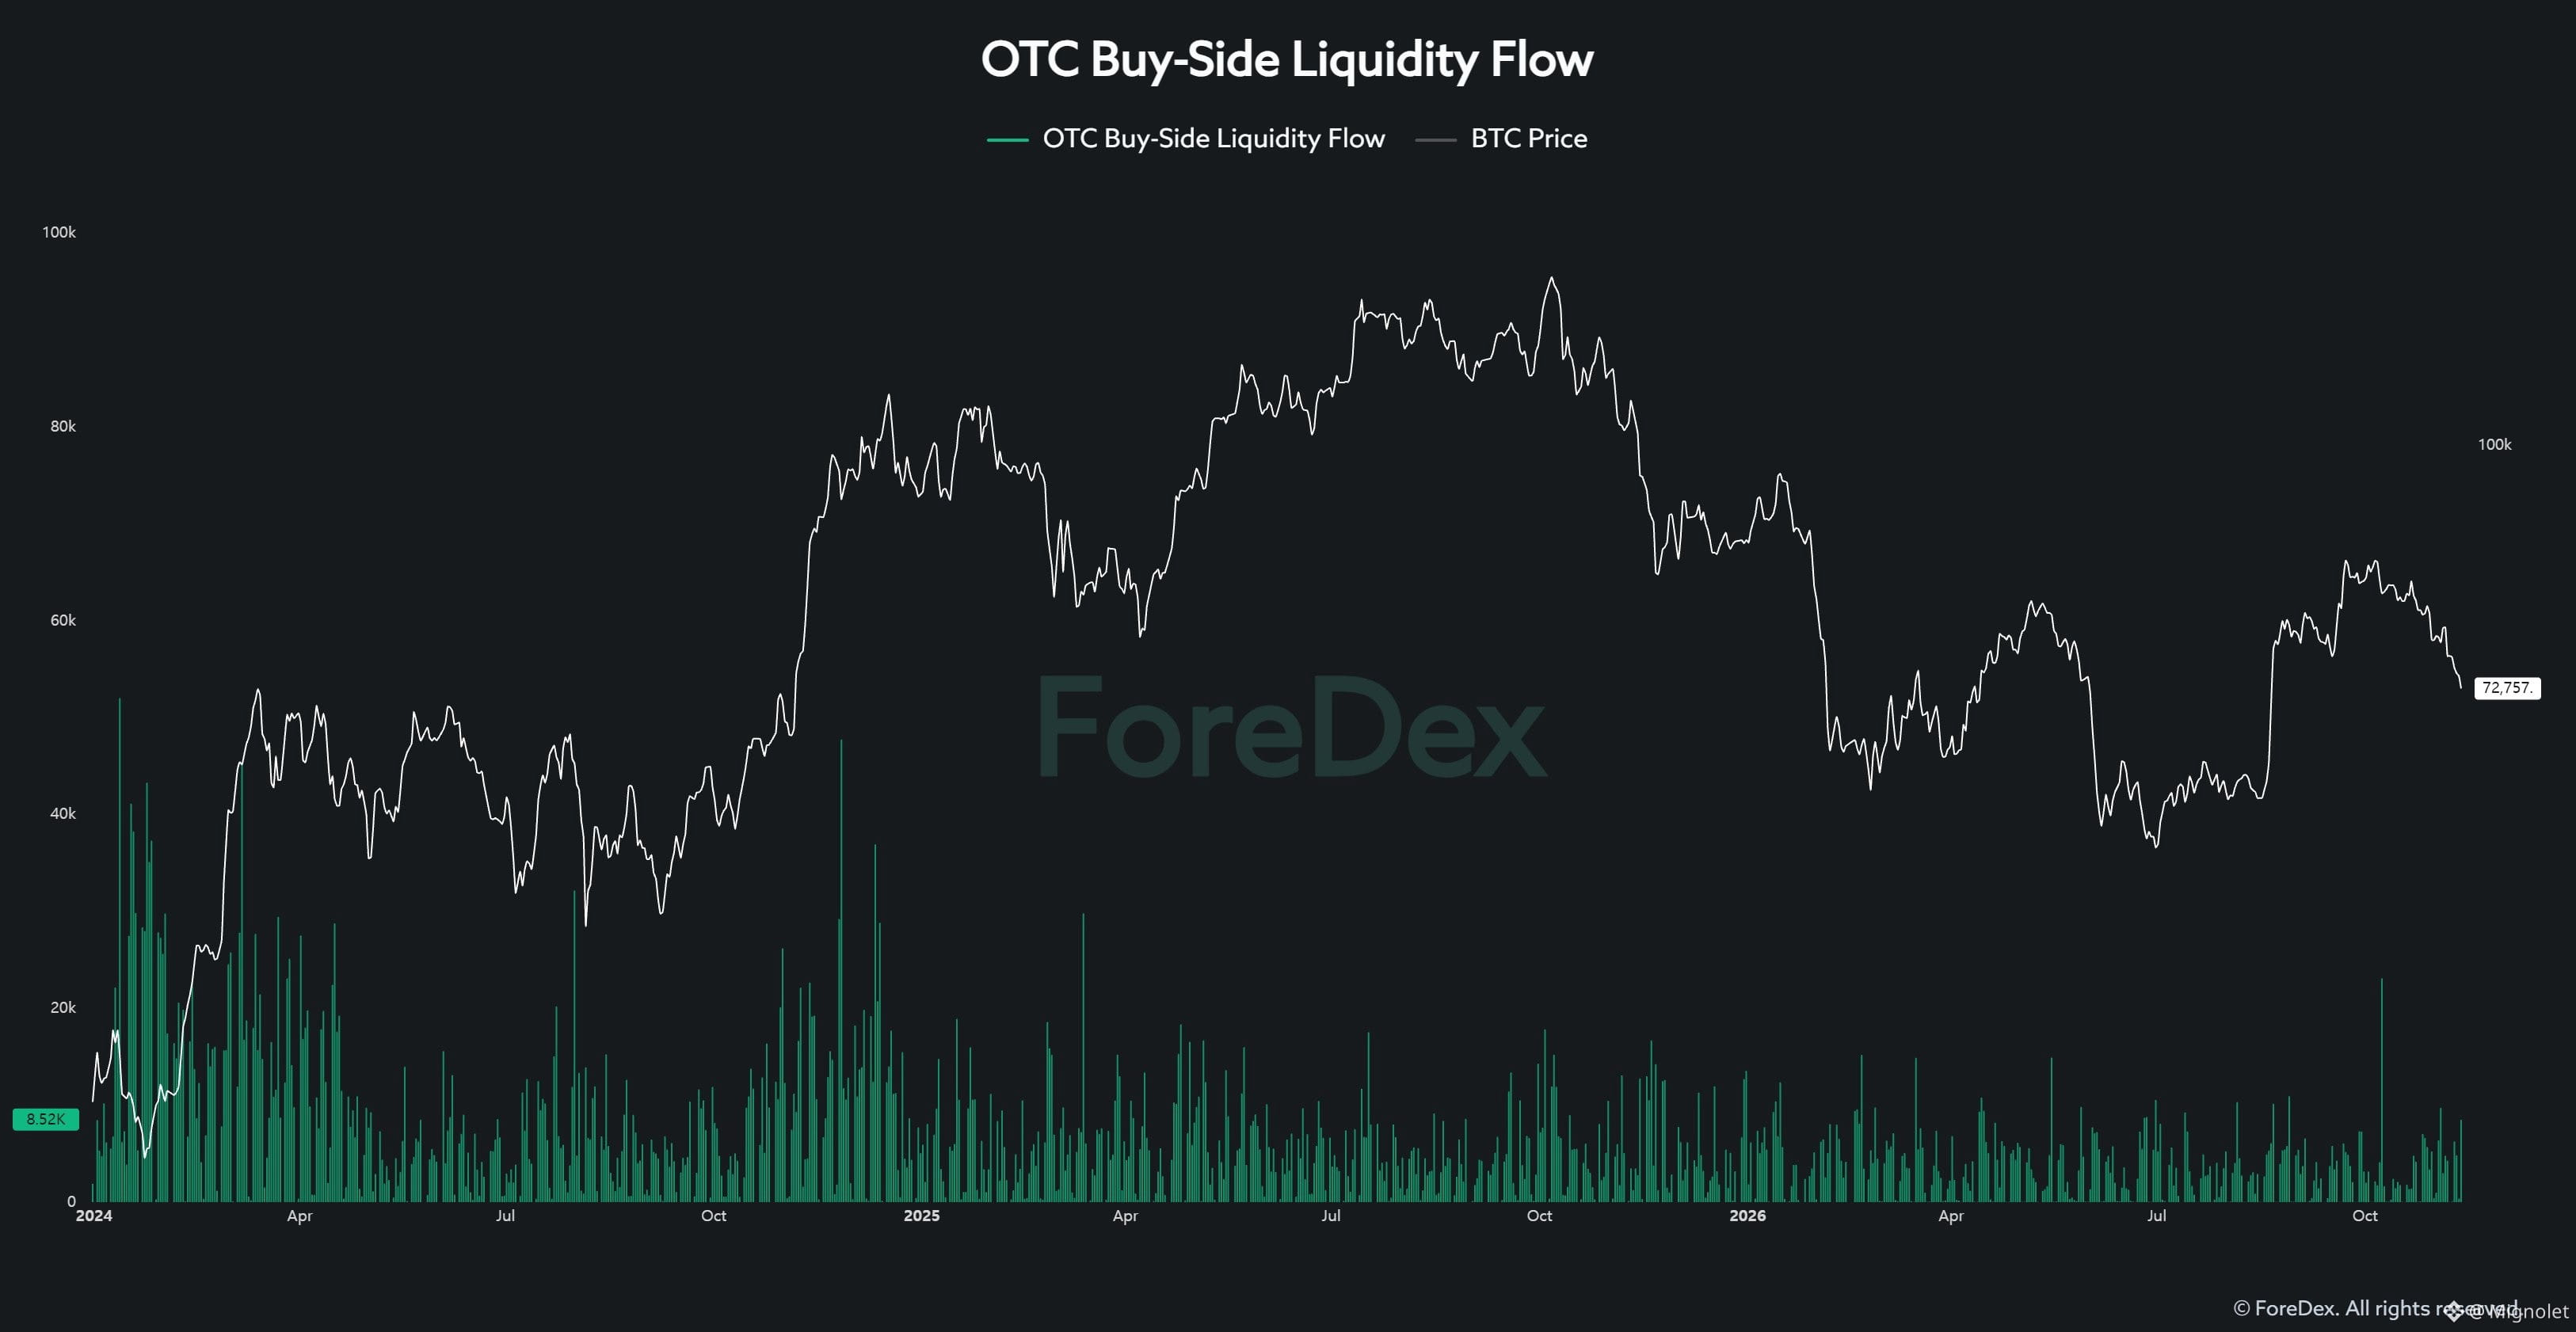
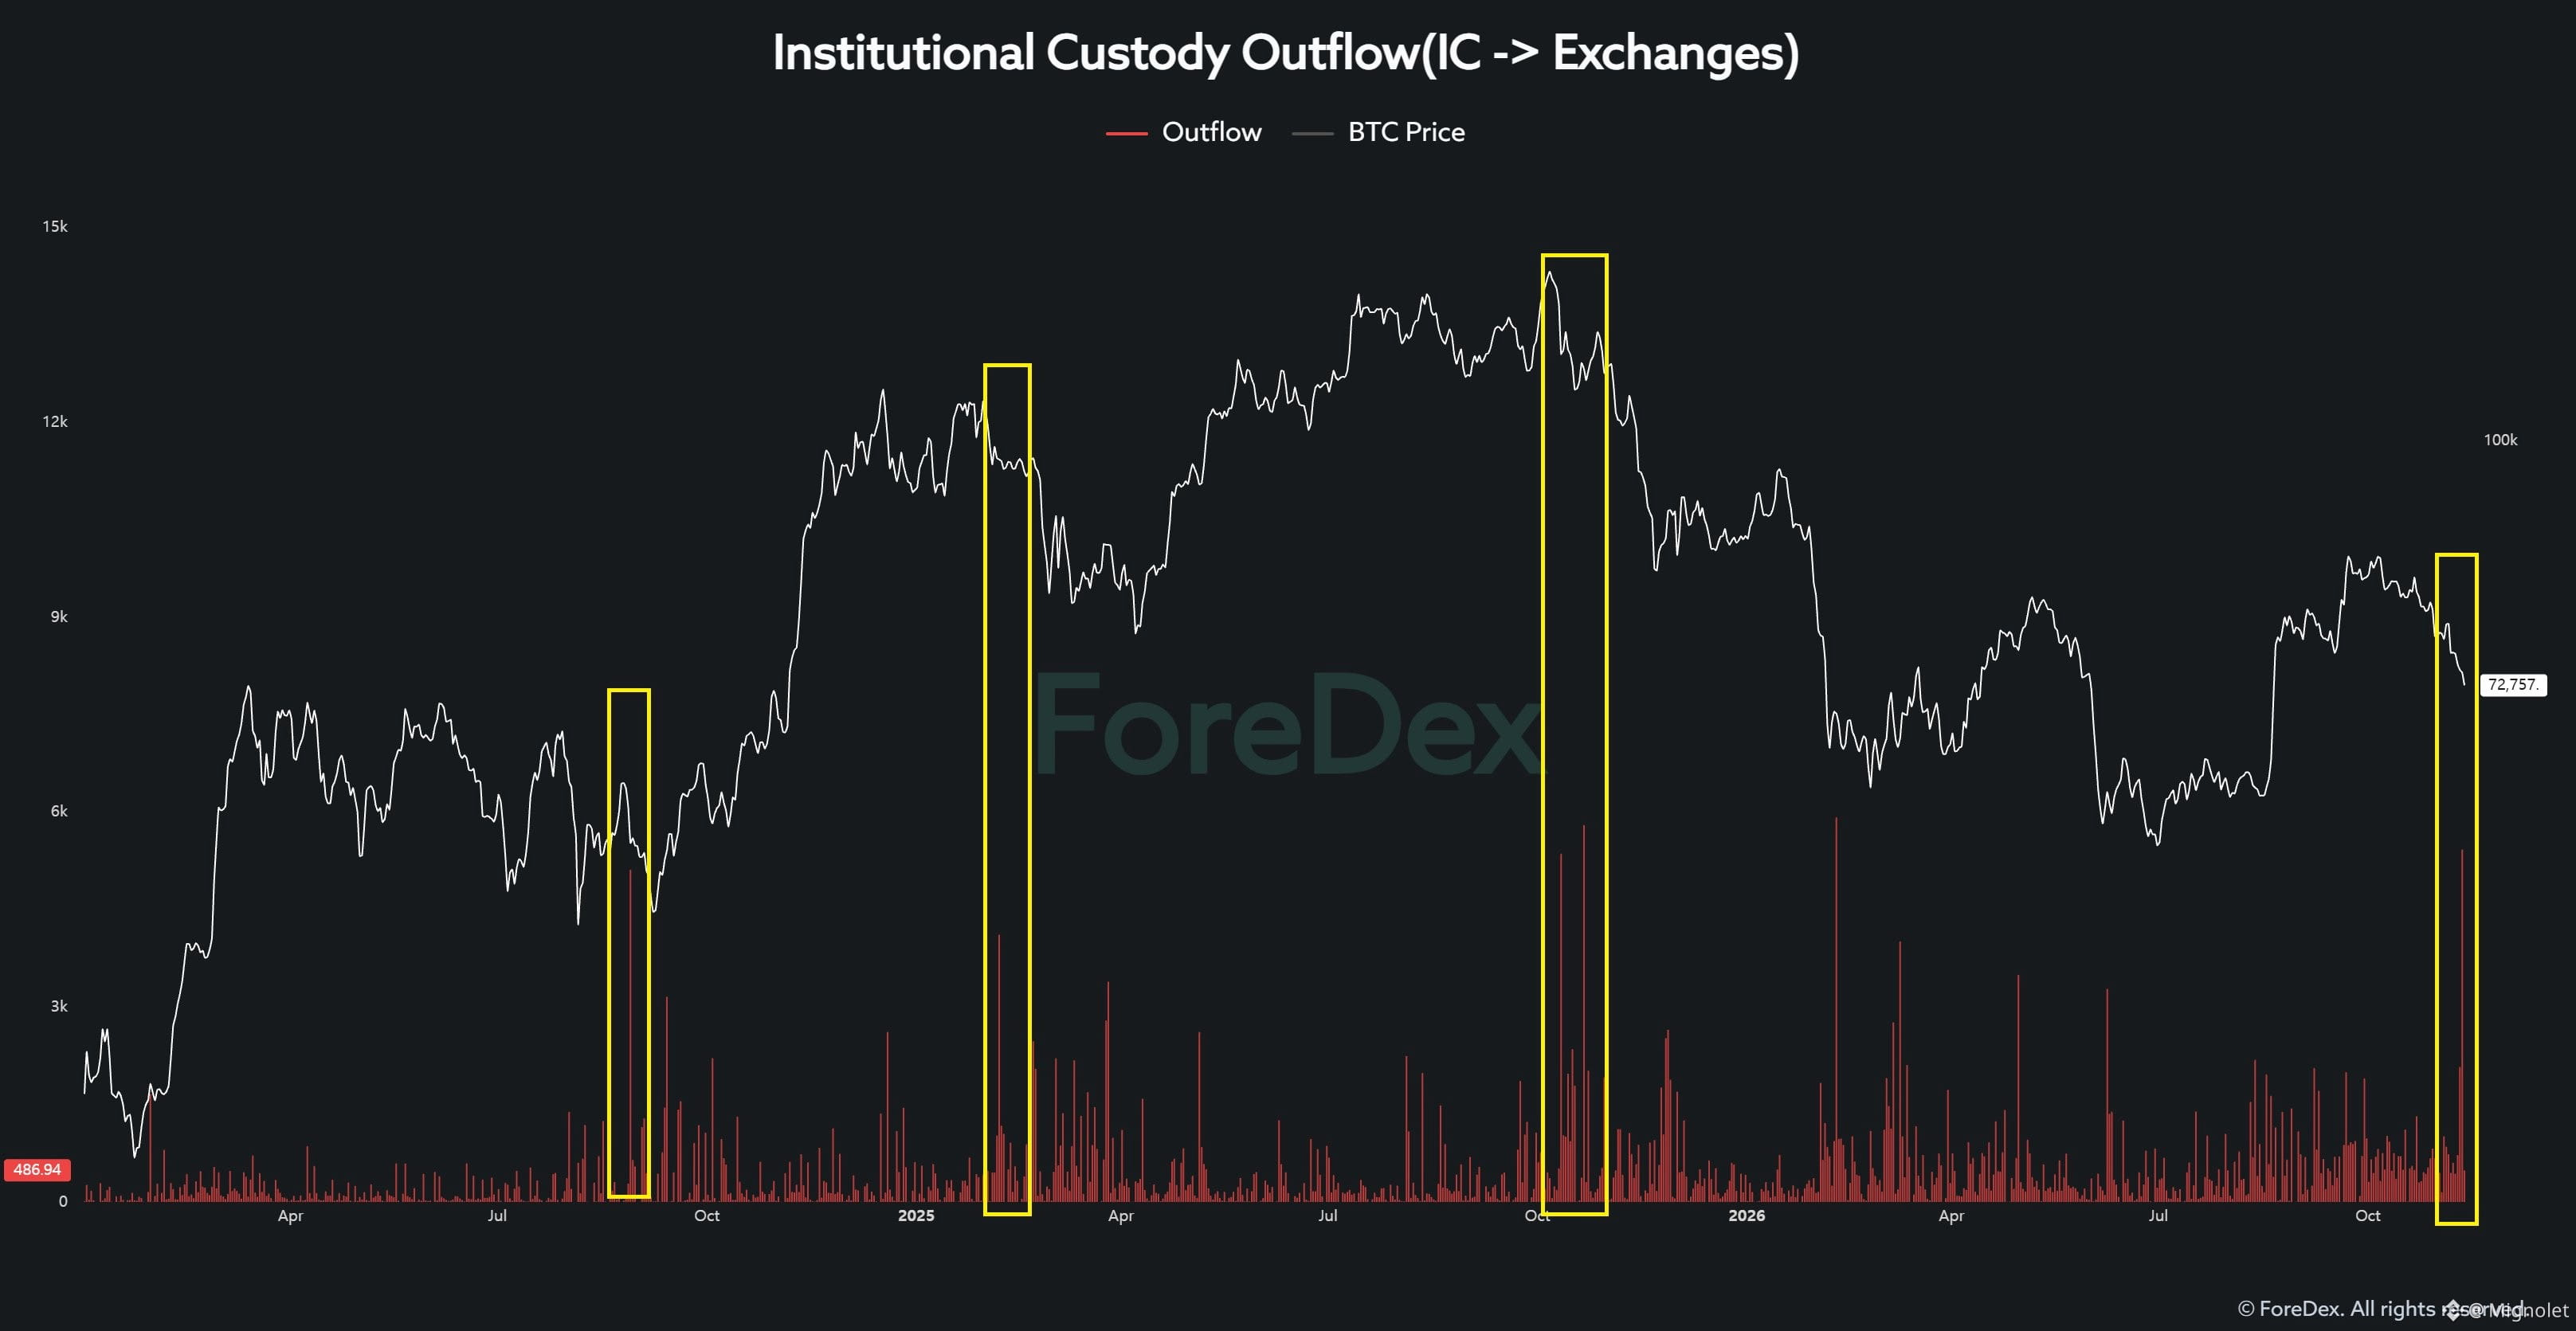
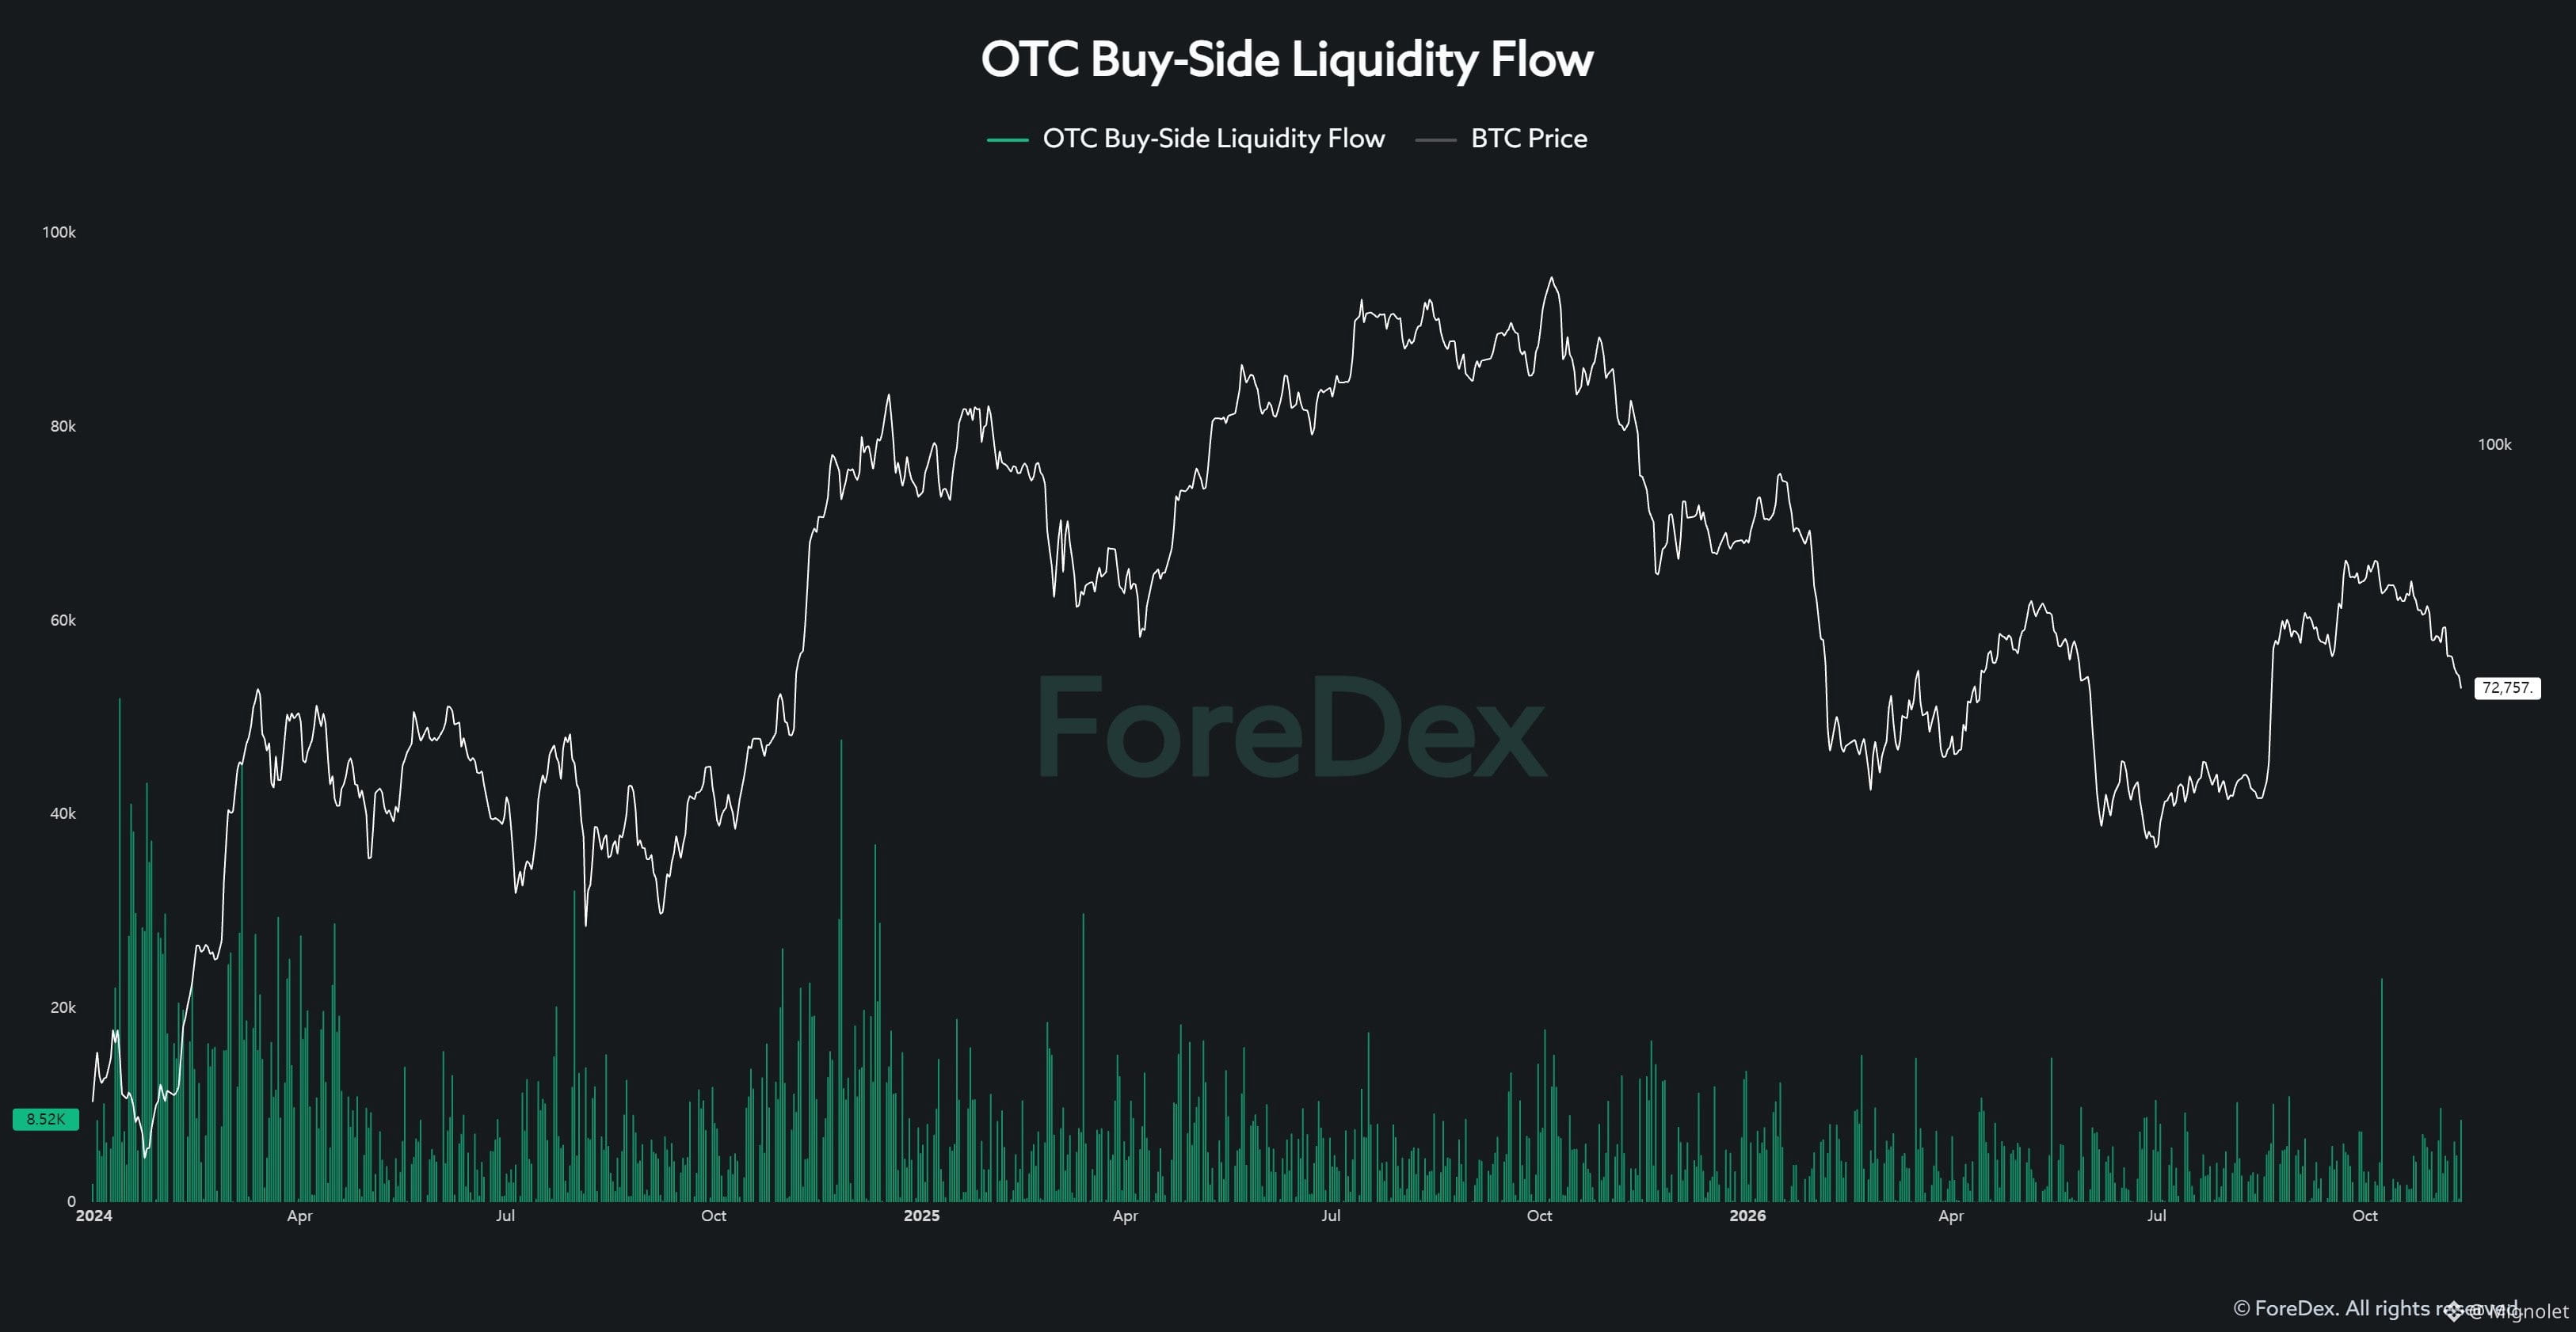
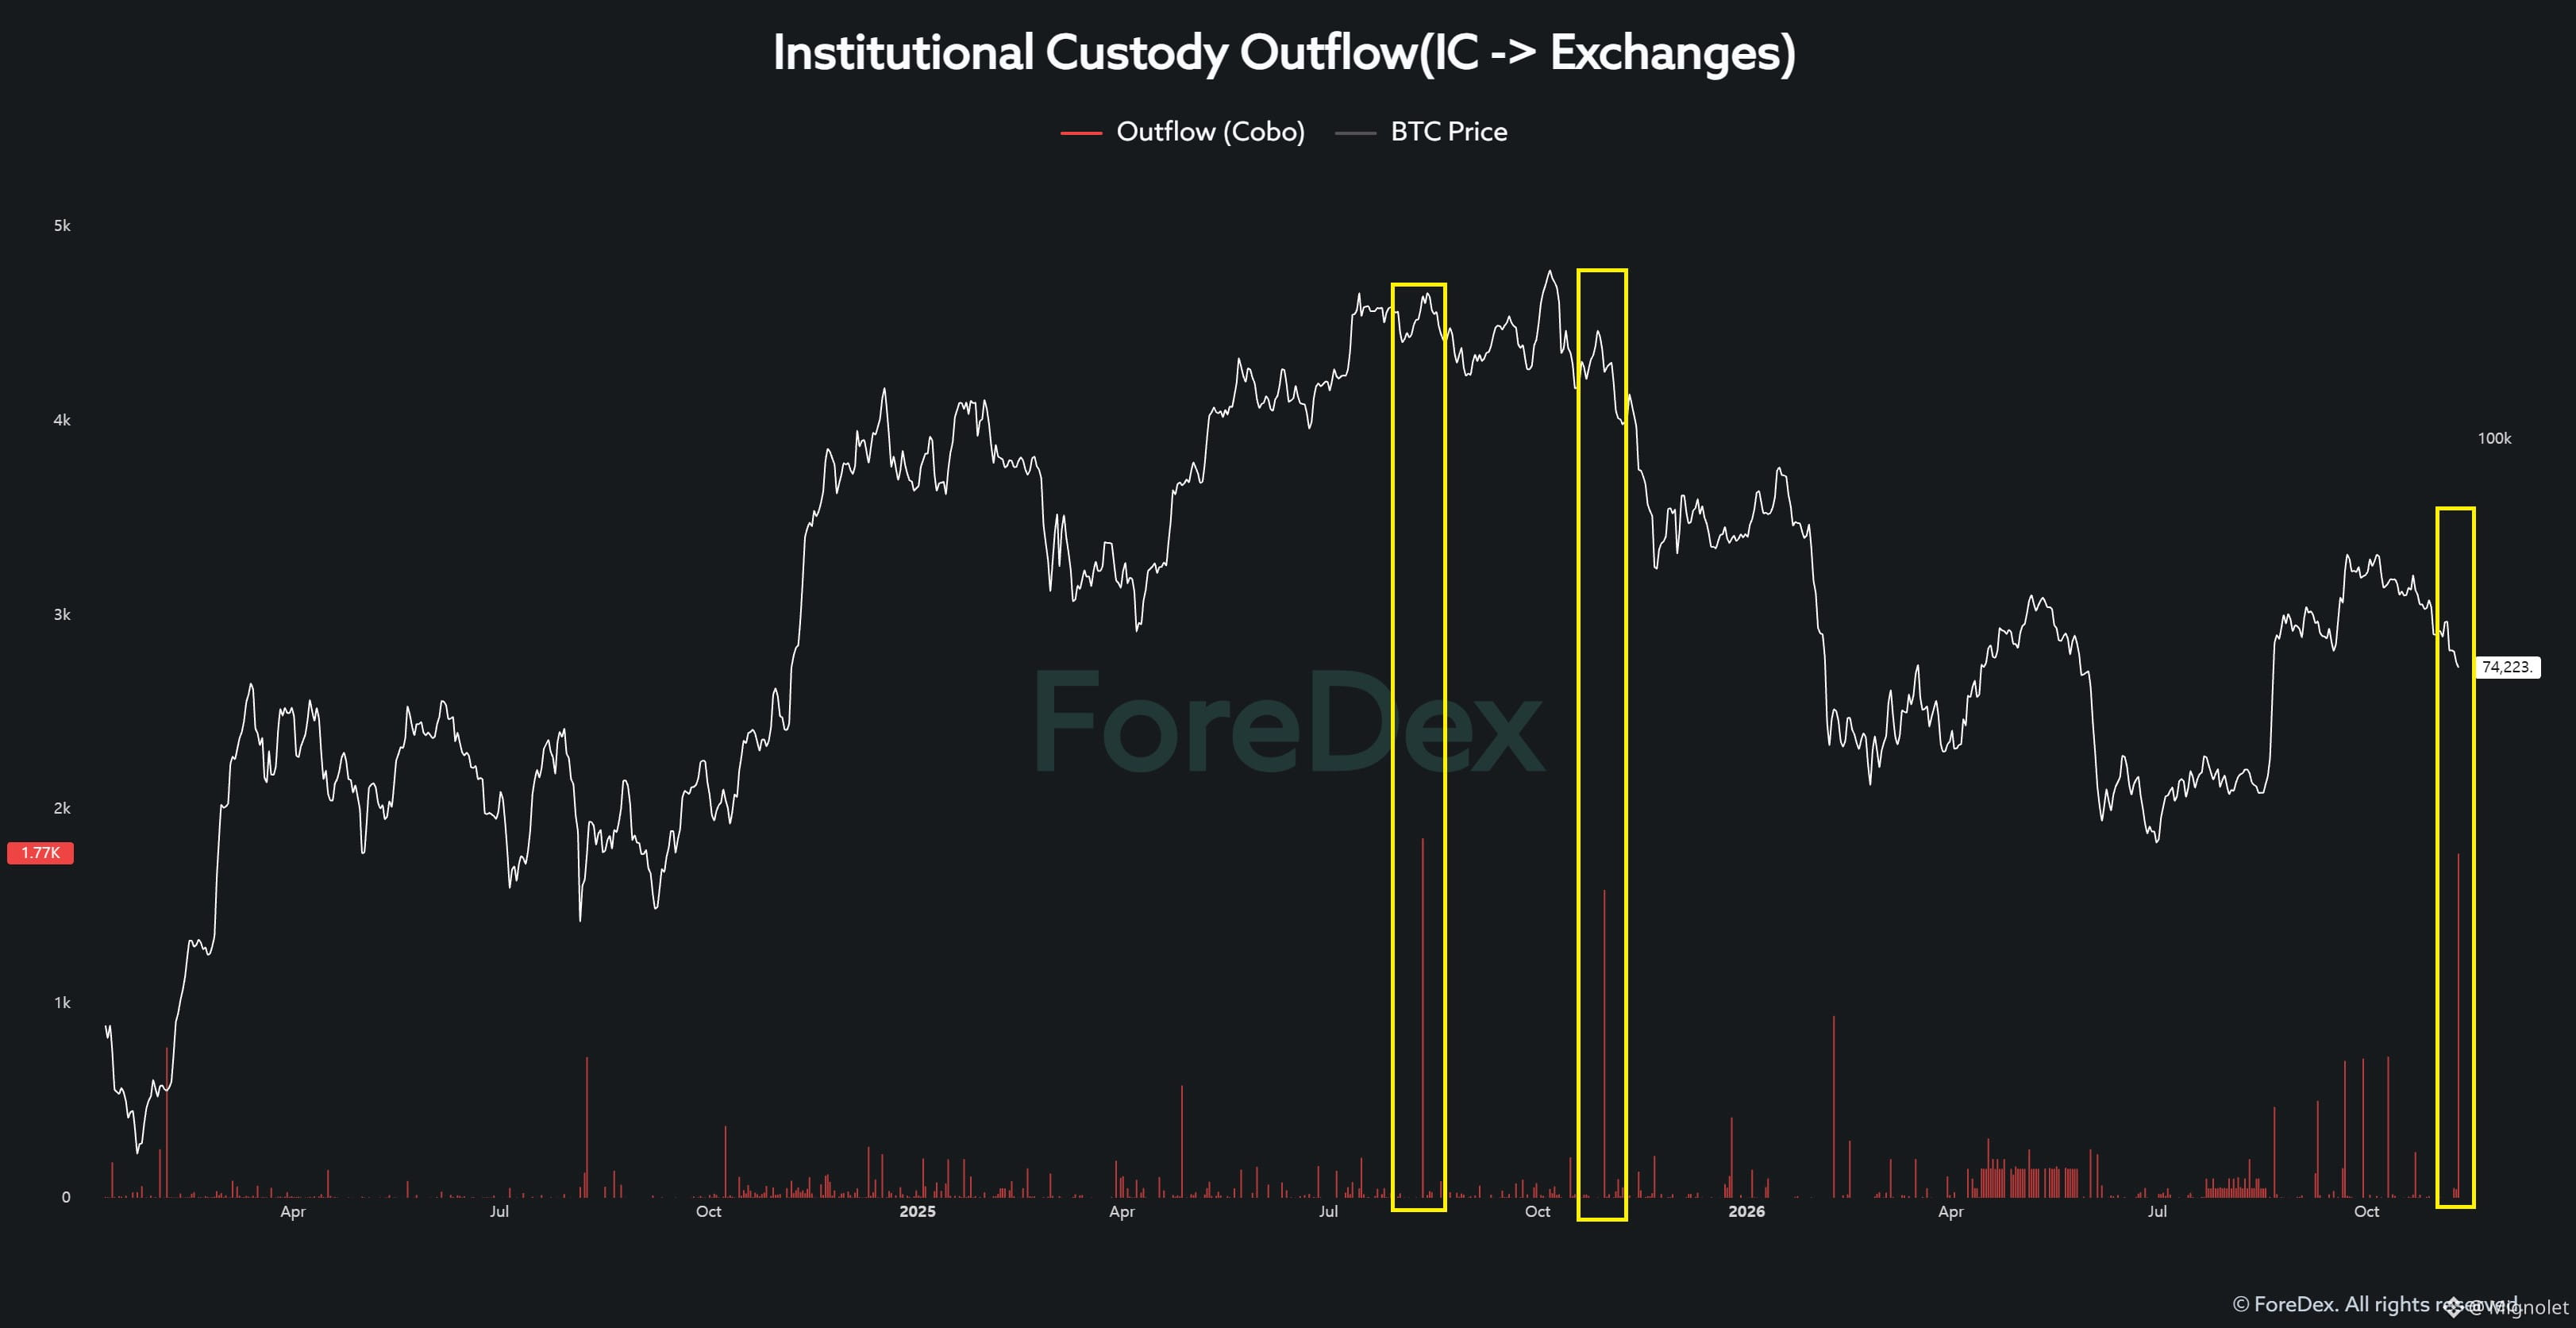
Buy-side liquidity remains severely constrained, while institutional selling flows continue moving onto exchanges.
The sustained buying pressure needed for a genuine recovery simply isn't there.

Under these conditions, I see no reason to rush.

Think about it.

When Bitcoin was above $80,000, many people confidently said:

"If the price crashes, I'll just buy more. What's there to worry about?"
But when the market actually crashes, those same people often struggle to buy.

That's what makes investing difficult. It's not just about predicting prices, but sticking to your principles when the situation actually unfolds.

Now imagine buying simply because Bitcoin has fallen sharply, without clear investment criteria.
What if the market doesn't recover and instead enters a prolonged period of sideways consolidation?

The profits you expected never materialize. Doubt and anxiety gradually take over.
Eventually, even small price fluctuations begin to shake your confidence.
A position entered without clear criteria can ultimately be undermined more by your own emotions than by the market itself.
That's exactly what I want to avoid.
Given the current liquidity conditions and lack of accumulation, I still see no convincing signs of improvement.
That's why I have no intention of taking any action right now.
Even if this turns out to be the bottom, it doesn't mean a new uptrend will begin immediately.
Finding a bottom and establishing a sustainable uptrend through sufficient accumulation are two entirely different things.

I'm not going to rush. This simply isn't the time.
Mignolet
·
--
Bitcoin’s Liquidity Crisis: Why the Market Still Needs More Time
Today, I want to take a step back and examine the Bitcoin market from a macroeconomic perspective.

It may be a relatively conventional approach, but given the severe liquidity constraints currently facing Bitcoin, I believe it's important to revisit the broader macro environment.

Let me start with my conclusion.

"The Bitcoin market has still not gone through sufficient accumulation, and liquidity conditions continue to deteriorate. At this point, we can only hope the market avoids a major shock. Even if it does, a much longer period of sideways consolidation may be necessary than many expect."

As I've repeatedly discussed in my previous analyses, Bitcoin's internal liquidity conditions are extremely concerning.

Buy-side liquidity continues to weaken, and the market is experiencing a significant liquidity squeeze.

Against this backdrop, I want to examine the relationship between the U.S. dollar and Bitcoin's market cycles.

This may be familiar territory for anyone who has spent some time studying financial markets.

Generally speaking, the U.S. dollar is closely tied to global liquidity conditions.

Looking back at Bitcoin's historical cycles, we have never seen Bitcoin sustain a full-fledged bull market while the dollar was in a strong upward trend.

The bearish cycle that began in 2025 has not been particularly different in this regard.

But that brings us to the most important question.

"Are we really at the point where the U.S. dollar is about to enter a sustained downtrend?"

To me, this is one of the most critical questions when assessing the current market.

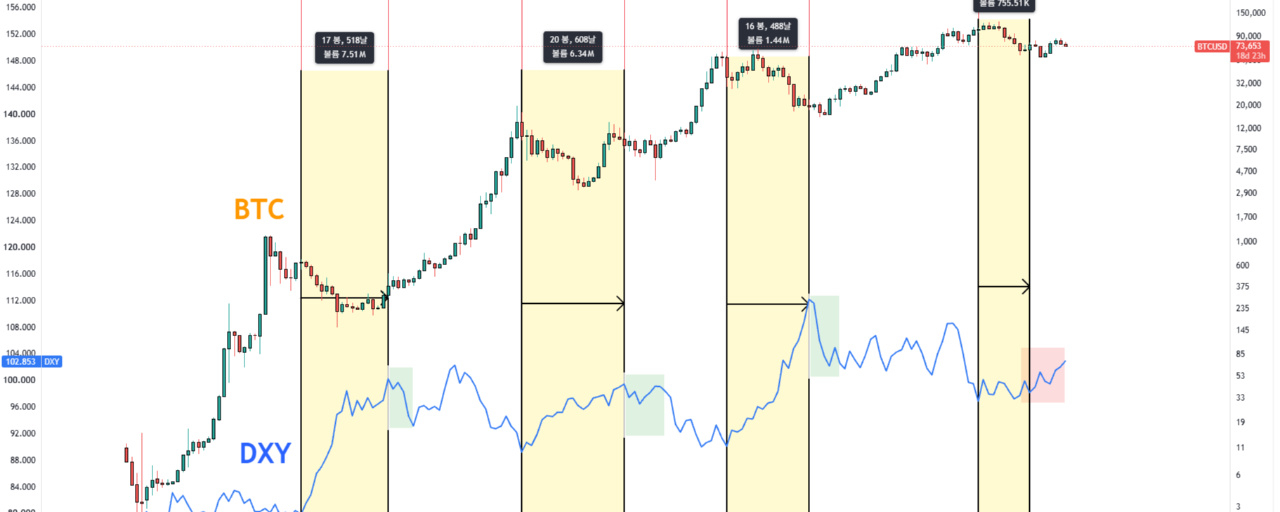
Let's look at the historical cycles objectively.

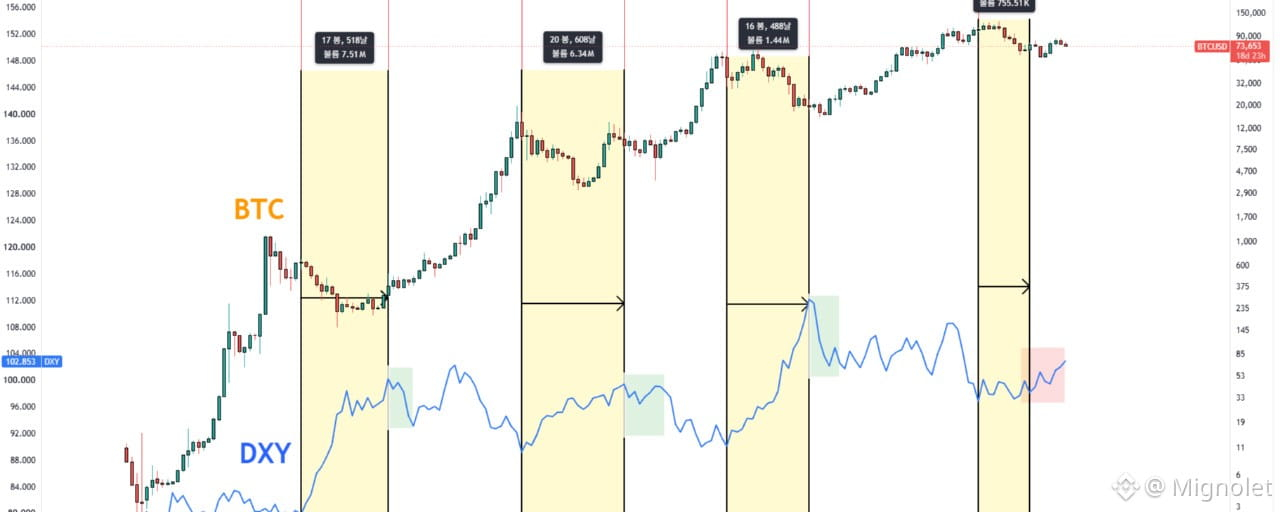
In previous cycles, Bitcoin went through a prolonged bear market before entering a major bullish phase as the U.S. dollar began a sustained decline.
(Image 1, green boxes)

But the current situation is fundamentally different.

Rather than entering a downtrend, the dollar is showing signs of establishing a strong upward trend.

(Image 1, red box)

This is the most important difference between previous bullish cycles and the market environment we face today.

Now, take a look at Image 2.

The U.S. dollar has broken above a trading range that had been forming for more than 500 days.

There is something I frequently emphasize in my market analysis:

"Once a trend is established, it rarely reverses easily."

This is because of trend persistence.

And this is not a trend that developed over a few weeks or months.

We are looking at a breakout from a consolidation range that lasted more than 500 days.

That makes this development particularly important.

Even if the dollar eventually reverses and begins declining again, the process could take considerably longer than many investors anticipate.

We also need to consider the broader macroeconomic environment.

Interest rate hikes began in the third quarter of this year, while the political and economic environment surrounding the U.S. midterm elections has hardly been favorable for the crypto market.

Meanwhile, selling pressure from Bitcoin mining companies is another major concern.

Bitcoin selling activity among mining companies reached historically elevated levels during the third and fourth quarters of this year.

At the same time, many mining companies have been shifting their business models toward AI data centers.

Under these circumstances, can we realistically expect substantial new liquidity to flow into Bitcoin?

At this point, I find it difficult to be confident that it will.

Ultimately, Bitcoin needs a new catalyst and a compelling narrative capable of attracting fresh capital.

Personally, I believe one of the strongest narratives Bitcoin could have is its role as "Digital Gold."

But there has been an interesting shift here as well.

One of the companies that most aggressively promoted Bitcoin as digital gold was Strategy.

Back in 2022, Strategy frequently emphasized Bitcoin's identity as "Digital Gold."

However, beginning in 2025, the company increasingly shifted its messaging toward concepts such as "Credit" and "Digital Capital," rather than emphasizing Bitcoin primarily as digital gold.

Think about what that means.

Even Strategy, one of the most influential companies capable of driving the digital gold narrative, is now emphasizing a different narrative.

And now, with today's confirmation of its exclusion from the MSCI index, uncertainty surrounding the market has increased even further.

So let me ask the question again.

"Is liquidity in the Bitcoin market actually recovering?"

Bitcoin has become far more deeply integrated into the traditional financial system than ever before.

Through spot ETFs and growing institutional participation, Bitcoin is increasingly held within the portfolios of traditional financial institutions.

As a result, its market behavior has become more closely connected to macroeconomic conditions and movements in traditional financial markets.

In other words, Bitcoin is now more exposed to the broader macro environment, not less.

Yet today, Bitcoin's internal liquidity remains weak, while external macroeconomic conditions are far from supportive.

Under these circumstances, I find it difficult to see how Bitcoin could simply defy the broader macro environment and independently enter a powerful bullish cycle.

For Bitcoin to begin a genuine, sustained bull market, new liquidity needs to enter the market.

That is the fundamental requirement.

And this brings me back to my current assessment.

Right now, the priority should be hoping that the market can get through this period without experiencing a major shock.

But even if we manage to avoid a significant disruption, unwinding excessive leverage and resolving the current liquidity imbalances could require a much longer period of consolidation and accumulation than many investors expect.

If investors are expecting Bitcoin to quickly return to a steep upward trajectory from here, I think they may be setting themselves up for considerable disappointment.

This is also why I intend to approach my next Bitcoin purchases with a much longer time horizon.

Rather than rushing back into the market, I want to carefully assess how liquidity conditions develop and whether the market has gone through a sufficient accumulation process.

I understand that my current outlook may sound pessimistic, or even discouraging.

But the purpose of market analysis is not to consistently deliver an optimistic outlook.

It is to objectively assess the environment we are operating in and develop an investment strategy that reflects those conditions.

I simply do not believe this is the right time to approach the Bitcoin market aggressively.

There is no need to rush.

For now, I believe patience is more important than chasing a potential rebound.

I would rather wait for liquidity to recover, allow the market enough time to accumulate, and position myself when a more favorable opportunity emerges.
Article
"Why Am I Focusing on More Granular Liquidity Data Instead of Traditional On-Chain Indicators?"Why Am I Focusing on More Granular Liquidity Data Instead of Traditional On-Chain Indicators? Those who have been following my analysis closely since last year will already know this. I still actively use on-chain data. However, I rarely rely on indicators that broadly aggregate activity across the entire Bitcoin network anymore. Instead, I break down market participants into more specific categories, quantify capital flows at the level of individual companies and institutions, and develop datasets that I can directly incorporate into my analysis. ForeDex continues to develop new datasets based on this same analytical philosophy. Some examples include: OTC DataMarket Maker DataInstitutional CustodyDeFi Lending Liquidity These datasets are designed to track specific market participants and activities directly involved in providing or utilizing liquidity. In particular, DeFi Lending Liquidity allows us to analyze not only capital inflows but also the accumulation of leverage-driven liquidity and signs of overheating in market sentiment. This dataset has been particularly helpful in navigating the current market, and I believe it could continue to play an important role in the future. So why do I insist on breaking down on-chain data into such granular categories? Because the Framework for Interpreting Traditional On-Chain Data Has Changed Since the Approval of Bitcoin ETFs. Since the approval of spot Bitcoin ETFs, the market's trading structure and the way capital moves have changed significantly. As a result, I believe traditional on-chain indicators now contain considerably more noise and structural distortion. The problem is that many analysts continue applying historical interpretation frameworks without sufficiently accounting for these structural changes. I am not suggesting that on-chain data has lost its value. Quite the opposite. I firmly believe on-chain data remains extremely valuable. However, when market structure changes, the framework we use to interpret the data must evolve as well. Let me walk through a few examples. 1. Active Addresses During previous Bitcoin bull cycles, increases in active addresses generally moved in the same direction as Bitcoin's price. However, that relationship has changed significantly during the current cycle. Bitcoin's price has risen, but active addresses have failed to show the same level of growth seen in previous cycles. Why is this happening? I believe one of the major reasons is the structural change in trading activity following the approval of spot Bitcoin ETFs. In the past, whales directly bought and transferred Bitcoin, generating on-chain transactions in the process. Today, however, many institutions and investors gain Bitcoin exposure through ETFs, while ETF-related institutions handle the underlying Bitcoin custody, settlement, and related operations. To illustrate this with an extreme example, trading activity that previously required 100 separate on-chain transactions might now be processed through a single transaction under a different market structure. Of course, this is simply a hypothetical example intended to explain the structural change. Now imagine this trading structure continuing for another three to five years. Think seriously about how much it could change not only active addresses but also many other on-chain indicators. 2. Segmented MVRV Ratio Now look at the Segmented MVRV Ratio, calculated specifically for ETF-related entities. Its behavior is completely different from what we've historically observed in traditional MVRV indicators. In particular, the ratio has struggled to rise significantly above the 1.0 level. One possible explanation is that ETF-related entities operate under different custody and trading structures compared to traditional Bitcoin investors. If ETFs continue to play a major role in the market, the MVRV of ETF-related entities may continue to behave within a different range from the historical MVRV of the broader Bitcoin market. Now consider this: If even MVRV, one of the most widely used on-chain indicators for years, is behaving differently from its historical patterns, can we really assume that other indicators remain unaffected? 3. Bitcoin Exchange Whale Inflow Next, let's examine exchange inflows specifically attributed to whale entities. In previous cycles, severe market conditions sometimes produced whale inflows exceeding 10,000 BTC in a single day. Large inflows of around 5,000 BTC were also frequently observed. Today, however, even when similarly large transfers appear, many turn out to be internal wallet movements. Does that mean whales have disappeared from the market? No. It means the way whales conduct transactions has changed. Compared to the past, whales increasingly utilize market makers and institutional trading infrastructure. They may also split large transfers into multiple smaller transactions. For example, instead of depositing 3,000 BTC in a single transaction, a whale might now deposit 300 BTC across ten separate transactions. Under these circumstances, traditional thresholds for identifying large whale deposits may fail to capture actual selling activity effectively. The whales haven't necessarily disappeared. Rather, the traditional methods used to track them may no longer adequately reflect how the market operates. 4. Addresses with Balance Finally, let's examine Bitcoin addresses categorized by their holdings. In the chart: Orange line: Addresses holding at least 1,000 BTCBlue line: Addresses holding at least 100 BTC During the bull and bear market cycles between 2020 and 2023, accumulation and distribution among addresses holding at least 1,000 BTC were closely associated with major market movements. However, the current cycle looks significantly different. The number of addresses holding at least 1,000 BTC has remained relatively flat or even declined, while the number of addresses holding at least 100 BTC has increased sharply. Why are we seeing such a divergence? I believe changes in institutional Bitcoin custody and trading practices following ETF approval may have played an important role. But here's the key point: An increase in addresses holding at least 100 BTC does not automatically prove that genuine accumulation is taking place. An increase in address count does not necessarily represent new investors entering the market or additional net buying. Address counts can also change because of the redistribution of existing holdings, changes in custody structures, or internal wallet reorganizations. So let me ask you something. If genuine large-scale accumulation is taking place, how should we interpret a situation where addresses holding at least 1,000 BTC remain stagnant while addresses holding at least 100 BTC surge? Simply pointing to the increase in 100 BTC addresses and declaring that accumulation is underway is not sufficient analysis. It may amount to selectively choosing data that supports a conclusion you've already decided on. Ultimately, What Matters Is Not Just the Data, but the Framework Used to Interpret It. The message I want to convey through these four examples is straightforward. The structure of the Bitcoin market has changed since ETF approval, and the framework for interpreting traditional, broadly aggregated on-chain indicators must change accordingly. Indicators that were useful in previous cycles may now contain significantly more noise and structural distortion. But how many people truly understand these changes well enough to establish new analytical standards? And beyond the four examples I've discussed, can we really assume that other on-chain indicators are free from similar structural distortions? During the 2025 bull market, did traditional on-chain indicators identify the market top as effectively as they had in previous cycles? I believe this is a question worth considering seriously. Again, I'm not saying traditional on-chain indicators have become completely useless. However, if we continue applying historical interpretation frameworks without properly understanding the structural distortions embedded in the data, the accuracy of our investment decisions may actually deteriorate. Until these distortions are better understood and more reliable interpretation frameworks emerge through subsequent market cycles, I don't intend to rely heavily on traditional, broadly aggregated on-chain indicators. This is precisely why, since last year, I've shifted my focus away from simply aggregating market-wide data and toward identifying and analyzing the specific participants that actually drive liquidity flows.

"Why Am I Focusing on More Granular Liquidity Data Instead of Traditional On-Chain Indicators?"

Why Am I Focusing on More Granular Liquidity Data Instead of Traditional On-Chain Indicators?
Those who have been following my analysis closely since last year will already know this.
I still actively use on-chain data. However, I rarely rely on indicators that broadly aggregate activity across the entire Bitcoin network anymore.
Instead, I break down market participants into more specific categories, quantify capital flows at the level of individual companies and institutions, and develop datasets that I can directly incorporate into my analysis.
ForeDex continues to develop new datasets based on this same analytical philosophy.
Some examples include:
OTC DataMarket Maker DataInstitutional CustodyDeFi Lending Liquidity
These datasets are designed to track specific market participants and activities directly involved in providing or utilizing liquidity.
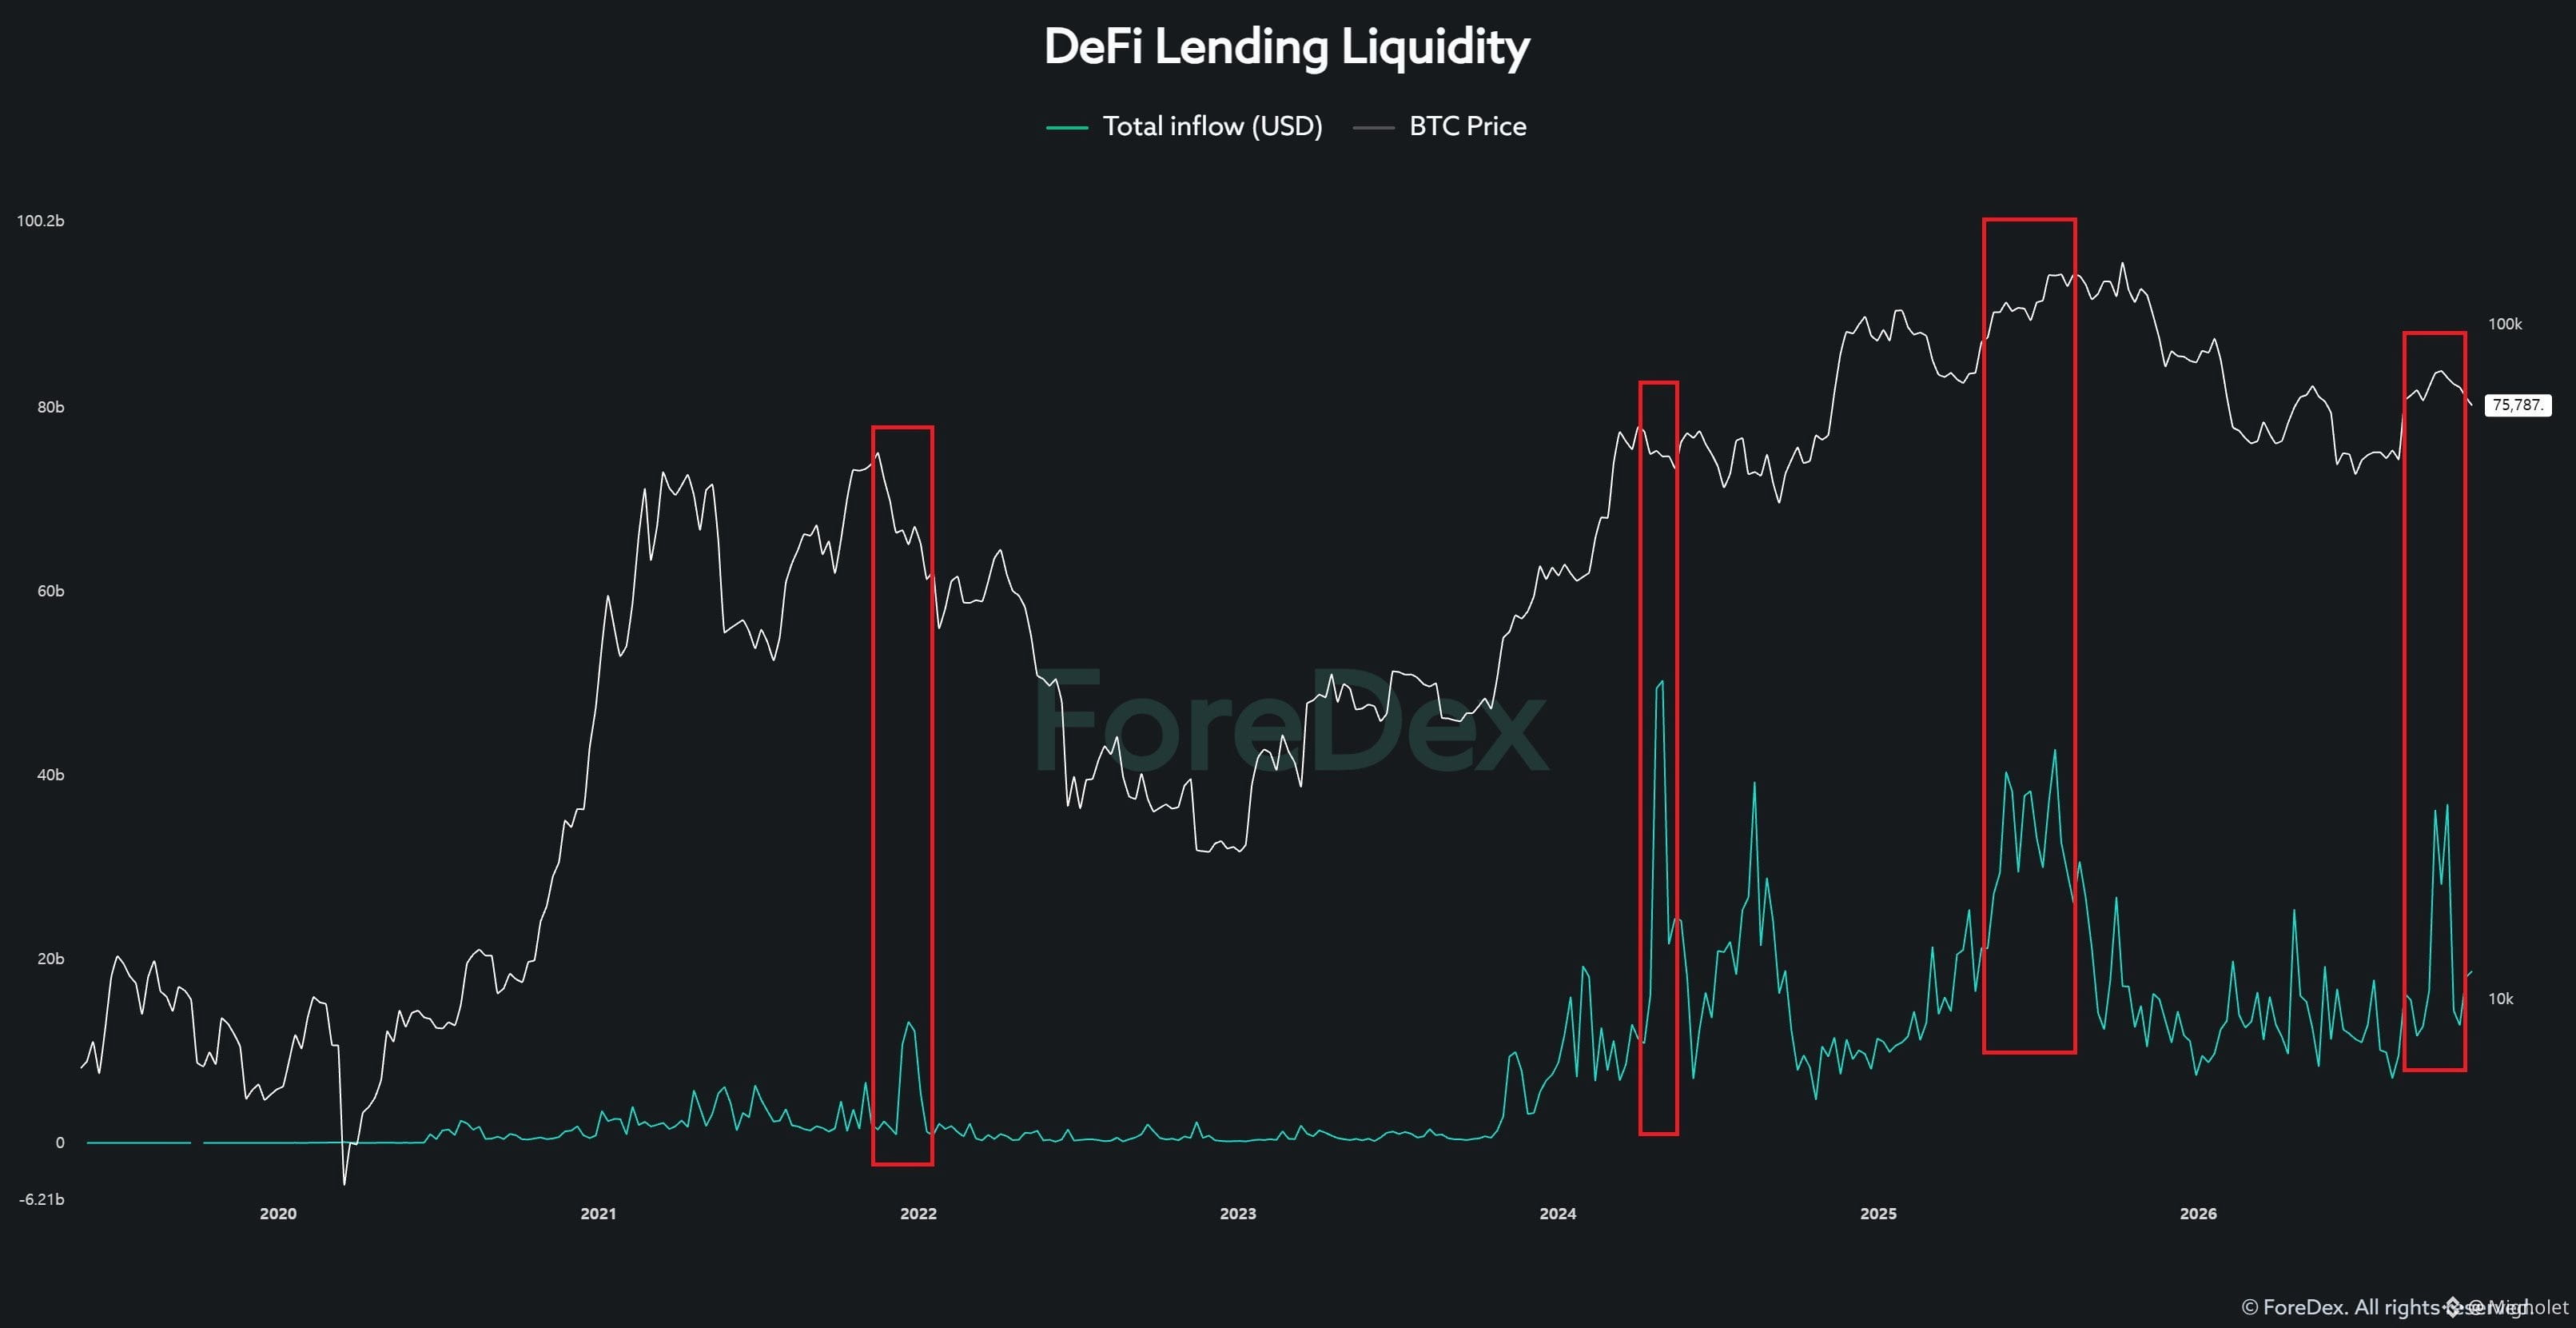
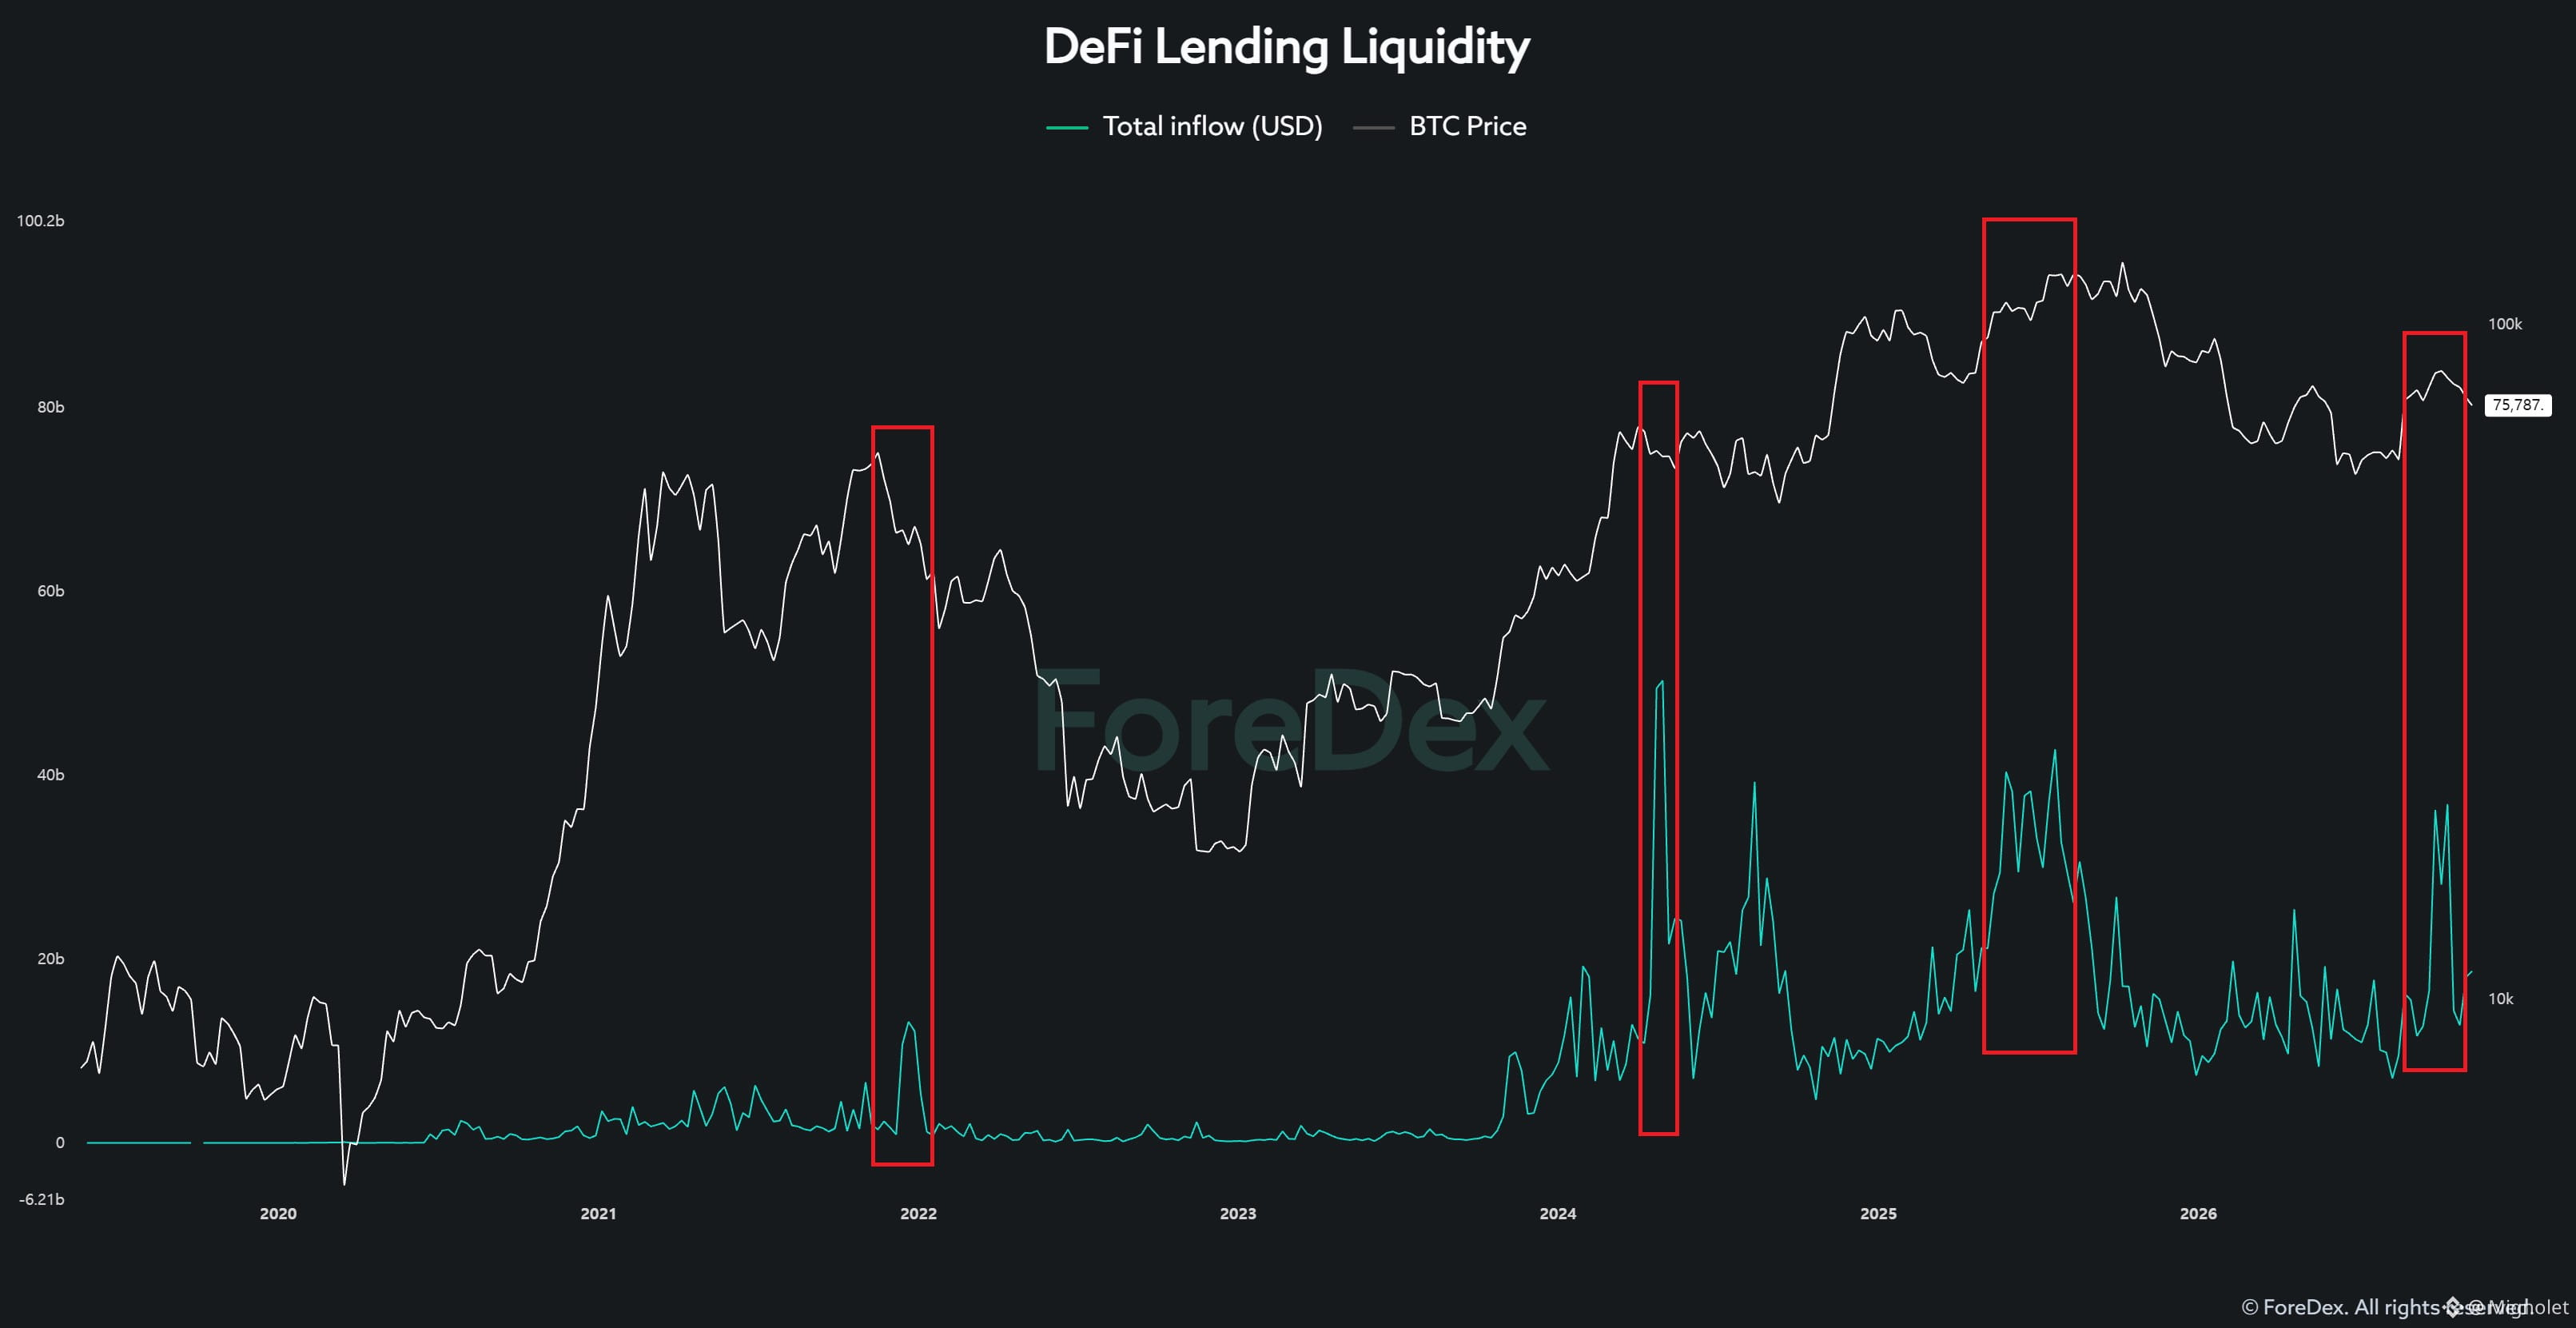
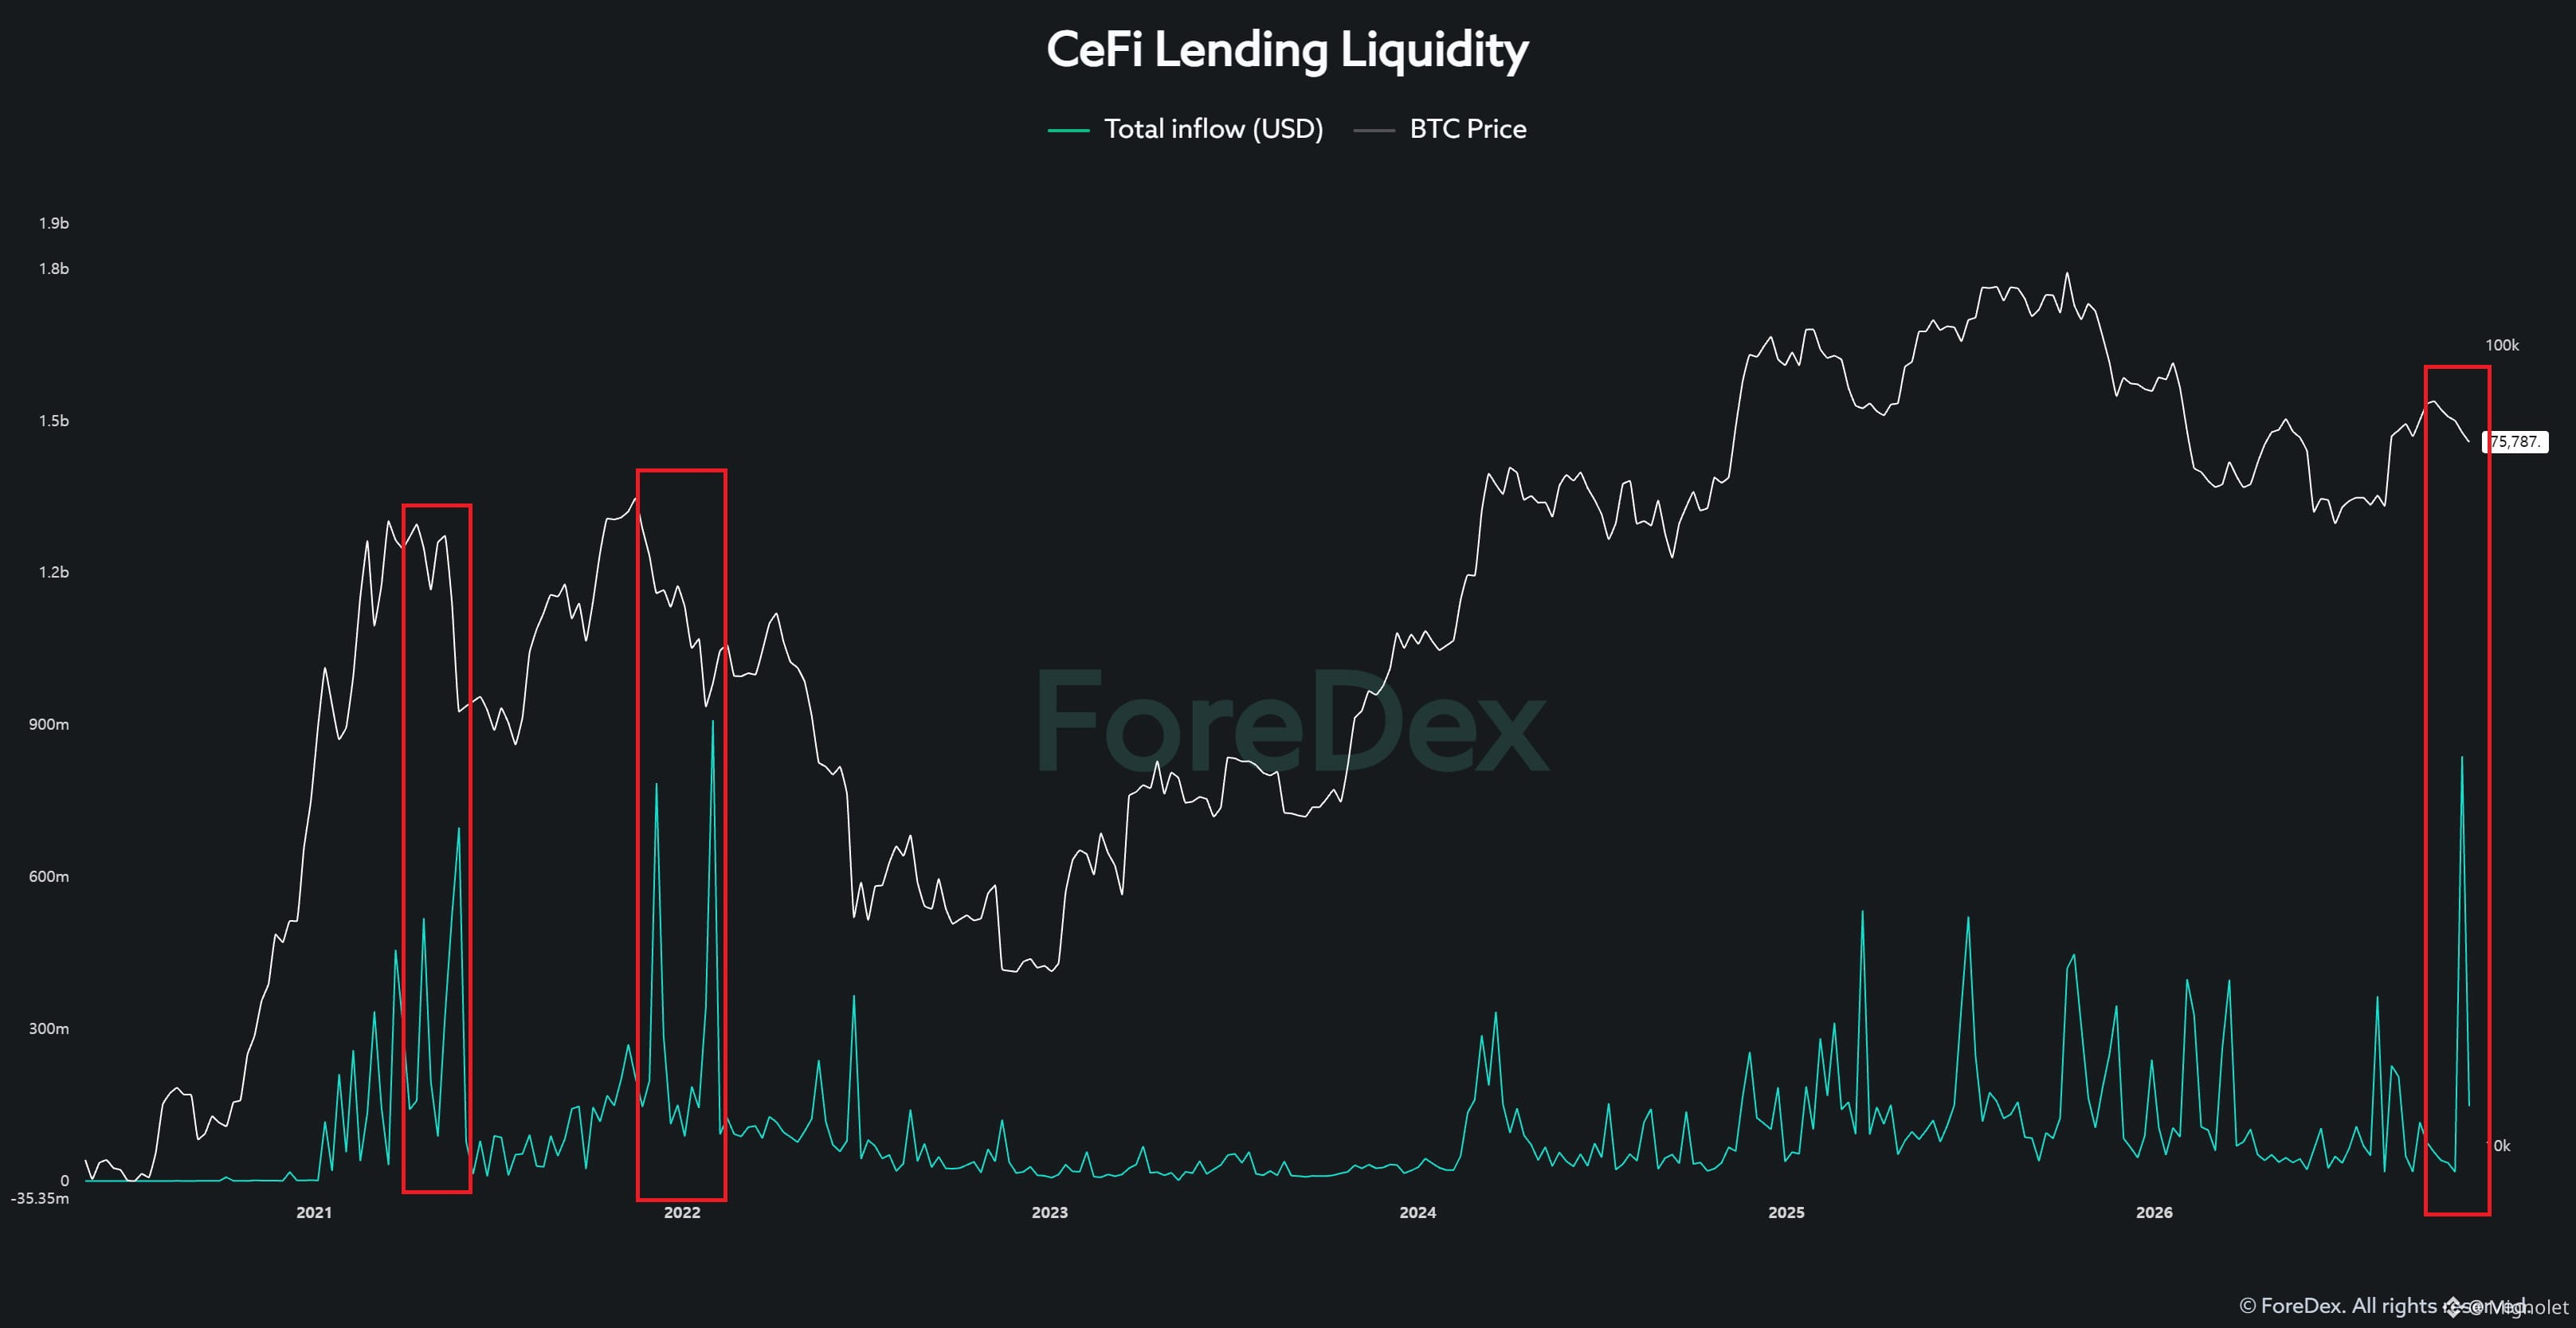
In particular, DeFi Lending Liquidity allows us to analyze not only capital inflows but also the accumulation of leverage-driven liquidity and signs of overheating in market sentiment.
This dataset has been particularly helpful in navigating the current market, and I believe it could continue to play an important role in the future.
So why do I insist on breaking down on-chain data into such granular categories?
Because the Framework for Interpreting Traditional On-Chain Data Has Changed Since the Approval of Bitcoin ETFs.
Since the approval of spot Bitcoin ETFs, the market's trading structure and the way capital moves have changed significantly.
As a result, I believe traditional on-chain indicators now contain considerably more noise and structural distortion.
The problem is that many analysts continue applying historical interpretation frameworks without sufficiently accounting for these structural changes.
I am not suggesting that on-chain data has lost its value.
Quite the opposite. I firmly believe on-chain data remains extremely valuable.
However, when market structure changes, the framework we use to interpret the data must evolve as well.
Let me walk through a few examples.
1. Active Addresses
During previous Bitcoin bull cycles, increases in active addresses generally moved in the same direction as Bitcoin's price.
However, that relationship has changed significantly during the current cycle.
Bitcoin's price has risen, but active addresses have failed to show the same level of growth seen in previous cycles.
Why is this happening?
I believe one of the major reasons is the structural change in trading activity following the approval of spot Bitcoin ETFs.
In the past, whales directly bought and transferred Bitcoin, generating on-chain transactions in the process.
Today, however, many institutions and investors gain Bitcoin exposure through ETFs, while ETF-related institutions handle the underlying Bitcoin custody, settlement, and related operations.
To illustrate this with an extreme example, trading activity that previously required 100 separate on-chain transactions might now be processed through a single transaction under a different market structure.
Of course, this is simply a hypothetical example intended to explain the structural change.
Now imagine this trading structure continuing for another three to five years.
Think seriously about how much it could change not only active addresses but also many other on-chain indicators.
2. Segmented MVRV Ratio
Now look at the Segmented MVRV Ratio, calculated specifically for ETF-related entities.
Its behavior is completely different from what we've historically observed in traditional MVRV indicators.
In particular, the ratio has struggled to rise significantly above the 1.0 level.
One possible explanation is that ETF-related entities operate under different custody and trading structures compared to traditional Bitcoin investors.
If ETFs continue to play a major role in the market, the MVRV of ETF-related entities may continue to behave within a different range from the historical MVRV of the broader Bitcoin market.
Now consider this:
If even MVRV, one of the most widely used on-chain indicators for years, is behaving differently from its historical patterns, can we really assume that other indicators remain unaffected?
3. Bitcoin Exchange Whale Inflow
Next, let's examine exchange inflows specifically attributed to whale entities.
In previous cycles, severe market conditions sometimes produced whale inflows exceeding 10,000 BTC in a single day.
Large inflows of around 5,000 BTC were also frequently observed.
Today, however, even when similarly large transfers appear, many turn out to be internal wallet movements.
Does that mean whales have disappeared from the market?
No. It means the way whales conduct transactions has changed.
Compared to the past, whales increasingly utilize market makers and institutional trading infrastructure. They may also split large transfers into multiple smaller transactions.
For example, instead of depositing 3,000 BTC in a single transaction, a whale might now deposit 300 BTC across ten separate transactions.
Under these circumstances, traditional thresholds for identifying large whale deposits may fail to capture actual selling activity effectively.
The whales haven't necessarily disappeared. Rather, the traditional methods used to track them may no longer adequately reflect how the market operates.
4. Addresses with Balance
Finally, let's examine Bitcoin addresses categorized by their holdings.
In the chart:
Orange line: Addresses holding at least 1,000 BTCBlue line: Addresses holding at least 100 BTC
During the bull and bear market cycles between 2020 and 2023, accumulation and distribution among addresses holding at least 1,000 BTC were closely associated with major market movements.
However, the current cycle looks significantly different.
The number of addresses holding at least 1,000 BTC has remained relatively flat or even declined, while the number of addresses holding at least 100 BTC has increased sharply.
Why are we seeing such a divergence?
I believe changes in institutional Bitcoin custody and trading practices following ETF approval may have played an important role.
But here's the key point:
An increase in addresses holding at least 100 BTC does not automatically prove that genuine accumulation is taking place.
An increase in address count does not necessarily represent new investors entering the market or additional net buying.
Address counts can also change because of the redistribution of existing holdings, changes in custody structures, or internal wallet reorganizations.
So let me ask you something.
If genuine large-scale accumulation is taking place, how should we interpret a situation where addresses holding at least 1,000 BTC remain stagnant while addresses holding at least 100 BTC surge?
Simply pointing to the increase in 100 BTC addresses and declaring that accumulation is underway is not sufficient analysis.
It may amount to selectively choosing data that supports a conclusion you've already decided on.
Ultimately, What Matters Is Not Just the Data, but the Framework Used to Interpret It.
The message I want to convey through these four examples is straightforward.
The structure of the Bitcoin market has changed since ETF approval, and the framework for interpreting traditional, broadly aggregated on-chain indicators must change accordingly.
Indicators that were useful in previous cycles may now contain significantly more noise and structural distortion.
But how many people truly understand these changes well enough to establish new analytical standards?
And beyond the four examples I've discussed, can we really assume that other on-chain indicators are free from similar structural distortions?
During the 2025 bull market, did traditional on-chain indicators identify the market top as effectively as they had in previous cycles?
I believe this is a question worth considering seriously.
Again, I'm not saying traditional on-chain indicators have become completely useless.
However, if we continue applying historical interpretation frameworks without properly understanding the structural distortions embedded in the data, the accuracy of our investment decisions may actually deteriorate.
Until these distortions are better understood and more reliable interpretation frameworks emerge through subsequent market cycles, I don't intend to rely heavily on traditional, broadly aggregated on-chain indicators.
This is precisely why, since last year, I've shifted my focus away from simply aggregating market-wide data and toward identifying and analyzing the specific participants that actually drive liquidity flows.
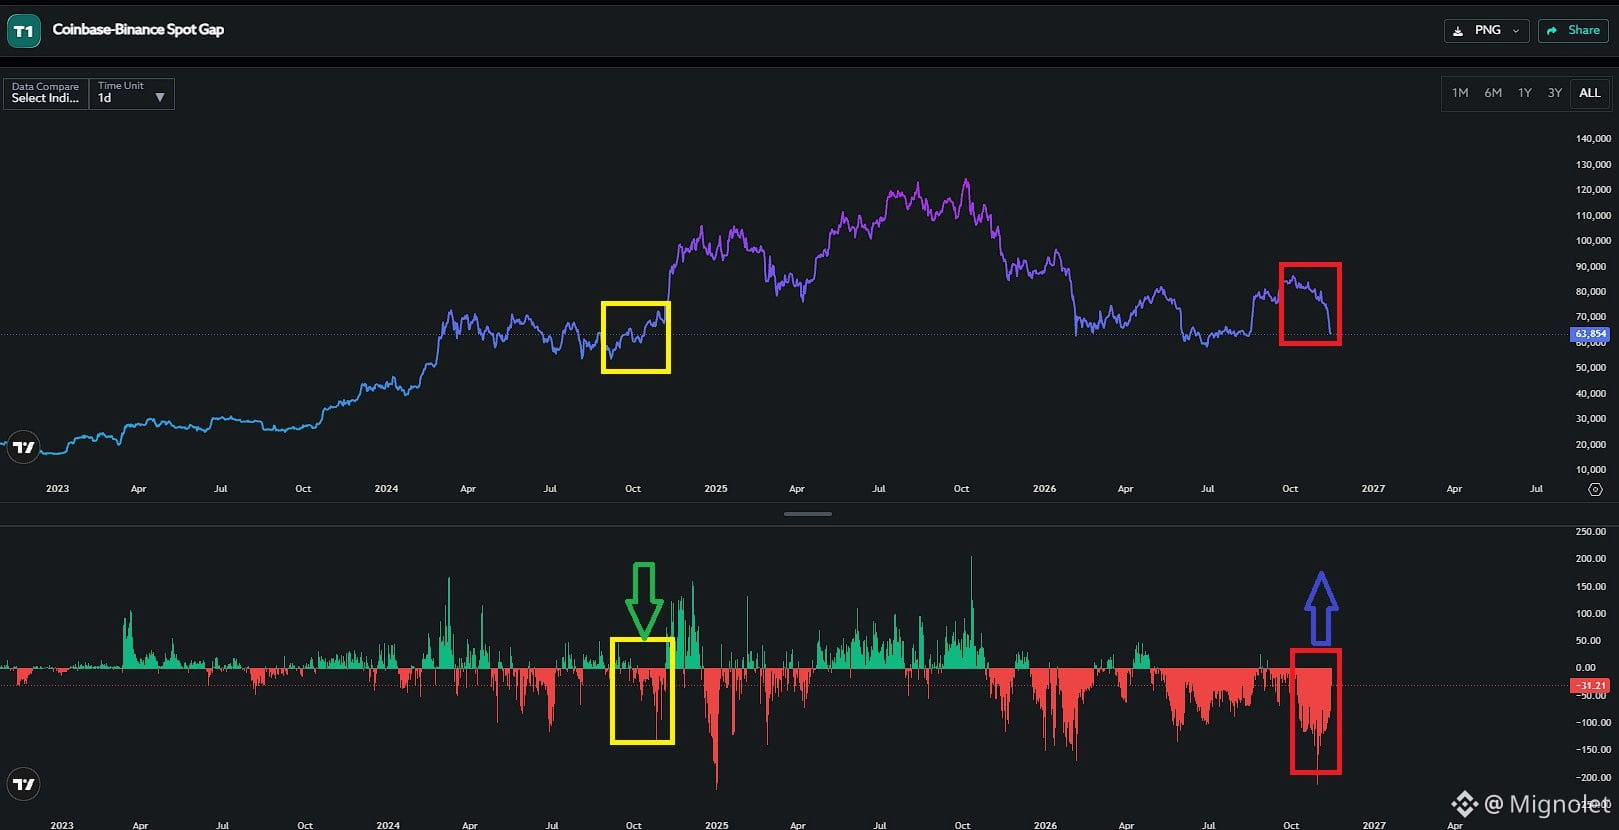
Please don't interpret the Coinbase Premium Gap as simply bullish when positive and bearish when negative. This indicator requires much more detailed analysis. I've been emphasizing this for the past five years. Right now, Bitcoin's price is falling while the Coinbase Premium is recovering. I consider this an extremely bearish signal, one that makes the current market situation even more concerning. Why? When Bitcoin falls while the Coinbase Premium rises, it means Bitcoin's price on Binance is declining more sharply than on Coinbase. In other words, significant selling pressure is coming from Binance, and I believe Binance whales are driving it. Now, look at the yellow box from October 2024. Back then, the Coinbase Premium was declining. Many people argued that Bitcoin had further downside ahead simply because the premium was falling. But my interpretation was completely different. Bitcoin had already undergone sufficient accumulation, and aggressive buying by Binance whales was pushing the Coinbase Premium lower. A declining premium wasn't necessarily bearish. It reflected stronger buying pressure on Binance. I've always believed that Binance's spot and futures markets play a more important role in determining Bitcoin's direction than Coinbase. Now compare that with today. The situation is almost the exact opposite of October 2024. Back then, strong Binance buying pushed the premium lower. Today, strong Binance selling is pushing the premium higher, even as Bitcoin continues to decline. This is why the same Coinbase Premium indicator can have completely different meanings depending on market structure and the participants driving trading activity. A rising Coinbase Premium does not automatically mean bullish conditions. In the current environment, I see nothing positive about Bitcoin falling while the premium rises. Instead, I'm deeply concerned that it reflects continued selling pressure from Binance whales.
Please don't interpret the Coinbase Premium Gap as simply bullish when positive and bearish when negative.

This indicator requires much more detailed analysis. I've been emphasizing this for the past five years.

Right now, Bitcoin's price is falling while the Coinbase Premium is recovering.

I consider this an extremely bearish signal, one that makes the current market situation even more concerning.

Why?

When Bitcoin falls while the Coinbase Premium rises, it means Bitcoin's price on Binance is declining more sharply than on Coinbase.

In other words, significant selling pressure is coming from Binance, and I believe Binance whales are driving it.

Now, look at the yellow box from October 2024.

Back then, the Coinbase Premium was declining.

Many people argued that Bitcoin had further downside ahead simply because the premium was falling.

But my interpretation was completely different.

Bitcoin had already undergone sufficient accumulation, and aggressive buying by Binance whales was pushing the Coinbase Premium lower.

A declining premium wasn't necessarily bearish. It reflected stronger buying pressure on Binance.

I've always believed that Binance's spot and futures markets play a more important role in determining Bitcoin's direction than Coinbase.

Now compare that with today.

The situation is almost the exact opposite of October 2024.

Back then, strong Binance buying pushed the premium lower.

Today, strong Binance selling is pushing the premium higher, even as Bitcoin continues to decline.

This is why the same Coinbase Premium indicator can have completely different meanings depending on market structure and the participants driving trading activity.

A rising Coinbase Premium does not automatically mean bullish conditions.

In the current environment, I see nothing positive about Bitcoin falling while the premium rises.

Instead, I'm deeply concerned that it reflects continued selling pressure from Binance whales.
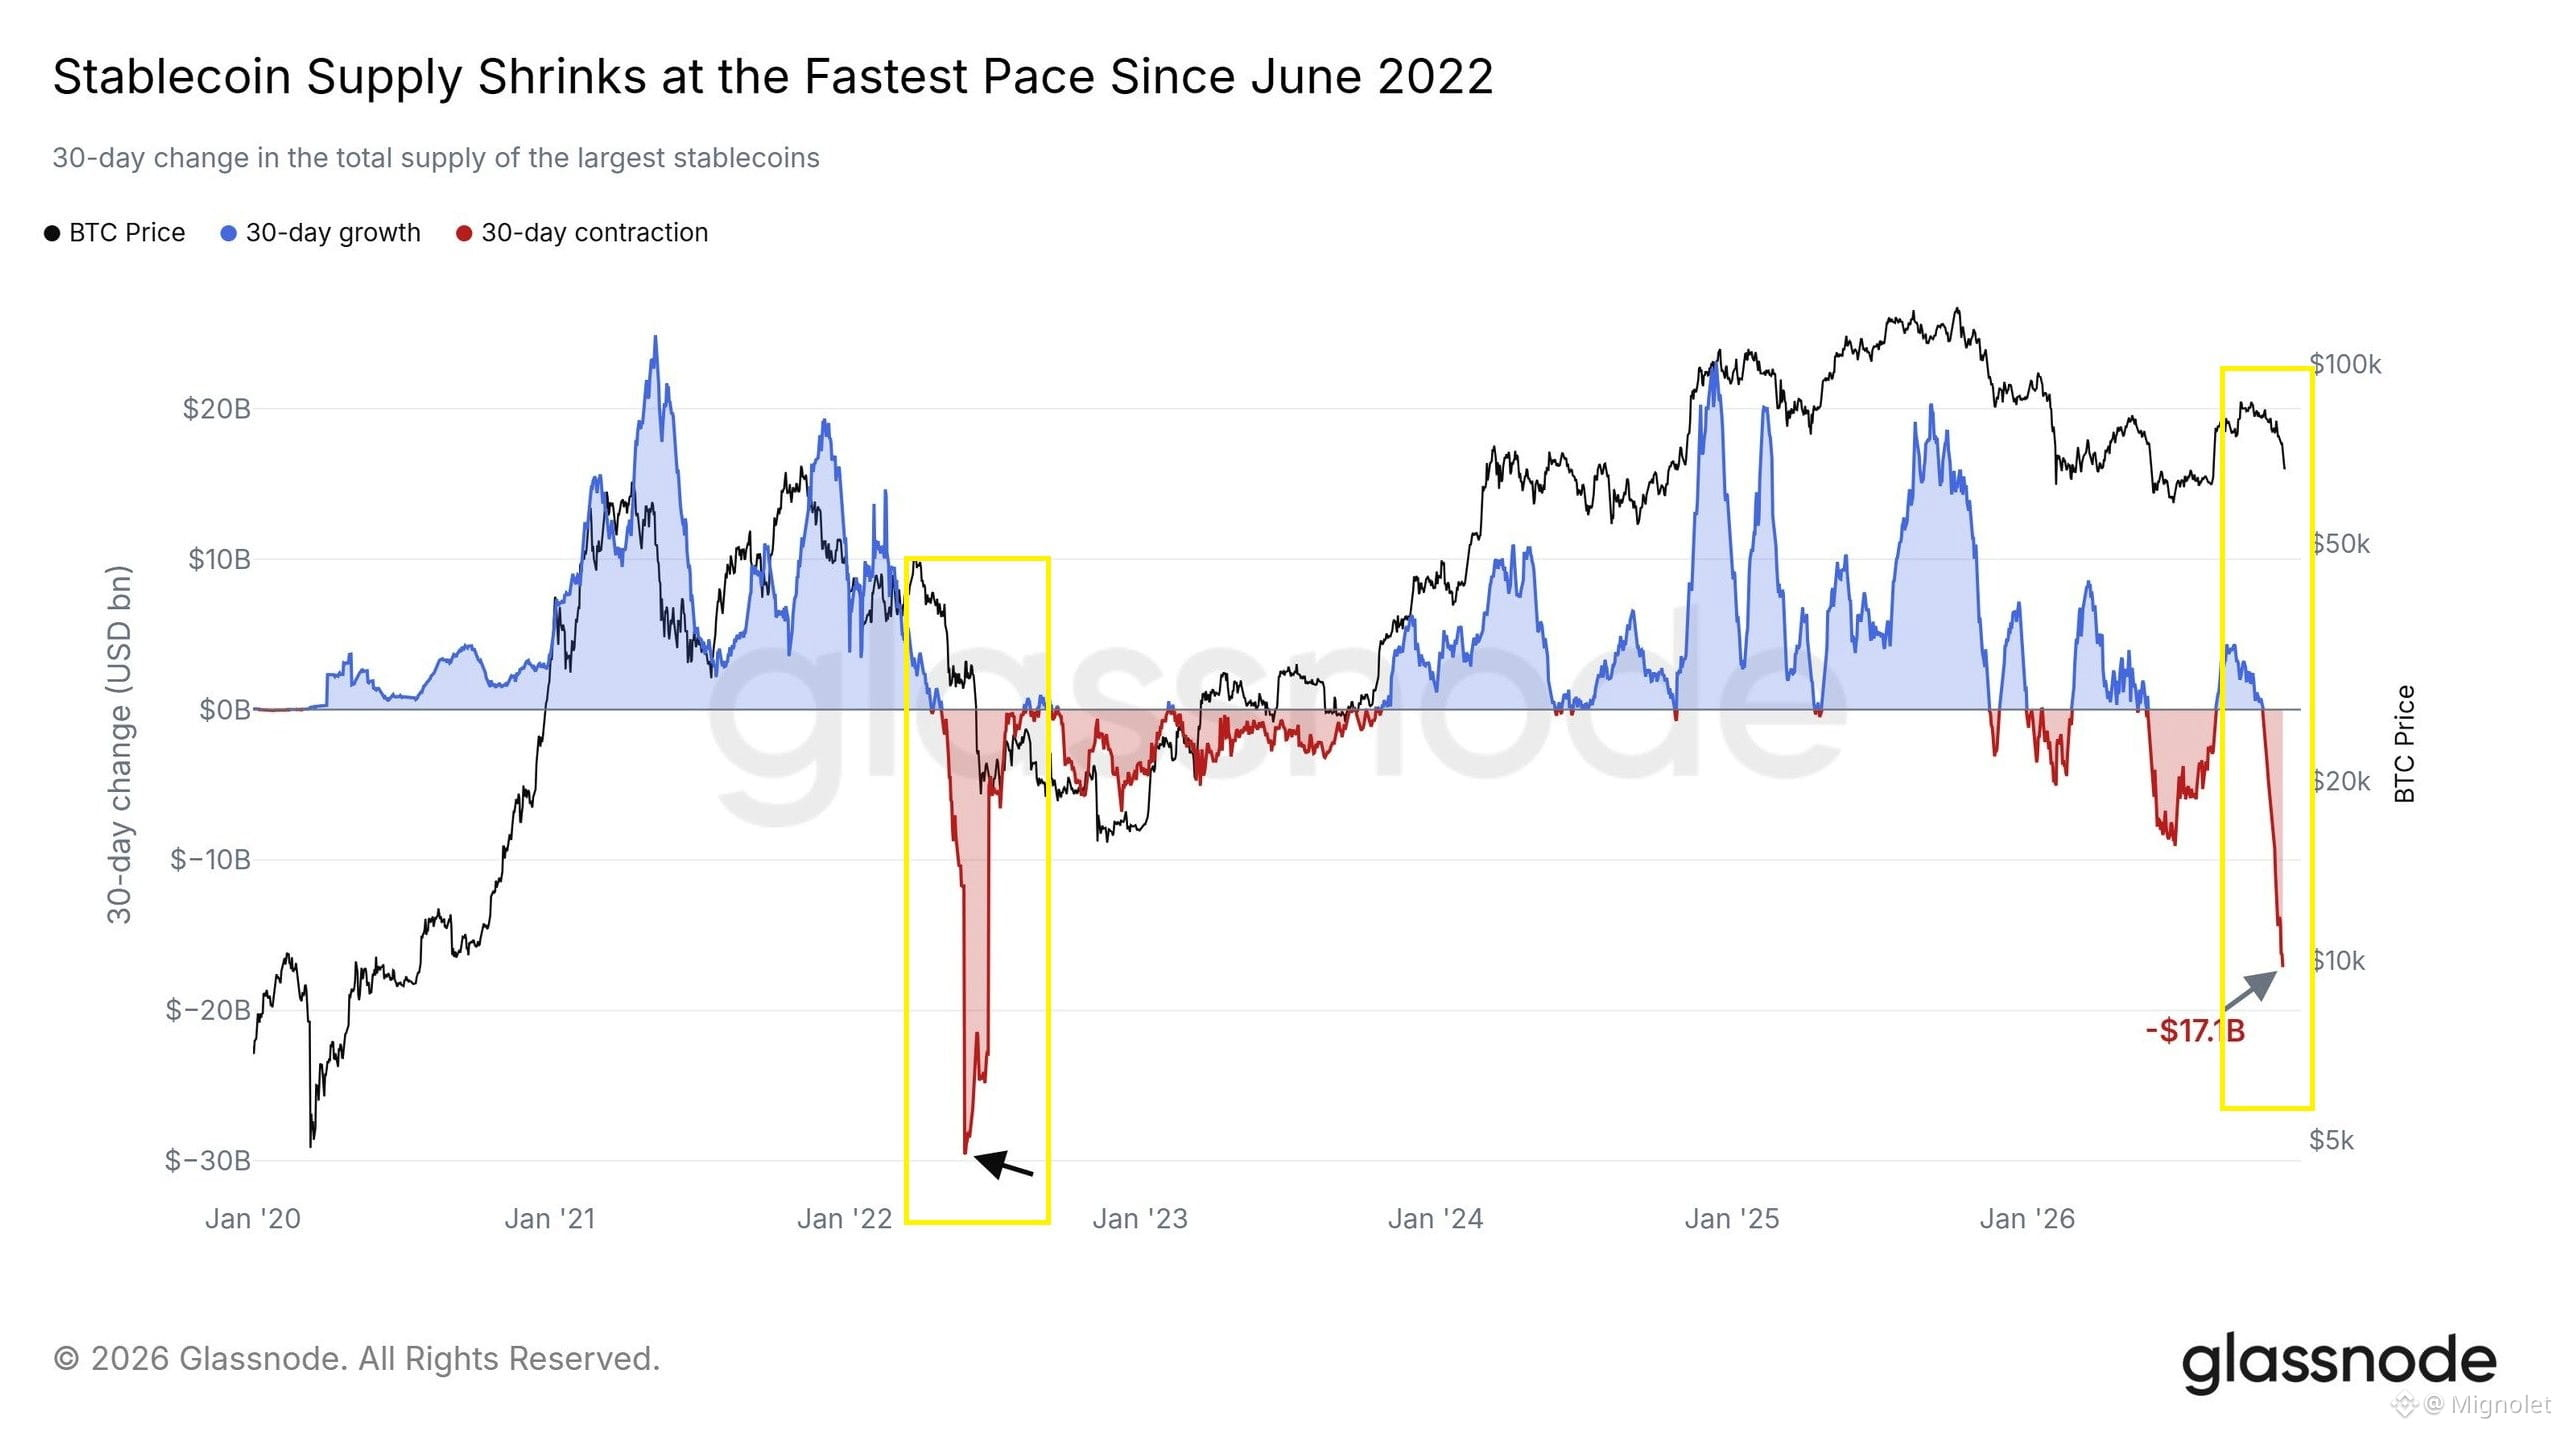
Interestingly, the period of sharp decline in stablecoin liquidity reported by Glassnode aligns almost exactly with the current period of Binance whale selling activity. I generally don't like making market judgments based solely on fractal patterns that resemble historical events. However, what concerns me this time is that we're not simply looking at similar price patterns. We're looking at actual changes in market liquidity. In 2022, we also witnessed signs of whales exiting the market before a series of unexpected events unfolded, including the collapses of 3AC, Celsius, and FTX. At the time, very few people could have accurately predicted that such major events would occur one after another. Of course, this doesn't mean history will necessarily repeat itself. However, I don't believe we should underestimate the warning signals emerging from the current liquidity data. I believe we need to closely monitor Binance whale selling activity and changes in market liquidity throughout this month.
Interestingly, the period of sharp decline in stablecoin liquidity reported by Glassnode aligns almost exactly with the current period of Binance whale selling activity.

I generally don't like making market judgments based solely on fractal patterns that resemble historical events.

However, what concerns me this time is that we're not simply looking at similar price patterns. We're looking at actual changes in market liquidity.

In 2022, we also witnessed signs of whales exiting the market before a series of unexpected events unfolded, including the collapses of 3AC, Celsius, and FTX.

At the time, very few people could have accurately predicted that such major events would occur one after another.

Of course, this doesn't mean history will necessarily repeat itself.

However, I don't believe we should underestimate the warning signals emerging from the current liquidity data.

I believe we need to closely monitor Binance whale selling activity and changes in market liquidity throughout this month.
Mignolet
·
--
Today, I want to share a concern before it potentially becomes a bigger issue.

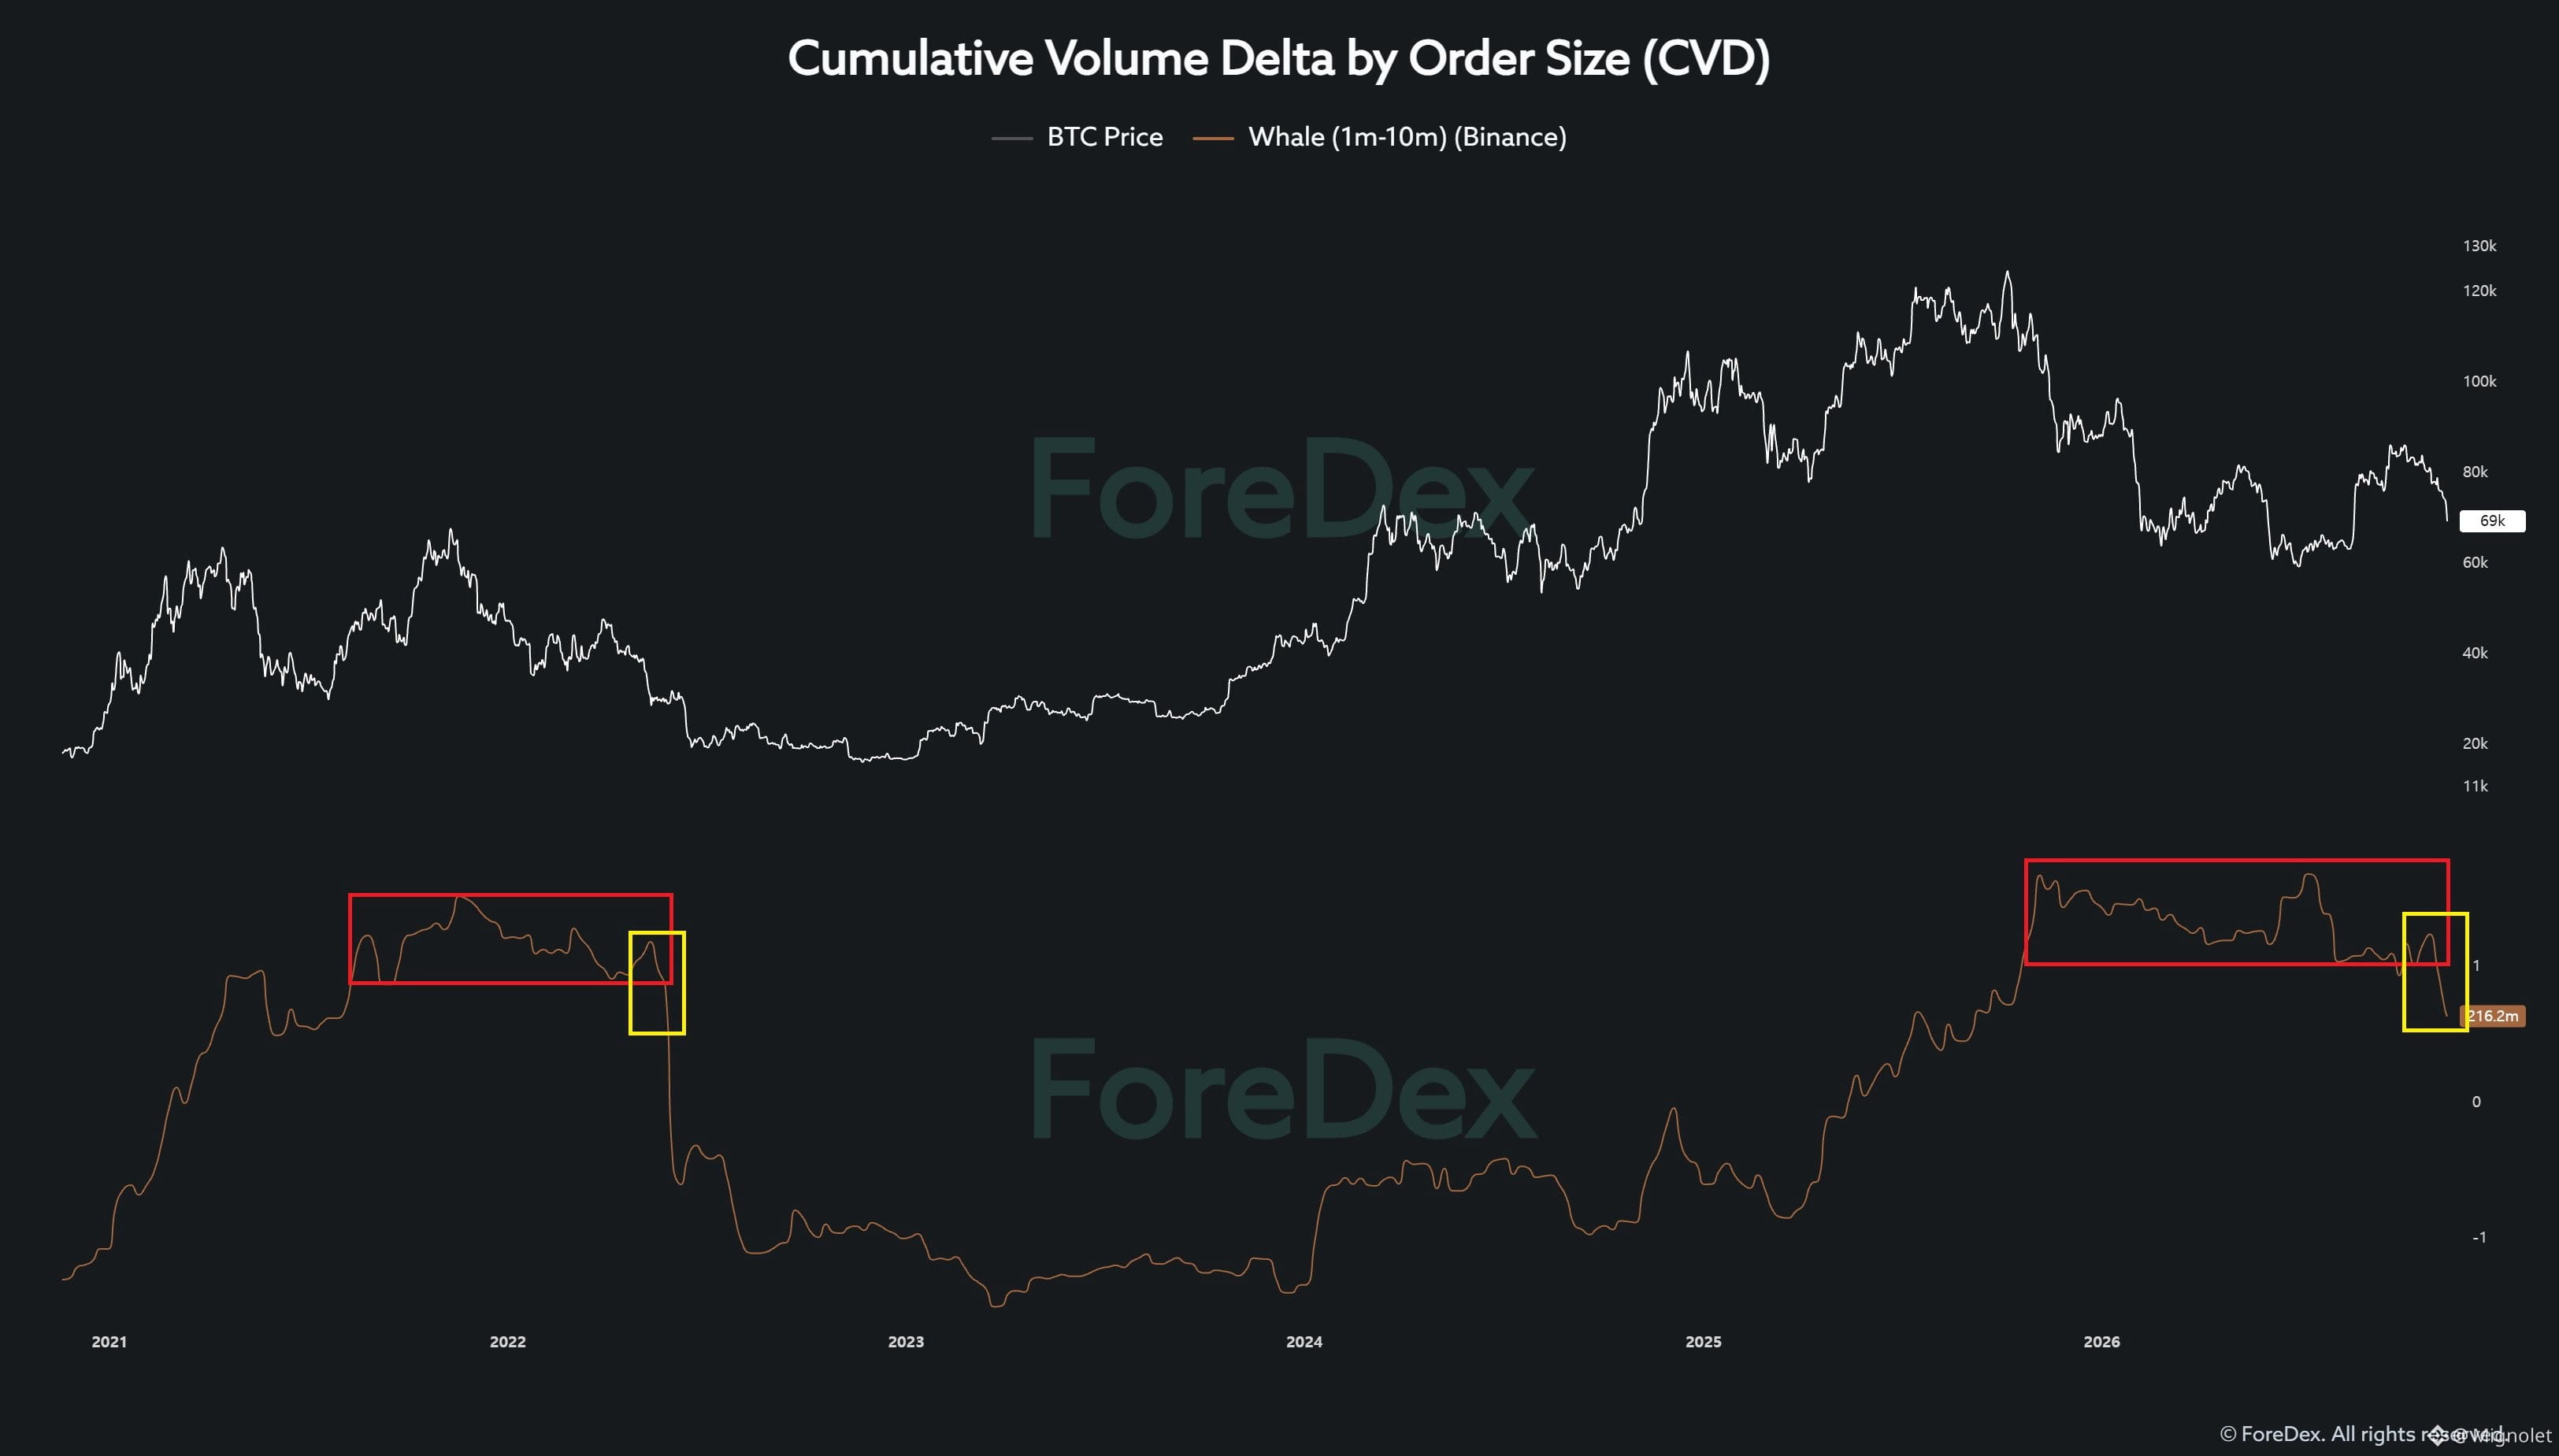
Binance spot whale liquidity flows have looked increasingly concerning since early October, and the situation continues to deteriorate.

What worries me is how closely the current structure resembles 2022.
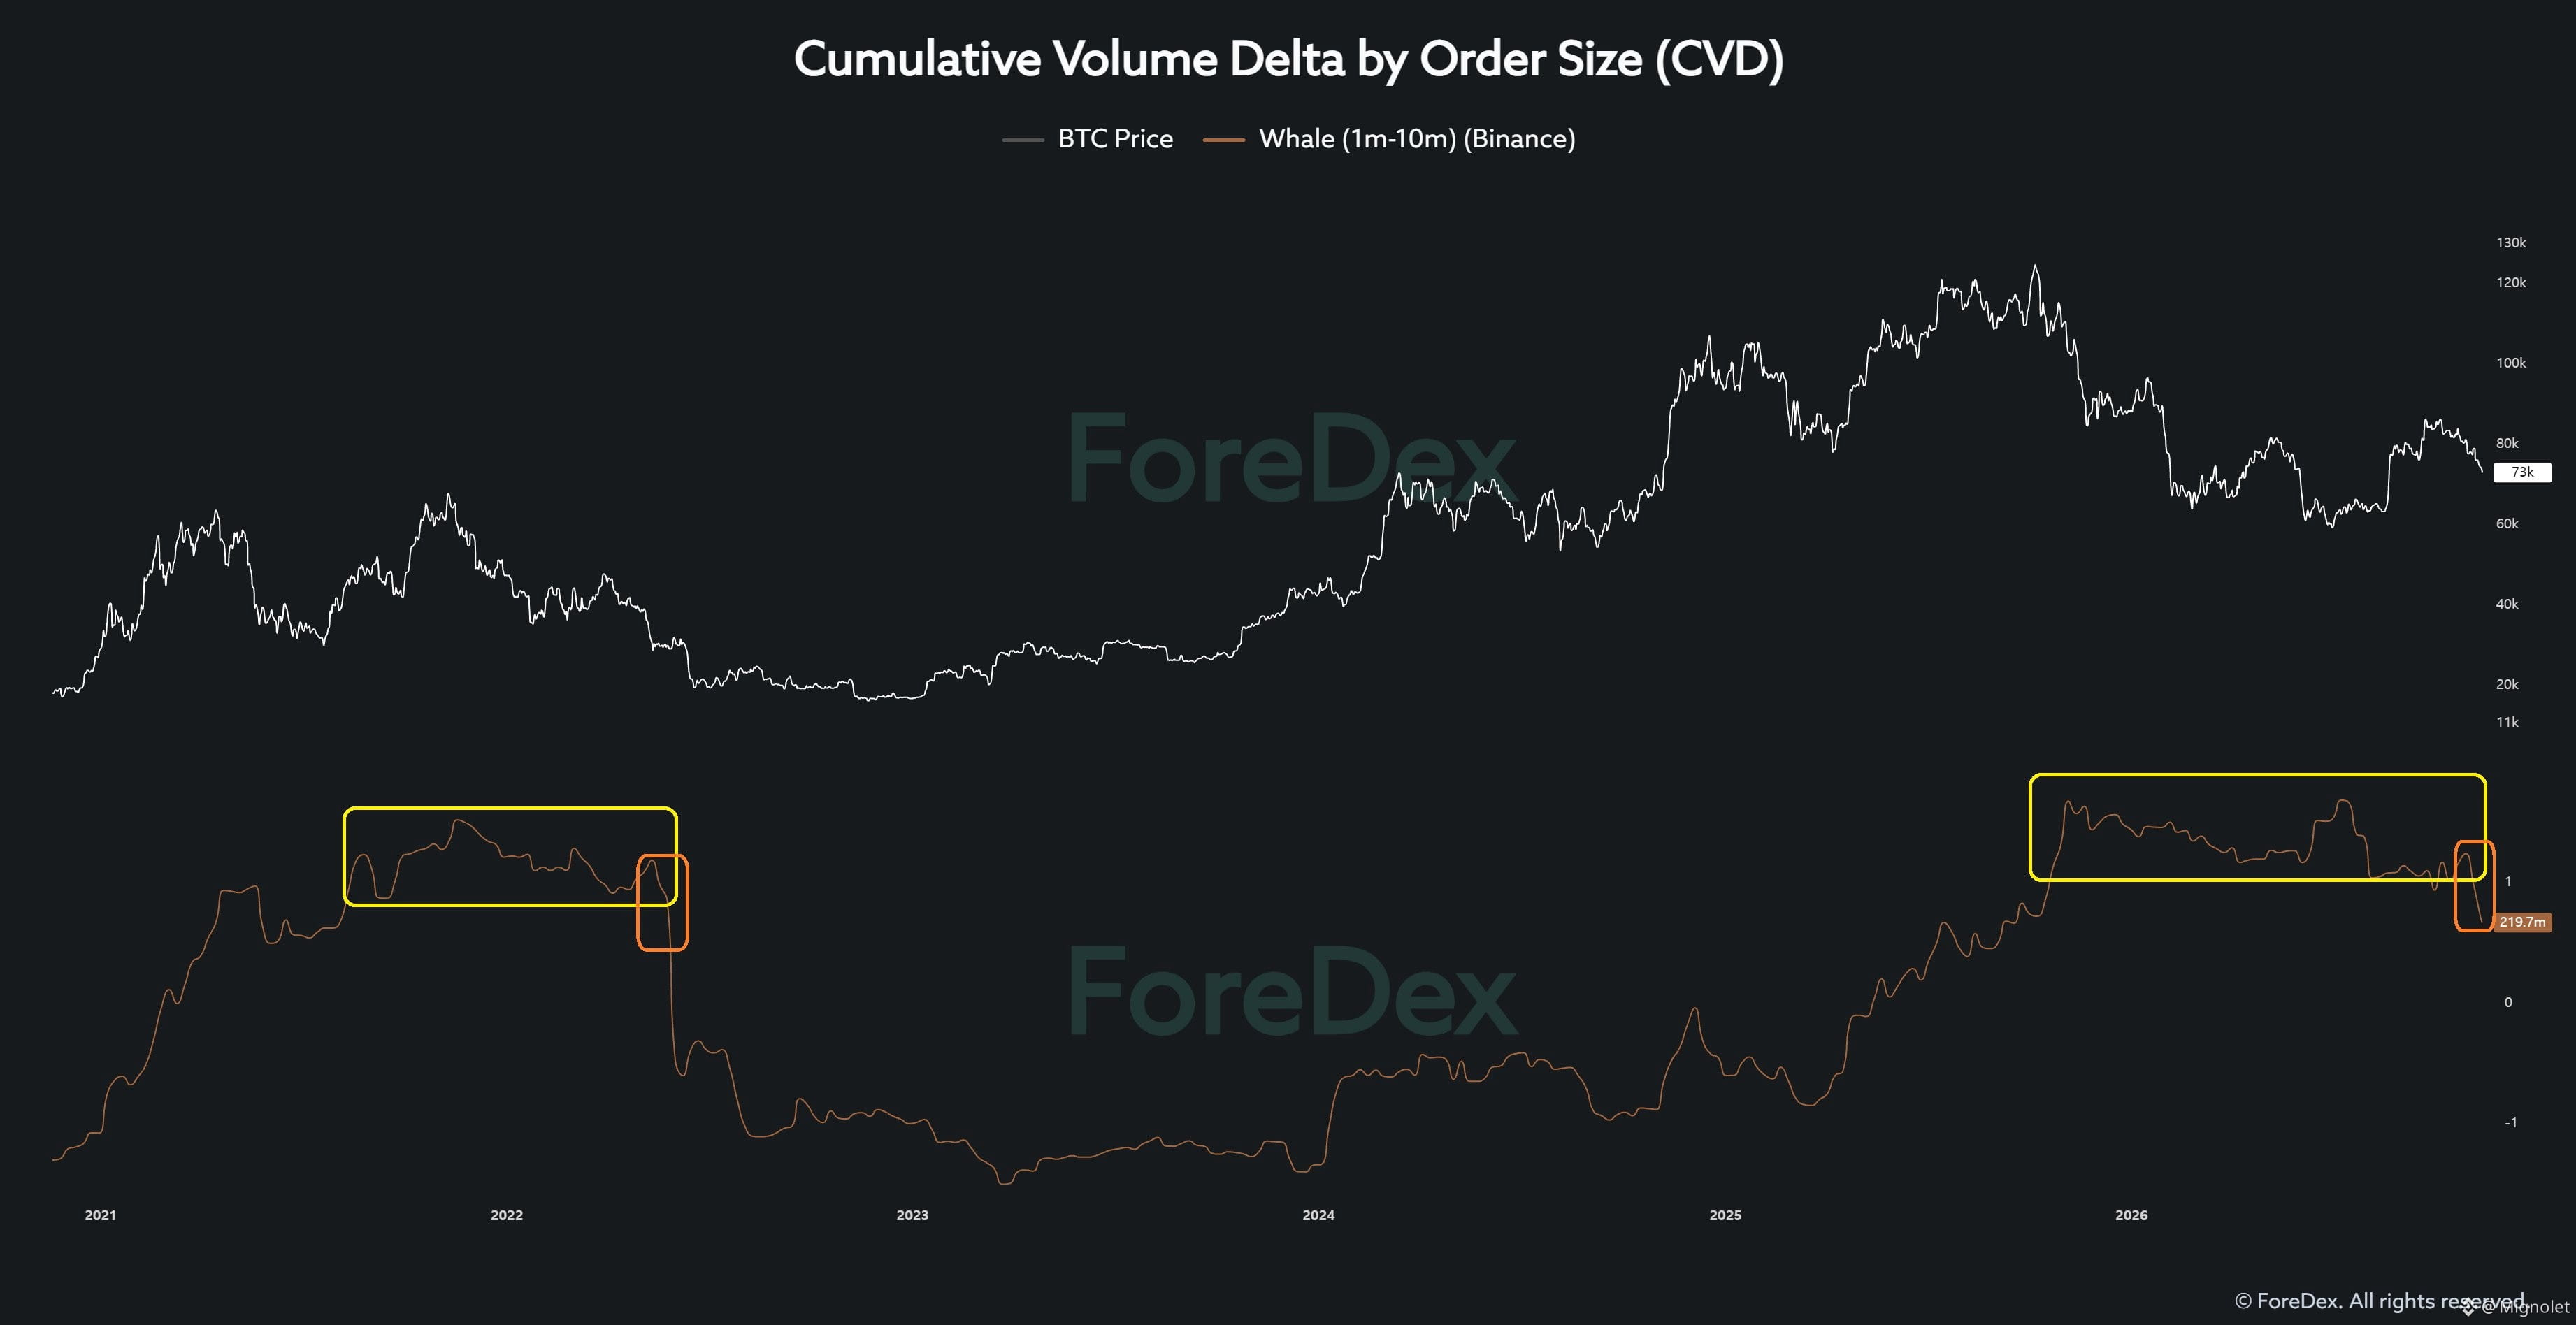
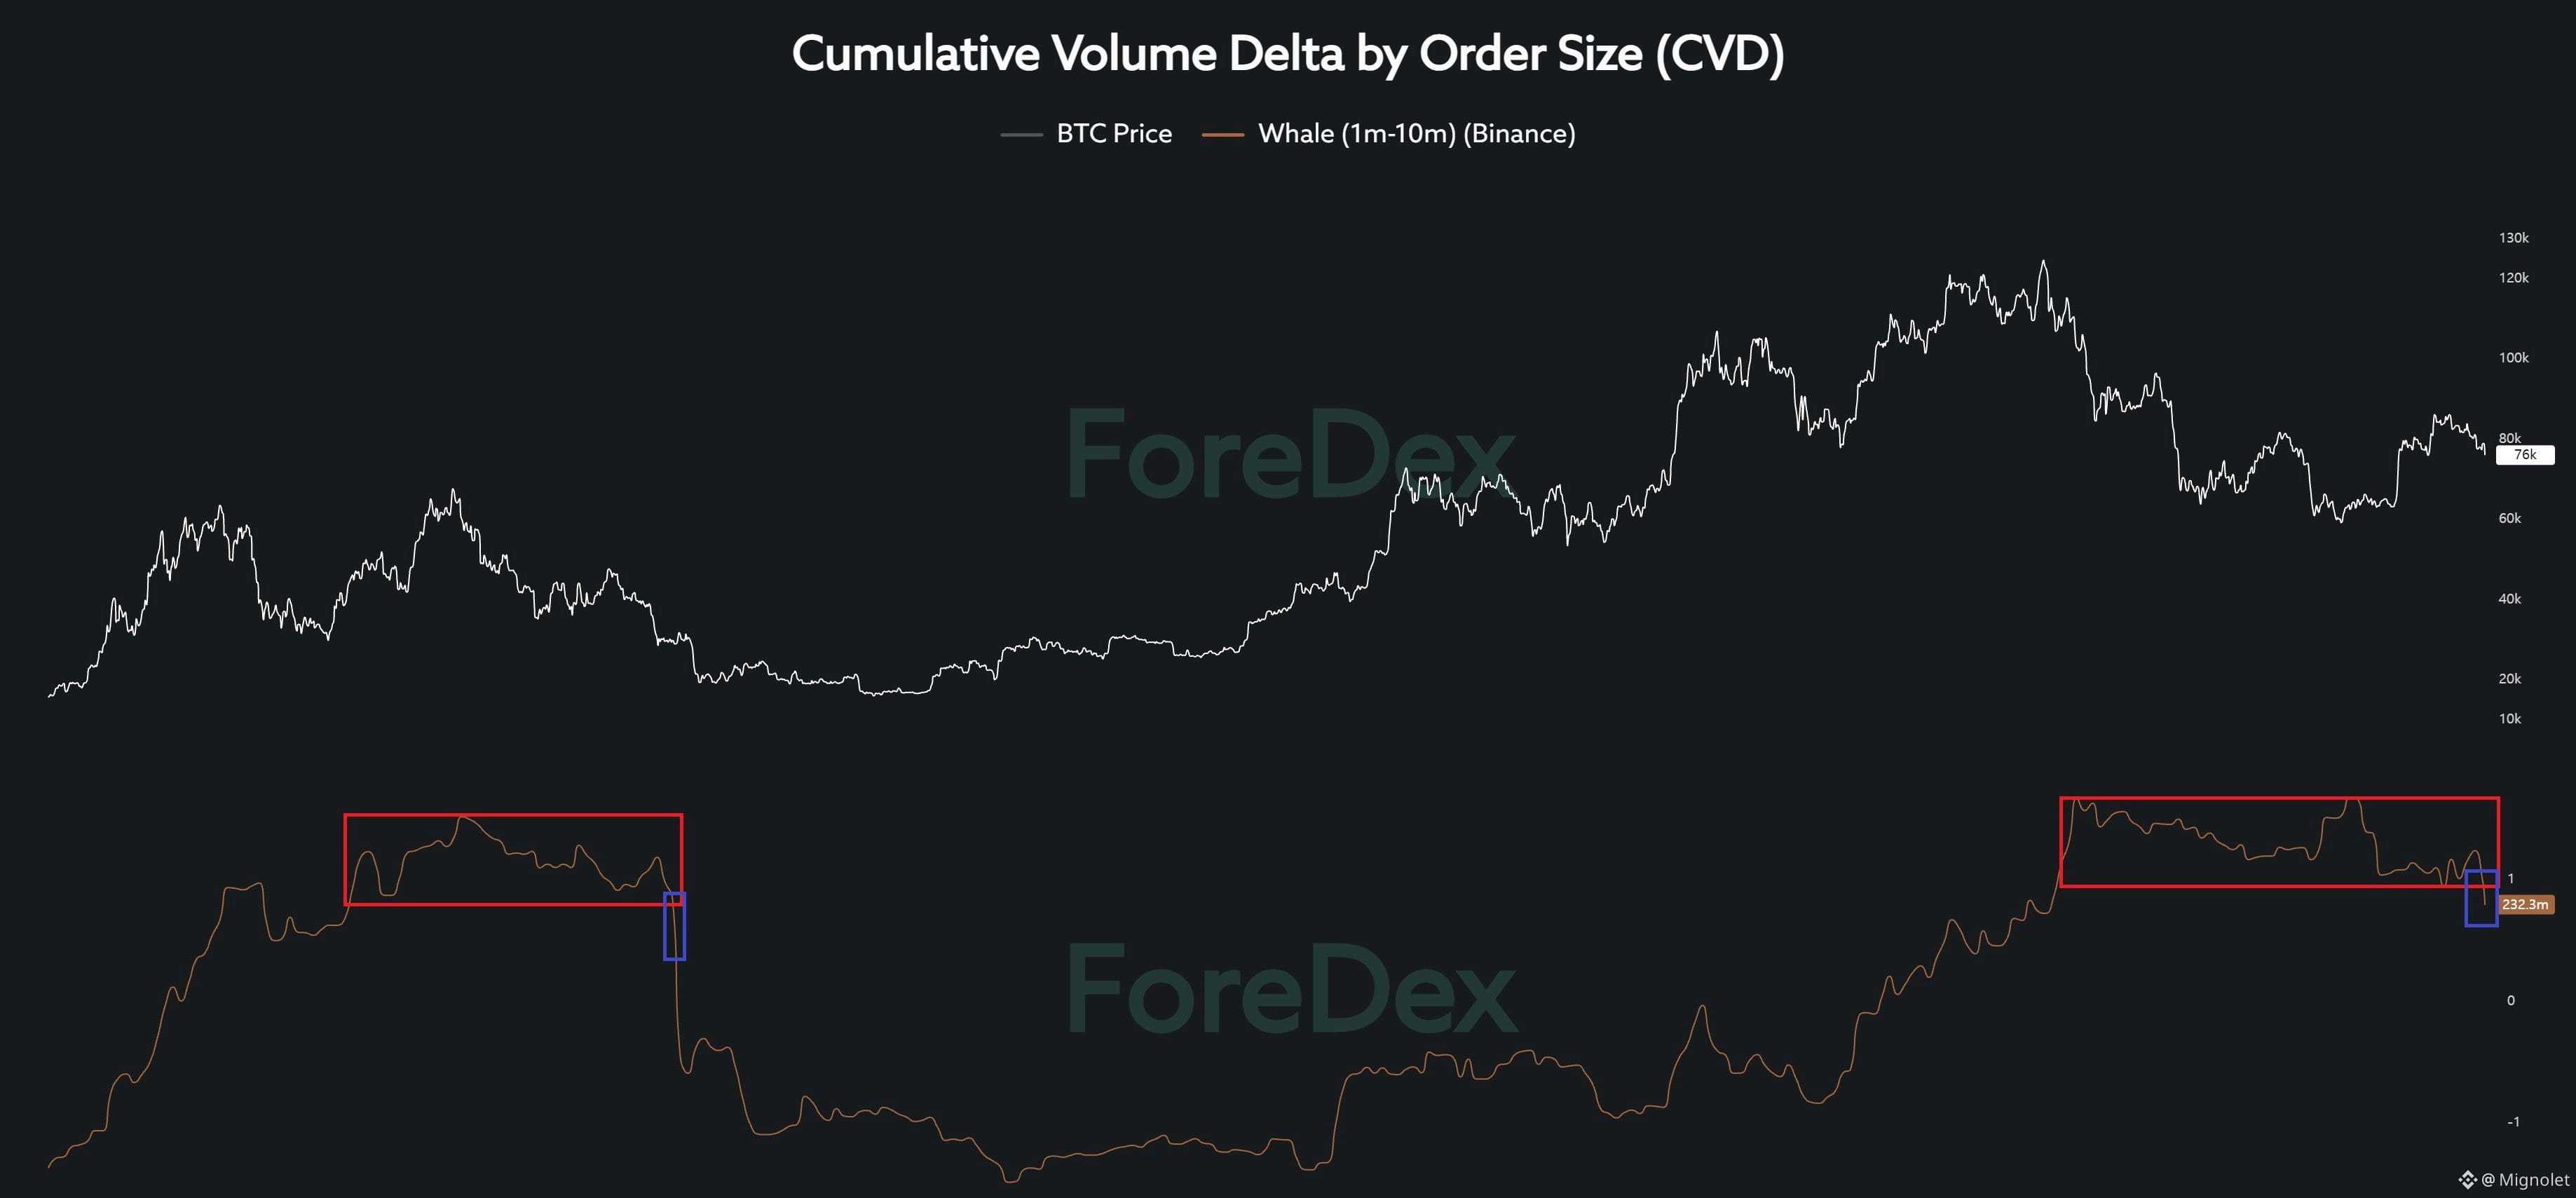
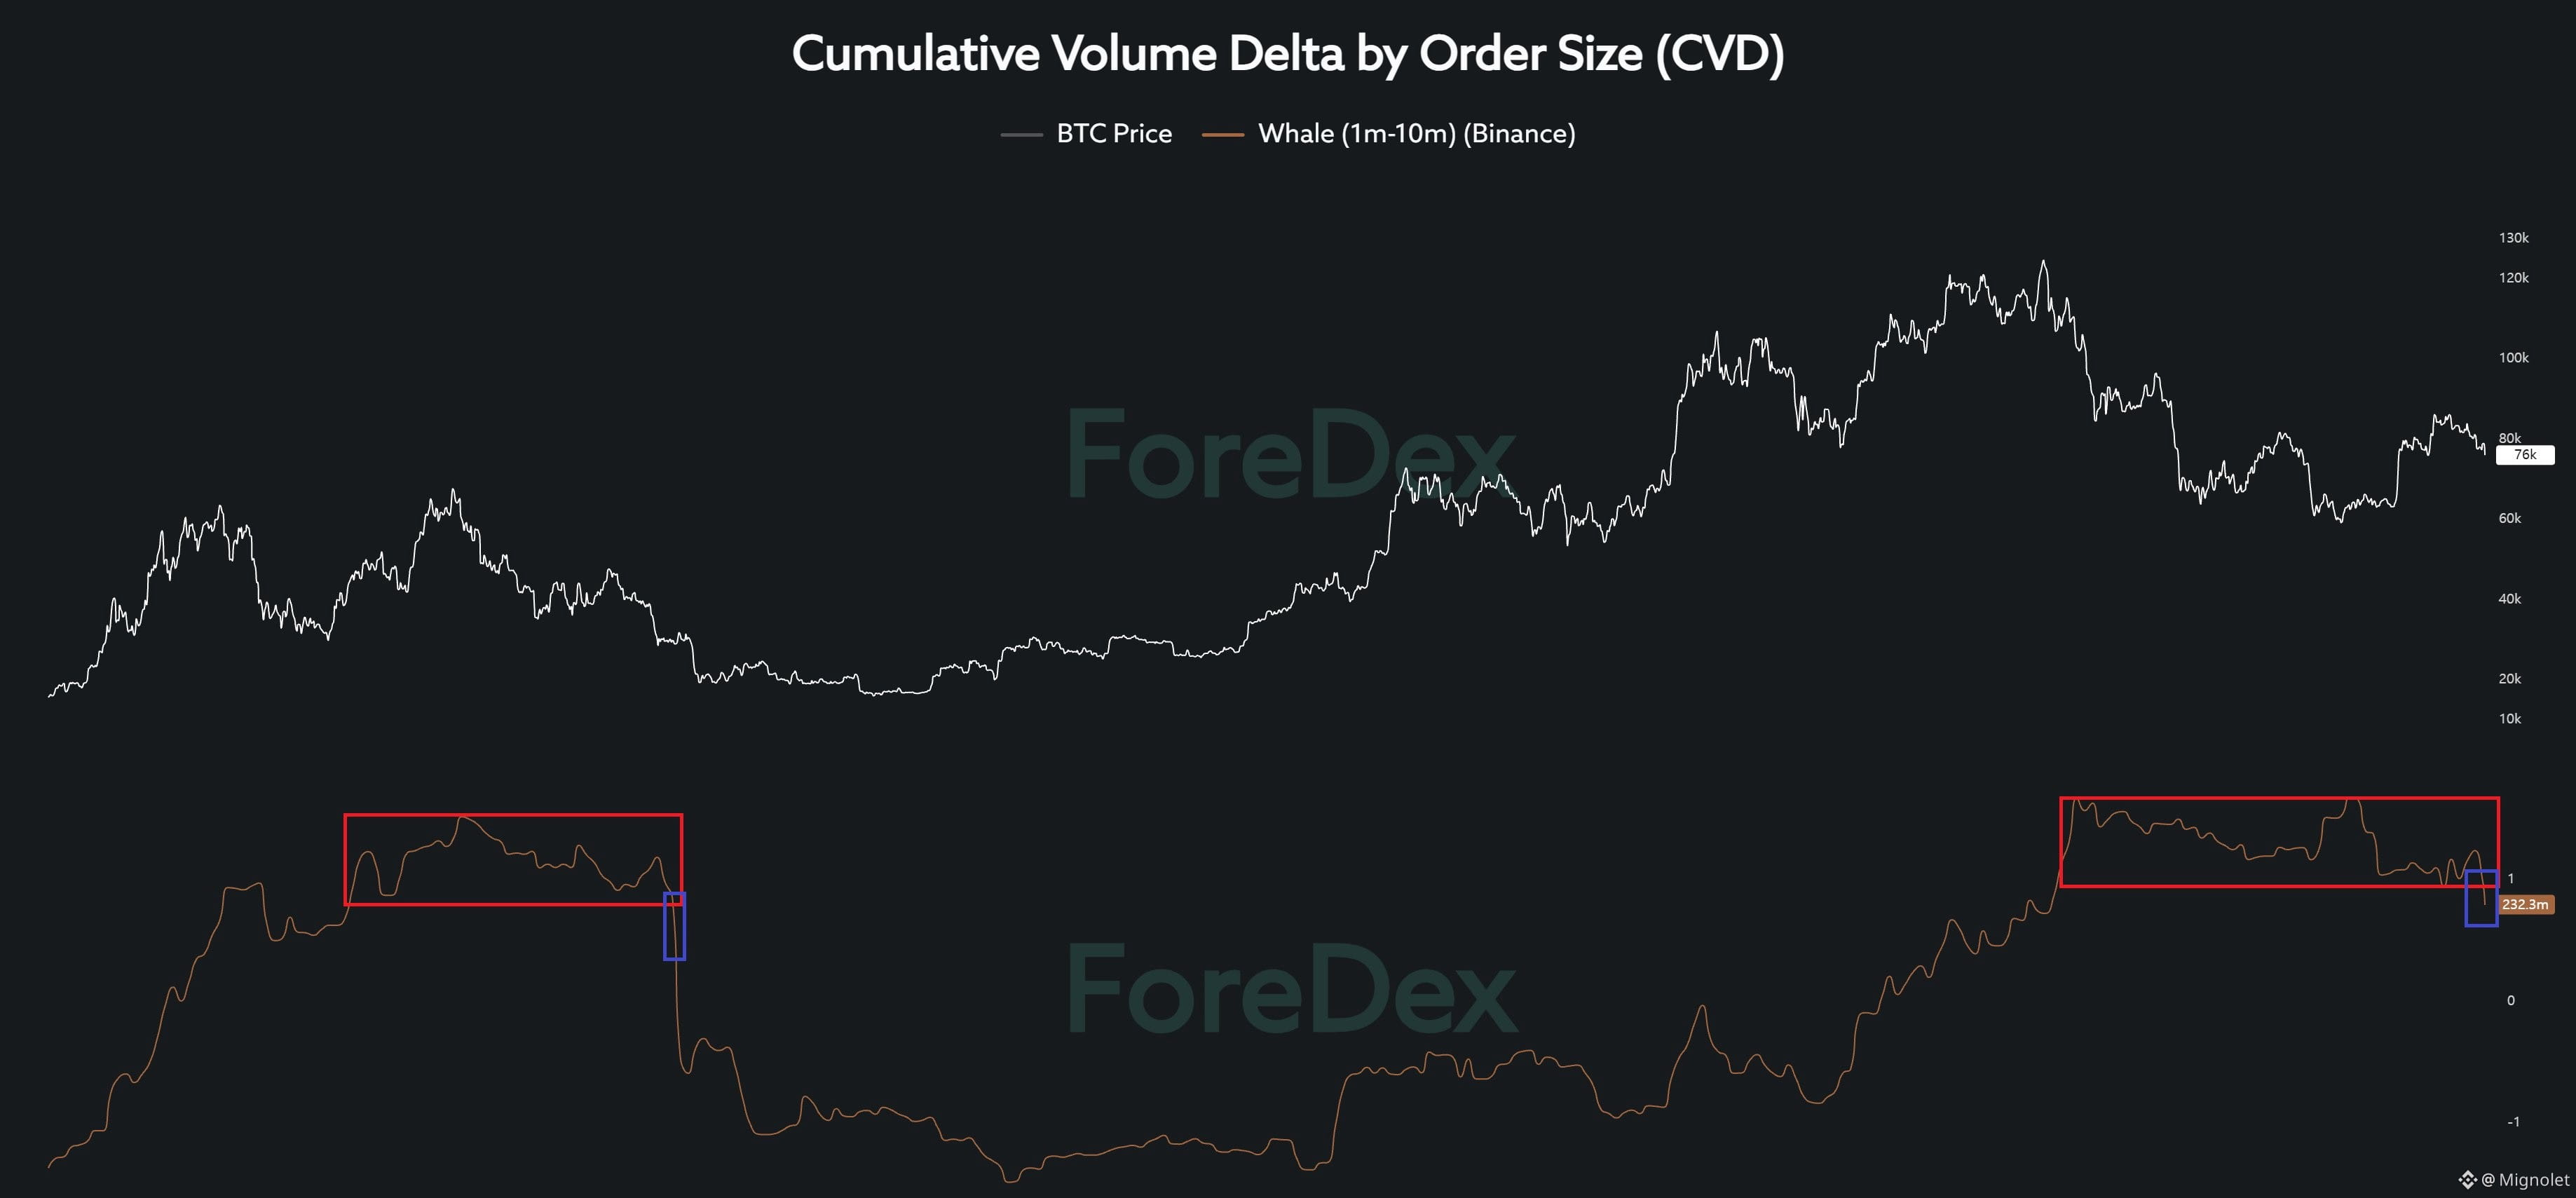
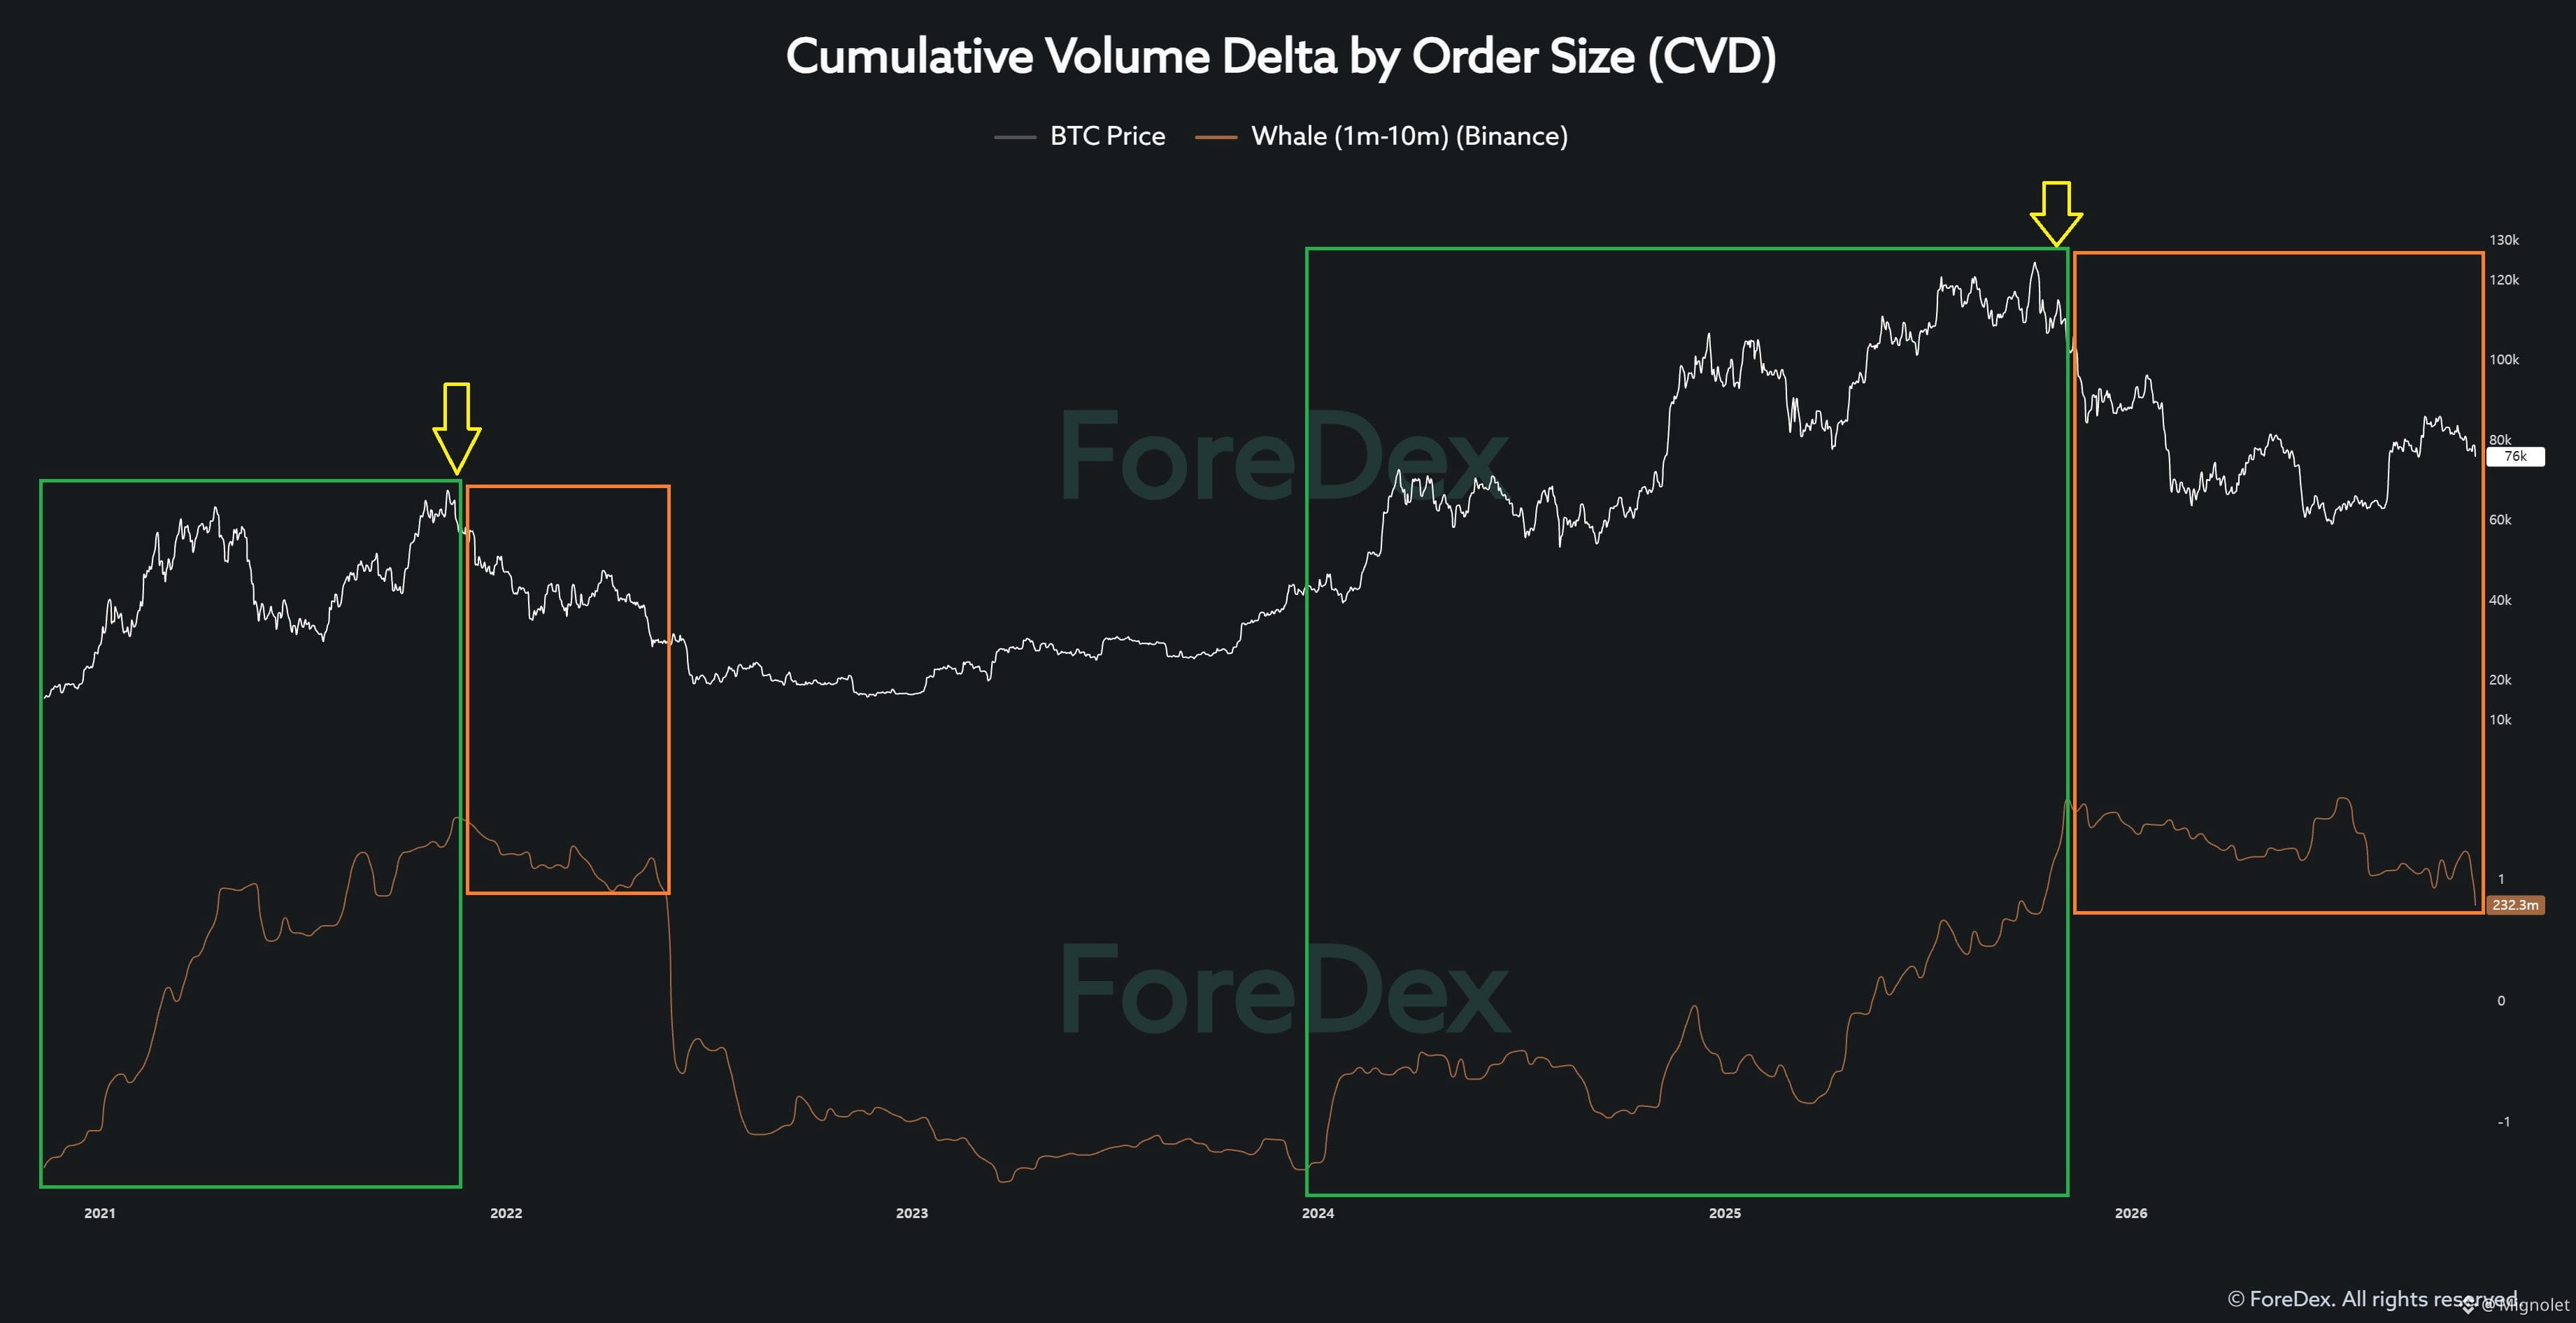
Back then, the brown whale CVD rose alongside Bitcoin's price. But as whale buying pressure weakened, the bearish cycle began.
(Image 2, green box)

Importantly, Binance spot whale CVD didn't collapse immediately. It moved sideways within a range for some time.(Image 1, red box)

The real shock came when that range broke down.
That period coincided with the Terra-Luna crisis, followed by Celsius and 3AC.

Now, whale buying pressure is weakening sharply again.
And today, Bitcoin broke below the lower boundary of a trading range that had formed over roughly a year.
If Binance spot whales continue selling, we should consider the possibility of unexpected problems emerging.
Aside from the Binance hacking incident, there are no obvious major threats currently visible.
But did we know in advance that Terra-Luna, Celsius, and 3AC would collapse in 2022?

That's exactly why risk management matters.
Since selling all my Bitcoin in late September, I haven't bought back. I don't believe this is the time to rush.
Bitcoin's internal liquidity remains weak, while the broader macroeconomic environment is also unfavorable.

The U.S. stock market is showing a clear downward trend.
If Bitcoin's liquidity were improving strongly despite these conditions, I'd be willing to take an aggressive long position.
But that's not what the data shows.

With both internal liquidity and external conditions looking weak, unexpected events could trigger broader market stress.
Of course, none of this is guaranteed. The market could stabilize without a major incident.

But warning signs shouldn't be ignored simply because the risks aren't yet visible.
I'll continue taking a longer-term perspective and closely monitoring Binance spot whale CVD throughout November.
I'm calmly observing the market. As I've repeatedly emphasized, this is not the time to rush into investment decisions. I've already established a detailed plan and specific criteria for navigating the market after the U.S. midterm elections. However, the market is increasingly moving toward the most negative scenario I had anticipated. That means I may need to wait even longer. 1. The U.S. dollar is behaving differently from previous Bitcoin cycles. The dollar's current rise is difficult to dismiss as a short-term rebound. It has broken above a trading range that lasted more than 500 days. As I often emphasize, established trends rarely reverse easily, especially after such prolonged consolidation. 2. ETF and OTC buy-side liquidity remain weak. Cumulative Bitcoin ETF net flows are still negative for the year, indicating that sustained accumulation has yet to materialize. Meanwhile, OTC buy-side liquidity remains severely constrained. When OTC markets cannot absorb institutional selling, that selling pressure can shift toward exchanges. We're already seeing this happen in the data. 3. My biggest concern is the continued selling by Binance whales. Their selling activity is increasingly resembling the pattern we witnessed in 2022. More concerningly, this trend is still ongoing. In 2022, whales began exiting before major events emerged that triggered severe market disruptions. If this pattern continues, I believe the risk of currently hidden problems surfacing could increase significantly. Of course, history doesn't have to repeat itself. But these warning signals should not be ignored. Right now, I'm more concerned about how long the liquidity squeeze will persist and whether it could trigger a broader market shock than about short-term rebounds. My investment criteria are already in place. If conditions are worse than expected, I'm prepared to wait longer. Rather than forcing trades, I'll patiently wait for market stabilization and a genuine recovery in liquidity.
I'm calmly observing the market.

As I've repeatedly emphasized, this is not the time to rush into investment decisions.

I've already established a detailed plan and specific criteria for navigating the market after the U.S. midterm elections.

However, the market is increasingly moving toward the most negative scenario I had anticipated.

That means I may need to wait even longer.

1. The U.S. dollar is behaving differently from previous Bitcoin cycles.

The dollar's current rise is difficult to dismiss as a short-term rebound.

It has broken above a trading range that lasted more than 500 days.

As I often emphasize, established trends rarely reverse easily, especially after such prolonged consolidation.

2. ETF and OTC buy-side liquidity remain weak.

Cumulative Bitcoin ETF net flows are still negative for the year, indicating that sustained accumulation has yet to materialize.

Meanwhile, OTC buy-side liquidity remains severely constrained.

When OTC markets cannot absorb institutional selling, that selling pressure can shift toward exchanges.

We're already seeing this happen in the data.

3. My biggest concern is the continued selling by Binance whales.

Their selling activity is increasingly resembling the pattern we witnessed in 2022.

More concerningly, this trend is still ongoing.

In 2022, whales began exiting before major events emerged that triggered severe market disruptions.

If this pattern continues, I believe the risk of currently hidden problems surfacing could increase significantly.

Of course, history doesn't have to repeat itself.

But these warning signals should not be ignored.

Right now, I'm more concerned about how long the liquidity squeeze will persist and whether it could trigger a broader market shock than about short-term rebounds.

My investment criteria are already in place.

If conditions are worse than expected, I'm prepared to wait longer.

Rather than forcing trades, I'll patiently wait for market stabilization and a genuine recovery in liquidity.
Mignolet
·
--
Bitcoin’s Liquidity Crisis: Why the Market Still Needs More Time
Today, I want to take a step back and examine the Bitcoin market from a macroeconomic perspective.

It may be a relatively conventional approach, but given the severe liquidity constraints currently facing Bitcoin, I believe it's important to revisit the broader macro environment.

Let me start with my conclusion.

"The Bitcoin market has still not gone through sufficient accumulation, and liquidity conditions continue to deteriorate. At this point, we can only hope the market avoids a major shock. Even if it does, a much longer period of sideways consolidation may be necessary than many expect."

As I've repeatedly discussed in my previous analyses, Bitcoin's internal liquidity conditions are extremely concerning.

Buy-side liquidity continues to weaken, and the market is experiencing a significant liquidity squeeze.

Against this backdrop, I want to examine the relationship between the U.S. dollar and Bitcoin's market cycles.

This may be familiar territory for anyone who has spent some time studying financial markets.

Generally speaking, the U.S. dollar is closely tied to global liquidity conditions.

Looking back at Bitcoin's historical cycles, we have never seen Bitcoin sustain a full-fledged bull market while the dollar was in a strong upward trend.

The bearish cycle that began in 2025 has not been particularly different in this regard.

But that brings us to the most important question.

"Are we really at the point where the U.S. dollar is about to enter a sustained downtrend?"

To me, this is one of the most critical questions when assessing the current market.

Let's look at the historical cycles objectively.

In previous cycles, Bitcoin went through a prolonged bear market before entering a major bullish phase as the U.S. dollar began a sustained decline.
(Image 1, green boxes)

But the current situation is fundamentally different.

Rather than entering a downtrend, the dollar is showing signs of establishing a strong upward trend.

(Image 1, red box)

This is the most important difference between previous bullish cycles and the market environment we face today.

Now, take a look at Image 2.

The U.S. dollar has broken above a trading range that had been forming for more than 500 days.

There is something I frequently emphasize in my market analysis:

"Once a trend is established, it rarely reverses easily."

This is because of trend persistence.

And this is not a trend that developed over a few weeks or months.

We are looking at a breakout from a consolidation range that lasted more than 500 days.

That makes this development particularly important.

Even if the dollar eventually reverses and begins declining again, the process could take considerably longer than many investors anticipate.

We also need to consider the broader macroeconomic environment.

Interest rate hikes began in the third quarter of this year, while the political and economic environment surrounding the U.S. midterm elections has hardly been favorable for the crypto market.

Meanwhile, selling pressure from Bitcoin mining companies is another major concern.

Bitcoin selling activity among mining companies reached historically elevated levels during the third and fourth quarters of this year.

At the same time, many mining companies have been shifting their business models toward AI data centers.

Under these circumstances, can we realistically expect substantial new liquidity to flow into Bitcoin?

At this point, I find it difficult to be confident that it will.

Ultimately, Bitcoin needs a new catalyst and a compelling narrative capable of attracting fresh capital.

Personally, I believe one of the strongest narratives Bitcoin could have is its role as "Digital Gold."

But there has been an interesting shift here as well.

One of the companies that most aggressively promoted Bitcoin as digital gold was Strategy.

Back in 2022, Strategy frequently emphasized Bitcoin's identity as "Digital Gold."

However, beginning in 2025, the company increasingly shifted its messaging toward concepts such as "Credit" and "Digital Capital," rather than emphasizing Bitcoin primarily as digital gold.

Think about what that means.

Even Strategy, one of the most influential companies capable of driving the digital gold narrative, is now emphasizing a different narrative.

And now, with today's confirmation of its exclusion from the MSCI index, uncertainty surrounding the market has increased even further.

So let me ask the question again.

"Is liquidity in the Bitcoin market actually recovering?"

Bitcoin has become far more deeply integrated into the traditional financial system than ever before.

Through spot ETFs and growing institutional participation, Bitcoin is increasingly held within the portfolios of traditional financial institutions.

As a result, its market behavior has become more closely connected to macroeconomic conditions and movements in traditional financial markets.

In other words, Bitcoin is now more exposed to the broader macro environment, not less.

Yet today, Bitcoin's internal liquidity remains weak, while external macroeconomic conditions are far from supportive.

Under these circumstances, I find it difficult to see how Bitcoin could simply defy the broader macro environment and independently enter a powerful bullish cycle.

For Bitcoin to begin a genuine, sustained bull market, new liquidity needs to enter the market.

That is the fundamental requirement.

And this brings me back to my current assessment.

Right now, the priority should be hoping that the market can get through this period without experiencing a major shock.

But even if we manage to avoid a significant disruption, unwinding excessive leverage and resolving the current liquidity imbalances could require a much longer period of consolidation and accumulation than many investors expect.

If investors are expecting Bitcoin to quickly return to a steep upward trajectory from here, I think they may be setting themselves up for considerable disappointment.

This is also why I intend to approach my next Bitcoin purchases with a much longer time horizon.

Rather than rushing back into the market, I want to carefully assess how liquidity conditions develop and whether the market has gone through a sufficient accumulation process.

I understand that my current outlook may sound pessimistic, or even discouraging.

But the purpose of market analysis is not to consistently deliver an optimistic outlook.

It is to objectively assess the environment we are operating in and develop an investment strategy that reflects those conditions.

I simply do not believe this is the right time to approach the Bitcoin market aggressively.

There is no need to rush.

For now, I believe patience is more important than chasing a potential rebound.

I would rather wait for liquidity to recover, allow the market enough time to accumulate, and position myself when a more favorable opportunity emerges.
Since selling all my Bitcoin in late September, I've remained on the sidelines without taking any positions. I've consistently emphasized that Bitcoin has still not gone through sufficient accumulation, and the market may need considerably more time before a sustained bull cycle can begin. If I had believed sufficient accumulation had occurred before the August rally, I wouldn't have sold in late September. I would have bought more in October. But I didn't believe the conditions were in place for a sustained, rapid rally. Bitcoin has since declined sharply. However, I haven't opened any short positions because I believe the risk-reward ratio for longs is now significantly more favorable than for shorts. That doesn't mean it's time to buy immediately. I've already established specific criteria for navigating the market after the U.S. midterm elections, and I'm patiently monitoring those conditions. I still believe a much longer accumulation period is necessary. The liquidity data I've shared throughout this week has become increasingly concerning. ⚠️ Buy-side liquidity is severely constrained. With OTC buy-side liquidity failing to recover, institutional selling flows are beginning to move onto exchanges. Meanwhile, DeFi Leverage Liquidity is overheating, and the broader macroeconomic environment remains unfavorable. Taken together, these conditions paint a deeply concerning picture. We've reached a point where we can only hope these liquidity warning signals don't escalate into a major market shock. I will continue looking for buying opportunities, but I have no intention of rushing. A better risk-reward ratio for longs than shorts does not mean Bitcoin is an immediate buy. These are two entirely different judgments. For now, I believe it's important to look beyond short-term price movements, take a longer-term perspective, and wait patiently for sufficient accumulation and a recovery in market liquidity. Clarify my timeline and positioningTighten my liquidity warning section
Since selling all my Bitcoin in late September, I've remained on the sidelines without taking any positions.

I've consistently emphasized that Bitcoin has still not gone through sufficient accumulation, and the market may need considerably more time before a sustained bull cycle can begin.

If I had believed sufficient accumulation had occurred before the August rally, I wouldn't have sold in late September. I would have bought more in October.

But I didn't believe the conditions were in place for a sustained, rapid rally.

Bitcoin has since declined sharply.

However, I haven't opened any short positions because I believe the risk-reward ratio for longs is now significantly more favorable than for shorts.

That doesn't mean it's time to buy immediately.

I've already established specific criteria for navigating the market after the U.S. midterm elections, and I'm patiently monitoring those conditions.

I still believe a much longer accumulation period is necessary.

The liquidity data I've shared throughout this week has become increasingly concerning.

⚠️ Buy-side liquidity is severely constrained.

With OTC buy-side liquidity failing to recover, institutional selling flows are beginning to move onto exchanges.

Meanwhile, DeFi Leverage Liquidity is overheating, and the broader macroeconomic environment remains unfavorable.

Taken together, these conditions paint a deeply concerning picture.

We've reached a point where we can only hope these liquidity warning signals don't escalate into a major market shock.

I will continue looking for buying opportunities, but I have no intention of rushing.

A better risk-reward ratio for longs than shorts does not mean Bitcoin is an immediate buy.

These are two entirely different judgments.

For now, I believe it's important to look beyond short-term price movements, take a longer-term perspective, and wait patiently for sufficient accumulation and a recovery in market liquidity.

Clarify my timeline and positioningTighten my liquidity warning section
Article
Bitcoin’s Liquidity Crisis: Why the Market Still Needs More TimeToday, I want to take a step back and examine the Bitcoin market from a macroeconomic perspective. It may be a relatively conventional approach, but given the severe liquidity constraints currently facing Bitcoin, I believe it's important to revisit the broader macro environment. Let me start with my conclusion. "The Bitcoin market has still not gone through sufficient accumulation, and liquidity conditions continue to deteriorate. At this point, we can only hope the market avoids a major shock. Even if it does, a much longer period of sideways consolidation may be necessary than many expect." As I've repeatedly discussed in my previous analyses, Bitcoin's internal liquidity conditions are extremely concerning. Buy-side liquidity continues to weaken, and the market is experiencing a significant liquidity squeeze. Against this backdrop, I want to examine the relationship between the U.S. dollar and Bitcoin's market cycles. This may be familiar territory for anyone who has spent some time studying financial markets. Generally speaking, the U.S. dollar is closely tied to global liquidity conditions. Looking back at Bitcoin's historical cycles, we have never seen Bitcoin sustain a full-fledged bull market while the dollar was in a strong upward trend. The bearish cycle that began in 2025 has not been particularly different in this regard. But that brings us to the most important question. "Are we really at the point where the U.S. dollar is about to enter a sustained downtrend?" To me, this is one of the most critical questions when assessing the current market. Let's look at the historical cycles objectively. In previous cycles, Bitcoin went through a prolonged bear market before entering a major bullish phase as the U.S. dollar began a sustained decline. (Image 1, green boxes) But the current situation is fundamentally different. Rather than entering a downtrend, the dollar is showing signs of establishing a strong upward trend. (Image 1, red box) This is the most important difference between previous bullish cycles and the market environment we face today. Now, take a look at Image 2. The U.S. dollar has broken above a trading range that had been forming for more than 500 days. There is something I frequently emphasize in my market analysis: "Once a trend is established, it rarely reverses easily." This is because of trend persistence. And this is not a trend that developed over a few weeks or months. We are looking at a breakout from a consolidation range that lasted more than 500 days. That makes this development particularly important. Even if the dollar eventually reverses and begins declining again, the process could take considerably longer than many investors anticipate. We also need to consider the broader macroeconomic environment. Interest rate hikes began in the third quarter of this year, while the political and economic environment surrounding the U.S. midterm elections has hardly been favorable for the crypto market. Meanwhile, selling pressure from Bitcoin mining companies is another major concern. Bitcoin selling activity among mining companies reached historically elevated levels during the third and fourth quarters of this year. At the same time, many mining companies have been shifting their business models toward AI data centers. Under these circumstances, can we realistically expect substantial new liquidity to flow into Bitcoin? At this point, I find it difficult to be confident that it will. Ultimately, Bitcoin needs a new catalyst and a compelling narrative capable of attracting fresh capital. Personally, I believe one of the strongest narratives Bitcoin could have is its role as "Digital Gold." But there has been an interesting shift here as well. One of the companies that most aggressively promoted Bitcoin as digital gold was Strategy. Back in 2022, Strategy frequently emphasized Bitcoin's identity as "Digital Gold." However, beginning in 2025, the company increasingly shifted its messaging toward concepts such as "Credit" and "Digital Capital," rather than emphasizing Bitcoin primarily as digital gold. Think about what that means. Even Strategy, one of the most influential companies capable of driving the digital gold narrative, is now emphasizing a different narrative. And now, with today's confirmation of its exclusion from the MSCI index, uncertainty surrounding the market has increased even further. So let me ask the question again. "Is liquidity in the Bitcoin market actually recovering?" Bitcoin has become far more deeply integrated into the traditional financial system than ever before. Through spot ETFs and growing institutional participation, Bitcoin is increasingly held within the portfolios of traditional financial institutions. As a result, its market behavior has become more closely connected to macroeconomic conditions and movements in traditional financial markets. In other words, Bitcoin is now more exposed to the broader macro environment, not less. Yet today, Bitcoin's internal liquidity remains weak, while external macroeconomic conditions are far from supportive. Under these circumstances, I find it difficult to see how Bitcoin could simply defy the broader macro environment and independently enter a powerful bullish cycle. For Bitcoin to begin a genuine, sustained bull market, new liquidity needs to enter the market. That is the fundamental requirement. And this brings me back to my current assessment. Right now, the priority should be hoping that the market can get through this period without experiencing a major shock. But even if we manage to avoid a significant disruption, unwinding excessive leverage and resolving the current liquidity imbalances could require a much longer period of consolidation and accumulation than many investors expect. If investors are expecting Bitcoin to quickly return to a steep upward trajectory from here, I think they may be setting themselves up for considerable disappointment. This is also why I intend to approach my next Bitcoin purchases with a much longer time horizon. Rather than rushing back into the market, I want to carefully assess how liquidity conditions develop and whether the market has gone through a sufficient accumulation process. I understand that my current outlook may sound pessimistic, or even discouraging. But the purpose of market analysis is not to consistently deliver an optimistic outlook. It is to objectively assess the environment we are operating in and develop an investment strategy that reflects those conditions. I simply do not believe this is the right time to approach the Bitcoin market aggressively. There is no need to rush. For now, I believe patience is more important than chasing a potential rebound. I would rather wait for liquidity to recover, allow the market enough time to accumulate, and position myself when a more favorable opportunity emerges.

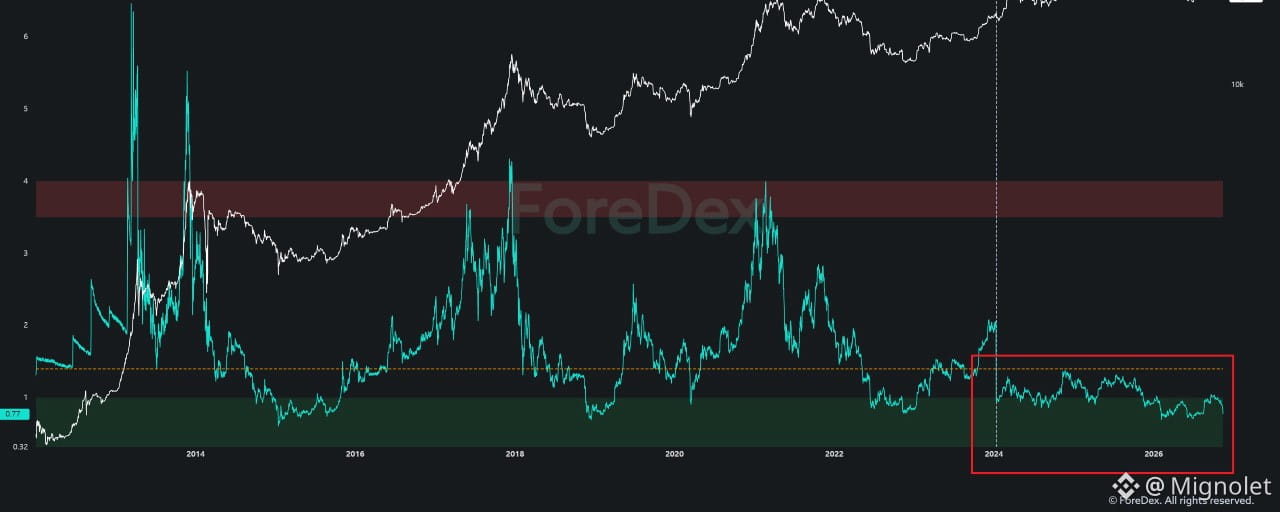
Bitcoin’s Liquidity Crisis: Why the Market Still Needs More Time

Today, I want to take a step back and examine the Bitcoin market from a macroeconomic perspective.
It may be a relatively conventional approach, but given the severe liquidity constraints currently facing Bitcoin, I believe it's important to revisit the broader macro environment.
Let me start with my conclusion.
"The Bitcoin market has still not gone through sufficient accumulation, and liquidity conditions continue to deteriorate. At this point, we can only hope the market avoids a major shock. Even if it does, a much longer period of sideways consolidation may be necessary than many expect."
As I've repeatedly discussed in my previous analyses, Bitcoin's internal liquidity conditions are extremely concerning.
Buy-side liquidity continues to weaken, and the market is experiencing a significant liquidity squeeze.
Against this backdrop, I want to examine the relationship between the U.S. dollar and Bitcoin's market cycles.
This may be familiar territory for anyone who has spent some time studying financial markets.
Generally speaking, the U.S. dollar is closely tied to global liquidity conditions.
Looking back at Bitcoin's historical cycles, we have never seen Bitcoin sustain a full-fledged bull market while the dollar was in a strong upward trend.
The bearish cycle that began in 2025 has not been particularly different in this regard.
But that brings us to the most important question.
"Are we really at the point where the U.S. dollar is about to enter a sustained downtrend?"
To me, this is one of the most critical questions when assessing the current market.
Let's look at the historical cycles objectively.
In previous cycles, Bitcoin went through a prolonged bear market before entering a major bullish phase as the U.S. dollar began a sustained decline.
(Image 1, green boxes)
But the current situation is fundamentally different.
Rather than entering a downtrend, the dollar is showing signs of establishing a strong upward trend.
(Image 1, red box)
This is the most important difference between previous bullish cycles and the market environment we face today.
Now, take a look at Image 2.
The U.S. dollar has broken above a trading range that had been forming for more than 500 days.
There is something I frequently emphasize in my market analysis:
"Once a trend is established, it rarely reverses easily."
This is because of trend persistence.
And this is not a trend that developed over a few weeks or months.
We are looking at a breakout from a consolidation range that lasted more than 500 days.
That makes this development particularly important.
Even if the dollar eventually reverses and begins declining again, the process could take considerably longer than many investors anticipate.
We also need to consider the broader macroeconomic environment.
Interest rate hikes began in the third quarter of this year, while the political and economic environment surrounding the U.S. midterm elections has hardly been favorable for the crypto market.
Meanwhile, selling pressure from Bitcoin mining companies is another major concern.
Bitcoin selling activity among mining companies reached historically elevated levels during the third and fourth quarters of this year.
At the same time, many mining companies have been shifting their business models toward AI data centers.
Under these circumstances, can we realistically expect substantial new liquidity to flow into Bitcoin?
At this point, I find it difficult to be confident that it will.
Ultimately, Bitcoin needs a new catalyst and a compelling narrative capable of attracting fresh capital.
Personally, I believe one of the strongest narratives Bitcoin could have is its role as "Digital Gold."
But there has been an interesting shift here as well.
One of the companies that most aggressively promoted Bitcoin as digital gold was Strategy.
Back in 2022, Strategy frequently emphasized Bitcoin's identity as "Digital Gold."
However, beginning in 2025, the company increasingly shifted its messaging toward concepts such as "Credit" and "Digital Capital," rather than emphasizing Bitcoin primarily as digital gold.
Think about what that means.
Even Strategy, one of the most influential companies capable of driving the digital gold narrative, is now emphasizing a different narrative.
And now, with today's confirmation of its exclusion from the MSCI index, uncertainty surrounding the market has increased even further.
So let me ask the question again.
"Is liquidity in the Bitcoin market actually recovering?"
Bitcoin has become far more deeply integrated into the traditional financial system than ever before.
Through spot ETFs and growing institutional participation, Bitcoin is increasingly held within the portfolios of traditional financial institutions.
As a result, its market behavior has become more closely connected to macroeconomic conditions and movements in traditional financial markets.
In other words, Bitcoin is now more exposed to the broader macro environment, not less.
Yet today, Bitcoin's internal liquidity remains weak, while external macroeconomic conditions are far from supportive.
Under these circumstances, I find it difficult to see how Bitcoin could simply defy the broader macro environment and independently enter a powerful bullish cycle.
For Bitcoin to begin a genuine, sustained bull market, new liquidity needs to enter the market.
That is the fundamental requirement.
And this brings me back to my current assessment.
Right now, the priority should be hoping that the market can get through this period without experiencing a major shock.
But even if we manage to avoid a significant disruption, unwinding excessive leverage and resolving the current liquidity imbalances could require a much longer period of consolidation and accumulation than many investors expect.
If investors are expecting Bitcoin to quickly return to a steep upward trajectory from here, I think they may be setting themselves up for considerable disappointment.
This is also why I intend to approach my next Bitcoin purchases with a much longer time horizon.
Rather than rushing back into the market, I want to carefully assess how liquidity conditions develop and whether the market has gone through a sufficient accumulation process.
I understand that my current outlook may sound pessimistic, or even discouraging.
But the purpose of market analysis is not to consistently deliver an optimistic outlook.
It is to objectively assess the environment we are operating in and develop an investment strategy that reflects those conditions.
I simply do not believe this is the right time to approach the Bitcoin market aggressively.
There is no need to rush.
For now, I believe patience is more important than chasing a potential rebound.
I would rather wait for liquidity to recover, allow the market enough time to accumulate, and position myself when a more favorable opportunity emerges.
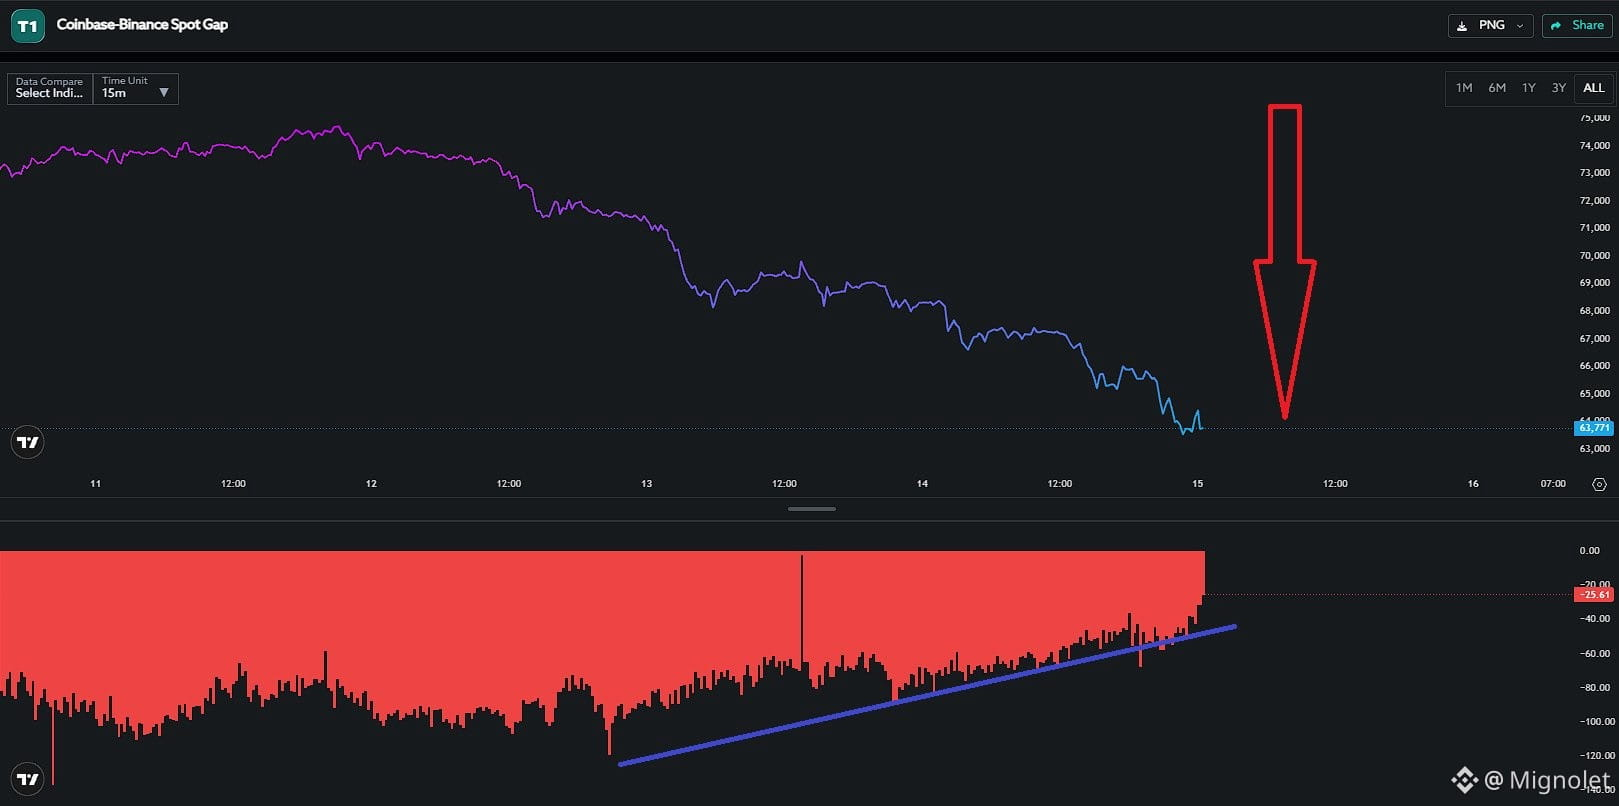
Looking at "CeFi and DeFi Leverage Liquidity" on a weekly basis, the underlying liquidity trends become much clearer. These represent aggressive capital flows driven by leverage. However, historically, market conditions have not tended to develop favorably following periods of aggressive inflows of this kind. 📊 CeFi Leverage Liquidity has reached its highest weekly level since December 2021. 📊 DeFi Leverage Liquidity has also reached its highest weekly level since late July of last year. Even if the market manages to absorb the impact of these liquidity flows, unwinding excessive leverage and allowing the market to cool down could take considerably longer than expected.
Looking at "CeFi and DeFi Leverage Liquidity" on a weekly basis, the underlying liquidity trends become much clearer.

These represent aggressive capital flows driven by leverage.

However, historically, market conditions have not tended to develop favorably following periods of aggressive inflows of this kind.

📊 CeFi Leverage Liquidity has reached its highest weekly level since December 2021.

📊 DeFi Leverage Liquidity has also reached its highest weekly level since late July of last year.

Even if the market manages to absorb the impact of these liquidity flows, unwinding excessive leverage and allowing the market to cool down could take considerably longer than expected.
Yesterday, signs of large-scale selling activity were detected from institutions using "Cobo Custody" This marks the strongest selling pressure since August 10 of last year. Buying liquidity is weakening across the broader market, and there appears to be insufficient OTC buy-side liquidity to absorb this selling pressure. Looking at the situation objectively, these liquidity flows are far from encouraging.
Yesterday, signs of large-scale selling activity were detected from institutions using "Cobo Custody"

This marks the strongest selling pressure since August 10 of last year.

Buying liquidity is weakening across the broader market, and there appears to be insufficient OTC buy-side liquidity to absorb this selling pressure.

Looking at the situation objectively, these liquidity flows are far from encouraging.
Today, I want to share a concern before it potentially becomes a bigger issue. Binance spot whale liquidity flows have looked increasingly concerning since early October, and the situation continues to deteriorate. What worries me is how closely the current structure resembles 2022. Back then, the brown whale CVD rose alongside Bitcoin's price. But as whale buying pressure weakened, the bearish cycle began. (Image 2, green box) Importantly, Binance spot whale CVD didn't collapse immediately. It moved sideways within a range for some time.(Image 1, red box) The real shock came when that range broke down. That period coincided with the Terra-Luna crisis, followed by Celsius and 3AC. Now, whale buying pressure is weakening sharply again. And today, Bitcoin broke below the lower boundary of a trading range that had formed over roughly a year. If Binance spot whales continue selling, we should consider the possibility of unexpected problems emerging. Aside from the Binance hacking incident, there are no obvious major threats currently visible. But did we know in advance that Terra-Luna, Celsius, and 3AC would collapse in 2022? That's exactly why risk management matters. Since selling all my Bitcoin in late September, I haven't bought back. I don't believe this is the time to rush. Bitcoin's internal liquidity remains weak, while the broader macroeconomic environment is also unfavorable. The U.S. stock market is showing a clear downward trend. If Bitcoin's liquidity were improving strongly despite these conditions, I'd be willing to take an aggressive long position. But that's not what the data shows. With both internal liquidity and external conditions looking weak, unexpected events could trigger broader market stress. Of course, none of this is guaranteed. The market could stabilize without a major incident. But warning signs shouldn't be ignored simply because the risks aren't yet visible. I'll continue taking a longer-term perspective and closely monitoring Binance spot whale CVD throughout November.
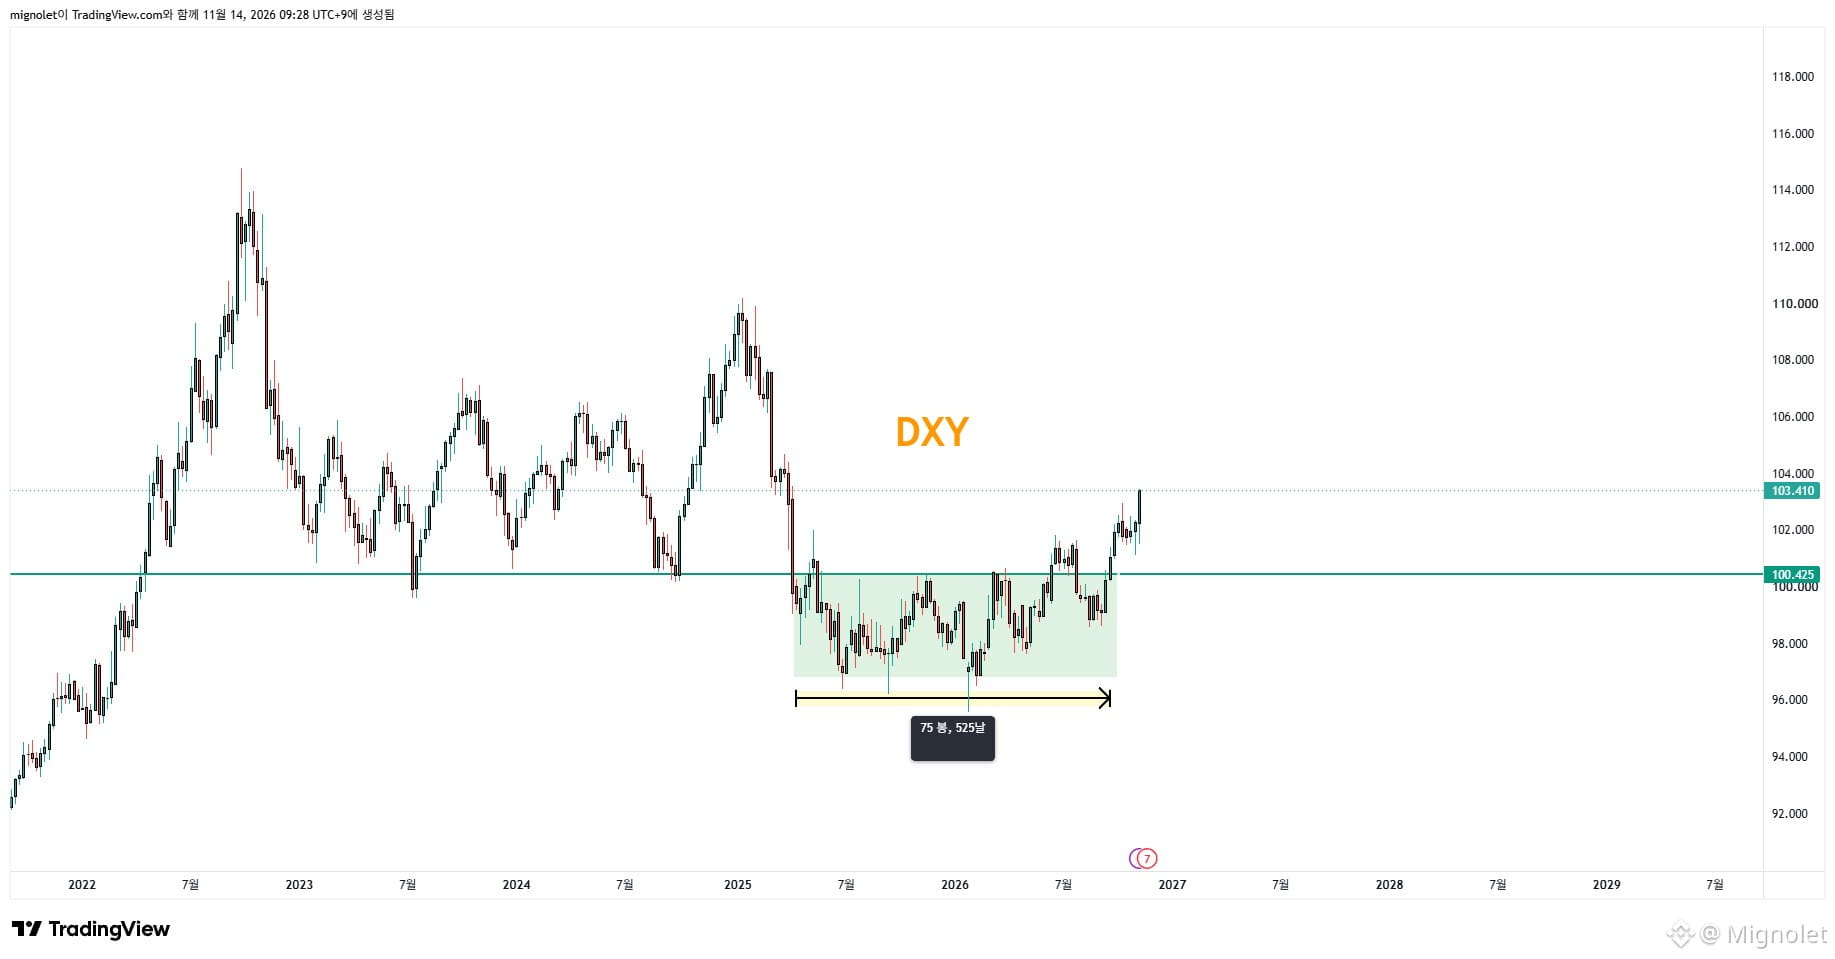
Today, I want to share a concern before it potentially becomes a bigger issue.

Binance spot whale liquidity flows have looked increasingly concerning since early October, and the situation continues to deteriorate.

What worries me is how closely the current structure resembles 2022.
Back then, the brown whale CVD rose alongside Bitcoin's price. But as whale buying pressure weakened, the bearish cycle began.
(Image 2, green box)

Importantly, Binance spot whale CVD didn't collapse immediately. It moved sideways within a range for some time.(Image 1, red box)

The real shock came when that range broke down.
That period coincided with the Terra-Luna crisis, followed by Celsius and 3AC.

Now, whale buying pressure is weakening sharply again.
And today, Bitcoin broke below the lower boundary of a trading range that had formed over roughly a year.
If Binance spot whales continue selling, we should consider the possibility of unexpected problems emerging.
Aside from the Binance hacking incident, there are no obvious major threats currently visible.
But did we know in advance that Terra-Luna, Celsius, and 3AC would collapse in 2022?

That's exactly why risk management matters.
Since selling all my Bitcoin in late September, I haven't bought back. I don't believe this is the time to rush.
Bitcoin's internal liquidity remains weak, while the broader macroeconomic environment is also unfavorable.

The U.S. stock market is showing a clear downward trend.
If Bitcoin's liquidity were improving strongly despite these conditions, I'd be willing to take an aggressive long position.
But that's not what the data shows.

With both internal liquidity and external conditions looking weak, unexpected events could trigger broader market stress.
Of course, none of this is guaranteed. The market could stabilize without a major incident.

But warning signs shouldn't be ignored simply because the risks aren't yet visible.
I'll continue taking a longer-term perspective and closely monitoring Binance spot whale CVD throughout November.
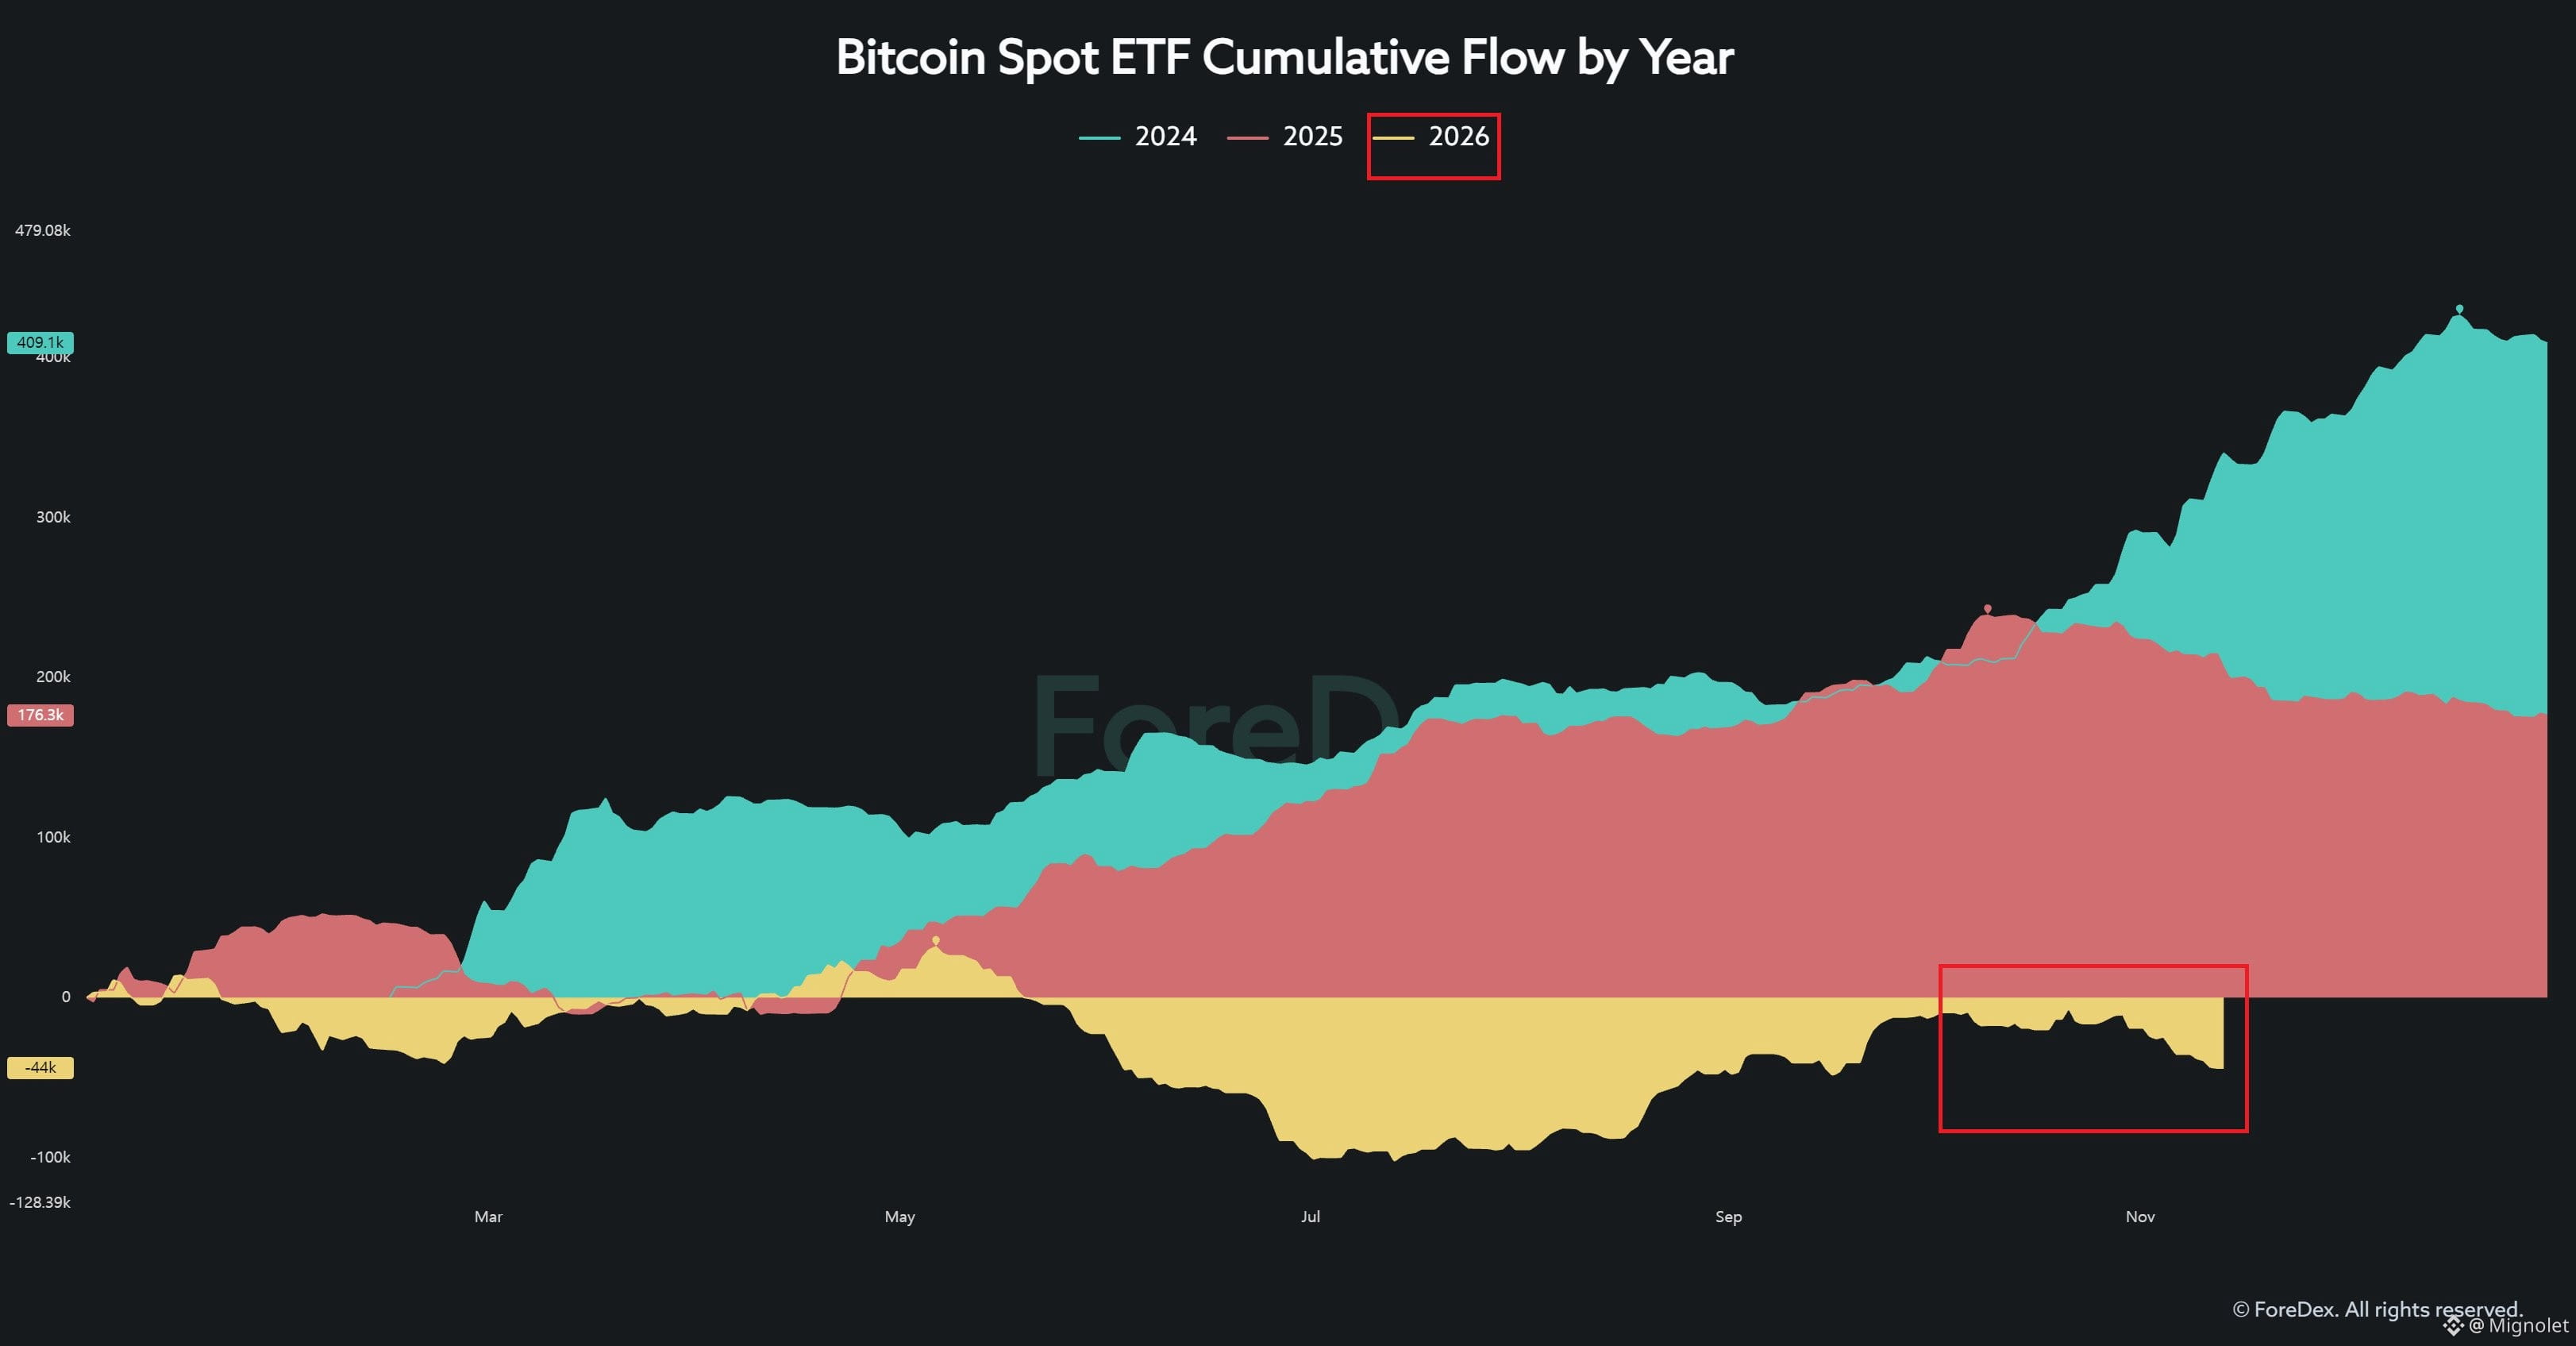
Nothing in investing is 100% certain. There will always be indicators and strategies that seem almost magical because of their high accuracy. But even the best strategy can fail. Those who understand this accept that they can be wrong, build their own framework, and follow it consistently. Consistency is everything. Others may watch a strategy work nine times in a row and start thinking: "What if I had used 10x or 100x leverage?" "What if I had borrowed as much as possible?" That's when greed takes over. They abandon their principles, take excessive risks, and lose everything on the one trade that goes wrong. But the strategy itself may still be highly effective. Someone who follows their rules can keep losses manageable. Someone who abandons them can lose everything. Then comes regret. They blame the strategy, find another indicator, follow another analyst, and repeat the same mistakes. Eventually, they lose confidence in their own judgment. Even when their analysis is correct, they hesitate. Later, they think: "If only I had bought..." "If only I had sold..." Those regrets create a desire to make up for missed opportunities, often leading to even bigger mistakes. The same happens with investment styles. During bull markets, people chase leverage and altcoin profits. During bear markets, they switch to shorting. When those fail, they decide long-term investing or DCA must be the answer. But when the market rallies again, those approaches suddenly feel too slow. And the cycle repeats. There is no perfect strategy or single right answer. Some excel at short-term trading, others at trend following or long-term investing. What matters is finding what works for you and having the discipline to follow it consistently. Don't let greed, emotions, or other people's profits dictate your decisions. A truly skilled investor isn't someone who's always right. It's someone who accepts being wrong, manages risk, and sticks to their principles.
Nothing in investing is 100% certain.
There will always be indicators and strategies that seem almost magical because of their high accuracy. But even the best strategy can fail.

Those who understand this accept that they can be wrong, build their own framework, and follow it consistently.
Consistency is everything.
Others may watch a strategy work nine times in a row and start thinking:

"What if I had used 10x or 100x leverage?"
"What if I had borrowed as much as possible?"

That's when greed takes over.

They abandon their principles, take excessive risks, and lose everything on the one trade that goes wrong.
But the strategy itself may still be highly effective.
Someone who follows their rules can keep losses manageable. Someone who abandons them can lose everything.
Then comes regret.
They blame the strategy, find another indicator, follow another analyst, and repeat the same mistakes.
Eventually, they lose confidence in their own judgment.
Even when their analysis is correct, they hesitate.

Later, they think:
"If only I had bought..."
"If only I had sold..."

Those regrets create a desire to make up for missed opportunities, often leading to even bigger mistakes.
The same happens with investment styles.
During bull markets, people chase leverage and altcoin profits. During bear markets, they switch to shorting.
When those fail, they decide long-term investing or DCA must be the answer.
But when the market rallies again, those approaches suddenly feel too slow.
And the cycle repeats.

There is no perfect strategy or single right answer.
Some excel at short-term trading, others at trend following or long-term investing.
What matters is finding what works for you and having the discipline to follow it consistently.
Don't let greed, emotions, or other people's profits dictate your decisions.
A truly skilled investor isn't someone who's always right. It's someone who accepts being wrong, manages risk, and sticks to their principles.
As I mentioned yesterday, after the midterm election results came out, I actually think it would have been better if Bitcoin had moved quickly in the direction the market had already established as the obvious outcome. But when we see another uncertain rally like this, people start reinterpreting or reshaping existing narratives to fit the price action, creating fresh bullish expectations. In the end, investors keep going through cycles of hope and disappointment, making the market increasingly difficult to navigate. And now, we're also seeing a sharp decline in the U.S. stock market. There's something I've been emphasizing for a while. If Bitcoin had already gone through a sufficient accumulation phase before starting its major rally, I think the upward momentum would have been much stronger, with a faster and steeper rise. And if I had seen that kind of market structure, I wouldn't have sold all my Bitcoin at the end of September. However, based on my own analytical framework, I still believe the market needs more time for accumulation. That's why, even if Bitcoin experiences another significant drop, I think it could take much longer than many expect for the market to establish a meaningful bottom and transition back into an uptrend. On top of that, the broader macro environment, U.S. equities, and the political landscape don't look particularly favorable right now. Given these conditions, I don't think this is the time to rush into decisions or feel pressured to act quickly. The more complicated and uncertain the market becomes, the more important it is to stick to your own analytical framework and wait patiently. When you become impatient, your judgment can easily get clouded. And decisions driven by impatience often lead to poor outcomes.
As I mentioned yesterday, after the midterm election results came out, I actually think it would have been better if Bitcoin had moved quickly in the direction the market had already established as the obvious outcome.

But when we see another uncertain rally like this, people start reinterpreting or reshaping existing narratives to fit the price action, creating fresh bullish expectations.

In the end, investors keep going through cycles of hope and disappointment, making the market increasingly difficult to navigate.

And now, we're also seeing a sharp decline in the U.S. stock market.

There's something I've been emphasizing for a while.

If Bitcoin had already gone through a sufficient accumulation phase before starting its major rally, I think the upward momentum would have been much stronger, with a faster and steeper rise.

And if I had seen that kind of market structure, I wouldn't have sold all my Bitcoin at the end of September.

However, based on my own analytical framework, I still believe the market needs more time for accumulation.

That's why, even if Bitcoin experiences another significant drop, I think it could take much longer than many expect for the market to establish a meaningful bottom and transition back into an uptrend.

On top of that, the broader macro environment, U.S. equities, and the political landscape don't look particularly favorable right now.

Given these conditions, I don't think this is the time to rush into decisions or feel pressured to act quickly.

The more complicated and uncertain the market becomes, the more important it is to stick to your own analytical framework and wait patiently.

When you become impatient, your judgment can easily get clouded. And decisions driven by impatience often lead to poor outcomes.
Mignolet
·
--
The midterm election results weren't ambiguous. The outcome was clear, and Trump accepted it.

Looking at this from my perspective, as someone who still believes the Bitcoin market needs sufficient time for accumulation, I actually think a sharp drop in Bitcoin's price would have been better if market makers were going to use the midterm elections as a catalyst.

Why?

Because the market had already established a clear narrative about how Bitcoin should react depending on which party won the midterm elections.

If Bitcoin had dropped sharply in line with that narrative, it could have quickly shaken investor sentiment and potentially accelerated the process of finding a market bottom.

But instead, we're seeing short-term bullish expectations building again while Bitcoin is still stuck in an uncertain price range.

I think this could actually make things more complicated.

As investors go through repeated cycles of hope and disappointment, market uncertainty could persist, and the accumulation phase may end up taking even longer than expected.
The midterm election results weren't ambiguous. The outcome was clear, and Trump accepted it. Looking at this from my perspective, as someone who still believes the Bitcoin market needs sufficient time for accumulation, I actually think a sharp drop in Bitcoin's price would have been better if market makers were going to use the midterm elections as a catalyst. Why? Because the market had already established a clear narrative about how Bitcoin should react depending on which party won the midterm elections. If Bitcoin had dropped sharply in line with that narrative, it could have quickly shaken investor sentiment and potentially accelerated the process of finding a market bottom. But instead, we're seeing short-term bullish expectations building again while Bitcoin is still stuck in an uncertain price range. I think this could actually make things more complicated. As investors go through repeated cycles of hope and disappointment, market uncertainty could persist, and the accumulation phase may end up taking even longer than expected.
The midterm election results weren't ambiguous. The outcome was clear, and Trump accepted it.

Looking at this from my perspective, as someone who still believes the Bitcoin market needs sufficient time for accumulation, I actually think a sharp drop in Bitcoin's price would have been better if market makers were going to use the midterm elections as a catalyst.

Why?

Because the market had already established a clear narrative about how Bitcoin should react depending on which party won the midterm elections.

If Bitcoin had dropped sharply in line with that narrative, it could have quickly shaken investor sentiment and potentially accelerated the process of finding a market bottom.

But instead, we're seeing short-term bullish expectations building again while Bitcoin is still stuck in an uncertain price range.

I think this could actually make things more complicated.

As investors go through repeated cycles of hope and disappointment, market uncertainty could persist, and the accumulation phase may end up taking even longer than expected.
Mignolet
·
--
If Bitcoin always moved the way most retail investors expected based on major events and their potential outcomes, there wouldn't be much reason to analyze Bitcoin's on-chain data or liquidity flows.

It would actually make more sense to focus on predicting the outcomes of major events.

But that's not how the market really works.

In reality, price often moves first, and the narrative follows.

When the price moves as expected, analysts can simply use their original reasoning to explain what happened.

But when the price moves in the opposite direction, they can always find another reason to explain it and make the narrative fit.

"No matter which direction the market moves, there's always a convincing story to explain it afterward."

The real problem is that investors keep getting caught up in these narratives.

Without a clear framework of your own, you'll constantly be influenced by whatever story the market is telling at the time.

And when the most important moments arrive, you'll hesitate instead of taking action.

You end up missing opportunities or making poor decisions.

Then comes regret.

That regret turns into a desire to make up for what you missed or lost. That desire becomes greed, and greed eventually leads to another major mistake.

And the same cycle keeps repeating.

That's why I think it's far more important to focus on how major market players react to these events and how capital and liquidity actually move, rather than getting too caught up in the events themselves.

Above all, you need to build your own clear investment framework and act consistently based on it.

Even if your decision turns out to be wrong, that's okay.

If you followed a clear framework, you can look back, understand what went wrong, and use that experience to make better decisions next time.

Don't let market narratives dictate your decisions. Build your own framework, trust your analysis, and act accordingly.

If Bitcoin always moved the way most retail investors expected based on major events and their potential outcomes, there wouldn't be much reason to analyze Bitcoin's on-chain data or liquidity flows. It would actually make more sense to focus on predicting the outcomes of major events. But that's not how the market really works. In reality, price often moves first, and the narrative follows. When the price moves as expected, analysts can simply use their original reasoning to explain what happened. But when the price moves in the opposite direction, they can always find another reason to explain it and make the narrative fit. "No matter which direction the market moves, there's always a convincing story to explain it afterward." The real problem is that investors keep getting caught up in these narratives. Without a clear framework of your own, you'll constantly be influenced by whatever story the market is telling at the time. And when the most important moments arrive, you'll hesitate instead of taking action. You end up missing opportunities or making poor decisions. Then comes regret. That regret turns into a desire to make up for what you missed or lost. That desire becomes greed, and greed eventually leads to another major mistake. And the same cycle keeps repeating. That's why I think it's far more important to focus on how major market players react to these events and how capital and liquidity actually move, rather than getting too caught up in the events themselves. Above all, you need to build your own clear investment framework and act consistently based on it. Even if your decision turns out to be wrong, that's okay. If you followed a clear framework, you can look back, understand what went wrong, and use that experience to make better decisions next time. Don't let market narratives dictate your decisions. Build your own framework, trust your analysis, and act accordingly.
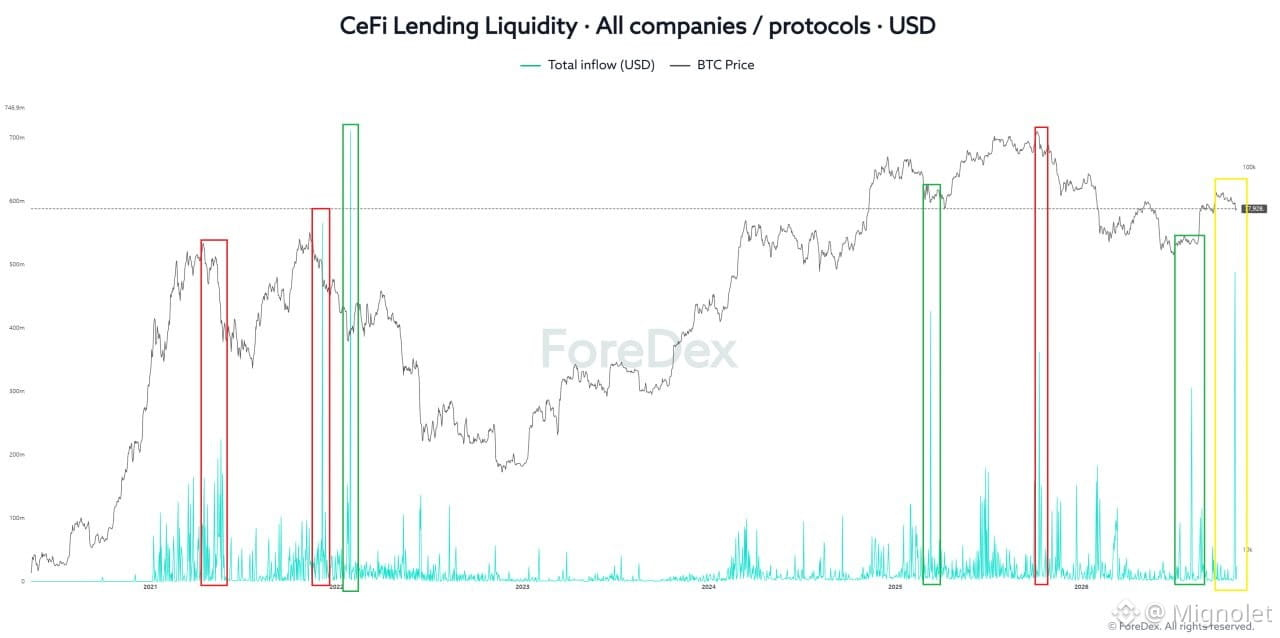
If Bitcoin always moved the way most retail investors expected based on major events and their potential outcomes, there wouldn't be much reason to analyze Bitcoin's on-chain data or liquidity flows.

It would actually make more sense to focus on predicting the outcomes of major events.

But that's not how the market really works.

In reality, price often moves first, and the narrative follows.

When the price moves as expected, analysts can simply use their original reasoning to explain what happened.

But when the price moves in the opposite direction, they can always find another reason to explain it and make the narrative fit.

"No matter which direction the market moves, there's always a convincing story to explain it afterward."

The real problem is that investors keep getting caught up in these narratives.

Without a clear framework of your own, you'll constantly be influenced by whatever story the market is telling at the time.

And when the most important moments arrive, you'll hesitate instead of taking action.

You end up missing opportunities or making poor decisions.

Then comes regret.

That regret turns into a desire to make up for what you missed or lost. That desire becomes greed, and greed eventually leads to another major mistake.

And the same cycle keeps repeating.

That's why I think it's far more important to focus on how major market players react to these events and how capital and liquidity actually move, rather than getting too caught up in the events themselves.

Above all, you need to build your own clear investment framework and act consistently based on it.

Even if your decision turns out to be wrong, that's okay.

If you followed a clear framework, you can look back, understand what went wrong, and use that experience to make better decisions next time.

Don't let market narratives dictate your decisions. Build your own framework, trust your analysis, and act accordingly.
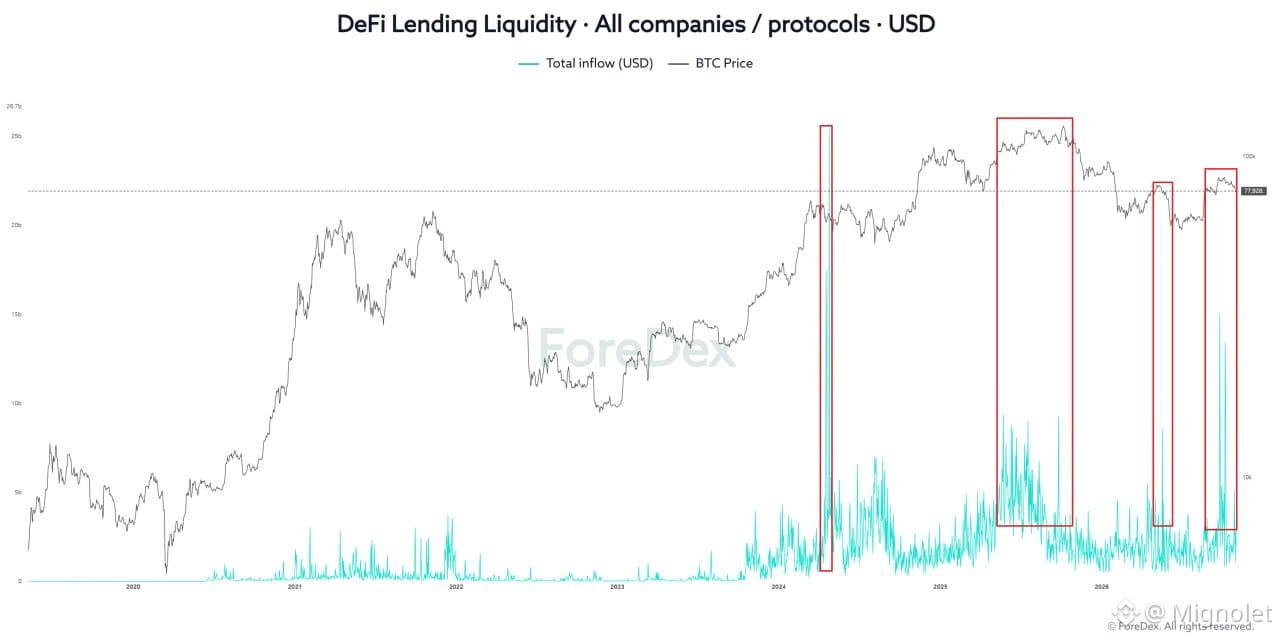
🤝ForeDex has officially signed an MOU with the Blockchain Research Institute at Hansung University! Through this partnership, we'll work together on research and technical collaboration to improve the accuracy and reliability of on-chain data. 🔍In particular, we'll focus on on-chain address labeling, developing better ways to identify and classify blockchain transactions and wallet addresses. We'll also cross-validate our datasets to improve analytical accuracy and overall data quality. 🚀ForeDex is still an early-stage startup, but we're steadily growing and strengthening our technology and data capabilities. We hope you'll continue to follow our journey! Our goal is to become a trusted on-chain data provider that more people can confidently rely on. Thank you for your continued support! 🙏
🤝ForeDex has officially signed an MOU with the Blockchain Research Institute at Hansung University!

Through this partnership, we'll work together on research and technical collaboration to improve the accuracy and reliability of on-chain data.

🔍In particular, we'll focus on on-chain address labeling, developing better ways to identify and classify blockchain transactions and wallet addresses.

We'll also cross-validate our datasets to improve analytical accuracy and overall data quality.

🚀ForeDex is still an early-stage startup, but we're steadily growing and strengthening our technology and data capabilities.

We hope you'll continue to follow our journey!

Our goal is to become a trusted on-chain data provider that more people can confidently rely on.

Thank you for your continued support! 🙏
·
--
1. CeFi Lending Liquidity This data tracks leveraged liquidity, mainly from institutional investors. Rather than predicting price direction, it's more useful for identifying potential increases in market volatility. Last week, we saw a sharp spike for the first time in about 3 months. The question is, which direction will the next big move be? 2. DeFi Lending Liquidity This data tracks leveraged liquidity in DeFi lending markets, where retail investors tend to be more active. Unlike CeFi, a sharp increase in DeFi Lending Liquidity can be a useful signal of market overheating. This indicator also spiked last week for the first time in about 3 months. And I don't think the current data trend looks positive. Both "CeFi Lending Liquidity" and "DeFi Lending Liquidity" will officially launch on ForeDex today or tomorrow. We'll share the official announcement on https://foredex.io/
1. CeFi Lending Liquidity

This data tracks leveraged liquidity, mainly from institutional investors.

Rather than predicting price direction, it's more useful for identifying potential increases in market volatility.

Last week, we saw a sharp spike for the first time in about 3 months.

The question is, which direction will the next big move be?

2. DeFi Lending Liquidity

This data tracks leveraged liquidity in DeFi lending markets, where retail investors tend to be more active.

Unlike CeFi, a sharp increase in DeFi Lending Liquidity can be a useful signal of market overheating.

This indicator also spiked last week for the first time in about 3 months.

And I don't think the current data trend looks positive.

Both "CeFi Lending Liquidity" and "DeFi Lending Liquidity" will officially launch on ForeDex today or tomorrow.

We'll share the official announcement on
https://foredex.io/
Voting for THE BLOCKCHAIN 100 2026 has officially ended! I hope we get a great result! Going forward, I'll be more active on Binance Square alongside X, sharing more market analysis and insights. Looking forward to connecting with more of you here! Thanks for all your support! 🙏 X : https://x.com/mignoletkr
Voting for THE BLOCKCHAIN 100 2026 has officially ended!
I hope we get a great result!
Going forward, I'll be more active on Binance Square alongside X, sharing more market analysis and insights.
Looking forward to connecting with more of you here!
Thanks for all your support! 🙏

X : https://x.com/mignoletkr
Log in to explore more content
Join global crypto users on Binance Square
⚡️ Get latest and useful information about crypto.
💬 Trusted by the world’s largest crypto exchange.
👍 Discover real insights from verified creators.
Email / Phone number
Sitemap
Cookie Preferences
Platform T&Cs