

Mi_Trade
183 Posts

Mi_Trade
Report
Block User
9 Following
8 Followers
7 Liked
Posts
All
Videos
·
--
I’m paying attention to $TAIKO khi the price increased by more than 22% in the past 24 hours and is approaching the resistance zone at 0.11555. A notable point is that trading volume has surged to 1301%, along with Open Interest rising sharply by 47.27% within just 1 hour. The RSI on the 15-minute timeframe has already reached 94.3, indicating very high bullish momentum but also comes with oversold risk. Long positions are currently dominant at 74.1%. I’m not rushing to chase a trade at this point; I’ll observe whether the price can break through and hold above the resistance zone.
#TAIKO #BinanceSquare #Crypto
I’m paying attention to $TAIKO khi the price increased by more than 22% in the past 24 hours and is approaching the resistance zone at 0.11555. A notable point is that trading volume has surged to 1301%, along with Open Interest rising sharply by 47.27% within just 1 hour. The RSI on the 15-minute timeframe has already reached 94.3, indicating very high bullish momentum but also comes with oversold risk. Long positions are currently dominant at 74.1%. I’m not rushing to chase a trade at this point; I’ll observe whether the price can break through and hold above the resistance zone.
#TAIKO #BinanceSquare #Crypto
#TAIKO #BinanceSquare #Crypto
6
·
--
Seeing $DASH đ is surging by more than 13% over the past 24 hours may make many brothers think about chasing the momentum. But taking a closer look at the data, trading volume is actually decreasing by about 24.6% compared to earlier. In addition, RSI 14 at 45.2 and the MACD are slightly leaning toward a downward bias, suggesting the uptrend may not be strongly confirmed by volume. The current price is around 71.23, sitting between support at 70.12 and resistance at 73.66. In this section, I’m not rushing into FOMO because the volume hasn’t clearly supported a breakout momentum.
#DASH #Crypto #Trading
Seeing $DASH đ is surging by more than 13% over the past 24 hours may make many brothers think about chasing the momentum. But taking a closer look at the data, trading volume is actually decreasing by about 24.6% compared to earlier. In addition, RSI 14 at 45.2 and the MACD are slightly leaning toward a downward bias, suggesting the uptrend may not be strongly confirmed by volume. The current price is around 71.23, sitting between support at 70.12 and resistance at 73.66. In this section, I’m not rushing into FOMO because the volume hasn’t clearly supported a breakout momentum.
#DASH #Crypto #Trading
#DASH #Crypto #Trading
1
45
·
--
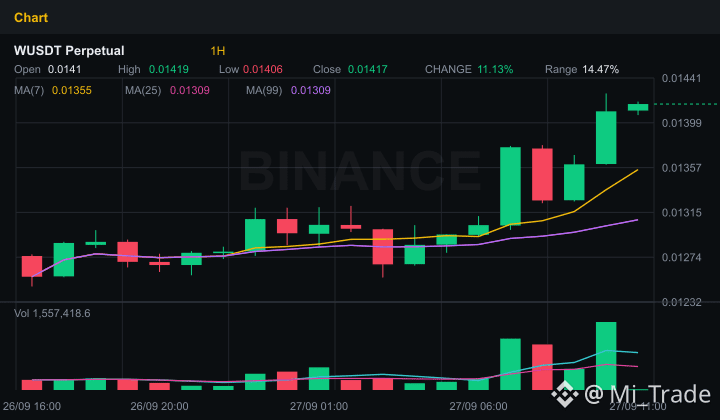
I'm paying attention to $W k as the price increased by 15.04% over the past 24 hours to 0.014111. The interesting part is that trading volume jumped 106.3%, alongside a strong 12.02% increase in open interest within just 1 hour, indicating that capital is flowing in quite aggressively in the short term. However, the RSI 14 has risen to 72.8 and the price is approaching the resistance zone at 0.014265. The global long-short ratio is 1.58, but the taker buy/sell ratio is currently leaning toward selling at 0.71. In this segment, I'm not in a hurry to FOMO yet and will observe whether the price can break through the resistance area.
#$W #BinanceSquare #Crypto
I'm paying attention to $W k as the price increased by 15.04% over the past 24 hours to 0.014111. The interesting part is that trading volume jumped 106.3%, alongside a strong 12.02% increase in open interest within just 1 hour, indicating that capital is flowing in quite aggressively in the short term. However, the RSI 14 has risen to 72.8 and the price is approaching the resistance zone at 0.014265. The global long-short ratio is 1.58, but the taker buy/sell ratio is currently leaning toward selling at 0.71. In this segment, I'm not in a hurry to FOMO yet and will observe whether the price can break through the resistance area.
#$W #BinanceSquare #Crypto
#$W #BinanceSquare #Crypto
14
·
--
The combination of artificial intelligence (AI) and Bitcoin is becoming the focus of discussions about future technology trends. Integrating AI into the decentralized finance ecosystem promises to unlock many new possibilities for the market.
👀 Market Watch: $BTC
What do you think about this combination? Could this be the next growth driver for the market?
#Bitcoin #AI
The combination of artificial intelligence (AI) and Bitcoin is becoming the focus of discussions about future technology trends. Integrating AI into the decentralized finance ecosystem promises to unlock many new possibilities for the market.
👀 Market Watch: $BTC
What do you think about this combination? Could this be the next growth driver for the market?
#Bitcoin #AI
👀 Market Watch: $BTC
What do you think about this combination? Could this be the next growth driver for the market?
#Bitcoin #AI
132
·
--
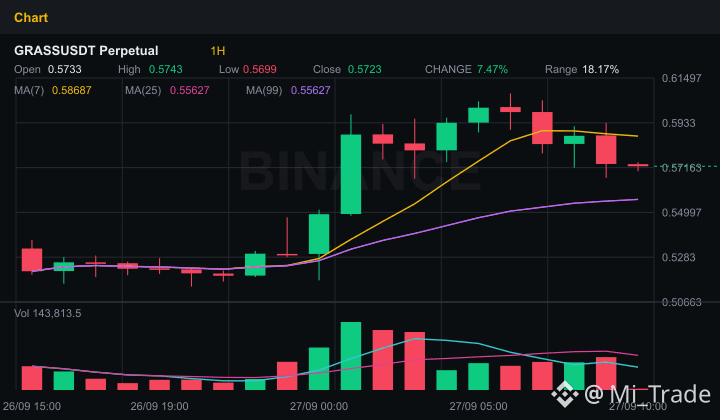
Today $GRASS đ is showing a fairly stable upward momentum, around 14.19%; the price is hovering near 0.5704, but the trading volume has slightly declined by 31.8%. The point I'm paying attention to is that the RSI 14 has slipped back close to the 30.1 zone, and the short-timeframe MACD is still in red, even though the H1 trend before this still maintains a bullish tone. Open Interest also dropped by about 4% over the past hour, suggesting the money flow is pausing in the short term. The support zone at 0.5663 is right at the base—if it breaks through, the structure will likely need time to accumulate again. Resistance above is at 0.6075.
Today $GRASS đ is showing a fairly stable upward momentum, around 14.19%; the price is hovering near 0.5704, but the trading volume has slightly declined by 31.8%. The point I'm paying attention to is that the RSI 14 has slipped back close to the 30.1 zone, and the short-timeframe MACD is still in red, even though the H1 trend before this still maintains a bullish tone. Open Interest also dropped by about 4% over the past hour, suggesting the money flow is pausing in the short term. The support zone at 0.5663 is right at the base—if it breaks through, the structure will likely need time to accumulate again. Resistance above is at 0.6075.
9
·
--
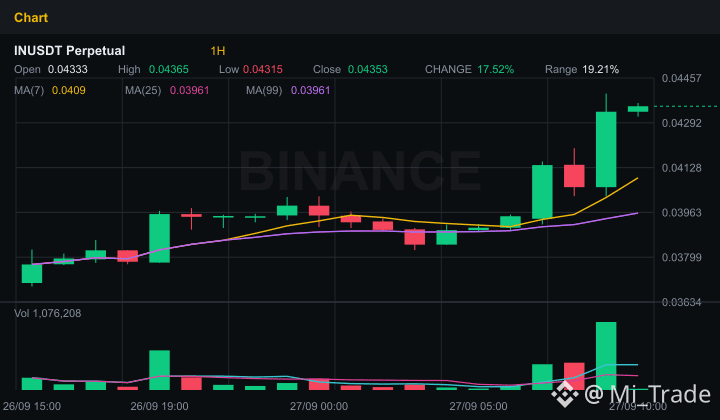
🔥 Alarm $IN: Is the Shark Stockpiling or Trapping a Price Hike? 🔥
The crypto market has never stopped being ruthless, and anyone tracking $IN is definitely sitting on a pile of fire as the price swings tear the roof off minute by minute. Is this an opportunity to get rich, or a perfect liquidity trap?
The latest on-chain and technical data are revealing a surprisingly interesting picture of $IN right now:
• Trend & Momentum: Both the M15 and H1 charts are painted a strong bullish green. However, RSI 14 has surged to 83.7—an extremely overbought zone—suggesting the bulls may run out of steam or need an early “breather.”
• Money Flow & Volume: A sharp volume spike is exploding up to +284.6%, alongside Open Interest rising 4.38% over the past hour. Funds are pouring heavily into the market, showing extremely strong attention from smart money.
• Crowd Sentiment & Sharks: The overall Long/Short ratio is 2.24 (69.2% Long), while the Top Trader also holds 65.3% of positions in buy. The Long side is extremely excited, but be careful of sudden liquidity wipeouts from the sharks.
• Crucial Price Levels: Hard support sits around 0.03825, while an important resistance is capping at 0.044. If this resistance breaks, $IN could have a wide-open runway ahead.
Right now, absolutely don’t FOMO and chase the top no matter what. Stay disciplined, set clear take-profit/stop-loss levels under the support zone to protect your account before the big storm sweeps through.
What do you think—will $IN officially break above 0.044, or will there be a deeper shakeout before it launches higher? Leave a comment below!
#BinanceSquare #TechnicalAnalysis
🔥 Alarm $IN : Is the Shark Stockpiling or Trapping a Price Hike? 🔥
The crypto market has never stopped being ruthless, and anyone tracking $IN is definitely sitting on a pile of fire as the price swings tear the roof off minute by minute. Is this an opportunity to get rich, or a perfect liquidity trap?
The latest on-chain and technical data are revealing a surprisingly interesting picture of $IN right now:
• Trend & Momentum: Both the M15 and H1 charts are painted a strong bullish green. However, RSI 14 has surged to 83.7—an extremely overbought zone—suggesting the bulls may run out of steam or need an early “breather.”
• Money Flow & Volume: A sharp volume spike is exploding up to +284.6%, alongside Open Interest rising 4.38% over the past hour. Funds are pouring heavily into the market, showing extremely strong attention from smart money.
• Crowd Sentiment & Sharks: The overall Long/Short ratio is 2.24 (69.2% Long), while the Top Trader also holds 65.3% of positions in buy. The Long side is extremely excited, but be careful of sudden liquidity wipeouts from the sharks.
• Crucial Price Levels: Hard support sits around 0.03825, while an important resistance is capping at 0.044. If this resistance breaks, $IN could have a wide-open runway ahead.
Right now, absolutely don’t FOMO and chase the top no matter what. Stay disciplined, set clear take-profit/stop-loss levels under the support zone to protect your account before the big storm sweeps through.
What do you think—will $IN officially break above 0.044, or will there be a deeper shakeout before it launches higher? Leave a comment below!
#BinanceSquare #TechnicalAnalysis
The crypto market has never stopped being ruthless, and anyone tracking $IN is definitely sitting on a pile of fire as the price swings tear the roof off minute by minute. Is this an opportunity to get rich, or a perfect liquidity trap?
The latest on-chain and technical data are revealing a surprisingly interesting picture of $IN right now:
• Trend & Momentum: Both the M15 and H1 charts are painted a strong bullish green. However, RSI 14 has surged to 83.7—an extremely overbought zone—suggesting the bulls may run out of steam or need an early “breather.”
• Money Flow & Volume: A sharp volume spike is exploding up to +284.6%, alongside Open Interest rising 4.38% over the past hour. Funds are pouring heavily into the market, showing extremely strong attention from smart money.
• Crowd Sentiment & Sharks: The overall Long/Short ratio is 2.24 (69.2% Long), while the Top Trader also holds 65.3% of positions in buy. The Long side is extremely excited, but be careful of sudden liquidity wipeouts from the sharks.
• Crucial Price Levels: Hard support sits around 0.03825, while an important resistance is capping at 0.044. If this resistance breaks, $IN could have a wide-open runway ahead.
Right now, absolutely don’t FOMO and chase the top no matter what. Stay disciplined, set clear take-profit/stop-loss levels under the support zone to protect your account before the big storm sweeps through.
What do you think—will $IN officially break above 0.044, or will there be a deeper shakeout before it launches higher? Leave a comment below!
#BinanceSquare #TechnicalAnalysis
48
·
--
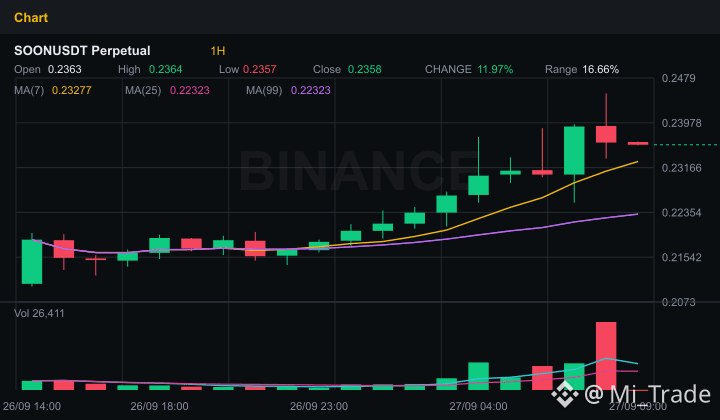
🚨 Breakout Signal $SOON : Is the “bull camp” secretly accumulating inventory or preparing a liquidity sweep?
The crypto market is never short of surprises, and the current focus is gathering around $SOON as money begins to move in extremely suspicious ways.
Looking at the current technical picture of $SOON, traders on Binance Square should pay special attention to the following bright and dark points:
- Main trend: Both the M15 and H1 timeframes are in strong green alignment with a powerful bullish structure, showing that the buyers are still firmly holding the steering wheel.
- Momentum: RSI at 57.1—an area that’s neutral but leaning toward bullish strength—combined with MACD supporting the uptrend. There’s no overbought condition, meaning there’s still room for the bulls to flex.
- Liquidity & Volume: Trading volume surged by 13.8%, indicating real interest from “smart money” rather than just a fake pump.
- Open Interest (OI) position: Slightly down 0.74% over the past hour, suggesting a few weak FOMO positions have been shaken out, helping the market feel “lighter” before the next wave arrives.
- Market sentiment & Taker: The Global Long/Short Ratio stands at 1.76 (63.8% Long), showing the community is extremely optimistic. However, the Taker Buy/Sell Ratio is 0.74—an interesting paradox that suggests the selling side is exerting short-term pressure, possibly a trap set before whales pull the price up.
Key price levels to remember:
- Strong support: 0.2188 — the guard protecting your account; if this level breaks, the bull camp must temporarily retreat.
- Potential resistance: 0.2451 — the door to a new sky if $SOON wants to break the short-term high.
The market is always right, and risk management is the key to survival. Always place your Stop Loss carefully below the support zone, and never all-in your account into a single trade no matter how good the signal looks.
What do you think about this rally in $SOON? Will we soon see resistance at 0.2451 broken, or will a liquidity sweep hit before that? Drop your thoughts in the comments below!
#SOON #TechnicalAnalysis
🚨 Breakout Signal $SOON : Is the “bull camp” secretly accumulating inventory or preparing a liquidity sweep?
The crypto market is never short of surprises, and the current focus is gathering around $SOON as money begins to move in extremely suspicious ways.
Looking at the current technical picture of $SOON , traders on Binance Square should pay special attention to the following bright and dark points:
- Main trend: Both the M15 and H1 timeframes are in strong green alignment with a powerful bullish structure, showing that the buyers are still firmly holding the steering wheel.
- Momentum: RSI at 57.1—an area that’s neutral but leaning toward bullish strength—combined with MACD supporting the uptrend. There’s no overbought condition, meaning there’s still room for the bulls to flex.
- Liquidity & Volume: Trading volume surged by 13.8%, indicating real interest from “smart money” rather than just a fake pump.
- Open Interest (OI) position: Slightly down 0.74% over the past hour, suggesting a few weak FOMO positions have been shaken out, helping the market feel “lighter” before the next wave arrives.
- Market sentiment & Taker: The Global Long/Short Ratio stands at 1.76 (63.8% Long), showing the community is extremely optimistic. However, the Taker Buy/Sell Ratio is 0.74—an interesting paradox that suggests the selling side is exerting short-term pressure, possibly a trap set before whales pull the price up.
Key price levels to remember:
- Strong support: 0.2188 — the guard protecting your account; if this level breaks, the bull camp must temporarily retreat.
- Potential resistance: 0.2451 — the door to a new sky if $SOON wants to break the short-term high.
The market is always right, and risk management is the key to survival. Always place your Stop Loss carefully below the support zone, and never all-in your account into a single trade no matter how good the signal looks.
What do you think about this rally in $SOON ? Will we soon see resistance at 0.2451 broken, or will a liquidity sweep hit before that? Drop your thoughts in the comments below!
#SOON #TechnicalAnalysis
The crypto market is never short of surprises, and the current focus is gathering around $SOON as money begins to move in extremely suspicious ways.
Looking at the current technical picture of $SOON , traders on Binance Square should pay special attention to the following bright and dark points:
- Main trend: Both the M15 and H1 timeframes are in strong green alignment with a powerful bullish structure, showing that the buyers are still firmly holding the steering wheel.
- Momentum: RSI at 57.1—an area that’s neutral but leaning toward bullish strength—combined with MACD supporting the uptrend. There’s no overbought condition, meaning there’s still room for the bulls to flex.
- Liquidity & Volume: Trading volume surged by 13.8%, indicating real interest from “smart money” rather than just a fake pump.
- Open Interest (OI) position: Slightly down 0.74% over the past hour, suggesting a few weak FOMO positions have been shaken out, helping the market feel “lighter” before the next wave arrives.
- Market sentiment & Taker: The Global Long/Short Ratio stands at 1.76 (63.8% Long), showing the community is extremely optimistic. However, the Taker Buy/Sell Ratio is 0.74—an interesting paradox that suggests the selling side is exerting short-term pressure, possibly a trap set before whales pull the price up.
Key price levels to remember:
- Strong support: 0.2188 — the guard protecting your account; if this level breaks, the bull camp must temporarily retreat.
- Potential resistance: 0.2451 — the door to a new sky if $SOON wants to break the short-term high.
The market is always right, and risk management is the key to survival. Always place your Stop Loss carefully below the support zone, and never all-in your account into a single trade no matter how good the signal looks.
What do you think about this rally in $SOON ? Will we soon see resistance at 0.2451 broken, or will a liquidity sweep hit before that? Drop your thoughts in the comments below!
#SOON #TechnicalAnalysis
75
·
--
Solana ecosystem continues to make a strong mark as it officially surpasses the milestone of 1 million people holding tokenized stock (tokenized shares).
This is an important milestone showing the growing popularity of using real-world assets (RWA) on this high-speed blockchain.
👀 Market Watch: $SOL
#Solana #RWA
Solana ecosystem continues to make a strong mark as it officially surpasses the milestone of 1 million people holding tokenized stock (tokenized shares).
This is an important milestone showing the growing popularity of using real-world assets (RWA) on this high-speed blockchain.
👀 Market Watch: $SOL
#Solana #RWA
This is an important milestone showing the growing popularity of using real-world assets (RWA) on this high-speed blockchain.
👀 Market Watch: $SOL
#Solana #RWA

123
·
--
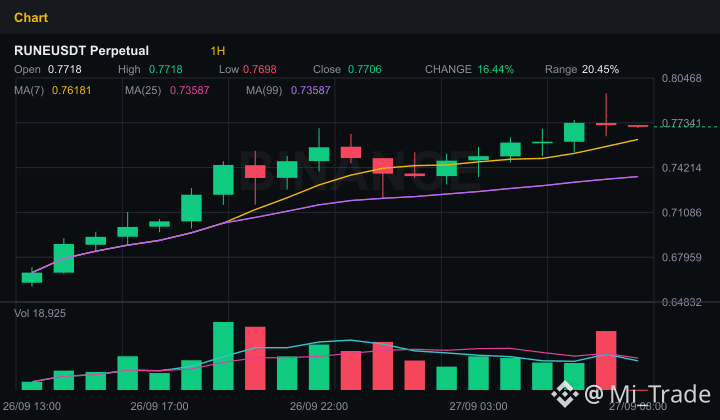
🚨 WHAT OPPORTUNITY IS THERE FOR $RUNE WHEN THE BULLS ARE ACCELERATING?
The crypto market is never short of nail-biting chases, and anyone following $RUNE is certainly sitting on a pile of fire. Is this a real breakout moment, or just a sophisticated "bull trap" from the sharks?
Let’s break down the technical picture of $RUNE right now to find the answer and craft the sharpest trading strategy!
📊 TECHNICAL NEWS $RUNE - A CLOSE-UP, NO- LESS-INTENSE VIEW:
• Main trend: The bull side is holding full control on both the M15 and H1 timeframes. The price structure clearly shows strong bullish agreement.
• Momentum: RSI is at 61— a safe zone—indicating buying pressure still has room to grow without falling into an overbought state. MACD is also supporting the uptrend.
• Flow of capital & Volume: Trading volume suddenly surged up 12.5%, accompanied by Open Interest (OI) edging up 2.2% over the past hour, reaching more than 7.5 million USD. This proves fresh capital is truly pouring into the market.
• Trading sentiment & Positioning:
- The global Long/Short ratio is 1.87 (65.2% Long orders), while the “top trader” sharks are even more confident with 67.9% Long orders.
- The interesting part is the Taker Buy/Sell Ratio at 0.89 (sell orders slightly higher on the taker side), suggesting an underlying tug-of-war—likely a clever accumulation phase before pushing price above resistance.
• Critical price levels:
- Hard support: 0.7207 USD
- Potential resistance: 0.7939 USD
💡 RISK MANAGEMENT ADVICE:
Even though the uptrend is extremely supportive, the derivatives market always hides unexpected “liquidity sweeps” at any time. Never chase FOMO at the top, and always remember to place a stop-loss order below the 0.7207 USD support zone to protect your account.
Brothers and sisters, what do you think? Does $RUNE have what it takes to break the 0.7939 USD resistance level today, or will there be a deep pullback to shake off some leverage first? Leave your thoughts in the comments below!
#RUNE #BinanceSquare
🚨 WHAT OPPORTUNITY IS THERE FOR $RUNE WHEN THE BULLS ARE ACCELERATING?
The crypto market is never short of nail-biting chases, and anyone following $RUNE is certainly sitting on a pile of fire. Is this a real breakout moment, or just a sophisticated "bull trap" from the sharks?
Let’s break down the technical picture of $RUNE right now to find the answer and craft the sharpest trading strategy!
📊 TECHNICAL NEWS $RUNE - A CLOSE-UP, NO- LESS-INTENSE VIEW:
• Main trend: The bull side is holding full control on both the M15 and H1 timeframes. The price structure clearly shows strong bullish agreement.
• Momentum: RSI is at 61— a safe zone—indicating buying pressure still has room to grow without falling into an overbought state. MACD is also supporting the uptrend.
• Flow of capital & Volume: Trading volume suddenly surged up 12.5%, accompanied by Open Interest (OI) edging up 2.2% over the past hour, reaching more than 7.5 million USD. This proves fresh capital is truly pouring into the market.
• Trading sentiment & Positioning:
- The global Long/Short ratio is 1.87 (65.2% Long orders), while the “top trader” sharks are even more confident with 67.9% Long orders.
- The interesting part is the Taker Buy/Sell Ratio at 0.89 (sell orders slightly higher on the taker side), suggesting an underlying tug-of-war—likely a clever accumulation phase before pushing price above resistance.
• Critical price levels:
- Hard support: 0.7207 USD
- Potential resistance: 0.7939 USD
💡 RISK MANAGEMENT ADVICE:
Even though the uptrend is extremely supportive, the derivatives market always hides unexpected “liquidity sweeps” at any time. Never chase FOMO at the top, and always remember to place a stop-loss order below the 0.7207 USD support zone to protect your account.
Brothers and sisters, what do you think? Does $RUNE have what it takes to break the 0.7939 USD resistance level today, or will there be a deep pullback to shake off some leverage first? Leave your thoughts in the comments below!
#RUNE #BinanceSquare
The crypto market is never short of nail-biting chases, and anyone following $RUNE is certainly sitting on a pile of fire. Is this a real breakout moment, or just a sophisticated "bull trap" from the sharks?
Let’s break down the technical picture of $RUNE right now to find the answer and craft the sharpest trading strategy!
📊 TECHNICAL NEWS $RUNE - A CLOSE-UP, NO- LESS-INTENSE VIEW:
• Main trend: The bull side is holding full control on both the M15 and H1 timeframes. The price structure clearly shows strong bullish agreement.
• Momentum: RSI is at 61— a safe zone—indicating buying pressure still has room to grow without falling into an overbought state. MACD is also supporting the uptrend.
• Flow of capital & Volume: Trading volume suddenly surged up 12.5%, accompanied by Open Interest (OI) edging up 2.2% over the past hour, reaching more than 7.5 million USD. This proves fresh capital is truly pouring into the market.
• Trading sentiment & Positioning:
- The global Long/Short ratio is 1.87 (65.2% Long orders), while the “top trader” sharks are even more confident with 67.9% Long orders.
- The interesting part is the Taker Buy/Sell Ratio at 0.89 (sell orders slightly higher on the taker side), suggesting an underlying tug-of-war—likely a clever accumulation phase before pushing price above resistance.
• Critical price levels:
- Hard support: 0.7207 USD
- Potential resistance: 0.7939 USD
💡 RISK MANAGEMENT ADVICE:
Even though the uptrend is extremely supportive, the derivatives market always hides unexpected “liquidity sweeps” at any time. Never chase FOMO at the top, and always remember to place a stop-loss order below the 0.7207 USD support zone to protect your account.
Brothers and sisters, what do you think? Does $RUNE have what it takes to break the 0.7939 USD resistance level today, or will there be a deep pullback to shake off some leverage first? Leave your thoughts in the comments below!
#RUNE #BinanceSquare
136
·
--
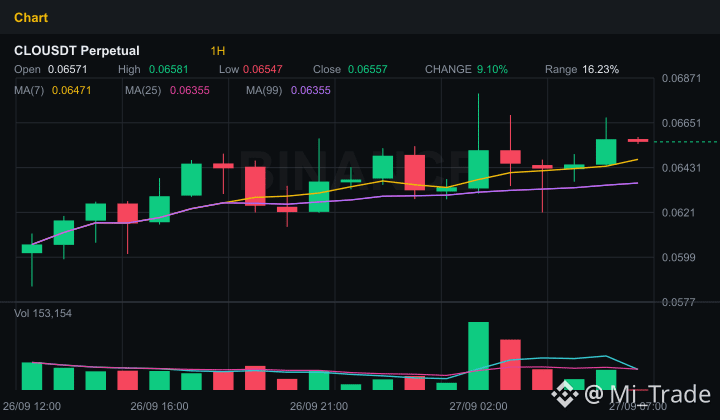
🔥 Price pump trap or the final late-stage rally of $CLOUSDT? Read it now so you don’t miss out! 🔥
The crypto market is always ruthless to anyone who doesn’t pay close attention, and $CLOUSDT right now is flashing extremely conflicting signals that have many of you "holding the bag".
At a quick glance at the chart, the bulls are currently in control of the short-term trend on M15 and H1—but don’t rush to throw money into a chase-buy. From a hands-on technical perspective, the picture is hiding telling numbers:
• Momentum & Trend: RSI-14 is hovering around 64.4 and MACD supports the buying side, suggesting the push still has strength. However, a hard resistance at 0.06795 is very close, while a reliable support sits at 0.0621.
• Volume & Taker Paradox: Trading volume suddenly evaporated by 34%, combined with a Taker Buy/Sell Ratio of just 0.593—showing the selling side is quietly dumping at higher price levels.
• Long/Short Showdown: Open Interest (OI) is up slightly by 1.92% (to over 5.56 million USD), while the global Long ratio is dominating at 80.6%. Are the whales accumulating—or are they setting a trap to liquidate Longs for meat?
This is the moment for a cool head to speak up. Going long on $CLOUSDT right now is like playing a high-risk game right at the edge of a cliff when trading volume is dropping sharply. Be patient and wait for the price to retest the support zone or to break through resistance completely with fresh, unusually high volume.
Always set a tight Stop Loss to protect your account against any last-minute turnarounds. What do you think: will $CLOUSDT break resistance to keep flying—or will there be a sharp drop that wipes out the Long crowd? Leave your thoughts in the comments below!
#CLOUSDT #BinanceSquare
🔥 Price pump trap or the final late-stage rally of $CLOUSDT? Read it now so you don’t miss out! 🔥
The crypto market is always ruthless to anyone who doesn’t pay close attention, and $CLOUSDT right now is flashing extremely conflicting signals that have many of you "holding the bag".
At a quick glance at the chart, the bulls are currently in control of the short-term trend on M15 and H1—but don’t rush to throw money into a chase-buy. From a hands-on technical perspective, the picture is hiding telling numbers:
• Momentum & Trend: RSI-14 is hovering around 64.4 and MACD supports the buying side, suggesting the push still has strength. However, a hard resistance at 0.06795 is very close, while a reliable support sits at 0.0621.
• Volume & Taker Paradox: Trading volume suddenly evaporated by 34%, combined with a Taker Buy/Sell Ratio of just 0.593—showing the selling side is quietly dumping at higher price levels.
• Long/Short Showdown: Open Interest (OI) is up slightly by 1.92% (to over 5.56 million USD), while the global Long ratio is dominating at 80.6%. Are the whales accumulating—or are they setting a trap to liquidate Longs for meat?
This is the moment for a cool head to speak up. Going long on $CLOUSDT right now is like playing a high-risk game right at the edge of a cliff when trading volume is dropping sharply. Be patient and wait for the price to retest the support zone or to break through resistance completely with fresh, unusually high volume.
Always set a tight Stop Loss to protect your account against any last-minute turnarounds. What do you think: will $CLOUSDT break resistance to keep flying—or will there be a sharp drop that wipes out the Long crowd? Leave your thoughts in the comments below!
#CLOUSDT #BinanceSquare
The crypto market is always ruthless to anyone who doesn’t pay close attention, and $CLOUSDT right now is flashing extremely conflicting signals that have many of you "holding the bag".
At a quick glance at the chart, the bulls are currently in control of the short-term trend on M15 and H1—but don’t rush to throw money into a chase-buy. From a hands-on technical perspective, the picture is hiding telling numbers:
• Momentum & Trend: RSI-14 is hovering around 64.4 and MACD supports the buying side, suggesting the push still has strength. However, a hard resistance at 0.06795 is very close, while a reliable support sits at 0.0621.
• Volume & Taker Paradox: Trading volume suddenly evaporated by 34%, combined with a Taker Buy/Sell Ratio of just 0.593—showing the selling side is quietly dumping at higher price levels.
• Long/Short Showdown: Open Interest (OI) is up slightly by 1.92% (to over 5.56 million USD), while the global Long ratio is dominating at 80.6%. Are the whales accumulating—or are they setting a trap to liquidate Longs for meat?
This is the moment for a cool head to speak up. Going long on $CLOUSDT right now is like playing a high-risk game right at the edge of a cliff when trading volume is dropping sharply. Be patient and wait for the price to retest the support zone or to break through resistance completely with fresh, unusually high volume.
Always set a tight Stop Loss to protect your account against any last-minute turnarounds. What do you think: will $CLOUSDT break resistance to keep flying—or will there be a sharp drop that wipes out the Long crowd? Leave your thoughts in the comments below!
#CLOUSDT #BinanceSquare
72
·
--
Injective has officially launched the Meridian Mainnet upgrade. This update introduces the ability to support tokenized securities with legal compliance requirements on the ecosystem.
👀 Market Watch: $INJ
This is an important milestone that helps expand the application scope of real-world assets (RWA) on the Injective network.
#Injective #CryptoNews
Injective has officially launched the Meridian Mainnet upgrade. This update introduces the ability to support tokenized securities with legal compliance requirements on the ecosystem.
👀 Market Watch: $INJ
This is an important milestone that helps expand the application scope of real-world assets (RWA) on the Injective network.
#Injective #CryptoNews
👀 Market Watch: $INJ
This is an important milestone that helps expand the application scope of real-world assets (RWA) on the Injective network.
#Injective #CryptoNews

93
·
--
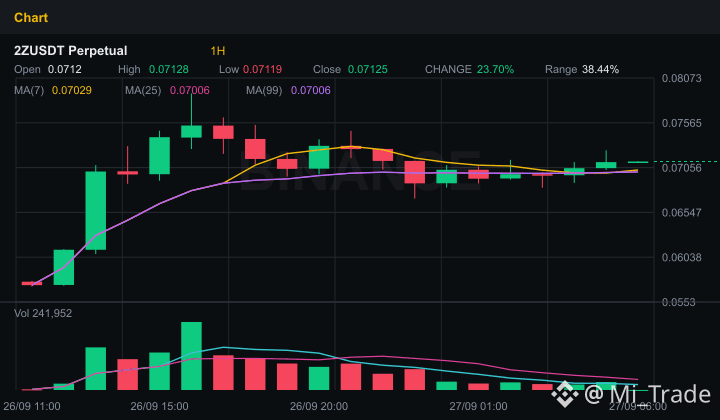
🚨 $2ZUSDT Price Drop Trap or a Ready-to-Launch Missile? 🚀
The crypto market always knows how to test traders’ patience, and today’s spotlight is on $2ZUSDT. Will the bulls keep their ground, or is a liquidity trap waiting to fool everyone?
Let’s quickly break down the technical picture of $2ZUSDT right now:
• Trend & Momentum: The M15 and H1 timeframes are both in agreement with a green "bullish" signal. RSI(14) is hovering around 57.6—still not overbought, a perfect spot for price to continue its breakout. MACD is also backing the buyers.
• Flow of Funds & Open Interest (OI): Trading volume has surged 17%, alongside a strong jump in OI of 4.48% within just the past hour. This shows fresh capital is rushing into the market.
• Trading Sentiment & Funding: The interesting point is the negative Funding Rate (-0.313%) while the global Long/Short ratio is 1.66 (62.5% Long). Are whales intentionally trying to "squeeze" the stubborn Shorts? Although Taker Buy/Sell is leaning toward selling (0.649), this is often a sign that sets up an extremely aggressive Short Squeeze.
• Key Price Zones: Rigid support at 0.06703$ and the nearest resistance at 0.07253$. If this resistance is broken, the path to the moon for $2ZUSDT will be wide open!
The trading strategy right now is not to chase prices too high. Watch for a support test, or wait for confirmation of a resistance breakout before entering a trade. Always use a tight stop-loss, because volatility can wipe out an account anytime if risk management is sloppy.
Are you holding a Long position, or waiting to go Short $2ZUSDT at this moment? Leave a comment below!
#2ZUSDT #BinanceSquare
🚨 $2ZUSDT Price Drop Trap or a Ready-to-Launch Missile? 🚀
The crypto market always knows how to test traders’ patience, and today’s spotlight is on $2ZUSDT. Will the bulls keep their ground, or is a liquidity trap waiting to fool everyone?
Let’s quickly break down the technical picture of $2ZUSDT right now:
• Trend & Momentum: The M15 and H1 timeframes are both in agreement with a green "bullish" signal. RSI(14) is hovering around 57.6—still not overbought, a perfect spot for price to continue its breakout. MACD is also backing the buyers.
• Flow of Funds & Open Interest (OI): Trading volume has surged 17%, alongside a strong jump in OI of 4.48% within just the past hour. This shows fresh capital is rushing into the market.
• Trading Sentiment & Funding: The interesting point is the negative Funding Rate (-0.313%) while the global Long/Short ratio is 1.66 (62.5% Long). Are whales intentionally trying to "squeeze" the stubborn Shorts? Although Taker Buy/Sell is leaning toward selling (0.649), this is often a sign that sets up an extremely aggressive Short Squeeze.
• Key Price Zones: Rigid support at 0.06703$ and the nearest resistance at 0.07253$. If this resistance is broken, the path to the moon for $2ZUSDT will be wide open!
The trading strategy right now is not to chase prices too high. Watch for a support test, or wait for confirmation of a resistance breakout before entering a trade. Always use a tight stop-loss, because volatility can wipe out an account anytime if risk management is sloppy.
Are you holding a Long position, or waiting to go Short $2ZUSDT at this moment? Leave a comment below!
#2ZUSDT #BinanceSquare
The crypto market always knows how to test traders’ patience, and today’s spotlight is on $2ZUSDT. Will the bulls keep their ground, or is a liquidity trap waiting to fool everyone?
Let’s quickly break down the technical picture of $2ZUSDT right now:
• Trend & Momentum: The M15 and H1 timeframes are both in agreement with a green "bullish" signal. RSI(14) is hovering around 57.6—still not overbought, a perfect spot for price to continue its breakout. MACD is also backing the buyers.
• Flow of Funds & Open Interest (OI): Trading volume has surged 17%, alongside a strong jump in OI of 4.48% within just the past hour. This shows fresh capital is rushing into the market.
• Trading Sentiment & Funding: The interesting point is the negative Funding Rate (-0.313%) while the global Long/Short ratio is 1.66 (62.5% Long). Are whales intentionally trying to "squeeze" the stubborn Shorts? Although Taker Buy/Sell is leaning toward selling (0.649), this is often a sign that sets up an extremely aggressive Short Squeeze.
• Key Price Zones: Rigid support at 0.06703$ and the nearest resistance at 0.07253$. If this resistance is broken, the path to the moon for $2ZUSDT will be wide open!
The trading strategy right now is not to chase prices too high. Watch for a support test, or wait for confirmation of a resistance breakout before entering a trade. Always use a tight stop-loss, because volatility can wipe out an account anytime if risk management is sloppy.
Are you holding a Long position, or waiting to go Short $2ZUSDT at this moment? Leave a comment below!
#2ZUSDT #BinanceSquare
11
·
--
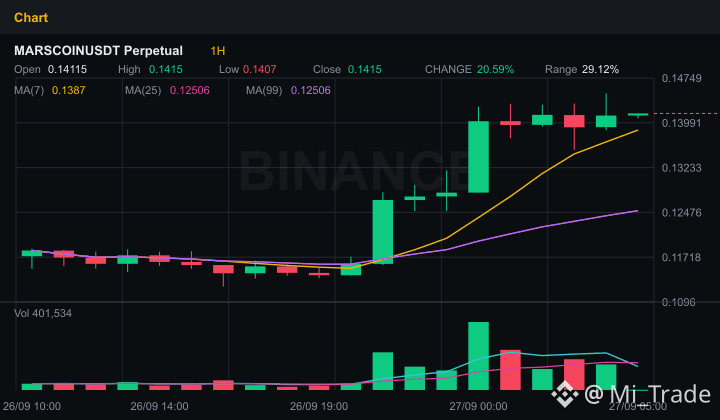
🚨 MARSCOINUSDT Alert: Are the Buyers Quietly Accumulating or Laying a Liquidity Trap?
The crypto market has never stopped playing visual tricks, and $MARSCOINUSDT is at the center of attention, making many traders struggle to figure things out.
Looking at the current technical picture, are we about to witness a strong breakout, or an unforgiving sweep that wipes out both Long/Short? Let’s break down the data to find the answer:
• Trend & Momentum: The M15 and H1 timeframes are both holding green (bullish), supported by the MACD favoring the buyers. However, RSI(14) is hovering around the neutral 49.1, suggesting indecision from both sides.
• Sharp drop in trading volume: 24h Volume is down by -53.7%. This is a warning sign—“the bulls are running out of steam.” Big money doesn’t seem ready to push price above resistance.
• Open Interest & Position battle: Open Interest is up slightly by 1.2% (reaching over $30.3 million), indicating new funds are still cautiously flowing in. The interesting part: whales (Top Traders) hold as much as 77.6% of Long positions (top traders’ Long/Short ratio is as high as 3.47), while smaller traders appear cautious, with the overall market Long/Short ratio balanced at 0.98.
• Critical price levels:
- Hard support: $0.11853
- Strong resistance: $0.14488
The whales are quietly accumulating beneath the thin shell of $MARSCOINUSDT’s liquidity. Deep volume decline while whales hold large Long positions is a double-edged sword: either a spring compression before takeoff, or a trap waiting to collapse so they can dump.
The advice for everyone right now is absolutely no FOMO chasing the top. Stay patient—watch how price reacts in the $0.11853 support zone and wait for volume signals confirming a breakout above the $0.14488 resistance level. Risk management, including a tight stop-loss, is the key to surviving this weak-liquidity phase.
In your opinion, are the whales intentionally pushing the price down to accumulate more—or are they preparing to throw a bucket of cold water in the faces of the Long side? Leave your thoughts in the comments below!
#MARSCOINUSDT #BinanceSquare
🚨 MARSCOINUSDT Alert: Are the Buyers Quietly Accumulating or Laying a Liquidity Trap?
The crypto market has never stopped playing visual tricks, and $MARSCOINUSDT is at the center of attention, making many traders struggle to figure things out.
Looking at the current technical picture, are we about to witness a strong breakout, or an unforgiving sweep that wipes out both Long/Short? Let’s break down the data to find the answer:
• Trend & Momentum: The M15 and H1 timeframes are both holding green (bullish), supported by the MACD favoring the buyers. However, RSI(14) is hovering around the neutral 49.1, suggesting indecision from both sides.
• Sharp drop in trading volume: 24h Volume is down by -53.7%. This is a warning sign—“the bulls are running out of steam.” Big money doesn’t seem ready to push price above resistance.
• Open Interest & Position battle: Open Interest is up slightly by 1.2% (reaching over $30.3 million), indicating new funds are still cautiously flowing in. The interesting part: whales (Top Traders) hold as much as 77.6% of Long positions (top traders’ Long/Short ratio is as high as 3.47), while smaller traders appear cautious, with the overall market Long/Short ratio balanced at 0.98.
• Critical price levels:
- Hard support: $0.11853
- Strong resistance: $0.14488
The whales are quietly accumulating beneath the thin shell of $MARSCOINUSDT’s liquidity. Deep volume decline while whales hold large Long positions is a double-edged sword: either a spring compression before takeoff, or a trap waiting to collapse so they can dump.
The advice for everyone right now is absolutely no FOMO chasing the top. Stay patient—watch how price reacts in the $0.11853 support zone and wait for volume signals confirming a breakout above the $0.14488 resistance level. Risk management, including a tight stop-loss, is the key to surviving this weak-liquidity phase.
In your opinion, are the whales intentionally pushing the price down to accumulate more—or are they preparing to throw a bucket of cold water in the faces of the Long side? Leave your thoughts in the comments below!
#MARSCOINUSDT #BinanceSquare
The crypto market has never stopped playing visual tricks, and $MARSCOINUSDT is at the center of attention, making many traders struggle to figure things out.
Looking at the current technical picture, are we about to witness a strong breakout, or an unforgiving sweep that wipes out both Long/Short? Let’s break down the data to find the answer:
• Trend & Momentum: The M15 and H1 timeframes are both holding green (bullish), supported by the MACD favoring the buyers. However, RSI(14) is hovering around the neutral 49.1, suggesting indecision from both sides.
• Sharp drop in trading volume: 24h Volume is down by -53.7%. This is a warning sign—“the bulls are running out of steam.” Big money doesn’t seem ready to push price above resistance.
• Open Interest & Position battle: Open Interest is up slightly by 1.2% (reaching over $30.3 million), indicating new funds are still cautiously flowing in. The interesting part: whales (Top Traders) hold as much as 77.6% of Long positions (top traders’ Long/Short ratio is as high as 3.47), while smaller traders appear cautious, with the overall market Long/Short ratio balanced at 0.98.
• Critical price levels:
- Hard support: $0.11853
- Strong resistance: $0.14488
The whales are quietly accumulating beneath the thin shell of $MARSCOINUSDT’s liquidity. Deep volume decline while whales hold large Long positions is a double-edged sword: either a spring compression before takeoff, or a trap waiting to collapse so they can dump.
The advice for everyone right now is absolutely no FOMO chasing the top. Stay patient—watch how price reacts in the $0.11853 support zone and wait for volume signals confirming a breakout above the $0.14488 resistance level. Risk management, including a tight stop-loss, is the key to surviving this weak-liquidity phase.
In your opinion, are the whales intentionally pushing the price down to accumulate more—or are they preparing to throw a bucket of cold water in the faces of the Long side? Leave your thoughts in the comments below!
#MARSCOINUSDT #BinanceSquare
10
·
--
SEC Commissioner Hester Peirce has just offered a noteworthy perspective on the future of financial regulation in Crypto.
She believes that Zero-Knowledge Proofs (ZKP) technology has the potential to verify compliance without collecting users’ personal data. Currently, KYC/AML processes are creating “massive data haystacks,” which poses significant security risks.
Applying ZKP could be a turning point in balancing regulatory requirements with investor privacy.
👀 Market Watch: $BTC, $ETH
#CryptoNews #SEC
SEC Commissioner Hester Peirce has just offered a noteworthy perspective on the future of financial regulation in Crypto.
She believes that Zero-Knowledge Proofs (ZKP) technology has the potential to verify compliance without collecting users’ personal data. Currently, KYC/AML processes are creating “massive data haystacks,” which poses significant security risks.
Applying ZKP could be a turning point in balancing regulatory requirements with investor privacy.
👀 Market Watch: $BTC , $ETH
#CryptoNews #SEC
She believes that Zero-Knowledge Proofs (ZKP) technology has the potential to verify compliance without collecting users’ personal data. Currently, KYC/AML processes are creating “massive data haystacks,” which poses significant security risks.
Applying ZKP could be a turning point in balancing regulatory requirements with investor privacy.
👀 Market Watch: $BTC , $ETH
#CryptoNews #SEC

198
·
--
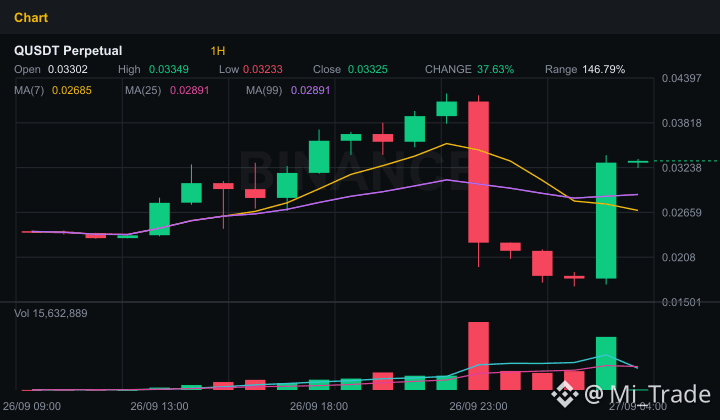
🚨 $QUSDT WARNING: Volume explodes 185% — FOMO trap or a historic breakout?
The crypto market has never stopped being volatile, and the spotlight right now is on $QUSDT, with dizzying numbers flashing nonstop. Guys holding the bags—are you smiling, or are those outside the game restless and uneasy? Let’s uncover the technical “inner layer” right now!
Taking a panoramic look, money is pouring into $QUSDT extremely strongly, with highly stimulating mixed signals:
• Exploding Volume: Volume surged 185.7%, alongside Open Interest (OI) jumping to 81.49% within just 1 hour. Whales and the “small fish” are rushing to pump funds into this feast.
• Momentum & Indicators: RSI is “burning hot” at 77.9 (heavily overbought), while MACD is sending a bearish signal of a mild divergence. The bulls are clearly running out of steam in the short term as they try to push higher.
• Timeframes: The H1 trend is still green and bullish, but M15 has started moving sideways (sideway)—a classic sign of “building up” energy or preparing for a terrifying liquidity sweep.
• Crowd Sentiment: Global Long/Short ratio is at 1.44 (59.1% Long), showing the Long side is extremely excited and complacent.
What’s the trading strategy right now?
Hard resistance sits at 0.0419$, while crucial support is holding the bulls at 0.0170$. With RSI too high and OI surging sharply, the risk of being “dumped on” by whales to liquidate margins is extremely high. Don’t let greed blind you into going “all-in” at this sensitive moment. Set clear take-profit targets and have ammunition ready for unexpected scenarios.
Do you dare to “risk big to win bigger” and catch the top right now, or will you choose to stand by and observe? Leave your thoughts in the comments below!
#BinanceSquare #CryptoTrading
🚨 $QUSDT WARNING: Volume explodes 185% — FOMO trap or a historic breakout?
The crypto market has never stopped being volatile, and the spotlight right now is on $QUSDT, with dizzying numbers flashing nonstop. Guys holding the bags—are you smiling, or are those outside the game restless and uneasy? Let’s uncover the technical “inner layer” right now!
Taking a panoramic look, money is pouring into $QUSDT extremely strongly, with highly stimulating mixed signals:
• Exploding Volume: Volume surged 185.7%, alongside Open Interest (OI) jumping to 81.49% within just 1 hour. Whales and the “small fish” are rushing to pump funds into this feast.
• Momentum & Indicators: RSI is “burning hot” at 77.9 (heavily overbought), while MACD is sending a bearish signal of a mild divergence. The bulls are clearly running out of steam in the short term as they try to push higher.
• Timeframes: The H1 trend is still green and bullish, but M15 has started moving sideways (sideway)—a classic sign of “building up” energy or preparing for a terrifying liquidity sweep.
• Crowd Sentiment: Global Long/Short ratio is at 1.44 (59.1% Long), showing the Long side is extremely excited and complacent.
What’s the trading strategy right now?
Hard resistance sits at 0.0419$, while crucial support is holding the bulls at 0.0170$. With RSI too high and OI surging sharply, the risk of being “dumped on” by whales to liquidate margins is extremely high. Don’t let greed blind you into going “all-in” at this sensitive moment. Set clear take-profit targets and have ammunition ready for unexpected scenarios.
Do you dare to “risk big to win bigger” and catch the top right now, or will you choose to stand by and observe? Leave your thoughts in the comments below!
#BinanceSquare #CryptoTrading
The crypto market has never stopped being volatile, and the spotlight right now is on $QUSDT, with dizzying numbers flashing nonstop. Guys holding the bags—are you smiling, or are those outside the game restless and uneasy? Let’s uncover the technical “inner layer” right now!
Taking a panoramic look, money is pouring into $QUSDT extremely strongly, with highly stimulating mixed signals:
• Exploding Volume: Volume surged 185.7%, alongside Open Interest (OI) jumping to 81.49% within just 1 hour. Whales and the “small fish” are rushing to pump funds into this feast.
• Momentum & Indicators: RSI is “burning hot” at 77.9 (heavily overbought), while MACD is sending a bearish signal of a mild divergence. The bulls are clearly running out of steam in the short term as they try to push higher.
• Timeframes: The H1 trend is still green and bullish, but M15 has started moving sideways (sideway)—a classic sign of “building up” energy or preparing for a terrifying liquidity sweep.
• Crowd Sentiment: Global Long/Short ratio is at 1.44 (59.1% Long), showing the Long side is extremely excited and complacent.
What’s the trading strategy right now?
Hard resistance sits at 0.0419$, while crucial support is holding the bulls at 0.0170$. With RSI too high and OI surging sharply, the risk of being “dumped on” by whales to liquidate margins is extremely high. Don’t let greed blind you into going “all-in” at this sensitive moment. Set clear take-profit targets and have ammunition ready for unexpected scenarios.
Do you dare to “risk big to win bigger” and catch the top right now, or will you choose to stand by and observe? Leave your thoughts in the comments below!
#BinanceSquare #CryptoTrading
53
·
--
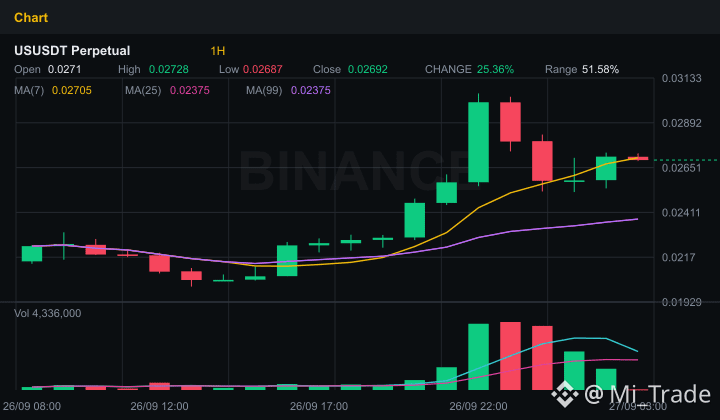
🚨 GOOD OPPORTUNITY OR A LIQUIDITY TRAP? UNLOCK THE PATH FOR $USUSDT RIGHT NOW! 🚨
The crypto market always knows how to test traders’ patience, and $USUSDT is currently at the center of attention, making many brothers scratch their heads. The bulls are trying to hold the ground, but the hidden numbers behind the chart are sending extremely important warning signals!
Let’s quickly break down the technical picture of $USUSDT to see what the sharks might be calculating:
📊 Technical Picture & Current Money Flow:
- Trend & Momentum: The M15 and H1 timeframes still lean green (bullish), and the MACD supports the buying side. However, RSI(14) is dropping to around 36.1—near the oversold zone—suggesting momentum is weakening and the bulls may be losing steam.
- Liquidity & Volume: Trading volume has plunged sharply to -55.7%. This indicates the market is being extremely cautious, and large capital flow is not rushing in.
- Open Interest (OI) Position: Slightly down by 1.58%, showing that some contracts have been closed out—there isn’t a fresh wave of FOMO at the moment.
- “Sharks” vs “Crowd” Sentiment: The global Long/Short rate is at 1.31 (56.8% Long), while Top Traders are even more confident with 61.7% Long orders (Ratio 1.61).
- Strategic Barrier: Strong support is placed at 0.022207, and the nearest resistance is around 0.0305.
⚠️ Risk Management Advice:
A drop in trading volume combined with low RSI signals the risk of sudden “liquidity sweeps” orchestrated by sharks. Never throw all your force into the trade right now. Always set a tight Stop Loss below the 0.022207 support zone to protect your account.
What do you think, brothers? Will $USUSDT break out and hit the 0.0305 resistance, or will there be a sudden dip that shakes out players before it flies? Leave your thoughts in the comments below!
#USUSDT #BinanceSquare
🚨 GOOD OPPORTUNITY OR A LIQUIDITY TRAP? UNLOCK THE PATH FOR $USUSDT RIGHT NOW! 🚨
The crypto market always knows how to test traders’ patience, and $USUSDT is currently at the center of attention, making many brothers scratch their heads. The bulls are trying to hold the ground, but the hidden numbers behind the chart are sending extremely important warning signals!
Let’s quickly break down the technical picture of $USUSDT to see what the sharks might be calculating:
📊 Technical Picture & Current Money Flow:
- Trend & Momentum: The M15 and H1 timeframes still lean green (bullish), and the MACD supports the buying side. However, RSI(14) is dropping to around 36.1—near the oversold zone—suggesting momentum is weakening and the bulls may be losing steam.
- Liquidity & Volume: Trading volume has plunged sharply to -55.7%. This indicates the market is being extremely cautious, and large capital flow is not rushing in.
- Open Interest (OI) Position: Slightly down by 1.58%, showing that some contracts have been closed out—there isn’t a fresh wave of FOMO at the moment.
- “Sharks” vs “Crowd” Sentiment: The global Long/Short rate is at 1.31 (56.8% Long), while Top Traders are even more confident with 61.7% Long orders (Ratio 1.61).
- Strategic Barrier: Strong support is placed at 0.022207, and the nearest resistance is around 0.0305.
⚠️ Risk Management Advice:
A drop in trading volume combined with low RSI signals the risk of sudden “liquidity sweeps” orchestrated by sharks. Never throw all your force into the trade right now. Always set a tight Stop Loss below the 0.022207 support zone to protect your account.
What do you think, brothers? Will $USUSDT break out and hit the 0.0305 resistance, or will there be a sudden dip that shakes out players before it flies? Leave your thoughts in the comments below!
#USUSDT #BinanceSquare
The crypto market always knows how to test traders’ patience, and $USUSDT is currently at the center of attention, making many brothers scratch their heads. The bulls are trying to hold the ground, but the hidden numbers behind the chart are sending extremely important warning signals!
Let’s quickly break down the technical picture of $USUSDT to see what the sharks might be calculating:
📊 Technical Picture & Current Money Flow:
- Trend & Momentum: The M15 and H1 timeframes still lean green (bullish), and the MACD supports the buying side. However, RSI(14) is dropping to around 36.1—near the oversold zone—suggesting momentum is weakening and the bulls may be losing steam.
- Liquidity & Volume: Trading volume has plunged sharply to -55.7%. This indicates the market is being extremely cautious, and large capital flow is not rushing in.
- Open Interest (OI) Position: Slightly down by 1.58%, showing that some contracts have been closed out—there isn’t a fresh wave of FOMO at the moment.
- “Sharks” vs “Crowd” Sentiment: The global Long/Short rate is at 1.31 (56.8% Long), while Top Traders are even more confident with 61.7% Long orders (Ratio 1.61).
- Strategic Barrier: Strong support is placed at 0.022207, and the nearest resistance is around 0.0305.
⚠️ Risk Management Advice:
A drop in trading volume combined with low RSI signals the risk of sudden “liquidity sweeps” orchestrated by sharks. Never throw all your force into the trade right now. Always set a tight Stop Loss below the 0.022207 support zone to protect your account.
What do you think, brothers? Will $USUSDT break out and hit the 0.0305 resistance, or will there be a sudden dip that shakes out players before it flies? Leave your thoughts in the comments below!
#USUSDT #BinanceSquare
9
·
--
Tether CEO Paolo Ardoino has just confirmed an important piece of information: USDT will soon be integrated directly onto the Bitcoin network.
This is a major step forward to increase liquidity and expand application capabilities for the Bitcoin ecosystem in the coming time.
👀 Market Watch: $BTC, $USDT
#Bitcoin #Tether
Tether CEO Paolo Ardoino has just confirmed an important piece of information: USDT will soon be integrated directly onto the Bitcoin network.
This is a major step forward to increase liquidity and expand application capabilities for the Bitcoin ecosystem in the coming time.
👀 Market Watch: $BTC , $USDT
#Bitcoin #Tether
This is a major step forward to increase liquidity and expand application capabilities for the Bitcoin ecosystem in the coming time.
👀 Market Watch: $BTC , $USDT
#Bitcoin #Tether

112
·
--
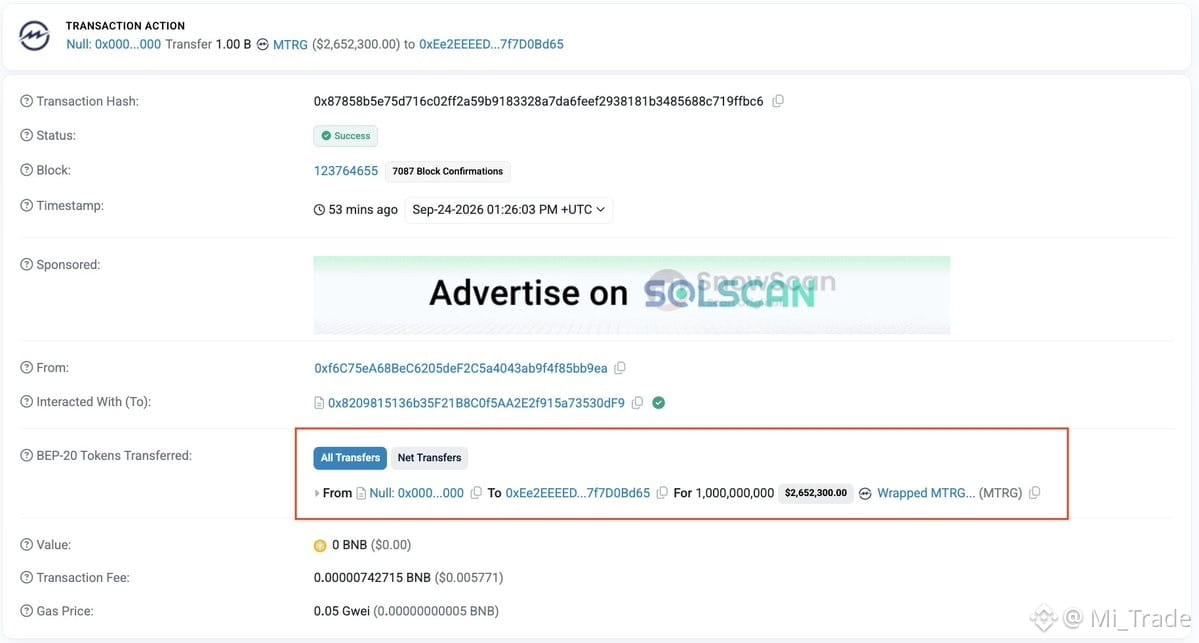
PeckShieldAlert has just issued a warning about a serious security incident related to the Meter.io project.
Specifically, more than 1 billion tokens #MTRG đ were illicitly minted on the #BNBChain network. Shortly after this information was released, the price of #MTRG recorded a sharp drop of -74%.
👀 Market Watch:
$MTRG
Investors should be cautious and closely monitor official announcements from the project to stay updated on the situation.
#CryptoNews #SecurityAlert
PeckShieldAlert has just issued a warning about a serious security incident related to the Meter.io project.
Specifically, more than 1 billion tokens #MTRG đ were illicitly minted on the #BNBChain network. Shortly after this information was released, the price of #MTRG recorded a sharp drop of -74%.
👀 Market Watch:
$MTRG
Investors should be cautious and closely monitor official announcements from the project to stay updated on the situation.
#CryptoNews #SecurityAlert
Specifically, more than 1 billion tokens #MTRG đ were illicitly minted on the #BNBChain network. Shortly after this information was released, the price of #MTRG recorded a sharp drop of -74%.
👀 Market Watch:
$MTRG
Investors should be cautious and closely monitor official announcements from the project to stay updated on the situation.
#CryptoNews #SecurityAlert
39
·
--
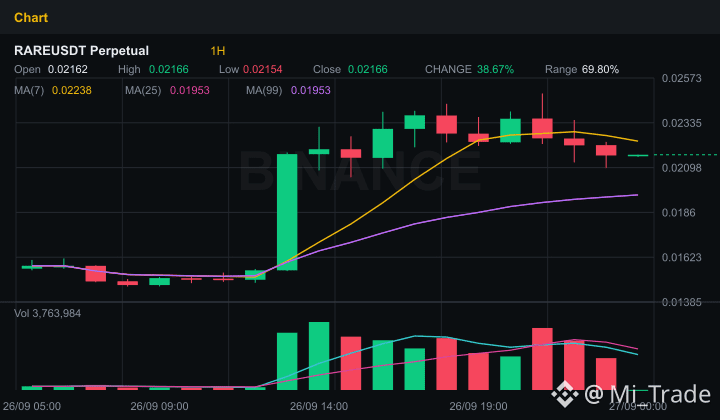
🔥 Is a discount trap or a million-dollar dip-buying opportunity with $RARE? Read this before it’s too late! 🔥
The crypto market is always ruthless to those who lack patience, and the current developments of $RARE are painting an intense strategic standoff between the Longs and the Shorts.
Taking a look at the technical numbers, what do we see?
• RSI(14) has dived to 27 — a deeply oversold zone, indicating $RARE is being heavily sold off, but at the same time it’s like a compressed spring that could snap back at any moment.
• Trading volume has dropped by as much as 44.4%, and Open Interest is down 8.57%, showing that capital is pulling back temporarily while waiting for a big catalyst.
• The global Long/Short ratio is 0.87 (Longs 46.6%, Shorts 53.4%), suggesting the bears are currently holding the advantage and trying to push prices down.
• A deeply negative Funding Rate (-0.533%) is an especially interesting signal: Shorts are paying fees to Longs, which often becomes perfect “fuel” for a breakout Short Squeeze if price hits hard support.
Current technical setup:
• On H1, the trend is still Bullish (rising), although M15 is Sideway and accumulating.
• Key support zone: 0.02095 (a reputable buy wall to accumulate).
• Nearest resistance zone: 0.02491 (where sellers are poised to dump).
Risk management advice from the expert: Don’t all-in dip-buy while buying pressure hasn’t truly returned yet. Split your capital into multiple portions, and set a strict stop-loss below the 0.02095 support zone to protect your account against sudden liquidity sweeps by big players.
What do you think—will $RARE break support, or will it pull off a remarkable “turnaround” back up to the resistance zone within the next 24 hours? Leave your thoughts in the comments!
#RARE #BinanceSquare
🔥 Is a discount trap or a million-dollar dip-buying opportunity with $RARE ? Read this before it’s too late! 🔥
The crypto market is always ruthless to those who lack patience, and the current developments of $RARE are painting an intense strategic standoff between the Longs and the Shorts.
Taking a look at the technical numbers, what do we see?
• RSI(14) has dived to 27 — a deeply oversold zone, indicating $RARE is being heavily sold off, but at the same time it’s like a compressed spring that could snap back at any moment.
• Trading volume has dropped by as much as 44.4%, and Open Interest is down 8.57%, showing that capital is pulling back temporarily while waiting for a big catalyst.
• The global Long/Short ratio is 0.87 (Longs 46.6%, Shorts 53.4%), suggesting the bears are currently holding the advantage and trying to push prices down.
• A deeply negative Funding Rate (-0.533%) is an especially interesting signal: Shorts are paying fees to Longs, which often becomes perfect “fuel” for a breakout Short Squeeze if price hits hard support.
Current technical setup:
• On H1, the trend is still Bullish (rising), although M15 is Sideway and accumulating.
• Key support zone: 0.02095 (a reputable buy wall to accumulate).
• Nearest resistance zone: 0.02491 (where sellers are poised to dump).
Risk management advice from the expert: Don’t all-in dip-buy while buying pressure hasn’t truly returned yet. Split your capital into multiple portions, and set a strict stop-loss below the 0.02095 support zone to protect your account against sudden liquidity sweeps by big players.
What do you think—will $RARE break support, or will it pull off a remarkable “turnaround” back up to the resistance zone within the next 24 hours? Leave your thoughts in the comments!
#RARE #BinanceSquare
The crypto market is always ruthless to those who lack patience, and the current developments of $RARE are painting an intense strategic standoff between the Longs and the Shorts.
Taking a look at the technical numbers, what do we see?
• RSI(14) has dived to 27 — a deeply oversold zone, indicating $RARE is being heavily sold off, but at the same time it’s like a compressed spring that could snap back at any moment.
• Trading volume has dropped by as much as 44.4%, and Open Interest is down 8.57%, showing that capital is pulling back temporarily while waiting for a big catalyst.
• The global Long/Short ratio is 0.87 (Longs 46.6%, Shorts 53.4%), suggesting the bears are currently holding the advantage and trying to push prices down.
• A deeply negative Funding Rate (-0.533%) is an especially interesting signal: Shorts are paying fees to Longs, which often becomes perfect “fuel” for a breakout Short Squeeze if price hits hard support.
Current technical setup:
• On H1, the trend is still Bullish (rising), although M15 is Sideway and accumulating.
• Key support zone: 0.02095 (a reputable buy wall to accumulate).
• Nearest resistance zone: 0.02491 (where sellers are poised to dump).
Risk management advice from the expert: Don’t all-in dip-buy while buying pressure hasn’t truly returned yet. Split your capital into multiple portions, and set a strict stop-loss below the 0.02095 support zone to protect your account against sudden liquidity sweeps by big players.
What do you think—will $RARE break support, or will it pull off a remarkable “turnaround” back up to the resistance zone within the next 24 hours? Leave your thoughts in the comments!
#RARE #BinanceSquare
37
·
--
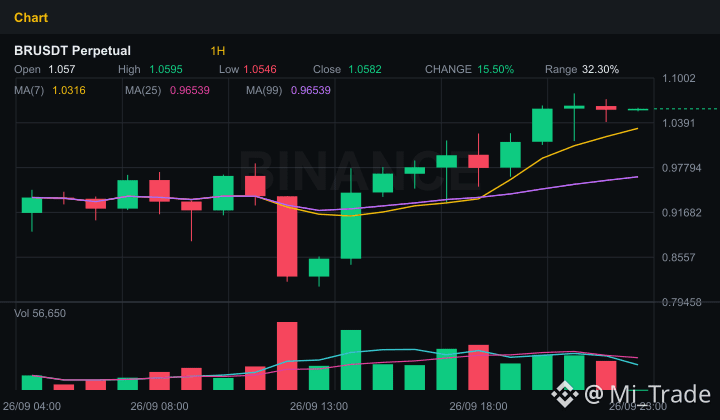
🚨 Golden Opportunity or a Deadly Liquidity Trap Coming for $BRU?
The crypto market is always ruthless toward those who lack patience, and the current data for $BRU is sending out extremely important warning signals that you can’t afford to ignore if you don’t want to lose money in today’s trading session.
Let’s quickly dissect the technical picture of $BRU using the telling numbers below to see who’s holding the steering wheel:
- Trend & Momentum: Both the M15 and H1 timeframes are clearly leaning toward the bulls (bullish). RSI-14 is at 64, indicating there’s still room for buying power, but it’s moving closer to the overbought zone. The MACD aligns with green momentum, confirming that the short-term uptrend hasn’t been broken.
- Volume & Money Flow: The biggest “kink” is that trading Volume has dropped by 34.6%, combined with a slight decline in Open Interest (OI) of 2.13% (currently above $30 million). This suggests the bulls are showing signs of fatigue, and new capital isn’t very eager to push the price up strongly.
- Long/Short Battle: It’s another spectacular trap from crowd psychology! The market is dominated by Shorts globally at 66.3% (the global Long/Short ratio is only 0.51). In contrast, the “whales” top traders are strongly accumulating with 61.1% in Long positions (top trader ratio is 1.57).
- Key Price Zone: The current price is squeezed between a hard support at 0.92888 and a strong resistance at 1.0791. A breakout above either level will ignite an extremely large volatility move.
In short, $BRU is in the crosshairs of “whales” to sweep liquidity. Don’t FOMO into the top when trading volume is gradually thinning out. Be patient and wait for a retest of support, or a decisive breakout above resistance with strong volume.
Always set a Stop-Loss and manage capital tightly—never put all your eggs in one basket. So, do you think the “whales” will push the price to break above 1.0791, or will they turn around and smash down, wiping out the top traders’ Long positions first? Leave your thoughts in the comments below!
#BRU #BinanceSquare
🚨 Golden Opportunity or a Deadly Liquidity Trap Coming for $BRU?
The crypto market is always ruthless toward those who lack patience, and the current data for $BRU is sending out extremely important warning signals that you can’t afford to ignore if you don’t want to lose money in today’s trading session.
Let’s quickly dissect the technical picture of $BRU using the telling numbers below to see who’s holding the steering wheel:
- Trend & Momentum: Both the M15 and H1 timeframes are clearly leaning toward the bulls (bullish). RSI-14 is at 64, indicating there’s still room for buying power, but it’s moving closer to the overbought zone. The MACD aligns with green momentum, confirming that the short-term uptrend hasn’t been broken.
- Volume & Money Flow: The biggest “kink” is that trading Volume has dropped by 34.6%, combined with a slight decline in Open Interest (OI) of 2.13% (currently above $30 million). This suggests the bulls are showing signs of fatigue, and new capital isn’t very eager to push the price up strongly.
- Long/Short Battle: It’s another spectacular trap from crowd psychology! The market is dominated by Shorts globally at 66.3% (the global Long/Short ratio is only 0.51). In contrast, the “whales” top traders are strongly accumulating with 61.1% in Long positions (top trader ratio is 1.57).
- Key Price Zone: The current price is squeezed between a hard support at 0.92888 and a strong resistance at 1.0791. A breakout above either level will ignite an extremely large volatility move.
In short, $BRU is in the crosshairs of “whales” to sweep liquidity. Don’t FOMO into the top when trading volume is gradually thinning out. Be patient and wait for a retest of support, or a decisive breakout above resistance with strong volume.
Always set a Stop-Loss and manage capital tightly—never put all your eggs in one basket. So, do you think the “whales” will push the price to break above 1.0791, or will they turn around and smash down, wiping out the top traders’ Long positions first? Leave your thoughts in the comments below!
#BRU #BinanceSquare
The crypto market is always ruthless toward those who lack patience, and the current data for $BRU is sending out extremely important warning signals that you can’t afford to ignore if you don’t want to lose money in today’s trading session.
Let’s quickly dissect the technical picture of $BRU using the telling numbers below to see who’s holding the steering wheel:
- Trend & Momentum: Both the M15 and H1 timeframes are clearly leaning toward the bulls (bullish). RSI-14 is at 64, indicating there’s still room for buying power, but it’s moving closer to the overbought zone. The MACD aligns with green momentum, confirming that the short-term uptrend hasn’t been broken.
- Volume & Money Flow: The biggest “kink” is that trading Volume has dropped by 34.6%, combined with a slight decline in Open Interest (OI) of 2.13% (currently above $30 million). This suggests the bulls are showing signs of fatigue, and new capital isn’t very eager to push the price up strongly.
- Long/Short Battle: It’s another spectacular trap from crowd psychology! The market is dominated by Shorts globally at 66.3% (the global Long/Short ratio is only 0.51). In contrast, the “whales” top traders are strongly accumulating with 61.1% in Long positions (top trader ratio is 1.57).
- Key Price Zone: The current price is squeezed between a hard support at 0.92888 and a strong resistance at 1.0791. A breakout above either level will ignite an extremely large volatility move.
In short, $BRU is in the crosshairs of “whales” to sweep liquidity. Don’t FOMO into the top when trading volume is gradually thinning out. Be patient and wait for a retest of support, or a decisive breakout above resistance with strong volume.
Always set a Stop-Loss and manage capital tightly—never put all your eggs in one basket. So, do you think the “whales” will push the price to break above 1.0791, or will they turn around and smash down, wiping out the top traders’ Long positions first? Leave your thoughts in the comments below!
#BRU #BinanceSquare
98
Log in to explore more content
Join global crypto users on Binance Square
⚡️ Get latest and useful information about crypto.
💬 Trusted by the world’s largest crypto exchange.
👍 Discover real insights from verified creators.
Email / Phone number
Trending Topics
StrategyStriveAdd2305BitcoinThisWeek
135 views
35 Discussing
#StrategyStriveAdd2305BitcoinThisWeek Institutional accumulation isn't slowing down! Seeing Strive and strategic treasury players continuously stack $BTC proves that conviction remains rock solid despite short-term market noise.
Continuous reserve additions signal long-term strength for Bitcoin. Are you stacking alongside the whales or waiting on the sidelines? 👇
$BTC #Bitcoin❗ n #Crypto #BinanceSquareFamily #TreasuryStrategy
Marget Argudo xtm7
·0 Likes
·10 views
TrumpRejectsIranHormuzReopening
3,973 views
173 Discussing
CircleTetherFreezeBitgetHackerWallet
27,834 views
377 Discussing