
loweef
9 Posts

loweef
Report
Block User
Free TradingView indicators: Market, Funding, Cost & Session Compass · Crypto market structure & trading-cost education · X @loweef_io
0 Following
1 Followers
4 Liked
Posts
·
--
Price and open interest: four combinations worth knowing
Open interest (OI) is the total number of open futures contracts. Reading it next to price tells you more than price alone.
Price up, OI up: new positions are opening in the direction of the move. Fresh money is pushing it.
Price up, OI down: shorts are closing. The rise can be a squeeze rather than new demand.
Price down, OI up: new shorts are joining, or longs are adding into weakness.
Price down, OI down: longs are exiting or being liquidated. Selling pressure often fades once that flush is done.
None of these is a trade on its own. The way I read it, OI does not tell you who is right, only how crowded the market is getting and whether a move is driven by opening or by closing. The quadrant I trust least is price up with OI down: it often runs out of fuel once the shorts are done covering.
Which combination do you watch most closely before entering a trade?
$BTC $ETH #OpenInterest #CryptoEducation
Price and open interest: four combinations worth knowing
Open interest (OI) is the total number of open futures contracts. Reading it next to price tells you more than price alone.
Price up, OI up: new positions are opening in the direction of the move. Fresh money is pushing it.
Price up, OI down: shorts are closing. The rise can be a squeeze rather than new demand.
Price down, OI up: new shorts are joining, or longs are adding into weakness.
Price down, OI down: longs are exiting or being liquidated. Selling pressure often fades once that flush is done.
None of these is a trade on its own. The way I read it, OI does not tell you who is right, only how crowded the market is getting and whether a move is driven by opening or by closing. The quadrant I trust least is price up with OI down: it often runs out of fuel once the shorts are done covering.
Which combination do you watch most closely before entering a trade?
$BTC $ETH #OpenInterest #CryptoEducation
Open interest (OI) is the total number of open futures contracts. Reading it next to price tells you more than price alone.
Price up, OI up: new positions are opening in the direction of the move. Fresh money is pushing it.
Price up, OI down: shorts are closing. The rise can be a squeeze rather than new demand.
Price down, OI up: new shorts are joining, or longs are adding into weakness.
Price down, OI down: longs are exiting or being liquidated. Selling pressure often fades once that flush is done.
None of these is a trade on its own. The way I read it, OI does not tell you who is right, only how crowded the market is getting and whether a move is driven by opening or by closing. The quadrant I trust least is price up with OI down: it often runs out of fuel once the shorts are done covering.
Which combination do you watch most closely before entering a trade?
$BTC $ETH #OpenInterest #CryptoEducation
93
·
--
Did Bitcoin just lose its range, or only its post-election premium?
What happened: the Nasdaq 100 fell about 6% on Thursday as chipmakers sold off on AI regulation fears, and BTC dropped roughly 5.5% to around 75.7K in the same session (Bloomberg, via Binance News). Most of the move came in just two hourly candles.
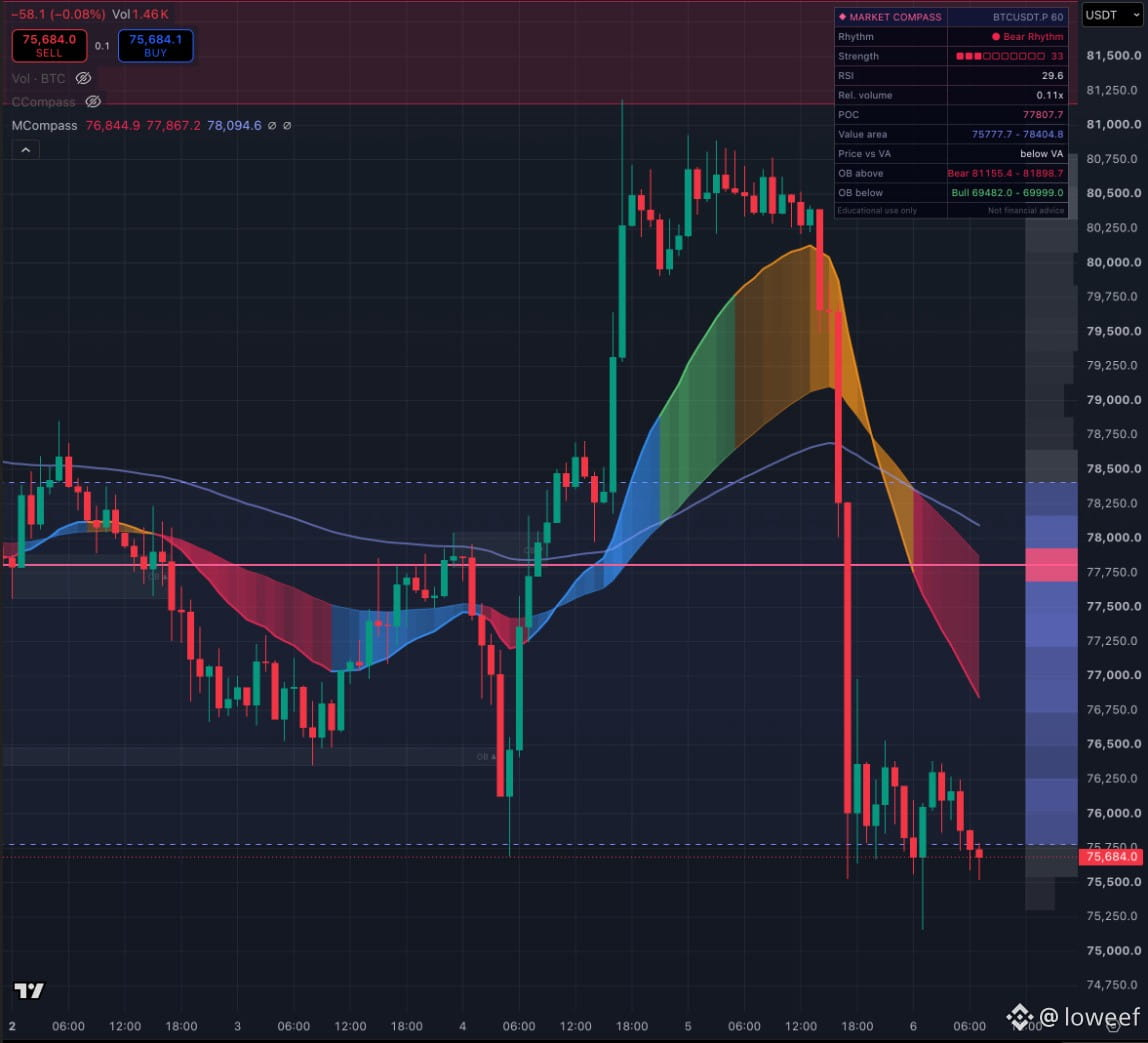
The chart (BTC perp, 1H): price fell from the 80K shelf straight through the volume POC near 77.8K and now sits on the lower edge of the value area, around 75.8K. The trend ribbon has turned bearish and hourly RSI is near 30.
My read: this looks like a liquidity air pocket, not slow distribution. Price skipped most of the value area, so very little trading happened between 80K and 76K. If 75.8K fails on a closing basis, the next visible demand zone on this chart sits much lower, near 69.5K-70K. If buyers reclaim 77.8K, the drop reads more like a macro flush than a trend change. I'm watching whether hourly volume expands on bounces or only on red candles.
Does BTC defend the value-area low, or do equities drag it toward 70K first?
$BTC #USStocksSlipandCryptoMarketUnderBroadPressure #Bitcoin #CryptoMarket
Did Bitcoin just lose its range, or only its post-election premium?
What happened: the Nasdaq 100 fell about 6% on Thursday as chipmakers sold off on AI regulation fears, and BTC dropped roughly 5.5% to around 75.7K in the same session (Bloomberg, via Binance News). Most of the move came in just two hourly candles.
The chart (BTC perp, 1H): price fell from the 80K shelf straight through the volume POC near 77.8K and now sits on the lower edge of the value area, around 75.8K. The trend ribbon has turned bearish and hourly RSI is near 30.
My read: this looks like a liquidity air pocket, not slow distribution. Price skipped most of the value area, so very little trading happened between 80K and 76K. If 75.8K fails on a closing basis, the next visible demand zone on this chart sits much lower, near 69.5K-70K. If buyers reclaim 77.8K, the drop reads more like a macro flush than a trend change. I'm watching whether hourly volume expands on bounces or only on red candles.
Does BTC defend the value-area low, or do equities drag it toward 70K first?
$BTC #USStocksSlipandCryptoMarketUnderBroadPressure #Bitcoin #CryptoMarket
What happened: the Nasdaq 100 fell about 6% on Thursday as chipmakers sold off on AI regulation fears, and BTC dropped roughly 5.5% to around 75.7K in the same session (Bloomberg, via Binance News). Most of the move came in just two hourly candles.
The chart (BTC perp, 1H): price fell from the 80K shelf straight through the volume POC near 77.8K and now sits on the lower edge of the value area, around 75.8K. The trend ribbon has turned bearish and hourly RSI is near 30.
My read: this looks like a liquidity air pocket, not slow distribution. Price skipped most of the value area, so very little trading happened between 80K and 76K. If 75.8K fails on a closing basis, the next visible demand zone on this chart sits much lower, near 69.5K-70K. If buyers reclaim 77.8K, the drop reads more like a macro flush than a trend change. I'm watching whether hourly volume expands on bounces or only on red candles.
Does BTC defend the value-area low, or do equities drag it toward 70K first?
$BTC #USStocksSlipandCryptoMarketUnderBroadPressure #Bitcoin #CryptoMarket
62
·
--
Funding extremes: when longs pay too much, squeezes follow
Perpetual futures use funding payments to keep price tied to spot. Every 8 hours (on most exchanges), one side pays the other:
- Funding positive: longs pay shorts
- Funding negative: shorts pay longs
Why traders watch it:
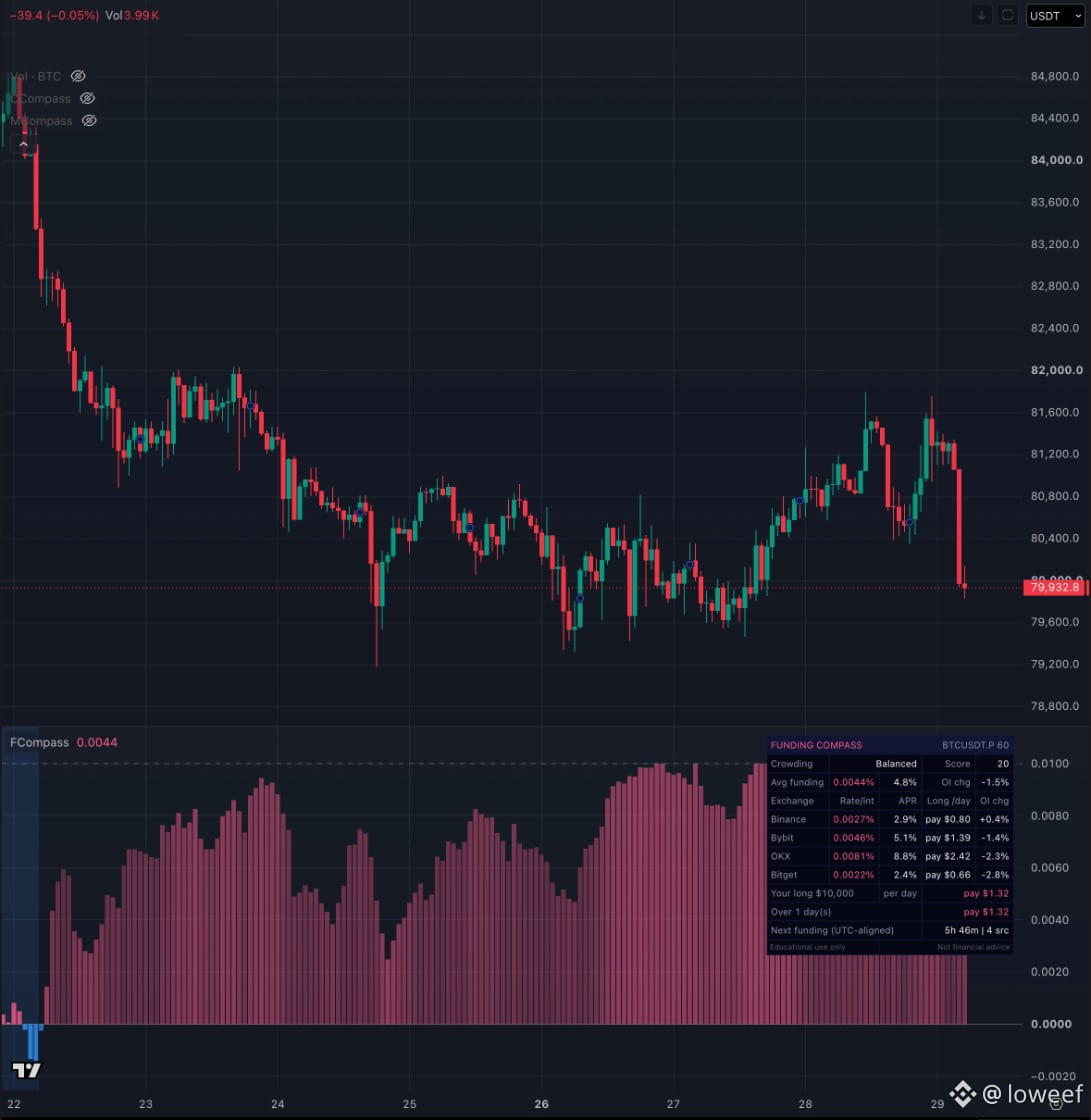
1. Crowding signal. Persistently high positive funding means the long side is crowded and paying to stay in. Crowded trades unwind fast when price stalls.
2. Squeeze fuel. When funding is extreme and open interest keeps rising, a small move against the crowd can force liquidations that push price further, the classic squeeze.
3. Cost you actually pay. On a leveraged position held for days, funding can cost more than your trading fees. Check it before you hold.
How to read it in practice:
- Compare funding across several exchanges, not one. A spike on a single venue is often local noise.
- Look at the trend over days, not one print.
- Pair it with open interest. High funding with falling open interest is very different from high funding with rising open interest.
What chart do you use to track funding? Share your setup below.
$BTC
Funding extremes: when longs pay too much, squeezes follow
Perpetual futures use funding payments to keep price tied to spot. Every 8 hours (on most exchanges), one side pays the other:
- Funding positive: longs pay shorts
- Funding negative: shorts pay longs
Why traders watch it:
1. Crowding signal. Persistently high positive funding means the long side is crowded and paying to stay in. Crowded trades unwind fast when price stalls.
2. Squeeze fuel. When funding is extreme and open interest keeps rising, a small move against the crowd can force liquidations that push price further, the classic squeeze.
3. Cost you actually pay. On a leveraged position held for days, funding can cost more than your trading fees. Check it before you hold.
How to read it in practice:
- Compare funding across several exchanges, not one. A spike on a single venue is often local noise.
- Look at the trend over days, not one print.
- Pair it with open interest. High funding with falling open interest is very different from high funding with rising open interest.
What chart do you use to track funding? Share your setup below.
$BTC
Perpetual futures use funding payments to keep price tied to spot. Every 8 hours (on most exchanges), one side pays the other:
- Funding positive: longs pay shorts
- Funding negative: shorts pay longs
Why traders watch it:
1. Crowding signal. Persistently high positive funding means the long side is crowded and paying to stay in. Crowded trades unwind fast when price stalls.
2. Squeeze fuel. When funding is extreme and open interest keeps rising, a small move against the crowd can force liquidations that push price further, the classic squeeze.
3. Cost you actually pay. On a leveraged position held for days, funding can cost more than your trading fees. Check it before you hold.
How to read it in practice:
- Compare funding across several exchanges, not one. A spike on a single venue is often local noise.
- Look at the trend over days, not one print.
- Pair it with open interest. High funding with falling open interest is very different from high funding with rising open interest.
What chart do you use to track funding? Share your setup below.
$BTC
1
121
Log in to explore more content
Join global crypto users on Binance Square
⚡️ Get latest and useful information about crypto.
💬 Trusted by the world’s largest crypto exchange.
👍 Discover real insights from verified creators.
Email / Phone number
Trending Topics
JobsReportRaisesHikeOdds
570,041 views
3,574 Discussing
TradFi News | US Adds 165,000 Jobs in October, More Than Double the 65,000 Forecast, as Unemployment Falls to 4.1%
Binance News
·43 Likes
·24.3k views
CPITestsDecemberRateOutlook
181,953 views
1,273 Discussing
US Data Center Rules May Constrain AI Expansion
79,636 views
234 Discussing