

小斌冲鸭
1.2k Posts

小斌冲鸭
Report
Block User
多军头子|控费率大师|GPAY-DCBXGM
Open Trade
High-Frequency Trader
8.9 Months
45 Following
290 Followers
703 Liked
Posts
Portfolio
All
Quotes
Videos
·
--
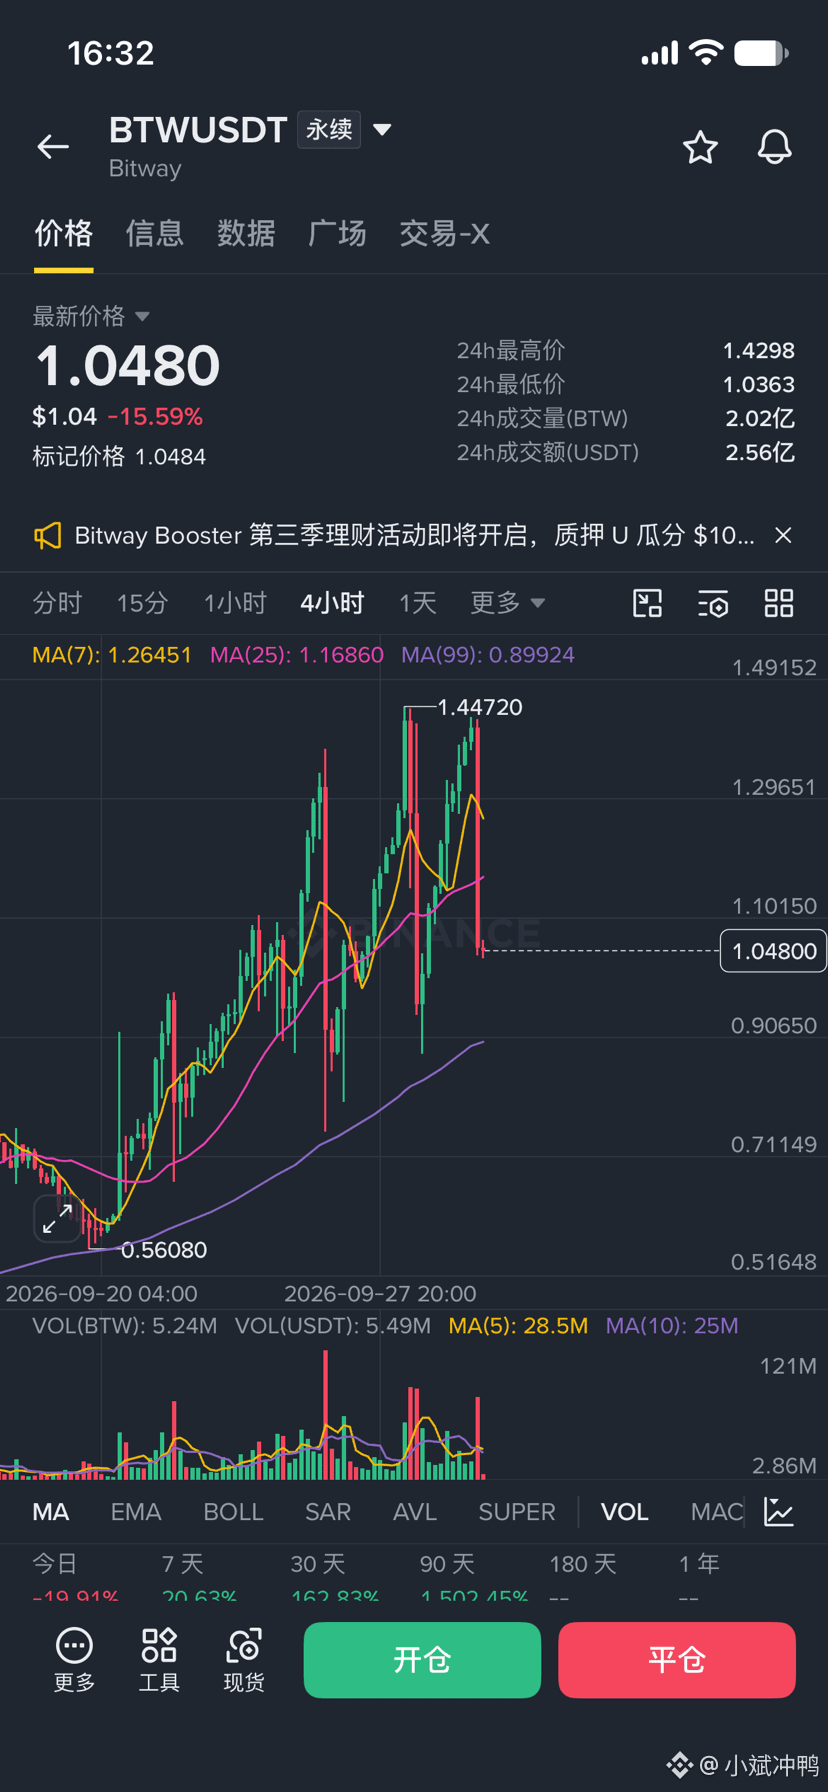
666, how do you openly manipulate the market? Sun ge, you’re not even pretending anymore! $BTW
{future}(BTWUSDT)
666, how do you openly manipulate the market? Sun ge, you’re not even pretending anymore! $BTW
280
·
--
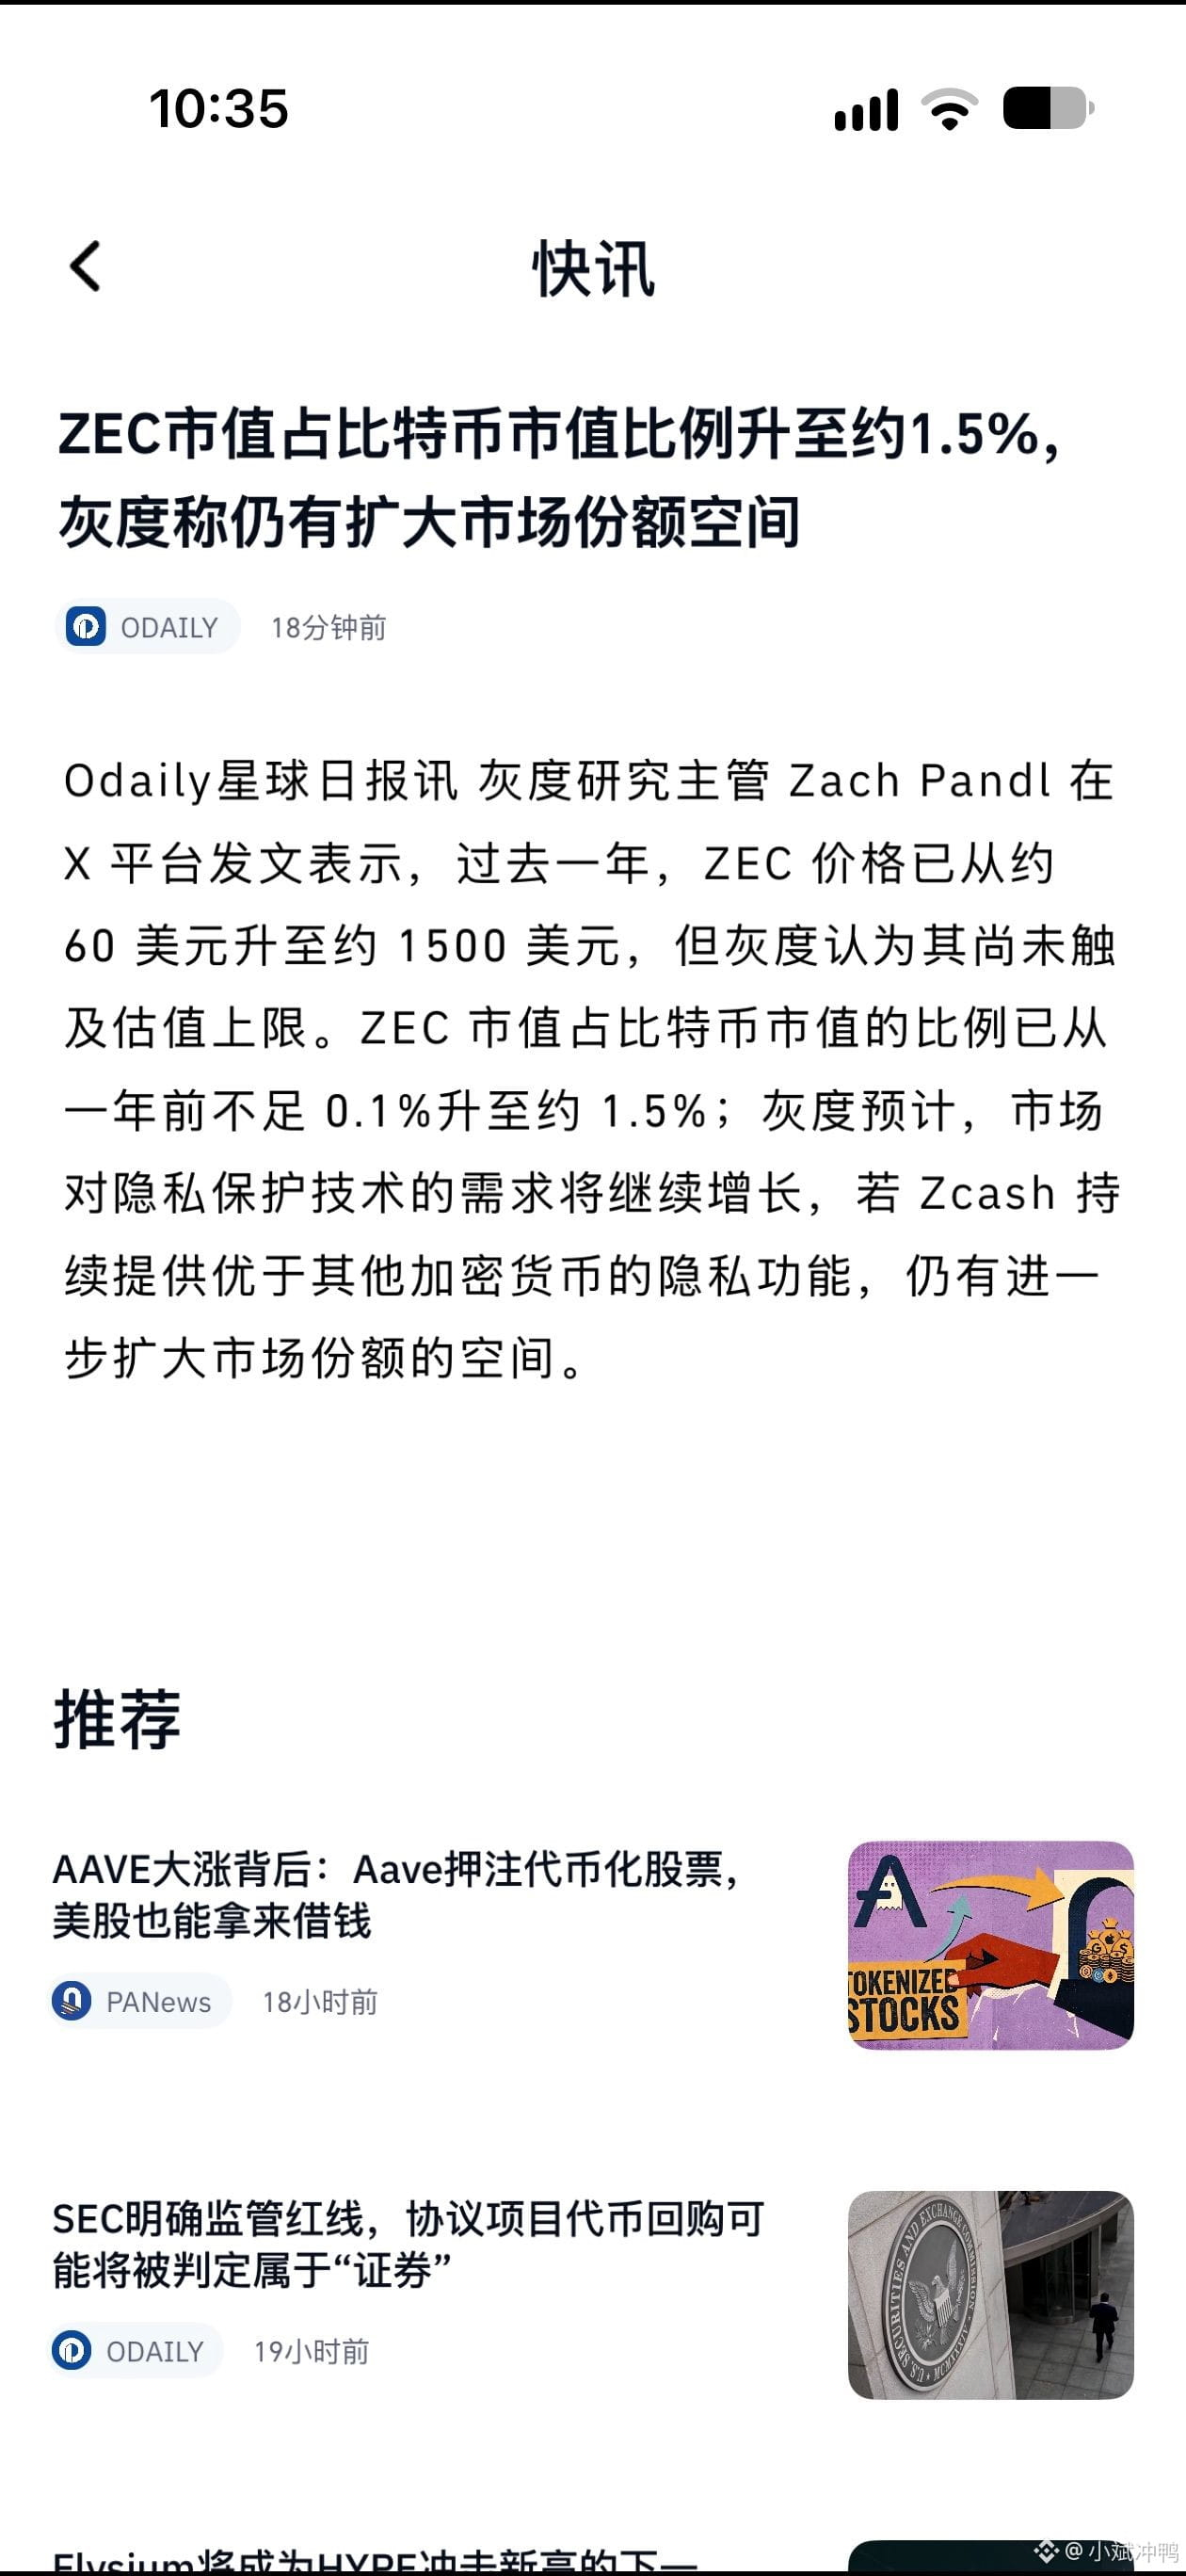
Brothers, look at the picture—Grayscale has come out on its own to make a statement. It says ZEC went from 60 to 1500, and the share of BTC market cap went from 0.1% to 1.5%, and people still think it hasn’t reached the end yet.
I’ll just say one thing—if it’s not Grayscale doing this pump, then who is it?
For the past couple of days I’ve been watching on-chain data. Besides Grayscale buying there, where are the retail guys? Where are the other big players? I flipped through it for a long time and didn’t see any second wave of funds coming in to take over. It’s all Grayscale, pulling the strings by itself—then after pumping it, it goes out and tweets, saying “there’s still room.” Isn’t this exactly what happens when you pull the price up yourself and then look for retail traders to come in and bag it?
ZEC went from 60 to 1500—that’s a 25x move. Grayscale is now coming out to hype the long. You guys think about this timing.
I don’t believe it can keep pumping forever. A market with no one following along—no matter how high you pump it—is just a castle in the air. The moment Grayscale stops, it’ll be a bloodbath: longs killing longs.
Are there any brothers who are tracking the chain who can come out and talk about it—besides Grayscale, is there really big capital entering the market? Or is it just performing by itself?
$ZEC $BTC #Zcash #隐私币 #灰度 #altcoin
Brothers, look at the picture—Grayscale has come out on its own to make a statement. It says ZEC went from 60 to 1500, and the share of BTC market cap went from 0.1% to 1.5%, and people still think it hasn’t reached the end yet.
I’ll just say one thing—if it’s not Grayscale doing this pump, then who is it?
For the past couple of days I’ve been watching on-chain data. Besides Grayscale buying there, where are the retail guys? Where are the other big players? I flipped through it for a long time and didn’t see any second wave of funds coming in to take over. It’s all Grayscale, pulling the strings by itself—then after pumping it, it goes out and tweets, saying “there’s still room.” Isn’t this exactly what happens when you pull the price up yourself and then look for retail traders to come in and bag it?
ZEC went from 60 to 1500—that’s a 25x move. Grayscale is now coming out to hype the long. You guys think about this timing.
I don’t believe it can keep pumping forever. A market with no one following along—no matter how high you pump it—is just a castle in the air. The moment Grayscale stops, it’ll be a bloodbath: longs killing longs.
Are there any brothers who are tracking the chain who can come out and talk about it—besides Grayscale, is there really big capital entering the market? Or is it just performing by itself?
$ZEC $BTC #Zcash #隐私币 #灰度 #altcoin
I’ll just say one thing—if it’s not Grayscale doing this pump, then who is it?
For the past couple of days I’ve been watching on-chain data. Besides Grayscale buying there, where are the retail guys? Where are the other big players? I flipped through it for a long time and didn’t see any second wave of funds coming in to take over. It’s all Grayscale, pulling the strings by itself—then after pumping it, it goes out and tweets, saying “there’s still room.” Isn’t this exactly what happens when you pull the price up yourself and then look for retail traders to come in and bag it?
ZEC went from 60 to 1500—that’s a 25x move. Grayscale is now coming out to hype the long. You guys think about this timing.
I don’t believe it can keep pumping forever. A market with no one following along—no matter how high you pump it—is just a castle in the air. The moment Grayscale stops, it’ll be a bloodbath: longs killing longs.
Are there any brothers who are tracking the chain who can come out and talk about it—besides Grayscale, is there really big capital entering the market? Or is it just performing by itself?
$ZEC $BTC #Zcash #隐私币 #灰度 #altcoin
4
1
2.7k
·
--
Bearish
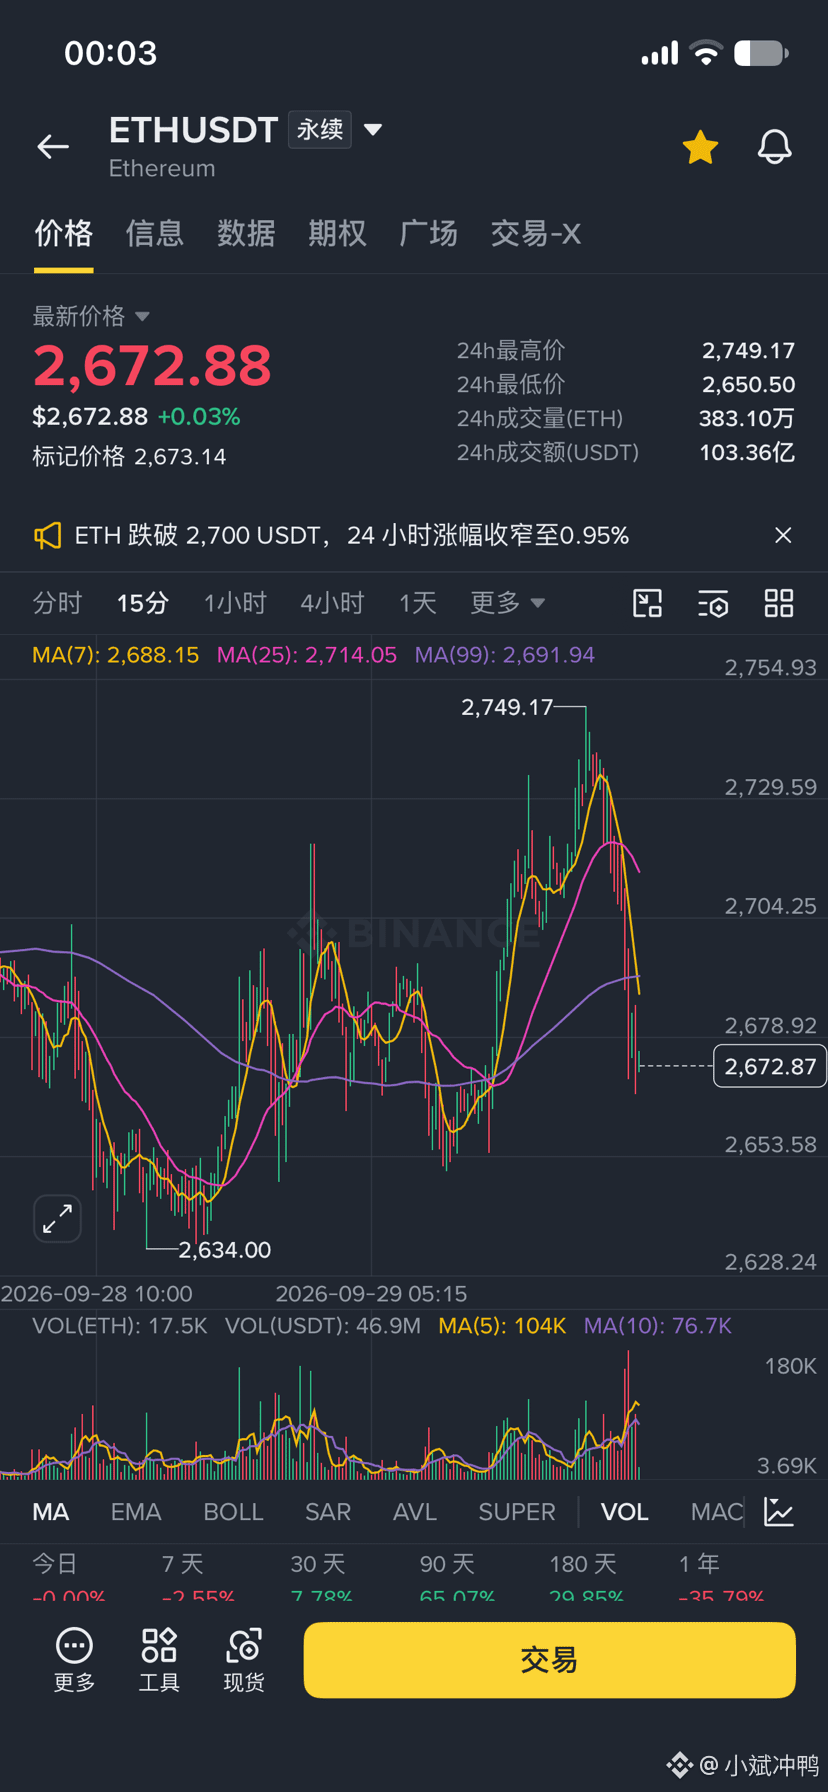
$ETH Sorry, this time I’m going short.
Brothers, ETH bounced this wave—I’m shorting it.
Not because I’m bearish, but because the chart is forcing it.
Let’s look at it in three points:
1. The bullish news is being shouted loud, but the volume hasn’t kept up—every push up smells like distribution.
2. ETH/BTC is unbelievably weak; when BTC catches its breath, it was ETH that dived first.
3. There’s a layer upon layer of trapped longs overhead; every bounce is a place for shorts to enter.
My approach is simple:
No chasing shorts—just wait for the bounce to short;
Position size 2%, 3x leverage; if it breaks the prior high, I’ll admit I’m wrong;
Target: first look at the previous low—cut in half when it hits, then trail the rest with a moving stop.
No holding bags, no stubbornness—staying alive means there’s always another round.
Going long relies on belief; going short relies on discipline.
I’m not a short god—I just don’t want to keep standing guard at the mountaintop.
ETH gives me hope every time, then teaches me a lesson.
{future}(ETHUSDT)
$ETH Sorry, this time I’m going short.
Brothers, ETH bounced this wave—I’m shorting it.
Not because I’m bearish, but because the chart is forcing it.
Let’s look at it in three points:
1. The bullish news is being shouted loud, but the volume hasn’t kept up—every push up smells like distribution.
2. ETH/BTC is unbelievably weak; when BTC catches its breath, it was ETH that dived first.
3. There’s a layer upon layer of trapped longs overhead; every bounce is a place for shorts to enter.
My approach is simple:
No chasing shorts—just wait for the bounce to short;
Position size 2%, 3x leverage; if it breaks the prior high, I’ll admit I’m wrong;
Target: first look at the previous low—cut in half when it hits, then trail the rest with a moving stop.
No holding bags, no stubbornness—staying alive means there’s always another round.
Going long relies on belief; going short relies on discipline.
I’m not a short god—I just don’t want to keep standing guard at the mountaintop.
ETH gives me hope every time, then teaches me a lesson.
Brothers, ETH bounced this wave—I’m shorting it.
Not because I’m bearish, but because the chart is forcing it.
Let’s look at it in three points:
1. The bullish news is being shouted loud, but the volume hasn’t kept up—every push up smells like distribution.
2. ETH/BTC is unbelievably weak; when BTC catches its breath, it was ETH that dived first.
3. There’s a layer upon layer of trapped longs overhead; every bounce is a place for shorts to enter.
My approach is simple:
No chasing shorts—just wait for the bounce to short;
Position size 2%, 3x leverage; if it breaks the prior high, I’ll admit I’m wrong;
Target: first look at the previous low—cut in half when it hits, then trail the rest with a moving stop.
No holding bags, no stubbornness—staying alive means there’s always another round.
Going long relies on belief; going short relies on discipline.
I’m not a short god—I just don’t want to keep standing guard at the mountaintop.
ETH gives me hope every time, then teaches me a lesson.
1
161
·
--
Bearish
One throws 20k coins; one accumulates 20k coins. What is this—playing around? I have reason to suspect it’s the same person, putting on a show!$ZEC
{future}(ZECUSDT)
One throws 20k coins; one accumulates 20k coins. What is this—playing around? I have reason to suspect it’s the same person, putting on a show!$ZEC


720
·
--
Partly True
I can’t take it anymore—surely the dog-coin prop shop can’t hold on anymore, right?
Do you think this move is already over?
No, it isn’t over. This is just the beginning.
With these knockoff “wild-card” coins, once you trigger one major crash, what awaits it are countless more big crashes.
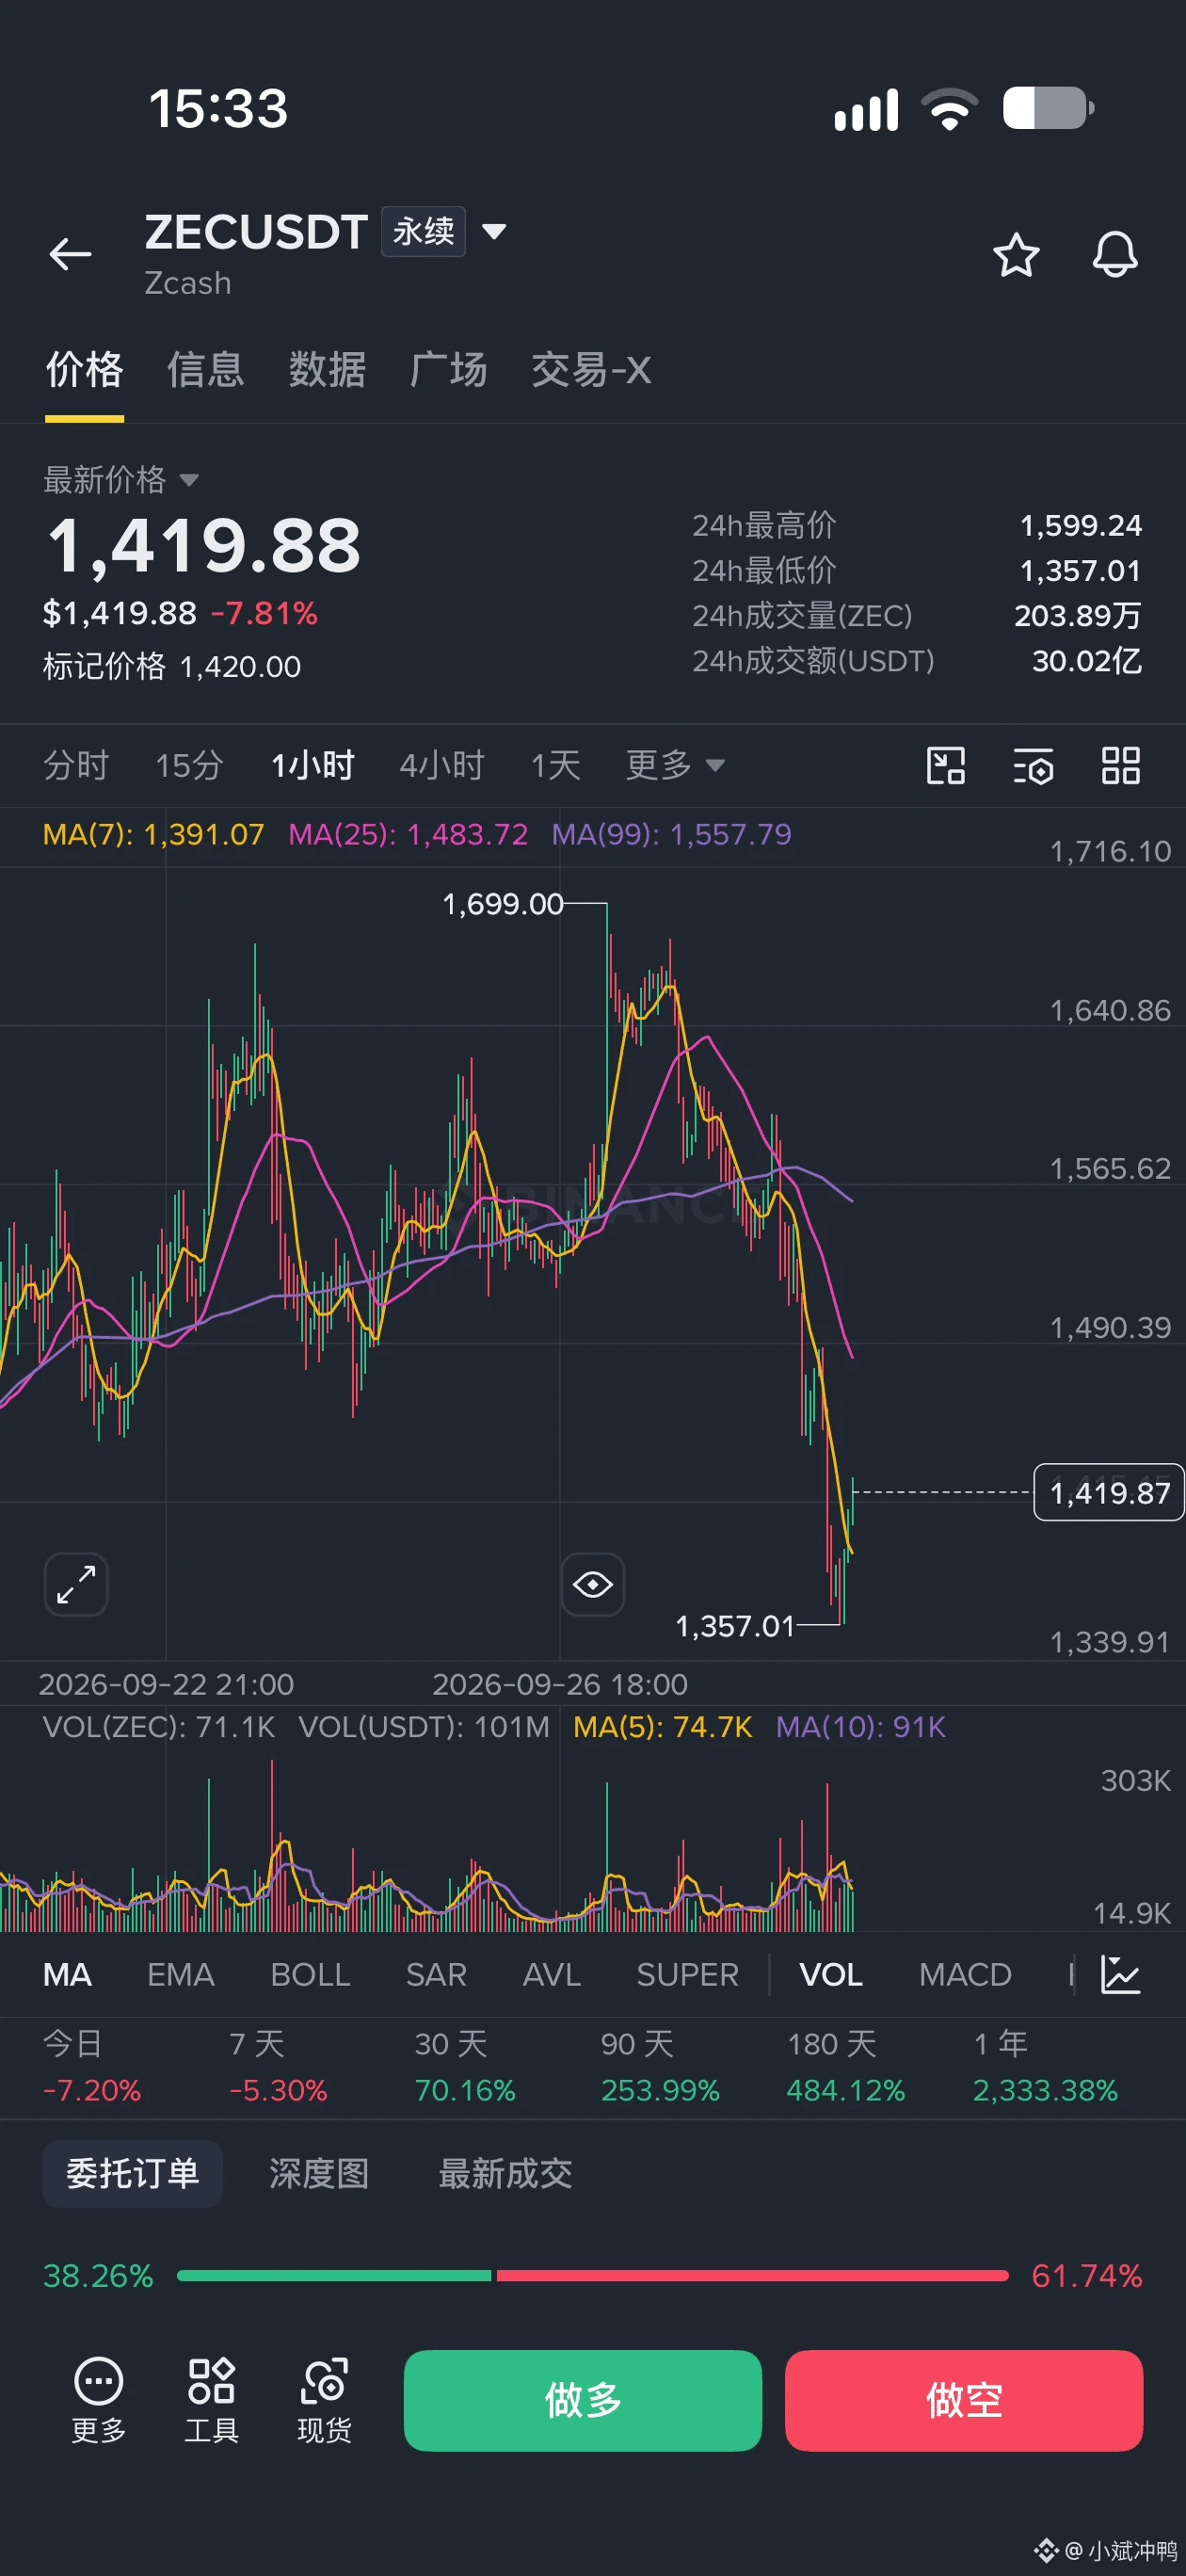
Look at the chart: $ZEC has been bleeding nonstop from the peak at 1683. Today, a single big bearish candle smashed it all the way to 1385—a nearly 9% drop in one day!
It was pumped so hard before, thanks to ETF news and the AI narrative. But now it falls just as badly.
The news can’t be propped up anymore either: “weak technicals and the NFT ecosystem’s failure affecting Zcash’s prospects.”
Even the basic foundation has gone bad—what can possibly hold up the price at 1600? It’s only being forced to hold by retail leverage and faith.
Now look at the macro picture: the NFP and PCE data are coming in a nonstop chain, and the probability of a rate hike in October is already nearing 70%. But I want to tell you—don’t rush to buy the dip.
For these knockoff “wild-card” coins, once a downward trend forms, the momentum can be terrifying.
This is just a rehearsal—the real waterfall is still coming.
This time, I’ll keep standing with the bears. See you at the foot of the hill!
I can’t take it anymore—surely the dog-coin prop shop can’t hold on anymore, right?
Do you think this move is already over?
No, it isn’t over. This is just the beginning.
With these knockoff “wild-card” coins, once you trigger one major crash, what awaits it are countless more big crashes.
Look at the chart: $ZEC has been bleeding nonstop from the peak at 1683. Today, a single big bearish candle smashed it all the way to 1385—a nearly 9% drop in one day!
It was pumped so hard before, thanks to ETF news and the AI narrative. But now it falls just as badly.
The news can’t be propped up anymore either: “weak technicals and the NFT ecosystem’s failure affecting Zcash’s prospects.”
Even the basic foundation has gone bad—what can possibly hold up the price at 1600? It’s only being forced to hold by retail leverage and faith.
Now look at the macro picture: the NFP and PCE data are coming in a nonstop chain, and the probability of a rate hike in October is already nearing 70%. But I want to tell you—don’t rush to buy the dip.
For these knockoff “wild-card” coins, once a downward trend forms, the momentum can be terrifying.
This is just a rehearsal—the real waterfall is still coming.
This time, I’ll keep standing with the bears. See you at the foot of the hill!
Do you think this move is already over?
No, it isn’t over. This is just the beginning.
With these knockoff “wild-card” coins, once you trigger one major crash, what awaits it are countless more big crashes.
Look at the chart: $ZEC has been bleeding nonstop from the peak at 1683. Today, a single big bearish candle smashed it all the way to 1385—a nearly 9% drop in one day!
It was pumped so hard before, thanks to ETF news and the AI narrative. But now it falls just as badly.
The news can’t be propped up anymore either: “weak technicals and the NFT ecosystem’s failure affecting Zcash’s prospects.”
Even the basic foundation has gone bad—what can possibly hold up the price at 1600? It’s only being forced to hold by retail leverage and faith.
Now look at the macro picture: the NFP and PCE data are coming in a nonstop chain, and the probability of a rate hike in October is already nearing 70%. But I want to tell you—don’t rush to buy the dip.
For these knockoff “wild-card” coins, once a downward trend forms, the momentum can be terrifying.
This is just a rehearsal—the real waterfall is still coming.
This time, I’ll keep standing with the bears. See you at the foot of the hill!
2
1
1.6k
·
--
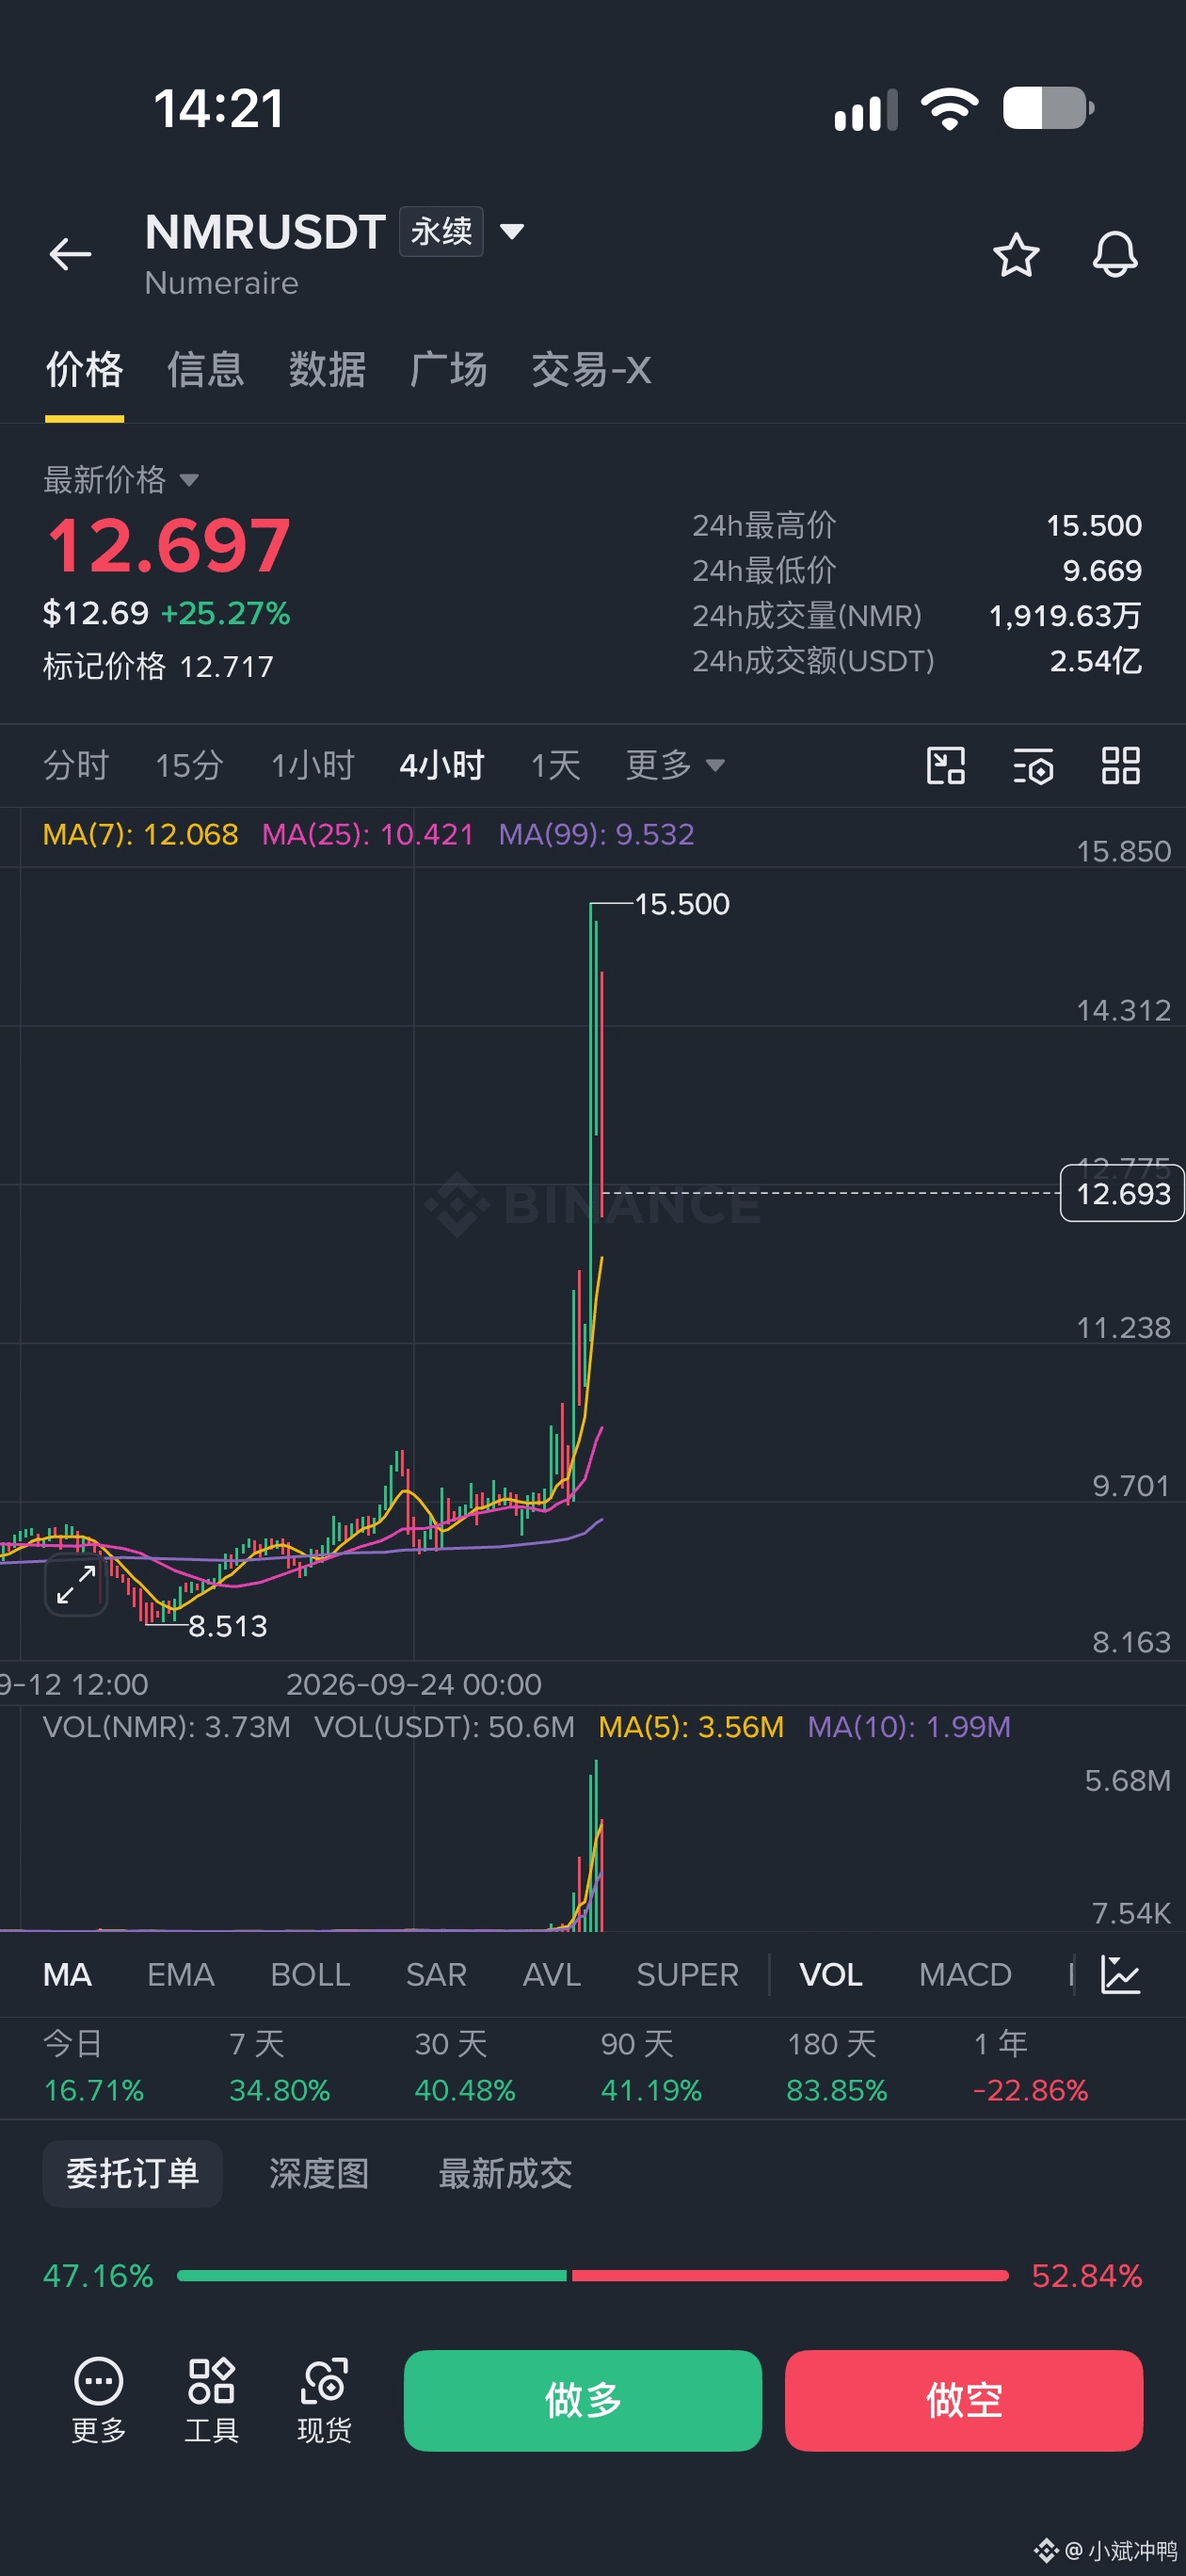
Brothers, look at this $NMR move—within 4 hours it jumped from 8.5 to 15.5, a doubling run. Now it’s pulling back to 12.7.
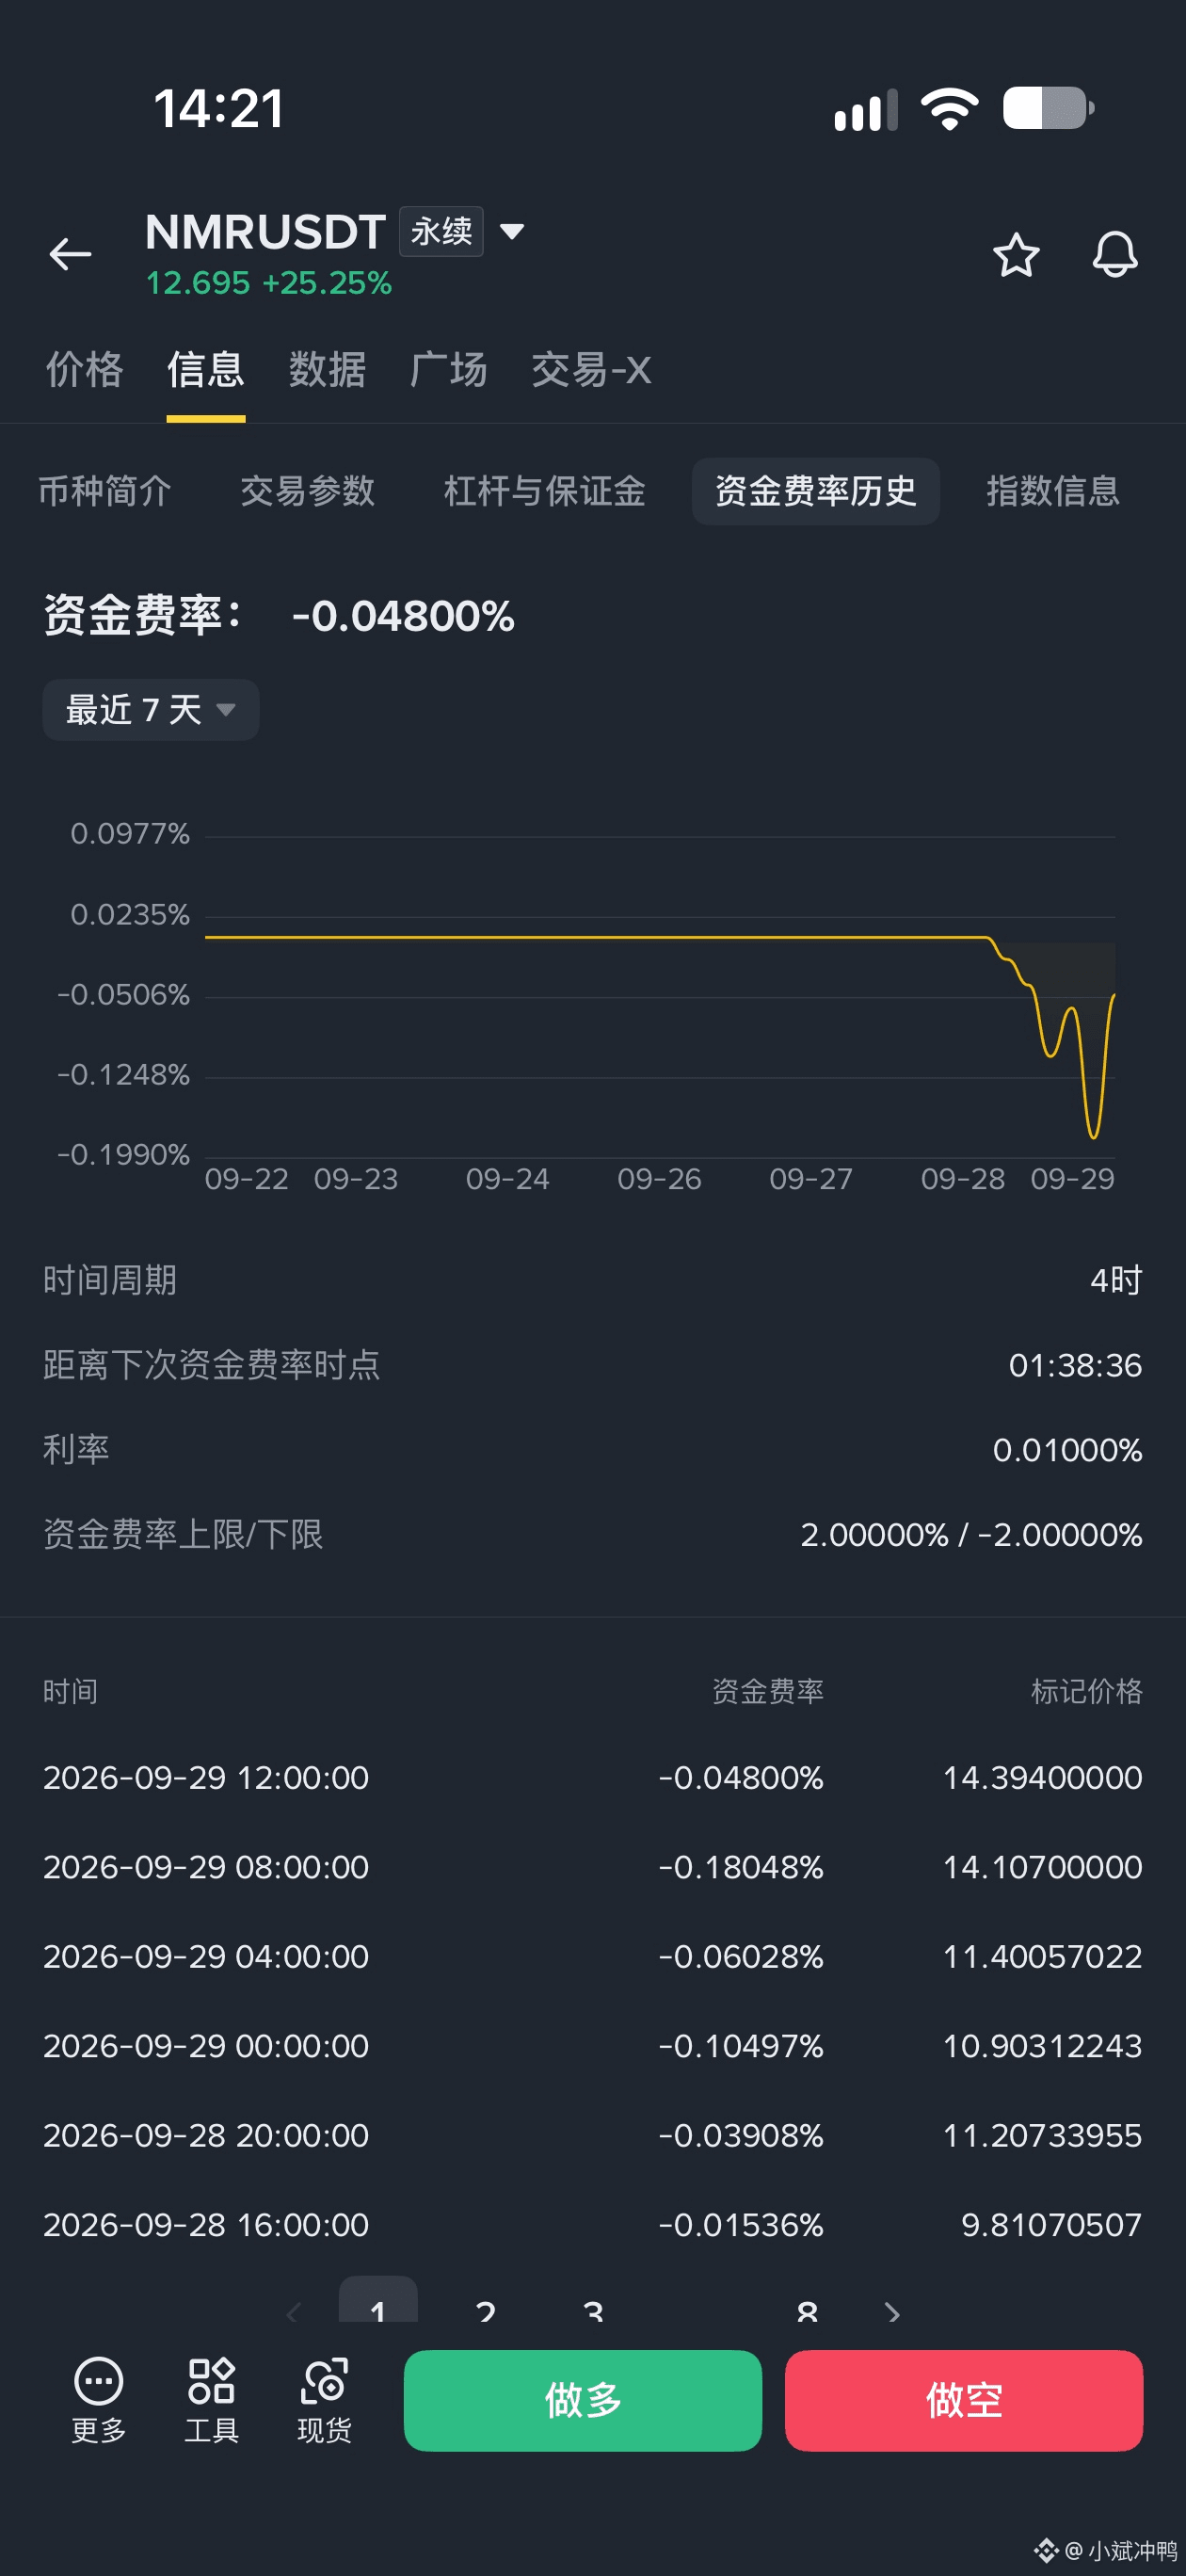
The key isn’t how much it’s gone up, it’s the funding rate. It’s currently -0.048%, and the last 6 straight periods have all been negative. In that one at dawn, it went all the way to -0.18%.
In plain human terms: there are too many shorts. The shorts are essentially paying money to the longs’ positions.
Now look at the long/short ratio in the bottom-right corner. 52.8% are short positions. Retail is flocking in to chase shorts, thinking it pumped too hard and must be due for a pullback.
But I actually don’t dare to short. With the funding rate this negative, there’s a pile of shorts up top waiting to get liquidated. If the market maker just pulls it up with another big green candle, it can trigger a chain liquidation. When shorts close, it pushes the price even higher—classic squeeze setup.
This run went from 9.6 to 15.5. In 24h, the volume was 250 million U. That’s not a size retail traders can produce.
The current pullback looks more like a shakeout, not a top.
Don’t see the big pump and get itchy to short. This kind of market-maker coin is best at burying everyone who chases shorts in the middle of the climb. If you want to join in, wait for the pullback to stabilize first—don’t go short against the trend and hand out money.
How high do you think NMR can go this time? Drop your target price in the comments.
$NMR #合约 #资金费率 #做空 #山寨币 #Numeraire
Brothers, look at this $NMR move—within 4 hours it jumped from 8.5 to 15.5, a doubling run. Now it’s pulling back to 12.7.
The key isn’t how much it’s gone up, it’s the funding rate. It’s currently -0.048%, and the last 6 straight periods have all been negative. In that one at dawn, it went all the way to -0.18%.
In plain human terms: there are too many shorts. The shorts are essentially paying money to the longs’ positions.
Now look at the long/short ratio in the bottom-right corner. 52.8% are short positions. Retail is flocking in to chase shorts, thinking it pumped too hard and must be due for a pullback.
But I actually don’t dare to short. With the funding rate this negative, there’s a pile of shorts up top waiting to get liquidated. If the market maker just pulls it up with another big green candle, it can trigger a chain liquidation. When shorts close, it pushes the price even higher—classic squeeze setup.
This run went from 9.6 to 15.5. In 24h, the volume was 250 million U. That’s not a size retail traders can produce.
The current pullback looks more like a shakeout, not a top.
Don’t see the big pump and get itchy to short. This kind of market-maker coin is best at burying everyone who chases shorts in the middle of the climb. If you want to join in, wait for the pullback to stabilize first—don’t go short against the trend and hand out money.
How high do you think NMR can go this time? Drop your target price in the comments.
$NMR #合约 #资金费率 #做空 #山寨币 #Numeraire
The key isn’t how much it’s gone up, it’s the funding rate. It’s currently -0.048%, and the last 6 straight periods have all been negative. In that one at dawn, it went all the way to -0.18%.
In plain human terms: there are too many shorts. The shorts are essentially paying money to the longs’ positions.
Now look at the long/short ratio in the bottom-right corner. 52.8% are short positions. Retail is flocking in to chase shorts, thinking it pumped too hard and must be due for a pullback.
But I actually don’t dare to short. With the funding rate this negative, there’s a pile of shorts up top waiting to get liquidated. If the market maker just pulls it up with another big green candle, it can trigger a chain liquidation. When shorts close, it pushes the price even higher—classic squeeze setup.
This run went from 9.6 to 15.5. In 24h, the volume was 250 million U. That’s not a size retail traders can produce.
The current pullback looks more like a shakeout, not a top.
Don’t see the big pump and get itchy to short. This kind of market-maker coin is best at burying everyone who chases shorts in the middle of the climb. If you want to join in, wait for the pullback to stabilize first—don’t go short against the trend and hand out money.
How high do you think NMR can go this time? Drop your target price in the comments.
$NMR #合约 #资金费率 #做空 #山寨币 #Numeraire
1
182
·
--
A famous photo spot—the big-mouthed fish—was pushed away today by a security guard using a small handcart.
A famous photo spot—the big-mouthed fish—was pushed away today by a security guard using a small handcart.



1.6k
·
--
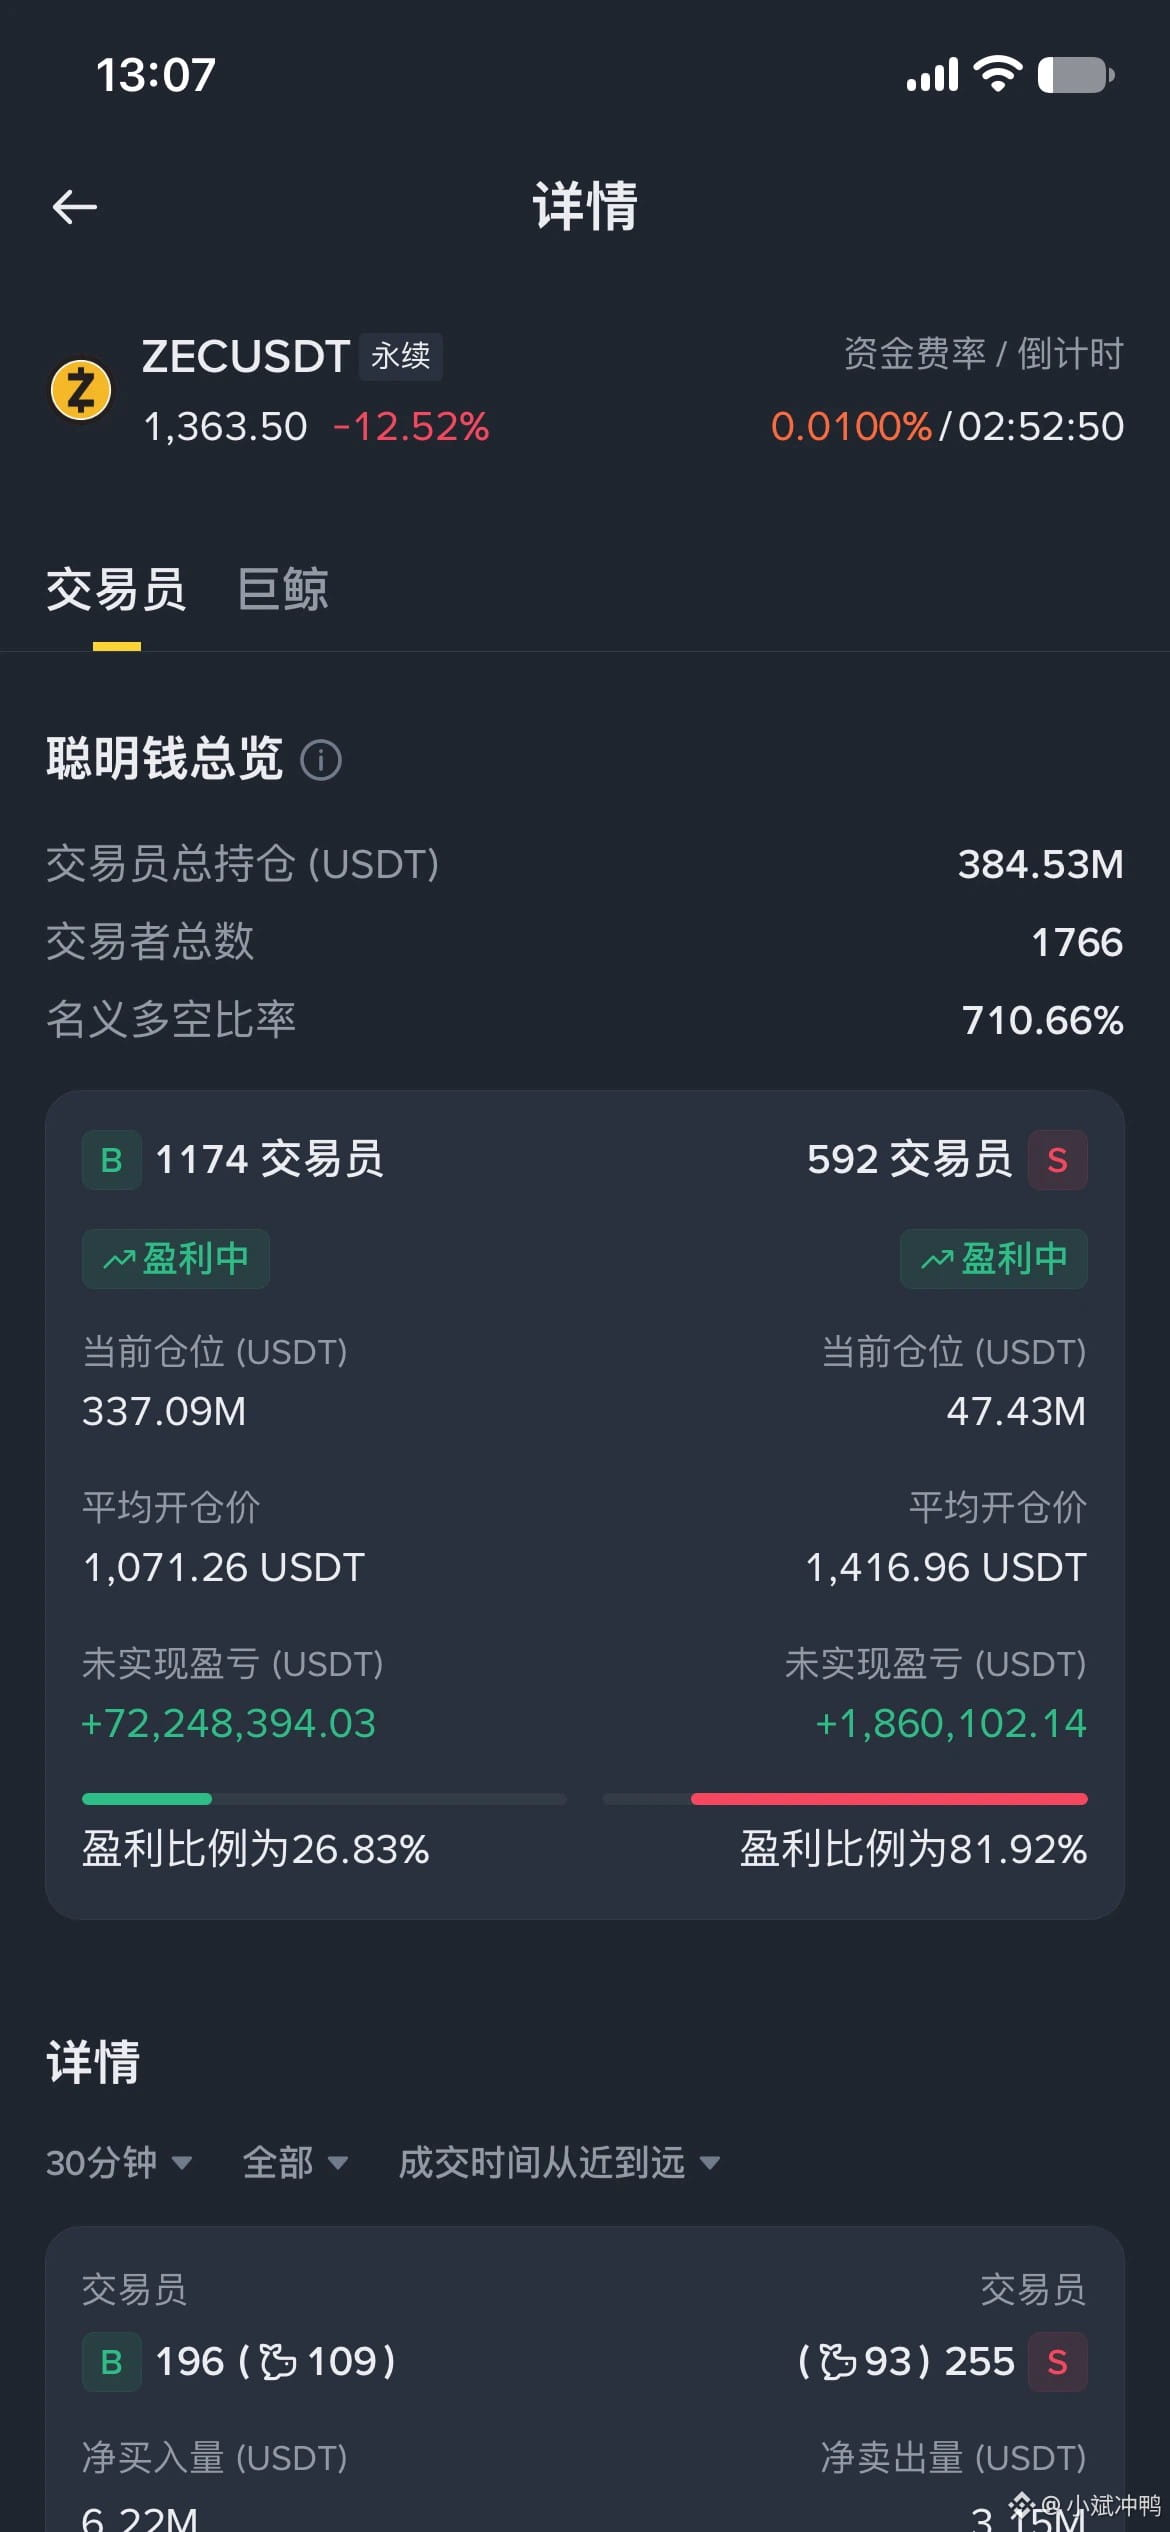
After looking at this chart, I literally laughed out loud.
ZEC is now at 1363, down 12 points in the past 24 hours—but guess what the average cost for these smart long bulls is? 1071. Yes, overall they’re still up by 72 million dollars, averaging a 27-point gain, with a profit cushion as thick as a wall.
But the problem is hidden in the line below: long positions total 337 million dollars, while shorts are only 47 million—so the nominal long/short ratio is 710%: longs are 7 times the shorts. Out of 1174 long orders, only 26.8% are truly profitable; the remaining 73% are stuck—people chased longs above 1400 and are now trapped.
Meanwhile on the short side, 592 accounts are all doing well—81.9% are in profit, and morale is high.
This structure is classic: a bunch of low-cost old longs are floating with thick profit like a solid wall, while below them a pile of late longs are losing after chasing at high levels; there are fewer shorts, but they’re all making money.
Let me be blunt: this coin will most likely move toward 1000.
The logic is simple. Once 1300 breaks, that 72 million profit cushion will shrink at a speed you can see with your own eyes. Old longs won’t play nice. For those who took it from 1071 to 1699, they’re still up 27% at 1363—but once it falls back to 1200, the cushion drops to 12% and people start running. Back at 1100, it’s basically pocket change. Then it becomes a “more kills more” cascade—selling accelerates directly.
What’s most terrifying is that 73% of the chased longs are already underwater. When 1300 breaks, their stop-losses trigger, and that’s the start of a fresh wave of selling pressure.
How it can pump from 1000 to 1700, it can also dump back to 1000. Whatever the longs gained, they’ll have to spit out on the way down—maybe even with extra losses.
When I rebounded to 1450, I added a bit of short, cut my stop at 1500, and my first target is 1200. If it breaks, I’ll look at that average cost of 1071.
Don’t tell me to argue about fundamentals and good news. Narrative is belief when it’s rising; when it falls, it becomes the excuse to unload.
Do you think ZEC can hold 1300? Or do you really think it’ll come back to 1000? Chat in the comments.
$ZEC #ZEC #合约 #做空 #多空比 #Binance Futures
After looking at this chart, I literally laughed out loud.
ZEC is now at 1363, down 12 points in the past 24 hours—but guess what the average cost for these smart long bulls is? 1071. Yes, overall they’re still up by 72 million dollars, averaging a 27-point gain, with a profit cushion as thick as a wall.
But the problem is hidden in the line below: long positions total 337 million dollars, while shorts are only 47 million—so the nominal long/short ratio is 710%: longs are 7 times the shorts. Out of 1174 long orders, only 26.8% are truly profitable; the remaining 73% are stuck—people chased longs above 1400 and are now trapped.
Meanwhile on the short side, 592 accounts are all doing well—81.9% are in profit, and morale is high.
This structure is classic: a bunch of low-cost old longs are floating with thick profit like a solid wall, while below them a pile of late longs are losing after chasing at high levels; there are fewer shorts, but they’re all making money.
Let me be blunt: this coin will most likely move toward 1000.
The logic is simple. Once 1300 breaks, that 72 million profit cushion will shrink at a speed you can see with your own eyes. Old longs won’t play nice. For those who took it from 1071 to 1699, they’re still up 27% at 1363—but once it falls back to 1200, the cushion drops to 12% and people start running. Back at 1100, it’s basically pocket change. Then it becomes a “more kills more” cascade—selling accelerates directly.
What’s most terrifying is that 73% of the chased longs are already underwater. When 1300 breaks, their stop-losses trigger, and that’s the start of a fresh wave of selling pressure.
How it can pump from 1000 to 1700, it can also dump back to 1000. Whatever the longs gained, they’ll have to spit out on the way down—maybe even with extra losses.
When I rebounded to 1450, I added a bit of short, cut my stop at 1500, and my first target is 1200. If it breaks, I’ll look at that average cost of 1071.
Don’t tell me to argue about fundamentals and good news. Narrative is belief when it’s rising; when it falls, it becomes the excuse to unload.
Do you think ZEC can hold 1300? Or do you really think it’ll come back to 1000? Chat in the comments.
$ZEC #ZEC #合约 #做空 #多空比 #Binance Futures
ZEC is now at 1363, down 12 points in the past 24 hours—but guess what the average cost for these smart long bulls is? 1071. Yes, overall they’re still up by 72 million dollars, averaging a 27-point gain, with a profit cushion as thick as a wall.
But the problem is hidden in the line below: long positions total 337 million dollars, while shorts are only 47 million—so the nominal long/short ratio is 710%: longs are 7 times the shorts. Out of 1174 long orders, only 26.8% are truly profitable; the remaining 73% are stuck—people chased longs above 1400 and are now trapped.
Meanwhile on the short side, 592 accounts are all doing well—81.9% are in profit, and morale is high.
This structure is classic: a bunch of low-cost old longs are floating with thick profit like a solid wall, while below them a pile of late longs are losing after chasing at high levels; there are fewer shorts, but they’re all making money.
Let me be blunt: this coin will most likely move toward 1000.
The logic is simple. Once 1300 breaks, that 72 million profit cushion will shrink at a speed you can see with your own eyes. Old longs won’t play nice. For those who took it from 1071 to 1699, they’re still up 27% at 1363—but once it falls back to 1200, the cushion drops to 12% and people start running. Back at 1100, it’s basically pocket change. Then it becomes a “more kills more” cascade—selling accelerates directly.
What’s most terrifying is that 73% of the chased longs are already underwater. When 1300 breaks, their stop-losses trigger, and that’s the start of a fresh wave of selling pressure.
How it can pump from 1000 to 1700, it can also dump back to 1000. Whatever the longs gained, they’ll have to spit out on the way down—maybe even with extra losses.
When I rebounded to 1450, I added a bit of short, cut my stop at 1500, and my first target is 1200. If it breaks, I’ll look at that average cost of 1071.
Don’t tell me to argue about fundamentals and good news. Narrative is belief when it’s rising; when it falls, it becomes the excuse to unload.
Do you think ZEC can hold 1300? Or do you really think it’ll come back to 1000? Chat in the comments.
$ZEC #ZEC #合约 #做空 #多空比 #Binance Futures
4
2
8.9k
·
--
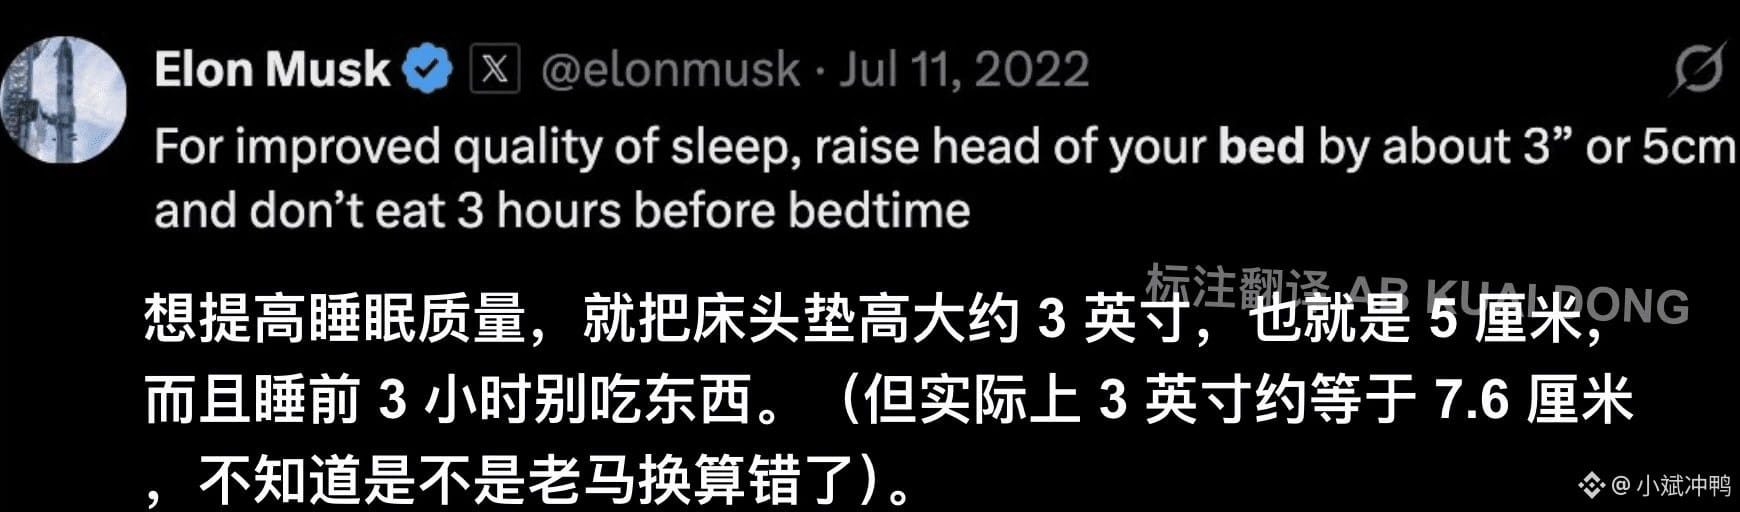
I scrolled and found that old Musk tweet from 22 years ago—someone dug it back up. It’s about sleep. The comments are full of people saying, “tried it, and it’s genuinely great.” I’m going to jot it down quickly.
He basically has just two points:
First, raise the side of the bed by about 3 inches (he writes 5 cm in parentheses, but 3 inches is actually close to 7.6 cm—Musk’s conversions have always been a bit loose, you know the type).
Second, add one more rule: don’t put anything else in your mouth for the last 3 hours before bed.
It sounds like nonsense, but the reasoning underneath isn’t really new:
Elevating the head of the bed creates a slight incline for the upper body. Gravity helps keep stomach acid pressed down in the stomach so it doesn’t creep upward. At the same time, the airway opens a bit more, so snoring and sleep apnea—waking up gasping in the middle of the night—can be reduced.
So people who wake up in the morning without a headache or a sour, dry mouth often use this posture.
Fasting for 3 hours before bed is even more direct: with food sitting in your stomach and lying flat, the chance of acid reflux basically doubles. Deep sleep gets fragmented too, and you’re more likely to wake up during the night.
There really are people in the comments saying they tried it for a week: their roommates stopped complaining about their snoring, and when they open their eyes in the morning, they feel alert—not like that “hangover” feeling you get after someone hits you in the head.
Tonight I’m planning to prop up the head of my bed using those two thick books—has anyone here actually tried it? Is it really that amazing, or is it just a psychological effect?
#睡眠 #健康生活 #马斯克 #熬夜党 #workpeople
I scrolled and found that old Musk tweet from 22 years ago—someone dug it back up. It’s about sleep. The comments are full of people saying, “tried it, and it’s genuinely great.” I’m going to jot it down quickly.
He basically has just two points:
First, raise the side of the bed by about 3 inches (he writes 5 cm in parentheses, but 3 inches is actually close to 7.6 cm—Musk’s conversions have always been a bit loose, you know the type).
Second, add one more rule: don’t put anything else in your mouth for the last 3 hours before bed.
It sounds like nonsense, but the reasoning underneath isn’t really new:
Elevating the head of the bed creates a slight incline for the upper body. Gravity helps keep stomach acid pressed down in the stomach so it doesn’t creep upward. At the same time, the airway opens a bit more, so snoring and sleep apnea—waking up gasping in the middle of the night—can be reduced.
So people who wake up in the morning without a headache or a sour, dry mouth often use this posture.
Fasting for 3 hours before bed is even more direct: with food sitting in your stomach and lying flat, the chance of acid reflux basically doubles. Deep sleep gets fragmented too, and you’re more likely to wake up during the night.
There really are people in the comments saying they tried it for a week: their roommates stopped complaining about their snoring, and when they open their eyes in the morning, they feel alert—not like that “hangover” feeling you get after someone hits you in the head.
Tonight I’m planning to prop up the head of my bed using those two thick books—has anyone here actually tried it? Is it really that amazing, or is it just a psychological effect?
#睡眠 #健康生活 #马斯克 #熬夜党 #workpeople
He basically has just two points:
First, raise the side of the bed by about 3 inches (he writes 5 cm in parentheses, but 3 inches is actually close to 7.6 cm—Musk’s conversions have always been a bit loose, you know the type).
Second, add one more rule: don’t put anything else in your mouth for the last 3 hours before bed.
It sounds like nonsense, but the reasoning underneath isn’t really new:
Elevating the head of the bed creates a slight incline for the upper body. Gravity helps keep stomach acid pressed down in the stomach so it doesn’t creep upward. At the same time, the airway opens a bit more, so snoring and sleep apnea—waking up gasping in the middle of the night—can be reduced.
So people who wake up in the morning without a headache or a sour, dry mouth often use this posture.
Fasting for 3 hours before bed is even more direct: with food sitting in your stomach and lying flat, the chance of acid reflux basically doubles. Deep sleep gets fragmented too, and you’re more likely to wake up during the night.
There really are people in the comments saying they tried it for a week: their roommates stopped complaining about their snoring, and when they open their eyes in the morning, they feel alert—not like that “hangover” feeling you get after someone hits you in the head.
Tonight I’m planning to prop up the head of my bed using those two thick books—has anyone here actually tried it? Is it really that amazing, or is it just a psychological effect?
#睡眠 #健康生活 #马斯克 #熬夜党 #workpeople
2k
·
--
I basically slashed my neck with this ZEC blade.
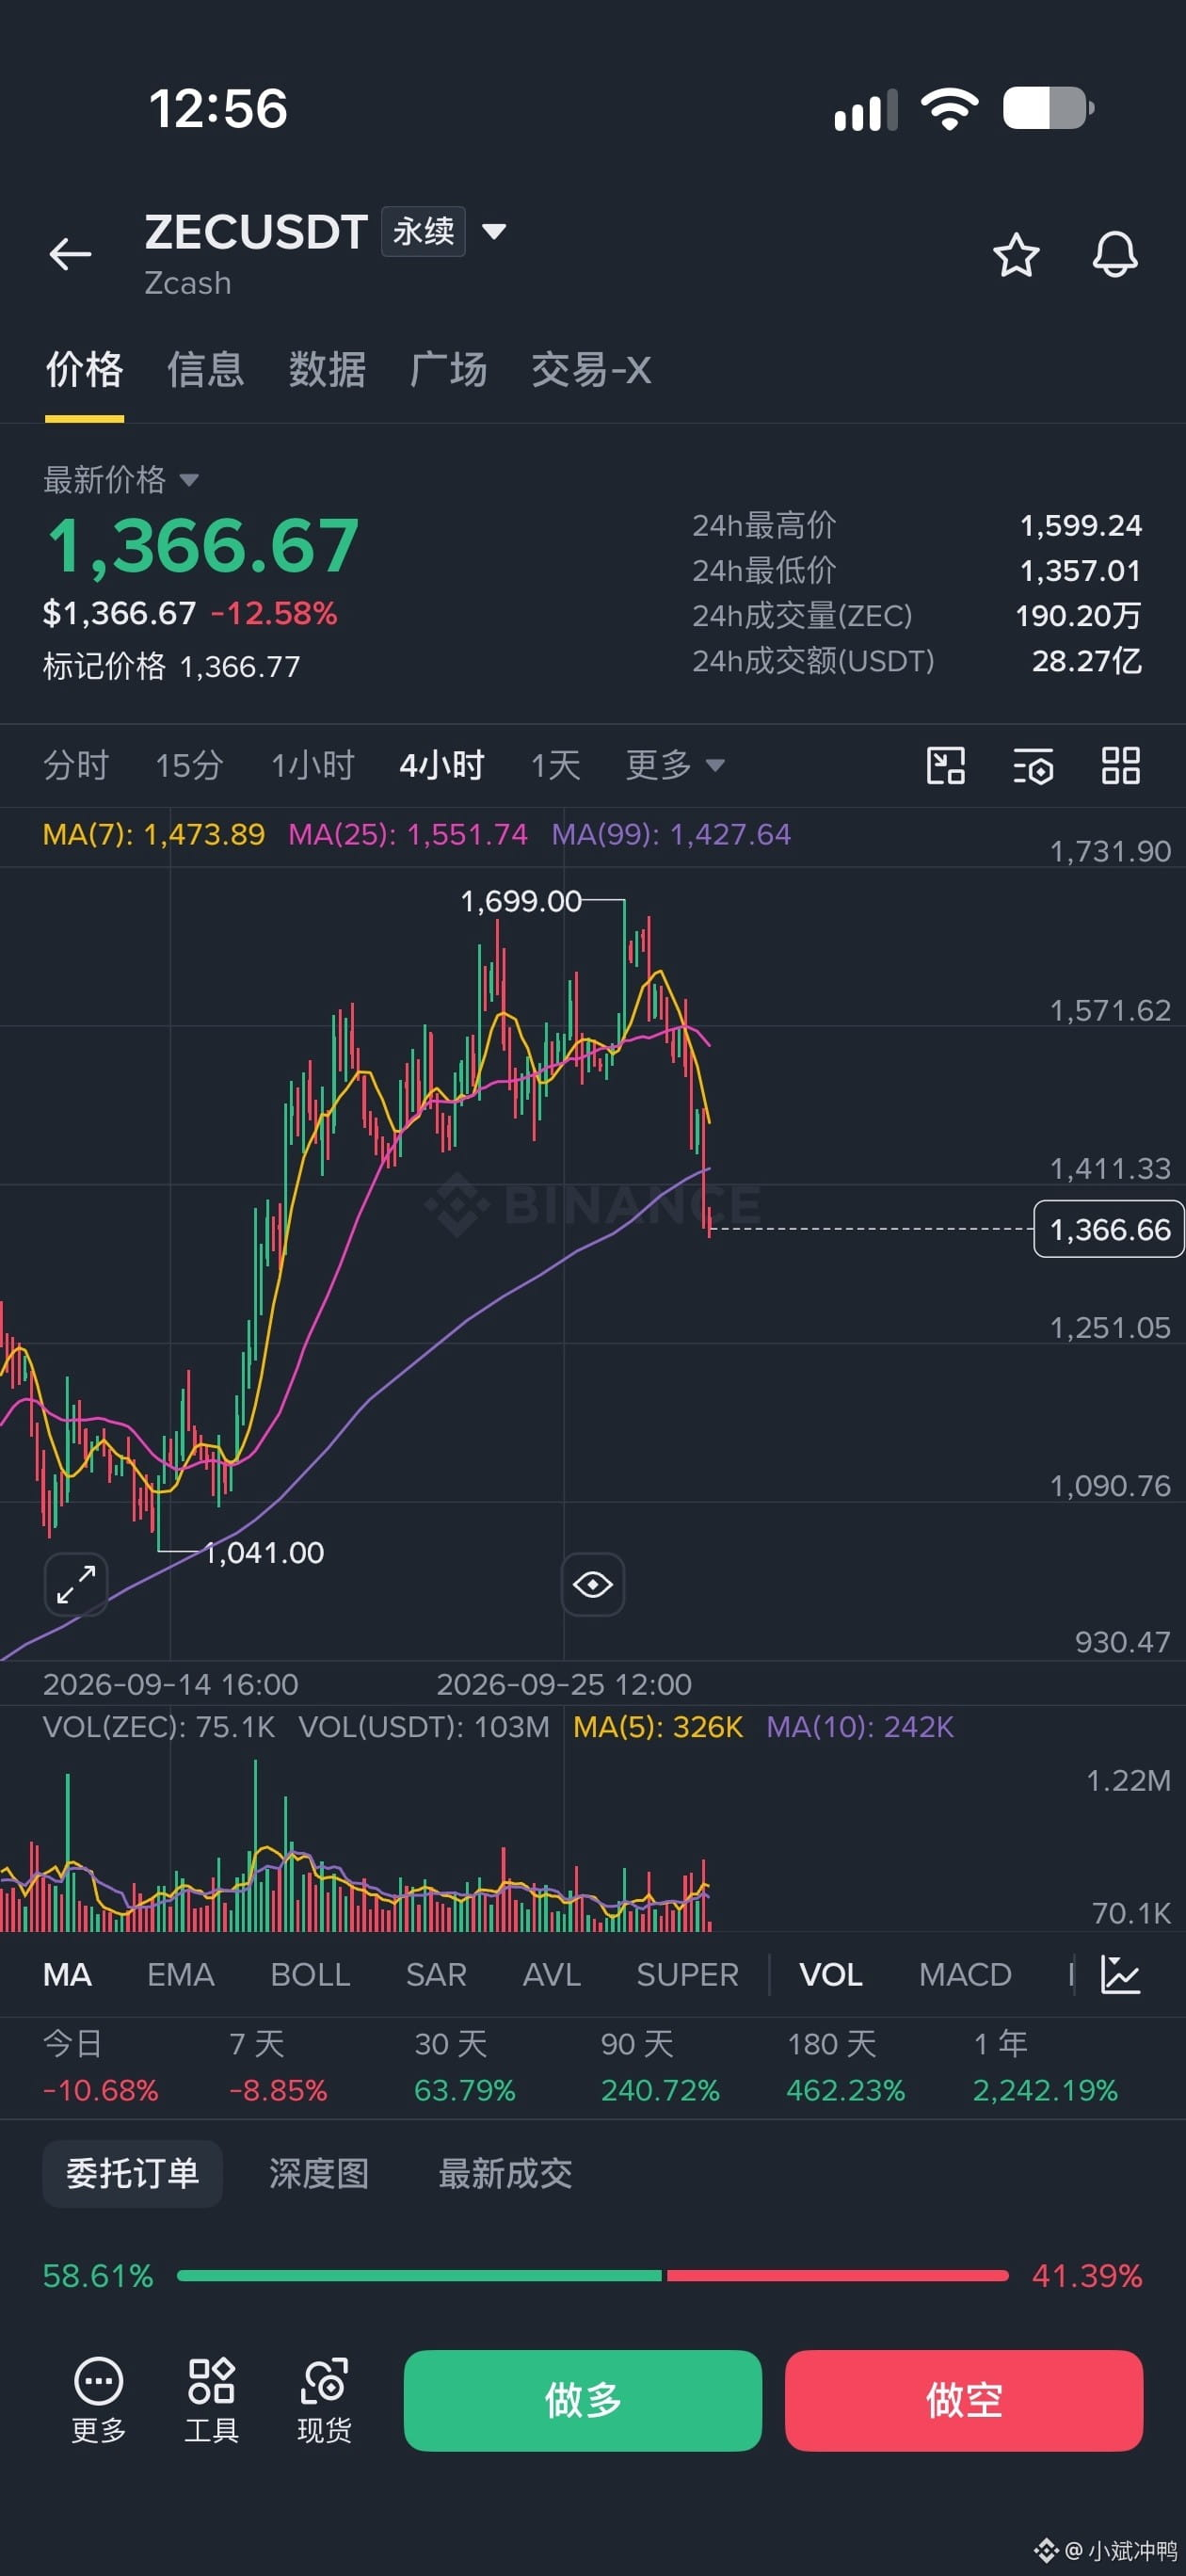
This morning it was still hovering above 1500. A 4h candle directly crashed to 1357. In the next 24h it’s already down nearly 13 points; counting from the peak of the wave at 1699, that’s already almost 20 points.
Look at the volume on the chart—one line of selling dumped 510,000 ZEC. The longs really got pinned down and rubbed into the ground. That big green candle—I've been staring at it for half an hour; my hands were shaking.
Let me talk about the reason I dug up. In reality, there’s nothing new about a project blowing up—it's just that it has surged too wildly plus leverage got too crowded. Over 90 days it jumped 240%. A monthly line move of 83 points—this kind of upside is basically always due for payback.
Previously, contract OI ran up to $1.35B, and it was all chasing longs. This round’s cascading liquidations cut OI down to just over $600M—meaning about half the leverage was force-liquidated. On top of that, before Trump’s Oval Office speech, the whole market went risk-off. The ECB then hiked rates again. And Wang Chun came out a few days ago to rant about ZEC—he said it’s just narrative trading. Also, the news about the ECC exiting the development agreement has been fermenting too. A few different bad things piled together.
As for my own plan:
At this position, I feel uneasy about chasing shorts. 1357 already got stepped on and it’s starting to shrink volume; funding rate has also fallen back to around 0.01%, basically neutral. The long leverage has basically been washed out enough. I’m planning to first watch whether 1350 can hold. If it holds, I’ll lightly look for a rebound to touch that purple line at 1420–1450 (that was the MA99 area before—once it broke, it becomes resistance). I’ll place the stop loss below 1330.
If 1350 breaks directly, don’t hesitate. Look for 1280–1300, the previous base platform, below. On the other hand, if it rebounds back to around 1450 and can’t stay above it, that’s the spot for a second short. Stop loss above 1500, target looking for a break below 1350.
Don’t learn from me—control your own position size. After a coin just blasts out of liquidations, getting poked back up is ruthless for anyone who’s left.
What do you think? Is it more likely to rebound long, or keep shorting? Drop your thoughts in the comments.
$ZEC #Zcash #合约 #做空 #山寨币 #privacy coin
I basically slashed my neck with this ZEC blade.
This morning it was still hovering above 1500. A 4h candle directly crashed to 1357. In the next 24h it’s already down nearly 13 points; counting from the peak of the wave at 1699, that’s already almost 20 points.
Look at the volume on the chart—one line of selling dumped 510,000 ZEC. The longs really got pinned down and rubbed into the ground. That big green candle—I've been staring at it for half an hour; my hands were shaking.
Let me talk about the reason I dug up. In reality, there’s nothing new about a project blowing up—it's just that it has surged too wildly plus leverage got too crowded. Over 90 days it jumped 240%. A monthly line move of 83 points—this kind of upside is basically always due for payback.
Previously, contract OI ran up to $1.35B, and it was all chasing longs. This round’s cascading liquidations cut OI down to just over $600M—meaning about half the leverage was force-liquidated. On top of that, before Trump’s Oval Office speech, the whole market went risk-off. The ECB then hiked rates again. And Wang Chun came out a few days ago to rant about ZEC—he said it’s just narrative trading. Also, the news about the ECC exiting the development agreement has been fermenting too. A few different bad things piled together.
As for my own plan:
At this position, I feel uneasy about chasing shorts. 1357 already got stepped on and it’s starting to shrink volume; funding rate has also fallen back to around 0.01%, basically neutral. The long leverage has basically been washed out enough. I’m planning to first watch whether 1350 can hold. If it holds, I’ll lightly look for a rebound to touch that purple line at 1420–1450 (that was the MA99 area before—once it broke, it becomes resistance). I’ll place the stop loss below 1330.
If 1350 breaks directly, don’t hesitate. Look for 1280–1300, the previous base platform, below. On the other hand, if it rebounds back to around 1450 and can’t stay above it, that’s the spot for a second short. Stop loss above 1500, target looking for a break below 1350.
Don’t learn from me—control your own position size. After a coin just blasts out of liquidations, getting poked back up is ruthless for anyone who’s left.
What do you think? Is it more likely to rebound long, or keep shorting? Drop your thoughts in the comments.
$ZEC #Zcash #合约 #做空 #山寨币 #privacy coin
This morning it was still hovering above 1500. A 4h candle directly crashed to 1357. In the next 24h it’s already down nearly 13 points; counting from the peak of the wave at 1699, that’s already almost 20 points.
Look at the volume on the chart—one line of selling dumped 510,000 ZEC. The longs really got pinned down and rubbed into the ground. That big green candle—I've been staring at it for half an hour; my hands were shaking.
Let me talk about the reason I dug up. In reality, there’s nothing new about a project blowing up—it's just that it has surged too wildly plus leverage got too crowded. Over 90 days it jumped 240%. A monthly line move of 83 points—this kind of upside is basically always due for payback.
Previously, contract OI ran up to $1.35B, and it was all chasing longs. This round’s cascading liquidations cut OI down to just over $600M—meaning about half the leverage was force-liquidated. On top of that, before Trump’s Oval Office speech, the whole market went risk-off. The ECB then hiked rates again. And Wang Chun came out a few days ago to rant about ZEC—he said it’s just narrative trading. Also, the news about the ECC exiting the development agreement has been fermenting too. A few different bad things piled together.
As for my own plan:
At this position, I feel uneasy about chasing shorts. 1357 already got stepped on and it’s starting to shrink volume; funding rate has also fallen back to around 0.01%, basically neutral. The long leverage has basically been washed out enough. I’m planning to first watch whether 1350 can hold. If it holds, I’ll lightly look for a rebound to touch that purple line at 1420–1450 (that was the MA99 area before—once it broke, it becomes resistance). I’ll place the stop loss below 1330.
If 1350 breaks directly, don’t hesitate. Look for 1280–1300, the previous base platform, below. On the other hand, if it rebounds back to around 1450 and can’t stay above it, that’s the spot for a second short. Stop loss above 1500, target looking for a break below 1350.
Don’t learn from me—control your own position size. After a coin just blasts out of liquidations, getting poked back up is ruthless for anyone who’s left.
What do you think? Is it more likely to rebound long, or keep shorting? Drop your thoughts in the comments.
$ZEC #Zcash #合约 #做空 #山寨币 #privacy coin
615
·
--

Article
When can Ethereum break $5,000?$2,686.
This is ETH’s price right now. It’s still 86% away from $5,000.
Recently, there’s noticeably more talk about ETH in the community: ETF net inflows have broken $1 billion for two straight weeks, the Glamsterdam upgrade will more than triple the Gas Limit, the CLARITY Act regulation has been implemented, and staking has been clearly stated as not constituting a security… good news one after another. But when I pulled the contract data, I found a weird signal: on Binance USD (U)-denominated perpetual contracts, the share of accounts across the whole network that are net-long ETH has already reached 72.6%.
Plain English translation: 3 out of every 4 people with open positions are going long.
When can Ethereum break $5,000?
$2,686.
This is ETH’s price right now. It’s still 86% away from $5,000.
Recently, there’s noticeably more talk about ETH in the community: ETF net inflows have broken $1 billion for two straight weeks, the Glamsterdam upgrade will more than triple the Gas Limit, the CLARITY Act regulation has been implemented, and staking has been clearly stated as not constituting a security… good news one after another. But when I pulled the contract data, I found a weird signal: on Binance USD (U)-denominated perpetual contracts, the share of accounts across the whole network that are net-long ETH has already reached 72.6%.
Plain English translation: 3 out of every 4 people with open positions are going long.
This is ETH’s price right now. It’s still 86% away from $5,000.
Recently, there’s noticeably more talk about ETH in the community: ETF net inflows have broken $1 billion for two straight weeks, the Glamsterdam upgrade will more than triple the Gas Limit, the CLARITY Act regulation has been implemented, and staking has been clearly stated as not constituting a security… good news one after another. But when I pulled the contract data, I found a weird signal: on Binance USD (U)-denominated perpetual contracts, the share of accounts across the whole network that are net-long ETH has already reached 72.6%.
Plain English translation: 3 out of every 4 people with open positions are going long.
220
·
--

Article
Don’t get fooled by the bounce: after the Fed restarted rate hikes, BTC’s real test is only just beginning84,000.
This number has been popping up in the community lately even more often than your mom’s催婚電話. Bulls and bears have been grinding it out here for three days: the bulls say, "A double bottom has formed—bullish flag." The bears say, "A descending triangle—breakdown is imminent." I went through all the on-chain data from the past week, contract positioning, and macro interest rates, and the conclusion might be quite different from what either side has been shouting on calls.
First, look at where we are standing now.
BTC has touched a high of 126,000 this year; now it’s at 84,000—an over 33% pullback. A lot of people think this already counts as a "major sell-off," but if you zoom out to a larger timeframe, that big bullish candle on September 4th—from 62,000 directly up to 80,000—was essentially a wave of short-covering driven by the marginal easing of rate-hike expectations, not a fundamental reversal. Then on September 16th, the Federal Reserve unanimously approved a 25bp increase to 3.75–4%. This is the first time it has restarted rate hikes since July 2023—that’s not a "policy shock" moment where the shoe drops; it’s the starting pistol.
Don’t get fooled by the bounce: after the Fed restarted rate hikes, BTC’s real test is only just beginning
84,000.
This number has been popping up in the community lately even more often than your mom’s催婚電話. Bulls and bears have been grinding it out here for three days: the bulls say, "A double bottom has formed—bullish flag." The bears say, "A descending triangle—breakdown is imminent." I went through all the on-chain data from the past week, contract positioning, and macro interest rates, and the conclusion might be quite different from what either side has been shouting on calls.
First, look at where we are standing now.
BTC has touched a high of 126,000 this year; now it’s at 84,000—an over 33% pullback. A lot of people think this already counts as a "major sell-off," but if you zoom out to a larger timeframe, that big bullish candle on September 4th—from 62,000 directly up to 80,000—was essentially a wave of short-covering driven by the marginal easing of rate-hike expectations, not a fundamental reversal. Then on September 16th, the Federal Reserve unanimously approved a 25bp increase to 3.75–4%. This is the first time it has restarted rate hikes since July 2023—that’s not a "policy shock" moment where the shoe drops; it’s the starting pistol.
This number has been popping up in the community lately even more often than your mom’s催婚電話. Bulls and bears have been grinding it out here for three days: the bulls say, "A double bottom has formed—bullish flag." The bears say, "A descending triangle—breakdown is imminent." I went through all the on-chain data from the past week, contract positioning, and macro interest rates, and the conclusion might be quite different from what either side has been shouting on calls.
First, look at where we are standing now.
BTC has touched a high of 126,000 this year; now it’s at 84,000—an over 33% pullback. A lot of people think this already counts as a "major sell-off," but if you zoom out to a larger timeframe, that big bullish candle on September 4th—from 62,000 directly up to 80,000—was essentially a wave of short-covering driven by the marginal easing of rate-hike expectations, not a fundamental reversal. Then on September 16th, the Federal Reserve unanimously approved a 25bp increase to 3.75–4%. This is the first time it has restarted rate hikes since July 2023—that’s not a "policy shock" moment where the shoe drops; it’s the starting pistol.
241
·
--
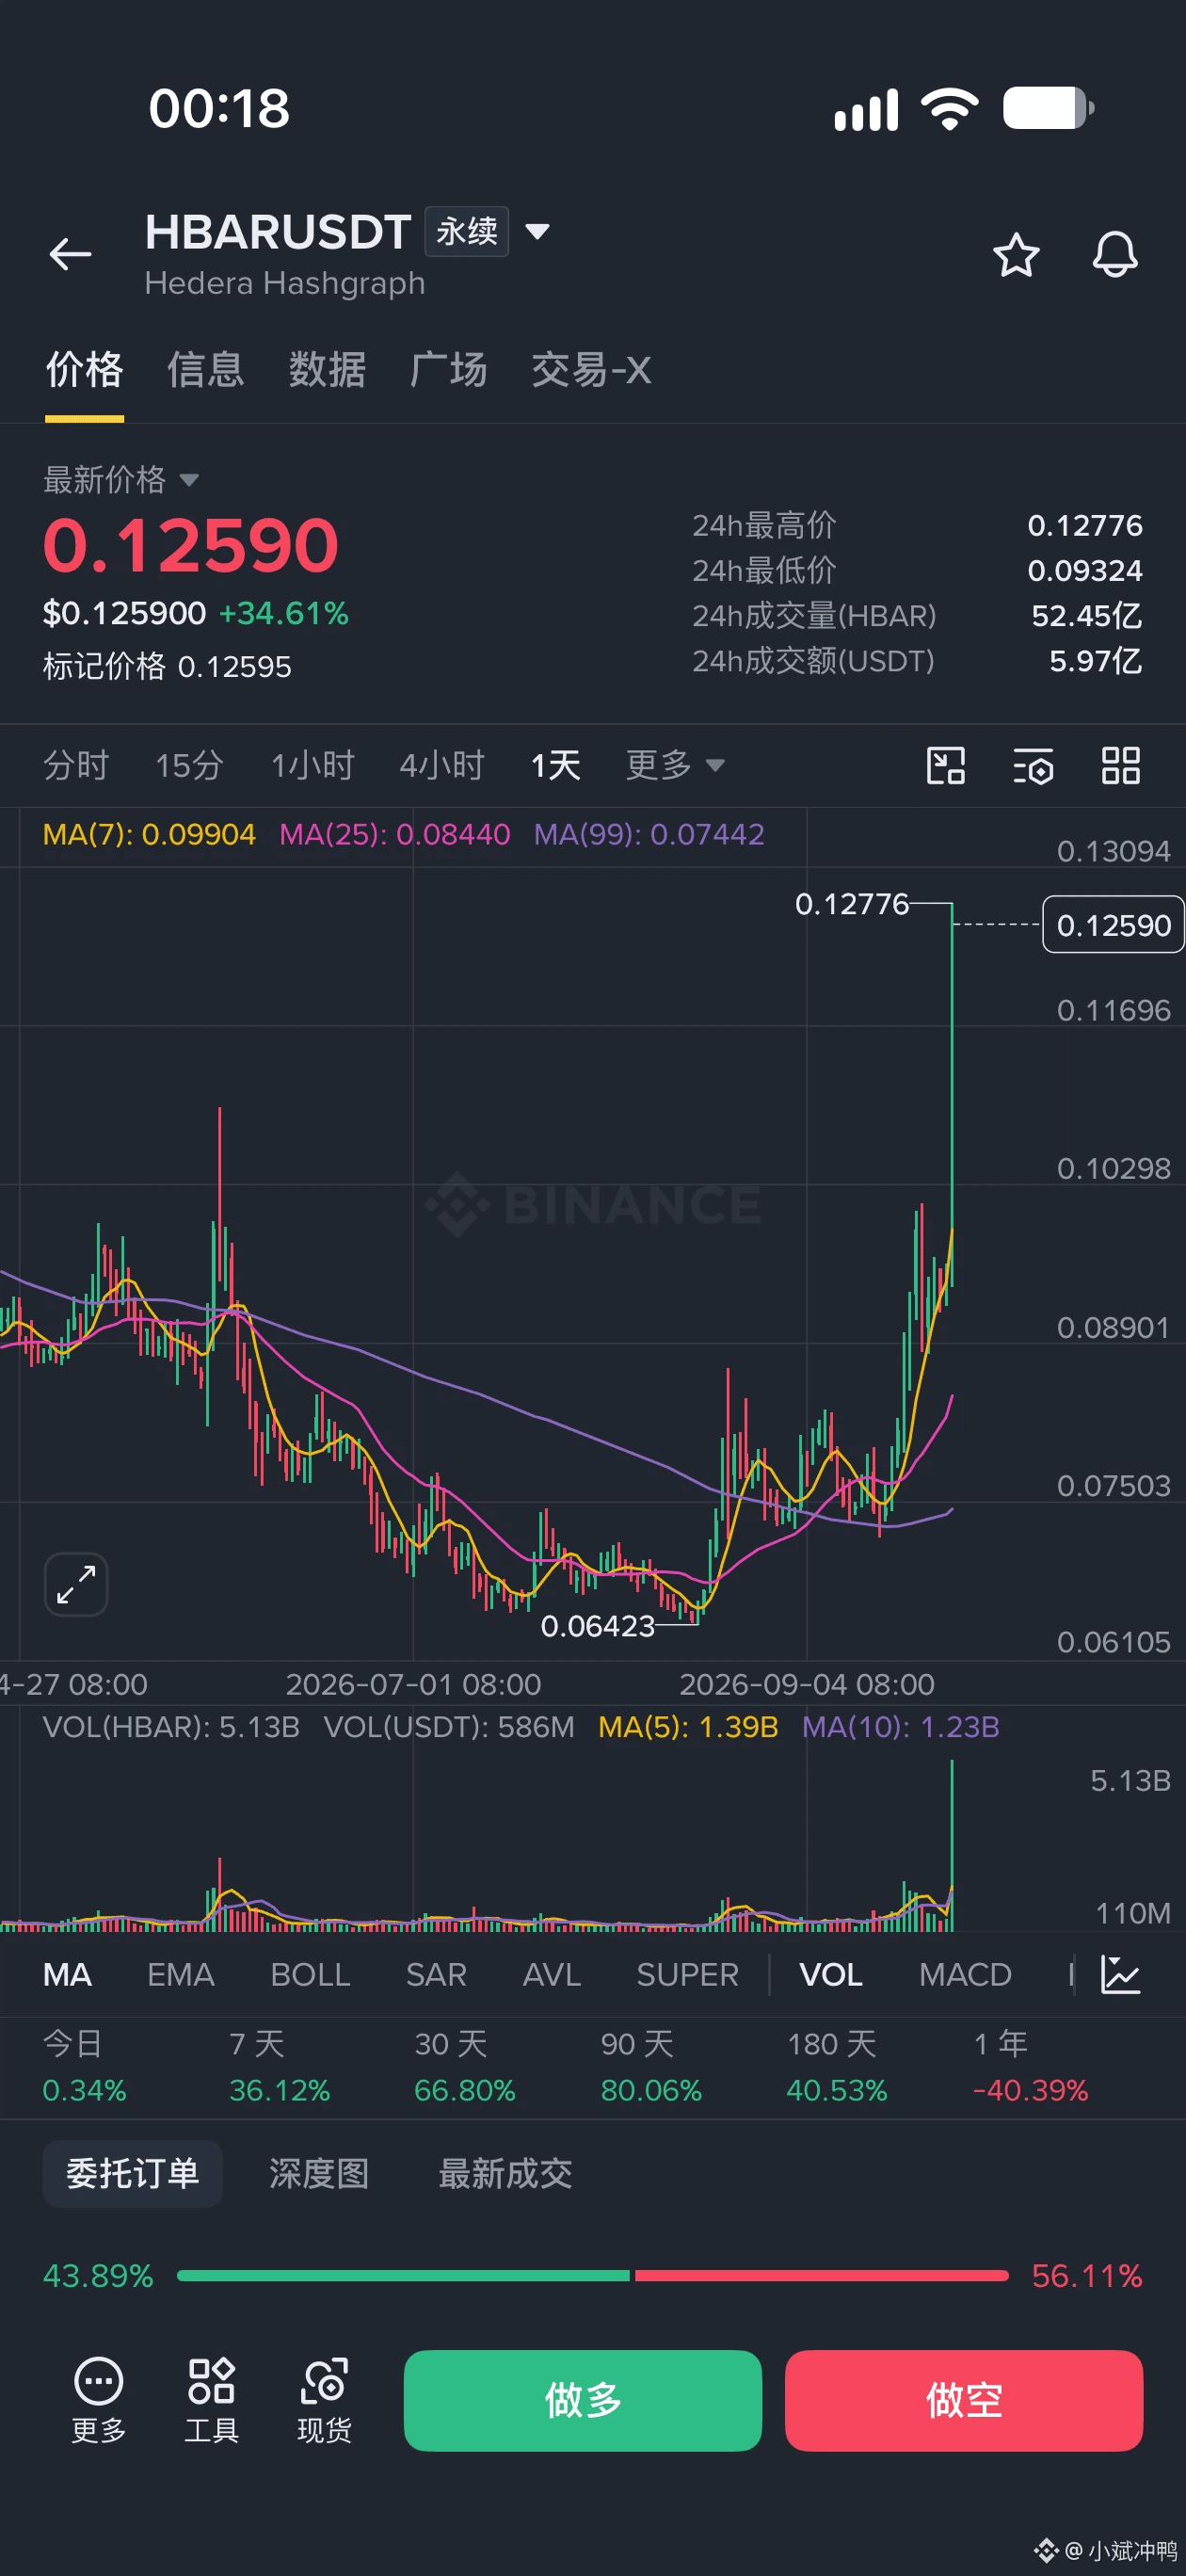
HBAR—this big bullish candle has something to it. In 24 hours, it directly jumped 34%, moving from 0.09 to 0.127. One single bullish candle pierced through all the prior three months of consolidation.
Let me first explain why it’s up—not random pumping. The news is real:
1) Last week, IBM Cloud listed Hedera’s ID Trust platform on their side, for identity authentication for AI agents. This is actual deployment, not just a Twitter slogan.
2) The NVIDIA AI platform is also moving in.
3) The SIBOS conference (that global annual SWIFT banking event) is promoting Hedera’s cross-border settlement solution.
4) It was added to the watchlists by several spot ETF issuers—meaning institutional capital has started positioning early.
5) At HederaCon, they just released the Cross-Ledger cross-ledger protocol.
I pulled contract data—this move isn’t one of those pure “needle” spikes. The funding rate is only 0.008%, so longs didn’t pay much of a premium, which suggests it’s not a one-sided squeeze. Open interest went from $34 million straight to $64 million—doubling—showing real money opening new positions. The active buy/sell ratio is basically 1:1; it’s not just the market maker trading back and forth alone.
But don’t get carried away. The share of long accounts across the whole network fell from 61% to 58%, meaning as price climbed, some people started taking profits at higher levels. Measured from the low at 0.064, this move is almost a double. The previous high at 0.13 is right above—so there will definitely be some near-term chop.
This kind of coin has a real institutional narrative, unlike pure memes. There will be someone to catch the dip, but if you chase the rally, you still need to control your position size.
What do you think—can HBAR hold above 0.13 this time, or will it get hammered back down again? Let’s chat in the comments.
$HBAR #HBAR #Hedera #山寨币 #IBM
HBAR—this big bullish candle has something to it. In 24 hours, it directly jumped 34%, moving from 0.09 to 0.127. One single bullish candle pierced through all the prior three months of consolidation.
Let me first explain why it’s up—not random pumping. The news is real:
1) Last week, IBM Cloud listed Hedera’s ID Trust platform on their side, for identity authentication for AI agents. This is actual deployment, not just a Twitter slogan.
2) The NVIDIA AI platform is also moving in.
3) The SIBOS conference (that global annual SWIFT banking event) is promoting Hedera’s cross-border settlement solution.
4) It was added to the watchlists by several spot ETF issuers—meaning institutional capital has started positioning early.
5) At HederaCon, they just released the Cross-Ledger cross-ledger protocol.
I pulled contract data—this move isn’t one of those pure “needle” spikes. The funding rate is only 0.008%, so longs didn’t pay much of a premium, which suggests it’s not a one-sided squeeze. Open interest went from $34 million straight to $64 million—doubling—showing real money opening new positions. The active buy/sell ratio is basically 1:1; it’s not just the market maker trading back and forth alone.
But don’t get carried away. The share of long accounts across the whole network fell from 61% to 58%, meaning as price climbed, some people started taking profits at higher levels. Measured from the low at 0.064, this move is almost a double. The previous high at 0.13 is right above—so there will definitely be some near-term chop.
This kind of coin has a real institutional narrative, unlike pure memes. There will be someone to catch the dip, but if you chase the rally, you still need to control your position size.
What do you think—can HBAR hold above 0.13 this time, or will it get hammered back down again? Let’s chat in the comments.
$HBAR #HBAR #Hedera #山寨币 #IBM
Let me first explain why it’s up—not random pumping. The news is real:
1) Last week, IBM Cloud listed Hedera’s ID Trust platform on their side, for identity authentication for AI agents. This is actual deployment, not just a Twitter slogan.
2) The NVIDIA AI platform is also moving in.
3) The SIBOS conference (that global annual SWIFT banking event) is promoting Hedera’s cross-border settlement solution.
4) It was added to the watchlists by several spot ETF issuers—meaning institutional capital has started positioning early.
5) At HederaCon, they just released the Cross-Ledger cross-ledger protocol.
I pulled contract data—this move isn’t one of those pure “needle” spikes. The funding rate is only 0.008%, so longs didn’t pay much of a premium, which suggests it’s not a one-sided squeeze. Open interest went from $34 million straight to $64 million—doubling—showing real money opening new positions. The active buy/sell ratio is basically 1:1; it’s not just the market maker trading back and forth alone.
But don’t get carried away. The share of long accounts across the whole network fell from 61% to 58%, meaning as price climbed, some people started taking profits at higher levels. Measured from the low at 0.064, this move is almost a double. The previous high at 0.13 is right above—so there will definitely be some near-term chop.
This kind of coin has a real institutional narrative, unlike pure memes. There will be someone to catch the dip, but if you chase the rally, you still need to control your position size.
What do you think—can HBAR hold above 0.13 this time, or will it get hammered back down again? Let’s chat in the comments.
$HBAR #HBAR #Hedera #山寨币 #IBM
471
·
--
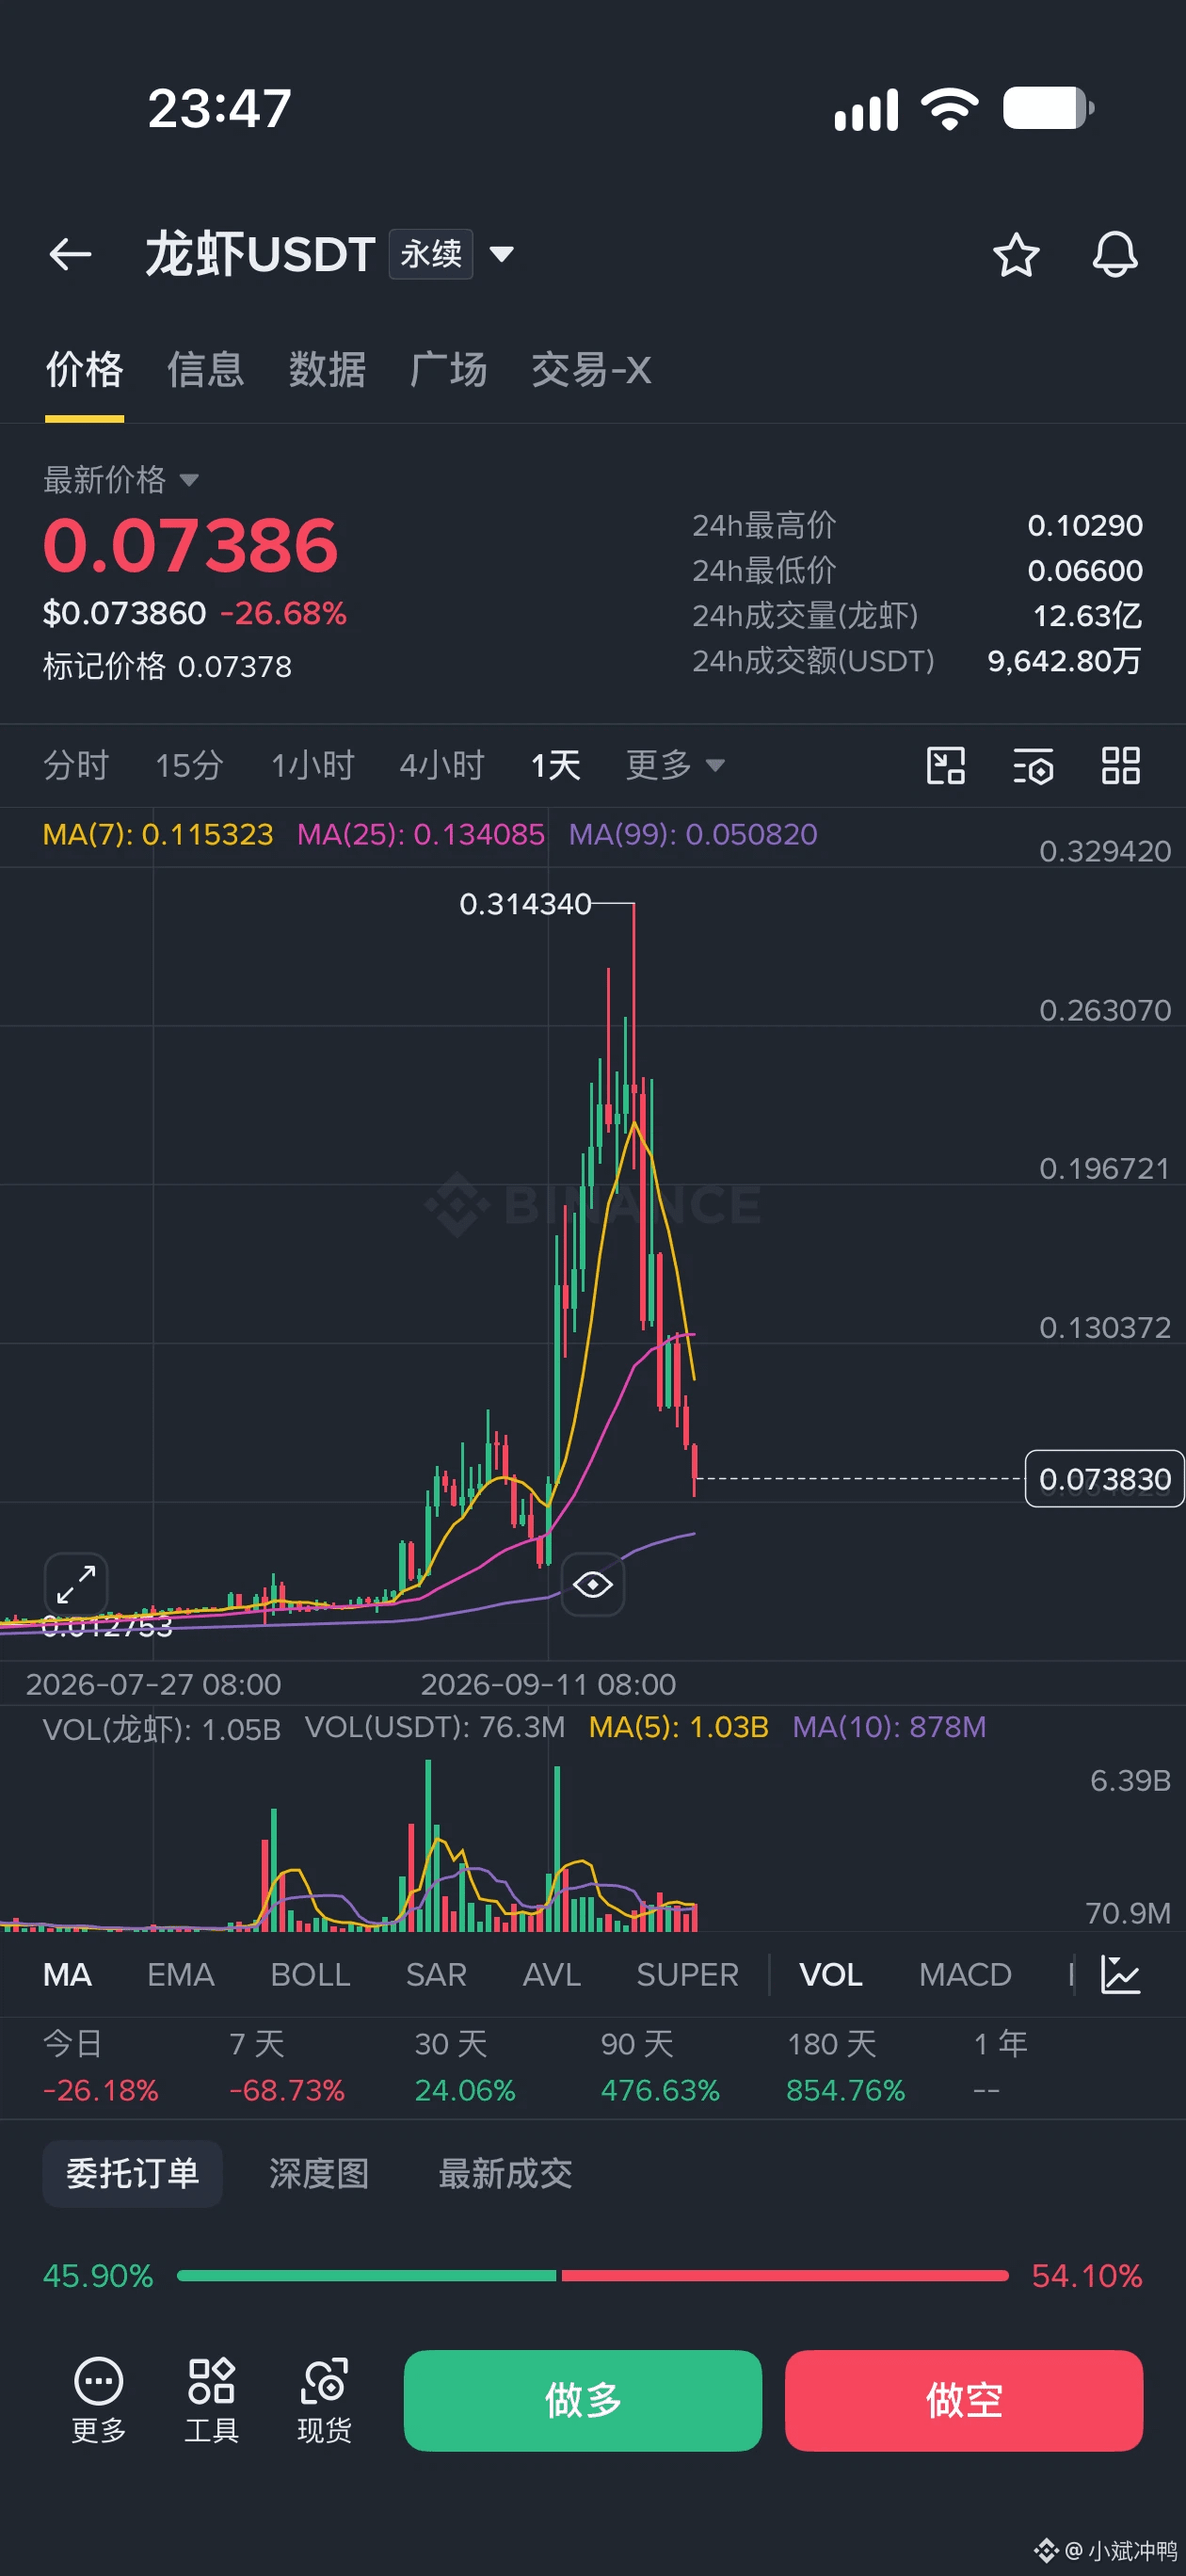
This lobster trend is real—there’s absolutely no intention of turning back.
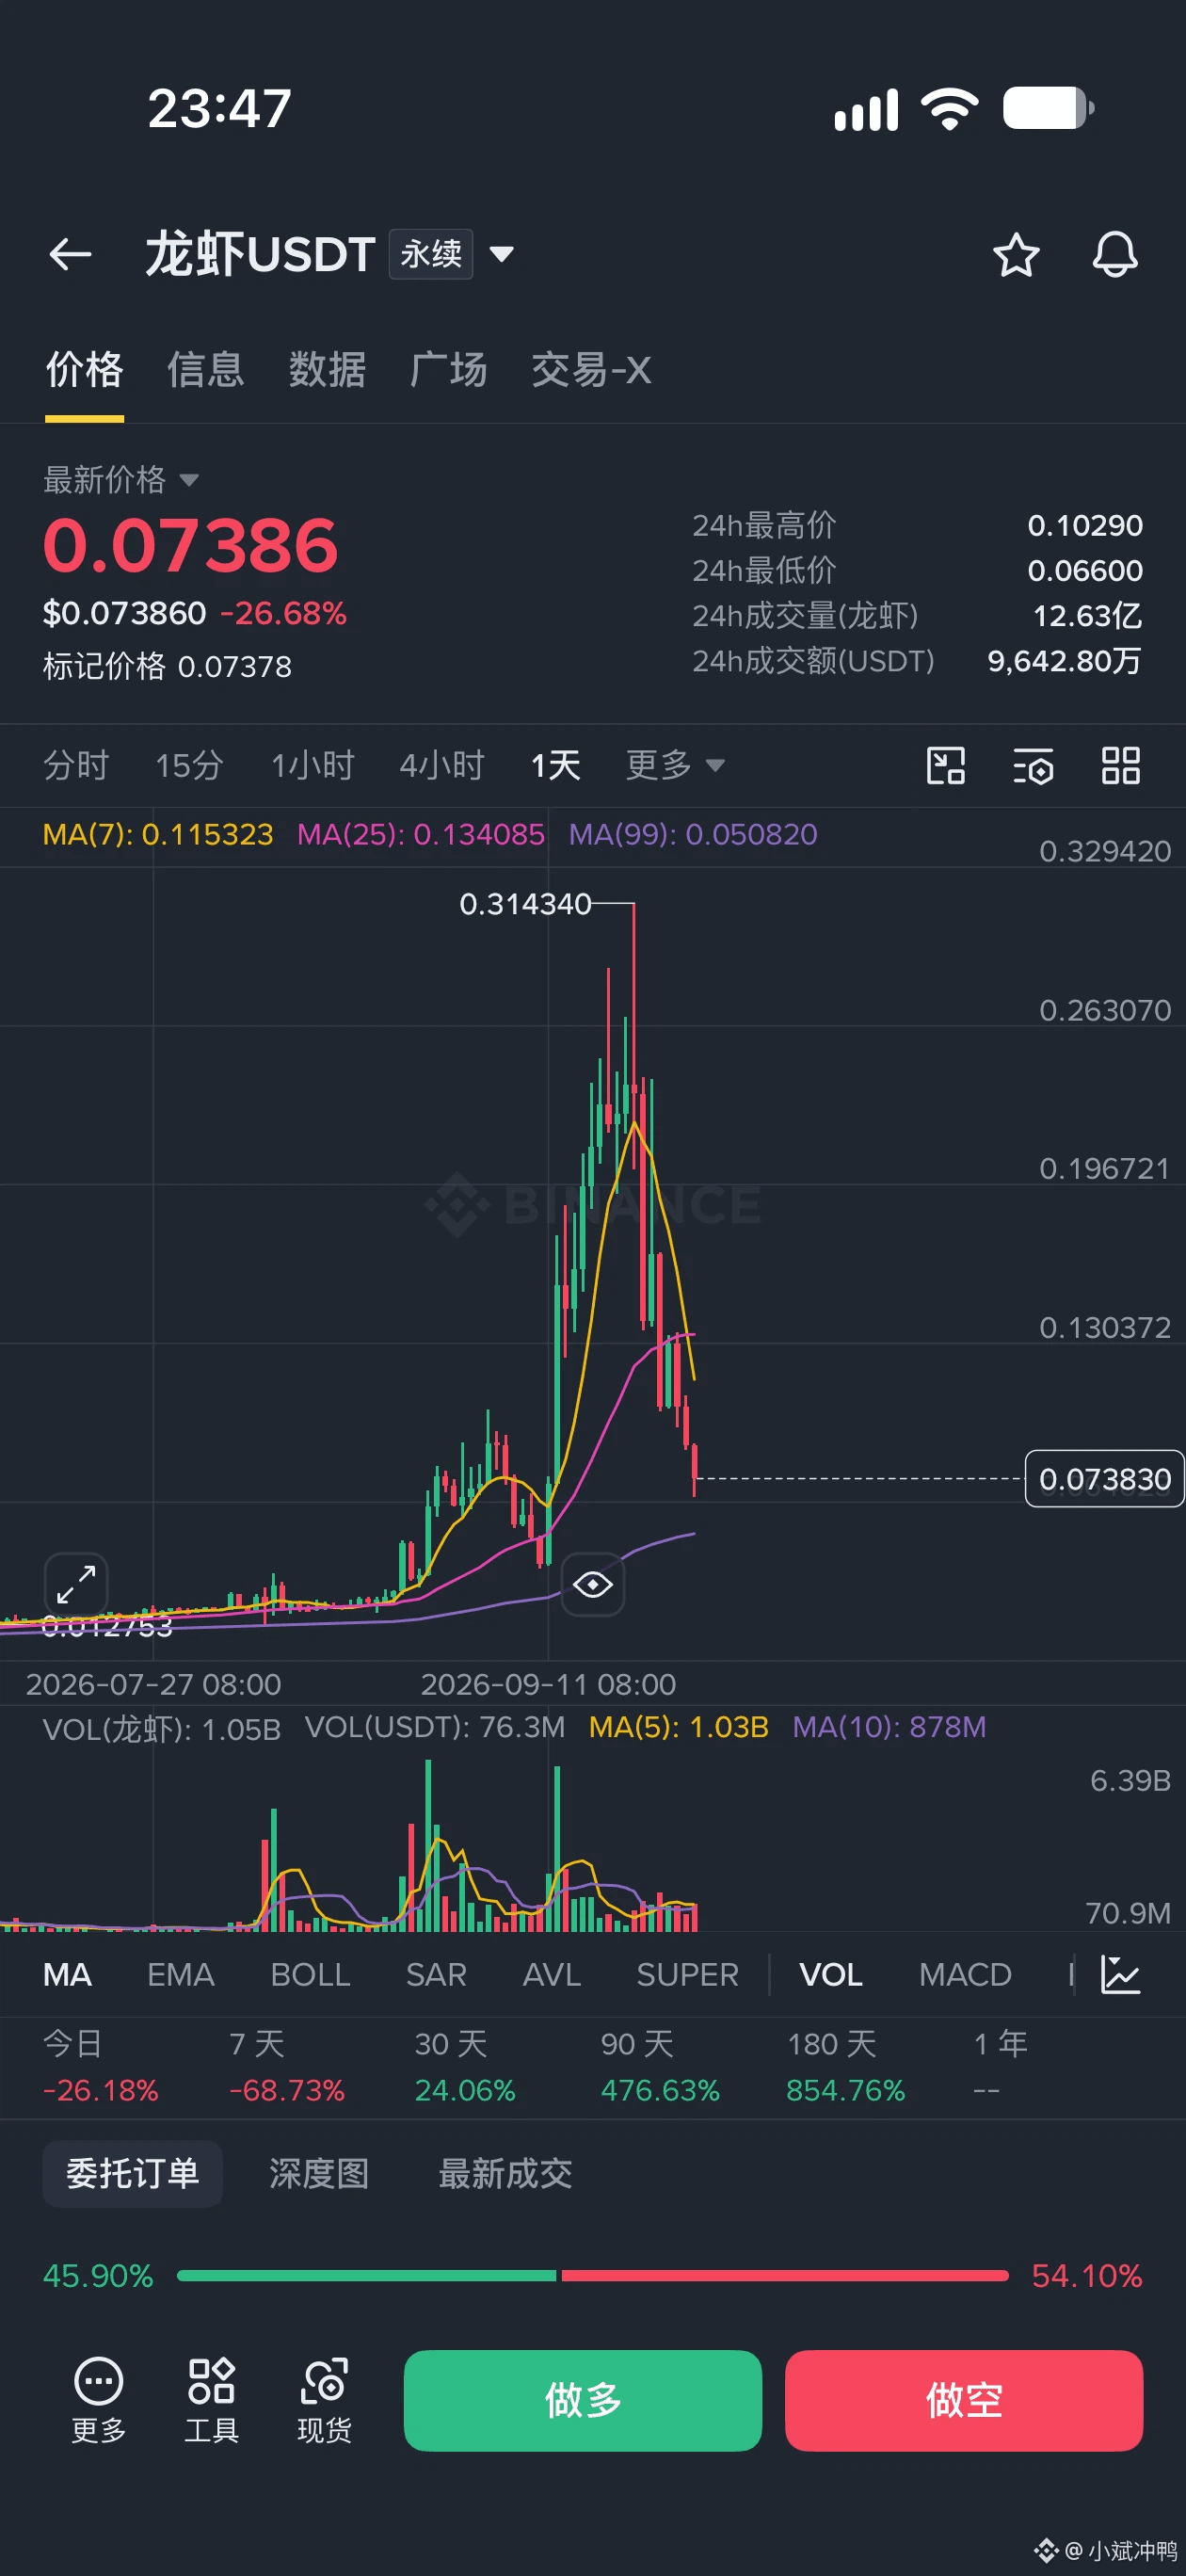
Look at the chart: the previous high at 0.314 got smashed straight down to where it is now at 0.073. In seven days it wiped out 68%. And today alone another huge bearish candle—down 27 percentage points—was slammed in. No decent bounce in between either; bearish candle after bearish candle, stepping down on top of each other.
That’s just how meme coins are. When sentiment is hot, it lifts you to the sky. When sentiment fades, everything falls back the way it was lifted—no support worth half a cent, just holding on with pure hot air. A market like this is fully controlled by the syndicate. Spot pumps cost nothing at all; the real battlefield is in the futures. Longs on that side were already eaten up early. What’s happening now is basically a phase of quietly distributing supply.
I just pulled up the futures data, and it’s pretty ironic: with the price having collapsed like this, the number of open positions actually increased—from 320 million contracts to 350 million. Passive sell orders have been getting more aggressive hour by hour, while the accounts that are bottom-fishing and going long are still adding more as it keeps dropping—classic top-side distribution and knife-catching from below. And the “more killing” hasn’t even started yet.
Don’t try to guess the bottom. Don’t bottom-fish. What you think is “cheap” is only halfway down. When a market like this falls, there’s no bottom—only a lower bottom.
Are any brothers still holding in there right now? Drop your position size in the comments.
$龙虾USDT #Meme币 #合约 #山寨币 #崩盘
This lobster trend is real—there’s absolutely no intention of turning back.
Look at the chart: the previous high at 0.314 got smashed straight down to where it is now at 0.073. In seven days it wiped out 68%. And today alone another huge bearish candle—down 27 percentage points—was slammed in. No decent bounce in between either; bearish candle after bearish candle, stepping down on top of each other.
That’s just how meme coins are. When sentiment is hot, it lifts you to the sky. When sentiment fades, everything falls back the way it was lifted—no support worth half a cent, just holding on with pure hot air. A market like this is fully controlled by the syndicate. Spot pumps cost nothing at all; the real battlefield is in the futures. Longs on that side were already eaten up early. What’s happening now is basically a phase of quietly distributing supply.
I just pulled up the futures data, and it’s pretty ironic: with the price having collapsed like this, the number of open positions actually increased—from 320 million contracts to 350 million. Passive sell orders have been getting more aggressive hour by hour, while the accounts that are bottom-fishing and going long are still adding more as it keeps dropping—classic top-side distribution and knife-catching from below. And the “more killing” hasn’t even started yet.
Don’t try to guess the bottom. Don’t bottom-fish. What you think is “cheap” is only halfway down. When a market like this falls, there’s no bottom—only a lower bottom.
Are any brothers still holding in there right now? Drop your position size in the comments.
$龙虾USDT #Meme币 #合约 #山寨币 #崩盘
Look at the chart: the previous high at 0.314 got smashed straight down to where it is now at 0.073. In seven days it wiped out 68%. And today alone another huge bearish candle—down 27 percentage points—was slammed in. No decent bounce in between either; bearish candle after bearish candle, stepping down on top of each other.
That’s just how meme coins are. When sentiment is hot, it lifts you to the sky. When sentiment fades, everything falls back the way it was lifted—no support worth half a cent, just holding on with pure hot air. A market like this is fully controlled by the syndicate. Spot pumps cost nothing at all; the real battlefield is in the futures. Longs on that side were already eaten up early. What’s happening now is basically a phase of quietly distributing supply.
I just pulled up the futures data, and it’s pretty ironic: with the price having collapsed like this, the number of open positions actually increased—from 320 million contracts to 350 million. Passive sell orders have been getting more aggressive hour by hour, while the accounts that are bottom-fishing and going long are still adding more as it keeps dropping—classic top-side distribution and knife-catching from below. And the “more killing” hasn’t even started yet.
Don’t try to guess the bottom. Don’t bottom-fish. What you think is “cheap” is only halfway down. When a market like this falls, there’s no bottom—only a lower bottom.
Are any brothers still holding in there right now? Drop your position size in the comments.
$龙虾USDT #Meme币 #合约 #山寨币 #崩盘
1.1k
·
--
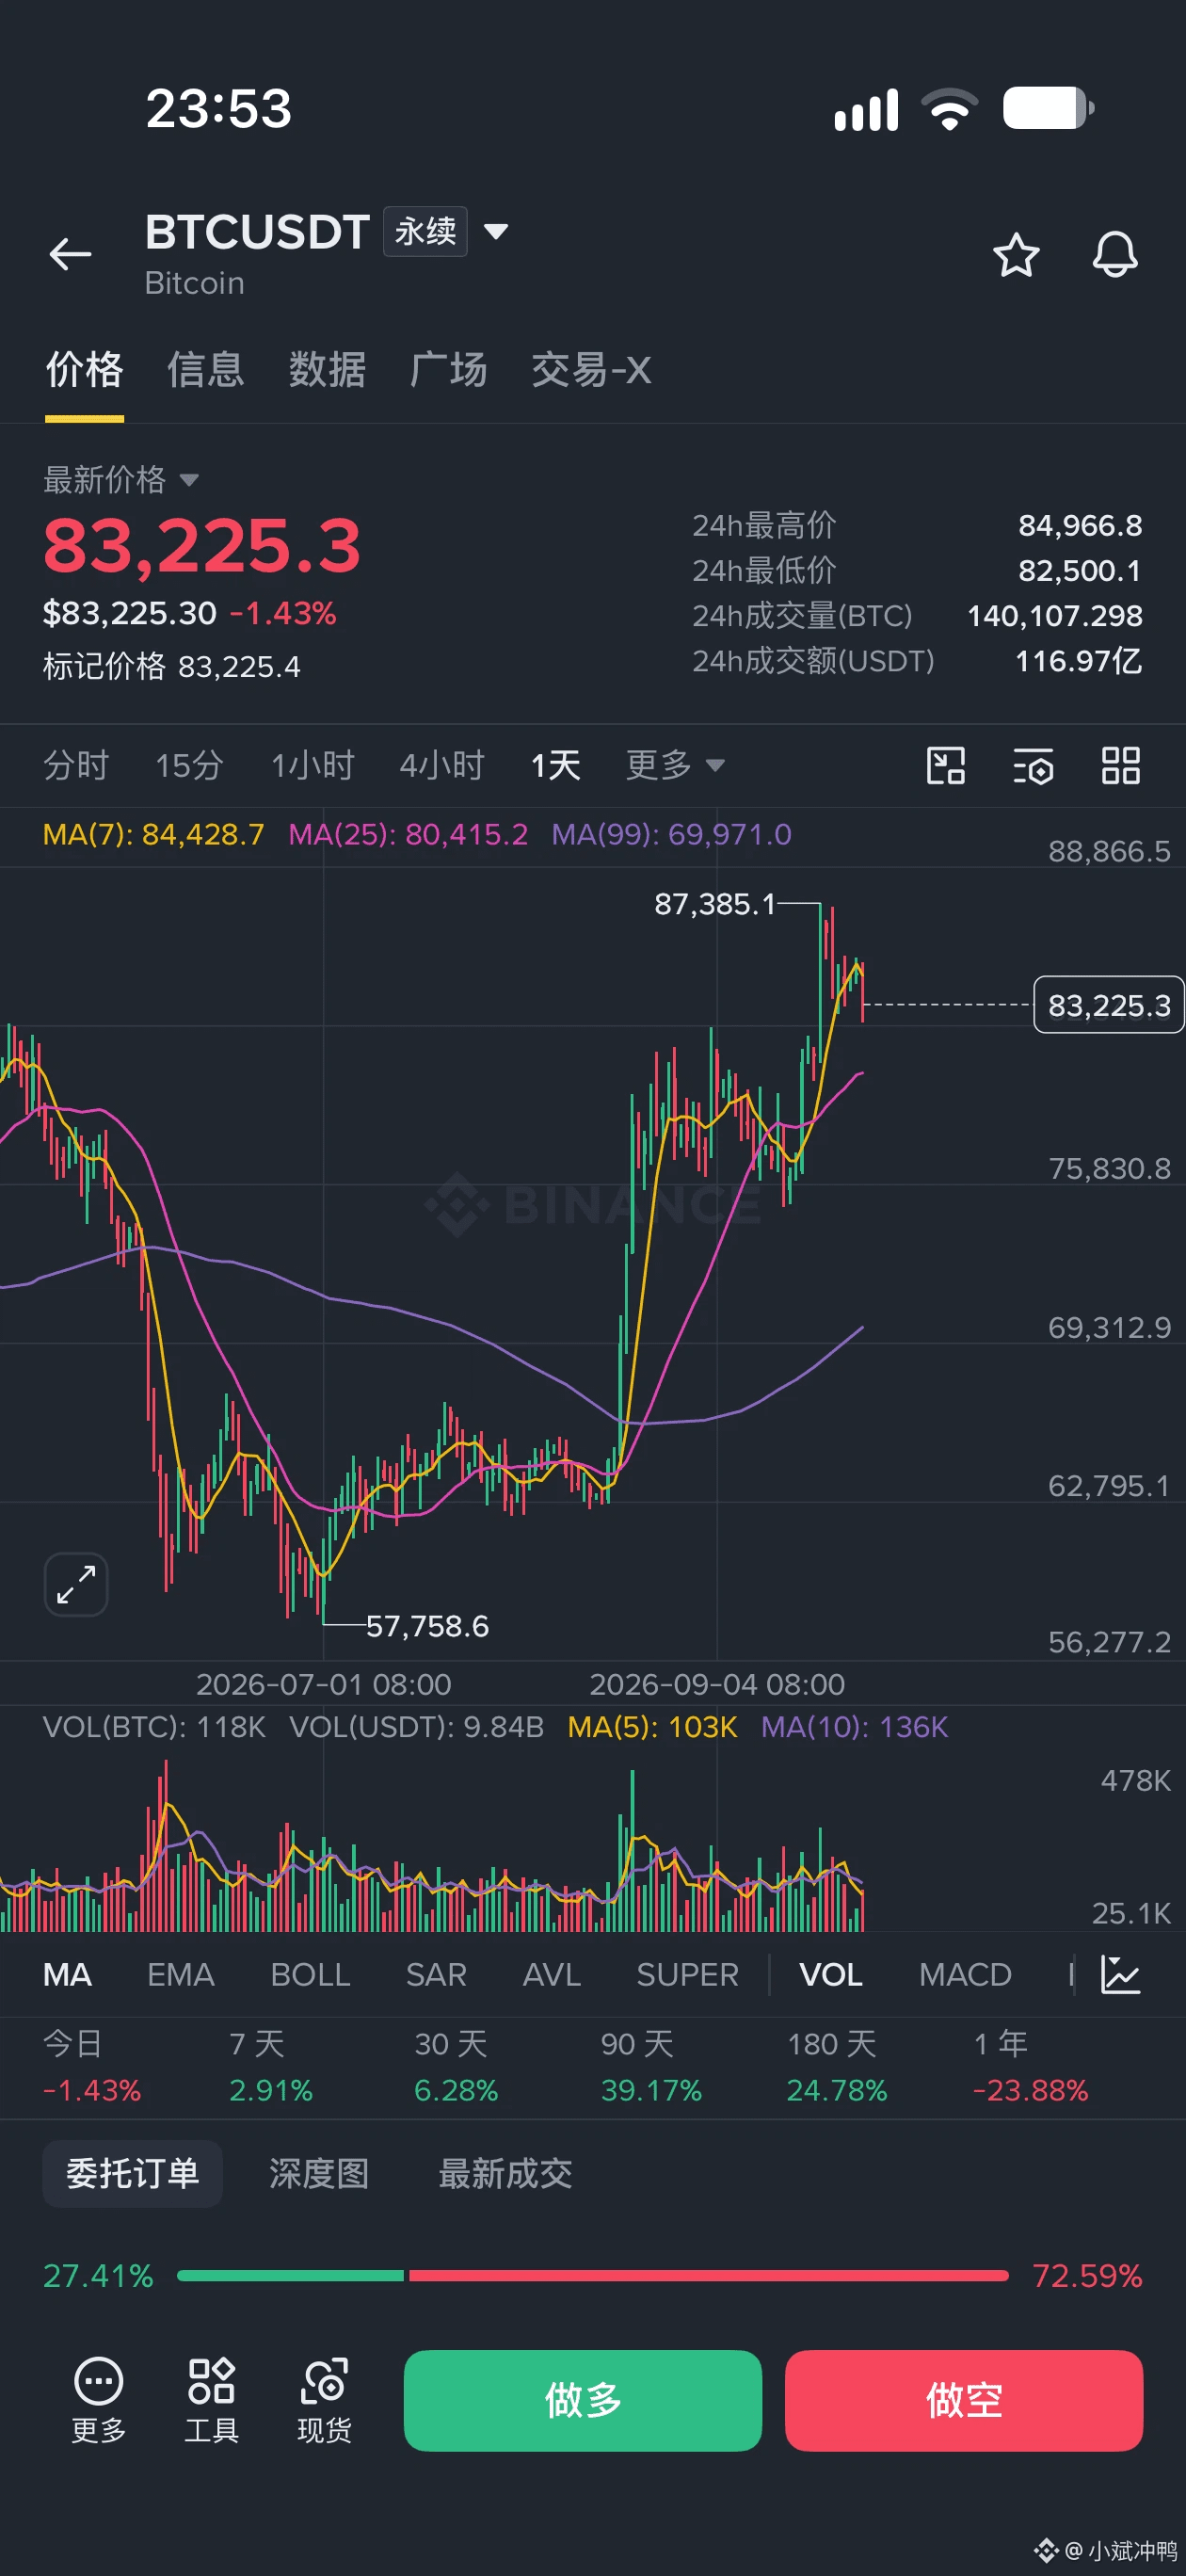
Honestly, the more I look at this market index, the more uneasy I get.
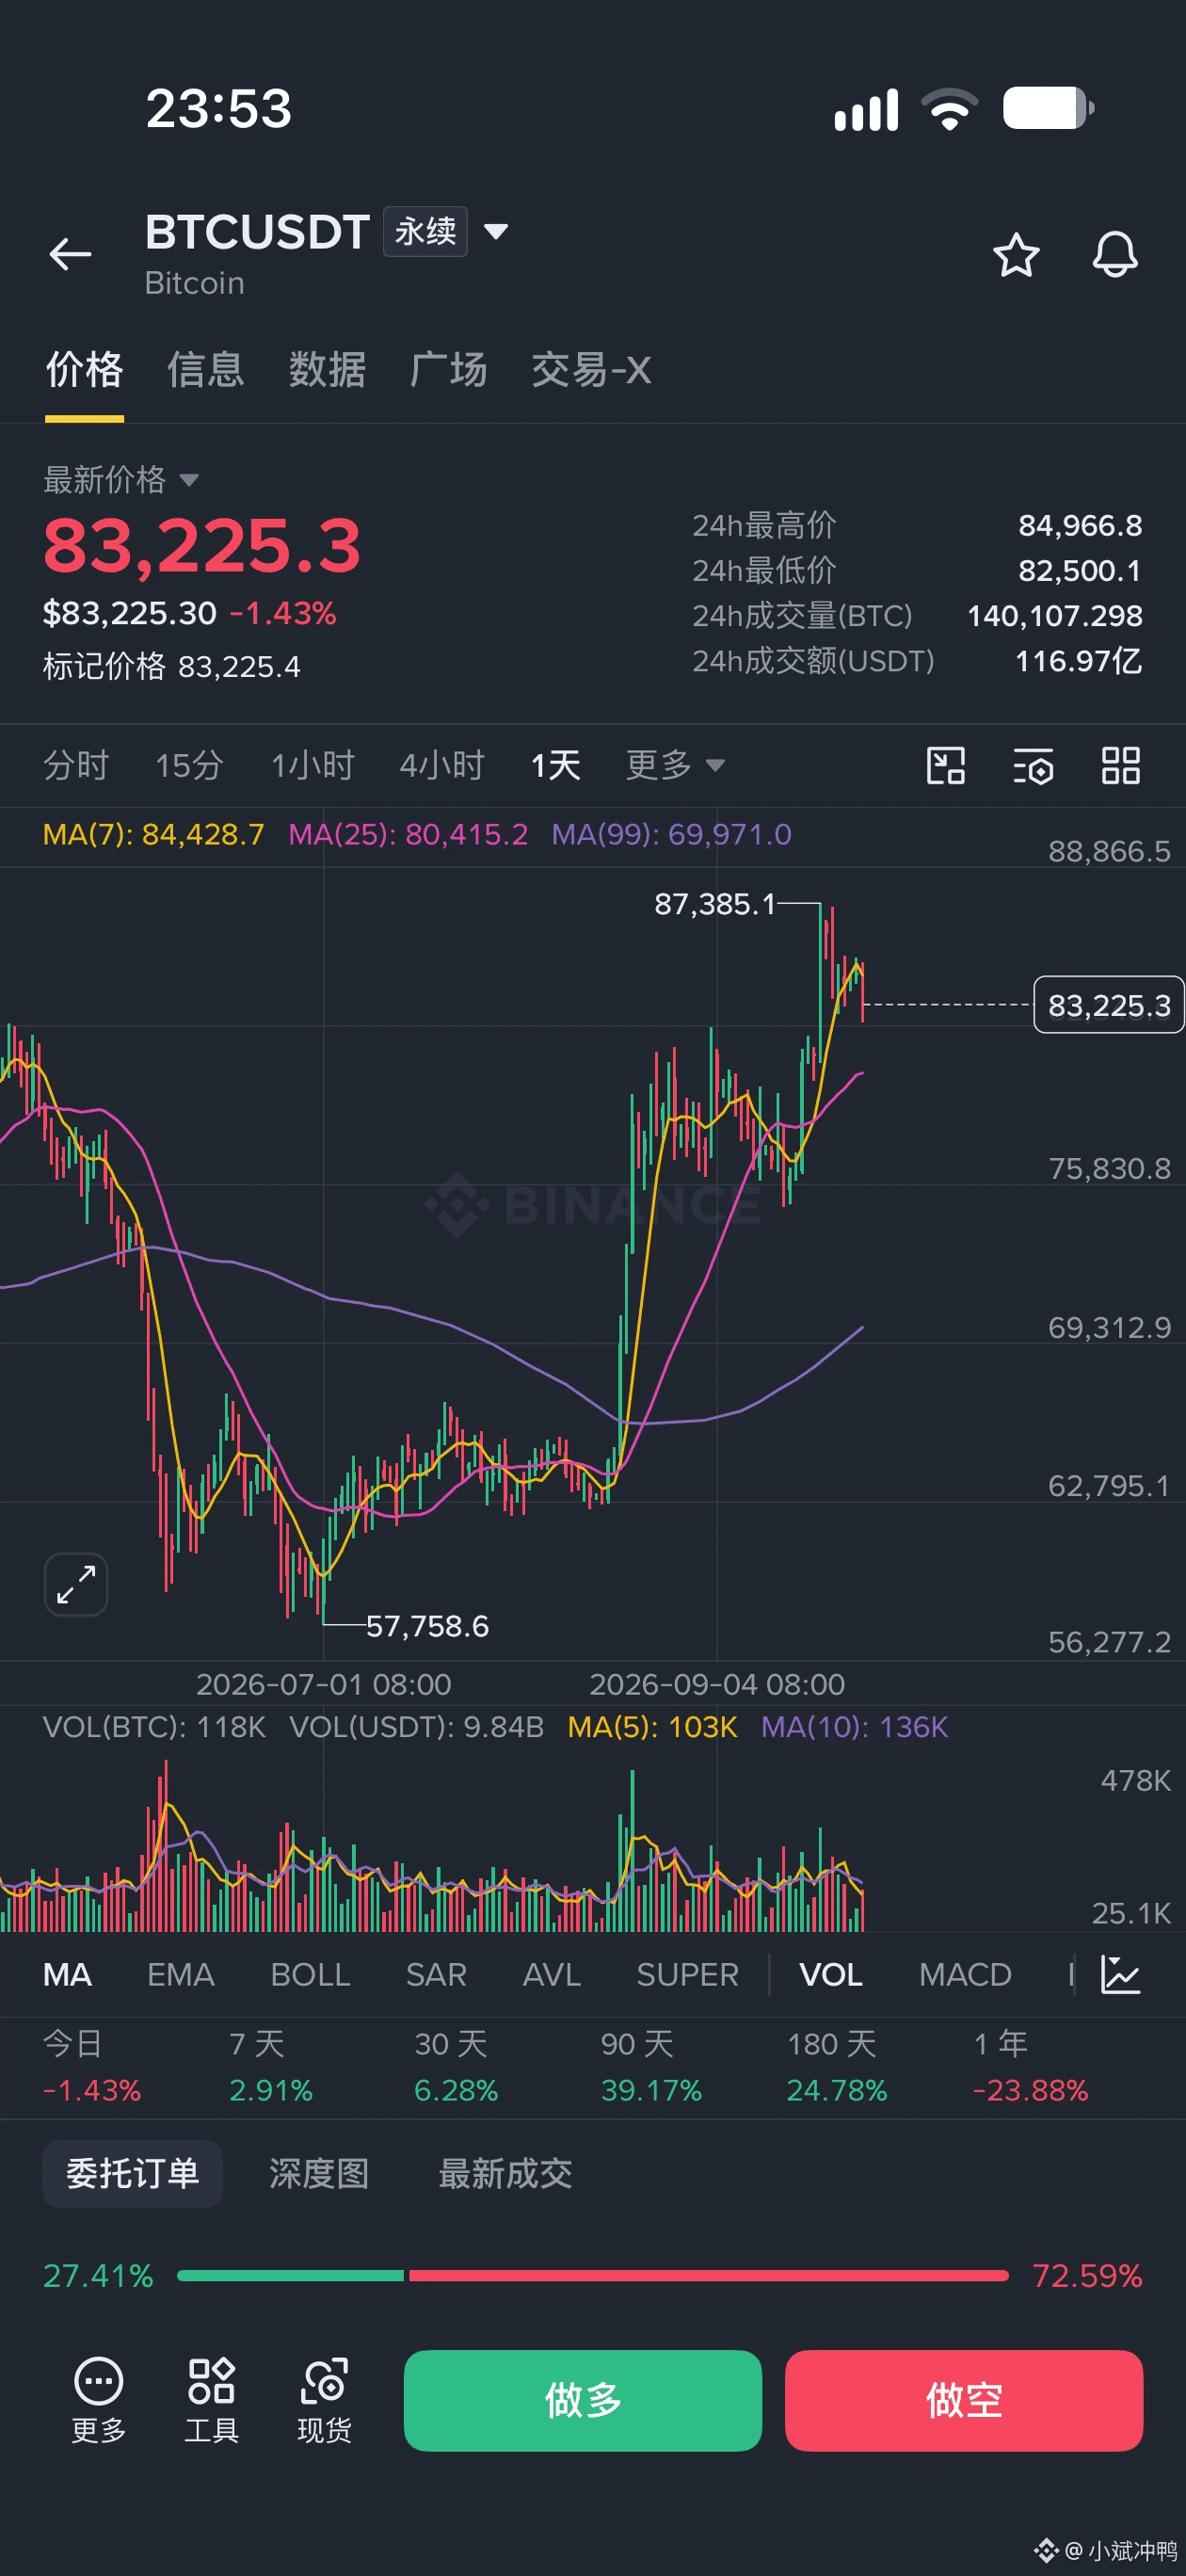
A few days ago, BTC finally managed to push its way up to 87,300. In the group, a bunch of people were shouting, “Breakthrough! Main rally! 100k incoming!” What happened then? It couldn’t even hold for two days—one bearish candle slammed it back to 83,000. It’s like that breakthrough never even happened. The so-called “breakthrough” was just a trap to catch people.
Now look outside: the U.S. stock market is even more embarrassing. The Nasdaq hasn’t really had many green days this week. On September 23, it dropped -1.13%. It bounced for a day, and tonight the chip stocks all dropped at once again. The Dow is down more than 300 points—classic “up one day, down three days,” a weak market all the way.
Most of all, the macro picture—on September 16, the Fed just added 25 basis points, pushing the rate up to 3.75–4%. This is the first rate hike restart since July 2023. All 12 voting members approved it unanimously—no dissenting votes at all. The dot plot also makes it plain that another hike is coming later this year. Goldman Sachs even directly called for another move on October 27. Brothers, this isn’t a rate-cut cycle—it’s the rate-hike cycle rebooting. Liquidity is meant to be tightened, not loosened.
The old myth that “BTC has an independent run and decouples from the U.S. market” now looks like a joke. The U.S. stocks sneeze, and crypto catches pneumonia first.
To be honest, at this level around 83,000, I really don’t dare chase longs. If it moves up to 100,000, that’s only about 20% upside. But if it drops instead—if the U.S. market really crashes and the rate hike actually lands—then a pullback to 60,000 isn’t even a big deal. Just my own rough hunch: if 80,000 can’t hold, then going down to see 50,000 won’t be far-fetched at all.
Of course, I’m not some big shot. I’m just an old “grass” who’s been liquidated over and over. My position was gone a long time ago—I’m just here to watch.
What do you all think right now? Keep shouting “100k,” or are you planning to hide like I am? Let’s chat in the comments.
$BTC #比特币 #美联储 #美股 #合同
Honestly, the more I look at this market index, the more uneasy I get.
A few days ago, BTC finally managed to push its way up to 87,300. In the group, a bunch of people were shouting, “Breakthrough! Main rally! 100k incoming!” What happened then? It couldn’t even hold for two days—one bearish candle slammed it back to 83,000. It’s like that breakthrough never even happened. The so-called “breakthrough” was just a trap to catch people.
Now look outside: the U.S. stock market is even more embarrassing. The Nasdaq hasn’t really had many green days this week. On September 23, it dropped -1.13%. It bounced for a day, and tonight the chip stocks all dropped at once again. The Dow is down more than 300 points—classic “up one day, down three days,” a weak market all the way.
Most of all, the macro picture—on September 16, the Fed just added 25 basis points, pushing the rate up to 3.75–4%. This is the first rate hike restart since July 2023. All 12 voting members approved it unanimously—no dissenting votes at all. The dot plot also makes it plain that another hike is coming later this year. Goldman Sachs even directly called for another move on October 27. Brothers, this isn’t a rate-cut cycle—it’s the rate-hike cycle rebooting. Liquidity is meant to be tightened, not loosened.
The old myth that “BTC has an independent run and decouples from the U.S. market” now looks like a joke. The U.S. stocks sneeze, and crypto catches pneumonia first.
To be honest, at this level around 83,000, I really don’t dare chase longs. If it moves up to 100,000, that’s only about 20% upside. But if it drops instead—if the U.S. market really crashes and the rate hike actually lands—then a pullback to 60,000 isn’t even a big deal. Just my own rough hunch: if 80,000 can’t hold, then going down to see 50,000 won’t be far-fetched at all.
Of course, I’m not some big shot. I’m just an old “grass” who’s been liquidated over and over. My position was gone a long time ago—I’m just here to watch.
What do you all think right now? Keep shouting “100k,” or are you planning to hide like I am? Let’s chat in the comments.
$BTC #比特币 #美联储 #美股 #合同
A few days ago, BTC finally managed to push its way up to 87,300. In the group, a bunch of people were shouting, “Breakthrough! Main rally! 100k incoming!” What happened then? It couldn’t even hold for two days—one bearish candle slammed it back to 83,000. It’s like that breakthrough never even happened. The so-called “breakthrough” was just a trap to catch people.
Now look outside: the U.S. stock market is even more embarrassing. The Nasdaq hasn’t really had many green days this week. On September 23, it dropped -1.13%. It bounced for a day, and tonight the chip stocks all dropped at once again. The Dow is down more than 300 points—classic “up one day, down three days,” a weak market all the way.
Most of all, the macro picture—on September 16, the Fed just added 25 basis points, pushing the rate up to 3.75–4%. This is the first rate hike restart since July 2023. All 12 voting members approved it unanimously—no dissenting votes at all. The dot plot also makes it plain that another hike is coming later this year. Goldman Sachs even directly called for another move on October 27. Brothers, this isn’t a rate-cut cycle—it’s the rate-hike cycle rebooting. Liquidity is meant to be tightened, not loosened.
The old myth that “BTC has an independent run and decouples from the U.S. market” now looks like a joke. The U.S. stocks sneeze, and crypto catches pneumonia first.
To be honest, at this level around 83,000, I really don’t dare chase longs. If it moves up to 100,000, that’s only about 20% upside. But if it drops instead—if the U.S. market really crashes and the rate hike actually lands—then a pullback to 60,000 isn’t even a big deal. Just my own rough hunch: if 80,000 can’t hold, then going down to see 50,000 won’t be far-fetched at all.
Of course, I’m not some big shot. I’m just an old “grass” who’s been liquidated over and over. My position was gone a long time ago—I’m just here to watch.
What do you all think right now? Keep shouting “100k,” or are you planning to hide like I am? Let’s chat in the comments.
$BTC #比特币 #美联储 #美股 #合同
151
·
--
Honestly, the more I look at this market index right now, the more uneasy I feel.
Honestly, the more I look at this market index right now, the more uneasy I feel.
149
·
--
This lobster trend is real—there’s absolutely no sign of turning back.
This lobster trend is real—there’s absolutely no sign of turning back.
1
834
·
--
Trading coins is not as good as issuing them; starting a business is not as good as setting it up.
This used to be a joke, but now someone has actually turned it into a pipeline.
I just saw a piece of on-chain data that left me stunned: the same group, from July to September—over two months—launched 53 coins on Robinhood, pocketing $18.43 million (about 7,447 ETH). And this is only the part that can be directly linked; the real amount is likely more.
What level of operation is this? Here’s a reference: Grayscale working on RWA business makes around $18 million a month at most— and even then they have to support dozens of people, dealing with compliance, audits, regulators, and license approvals one layer after another.
But this group only needs to do three things: change the coin name, swap the contract address, and use the fee to funnel the money stolen from the previous “plate” into the next one. The proceeds from one launch are just enough to fatten up the next launch; 53 projects share a single set of keys, seamless handoff.
What they’re earning isn’t “cognitive” money—it’s “efficiency” money. But this kind of efficiency will have to be paid back eventually.
Have you seen this kind of “skin-swap” where there’s a new coin every day on Robinhood lately? In the comments, steer clear of the risks.
$BTC $ETH #加密货币 #RugPull #Investment risk
Trading coins is not as good as issuing them; starting a business is not as good as setting it up.
This used to be a joke, but now someone has actually turned it into a pipeline.
I just saw a piece of on-chain data that left me stunned: the same group, from July to September—over two months—launched 53 coins on Robinhood, pocketing $18.43 million (about 7,447 ETH). And this is only the part that can be directly linked; the real amount is likely more.
What level of operation is this? Here’s a reference: Grayscale working on RWA business makes around $18 million a month at most— and even then they have to support dozens of people, dealing with compliance, audits, regulators, and license approvals one layer after another.
But this group only needs to do three things: change the coin name, swap the contract address, and use the fee to funnel the money stolen from the previous “plate” into the next one. The proceeds from one launch are just enough to fatten up the next launch; 53 projects share a single set of keys, seamless handoff.
What they’re earning isn’t “cognitive” money—it’s “efficiency” money. But this kind of efficiency will have to be paid back eventually.
Have you seen this kind of “skin-swap” where there’s a new coin every day on Robinhood lately? In the comments, steer clear of the risks.
$BTC $ETH #加密货币 #RugPull #Investment risk
This used to be a joke, but now someone has actually turned it into a pipeline.
I just saw a piece of on-chain data that left me stunned: the same group, from July to September—over two months—launched 53 coins on Robinhood, pocketing $18.43 million (about 7,447 ETH). And this is only the part that can be directly linked; the real amount is likely more.
What level of operation is this? Here’s a reference: Grayscale working on RWA business makes around $18 million a month at most— and even then they have to support dozens of people, dealing with compliance, audits, regulators, and license approvals one layer after another.
But this group only needs to do three things: change the coin name, swap the contract address, and use the fee to funnel the money stolen from the previous “plate” into the next one. The proceeds from one launch are just enough to fatten up the next launch; 53 projects share a single set of keys, seamless handoff.
What they’re earning isn’t “cognitive” money—it’s “efficiency” money. But this kind of efficiency will have to be paid back eventually.
Have you seen this kind of “skin-swap” where there’s a new coin every day on Robinhood lately? In the comments, steer clear of the risks.
$BTC $ETH #加密货币 #RugPull #Investment risk

1
1.8k
·
--
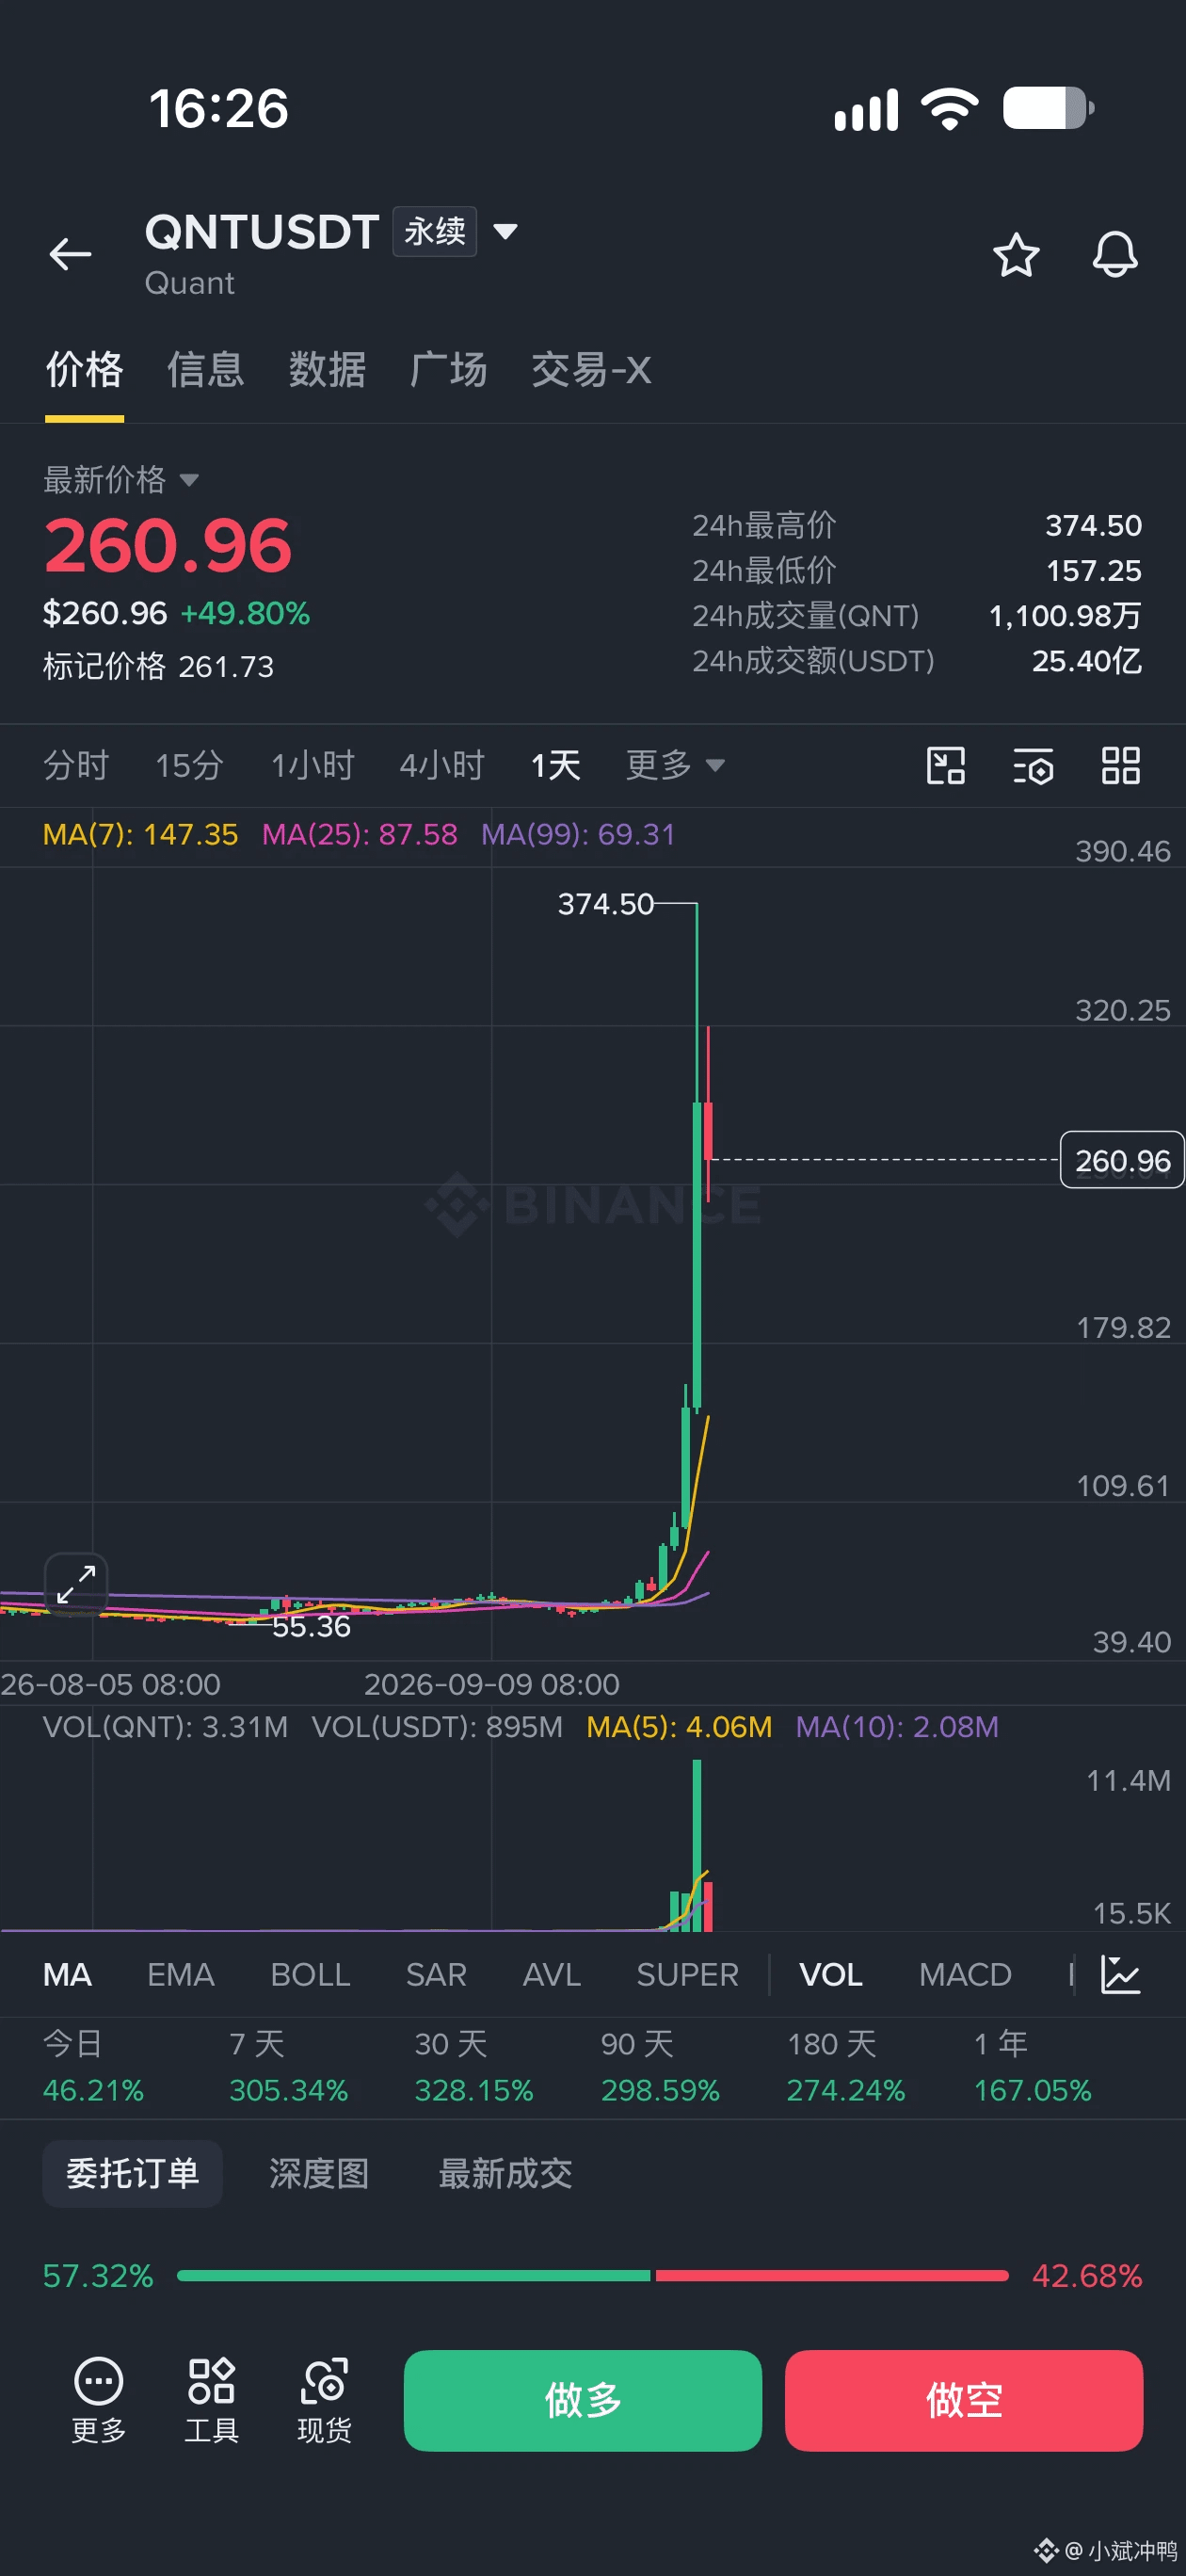
Oh wow. $QNT — this streak of four consecutive bullish days, I’m genuinely stunned.
I had been lying around near the 55 level for half a year, like it was turned off—who would’ve thought it would suddenly shoot up with a needle-like spike. In 7 days it pulled over 300%, the high hit 374, and now it’s back down to 260. The 24h trading volume is 2.5 billion USD in U, and the volume is really crazy.
Why did it pump this hard? The weekend news backdrop was basically already clear—The Clearing House in the U.S. (the clearing giant that processes $2 trillion in daily payments) chose Quant for its On-Chain Money Initiative to provide an on-chain interoperability layer, specifically for clearing settlement of tokenized deposits for banks, using the same setup as RTP and CHIPS old payment networks. The very same day, the UK’s seven major banks (including Barclays, HSBC, Lloyds, National Westminster, etc.) completed real customer transactions on the infrastructure built on Quant—two repo plus one condition payment.
In plain terms, this isn’t just meme hype. Traditional banks are genuinely starting to use its tech stack. Once the institutional narrative came out, the long crowd went into a frenzy, and the shorts got squeezed and exploded back and forth.
But honestly, from 55 to 374 and then stabbing back to 260—this long upper wick. The brothers who chased higher should now be eating their losses with the lights off. The long/short ratio is 57:43; longs look dominant, but the short positions are still hard holding and fighting.
I didn’t dare chase. In a parabolic move, going in is basically handing liquidity to the market makers. Brothers on the car, tell me—should we take profit and lock it in now, or hold and watch for the previous high? Let’s chat in the comments.
$QNT #Quant #代币化 #加密货币 #山寨币
Oh wow. $QNT — this streak of four consecutive bullish days, I’m genuinely stunned.
I had been lying around near the 55 level for half a year, like it was turned off—who would’ve thought it would suddenly shoot up with a needle-like spike. In 7 days it pulled over 300%, the high hit 374, and now it’s back down to 260. The 24h trading volume is 2.5 billion USD in U, and the volume is really crazy.
Why did it pump this hard? The weekend news backdrop was basically already clear—The Clearing House in the U.S. (the clearing giant that processes $2 trillion in daily payments) chose Quant for its On-Chain Money Initiative to provide an on-chain interoperability layer, specifically for clearing settlement of tokenized deposits for banks, using the same setup as RTP and CHIPS old payment networks. The very same day, the UK’s seven major banks (including Barclays, HSBC, Lloyds, National Westminster, etc.) completed real customer transactions on the infrastructure built on Quant—two repo plus one condition payment.
In plain terms, this isn’t just meme hype. Traditional banks are genuinely starting to use its tech stack. Once the institutional narrative came out, the long crowd went into a frenzy, and the shorts got squeezed and exploded back and forth.
But honestly, from 55 to 374 and then stabbing back to 260—this long upper wick. The brothers who chased higher should now be eating their losses with the lights off. The long/short ratio is 57:43; longs look dominant, but the short positions are still hard holding and fighting.
I didn’t dare chase. In a parabolic move, going in is basically handing liquidity to the market makers. Brothers on the car, tell me—should we take profit and lock it in now, or hold and watch for the previous high? Let’s chat in the comments.
$QNT #Quant #代币化 #加密货币 #山寨币
I had been lying around near the 55 level for half a year, like it was turned off—who would’ve thought it would suddenly shoot up with a needle-like spike. In 7 days it pulled over 300%, the high hit 374, and now it’s back down to 260. The 24h trading volume is 2.5 billion USD in U, and the volume is really crazy.
Why did it pump this hard? The weekend news backdrop was basically already clear—The Clearing House in the U.S. (the clearing giant that processes $2 trillion in daily payments) chose Quant for its On-Chain Money Initiative to provide an on-chain interoperability layer, specifically for clearing settlement of tokenized deposits for banks, using the same setup as RTP and CHIPS old payment networks. The very same day, the UK’s seven major banks (including Barclays, HSBC, Lloyds, National Westminster, etc.) completed real customer transactions on the infrastructure built on Quant—two repo plus one condition payment.
In plain terms, this isn’t just meme hype. Traditional banks are genuinely starting to use its tech stack. Once the institutional narrative came out, the long crowd went into a frenzy, and the shorts got squeezed and exploded back and forth.
But honestly, from 55 to 374 and then stabbing back to 260—this long upper wick. The brothers who chased higher should now be eating their losses with the lights off. The long/short ratio is 57:43; longs look dominant, but the short positions are still hard holding and fighting.
I didn’t dare chase. In a parabolic move, going in is basically handing liquidity to the market makers. Brothers on the car, tell me—should we take profit and lock it in now, or hold and watch for the previous high? Let’s chat in the comments.
$QNT #Quant #代币化 #加密货币 #山寨币
452
·
--
Just got a new coin listed that’s only been live for 11 hours and already surged 22x—let’s chat briefly 👀$CASH
$CASH, the inspiration came directly from Binance Square itself—Binance Square natives’ meme: turned the daily “Square” that everyone browses into a token, and the narrative comes with a built-in traffic boost.
📊 Current on-chain data (Flap Chain):
• Current price: $0.00010647
• Change: +2,246.8%
• Market cap: ~ $103K
• 24h trading volume: $352K
• Liquidity: $33K
• Holder addresses: 6,170+
• Top 10 holders share: 17.6% (not overly concentrated)
• Circulating / max supply: 974M / 974M (fully circulating, no unlock-induced sell pressure)
💡 A few observations:
1. Narrative posts on Binance Square—Square users naturally resonate
2. Listed only 11 hours ago; the “pot” is just a little over $100k—this is a very early stage
3. 6K+ holder addresses—community spread isn’t slow
4. The 3-minute chart just pulled up a wave; volume followed and expanded
Early-stage micro-cap meme—volatility will be very high. Control your position yourself. DYOR—don’t get carried away.
Contract address: 0x324F74a4fd5D25186C74FAe255a5750B6A807777
SR-D9B3A0314AF412259365A219
Just got a new coin listed that’s only been live for 11 hours and already surged 22x—let’s chat briefly 👀$CASH
$CASH, the inspiration came directly from Binance Square itself—Binance Square natives’ meme: turned the daily “Square” that everyone browses into a token, and the narrative comes with a built-in traffic boost.
📊 Current on-chain data (Flap Chain):
• Current price: $0.00010647
• Change: +2,246.8%
• Market cap: ~ $103K
• 24h trading volume: $352K
• Liquidity: $33K
• Holder addresses: 6,170+
• Top 10 holders share: 17.6% (not overly concentrated)
• Circulating / max supply: 974M / 974M (fully circulating, no unlock-induced sell pressure)
💡 A few observations:
1. Narrative posts on Binance Square—Square users naturally resonate
2. Listed only 11 hours ago; the “pot” is just a little over $100k—this is a very early stage
3. 6K+ holder addresses—community spread isn’t slow
4. The 3-minute chart just pulled up a wave; volume followed and expanded
Early-stage micro-cap meme—volatility will be very high. Control your position yourself. DYOR—don’t get carried away.
Contract address: 0x324F74a4fd5D25186C74FAe255a5750B6A807777
SR-D9B3A0314AF412259365A219
$CASH, the inspiration came directly from Binance Square itself—Binance Square natives’ meme: turned the daily “Square” that everyone browses into a token, and the narrative comes with a built-in traffic boost.
📊 Current on-chain data (Flap Chain):
• Current price: $0.00010647
• Change: +2,246.8%
• Market cap: ~ $103K
• 24h trading volume: $352K
• Liquidity: $33K
• Holder addresses: 6,170+
• Top 10 holders share: 17.6% (not overly concentrated)
• Circulating / max supply: 974M / 974M (fully circulating, no unlock-induced sell pressure)
💡 A few observations:
1. Narrative posts on Binance Square—Square users naturally resonate
2. Listed only 11 hours ago; the “pot” is just a little over $100k—this is a very early stage
3. 6K+ holder addresses—community spread isn’t slow
4. The 3-minute chart just pulled up a wave; volume followed and expanded
Early-stage micro-cap meme—volatility will be very high. Control your position yourself. DYOR—don’t get carried away.
Contract address: 0x324F74a4fd5D25186C74FAe255a5750B6A807777
SR-D9B3A0314AF412259365A219
1
151
Log in to explore more content
Join global crypto users on Binance Square
⚡️ Get latest and useful information about crypto.
💬 Trusted by the world’s largest crypto exchange.
👍 Discover real insights from verified creators.
Email / Phone number
Trending Topics
UKFCAOpensCryptoFirmAuthorization
8 views
12 Discussing
#ukfcaopenscryptofirmauthorization
🇬🇧🚨 UK OPENS THE DOOR FOR CRYPTO FIRMS!
The UK Financial Conduct Authority (FCA) has opened its crypto-firm authorization process, marking another major step toward bringing crypto businesses into the UK’s regulatory framework.
🏦 Crypto firms can seek authorization
📋 Regulatory standards coming into focus
🔐 Greater emphasis on compliance & consumer protection
🇬🇧 UK positioning itself as a regulated crypto market
The message is clear: crypto is moving deeper into traditional financial regulation. 👀
Could this attract more crypto companies to the UK?
#crypto #FCA #UKCBC #UK
Faizan Crypto Learner
·0 Likes
·2 views
JapanMOFStudyGroupOnTokenizedGovtBonds
592 views
69 Discussing
QNTRises287%
16,785 views
357 Discussing