

LionFire
324 Posts

LionFire
Report
Block User
Entusiasta de las criptomonedas🦁
35 Following
86 Followers
132 Liked
Posts
All
Quotes
Videos
PINNED
·
--
Bullish
#zec #ProbabilisticAnalysis #tradingplan
🎯 ZEC A 30 DÍAS: Probabilistic mapping for early October and hypothesis testing ($1,122) 📊⏳
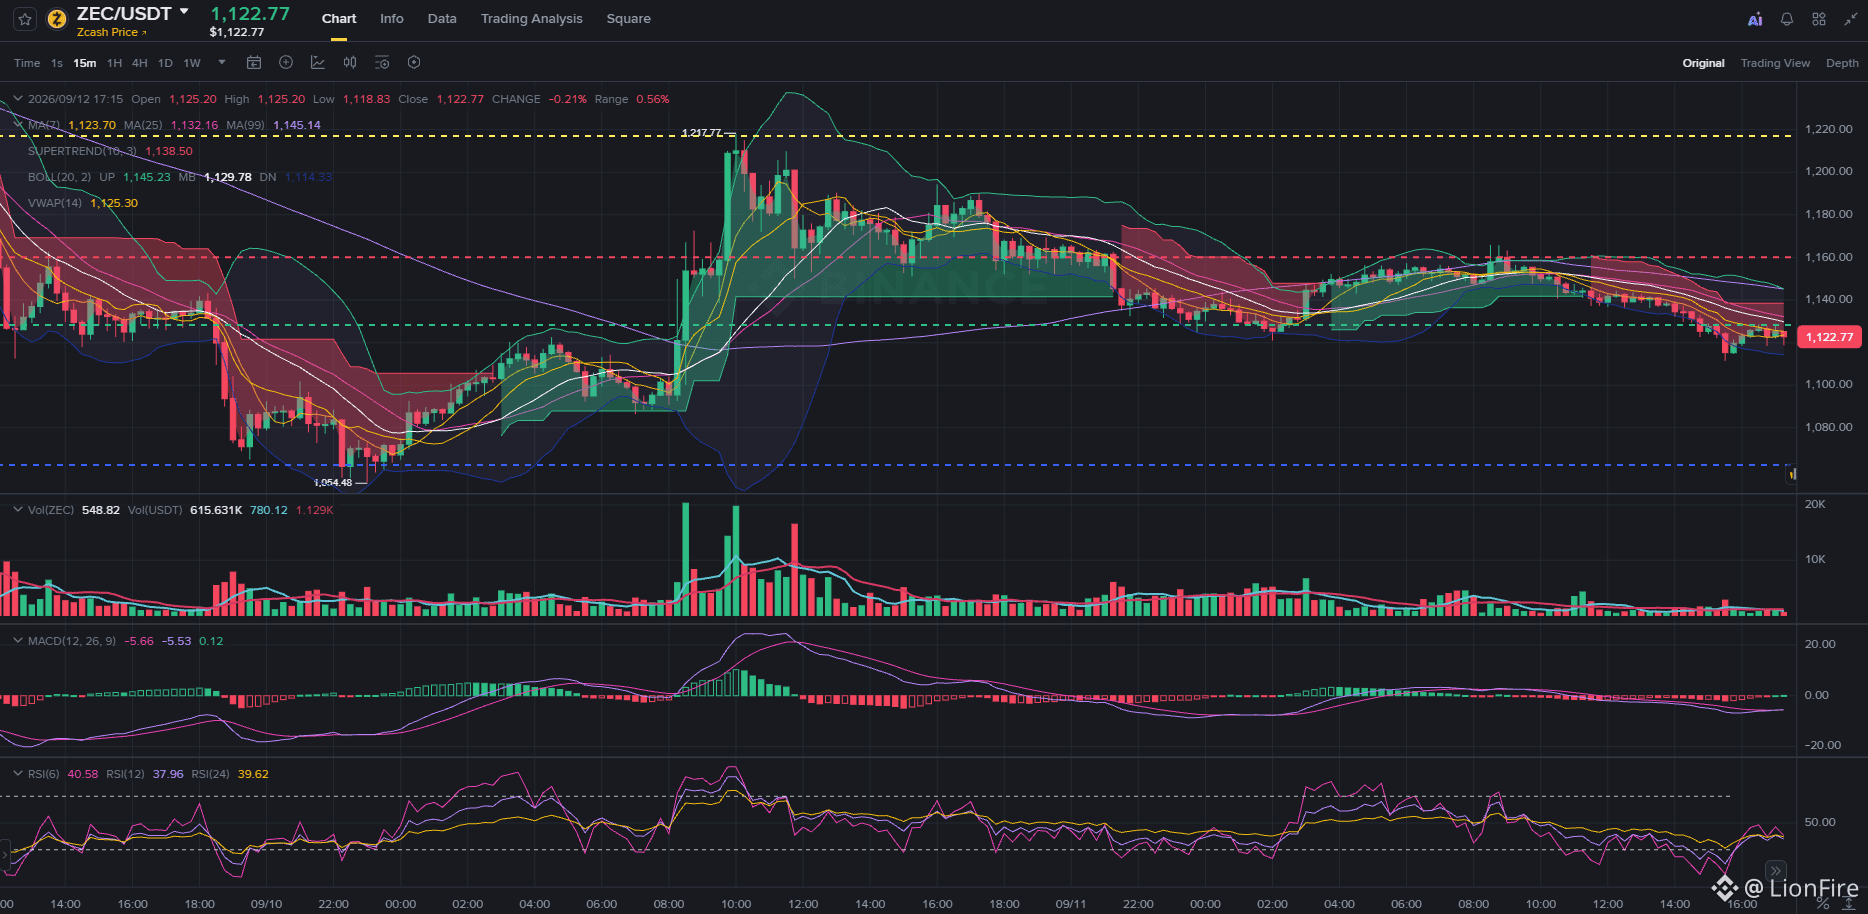
Testing the idea that markets are managed by probabilities, not certainties, we record the technical map of $ZEC ($1,122.77) on 15m. With the price currently testing our Green Line of buy, we set three objective scenarios to contrast exactly one month from now (October 12):
🚀 Bullish (Continuation) 50%
⚖️ Base (Compression) 35%
🔻 Bearish (Capitulation) 15%
🧭 Reading of the 4 marked levels:
🟢 Green Line ($1,120) — Entry Support: Active accumulation level. Price is defending the lower Bollinger band ($1,114) and the RSI(6) is cooling to 40.58 points. As long as this floor holds daily candles, the constructive structure remains alive.
🔴 Red Line ($1,160) — Confirmation Trigger: Intermediate ceiling. Breaking it toward the end of September turns the Supertrend ($1,138.50) to buys and cancels the pressure from the MA99 ($1,145.14), opening the door to acceleration.
🟡 Yellow Line ($1,220) — Major Resistance: Prior local high. Breaking this level with volume confirms the extension toward new cycle highs.
🔵 Blue Line ($1,064) — Safety Net: Invalidation of bullish momentum. Losing $1,120 would force a retest of this key support to avoid a purge toward $1,000.
💡 No bias or guesswork: the statistical edge is buying in the green zone with limited risk and waiting for confirmation on the red line. We save this analysis to audit results in 30 days. Strict risk management and a cool head! 🧠⚡
#zec #ProbabilisticAnalysis #tradingplan
🎯 ZEC A 30 DÍAS: Probabilistic mapping for early October and hypothesis testing ($1,122) 📊⏳
Testing the idea that markets are managed by probabilities, not certainties, we record the technical map of $ZEC ($1,122.77) on 15m. With the price currently testing our Green Line of buy, we set three objective scenarios to contrast exactly one month from now (October 12):
🚀 Bullish (Continuation) 50%
⚖️ Base (Compression) 35%
🔻 Bearish (Capitulation) 15%
🧭 Reading of the 4 marked levels:
🟢 Green Line ($1,120) — Entry Support: Active accumulation level. Price is defending the lower Bollinger band ($1,114) and the RSI(6) is cooling to 40.58 points. As long as this floor holds daily candles, the constructive structure remains alive.
🔴 Red Line ($1,160) — Confirmation Trigger: Intermediate ceiling. Breaking it toward the end of September turns the Supertrend ($1,138.50) to buys and cancels the pressure from the MA99 ($1,145.14), opening the door to acceleration.
🟡 Yellow Line ($1,220) — Major Resistance: Prior local high. Breaking this level with volume confirms the extension toward new cycle highs.
🔵 Blue Line ($1,064) — Safety Net: Invalidation of bullish momentum. Losing $1,120 would force a retest of this key support to avoid a purge toward $1,000.
💡 No bias or guesswork: the statistical edge is buying in the green zone with limited risk and waiting for confirmation on the red line. We save this analysis to audit results in 30 days. Strict risk management and a cool head! 🧠⚡
🎯 ZEC A 30 DÍAS: Probabilistic mapping for early October and hypothesis testing ($1,122) 📊⏳
Testing the idea that markets are managed by probabilities, not certainties, we record the technical map of $ZEC ($1,122.77) on 15m. With the price currently testing our Green Line of buy, we set three objective scenarios to contrast exactly one month from now (October 12):
🚀 Bullish (Continuation) 50%
⚖️ Base (Compression) 35%
🔻 Bearish (Capitulation) 15%
🧭 Reading of the 4 marked levels:
🟢 Green Line ($1,120) — Entry Support: Active accumulation level. Price is defending the lower Bollinger band ($1,114) and the RSI(6) is cooling to 40.58 points. As long as this floor holds daily candles, the constructive structure remains alive.
🔴 Red Line ($1,160) — Confirmation Trigger: Intermediate ceiling. Breaking it toward the end of September turns the Supertrend ($1,138.50) to buys and cancels the pressure from the MA99 ($1,145.14), opening the door to acceleration.
🟡 Yellow Line ($1,220) — Major Resistance: Prior local high. Breaking this level with volume confirms the extension toward new cycle highs.
🔵 Blue Line ($1,064) — Safety Net: Invalidation of bullish momentum. Losing $1,120 would force a retest of this key support to avoid a purge toward $1,000.
💡 No bias or guesswork: the statistical edge is buying in the green zone with limited risk and waiting for confirmation on the red line. We save this analysis to audit results in 30 days. Strict risk management and a cool head! 🧠⚡
285
PINNED
·
--
Bullish
#TechnicalAnalysis #RiskManagement #MarketPhilosophy
🔥 THE GREAT ILLUSION OF TECHNICAL ANALYSIS📉🔮
Many won’t like reading this, but the financial market is not a Swiss watch and not a physics problem solved by drawing trend lines. Pretending that a moving-average crossover or a candle pattern “predicts” the future ignores the very nature of markets: they are complex adaptive systems.
🌪️ 1. The fallacy of predicting complexity
🧩 Nonlinear interaction: A market is made up of millions of participants with disparate time horizons: HFT algorithms, market makers, hedge funds, central banks, and retail traders driven by FOMO. Each decision changes the environment in real time, producing chaotic dynamics and feedback loops that are impossible to model.
🚗 Looking in the rearview mirror: A technical indicator does not read the future; it processes past data. Support or an RSI doesn’t move capital. What moves price are market orders and institutional flow executing in the order book at this precise moment.
🩳 The trap of self-fulfilling prophecy: The only reason certain technical levels “work” temporarily is that thousands of eyes are looking at the same screen... until a player with enough capital uses that concentrated liquidity to hunt stops and sweep the crowd.
🎲 2. Probabilities vs. Certainties: The real boundary
⚖️ No guarantees in the short or medium term: No one—absolutely no one—knows for sure what candle will close in 15 minutes, in 4 hours, or next week. A surprise macroeconomic data point or a forced liquidation in derivatives can ruin any “perfect” setup in microseconds.
🛡️ The true role of technical analysis: The chart is not a crystal ball for guessing tops or bottoms; it’s simply a compass for managing probabilities and defining where your hypothesis is invalidated.
Treating technical analysis as a predictive science is like playing financial astrology with real money.
#TechnicalAnalysis #RiskManagement #MarketPhilosophy
🔥 THE GREAT ILLUSION OF TECHNICAL ANALYSIS📉🔮
Many won’t like reading this, but the financial market is not a Swiss watch and not a physics problem solved by drawing trend lines. Pretending that a moving-average crossover or a candle pattern “predicts” the future ignores the very nature of markets: they are complex adaptive systems.
🌪️ 1. The fallacy of predicting complexity
🧩 Nonlinear interaction: A market is made up of millions of participants with disparate time horizons: HFT algorithms, market makers, hedge funds, central banks, and retail traders driven by FOMO. Each decision changes the environment in real time, producing chaotic dynamics and feedback loops that are impossible to model.
🚗 Looking in the rearview mirror: A technical indicator does not read the future; it processes past data. Support or an RSI doesn’t move capital. What moves price are market orders and institutional flow executing in the order book at this precise moment.
🩳 The trap of self-fulfilling prophecy: The only reason certain technical levels “work” temporarily is that thousands of eyes are looking at the same screen... until a player with enough capital uses that concentrated liquidity to hunt stops and sweep the crowd.
🎲 2. Probabilities vs. Certainties: The real boundary
⚖️ No guarantees in the short or medium term: No one—absolutely no one—knows for sure what candle will close in 15 minutes, in 4 hours, or next week. A surprise macroeconomic data point or a forced liquidation in derivatives can ruin any “perfect” setup in microseconds.
🛡️ The true role of technical analysis: The chart is not a crystal ball for guessing tops or bottoms; it’s simply a compass for managing probabilities and defining where your hypothesis is invalidated.
Treating technical analysis as a predictive science is like playing financial astrology with real money.
🔥 THE GREAT ILLUSION OF TECHNICAL ANALYSIS📉🔮
Many won’t like reading this, but the financial market is not a Swiss watch and not a physics problem solved by drawing trend lines. Pretending that a moving-average crossover or a candle pattern “predicts” the future ignores the very nature of markets: they are complex adaptive systems.
🌪️ 1. The fallacy of predicting complexity
🧩 Nonlinear interaction: A market is made up of millions of participants with disparate time horizons: HFT algorithms, market makers, hedge funds, central banks, and retail traders driven by FOMO. Each decision changes the environment in real time, producing chaotic dynamics and feedback loops that are impossible to model.
🚗 Looking in the rearview mirror: A technical indicator does not read the future; it processes past data. Support or an RSI doesn’t move capital. What moves price are market orders and institutional flow executing in the order book at this precise moment.
🩳 The trap of self-fulfilling prophecy: The only reason certain technical levels “work” temporarily is that thousands of eyes are looking at the same screen... until a player with enough capital uses that concentrated liquidity to hunt stops and sweep the crowd.
🎲 2. Probabilities vs. Certainties: The real boundary
⚖️ No guarantees in the short or medium term: No one—absolutely no one—knows for sure what candle will close in 15 minutes, in 4 hours, or next week. A surprise macroeconomic data point or a forced liquidation in derivatives can ruin any “perfect” setup in microseconds.
🛡️ The true role of technical analysis: The chart is not a crystal ball for guessing tops or bottoms; it’s simply a compass for managing probabilities and defining where your hypothesis is invalidated.
Treating technical analysis as a predictive science is like playing financial astrology with real money.

27
·
--
Bullish
#SPCX #TradingAnalysis #Aerospace
🚀 SPACEX TRAS EL VUELO ($145.89): Structural resilience and flawless absorption of "Sell the News" 🛰️🛡️
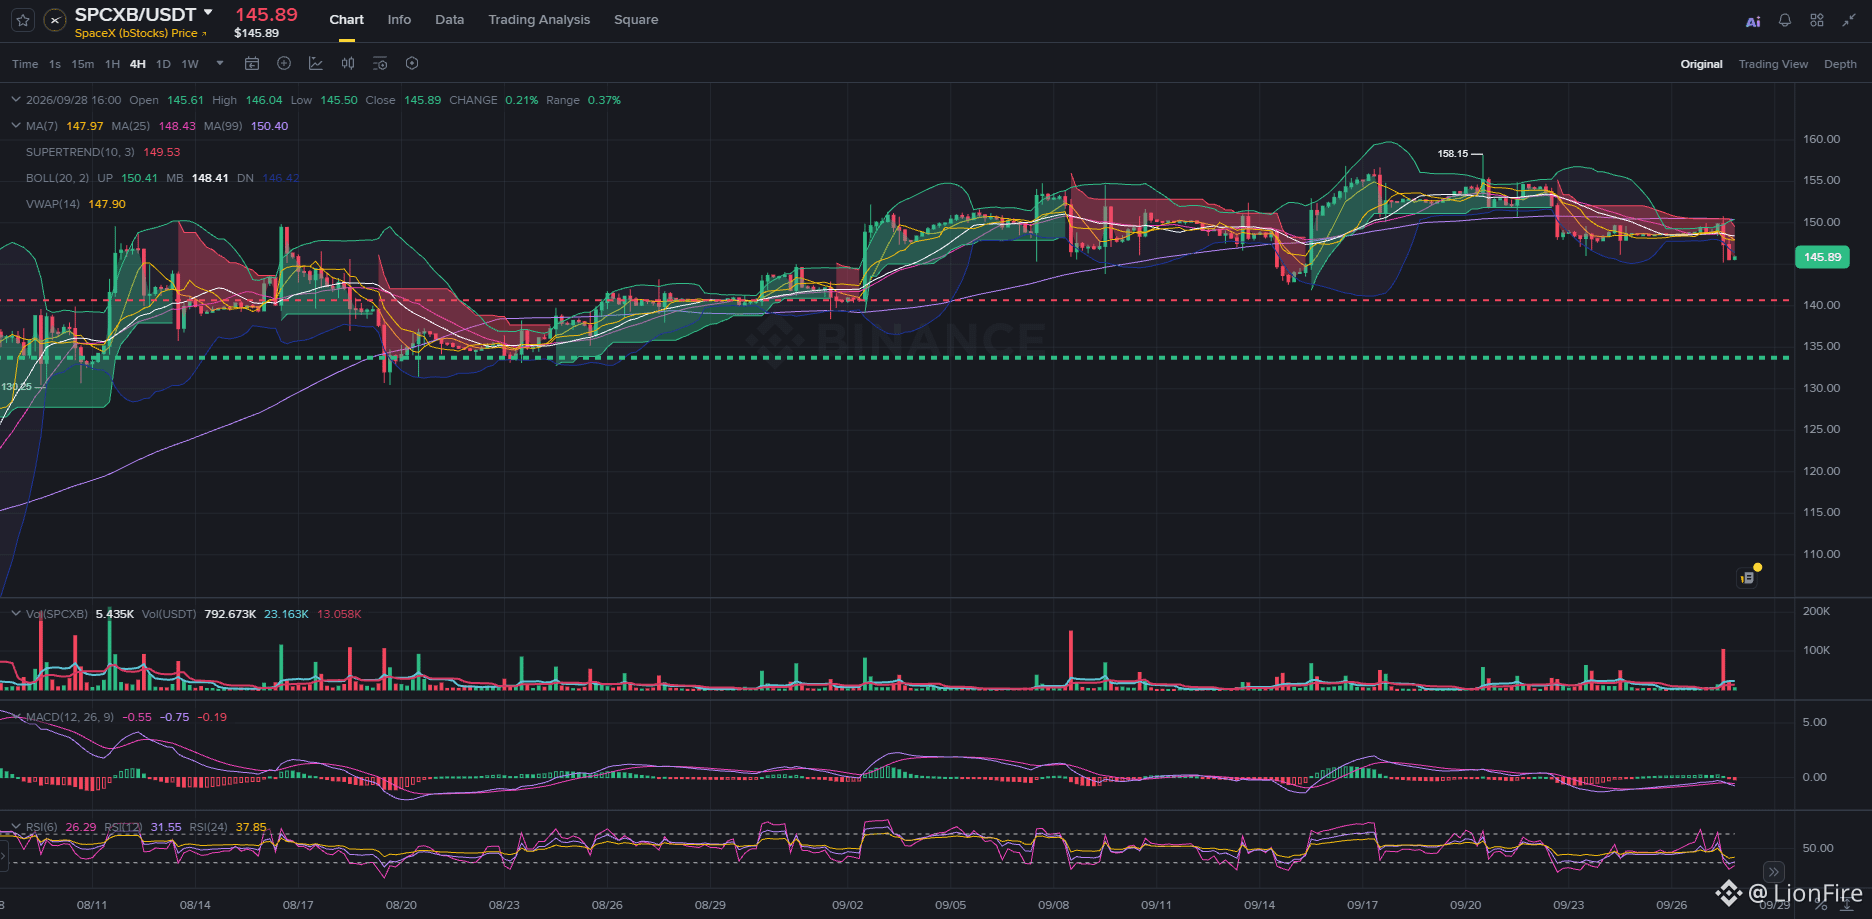
Far from triggering capitulation or a massive take-profit move after today’s mission, $SPCXB ($145.89) is digesting the event while maintaining remarkable technical health on the 4-Hour chart (4H). The market once again shows that it doesn’t trade launches as isolated speculative catalysts, but as operational validations of an aerospace monopoly in continuous expansion.
📊 1. The technical structure absorbs the impact (4H):
🛑 The master floor didn’t even flinch: After printing a recent high at $158.15, the intraday pullback hasn’t even come close to compromising our critical zone. The red support line ($141.60) remains intact and at a prudent distance, confirming that the underlying trend is still under buyer control.
⚡ Extreme oversold as a spring: The RSI(6) sank to 28.29 points. This abrupt cooldown reflects the immediate exhaustion of short-term sellers, setting the stage for a mean-reversion bounce.
🗜️ Compression at the base: Price defends the lower Bollinger band ($146.42) with orderly volume of 5.43K SPCXB, with no signs of institutional panic selling.
🎯 2. Key reactivation levels:
🟢 Active buy zone: The range between $144.00 and $146.00 offers favorable asymmetry, supported by the safety net of the red line at $141.60 and the green base at $134.00.
🚀 Barrier to retake: To reignite bullish momentum toward $155+, price must break above the dynamic resistance of the VWAP ($147.90), the MA25 ($148.43), and the Supertrend at $149.53.
💡 That a company keeps its stock firm after completing flight milestones confirms that the risk premium is backed by solid industrial fundamentals—not by mere fleeting euphoria. Stay disciplined and execute the plan with a cool head! 🧠⚡
#SPCX #TradingAnalysis #Aerospace
🚀 SPACEX TRAS EL VUELO ($145.89): Structural resilience and flawless absorption of "Sell the News" 🛰️🛡️
Far from triggering capitulation or a massive take-profit move after today’s mission, $SPCXB ($145.89) is digesting the event while maintaining remarkable technical health on the 4-Hour chart (4H). The market once again shows that it doesn’t trade launches as isolated speculative catalysts, but as operational validations of an aerospace monopoly in continuous expansion.
📊 1. The technical structure absorbs the impact (4H):
🛑 The master floor didn’t even flinch: After printing a recent high at $158.15, the intraday pullback hasn’t even come close to compromising our critical zone. The red support line ($141.60) remains intact and at a prudent distance, confirming that the underlying trend is still under buyer control.
⚡ Extreme oversold as a spring: The RSI(6) sank to 28.29 points. This abrupt cooldown reflects the immediate exhaustion of short-term sellers, setting the stage for a mean-reversion bounce.
🗜️ Compression at the base: Price defends the lower Bollinger band ($146.42) with orderly volume of 5.43K SPCXB, with no signs of institutional panic selling.
🎯 2. Key reactivation levels:
🟢 Active buy zone: The range between $144.00 and $146.00 offers favorable asymmetry, supported by the safety net of the red line at $141.60 and the green base at $134.00.
🚀 Barrier to retake: To reignite bullish momentum toward $155+, price must break above the dynamic resistance of the VWAP ($147.90), the MA25 ($148.43), and the Supertrend at $149.53.
💡 That a company keeps its stock firm after completing flight milestones confirms that the risk premium is backed by solid industrial fundamentals—not by mere fleeting euphoria. Stay disciplined and execute the plan with a cool head! 🧠⚡
🚀 SPACEX TRAS EL VUELO ($145.89): Structural resilience and flawless absorption of "Sell the News" 🛰️🛡️
Far from triggering capitulation or a massive take-profit move after today’s mission, $SPCXB ($145.89) is digesting the event while maintaining remarkable technical health on the 4-Hour chart (4H). The market once again shows that it doesn’t trade launches as isolated speculative catalysts, but as operational validations of an aerospace monopoly in continuous expansion.
📊 1. The technical structure absorbs the impact (4H):
🛑 The master floor didn’t even flinch: After printing a recent high at $158.15, the intraday pullback hasn’t even come close to compromising our critical zone. The red support line ($141.60) remains intact and at a prudent distance, confirming that the underlying trend is still under buyer control.
⚡ Extreme oversold as a spring: The RSI(6) sank to 28.29 points. This abrupt cooldown reflects the immediate exhaustion of short-term sellers, setting the stage for a mean-reversion bounce.
🗜️ Compression at the base: Price defends the lower Bollinger band ($146.42) with orderly volume of 5.43K SPCXB, with no signs of institutional panic selling.
🎯 2. Key reactivation levels:
🟢 Active buy zone: The range between $144.00 and $146.00 offers favorable asymmetry, supported by the safety net of the red line at $141.60 and the green base at $134.00.
🚀 Barrier to retake: To reignite bullish momentum toward $155+, price must break above the dynamic resistance of the VWAP ($147.90), the MA25 ($148.43), and the Supertrend at $149.53.
💡 That a company keeps its stock firm after completing flight milestones confirms that the risk premium is backed by solid industrial fundamentals—not by mere fleeting euphoria. Stay disciplined and execute the plan with a cool head! 🧠⚡
202
·
--
Bullish
#zec #CryptoAlert #TradingAnalysis
🚨 ZEC ALERT ($1,461): It crushed the bullish projections and now breaks support on the 4H chart. Trap or value buy? 📊⚡
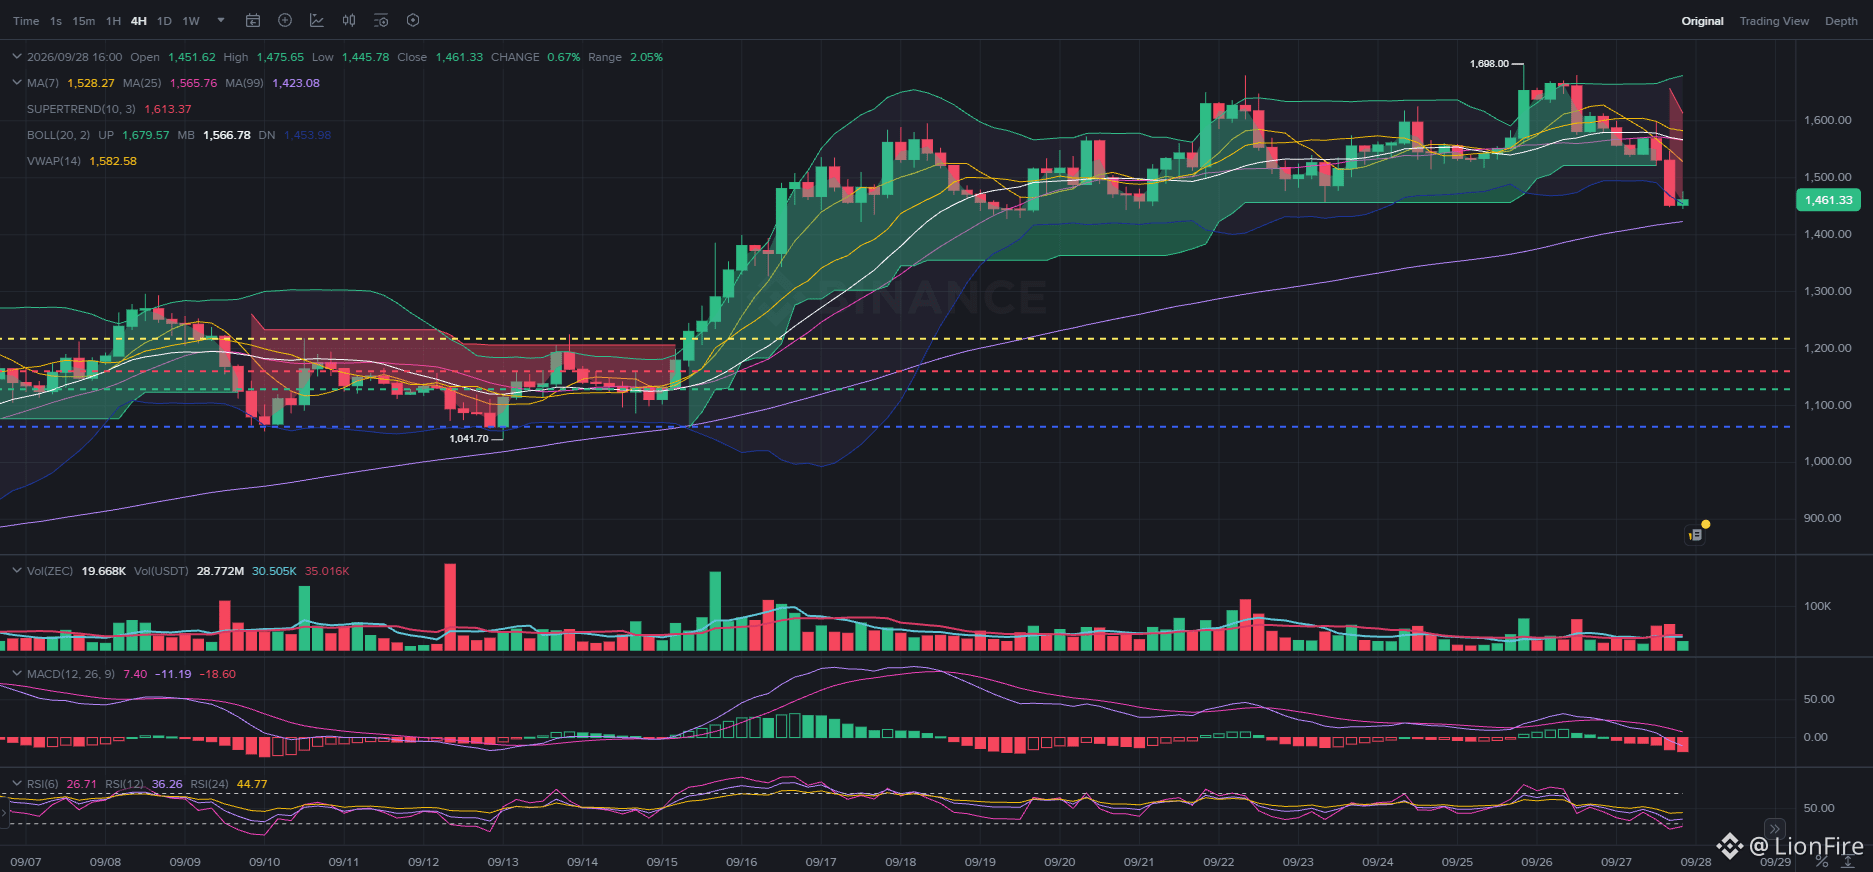
In our previous analysis, we projected a target range of $1,350 – $1,500 for early October. $ZEC ($1,461.33) didn’t just confirm the thesis—it swallowed the bullish scenario by marking a top at $1,698.00 days early. However, after the vertical euphoria, the 4-Hour (4H) chart has just broken its dynamic support.
📉 1. Breaking down the 4H breakdown (4H):
🛑 Short-term reversal: The Supertrend turned red at $1,613.37, confirming aggressive profit-taking after brushing $1,700.
🔻 Loss of fast moving averages: Price pierced the MA7 ($1,528.27), the MA25 ($1,565.76), and the VWAP ($1,582.58), now testing the lower Bollinger band at $1,453.98.
🩸 Oscillator pressure: The MACD histogram deepens into negative territory (-18.60), signaling the loss of immediate buying momentum.
🎯 2. Why this pullback opens a strategic window:
⚡ Extreme oversold: RSI(6) collapsed to 26.71 points. This cooling level hasn’t been seen in weeks and often anticipates technical bounces driven by seller exhaustion.
🛡️ The MA99 cushion: Just below the price action sits the MA99 at $1,423.08, an institutional dynamic support where meaningful buy-side liquidity converges.
💎 Intact potential for a bottom: After a parabolic rally from $1,120, a correction toward the $1,420 – $1,460 zone is the natural breathing space to clean up the order book and allow entries at a better price before structuring the next impulse.
💡 Breaking 4H support scares those who buy at highs, but for the strategic trader it opens an accumulation zone with favorable asymmetry between $1,420 and $1,460. Strict technical stop loss if it loses $1,400 with volume. Keep a cool head and manage risk! 🧠⚡
#zec #CryptoAlert #TradingAnalysis
🚨 ZEC ALERT ($1,461): It crushed the bullish projections and now breaks support on the 4H chart. Trap or value buy? 📊⚡
In our previous analysis, we projected a target range of $1,350 – $1,500 for early October. $ZEC ($1,461.33) didn’t just confirm the thesis—it swallowed the bullish scenario by marking a top at $1,698.00 days early. However, after the vertical euphoria, the 4-Hour (4H) chart has just broken its dynamic support.
📉 1. Breaking down the 4H breakdown (4H):
🛑 Short-term reversal: The Supertrend turned red at $1,613.37, confirming aggressive profit-taking after brushing $1,700.
🔻 Loss of fast moving averages: Price pierced the MA7 ($1,528.27), the MA25 ($1,565.76), and the VWAP ($1,582.58), now testing the lower Bollinger band at $1,453.98.
🩸 Oscillator pressure: The MACD histogram deepens into negative territory (-18.60), signaling the loss of immediate buying momentum.
🎯 2. Why this pullback opens a strategic window:
⚡ Extreme oversold: RSI(6) collapsed to 26.71 points. This cooling level hasn’t been seen in weeks and often anticipates technical bounces driven by seller exhaustion.
🛡️ The MA99 cushion: Just below the price action sits the MA99 at $1,423.08, an institutional dynamic support where meaningful buy-side liquidity converges.
💎 Intact potential for a bottom: After a parabolic rally from $1,120, a correction toward the $1,420 – $1,460 zone is the natural breathing space to clean up the order book and allow entries at a better price before structuring the next impulse.
💡 Breaking 4H support scares those who buy at highs, but for the strategic trader it opens an accumulation zone with favorable asymmetry between $1,420 and $1,460. Strict technical stop loss if it loses $1,400 with volume. Keep a cool head and manage risk! 🧠⚡
🚨 ZEC ALERT ($1,461): It crushed the bullish projections and now breaks support on the 4H chart. Trap or value buy? 📊⚡
In our previous analysis, we projected a target range of $1,350 – $1,500 for early October. $ZEC ($1,461.33) didn’t just confirm the thesis—it swallowed the bullish scenario by marking a top at $1,698.00 days early. However, after the vertical euphoria, the 4-Hour (4H) chart has just broken its dynamic support.
📉 1. Breaking down the 4H breakdown (4H):
🛑 Short-term reversal: The Supertrend turned red at $1,613.37, confirming aggressive profit-taking after brushing $1,700.
🔻 Loss of fast moving averages: Price pierced the MA7 ($1,528.27), the MA25 ($1,565.76), and the VWAP ($1,582.58), now testing the lower Bollinger band at $1,453.98.
🩸 Oscillator pressure: The MACD histogram deepens into negative territory (-18.60), signaling the loss of immediate buying momentum.
🎯 2. Why this pullback opens a strategic window:
⚡ Extreme oversold: RSI(6) collapsed to 26.71 points. This cooling level hasn’t been seen in weeks and often anticipates technical bounces driven by seller exhaustion.
🛡️ The MA99 cushion: Just below the price action sits the MA99 at $1,423.08, an institutional dynamic support where meaningful buy-side liquidity converges.
💎 Intact potential for a bottom: After a parabolic rally from $1,120, a correction toward the $1,420 – $1,460 zone is the natural breathing space to clean up the order book and allow entries at a better price before structuring the next impulse.
💡 Breaking 4H support scares those who buy at highs, but for the strategic trader it opens an accumulation zone with favorable asymmetry between $1,420 and $1,460. Strict technical stop loss if it loses $1,400 with volume. Keep a cool head and manage risk! 🧠⚡
2
584
·
--
Bullish
#BTC #Ethereum #CryptoMacro
🏛️ ETH’S CRYSTAL CEILING VS. BTC’S PATH: 📊⚖️
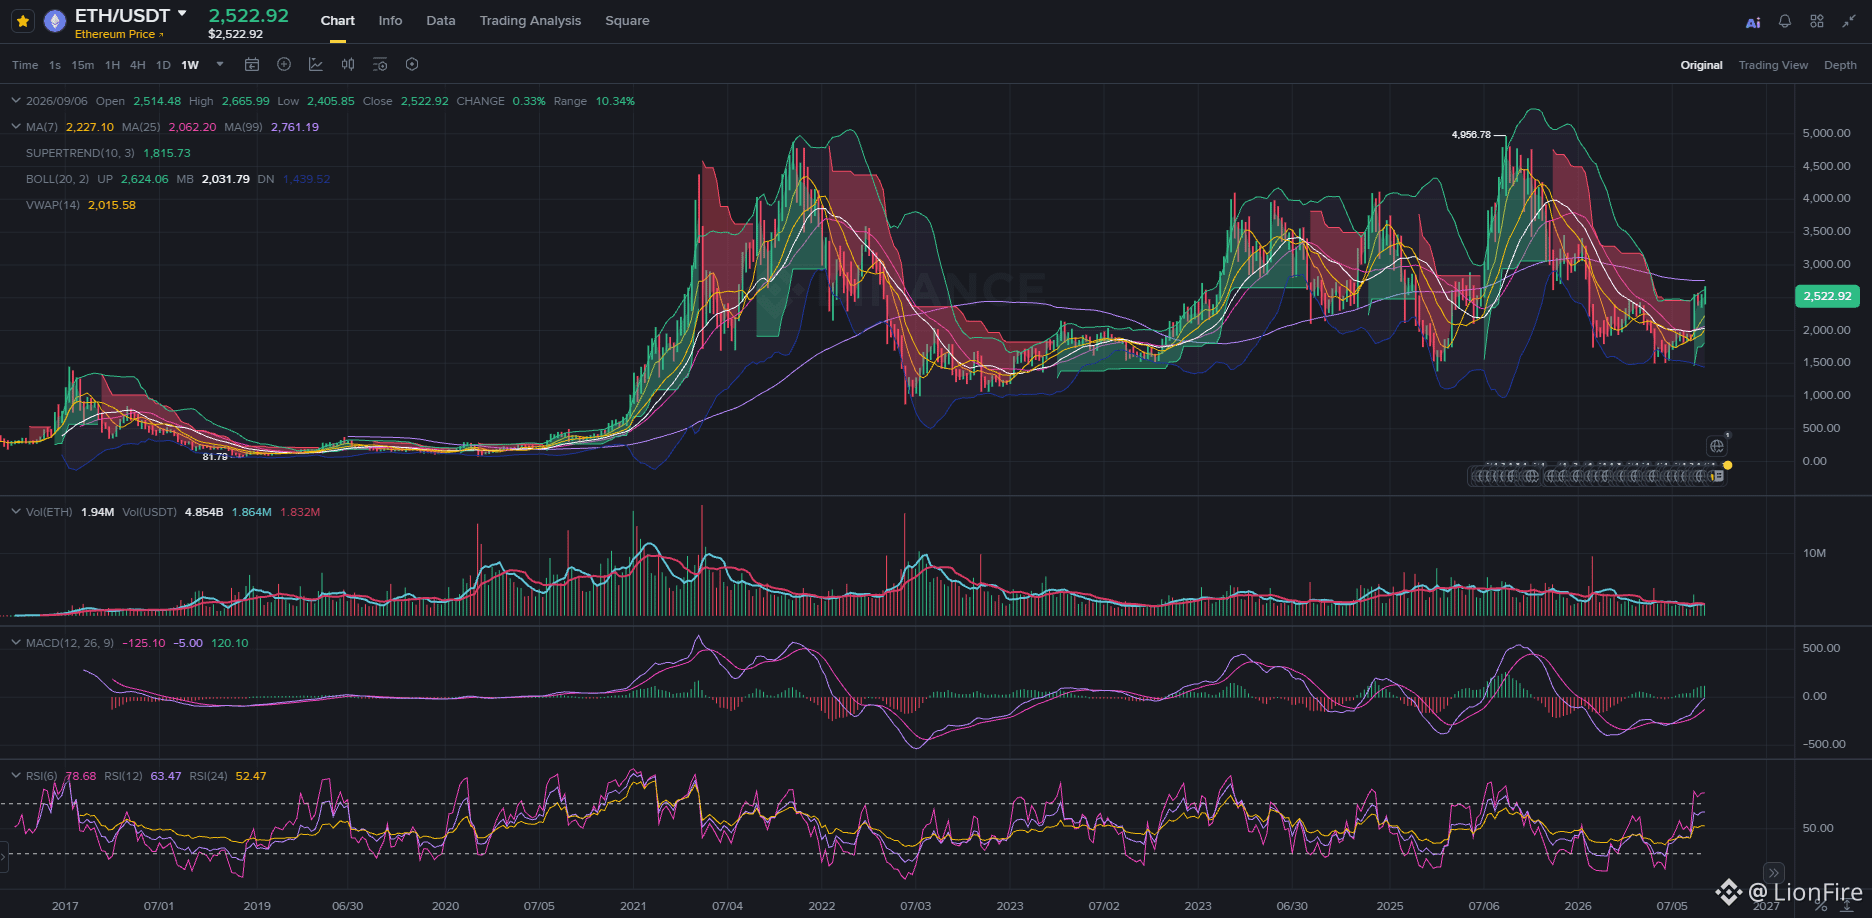
When you zoom out to the Weekly chart, the disconnect between the two dominant assets stops being a matter of sentiment and becomes a mathematical reality of flows and structure.
🧱 1. Why $ETH is facing a structural wall at $5,000:
🩸 Cannibalization by L2s and the end of "Ultrasound Money": The massive migration of activity to secondary layers stripped the base layer of commission income. The burn mechanism collapsed and ETH returned to being inflationary, dismantling its core scarcity thesis.
📉 Trapped under its moving averages: After failing repeatedly to break through its historical ceiling of $4,868.79, ETH trades boxed in below its MA99 ($2,761.19) and its MA25 ($2,862.20). Every attempt to push upward toward $4k hits a gigantic distribution wall of trapped participants.
⚠️ Competitive pressure: In terms of performance and retail adoption, high-throughput chains like Solana erode its market share, while spot ETH ETFs without staking fail to gain institutional traction.
🚀 2. Why $BTC has a clear path to $200,000:
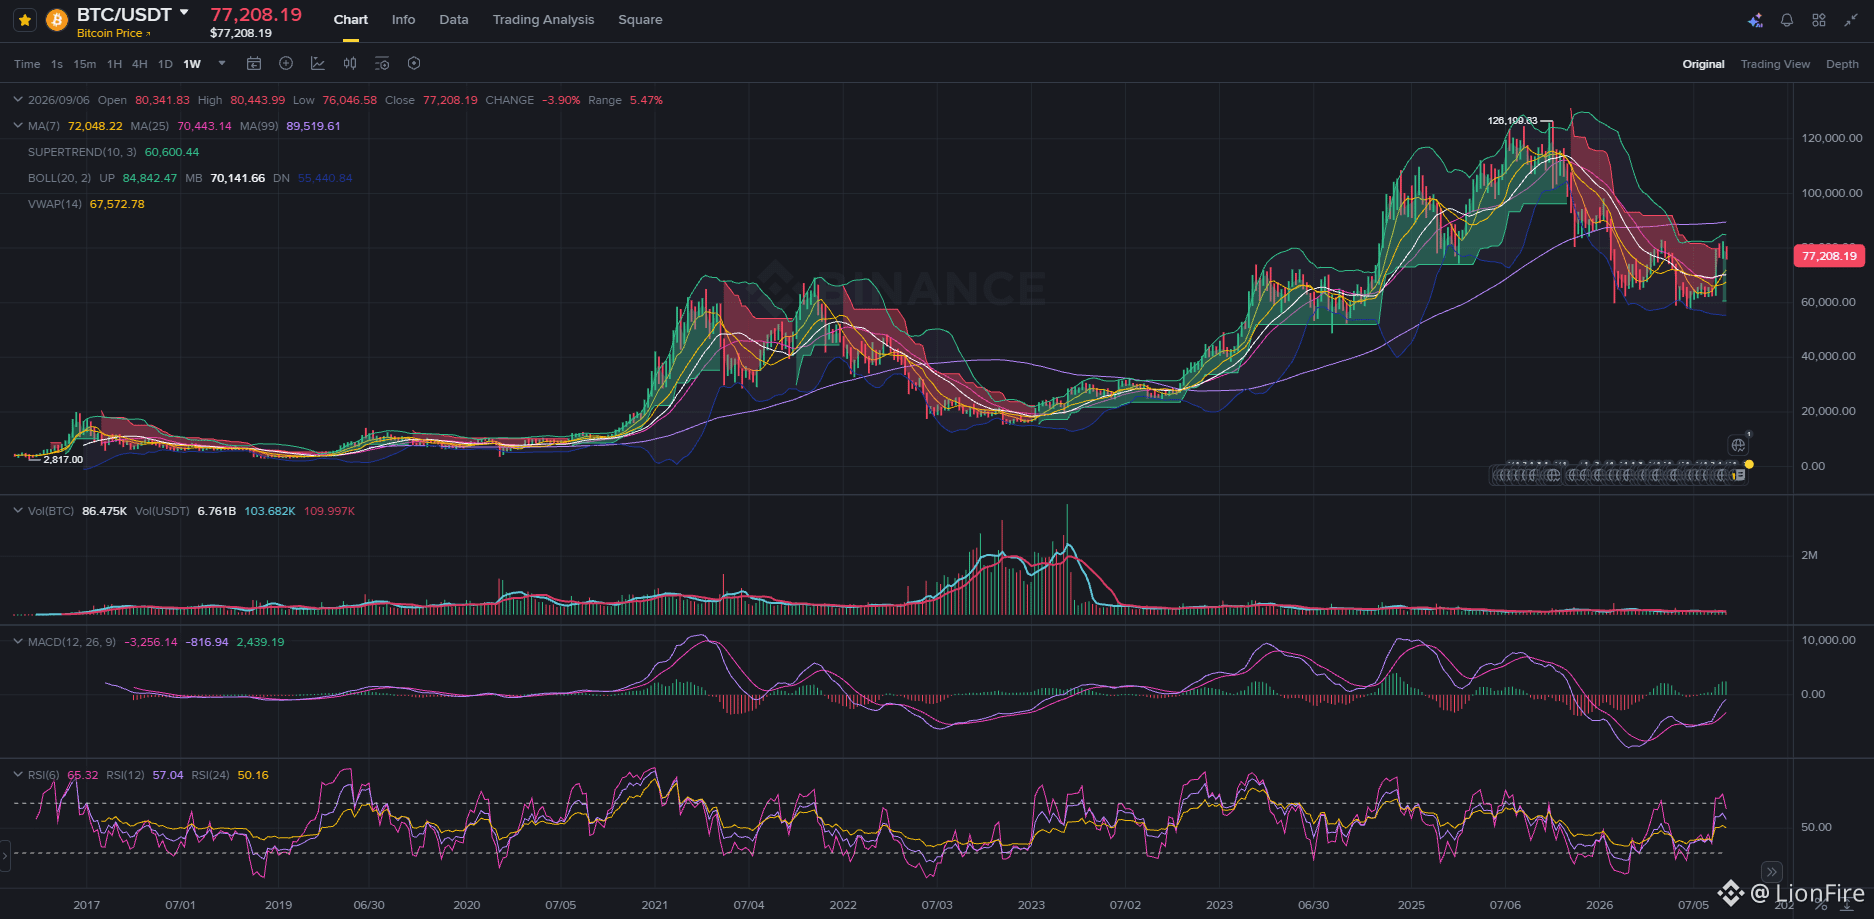
📐 Impeccable bullish macro structure: Unlike ETH, BTC set a new all-time high in this cycle, reaching $126,198.83. Its weekly moving averages maintain a perfect bullish order: MA7 ($72,048) > MA25 ($70,443) > MA99 ($60,519).
🧮 The multiple is feasible: Trading at $200k doesn’t require a miracle—it only needs about a ~2.6x move from current prices (or a +58% from its local high). A ~$4T market cap represents only a conservative fraction versus the gold market.
👑 BTC doesn’t compete as a computing network; it’s the global reserve asset and sovereign settlement layer. The capital it absorbs seeks macro refuge, not interaction with dApps.
💡 ETH competes like a tech company in a sector where software gets cheaper; BTC competes like scarce money in a world where fiat is being devalued.
#BTC #Ethereum #CryptoMacro
🏛️ ETH’S CRYSTAL CEILING VS. BTC’S PATH: 📊⚖️
When you zoom out to the Weekly chart, the disconnect between the two dominant assets stops being a matter of sentiment and becomes a mathematical reality of flows and structure.
🧱 1. Why $ETH is facing a structural wall at $5,000:
🩸 Cannibalization by L2s and the end of "Ultrasound Money": The massive migration of activity to secondary layers stripped the base layer of commission income. The burn mechanism collapsed and ETH returned to being inflationary, dismantling its core scarcity thesis.
📉 Trapped under its moving averages: After failing repeatedly to break through its historical ceiling of $4,868.79, ETH trades boxed in below its MA99 ($2,761.19) and its MA25 ($2,862.20). Every attempt to push upward toward $4k hits a gigantic distribution wall of trapped participants.
⚠️ Competitive pressure: In terms of performance and retail adoption, high-throughput chains like Solana erode its market share, while spot ETH ETFs without staking fail to gain institutional traction.
🚀 2. Why $BTC has a clear path to $200,000:
📐 Impeccable bullish macro structure: Unlike ETH, BTC set a new all-time high in this cycle, reaching $126,198.83. Its weekly moving averages maintain a perfect bullish order: MA7 ($72,048) > MA25 ($70,443) > MA99 ($60,519).
🧮 The multiple is feasible: Trading at $200k doesn’t require a miracle—it only needs about a ~2.6x move from current prices (or a +58% from its local high). A ~$4T market cap represents only a conservative fraction versus the gold market.
👑 BTC doesn’t compete as a computing network; it’s the global reserve asset and sovereign settlement layer. The capital it absorbs seeks macro refuge, not interaction with dApps.
💡 ETH competes like a tech company in a sector where software gets cheaper; BTC competes like scarce money in a world where fiat is being devalued.
🏛️ ETH’S CRYSTAL CEILING VS. BTC’S PATH: 📊⚖️
When you zoom out to the Weekly chart, the disconnect between the two dominant assets stops being a matter of sentiment and becomes a mathematical reality of flows and structure.
🧱 1. Why $ETH is facing a structural wall at $5,000:
🩸 Cannibalization by L2s and the end of "Ultrasound Money": The massive migration of activity to secondary layers stripped the base layer of commission income. The burn mechanism collapsed and ETH returned to being inflationary, dismantling its core scarcity thesis.
📉 Trapped under its moving averages: After failing repeatedly to break through its historical ceiling of $4,868.79, ETH trades boxed in below its MA99 ($2,761.19) and its MA25 ($2,862.20). Every attempt to push upward toward $4k hits a gigantic distribution wall of trapped participants.
⚠️ Competitive pressure: In terms of performance and retail adoption, high-throughput chains like Solana erode its market share, while spot ETH ETFs without staking fail to gain institutional traction.
🚀 2. Why $BTC has a clear path to $200,000:
📐 Impeccable bullish macro structure: Unlike ETH, BTC set a new all-time high in this cycle, reaching $126,198.83. Its weekly moving averages maintain a perfect bullish order: MA7 ($72,048) > MA25 ($70,443) > MA99 ($60,519).
🧮 The multiple is feasible: Trading at $200k doesn’t require a miracle—it only needs about a ~2.6x move from current prices (or a +58% from its local high). A ~$4T market cap represents only a conservative fraction versus the gold market.
👑 BTC doesn’t compete as a computing network; it’s the global reserve asset and sovereign settlement layer. The capital it absorbs seeks macro refuge, not interaction with dApps.
💡 ETH competes like a tech company in a sector where software gets cheaper; BTC competes like scarce money in a world where fiat is being devalued.
56
·
--
Bullish
#zec #MarketAnalysis #altcoins
🛡️ ZCASH ROADMAP ($1,126): Two key lines to define the bullish structure heading into October 📊🎯
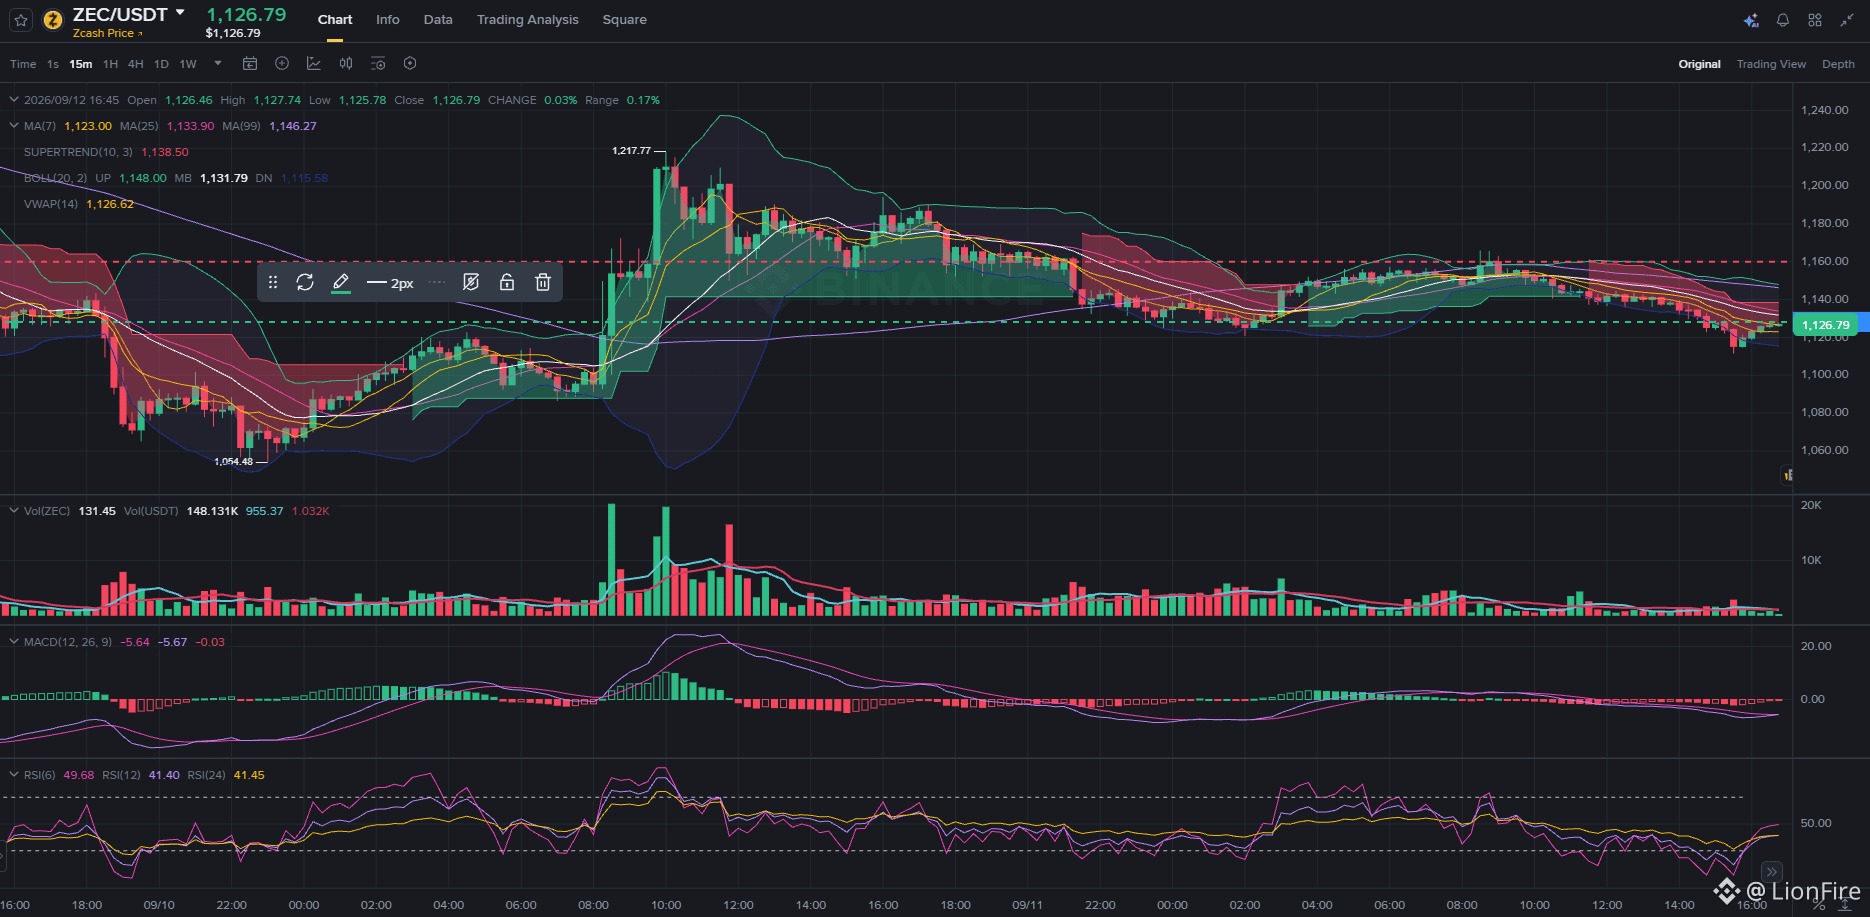
After the rejection at $1,217.77 and the absorption of weekly close volatility, $ZEC ($1,126.79) compresses into a highly relevant technical zone within the 15-minute timeframe (15m). The navigation map for the coming weeks is summarized in two precise references:
🟢 1. Green Line ($1,120.00): The Strategic Buy Zone
🎯 Accumulation window: Testing $1,120.00 lines up with the defense of the lower Bollinger Band ($1,115.58) and stabilization above the VWAP ($1,126.62).
⚖️ Risk/Reward asymmetry: After yesterday’s sell-off, the selling volume dried up dramatically (~131 ZEC in 15m) and the RSI(6) reset its overbought condition back to a neutral zone of 49.68 points. This area provides an optimal entry point to position with limited risk.
🔴 2. Red Line ($1,160.00): The Bullish Confirmation Trigger
🚀 The level that unlocks momentum: The $1,160.00 band previously acted as a distribution floor and now represents the structural resistance to break.
📅 End-of-September / early-October horizon: Reclaiming this red line would confirm the breakout of the intraday correction, overcoming the MA99 ($1,146.27) and flipping the Supertrend ($1,138.10). This is the necessary inflection point to validate the continuation of the macro rally toward new quarterly highs.
💡 Tactical execution:
In this kind of structure, the edge lies in accumulating patiently at support (green line at $1,120) and waiting for volume breakout validation at resistance (red line at $1,160) instead of chasing the price mid-range. As always, clear invalidation with firm closes below $1,115. Plan the entry, protect capital, and trade with discipline! 🧠⚡
#zec #MarketAnalysis #altcoins
🛡️ ZCASH ROADMAP ($1,126): Two key lines to define the bullish structure heading into October 📊🎯
After the rejection at $1,217.77 and the absorption of weekly close volatility, $ZEC ($1,126.79) compresses into a highly relevant technical zone within the 15-minute timeframe (15m). The navigation map for the coming weeks is summarized in two precise references:
🟢 1. Green Line ($1,120.00): The Strategic Buy Zone
🎯 Accumulation window: Testing $1,120.00 lines up with the defense of the lower Bollinger Band ($1,115.58) and stabilization above the VWAP ($1,126.62).
⚖️ Risk/Reward asymmetry: After yesterday’s sell-off, the selling volume dried up dramatically (~131 ZEC in 15m) and the RSI(6) reset its overbought condition back to a neutral zone of 49.68 points. This area provides an optimal entry point to position with limited risk.
🔴 2. Red Line ($1,160.00): The Bullish Confirmation Trigger
🚀 The level that unlocks momentum: The $1,160.00 band previously acted as a distribution floor and now represents the structural resistance to break.
📅 End-of-September / early-October horizon: Reclaiming this red line would confirm the breakout of the intraday correction, overcoming the MA99 ($1,146.27) and flipping the Supertrend ($1,138.10). This is the necessary inflection point to validate the continuation of the macro rally toward new quarterly highs.
💡 Tactical execution:
In this kind of structure, the edge lies in accumulating patiently at support (green line at $1,120) and waiting for volume breakout validation at resistance (red line at $1,160) instead of chasing the price mid-range. As always, clear invalidation with firm closes below $1,115. Plan the entry, protect capital, and trade with discipline! 🧠⚡
🛡️ ZCASH ROADMAP ($1,126): Two key lines to define the bullish structure heading into October 📊🎯
After the rejection at $1,217.77 and the absorption of weekly close volatility, $ZEC ($1,126.79) compresses into a highly relevant technical zone within the 15-minute timeframe (15m). The navigation map for the coming weeks is summarized in two precise references:
🟢 1. Green Line ($1,120.00): The Strategic Buy Zone
🎯 Accumulation window: Testing $1,120.00 lines up with the defense of the lower Bollinger Band ($1,115.58) and stabilization above the VWAP ($1,126.62).
⚖️ Risk/Reward asymmetry: After yesterday’s sell-off, the selling volume dried up dramatically (~131 ZEC in 15m) and the RSI(6) reset its overbought condition back to a neutral zone of 49.68 points. This area provides an optimal entry point to position with limited risk.
🔴 2. Red Line ($1,160.00): The Bullish Confirmation Trigger
🚀 The level that unlocks momentum: The $1,160.00 band previously acted as a distribution floor and now represents the structural resistance to break.
📅 End-of-September / early-October horizon: Reclaiming this red line would confirm the breakout of the intraday correction, overcoming the MA99 ($1,146.27) and flipping the Supertrend ($1,138.10). This is the necessary inflection point to validate the continuation of the macro rally toward new quarterly highs.
💡 Tactical execution:
In this kind of structure, the edge lies in accumulating patiently at support (green line at $1,120) and waiting for volume breakout validation at resistance (red line at $1,160) instead of chasing the price mid-range. As always, clear invalidation with firm closes below $1,115. Plan the entry, protect capital, and trade with discipline! 🧠⚡
294
·
--
Bullish
#SpaceX #Starship #Aerospace
🚀 BEYOND THE CHART: Why Starship milestones fortify SpaceX’s economic moat 🛰️💎
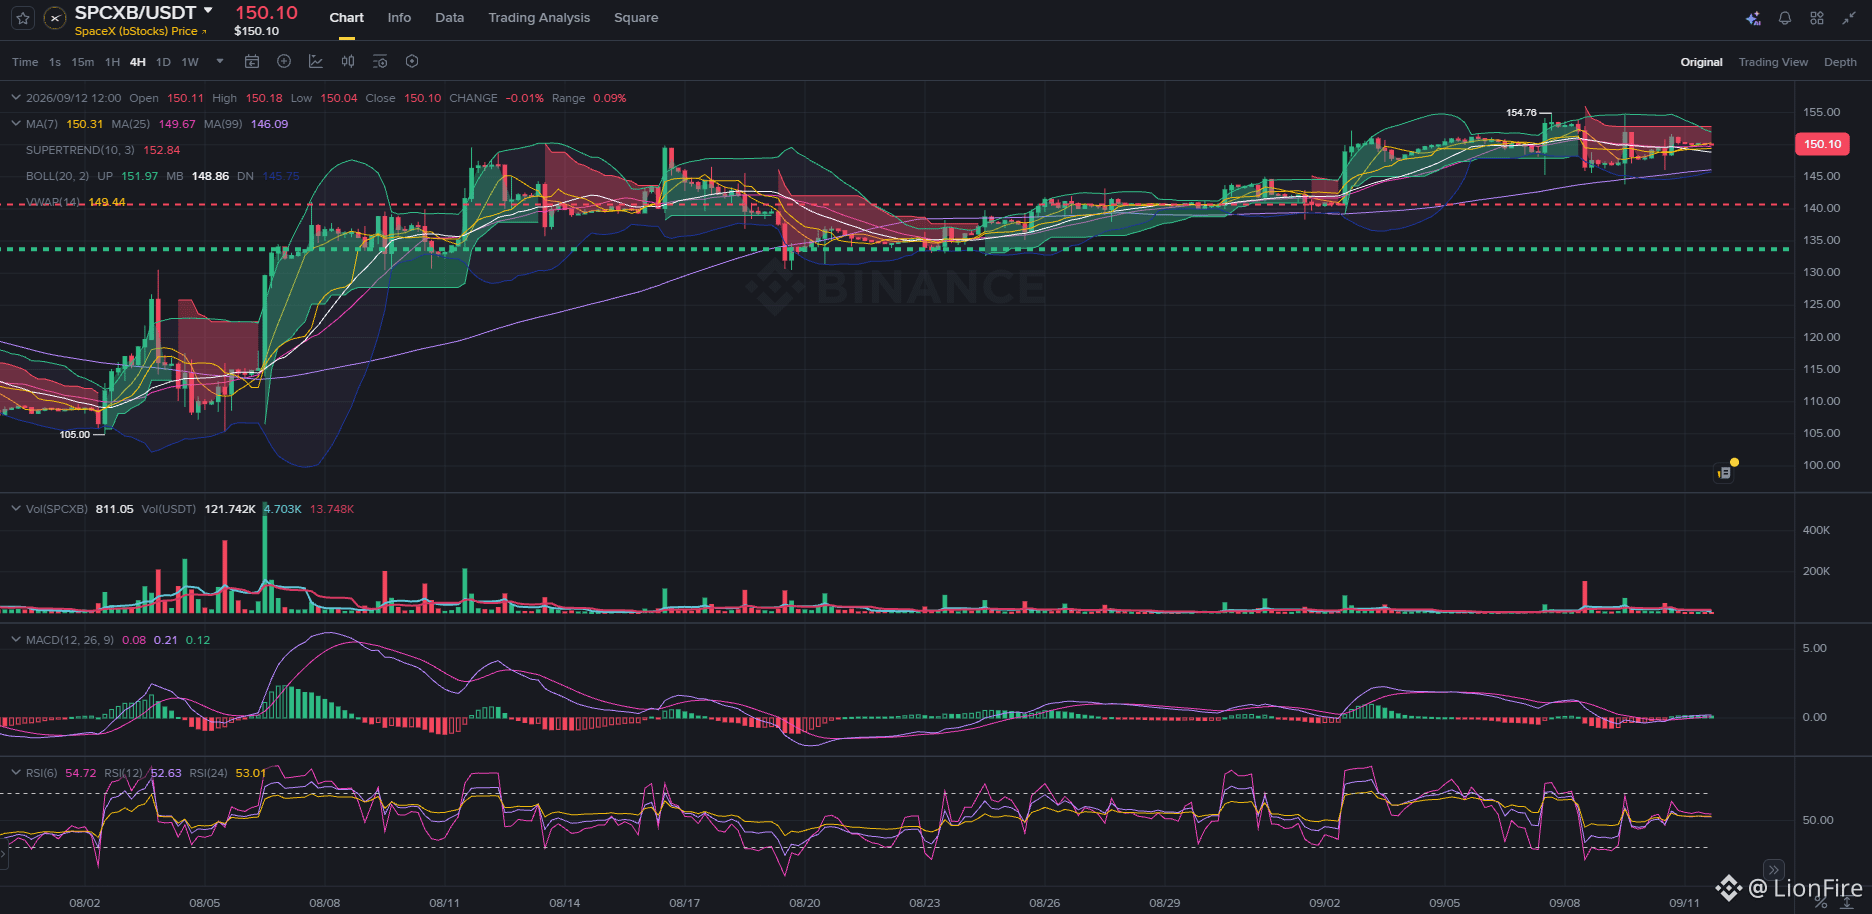
Beyond the consolidation of $SPCXB around $150.10, the company’s true value isn’t decoded in moving averages—it’s found in the launch ramp and the sea. Watching a Starship test craft complete its operating cycle and be recovered to become a historic museum piece confirms a paradigm shift: the absolute collapse of the traditional aerospace model.
🏗️ 1. The collapse of the marginal cost per kilogram:
💥 Depreciation vs. discard: The legacy industry operated under cost-plus contracts, destroying entire rockets on each mission. Radical reusability allows Capex to be spread across dozens of flights.
📉 Breaking barriers: If Falcon 9 drove launch costs down to ~$1,500/kg, Starship’s maturation points to shattering the $100/kg threshold. No government or private competitor can match that cost asymmetry.
📡 2. Starlink’s highway and recurring flow:
🛰️ Massive deployment: Starlink v2 viability and Direct-to-Cell services depend critically on Starship’s volumetric capacity and heavy payload.
💰 Software margin: Each milestone in reentry and recovery shortens timelines to saturate commercial satellite orbit, accelerating a globally recurring subscription revenue stream with software margins.
🏛️ 3. The rationale for a valuation nearing $2T:
🏰 Logistic monopoly: SpaceX isn’t valued as a mere contractor, but as the indispensable logistics infrastructure for NASA (Artemis), the Department of Defense, and global telecommunications.
🔒 Irreversible moat: Replicating Starship’s industrial infrastructure, metallurgy, and cadence would take any rival at least a decade and hundreds of billions in investment.
#SpaceX #Starship #Aerospace
🚀 BEYOND THE CHART: Why Starship milestones fortify SpaceX’s economic moat 🛰️💎
Beyond the consolidation of $SPCXB around $150.10, the company’s true value isn’t decoded in moving averages—it’s found in the launch ramp and the sea. Watching a Starship test craft complete its operating cycle and be recovered to become a historic museum piece confirms a paradigm shift: the absolute collapse of the traditional aerospace model.
🏗️ 1. The collapse of the marginal cost per kilogram:
💥 Depreciation vs. discard: The legacy industry operated under cost-plus contracts, destroying entire rockets on each mission. Radical reusability allows Capex to be spread across dozens of flights.
📉 Breaking barriers: If Falcon 9 drove launch costs down to ~$1,500/kg, Starship’s maturation points to shattering the $100/kg threshold. No government or private competitor can match that cost asymmetry.
📡 2. Starlink’s highway and recurring flow:
🛰️ Massive deployment: Starlink v2 viability and Direct-to-Cell services depend critically on Starship’s volumetric capacity and heavy payload.
💰 Software margin: Each milestone in reentry and recovery shortens timelines to saturate commercial satellite orbit, accelerating a globally recurring subscription revenue stream with software margins.
🏛️ 3. The rationale for a valuation nearing $2T:
🏰 Logistic monopoly: SpaceX isn’t valued as a mere contractor, but as the indispensable logistics infrastructure for NASA (Artemis), the Department of Defense, and global telecommunications.
🔒 Irreversible moat: Replicating Starship’s industrial infrastructure, metallurgy, and cadence would take any rival at least a decade and hundreds of billions in investment.
🚀 BEYOND THE CHART: Why Starship milestones fortify SpaceX’s economic moat 🛰️💎
Beyond the consolidation of $SPCXB around $150.10, the company’s true value isn’t decoded in moving averages—it’s found in the launch ramp and the sea. Watching a Starship test craft complete its operating cycle and be recovered to become a historic museum piece confirms a paradigm shift: the absolute collapse of the traditional aerospace model.
🏗️ 1. The collapse of the marginal cost per kilogram:
💥 Depreciation vs. discard: The legacy industry operated under cost-plus contracts, destroying entire rockets on each mission. Radical reusability allows Capex to be spread across dozens of flights.
📉 Breaking barriers: If Falcon 9 drove launch costs down to ~$1,500/kg, Starship’s maturation points to shattering the $100/kg threshold. No government or private competitor can match that cost asymmetry.
📡 2. Starlink’s highway and recurring flow:
🛰️ Massive deployment: Starlink v2 viability and Direct-to-Cell services depend critically on Starship’s volumetric capacity and heavy payload.
💰 Software margin: Each milestone in reentry and recovery shortens timelines to saturate commercial satellite orbit, accelerating a globally recurring subscription revenue stream with software margins.
🏛️ 3. The rationale for a valuation nearing $2T:
🏰 Logistic monopoly: SpaceX isn’t valued as a mere contractor, but as the indispensable logistics infrastructure for NASA (Artemis), the Department of Defense, and global telecommunications.
🔒 Irreversible moat: Replicating Starship’s industrial infrastructure, metallurgy, and cadence would take any rival at least a decade and hundreds of billions in investment.

455
·
--
Bearish
#bnb #solana #xrp
⚖️ BNB vs. SOL vs. XRP: Three opposing technical reads after digesting volatility 📊🔍
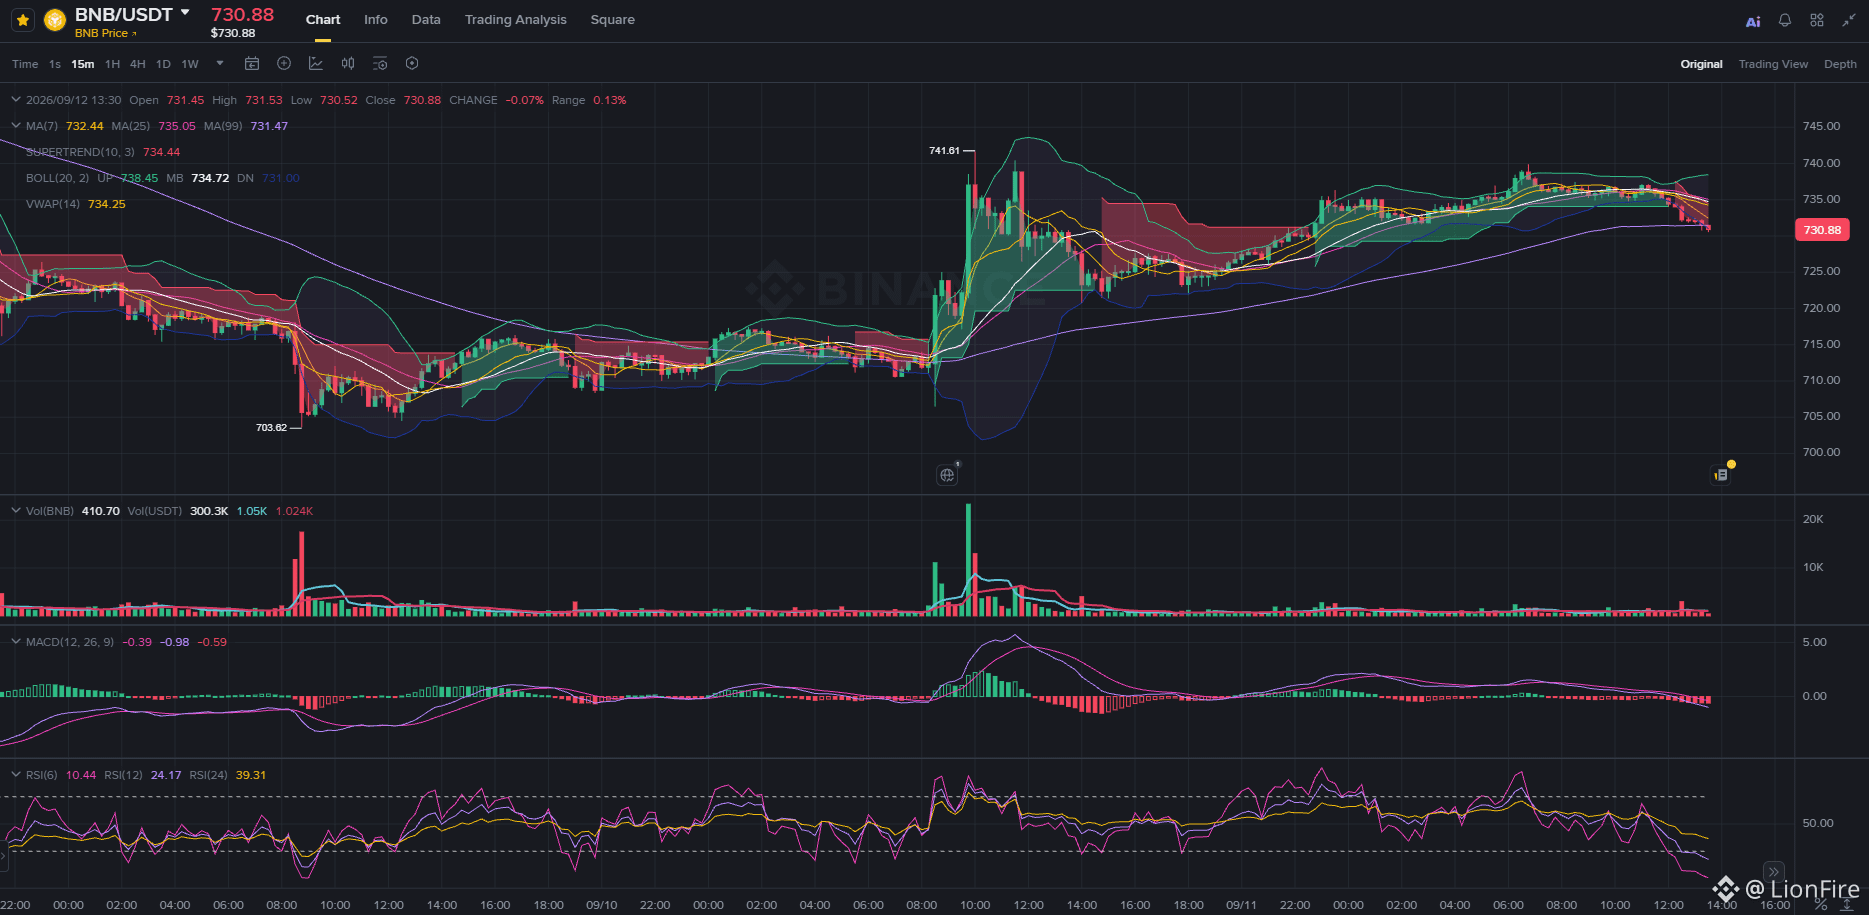
While the broader crypto market absorbs the weekend lull, the microstructure across 15-minute frames (15m) shows a clear tactical divergence among three of the leading altcoins:
🔍 1. BNB ($BNB): Intraday drop with extreme oversold conditions
🔻 Short-term bearish pressure: Unlike SOL and XRP, BNB failed to hold its upper range. It lost the Supertrend support ($734.44) and slipped from $741 down to touch the lower Bollinger band at $730.98.
⚡ Technical rebound alert: The RSI(6) collapsed to around 10.44—an unusually low level. This oversold reading reflects intraday capitulation from selling exhaustion, opening the door to a mean reversion toward the VWAP ($734.25).
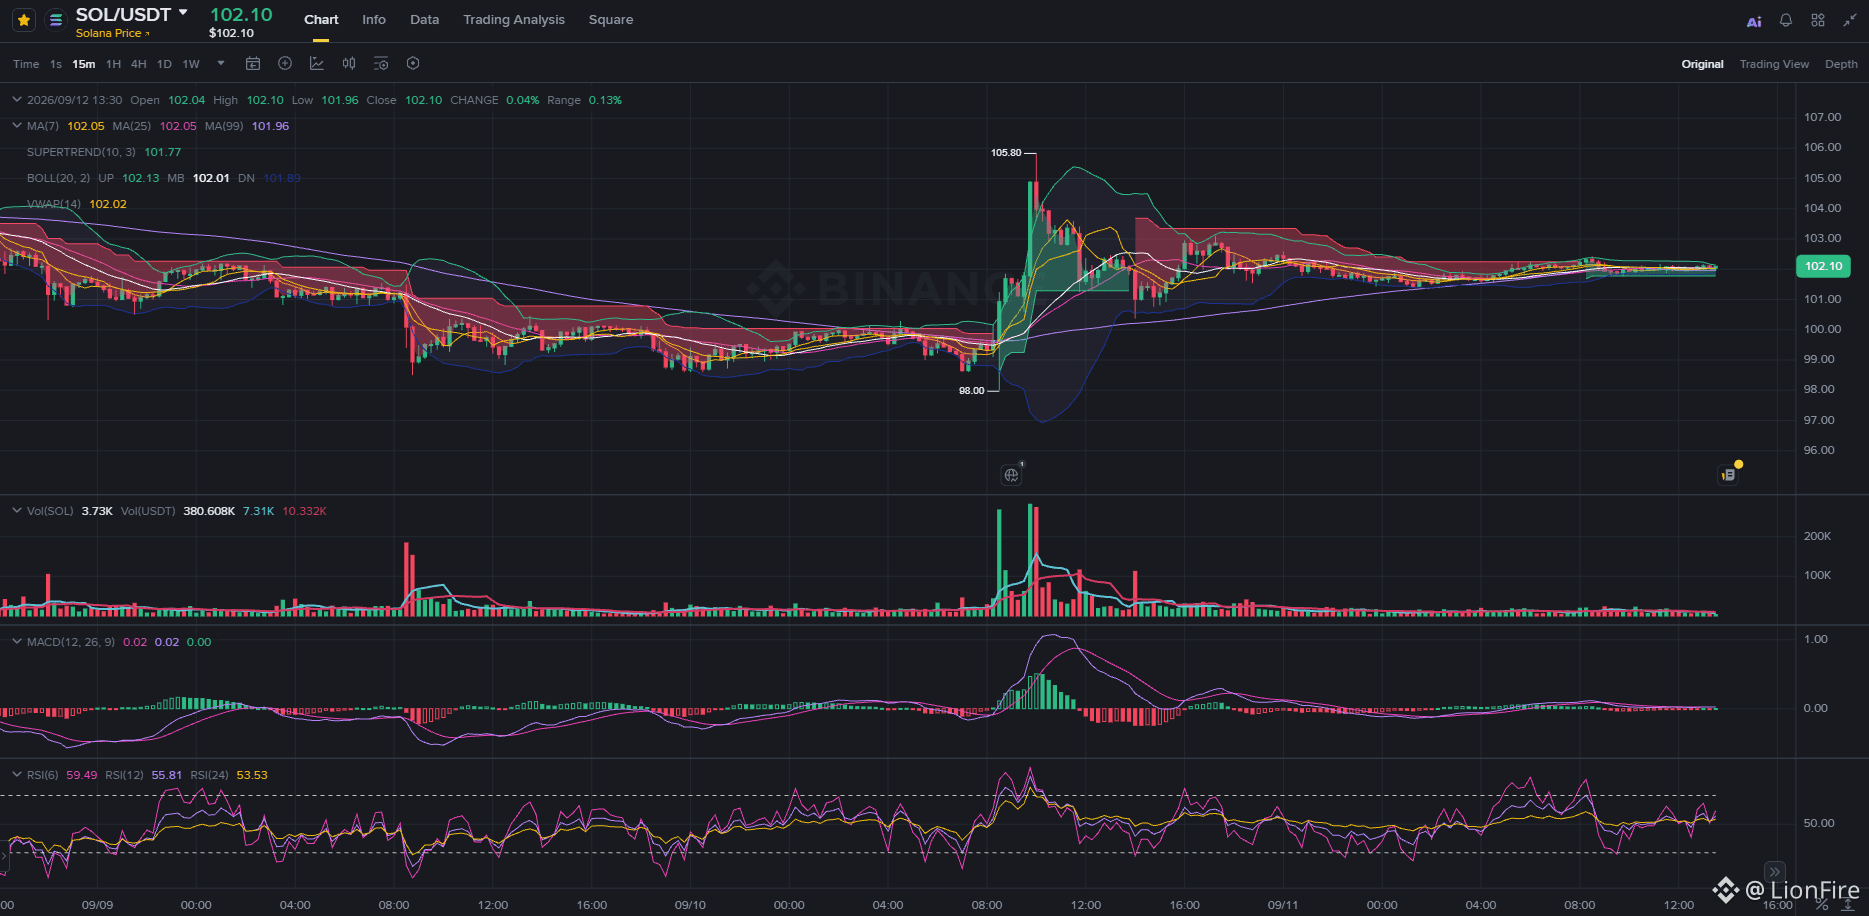
☀️ 2. Solana ($SOL): The stronghold of relative strength
🛡️ Constructive structure: It shows the strongest chart among the trio. It successfully defends the VWAP ($102.02), the MA7 ($102.05), and the MA99 ($101.98), staying above the Supertrend ($101.77).
🗜️ Compression before expansion: With a healthy RSI at 59.49, the tight Bollinger compression hints at a clean breakout if volume returns as price crosses $102.50.
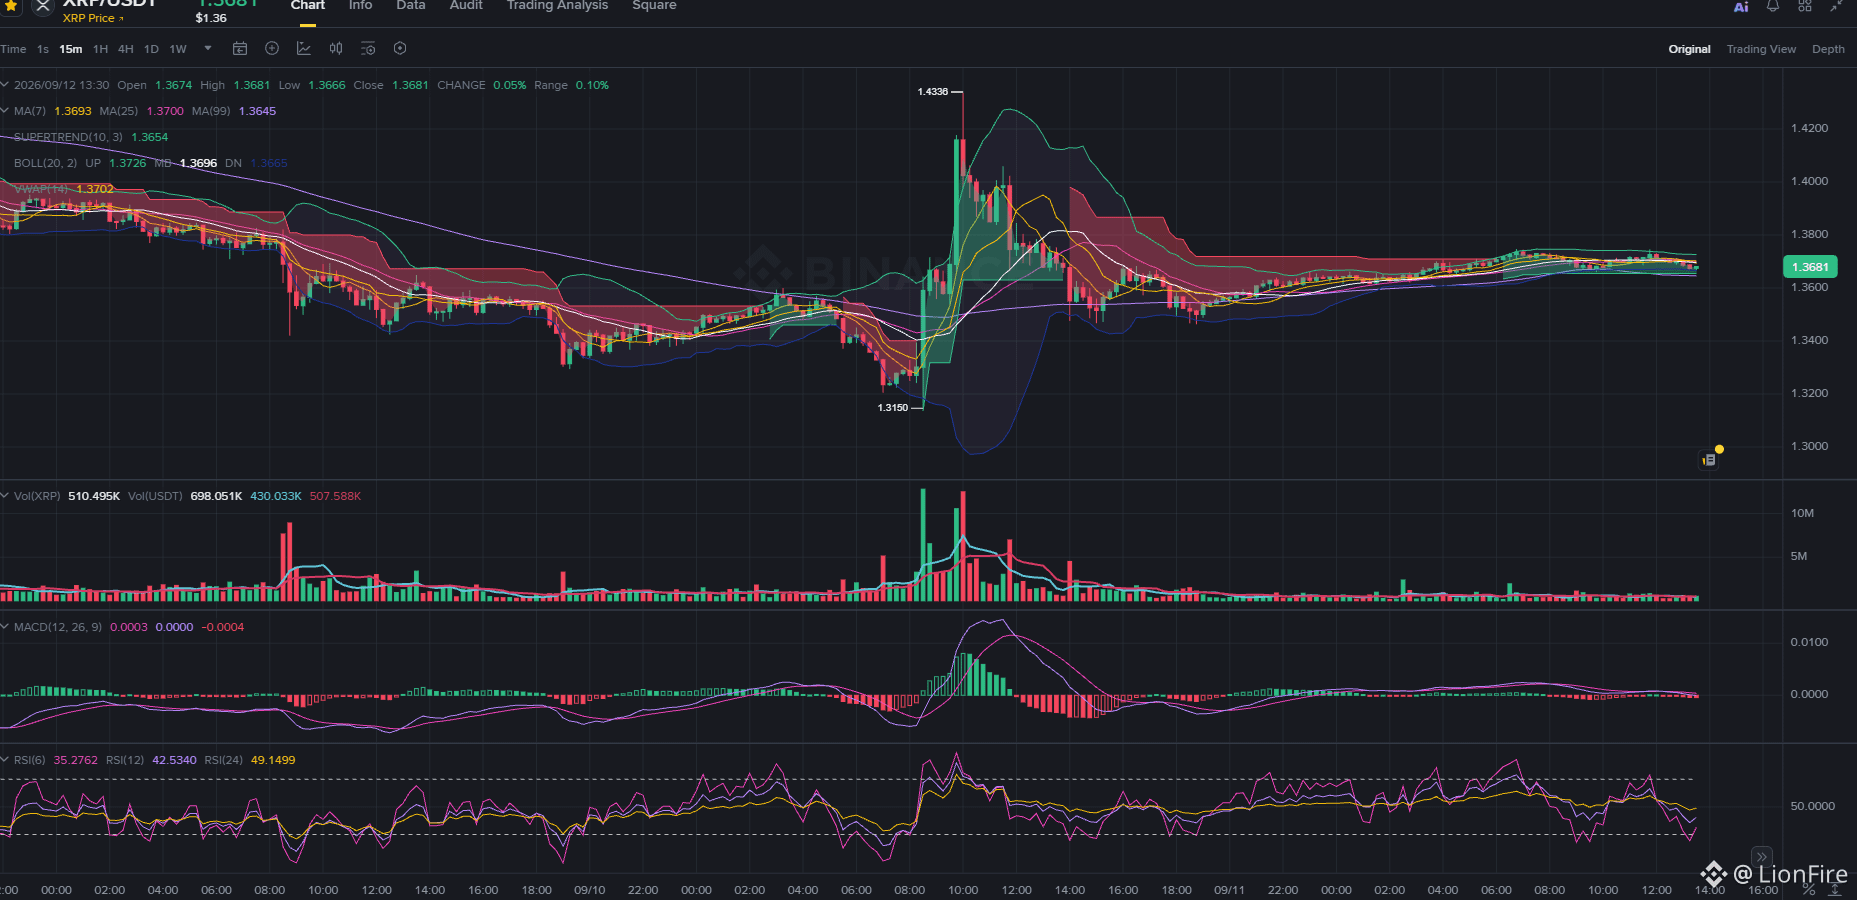
💧 3. XRP ($XRP): Absolute paralysis and a volatility purge
🛑 Flatline: After the failed whip toward $1.4330, price gave back the advance and froze at $1.3681.
⚖️ Fragile balance: It holds the MA99 ($1.3645) and the Supertrend ($1.3654), but it lacks its own catalyst; its RSI(6) at 35.27 confirms temporary buyer indifference.
💡 For fast scalping of a bounce, BNB offers the most attractive asymmetry due to extreme oversold conditions; for structural continuation, SOL continues to set the resilience benchmark. Manage risk and confirm before entering! 🧠⚡
#bnb #solana #xrp
⚖️ BNB vs. SOL vs. XRP: Three opposing technical reads after digesting volatility 📊🔍
While the broader crypto market absorbs the weekend lull, the microstructure across 15-minute frames (15m) shows a clear tactical divergence among three of the leading altcoins:
🔍 1. BNB ($BNB): Intraday drop with extreme oversold conditions
🔻 Short-term bearish pressure: Unlike SOL and XRP, BNB failed to hold its upper range. It lost the Supertrend support ($734.44) and slipped from $741 down to touch the lower Bollinger band at $730.98.
⚡ Technical rebound alert: The RSI(6) collapsed to around 10.44—an unusually low level. This oversold reading reflects intraday capitulation from selling exhaustion, opening the door to a mean reversion toward the VWAP ($734.25).
☀️ 2. Solana ($SOL): The stronghold of relative strength
🛡️ Constructive structure: It shows the strongest chart among the trio. It successfully defends the VWAP ($102.02), the MA7 ($102.05), and the MA99 ($101.98), staying above the Supertrend ($101.77).
🗜️ Compression before expansion: With a healthy RSI at 59.49, the tight Bollinger compression hints at a clean breakout if volume returns as price crosses $102.50.
💧 3. XRP ($XRP): Absolute paralysis and a volatility purge
🛑 Flatline: After the failed whip toward $1.4330, price gave back the advance and froze at $1.3681.
⚖️ Fragile balance: It holds the MA99 ($1.3645) and the Supertrend ($1.3654), but it lacks its own catalyst; its RSI(6) at 35.27 confirms temporary buyer indifference.
💡 For fast scalping of a bounce, BNB offers the most attractive asymmetry due to extreme oversold conditions; for structural continuation, SOL continues to set the resilience benchmark. Manage risk and confirm before entering! 🧠⚡
⚖️ BNB vs. SOL vs. XRP: Three opposing technical reads after digesting volatility 📊🔍
While the broader crypto market absorbs the weekend lull, the microstructure across 15-minute frames (15m) shows a clear tactical divergence among three of the leading altcoins:
🔍 1. BNB ($BNB): Intraday drop with extreme oversold conditions
🔻 Short-term bearish pressure: Unlike SOL and XRP, BNB failed to hold its upper range. It lost the Supertrend support ($734.44) and slipped from $741 down to touch the lower Bollinger band at $730.98.
⚡ Technical rebound alert: The RSI(6) collapsed to around 10.44—an unusually low level. This oversold reading reflects intraday capitulation from selling exhaustion, opening the door to a mean reversion toward the VWAP ($734.25).
☀️ 2. Solana ($SOL): The stronghold of relative strength
🛡️ Constructive structure: It shows the strongest chart among the trio. It successfully defends the VWAP ($102.02), the MA7 ($102.05), and the MA99 ($101.98), staying above the Supertrend ($101.77).
🗜️ Compression before expansion: With a healthy RSI at 59.49, the tight Bollinger compression hints at a clean breakout if volume returns as price crosses $102.50.
💧 3. XRP ($XRP): Absolute paralysis and a volatility purge
🛑 Flatline: After the failed whip toward $1.4330, price gave back the advance and froze at $1.3681.
⚖️ Fragile balance: It holds the MA99 ($1.3645) and the Supertrend ($1.3654), but it lacks its own catalyst; its RSI(6) at 35.27 confirms temporary buyer indifference.
💡 For fast scalping of a bounce, BNB offers the most attractive asymmetry due to extreme oversold conditions; for structural continuation, SOL continues to set the resilience benchmark. Manage risk and confirm before entering! 🧠⚡
192
·
--
Bullish
#BTC #MarketAnalysis #FOMO
⚡ THE PREF-WEEKEND WHIPLASH TO THE VALLE ($77.2k): What Bitcoin’s silence says after the storm 📊🧘
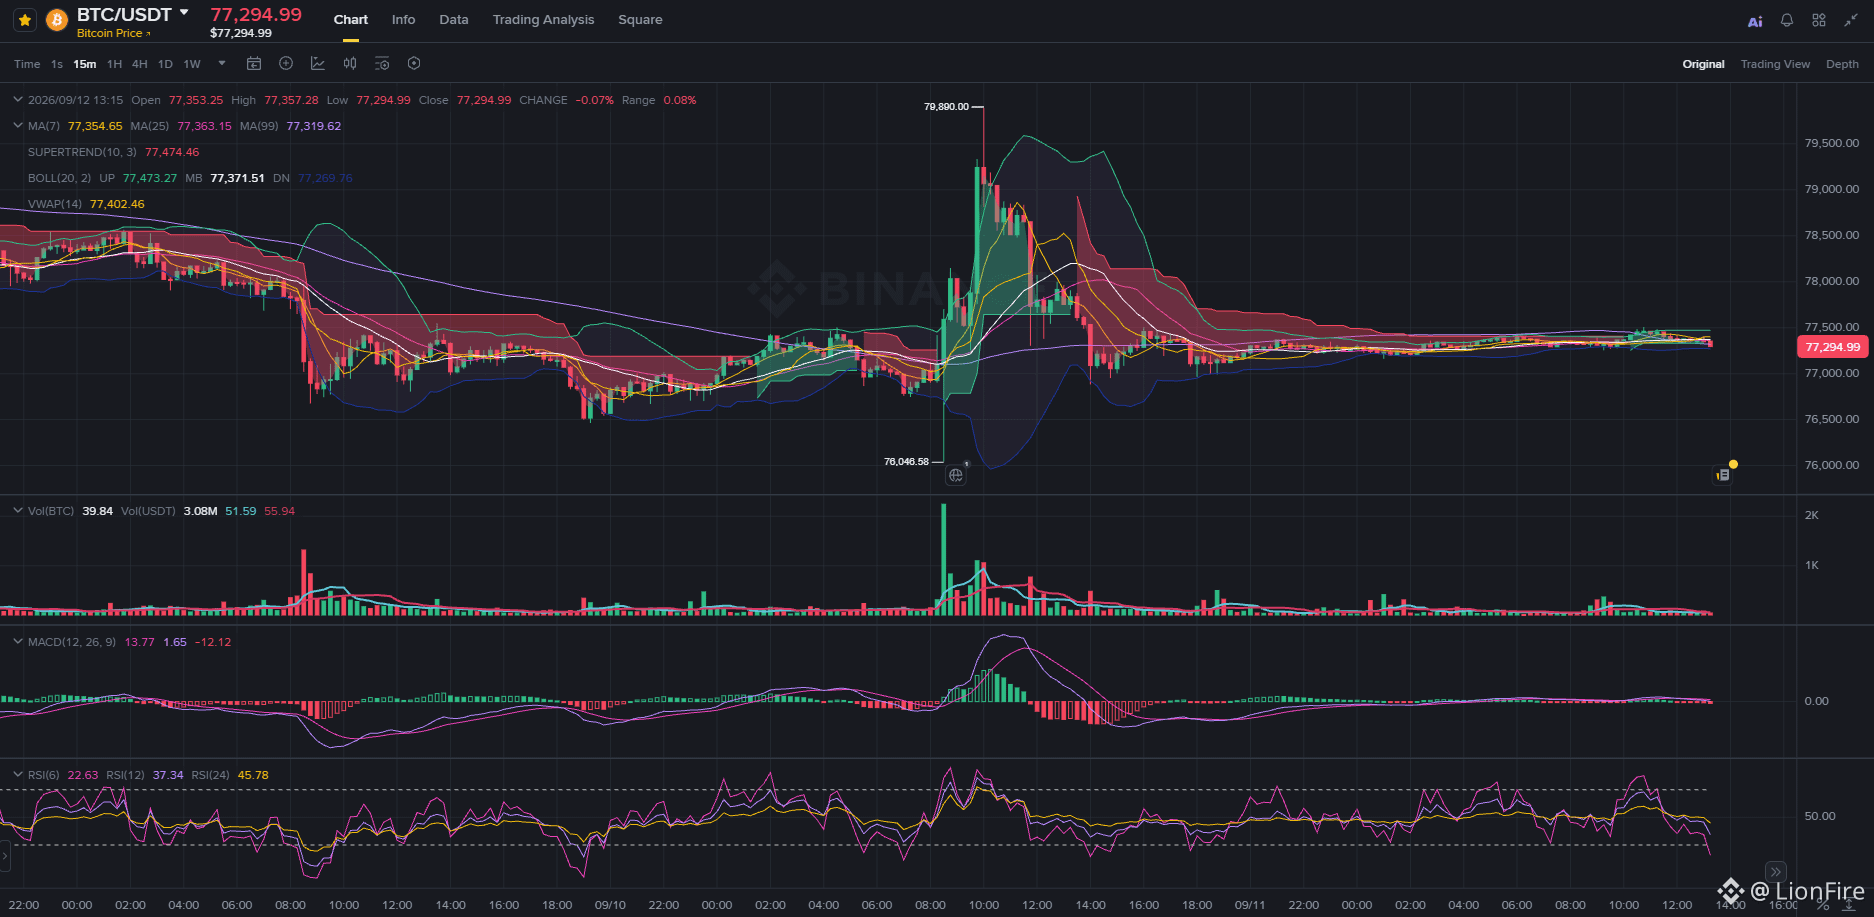
The transition between Friday’s session and this Saturday’s perfectly captures the mechanics of liquidity in crypto. Yesterday we saw a wild volatility session with liquidity hunts at both extremes: first a bearish purge down to $76,046.50, immediately answered by an aggressive short squeeze up to $79,590.00—only for all the gains to be given back afterward. Today, the market has gone from tachycardia to near-millimeter paralysis.
📉 1. Technical snapshot on 15m: Extreme compression
🗜️ Bollinger Band squeeze: Volatility collapsed completely. The band width shrank to a tight channel of just about $200 (Upper Band: $77,473 | Lower Band: $77,269).
🛑 Moving averages and VWAP convergence: MA7 ($77,354), MA25 ($77,383), and MA99 ($77,319) fused into a single point, keeping price contained under the VWAP ($77,402) and the Supertrend resistance ($77,474).
🏜️ Frozen volume: After recording peaks in taker volume (Taker Volume) of over 24k BTC during yesterday’s shock, today the 15m candles barely move ~39.8 BTC, leaving the MACD and RSI flat on their midlines.
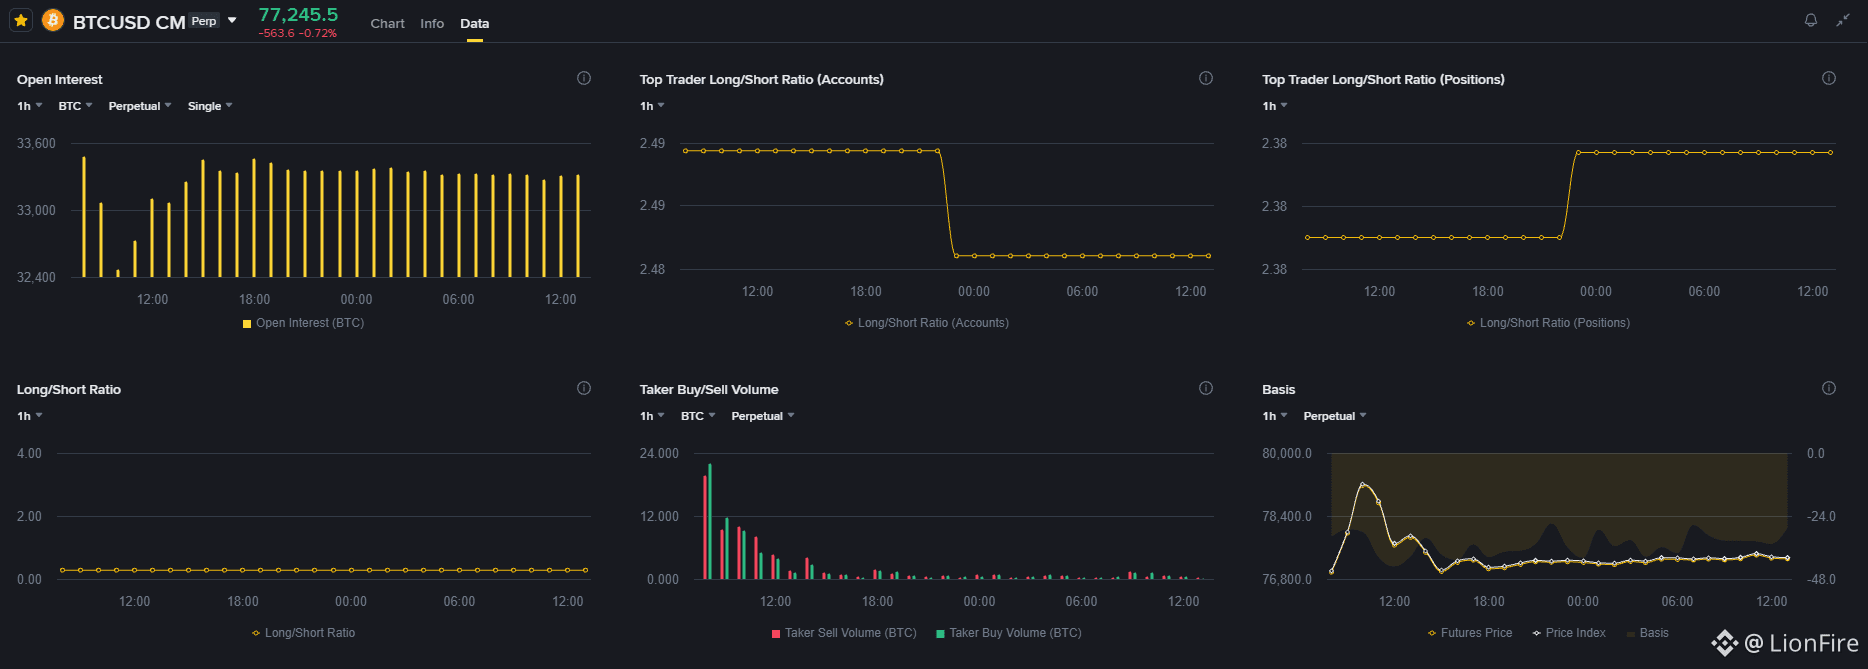
🔍 2. Derivatives reading and institutional flow:
🐋 Positioning by strong hands: The Long/Short ratio among Top Traders surged up to 2.38 points. The accounts with the highest volume used Friday’s whiplash to absorb sell orders and keep their buy-side bias intact during today’s sluggishness.
🔒 Open Interest stabilized: Open interest settled around 33.3k BTC, confirming that weak leverage has already been purged and there’s no pressure from forced liquidations within this range.
🎯 Looking at static charts after an explosive day isn’t a sign of weakness—it’s a sign of potential energy accumulation. Extreme compression is usually the spring before a new directional expansion:
#BTC #MarketAnalysis #FOMO
⚡ THE PREF-WEEKEND WHIPLASH TO THE VALLE ($77.2k): What Bitcoin’s silence says after the storm 📊🧘
The transition between Friday’s session and this Saturday’s perfectly captures the mechanics of liquidity in crypto. Yesterday we saw a wild volatility session with liquidity hunts at both extremes: first a bearish purge down to $76,046.50, immediately answered by an aggressive short squeeze up to $79,590.00—only for all the gains to be given back afterward. Today, the market has gone from tachycardia to near-millimeter paralysis.
📉 1. Technical snapshot on 15m: Extreme compression
🗜️ Bollinger Band squeeze: Volatility collapsed completely. The band width shrank to a tight channel of just about $200 (Upper Band: $77,473 | Lower Band: $77,269).
🛑 Moving averages and VWAP convergence: MA7 ($77,354), MA25 ($77,383), and MA99 ($77,319) fused into a single point, keeping price contained under the VWAP ($77,402) and the Supertrend resistance ($77,474).
🏜️ Frozen volume: After recording peaks in taker volume (Taker Volume) of over 24k BTC during yesterday’s shock, today the 15m candles barely move ~39.8 BTC, leaving the MACD and RSI flat on their midlines.
🔍 2. Derivatives reading and institutional flow:
🐋 Positioning by strong hands: The Long/Short ratio among Top Traders surged up to 2.38 points. The accounts with the highest volume used Friday’s whiplash to absorb sell orders and keep their buy-side bias intact during today’s sluggishness.
🔒 Open Interest stabilized: Open interest settled around 33.3k BTC, confirming that weak leverage has already been purged and there’s no pressure from forced liquidations within this range.
🎯 Looking at static charts after an explosive day isn’t a sign of weakness—it’s a sign of potential energy accumulation. Extreme compression is usually the spring before a new directional expansion:
⚡ THE PREF-WEEKEND WHIPLASH TO THE VALLE ($77.2k): What Bitcoin’s silence says after the storm 📊🧘
The transition between Friday’s session and this Saturday’s perfectly captures the mechanics of liquidity in crypto. Yesterday we saw a wild volatility session with liquidity hunts at both extremes: first a bearish purge down to $76,046.50, immediately answered by an aggressive short squeeze up to $79,590.00—only for all the gains to be given back afterward. Today, the market has gone from tachycardia to near-millimeter paralysis.
📉 1. Technical snapshot on 15m: Extreme compression
🗜️ Bollinger Band squeeze: Volatility collapsed completely. The band width shrank to a tight channel of just about $200 (Upper Band: $77,473 | Lower Band: $77,269).
🛑 Moving averages and VWAP convergence: MA7 ($77,354), MA25 ($77,383), and MA99 ($77,319) fused into a single point, keeping price contained under the VWAP ($77,402) and the Supertrend resistance ($77,474).
🏜️ Frozen volume: After recording peaks in taker volume (Taker Volume) of over 24k BTC during yesterday’s shock, today the 15m candles barely move ~39.8 BTC, leaving the MACD and RSI flat on their midlines.
🔍 2. Derivatives reading and institutional flow:
🐋 Positioning by strong hands: The Long/Short ratio among Top Traders surged up to 2.38 points. The accounts with the highest volume used Friday’s whiplash to absorb sell orders and keep their buy-side bias intact during today’s sluggishness.
🔒 Open Interest stabilized: Open interest settled around 33.3k BTC, confirming that weak leverage has already been purged and there’s no pressure from forced liquidations within this range.
🎯 Looking at static charts after an explosive day isn’t a sign of weakness—it’s a sign of potential energy accumulation. Extreme compression is usually the spring before a new directional expansion:
672
·
--
Bullish
#BTC #zec #technicalanalyst
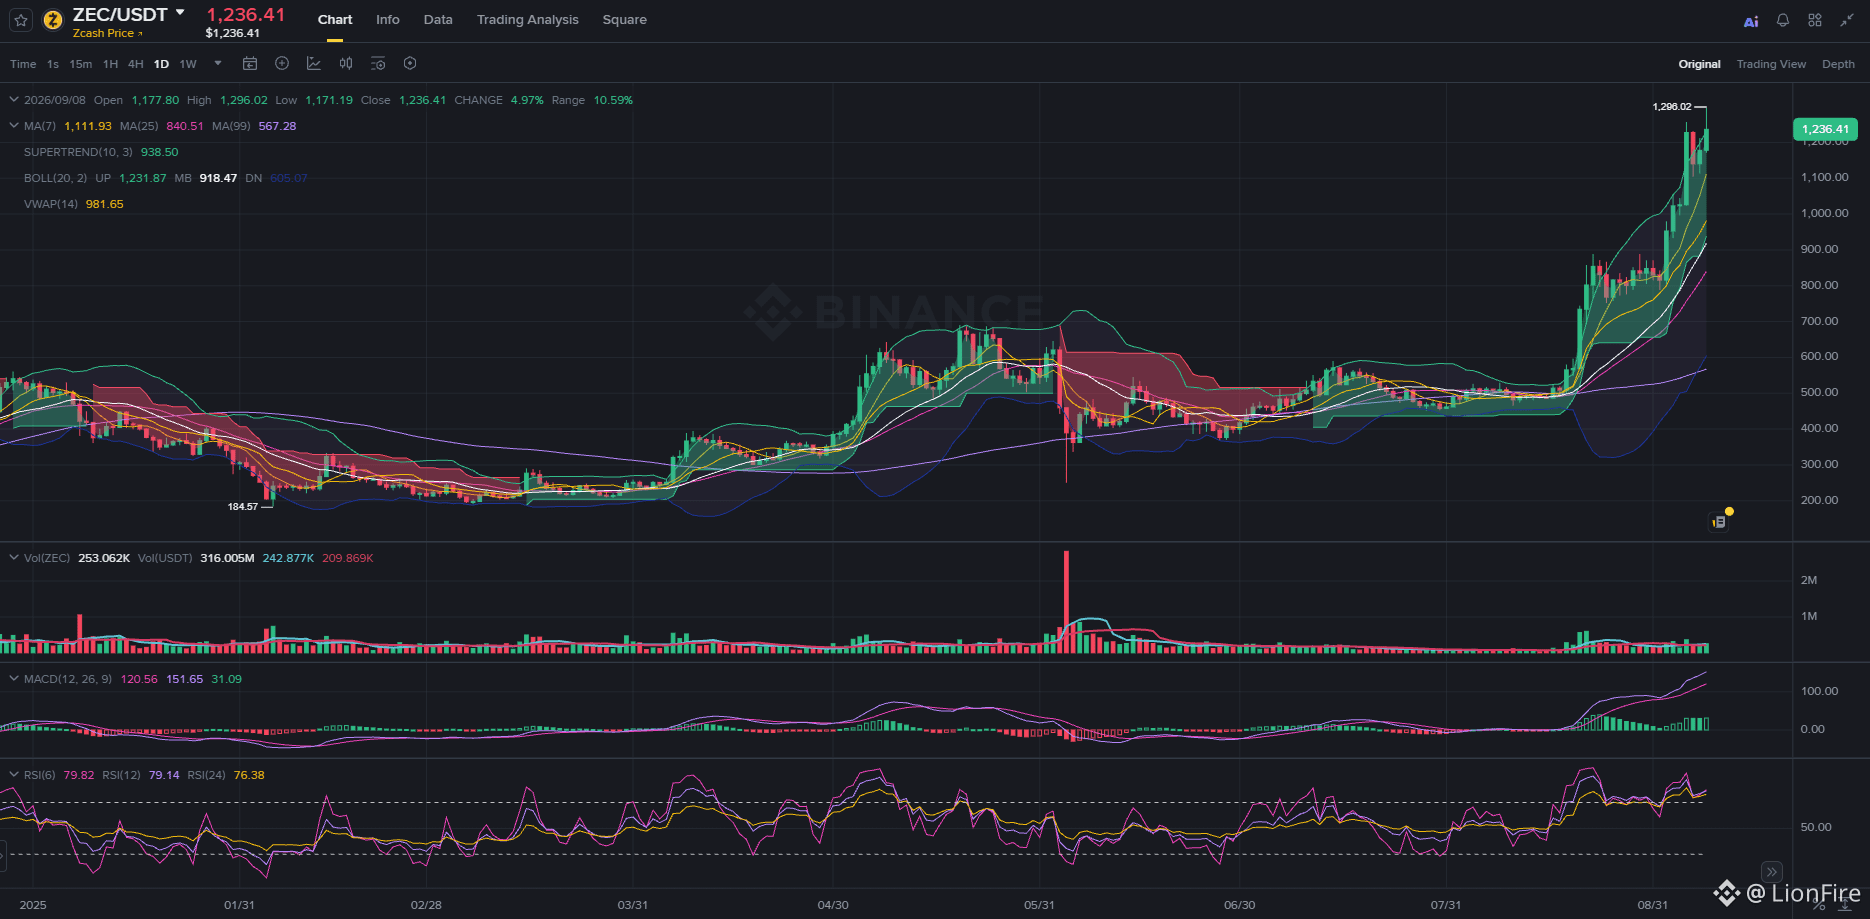
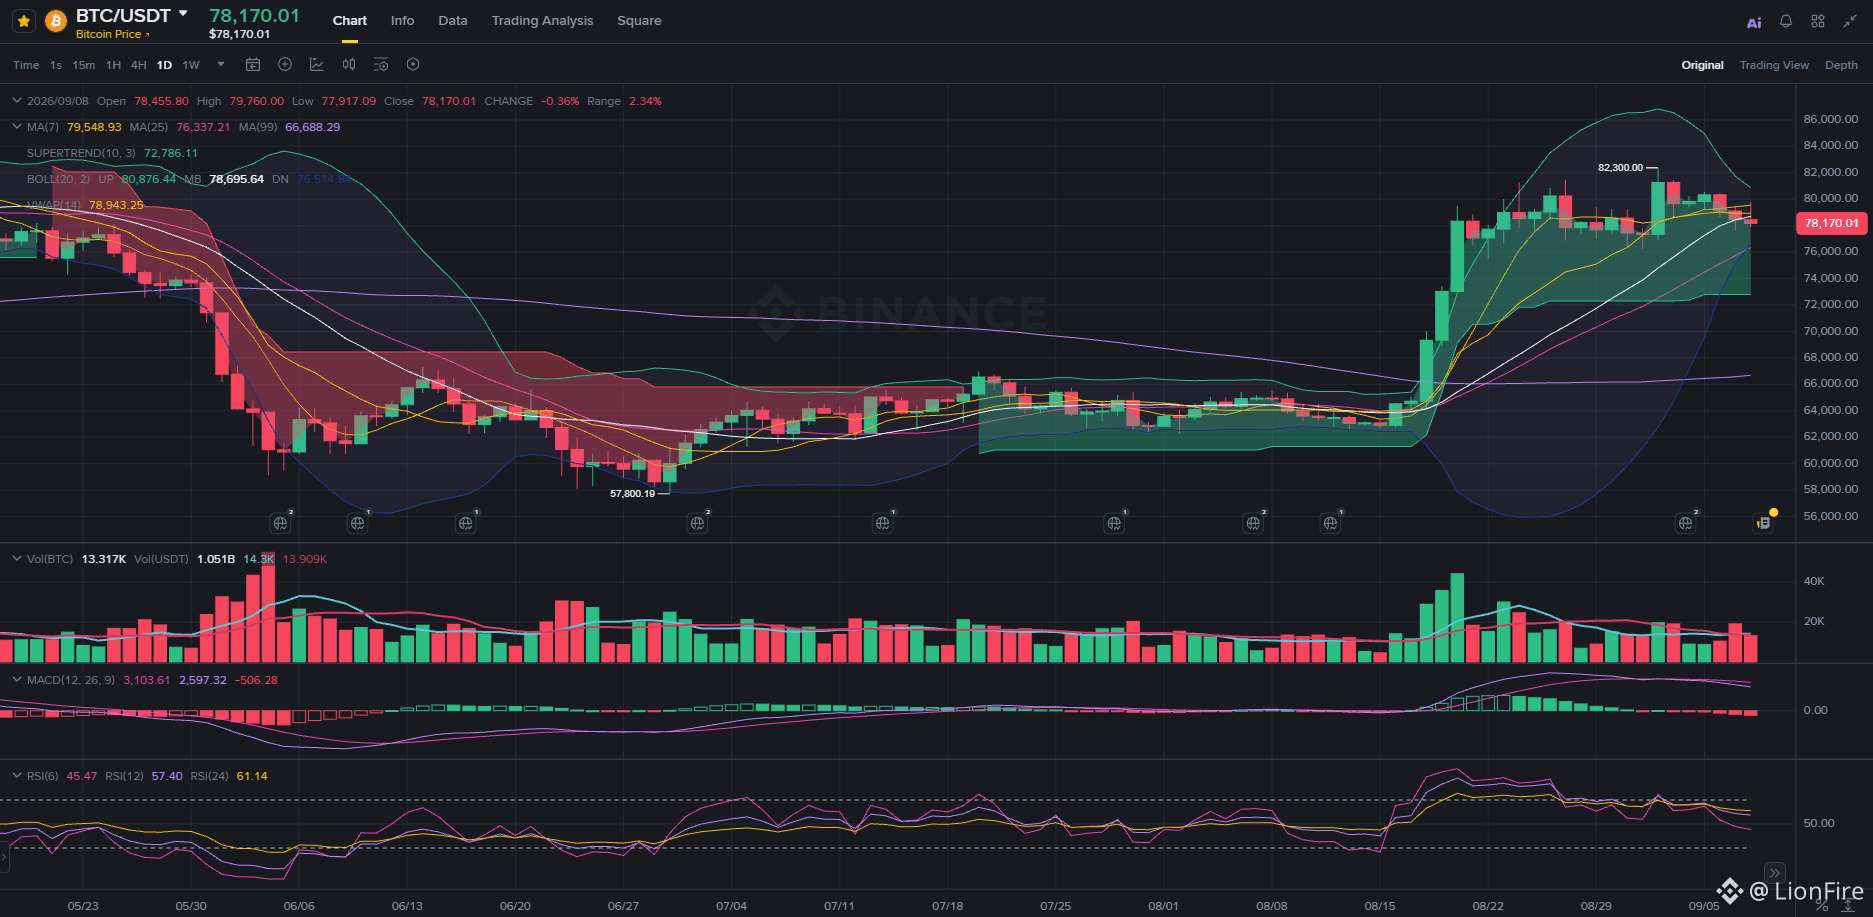
⚔️ RADICAL DIVERGENCE IN DAILY (1D): Bitcoin’s digestion ($78.1k) versus Zcash’s verticality ($1,236) 📊⚡
The crypto market shows a structural disconnect rarely seen. While $BTC ($78,170.01) succumbs to short-term exhaustion and gives ground, $ZEC ($1,236.41) breaks any correlation and accelerates in a parabolic rally after topping out near $1,295.02.
📉 1. Bitcoin ($BTC): Seasonal fatigue and liquidity drip
🛑 Loss of traction: The price slips below the MA7 ($79,548.93), confirming the difficulty of holding the $80k range. RSI(6) retreats to 45.47 points and MACD turns lower with a red histogram (-506.28).
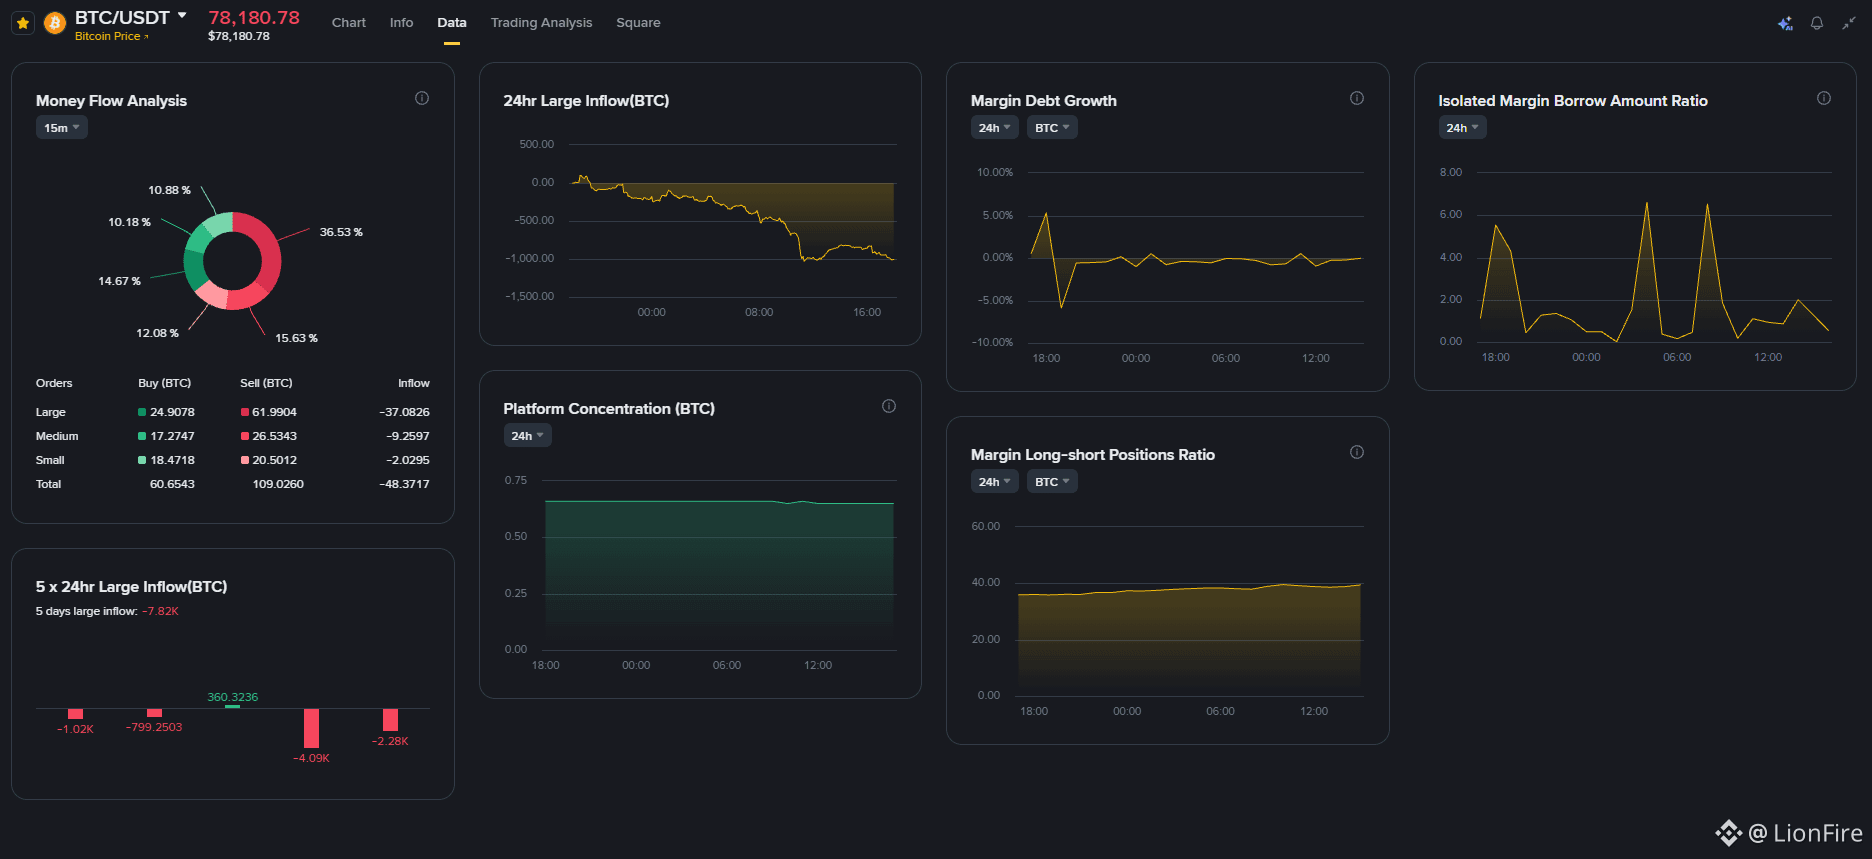
🩸 Net capital outflow: The flow data confirms institutional de-compression: the 24hr Large Inflow hits the day’s lows (-1,000 BTC) and the net balance of strong hands over 5 days sinks to -7.82K BTC.
🛡️ Key supports: The price is seeking stability above the MA25 ($76,337.21); if it breaks, the next stop is the Supertrend base ($72,786.11).
🚀 2. Zcash ($ZEC): Supply shock and conviction-driven buying
🟢 Unrelenting momentum: It trades detached from its MA7 ($1,111.93) and shreds the upper Bollinger band ($1,231.87). MACD expands its histogram (+31.09) and RSI(6) hovers near extreme overbought levels at 78.83 points.
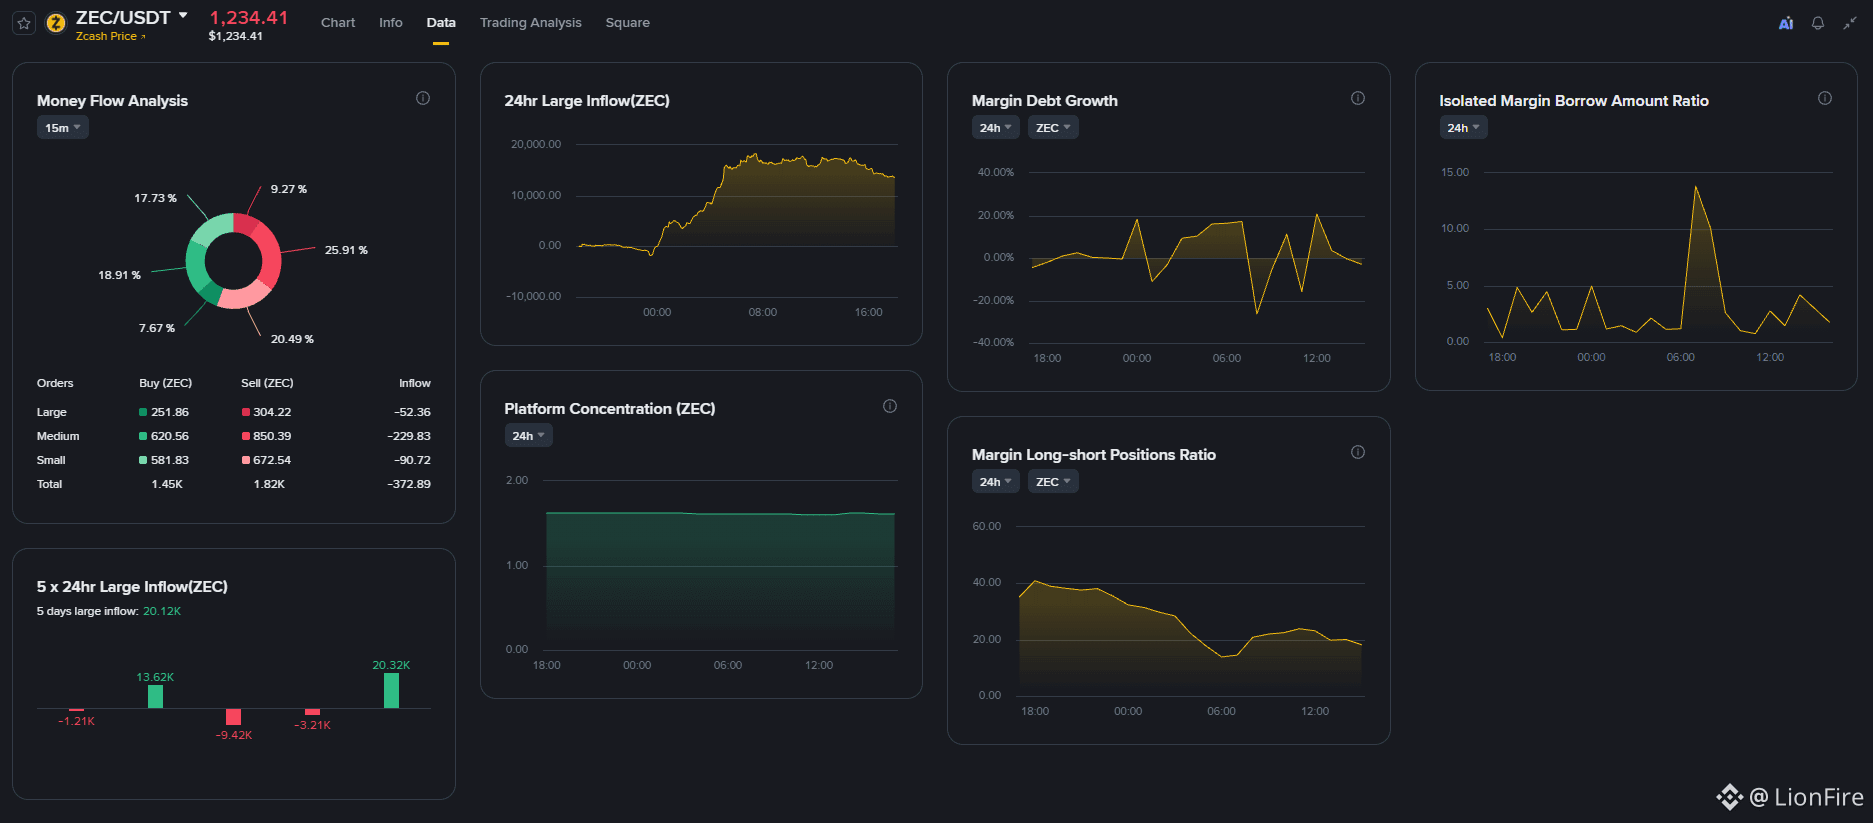
🐋 Massive injection (+20.12K ZEC): Unlike BTC, ZEC’s flow chart shows aggressive accumulation: the net balance of large orders over 5 days stands at +20.12K ZEC, absorbing any profit-taking.
🎯 We’re seeing an obvious liquidity rotation: while institutional funds pause or reduce exposure in Bitcoin to weather September seasonality, speculative capital shelters in assets with restricted float and mathematical privacy.
For BTC, the key is to defend the $76k without panic; for ZEC, trade with a trailing stop and don’t succumb to FOMO in full euphoria. Keep a cool head and manage risk! 🧠⚡
#BTC #zec #technicalanalyst
⚔️ RADICAL DIVERGENCE IN DAILY (1D): Bitcoin’s digestion ($78.1k) versus Zcash’s verticality ($1,236) 📊⚡
The crypto market shows a structural disconnect rarely seen. While $BTC ($78,170.01) succumbs to short-term exhaustion and gives ground, $ZEC ($1,236.41) breaks any correlation and accelerates in a parabolic rally after topping out near $1,295.02.
📉 1. Bitcoin ($BTC): Seasonal fatigue and liquidity drip
🛑 Loss of traction: The price slips below the MA7 ($79,548.93), confirming the difficulty of holding the $80k range. RSI(6) retreats to 45.47 points and MACD turns lower with a red histogram (-506.28).
🩸 Net capital outflow: The flow data confirms institutional de-compression: the 24hr Large Inflow hits the day’s lows (-1,000 BTC) and the net balance of strong hands over 5 days sinks to -7.82K BTC.
🛡️ Key supports: The price is seeking stability above the MA25 ($76,337.21); if it breaks, the next stop is the Supertrend base ($72,786.11).
🚀 2. Zcash ($ZEC): Supply shock and conviction-driven buying
🟢 Unrelenting momentum: It trades detached from its MA7 ($1,111.93) and shreds the upper Bollinger band ($1,231.87). MACD expands its histogram (+31.09) and RSI(6) hovers near extreme overbought levels at 78.83 points.
🐋 Massive injection (+20.12K ZEC): Unlike BTC, ZEC’s flow chart shows aggressive accumulation: the net balance of large orders over 5 days stands at +20.12K ZEC, absorbing any profit-taking.
🎯 We’re seeing an obvious liquidity rotation: while institutional funds pause or reduce exposure in Bitcoin to weather September seasonality, speculative capital shelters in assets with restricted float and mathematical privacy.
For BTC, the key is to defend the $76k without panic; for ZEC, trade with a trailing stop and don’t succumb to FOMO in full euphoria. Keep a cool head and manage risk! 🧠⚡
⚔️ RADICAL DIVERGENCE IN DAILY (1D): Bitcoin’s digestion ($78.1k) versus Zcash’s verticality ($1,236) 📊⚡
The crypto market shows a structural disconnect rarely seen. While $BTC ($78,170.01) succumbs to short-term exhaustion and gives ground, $ZEC ($1,236.41) breaks any correlation and accelerates in a parabolic rally after topping out near $1,295.02.
📉 1. Bitcoin ($BTC): Seasonal fatigue and liquidity drip
🛑 Loss of traction: The price slips below the MA7 ($79,548.93), confirming the difficulty of holding the $80k range. RSI(6) retreats to 45.47 points and MACD turns lower with a red histogram (-506.28).
🩸 Net capital outflow: The flow data confirms institutional de-compression: the 24hr Large Inflow hits the day’s lows (-1,000 BTC) and the net balance of strong hands over 5 days sinks to -7.82K BTC.
🛡️ Key supports: The price is seeking stability above the MA25 ($76,337.21); if it breaks, the next stop is the Supertrend base ($72,786.11).
🚀 2. Zcash ($ZEC): Supply shock and conviction-driven buying
🟢 Unrelenting momentum: It trades detached from its MA7 ($1,111.93) and shreds the upper Bollinger band ($1,231.87). MACD expands its histogram (+31.09) and RSI(6) hovers near extreme overbought levels at 78.83 points.
🐋 Massive injection (+20.12K ZEC): Unlike BTC, ZEC’s flow chart shows aggressive accumulation: the net balance of large orders over 5 days stands at +20.12K ZEC, absorbing any profit-taking.
🎯 We’re seeing an obvious liquidity rotation: while institutional funds pause or reduce exposure in Bitcoin to weather September seasonality, speculative capital shelters in assets with restricted float and mathematical privacy.
For BTC, the key is to defend the $76k without panic; for ZEC, trade with a trailing stop and don’t succumb to FOMO in full euphoria. Keep a cool head and manage risk! 🧠⚡
135
·
--
Bullish
#SpaceX #SPCX #TradingAnalysis
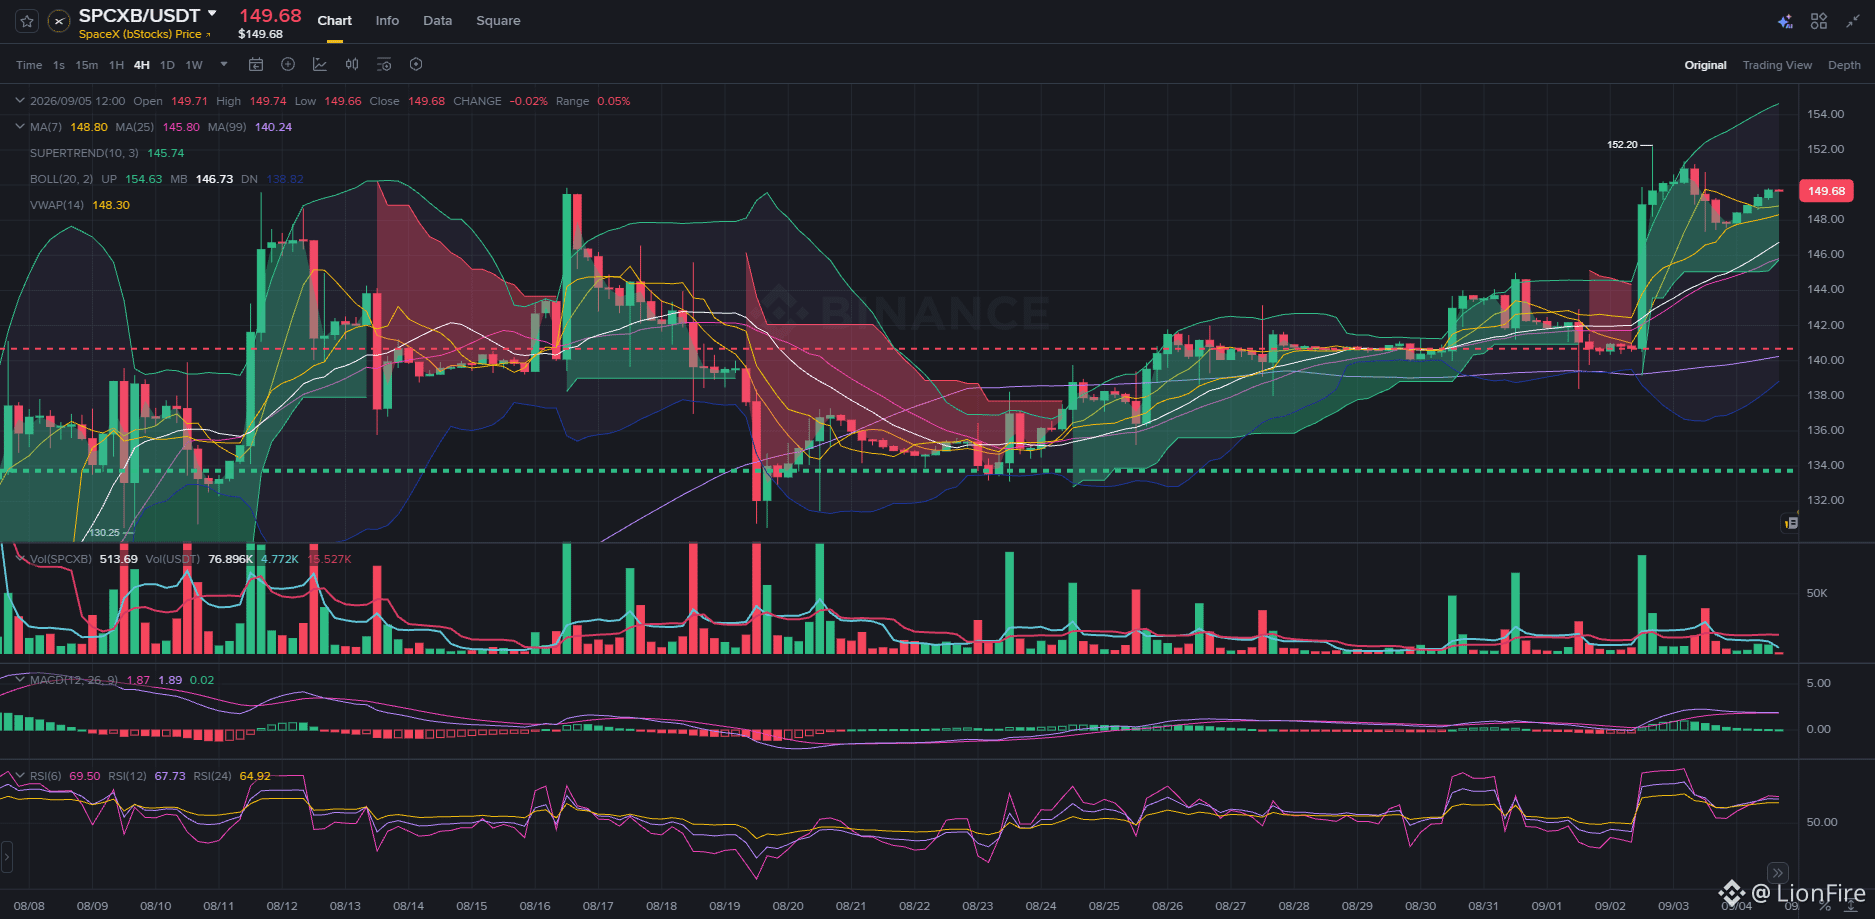
🛰️ NEW STRUCTURAL SUPPORT IN SPACEX📈🎯
After posting a high at $152.20, $SPCXB ($149.68) is entering a healthy consolidation phase over the weekend. On the 4-Hour timeframe (4H), the technical structure has just validated a key polarity transformation: the old late-August resistance has become our new structural support (red dashed line), defining the optimal accumulation and buying zone.
🔴 1. The red line ($141.60 - $142.00): The value trigger
🔄 Textbook S/R Flip: The $141.60 - $142.00 range acted as an unyielding ceiling in late August. After the vertical breakout with volume, this level is now the definitive floor of the current cycle.
🎯 Institutional buy signal: Any pullback to this zone represents a high-probability entry opportunity (swing buy). It offers optimal risk/reward asymmetry, with a clear technical stop loss below the MA99 ($140.24) and the summer base support at $134.00 (green line).
📊 2. Technical confluence on 4H:
🛡️ Immediate dynamic defense: Price is absorbing profit-taking while supported by the MA7 ($148.80) and VWAP ($148.30).
🧱 Intermediate cushion: Below that, the middle Bollinger band ($146.73), MA25 ($145.80), and bullish Supertrend ($145.74) form a buffer ahead of the red line.
⚡ Healthy oscillators: RSI(6) remains at 68.90, cooling from extreme levels without losing momentum, while MACD maintains a positive slope (+1.87).
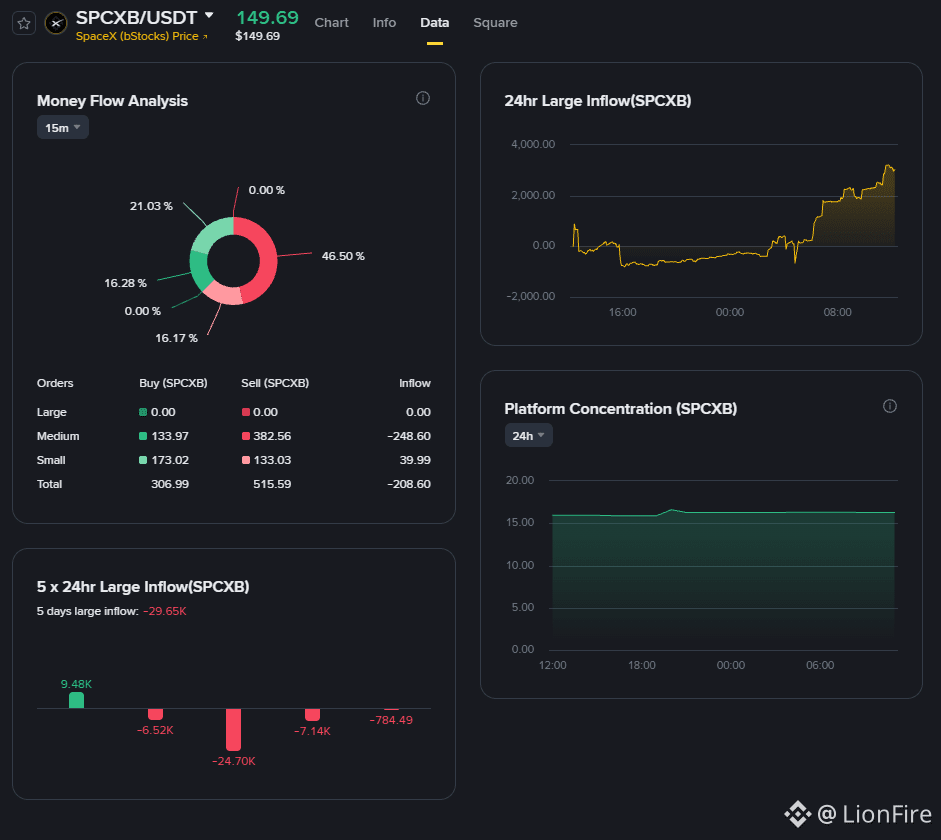
🔍 3. Capital flow:
🐋 Intact bottom accumulation: Despite intraday profit-taking in medium orders (-248.6 SPCXB), the 24hr Large Inflow chart shows a distinctly bullish slope (+2,500 SPCXB), confirming that institutional hands are sustaining their weekly buying.
🔒 Stable concentration: The platform metric remains fixed at 17.50%, with no signs of distribution from large holders.
#SpaceX #SPCX #TradingAnalysis
🛰️ NEW STRUCTURAL SUPPORT IN SPACEX📈🎯
After posting a high at $152.20, $SPCXB ($149.68) is entering a healthy consolidation phase over the weekend. On the 4-Hour timeframe (4H), the technical structure has just validated a key polarity transformation: the old late-August resistance has become our new structural support (red dashed line), defining the optimal accumulation and buying zone.
🔴 1. The red line ($141.60 - $142.00): The value trigger
🔄 Textbook S/R Flip: The $141.60 - $142.00 range acted as an unyielding ceiling in late August. After the vertical breakout with volume, this level is now the definitive floor of the current cycle.
🎯 Institutional buy signal: Any pullback to this zone represents a high-probability entry opportunity (swing buy). It offers optimal risk/reward asymmetry, with a clear technical stop loss below the MA99 ($140.24) and the summer base support at $134.00 (green line).
📊 2. Technical confluence on 4H:
🛡️ Immediate dynamic defense: Price is absorbing profit-taking while supported by the MA7 ($148.80) and VWAP ($148.30).
🧱 Intermediate cushion: Below that, the middle Bollinger band ($146.73), MA25 ($145.80), and bullish Supertrend ($145.74) form a buffer ahead of the red line.
⚡ Healthy oscillators: RSI(6) remains at 68.90, cooling from extreme levels without losing momentum, while MACD maintains a positive slope (+1.87).
🔍 3. Capital flow:
🐋 Intact bottom accumulation: Despite intraday profit-taking in medium orders (-248.6 SPCXB), the 24hr Large Inflow chart shows a distinctly bullish slope (+2,500 SPCXB), confirming that institutional hands are sustaining their weekly buying.
🔒 Stable concentration: The platform metric remains fixed at 17.50%, with no signs of distribution from large holders.
🛰️ NEW STRUCTURAL SUPPORT IN SPACEX📈🎯
After posting a high at $152.20, $SPCXB ($149.68) is entering a healthy consolidation phase over the weekend. On the 4-Hour timeframe (4H), the technical structure has just validated a key polarity transformation: the old late-August resistance has become our new structural support (red dashed line), defining the optimal accumulation and buying zone.
🔴 1. The red line ($141.60 - $142.00): The value trigger
🔄 Textbook S/R Flip: The $141.60 - $142.00 range acted as an unyielding ceiling in late August. After the vertical breakout with volume, this level is now the definitive floor of the current cycle.
🎯 Institutional buy signal: Any pullback to this zone represents a high-probability entry opportunity (swing buy). It offers optimal risk/reward asymmetry, with a clear technical stop loss below the MA99 ($140.24) and the summer base support at $134.00 (green line).
📊 2. Technical confluence on 4H:
🛡️ Immediate dynamic defense: Price is absorbing profit-taking while supported by the MA7 ($148.80) and VWAP ($148.30).
🧱 Intermediate cushion: Below that, the middle Bollinger band ($146.73), MA25 ($145.80), and bullish Supertrend ($145.74) form a buffer ahead of the red line.
⚡ Healthy oscillators: RSI(6) remains at 68.90, cooling from extreme levels without losing momentum, while MACD maintains a positive slope (+1.87).
🔍 3. Capital flow:
🐋 Intact bottom accumulation: Despite intraday profit-taking in medium orders (-248.6 SPCXB), the 24hr Large Inflow chart shows a distinctly bullish slope (+2,500 SPCXB), confirming that institutional hands are sustaining their weekly buying.
🔒 Stable concentration: The platform metric remains fixed at 17.50%, with no signs of distribution from large holders.
110
·
--
Bullish
#DASH #PrivacyCoins #altcoins
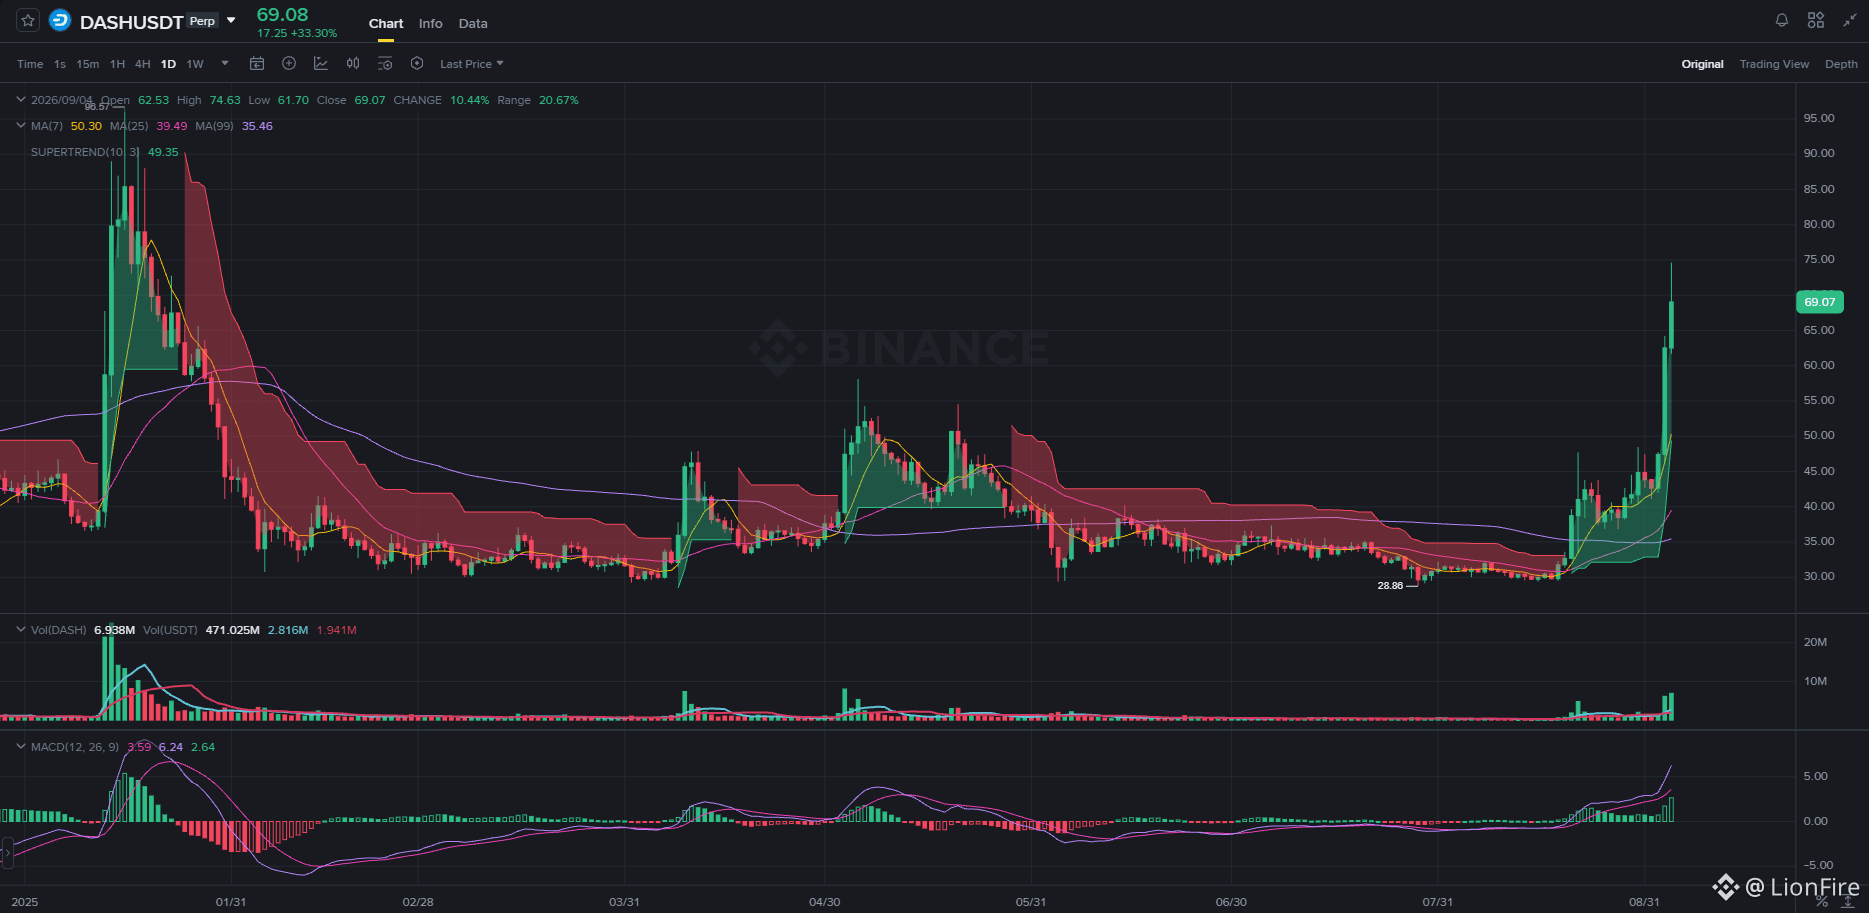
🚀 THE AWAKENING OF DASH (+33% | $69): Anatomy of the project and the mechanics of its violent pumps ⚡📈
While attention was focused on Bitcoin or the resilience of Zcash, $DASH ($69.08) detonated one of its characteristic parabolic explosions: a daily advance above +33%, marking a peak at $74.63 with more than $471M USDT traded (6.93M DASH).
🪙 1. What is Dash and what is its value proposition?
Originally born as a Bitcoin fork focused on privacy (Darkcoin), Dash evolved into the concept of Digital Cash:
⚡ Instant and private payments: Implements InstantSend for settlement in seconds and PrivateSend (CoinJoin-based obfuscation).
🏛️ Masternode network: Second-layer infrastructure governed by nodes that lock 1,000 DASH as collateral to provide services and manage the protocol treasury.
⚙️ 2. The mechanics of its recurring pumps:
🔒 Structural supply shock: The thousands of Masternodes immobilize a colossal portion of the circulating supply outside exchanges. With thin sell books, any capital inflow pushes the price vertically.
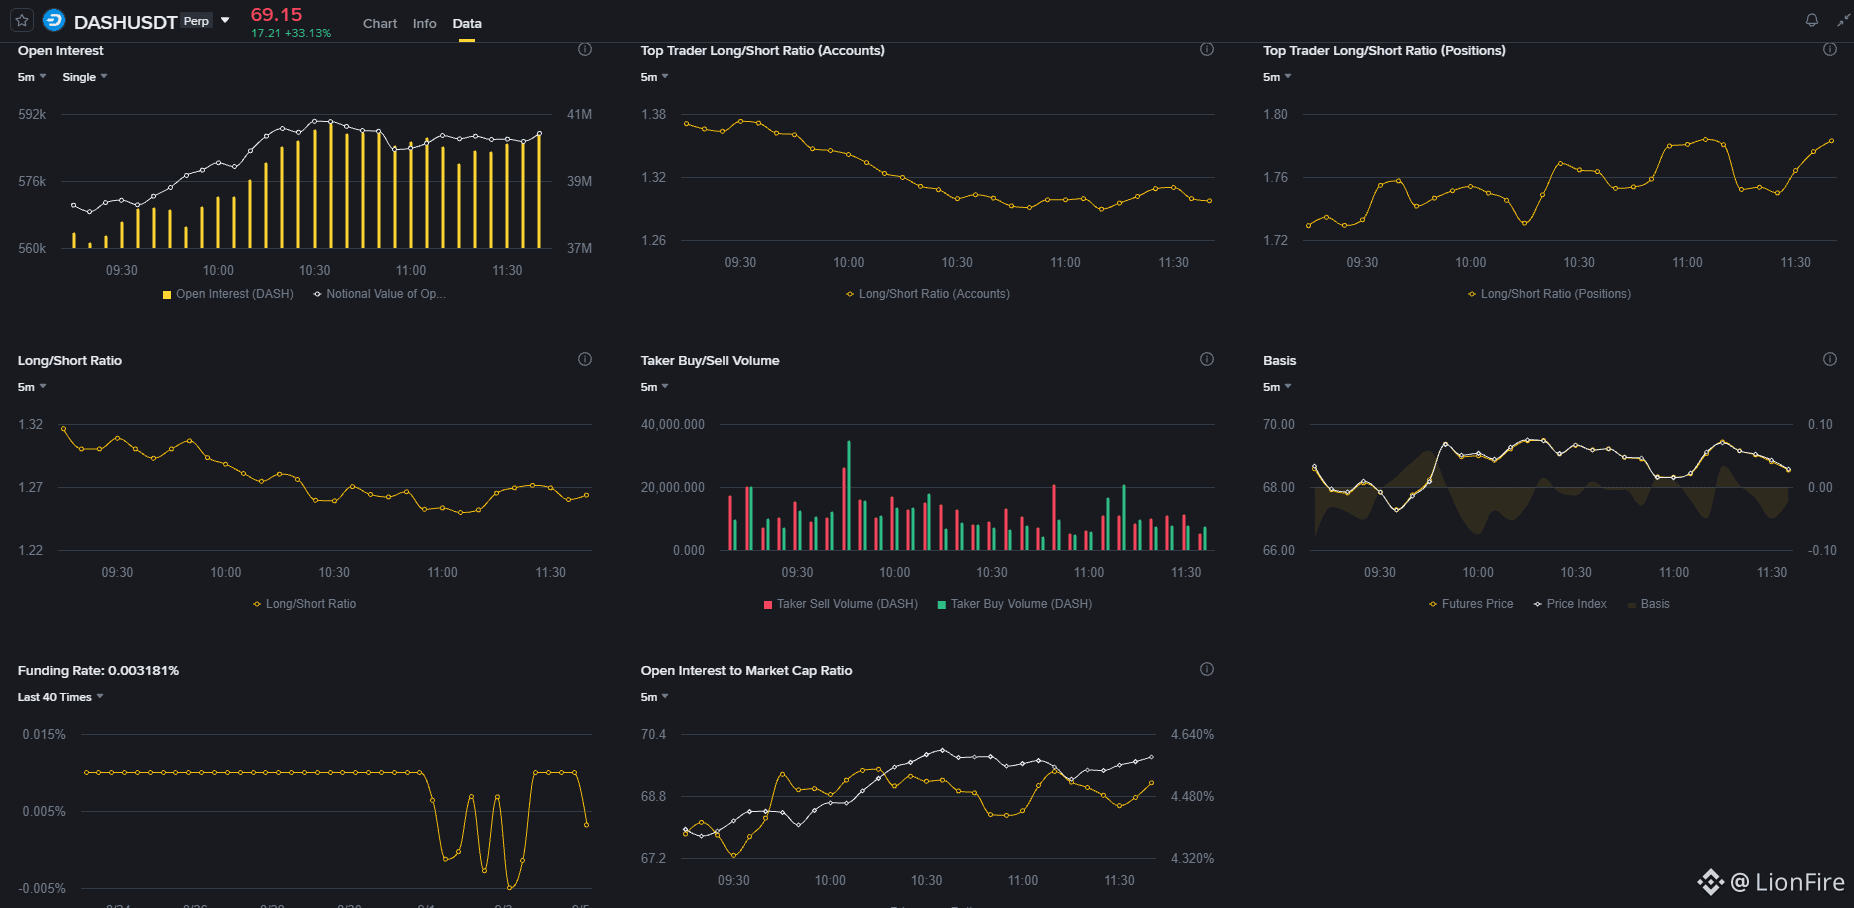
🩳 Merciless short squeeze: Retail traders often open shorts considering it a lagging asset. The global Long/Short ratio fell to 1.26 in the middle of the rally; the fuel for the rise was the liquidations of trapped shorts.
🐋 Strong hands in control: While the market hunted for tops, Top Traders' positions maintained a bullish ratio of 1.78, lifting Open Interest toward 590k DASH (~$40M).
📊 3. Technical reading (1D):
🚀 Base breakout: It forcefully emerges from months of accumulation that bottomed at $28.86, surpassing MA7 ($50.30), MA25 ($39.49), and MA99 ($35.46).
⚠️ Precedent: In previous moves it had already posted similar candles toward $96.57 before entering phases of gradual bleeding.
💡 Dash rewards accumulation in boredom and punishes late FOMO.
#DASH #PrivacyCoins #altcoins
🚀 THE AWAKENING OF DASH (+33% | $69): Anatomy of the project and the mechanics of its violent pumps ⚡📈
While attention was focused on Bitcoin or the resilience of Zcash, $DASH ($69.08) detonated one of its characteristic parabolic explosions: a daily advance above +33%, marking a peak at $74.63 with more than $471M USDT traded (6.93M DASH).
🪙 1. What is Dash and what is its value proposition?
Originally born as a Bitcoin fork focused on privacy (Darkcoin), Dash evolved into the concept of Digital Cash:
⚡ Instant and private payments: Implements InstantSend for settlement in seconds and PrivateSend (CoinJoin-based obfuscation).
🏛️ Masternode network: Second-layer infrastructure governed by nodes that lock 1,000 DASH as collateral to provide services and manage the protocol treasury.
⚙️ 2. The mechanics of its recurring pumps:
🔒 Structural supply shock: The thousands of Masternodes immobilize a colossal portion of the circulating supply outside exchanges. With thin sell books, any capital inflow pushes the price vertically.
🩳 Merciless short squeeze: Retail traders often open shorts considering it a lagging asset. The global Long/Short ratio fell to 1.26 in the middle of the rally; the fuel for the rise was the liquidations of trapped shorts.
🐋 Strong hands in control: While the market hunted for tops, Top Traders' positions maintained a bullish ratio of 1.78, lifting Open Interest toward 590k DASH (~$40M).
📊 3. Technical reading (1D):
🚀 Base breakout: It forcefully emerges from months of accumulation that bottomed at $28.86, surpassing MA7 ($50.30), MA25 ($39.49), and MA99 ($35.46).
⚠️ Precedent: In previous moves it had already posted similar candles toward $96.57 before entering phases of gradual bleeding.
💡 Dash rewards accumulation in boredom and punishes late FOMO.
🚀 THE AWAKENING OF DASH (+33% | $69): Anatomy of the project and the mechanics of its violent pumps ⚡📈
While attention was focused on Bitcoin or the resilience of Zcash, $DASH ($69.08) detonated one of its characteristic parabolic explosions: a daily advance above +33%, marking a peak at $74.63 with more than $471M USDT traded (6.93M DASH).
🪙 1. What is Dash and what is its value proposition?
Originally born as a Bitcoin fork focused on privacy (Darkcoin), Dash evolved into the concept of Digital Cash:
⚡ Instant and private payments: Implements InstantSend for settlement in seconds and PrivateSend (CoinJoin-based obfuscation).
🏛️ Masternode network: Second-layer infrastructure governed by nodes that lock 1,000 DASH as collateral to provide services and manage the protocol treasury.
⚙️ 2. The mechanics of its recurring pumps:
🔒 Structural supply shock: The thousands of Masternodes immobilize a colossal portion of the circulating supply outside exchanges. With thin sell books, any capital inflow pushes the price vertically.
🩳 Merciless short squeeze: Retail traders often open shorts considering it a lagging asset. The global Long/Short ratio fell to 1.26 in the middle of the rally; the fuel for the rise was the liquidations of trapped shorts.
🐋 Strong hands in control: While the market hunted for tops, Top Traders' positions maintained a bullish ratio of 1.78, lifting Open Interest toward 590k DASH (~$40M).
📊 3. Technical reading (1D):
🚀 Base breakout: It forcefully emerges from months of accumulation that bottomed at $28.86, surpassing MA7 ($50.30), MA25 ($39.49), and MA99 ($35.46).
⚠️ Precedent: In previous moves it had already posted similar candles toward $96.57 before entering phases of gradual bleeding.
💡 Dash rewards accumulation in boredom and punishes late FOMO.
113
·
--
Bullish
#marscoin #cryptotrading #altcoins
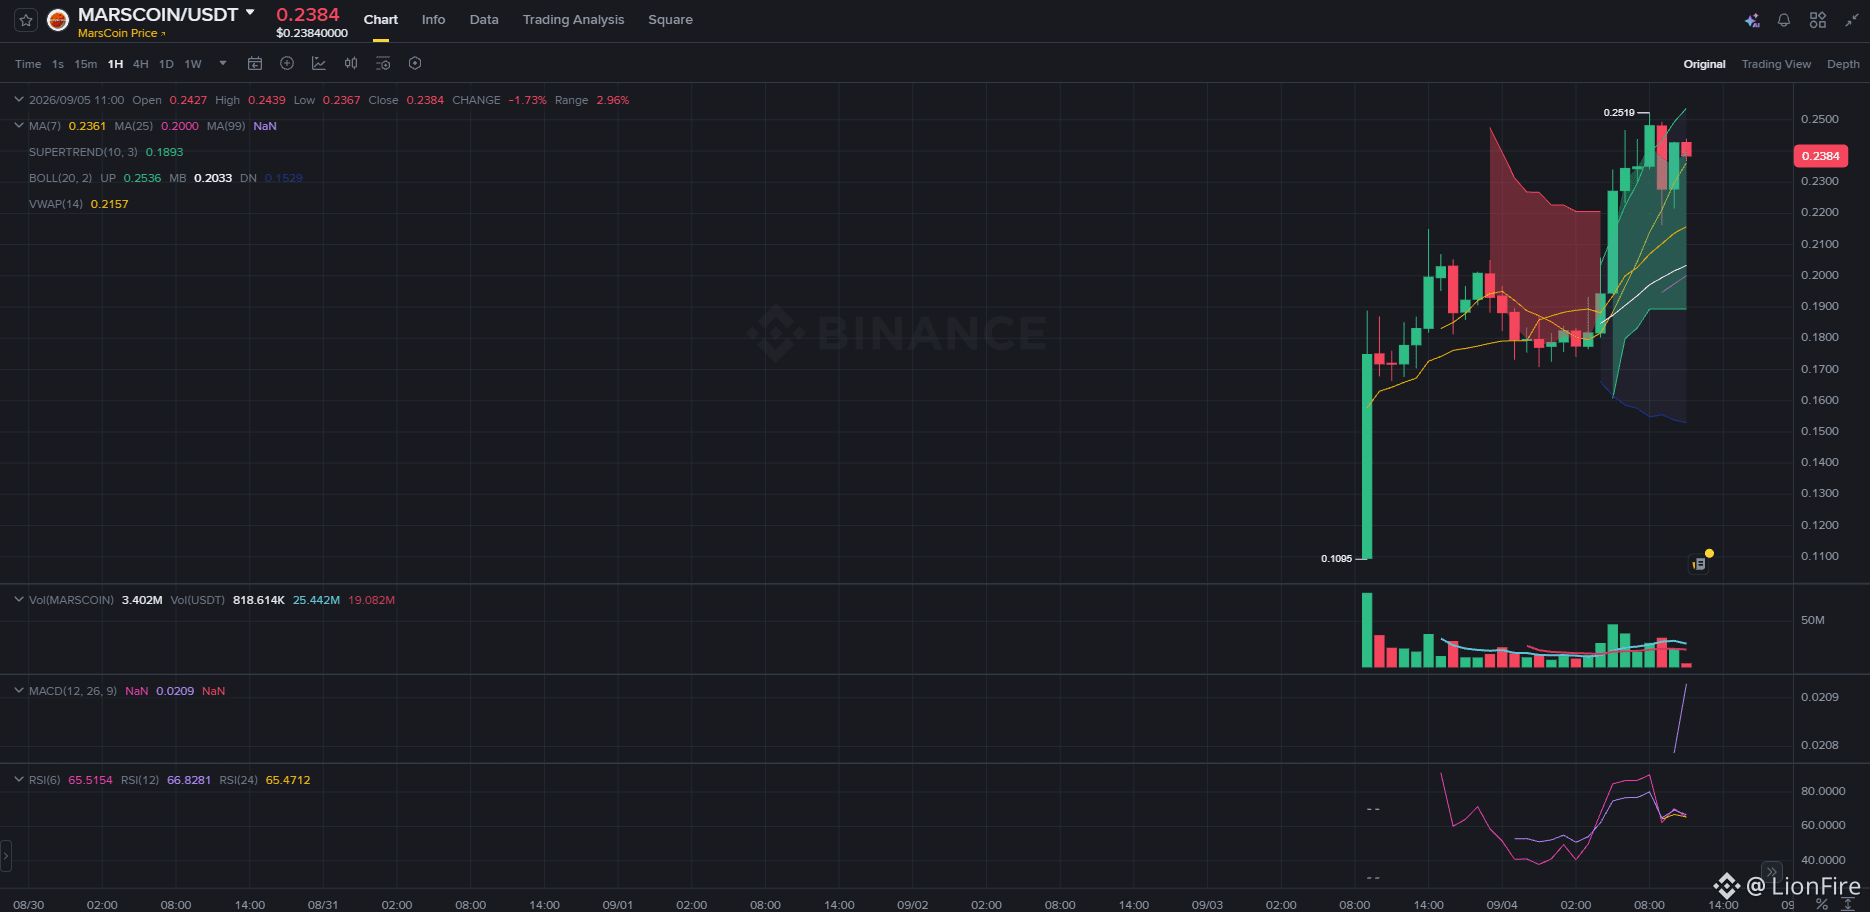
🚀 MARSCOIN REFUSES TO CORRECT ($0.238): Triumphant debut or the calm before the hangover? 🪐📈
The usual playbook for new listings says that, after a vertical rally of more than +70%, the following morning usually brings a massive profit-taking dump that sends the price back to square one. However, $MARSCOIN ($0.2384) is breaking the script this Saturday: not only has it not collapsed, it extended its momentum to hit a new high at $0.2519, so far consolidating as one of the strongest and most unusual launches of the past few weeks.
📊 1. Technical snapshot on 1H:
🟢 Riding above the fast moving average: The price remains compressed above MA7 ($0.2361), defending the highs with surprising technical strength for an asset with so little trading history.
🛡️ Dynamic cushion: VWAP ($0.2157) and the middle Bollinger band ($0.2033) have risen sharply to serve as initial support against any intraday pullback.
⚖️ Key structural floor: MA25 ($0.2000) and the bullish Supertrend at $0.1893 mark the red line separating continuation of the move from capitulation.
⚡ Oscillators in balance: RSI(6) remains warm at 65.51 points and MACD keeps a positive slope (+0.0209), showing that demand is still absorbing sells without signs of extreme exhaustion for now.
⚠️ 2. The ghost haunting new listings:
The crypto graveyard is full of tokens with spectacular debuts that, after 48 or 72 hours of euphoria, end up draining all their liquidity to zero as early funds distribute into late buyers driven by FOMO.
The narrative tied to the space race and the ecosystem around SpaceX has given it formidable speculative traction, but the real stress test will come when volume starts to normalize.
💡 So far it has been a resounding success in absorption, but with freshly born tokens, caution is warranted.
#marscoin #cryptotrading #altcoins
🚀 MARSCOIN REFUSES TO CORRECT ($0.238): Triumphant debut or the calm before the hangover? 🪐📈
The usual playbook for new listings says that, after a vertical rally of more than +70%, the following morning usually brings a massive profit-taking dump that sends the price back to square one. However, $MARSCOIN ($0.2384) is breaking the script this Saturday: not only has it not collapsed, it extended its momentum to hit a new high at $0.2519, so far consolidating as one of the strongest and most unusual launches of the past few weeks.
📊 1. Technical snapshot on 1H:
🟢 Riding above the fast moving average: The price remains compressed above MA7 ($0.2361), defending the highs with surprising technical strength for an asset with so little trading history.
🛡️ Dynamic cushion: VWAP ($0.2157) and the middle Bollinger band ($0.2033) have risen sharply to serve as initial support against any intraday pullback.
⚖️ Key structural floor: MA25 ($0.2000) and the bullish Supertrend at $0.1893 mark the red line separating continuation of the move from capitulation.
⚡ Oscillators in balance: RSI(6) remains warm at 65.51 points and MACD keeps a positive slope (+0.0209), showing that demand is still absorbing sells without signs of extreme exhaustion for now.
⚠️ 2. The ghost haunting new listings:
The crypto graveyard is full of tokens with spectacular debuts that, after 48 or 72 hours of euphoria, end up draining all their liquidity to zero as early funds distribute into late buyers driven by FOMO.
The narrative tied to the space race and the ecosystem around SpaceX has given it formidable speculative traction, but the real stress test will come when volume starts to normalize.
💡 So far it has been a resounding success in absorption, but with freshly born tokens, caution is warranted.
🚀 MARSCOIN REFUSES TO CORRECT ($0.238): Triumphant debut or the calm before the hangover? 🪐📈
The usual playbook for new listings says that, after a vertical rally of more than +70%, the following morning usually brings a massive profit-taking dump that sends the price back to square one. However, $MARSCOIN ($0.2384) is breaking the script this Saturday: not only has it not collapsed, it extended its momentum to hit a new high at $0.2519, so far consolidating as one of the strongest and most unusual launches of the past few weeks.
📊 1. Technical snapshot on 1H:
🟢 Riding above the fast moving average: The price remains compressed above MA7 ($0.2361), defending the highs with surprising technical strength for an asset with so little trading history.
🛡️ Dynamic cushion: VWAP ($0.2157) and the middle Bollinger band ($0.2033) have risen sharply to serve as initial support against any intraday pullback.
⚖️ Key structural floor: MA25 ($0.2000) and the bullish Supertrend at $0.1893 mark the red line separating continuation of the move from capitulation.
⚡ Oscillators in balance: RSI(6) remains warm at 65.51 points and MACD keeps a positive slope (+0.0209), showing that demand is still absorbing sells without signs of extreme exhaustion for now.
⚠️ 2. The ghost haunting new listings:
The crypto graveyard is full of tokens with spectacular debuts that, after 48 or 72 hours of euphoria, end up draining all their liquidity to zero as early funds distribute into late buyers driven by FOMO.
The narrative tied to the space race and the ecosystem around SpaceX has given it formidable speculative traction, but the real stress test will come when volume starts to normalize.
💡 So far it has been a resounding success in absorption, but with freshly born tokens, caution is warranted.
905
·
--
Bullish
#Ethereum #solana #xrp
🏛️ THE ETHEREUM TEMPLATE: Why altcoins mirror ETH’s structure and not Bitcoin’s 📊🧬
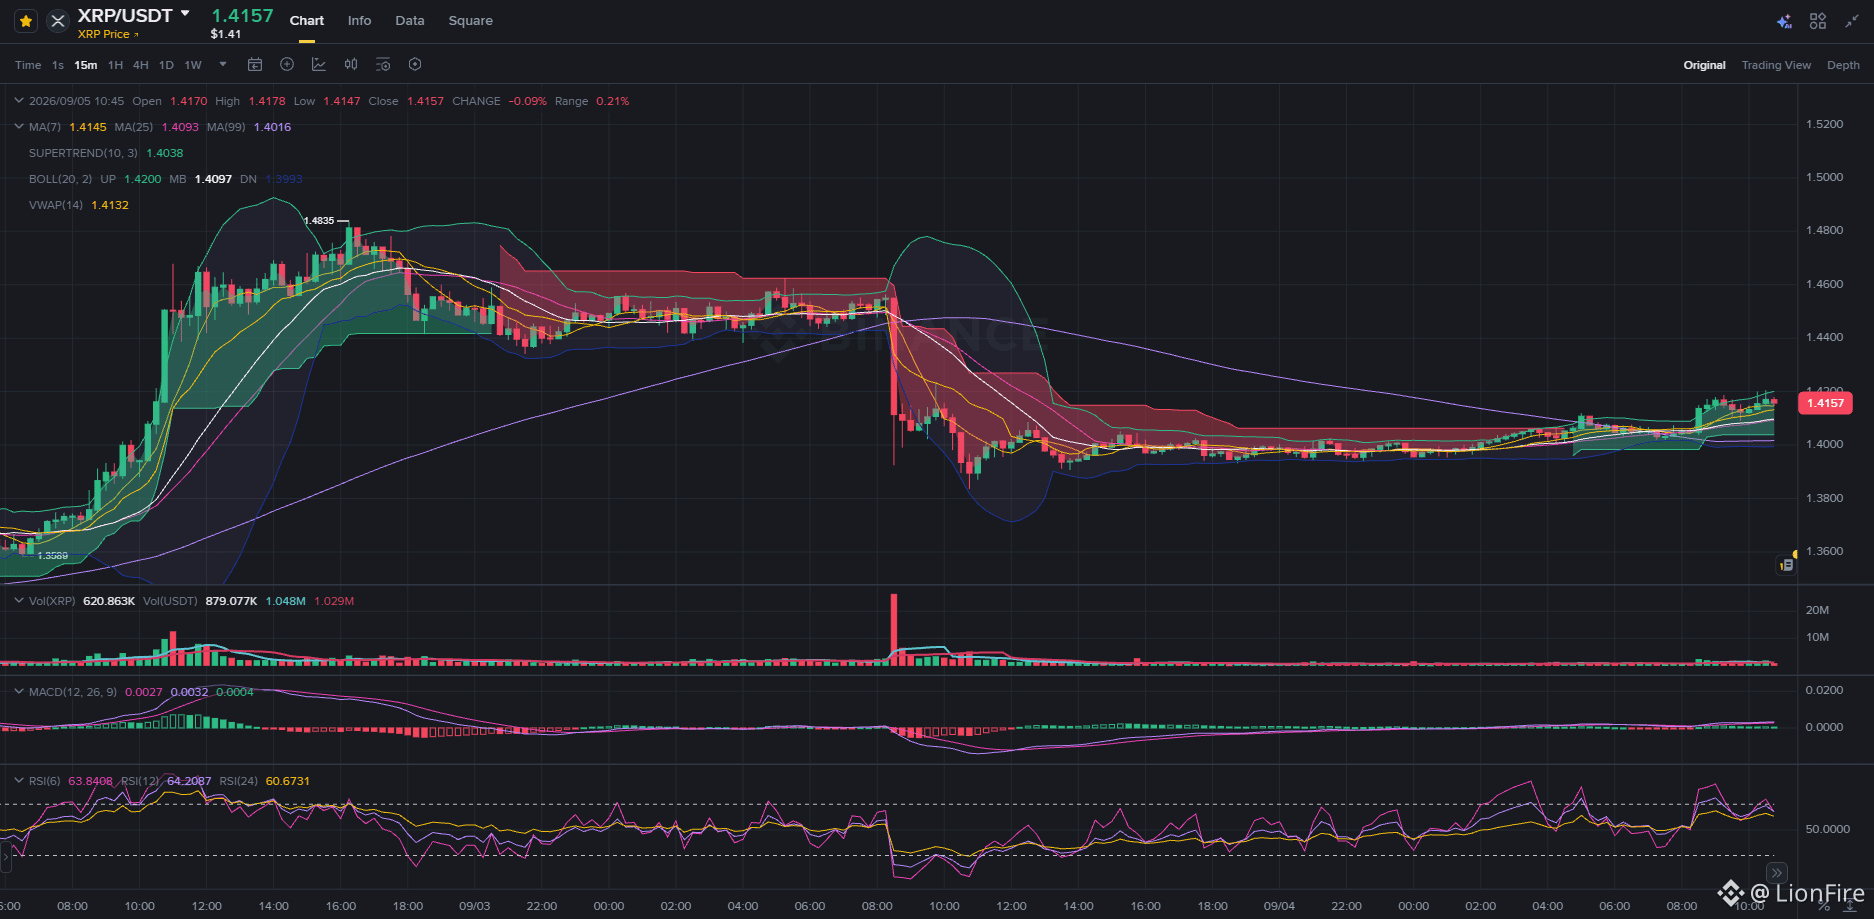
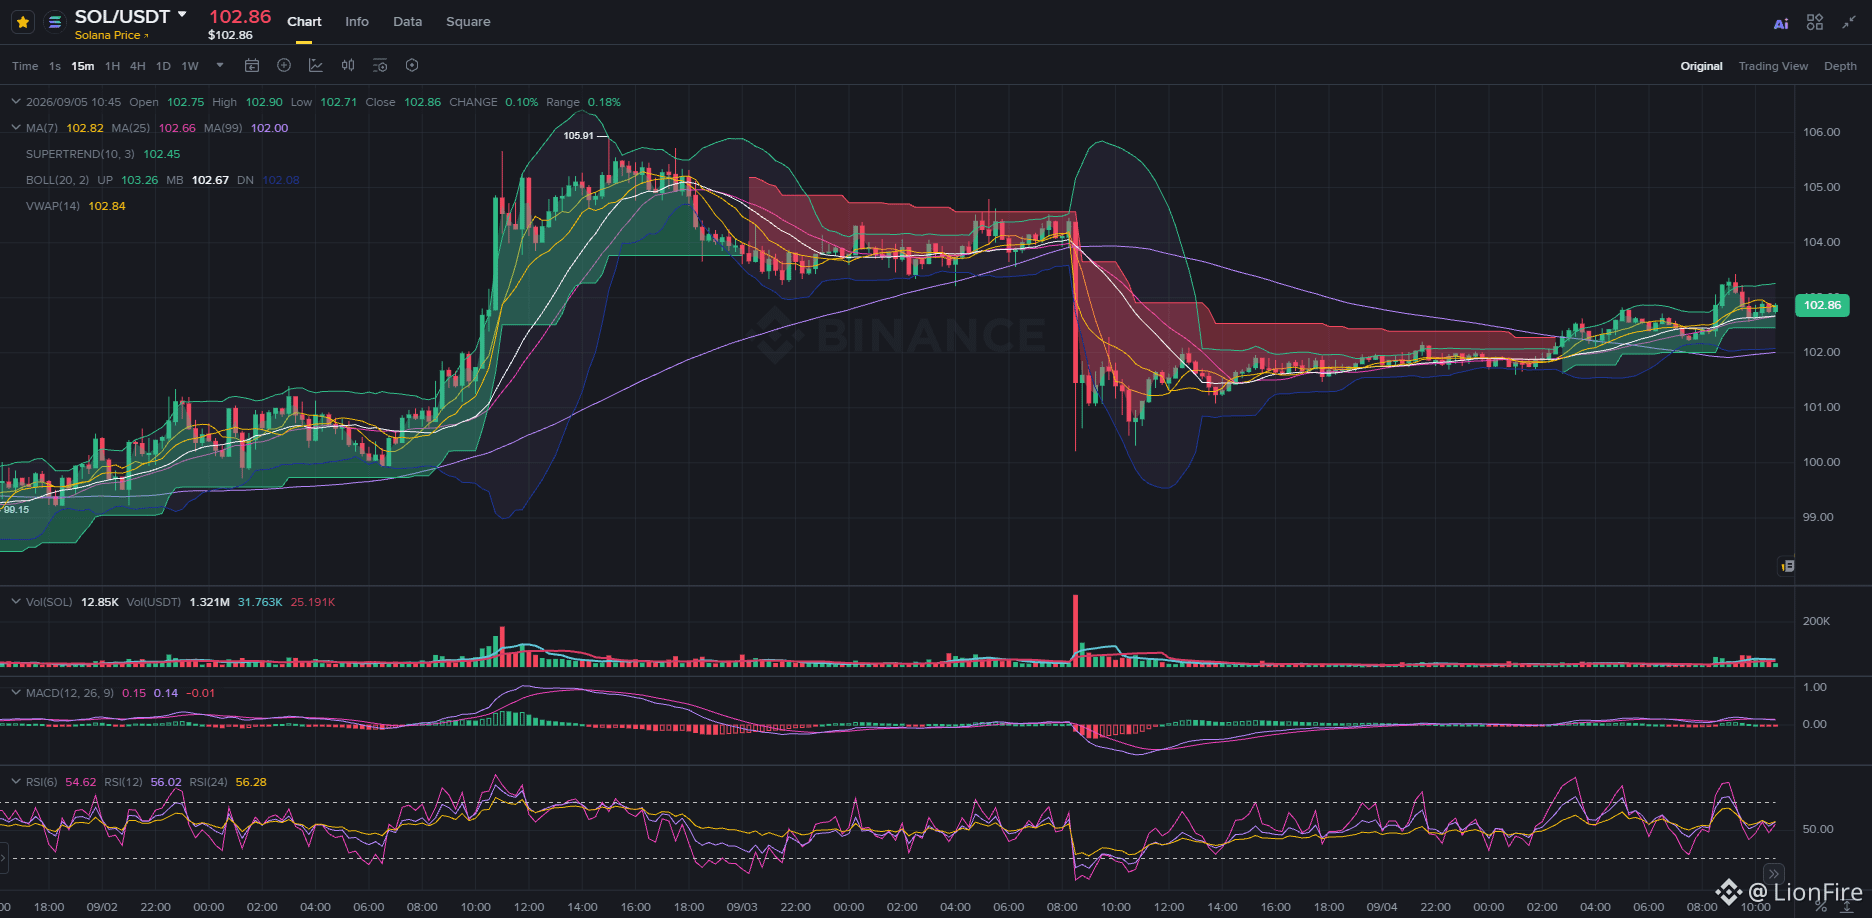
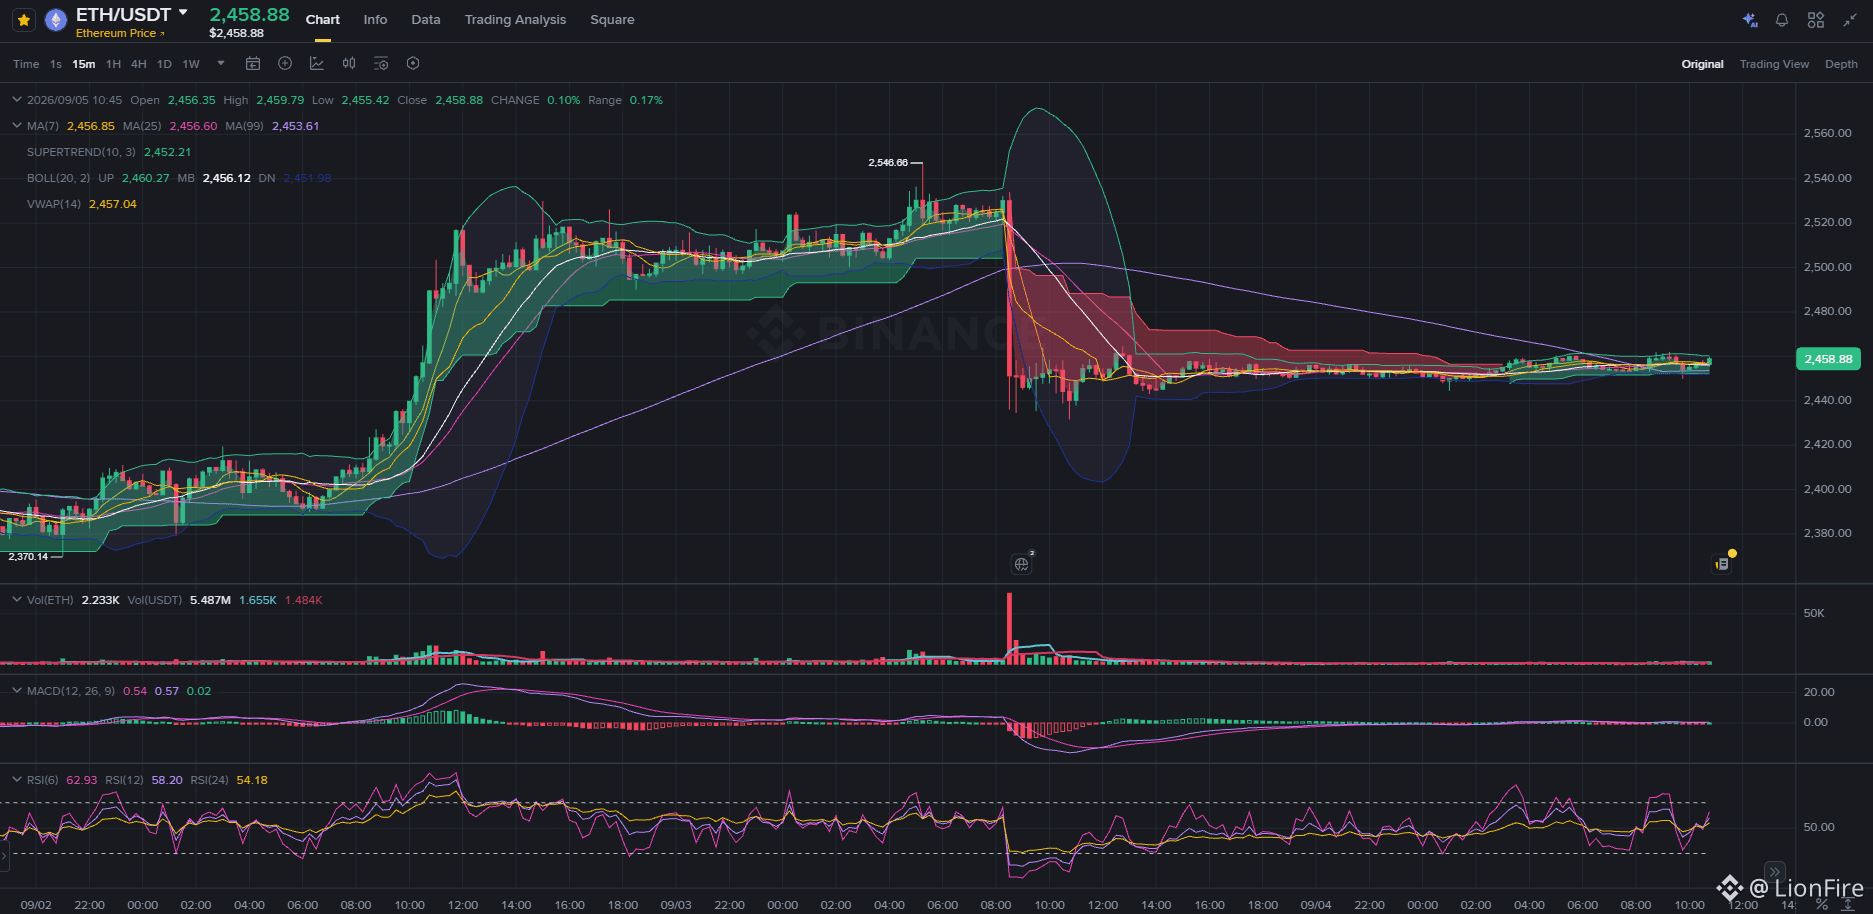
Although Bitcoin sets the macro sentiment, the real intraday compass of the alternative market is dictated by ETH ($2,458.88). By overlaying the 15m charts of SOL ($102.86) and XRP ($1.4157), the correlation is no coincidence: they share a millimetric technical copy of absorption, compression, and simultaneous reactivation.
📐 1. The base pattern drawn by Ethereum:
🛑 The post-crash shelf: After yesterday’s dump from $2,540, ETH did not seek a violent bounce or give in to new lows. It built an airtight horizontal base between $2,440 and $2,450.
🟢 Technical transition: After 20 hours of compression, price moved above the MA99 ($2,453.61), reclaimed the VWAP ($2,457.04), and activated the bullish Supertrend at $2,452.21.
👥 2. The synchronized reflection in Solana and XRP:
☀️ Solana ($SOL | $102.86): It replicated exactly the same shelf above $101.50. It sits on its MA99 ($102.00), recovers the VWAP ($102.84), and activates the Supertrend at $102.45.
💧 XRP ($XRP | $1.4157): It defended support at $1.4000 and is breaking higher above its MA99 ($1.4016), the VWAP ($1.4132), and the Supertrend at $1.4038.
🔍 3. The algorithmic mechanics behind it:
🌊 ETH as collateral: Ethereum is the unit of account and liquidity collateral of the entire ecosystem of smart contracts and decentralized finance.
🤖 Risk baskets: Market makers group high-cap altcoins under ETH’s volatility curve. If Ethereum does not validate real demand, passive orders in SOL and XRP replicate its range.
💡 Altcoins are not moving because of their own news this weekend, but as a unified block. More than watching minor fluctuations in BTC, the operational key is to monitor whether $ETH consolidates above $2,460 - $2,480 to confirm the continuation of the rebound. Let’s trade with a correlation map and a cool head! 🧠⚡
#Ethereum #solana #xrp
🏛️ THE ETHEREUM TEMPLATE: Why altcoins mirror ETH’s structure and not Bitcoin’s 📊🧬
Although Bitcoin sets the macro sentiment, the real intraday compass of the alternative market is dictated by ETH ($2,458.88). By overlaying the 15m charts of SOL ($102.86) and XRP ($1.4157), the correlation is no coincidence: they share a millimetric technical copy of absorption, compression, and simultaneous reactivation.
📐 1. The base pattern drawn by Ethereum:
🛑 The post-crash shelf: After yesterday’s dump from $2,540, ETH did not seek a violent bounce or give in to new lows. It built an airtight horizontal base between $2,440 and $2,450.
🟢 Technical transition: After 20 hours of compression, price moved above the MA99 ($2,453.61), reclaimed the VWAP ($2,457.04), and activated the bullish Supertrend at $2,452.21.
👥 2. The synchronized reflection in Solana and XRP:
☀️ Solana ($SOL | $102.86): It replicated exactly the same shelf above $101.50. It sits on its MA99 ($102.00), recovers the VWAP ($102.84), and activates the Supertrend at $102.45.
💧 XRP ($XRP | $1.4157): It defended support at $1.4000 and is breaking higher above its MA99 ($1.4016), the VWAP ($1.4132), and the Supertrend at $1.4038.
🔍 3. The algorithmic mechanics behind it:
🌊 ETH as collateral: Ethereum is the unit of account and liquidity collateral of the entire ecosystem of smart contracts and decentralized finance.
🤖 Risk baskets: Market makers group high-cap altcoins under ETH’s volatility curve. If Ethereum does not validate real demand, passive orders in SOL and XRP replicate its range.
💡 Altcoins are not moving because of their own news this weekend, but as a unified block. More than watching minor fluctuations in BTC, the operational key is to monitor whether $ETH consolidates above $2,460 - $2,480 to confirm the continuation of the rebound. Let’s trade with a correlation map and a cool head! 🧠⚡
🏛️ THE ETHEREUM TEMPLATE: Why altcoins mirror ETH’s structure and not Bitcoin’s 📊🧬
Although Bitcoin sets the macro sentiment, the real intraday compass of the alternative market is dictated by ETH ($2,458.88). By overlaying the 15m charts of SOL ($102.86) and XRP ($1.4157), the correlation is no coincidence: they share a millimetric technical copy of absorption, compression, and simultaneous reactivation.
📐 1. The base pattern drawn by Ethereum:
🛑 The post-crash shelf: After yesterday’s dump from $2,540, ETH did not seek a violent bounce or give in to new lows. It built an airtight horizontal base between $2,440 and $2,450.
🟢 Technical transition: After 20 hours of compression, price moved above the MA99 ($2,453.61), reclaimed the VWAP ($2,457.04), and activated the bullish Supertrend at $2,452.21.
👥 2. The synchronized reflection in Solana and XRP:
☀️ Solana ($SOL | $102.86): It replicated exactly the same shelf above $101.50. It sits on its MA99 ($102.00), recovers the VWAP ($102.84), and activates the Supertrend at $102.45.
💧 XRP ($XRP | $1.4157): It defended support at $1.4000 and is breaking higher above its MA99 ($1.4016), the VWAP ($1.4132), and the Supertrend at $1.4038.
🔍 3. The algorithmic mechanics behind it:
🌊 ETH as collateral: Ethereum is the unit of account and liquidity collateral of the entire ecosystem of smart contracts and decentralized finance.
🤖 Risk baskets: Market makers group high-cap altcoins under ETH’s volatility curve. If Ethereum does not validate real demand, passive orders in SOL and XRP replicate its range.
💡 Altcoins are not moving because of their own news this weekend, but as a unified block. More than watching minor fluctuations in BTC, the operational key is to monitor whether $ETH consolidates above $2,460 - $2,480 to confirm the continuation of the rebound. Let’s trade with a correlation map and a cool head! 🧠⚡
355
·
--
Bullish
#cryptotrading #BTC #GOLD #zcash
🧱 SATURDAY OF TOTAL COMPRESSION: Why lateralization is not weakness, but the best sign after yesterday's shock 📊🧘
For the impatient trader, seeing 15-minute candles reduced to a flat line may seem boring or a sign of exhaustion. However, in institutional flow analysis, this millimetric sideways action is the strongest and most constructive confirmation possible after yesterday's macroeconomic jolt.
If the market were truly wounded by the jobs data or the capital flight into the dollar, the disconnect from Wall Street and the lower weekend liquidity would have triggered a second bearish leg by inertia. Instead of a bloodbath, what we are seeing is a completely dry supply and impeccable passive absorption.
🔍 The balance snapshot across three fronts:
👑 $BTC (Bitcoin | $79,732): Textbook mathematical compression. The MA7 ($79,683), MA25 ($79,660), and MA99 ($79,618) have collapsed into a range of barely $70. With the Bollinger Bands squeezed and volume drying up to minimums (19 BTC in 15m), Bitcoin neutralized the panic and turned the $79.5k area into a concrete floor.
👑 $XAUT (Gold | $4,423): Absolute balance. The safe-haven asset flattened its price around $4,423 - $4,425, pinned to its VWAP ($4,425.26) and absorbing the impact of interest rates without giving back a single additional dollar.
🛡️ $ZEC (Zcash | $1,015): The definitive proof of technical health. After its vertical rally to $1,050, it did not give back the gains: it is consolidating impeccably above the psychological $1,000 barrier, supported by the MA7 ($1,013) and the MA25 ($1,011).
🎯 Tactical read:
🗜️ Compression before expansion: Phases of extremely low volatility do not last forever; they are the spring that accumulates energy before the next directional move.
🛑 Selling exhaustion: Those who needed to capitulate or react to the labor report were already flushed out yesterday. The market has found its intraday floor.
#cryptotrading #BTC #GOLD #zcash
🧱 SATURDAY OF TOTAL COMPRESSION: Why lateralization is not weakness, but the best sign after yesterday's shock 📊🧘
For the impatient trader, seeing 15-minute candles reduced to a flat line may seem boring or a sign of exhaustion. However, in institutional flow analysis, this millimetric sideways action is the strongest and most constructive confirmation possible after yesterday's macroeconomic jolt.
If the market were truly wounded by the jobs data or the capital flight into the dollar, the disconnect from Wall Street and the lower weekend liquidity would have triggered a second bearish leg by inertia. Instead of a bloodbath, what we are seeing is a completely dry supply and impeccable passive absorption.
🔍 The balance snapshot across three fronts:
👑 $BTC (Bitcoin | $79,732): Textbook mathematical compression. The MA7 ($79,683), MA25 ($79,660), and MA99 ($79,618) have collapsed into a range of barely $70. With the Bollinger Bands squeezed and volume drying up to minimums (19 BTC in 15m), Bitcoin neutralized the panic and turned the $79.5k area into a concrete floor.
👑 $XAUT (Gold | $4,423): Absolute balance. The safe-haven asset flattened its price around $4,423 - $4,425, pinned to its VWAP ($4,425.26) and absorbing the impact of interest rates without giving back a single additional dollar.
🛡️ $ZEC (Zcash | $1,015): The definitive proof of technical health. After its vertical rally to $1,050, it did not give back the gains: it is consolidating impeccably above the psychological $1,000 barrier, supported by the MA7 ($1,013) and the MA25 ($1,011).
🎯 Tactical read:
🗜️ Compression before expansion: Phases of extremely low volatility do not last forever; they are the spring that accumulates energy before the next directional move.
🛑 Selling exhaustion: Those who needed to capitulate or react to the labor report were already flushed out yesterday. The market has found its intraday floor.
🧱 SATURDAY OF TOTAL COMPRESSION: Why lateralization is not weakness, but the best sign after yesterday's shock 📊🧘
For the impatient trader, seeing 15-minute candles reduced to a flat line may seem boring or a sign of exhaustion. However, in institutional flow analysis, this millimetric sideways action is the strongest and most constructive confirmation possible after yesterday's macroeconomic jolt.
If the market were truly wounded by the jobs data or the capital flight into the dollar, the disconnect from Wall Street and the lower weekend liquidity would have triggered a second bearish leg by inertia. Instead of a bloodbath, what we are seeing is a completely dry supply and impeccable passive absorption.
🔍 The balance snapshot across three fronts:
👑 $BTC (Bitcoin | $79,732): Textbook mathematical compression. The MA7 ($79,683), MA25 ($79,660), and MA99 ($79,618) have collapsed into a range of barely $70. With the Bollinger Bands squeezed and volume drying up to minimums (19 BTC in 15m), Bitcoin neutralized the panic and turned the $79.5k area into a concrete floor.
👑 $XAUT (Gold | $4,423): Absolute balance. The safe-haven asset flattened its price around $4,423 - $4,425, pinned to its VWAP ($4,425.26) and absorbing the impact of interest rates without giving back a single additional dollar.
🛡️ $ZEC (Zcash | $1,015): The definitive proof of technical health. After its vertical rally to $1,050, it did not give back the gains: it is consolidating impeccably above the psychological $1,000 barrier, supported by the MA7 ($1,013) and the MA25 ($1,011).
🎯 Tactical read:
🗜️ Compression before expansion: Phases of extremely low volatility do not last forever; they are the spring that accumulates energy before the next directional move.
🛑 Selling exhaustion: Those who needed to capitulate or react to the labor report were already flushed out yesterday. The market has found its intraday floor.
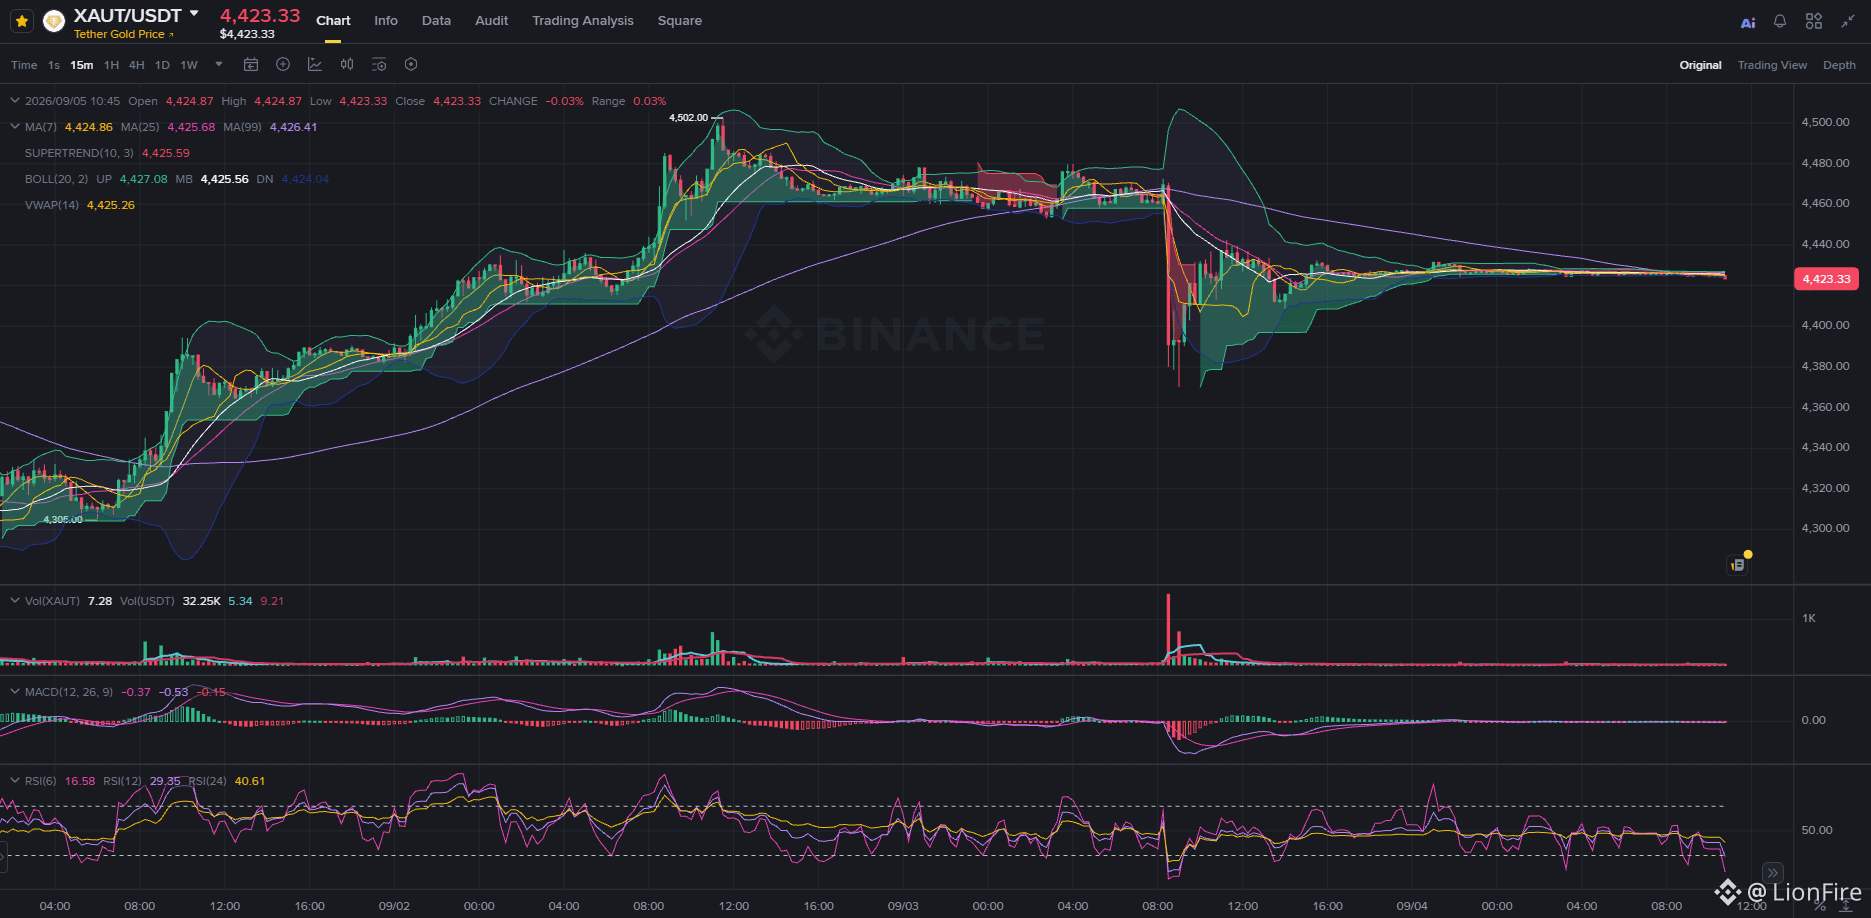
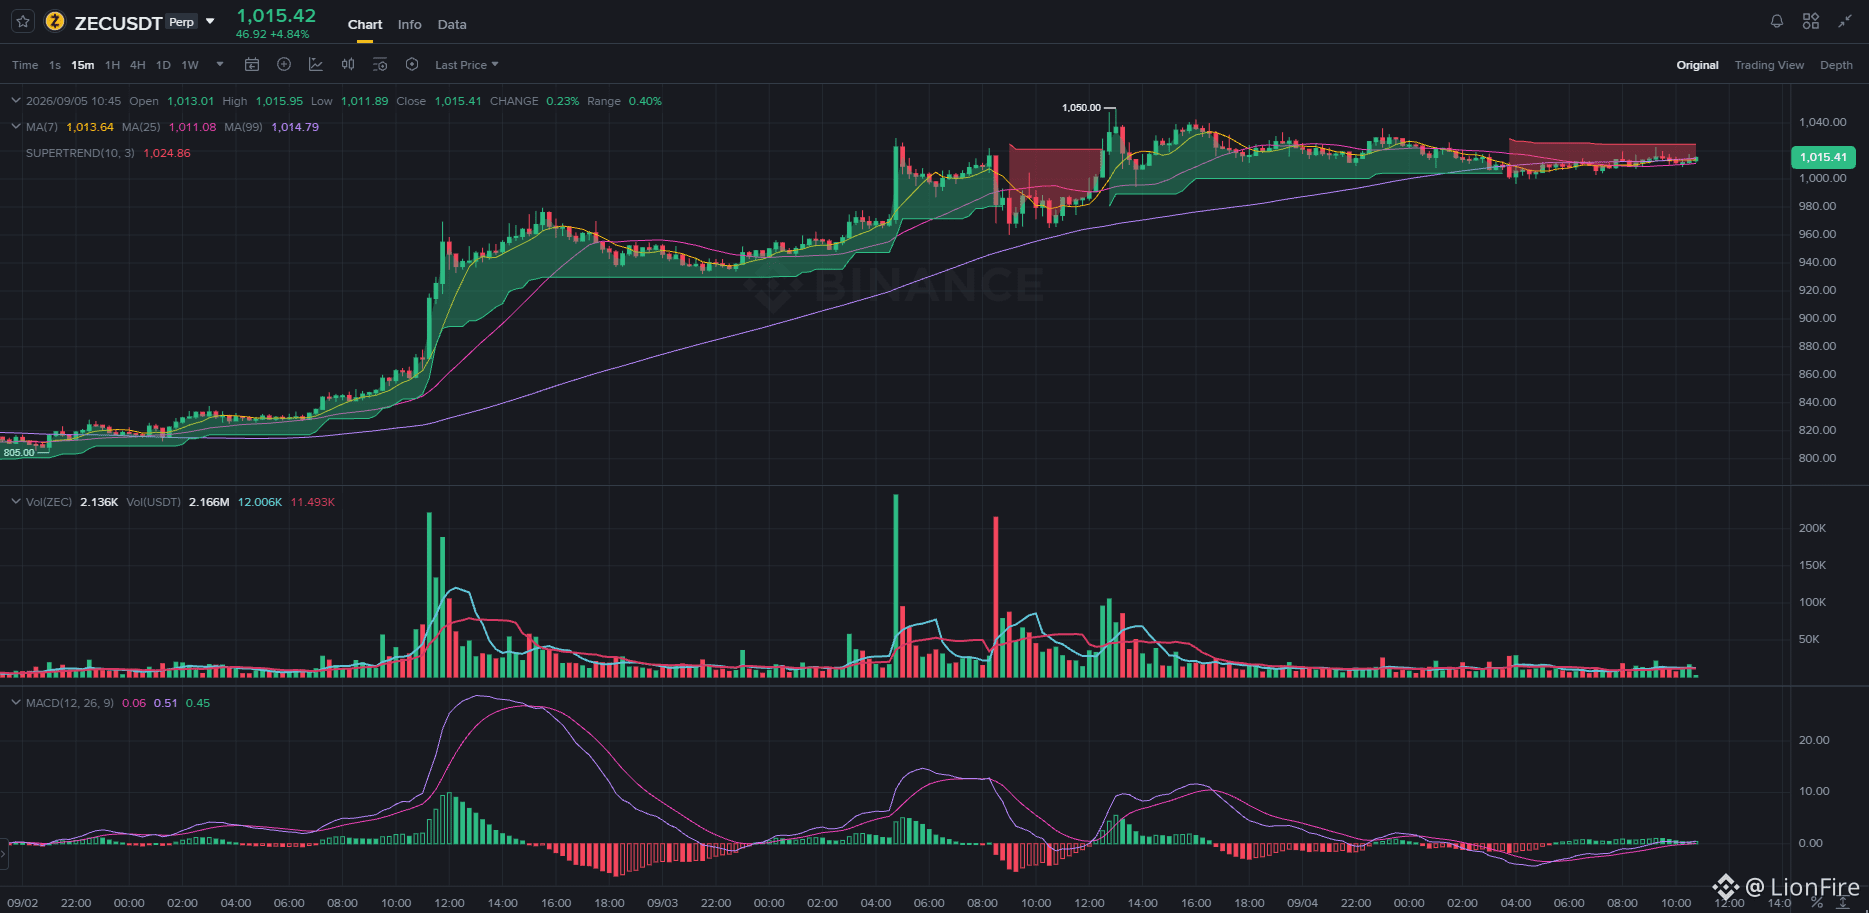
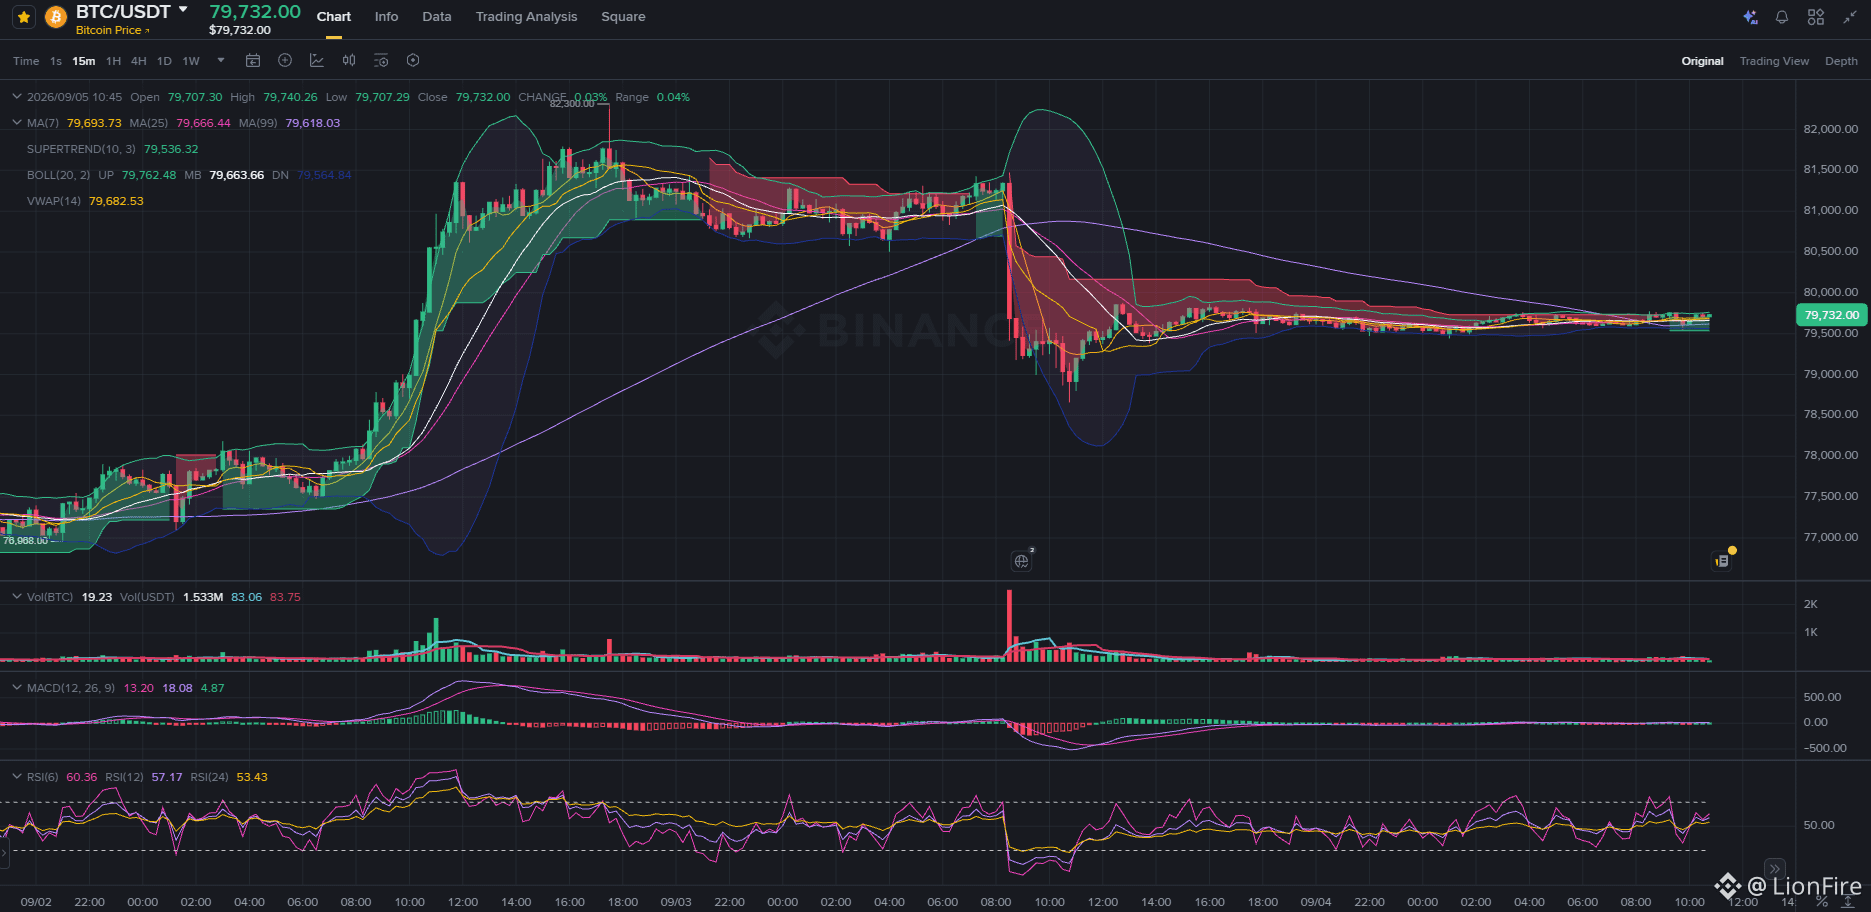
194
·
--
Bullish
#marscoin #cryptotrading #altcoins
🚀 EXPLOSION IN MARSCOIN (+70% | $0.194): What’s behind the reveal token and what to expect 🪐⚡
Recently listed on Binance perpetual contracts, $MARSCOIN ($0.1946) leads the session’s gains. From its listing floor at $0.05210, the asset took off in a vertical rally of nearly 4x to reach a peak at $0.21449, moving more than $53.3M USDT in 4-hour (4H) candles.
🪐 1. Fundamentals and catalysts:
🛰️ Interplanetary narrative: The project aims to build financial infrastructure for the colonization of Mars, capturing speculative interest around SpaceX and the space race.
⚙️ The liquidity trigger: Its addition to leveraged futures of up to 20x on BNB Chain channeled aggressive capital, acting as a high-beta vehicle linked to the ecosystem of space tokens and tokenized assets such as SPCXB.
📊 2. Technical snapshot on 4 Hours (4H):
⚠️ Pure price discovery: With no trading history, the MA25, MA99, and MACD still show NaN. The immediate guide is set by the MA7 at $0.16124, while the Supertrend base is anchored at $0.10787.
🌋 Pressure at the highs: The 277M volume in MARSCOIN confirms institutional absorption, but the upper wick at $0.214 reveals profit-taking by early participants.
🎯 3. Scenarios for the next sessions:
🛑 Pullback risk (-25% to -35%): After a move of more than +250% from the lows, a consolidation toward the MA7 ($0.160) is the most likely scenario to clean up the order book.
🚀 Bullish extension: If it can go sideways and turn the $0.180 - $0.190 range into structural support, the next psychological target points to $0.250.
💡 An excellent intraday scalping instrument because of its volatility, but extremely dangerous for late buys driven by FOMO. Anyone trading derivatives here should manage position size and place strict stops. Keep a cool head and stay disciplined! 🧠⚡
#marscoin #cryptotrading #altcoins
🚀 EXPLOSION IN MARSCOIN (+70% | $0.194): What’s behind the reveal token and what to expect 🪐⚡
Recently listed on Binance perpetual contracts, $MARSCOIN ($0.1946) leads the session’s gains. From its listing floor at $0.05210, the asset took off in a vertical rally of nearly 4x to reach a peak at $0.21449, moving more than $53.3M USDT in 4-hour (4H) candles.
🪐 1. Fundamentals and catalysts:
🛰️ Interplanetary narrative: The project aims to build financial infrastructure for the colonization of Mars, capturing speculative interest around SpaceX and the space race.
⚙️ The liquidity trigger: Its addition to leveraged futures of up to 20x on BNB Chain channeled aggressive capital, acting as a high-beta vehicle linked to the ecosystem of space tokens and tokenized assets such as SPCXB.
📊 2. Technical snapshot on 4 Hours (4H):
⚠️ Pure price discovery: With no trading history, the MA25, MA99, and MACD still show NaN. The immediate guide is set by the MA7 at $0.16124, while the Supertrend base is anchored at $0.10787.
🌋 Pressure at the highs: The 277M volume in MARSCOIN confirms institutional absorption, but the upper wick at $0.214 reveals profit-taking by early participants.
🎯 3. Scenarios for the next sessions:
🛑 Pullback risk (-25% to -35%): After a move of more than +250% from the lows, a consolidation toward the MA7 ($0.160) is the most likely scenario to clean up the order book.
🚀 Bullish extension: If it can go sideways and turn the $0.180 - $0.190 range into structural support, the next psychological target points to $0.250.
💡 An excellent intraday scalping instrument because of its volatility, but extremely dangerous for late buys driven by FOMO. Anyone trading derivatives here should manage position size and place strict stops. Keep a cool head and stay disciplined! 🧠⚡
🚀 EXPLOSION IN MARSCOIN (+70% | $0.194): What’s behind the reveal token and what to expect 🪐⚡
Recently listed on Binance perpetual contracts, $MARSCOIN ($0.1946) leads the session’s gains. From its listing floor at $0.05210, the asset took off in a vertical rally of nearly 4x to reach a peak at $0.21449, moving more than $53.3M USDT in 4-hour (4H) candles.
🪐 1. Fundamentals and catalysts:
🛰️ Interplanetary narrative: The project aims to build financial infrastructure for the colonization of Mars, capturing speculative interest around SpaceX and the space race.
⚙️ The liquidity trigger: Its addition to leveraged futures of up to 20x on BNB Chain channeled aggressive capital, acting as a high-beta vehicle linked to the ecosystem of space tokens and tokenized assets such as SPCXB.
📊 2. Technical snapshot on 4 Hours (4H):
⚠️ Pure price discovery: With no trading history, the MA25, MA99, and MACD still show NaN. The immediate guide is set by the MA7 at $0.16124, while the Supertrend base is anchored at $0.10787.
🌋 Pressure at the highs: The 277M volume in MARSCOIN confirms institutional absorption, but the upper wick at $0.214 reveals profit-taking by early participants.
🎯 3. Scenarios for the next sessions:
🛑 Pullback risk (-25% to -35%): After a move of more than +250% from the lows, a consolidation toward the MA7 ($0.160) is the most likely scenario to clean up the order book.
🚀 Bullish extension: If it can go sideways and turn the $0.180 - $0.190 range into structural support, the next psychological target points to $0.250.
💡 An excellent intraday scalping instrument because of its volatility, but extremely dangerous for late buys driven by FOMO. Anyone trading derivatives here should manage position size and place strict stops. Keep a cool head and stay disciplined! 🧠⚡
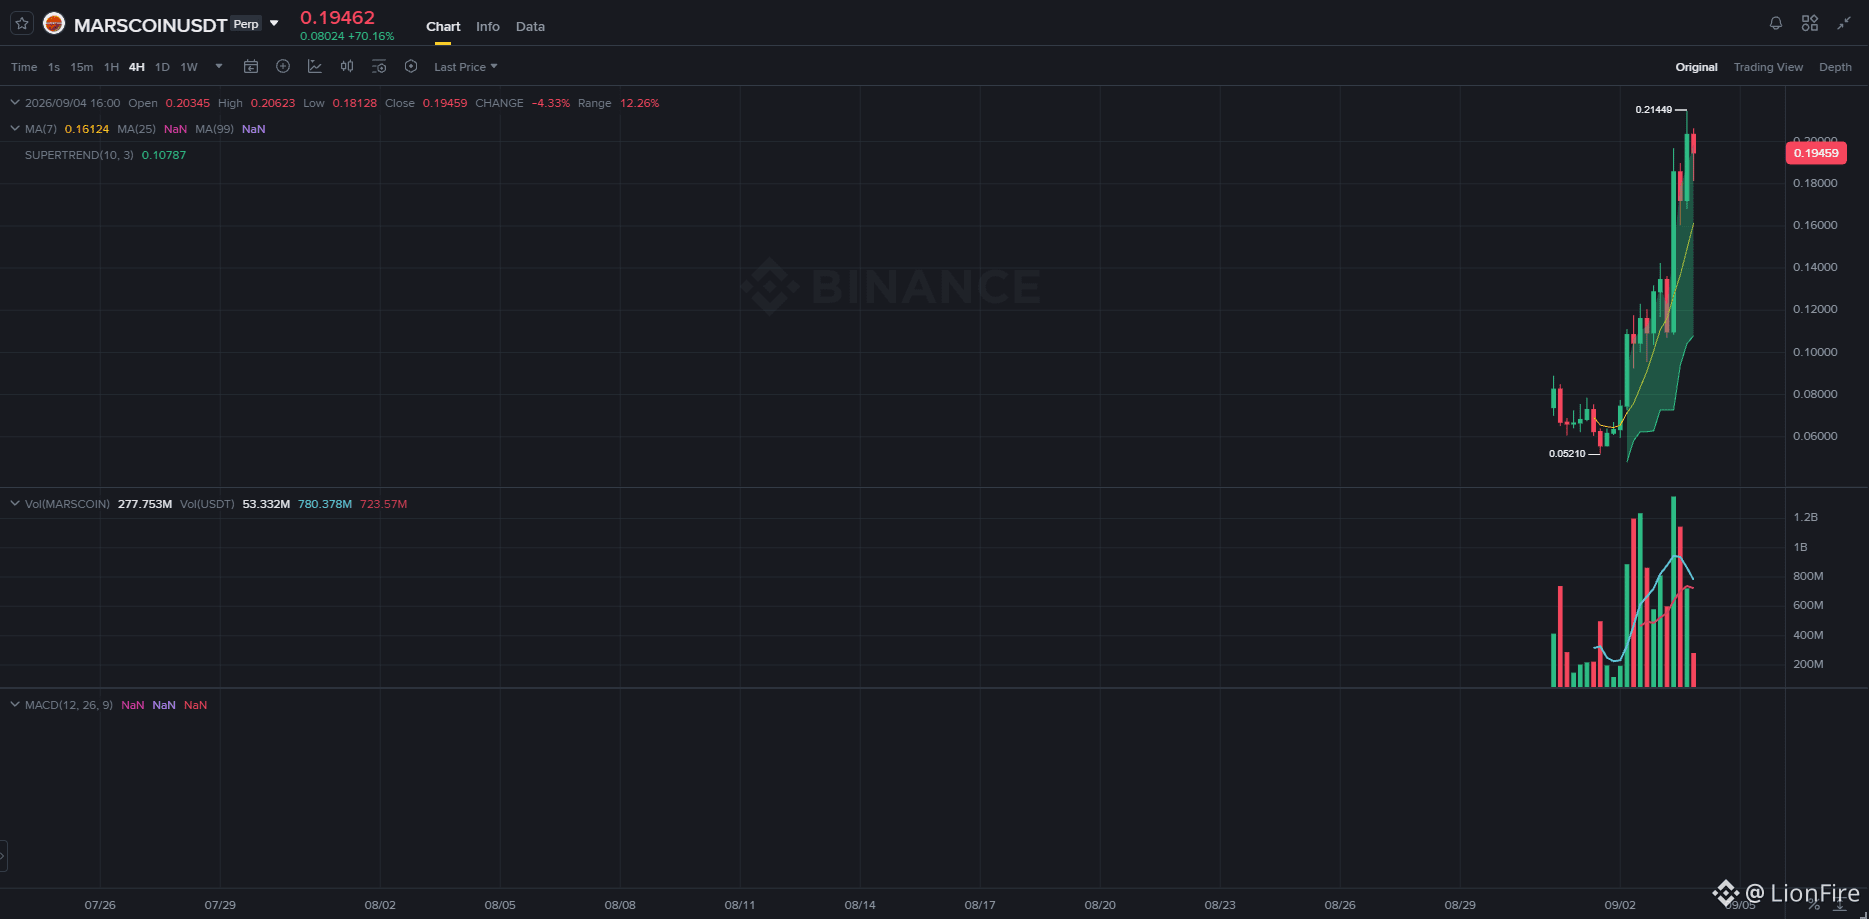
172
·
--
Bullish
#WallStreet #WeekendTrading
🏛️ FRIDAY OF CLOSURE AND HANGOVER: Wall Street ends the week cautiously and the crypto market heads into the weekend in the red 📉☕
A fairly intense week marked by the shake-up in employment data comes to an end. Wall Street closes out with a mixed, slightly cold balance: while some silicon firms saved the day, the tech giants suffered pressure from the rise in yields and the crypto market heads into the weekend with the heat map painted red.
A typical Friday of decompression, where big funds prefer to close out risk before traditional markets turn off the screens for 48 hours.
📊 Three assets to understand the closing picture:
🛰️ SpaceX ($SPCX | $147.95 | -1.20%): After the vertical rally of recent days and the morning whiplash, the stock absorbed natural profit-taking to close at $147.95. It comfortably defends a valuation of $1.950T, beginning to shape that consolidation we had been projecting.
👑 $BTC (Bitcoin | $79,700 | -2.25%): It failed to hold momentum above $81k and heads into Friday night floating just below the psychological $80,000 level. It’s worth watching calmly to see whether the current range serves as a base or whether it seeks liquidity lower down.
🛡️ $ZEC (Zcash | $1,017.97 | +6.67%): The true anomaly of the session. While the rest of the board falls between 2% and 5%, Zcash refuses to give ground and ends the week firmly above $1,000.
💡 With the New York bell silent until Monday, liquidity in the crypto ecosystem usually thins out, creating a setting ripe for trap moves or stop hunts on low volume.
The best plan for this Saturday and Sunday: don’t overtrade out of boredom, let prices breathe, and rest your mind. Have a great weekend everyone, and time to recharge! 🧠⚡
#WallStreet #WeekendTrading
🏛️ FRIDAY OF CLOSURE AND HANGOVER: Wall Street ends the week cautiously and the crypto market heads into the weekend in the red 📉☕
A fairly intense week marked by the shake-up in employment data comes to an end. Wall Street closes out with a mixed, slightly cold balance: while some silicon firms saved the day, the tech giants suffered pressure from the rise in yields and the crypto market heads into the weekend with the heat map painted red.
A typical Friday of decompression, where big funds prefer to close out risk before traditional markets turn off the screens for 48 hours.
📊 Three assets to understand the closing picture:
🛰️ SpaceX ($SPCX | $147.95 | -1.20%): After the vertical rally of recent days and the morning whiplash, the stock absorbed natural profit-taking to close at $147.95. It comfortably defends a valuation of $1.950T, beginning to shape that consolidation we had been projecting.
👑 $BTC (Bitcoin | $79,700 | -2.25%): It failed to hold momentum above $81k and heads into Friday night floating just below the psychological $80,000 level. It’s worth watching calmly to see whether the current range serves as a base or whether it seeks liquidity lower down.
🛡️ $ZEC (Zcash | $1,017.97 | +6.67%): The true anomaly of the session. While the rest of the board falls between 2% and 5%, Zcash refuses to give ground and ends the week firmly above $1,000.
💡 With the New York bell silent until Monday, liquidity in the crypto ecosystem usually thins out, creating a setting ripe for trap moves or stop hunts on low volume.
The best plan for this Saturday and Sunday: don’t overtrade out of boredom, let prices breathe, and rest your mind. Have a great weekend everyone, and time to recharge! 🧠⚡
🏛️ FRIDAY OF CLOSURE AND HANGOVER: Wall Street ends the week cautiously and the crypto market heads into the weekend in the red 📉☕
A fairly intense week marked by the shake-up in employment data comes to an end. Wall Street closes out with a mixed, slightly cold balance: while some silicon firms saved the day, the tech giants suffered pressure from the rise in yields and the crypto market heads into the weekend with the heat map painted red.
A typical Friday of decompression, where big funds prefer to close out risk before traditional markets turn off the screens for 48 hours.
📊 Three assets to understand the closing picture:
🛰️ SpaceX ($SPCX | $147.95 | -1.20%): After the vertical rally of recent days and the morning whiplash, the stock absorbed natural profit-taking to close at $147.95. It comfortably defends a valuation of $1.950T, beginning to shape that consolidation we had been projecting.
👑 $BTC (Bitcoin | $79,700 | -2.25%): It failed to hold momentum above $81k and heads into Friday night floating just below the psychological $80,000 level. It’s worth watching calmly to see whether the current range serves as a base or whether it seeks liquidity lower down.
🛡️ $ZEC (Zcash | $1,017.97 | +6.67%): The true anomaly of the session. While the rest of the board falls between 2% and 5%, Zcash refuses to give ground and ends the week firmly above $1,000.
💡 With the New York bell silent until Monday, liquidity in the crypto ecosystem usually thins out, creating a setting ripe for trap moves or stop hunts on low volume.
The best plan for this Saturday and Sunday: don’t overtrade out of boredom, let prices breathe, and rest your mind. Have a great weekend everyone, and time to recharge! 🧠⚡
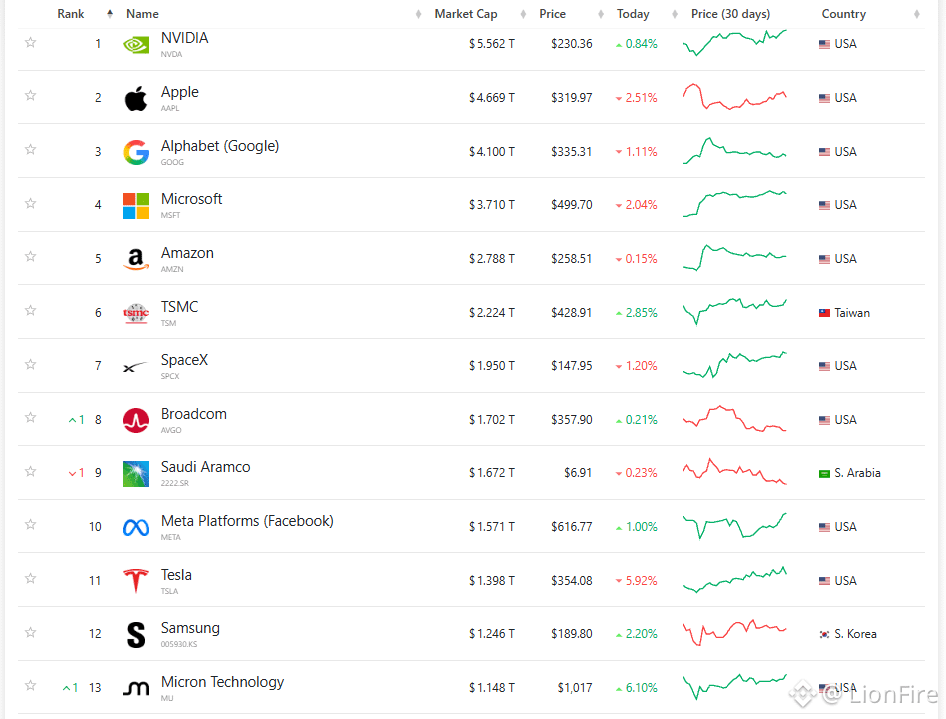
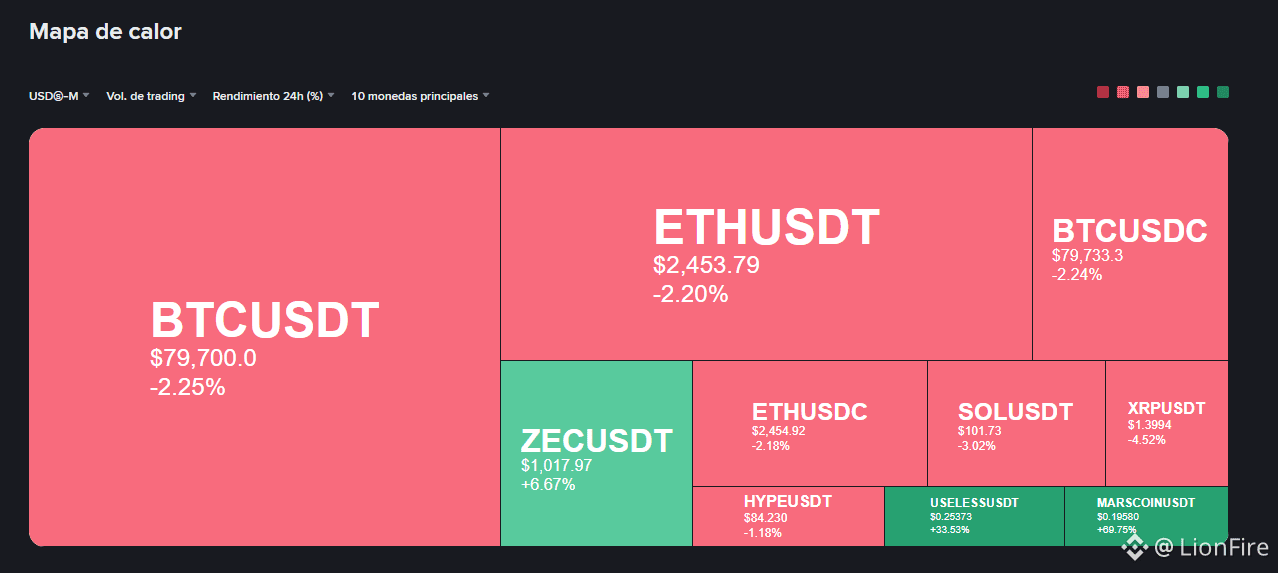
120
·
--
Bullish
#xrp #cryptotrading #TechnicalAnalysiss
💧 XRP WITH THE HANDBRAKE ON ($1.398): The crash hangover is still weighing on the chart 📉🐢
While other assets try to shake off the dust with more decisive bounces, $XRP ($1.3984) is struggling to catch its breath after the morning whiplash. The momentum that took it close to $1.48 is behind it, and the price is once again trading in a fairly dense compression zone.
📊 What the 4-Hour chart tells us (4H):
🛑 Short-term dynamic ceiling: The quote got trapped below its MA7 ($1.4269) and VWAP ($1.4176). Without reclaiming that band, any intraday rise risks being just a bounce to continue unloading.
🏜️ Volume dried up: After the liquidation candle, interest cooled off sharply. Trading with barely ~7M XRP in 4H volume shows that demand is in no rush to step in and buy at local highs.
🛡️ The floor preventing bigger problems: The constructive part is that the underlying structure has not broken. The price continues to defend the confluence between MA99 ($1.3948), the middle band ($1.3895), and MA25 ($1.3879), keeping the key Supertrend support at $1.3610.
💤 RSI cooling off: RSI(6) dropped to 40.31 points, erasing any trace of prior overbought conditions.
💡 In short:
XRP has not panicked, but it is heavy. To regain optimism, it needs to reclaim $1.4300 with confidence; as long as it stays above $1.3900, patience is needed and the range should be allowed to finish taking shape without rushing to anticipate moves. Keep a cool head and manage risk! 🧠⚡
#xrp #cryptotrading #TechnicalAnalysiss
💧 XRP WITH THE HANDBRAKE ON ($1.398): The crash hangover is still weighing on the chart 📉🐢
While other assets try to shake off the dust with more decisive bounces, $XRP ($1.3984) is struggling to catch its breath after the morning whiplash. The momentum that took it close to $1.48 is behind it, and the price is once again trading in a fairly dense compression zone.
📊 What the 4-Hour chart tells us (4H):
🛑 Short-term dynamic ceiling: The quote got trapped below its MA7 ($1.4269) and VWAP ($1.4176). Without reclaiming that band, any intraday rise risks being just a bounce to continue unloading.
🏜️ Volume dried up: After the liquidation candle, interest cooled off sharply. Trading with barely ~7M XRP in 4H volume shows that demand is in no rush to step in and buy at local highs.
🛡️ The floor preventing bigger problems: The constructive part is that the underlying structure has not broken. The price continues to defend the confluence between MA99 ($1.3948), the middle band ($1.3895), and MA25 ($1.3879), keeping the key Supertrend support at $1.3610.
💤 RSI cooling off: RSI(6) dropped to 40.31 points, erasing any trace of prior overbought conditions.
💡 In short:
XRP has not panicked, but it is heavy. To regain optimism, it needs to reclaim $1.4300 with confidence; as long as it stays above $1.3900, patience is needed and the range should be allowed to finish taking shape without rushing to anticipate moves. Keep a cool head and manage risk! 🧠⚡
💧 XRP WITH THE HANDBRAKE ON ($1.398): The crash hangover is still weighing on the chart 📉🐢
While other assets try to shake off the dust with more decisive bounces, $XRP ($1.3984) is struggling to catch its breath after the morning whiplash. The momentum that took it close to $1.48 is behind it, and the price is once again trading in a fairly dense compression zone.
📊 What the 4-Hour chart tells us (4H):
🛑 Short-term dynamic ceiling: The quote got trapped below its MA7 ($1.4269) and VWAP ($1.4176). Without reclaiming that band, any intraday rise risks being just a bounce to continue unloading.
🏜️ Volume dried up: After the liquidation candle, interest cooled off sharply. Trading with barely ~7M XRP in 4H volume shows that demand is in no rush to step in and buy at local highs.
🛡️ The floor preventing bigger problems: The constructive part is that the underlying structure has not broken. The price continues to defend the confluence between MA99 ($1.3948), the middle band ($1.3895), and MA25 ($1.3879), keeping the key Supertrend support at $1.3610.
💤 RSI cooling off: RSI(6) dropped to 40.31 points, erasing any trace of prior overbought conditions.
💡 In short:
XRP has not panicked, but it is heavy. To regain optimism, it needs to reclaim $1.4300 with confidence; as long as it stays above $1.3900, patience is needed and the range should be allowed to finish taking shape without rushing to anticipate moves. Keep a cool head and manage risk! 🧠⚡
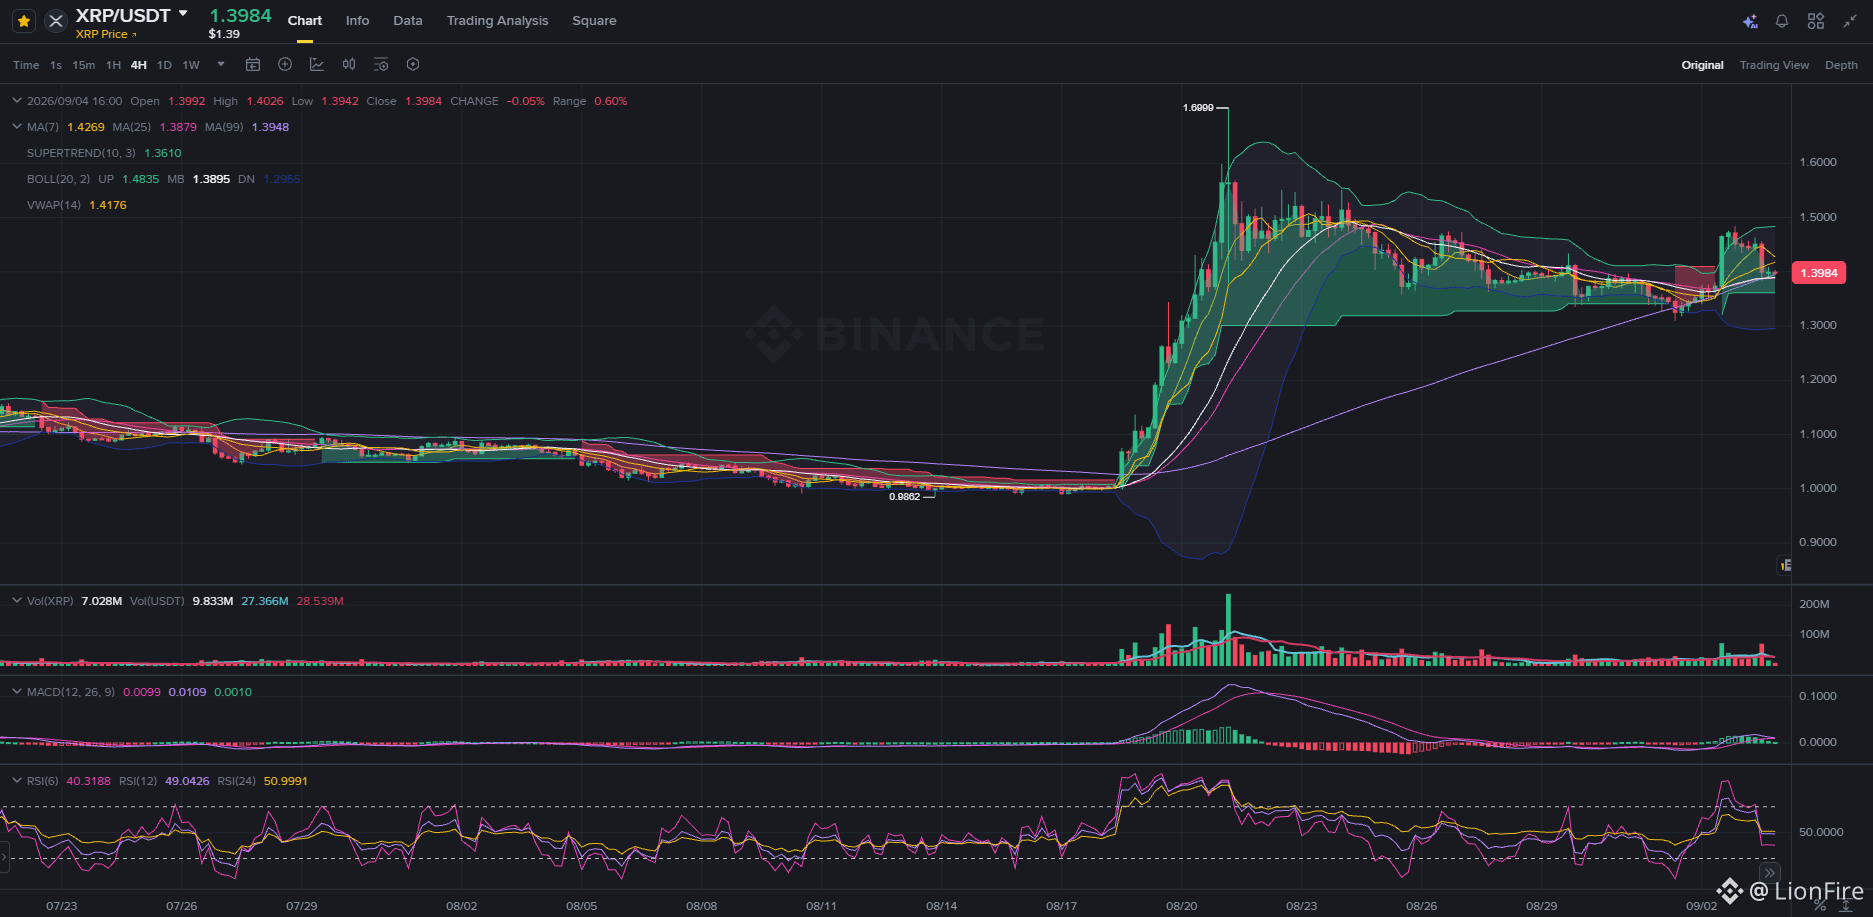
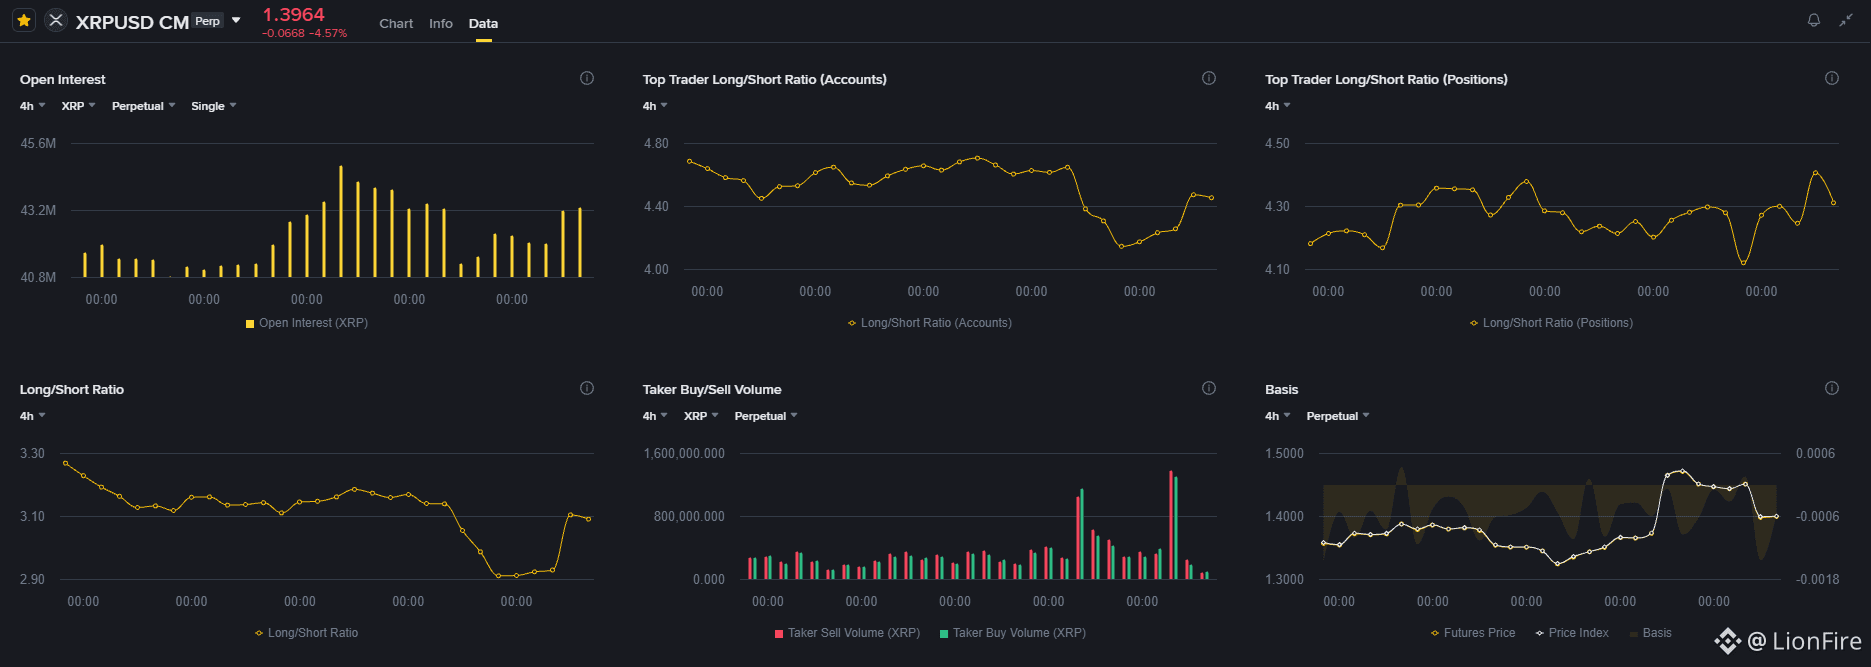
222
·
--
Bullish
#september #cryptotrading #MarketAnalysis
🍂 SEPTEMBER EFFECT 📊🎯
September carries the historical reputation of being the most challenging and corrective month in the financial calendar. With $BTC trading at $79,763.72 after being rejected in the $81.5k zone, the daily chart (1D) lays out three clear roadmaps for the monthly close:
🟢 1. Favorable Scenario (Green Line): Holding above $76,000
🛡️ It implies outstanding absorption of selling pressure. Bitcoin successfully defends the Bollinger mid-band ($75,831.09) and the VWAP ($78,621.35), turning August's former resistance into an unbreakable support.
🚀 It would completely nullify the month's negative seasonality, confirming that institutional demand is eager to attack new highs before the fourth quarter begins.
🟡 2. Base Scenario (Yellow Line): Consolidation around $70,000
⚖️ A controlled correction of 12% to 14% from local tops. Price seeks natural support in the confluence of the MA25 ($73,172.89), the Supertrend support ($72,310.90), and the psychological barrier of $70k.
🧘 It would perfectly follow September's classic script: a healthy purge of leverage and a reset of oscillators (cooling the RSI and decompressing the MACD) without compromising the broader uptrend at all.
🔴 3. Bearish Scenario (red line): Break of support below $65,000.
⚠️ A cascading loss of the MA99 ($66,318.40) and the lower Bollinger band ($66,106.74), pushing the price back into the summer accumulation range ($58k - $63k).
🩸 It would invalidate the recent breakout impulse and trigger a massive capital flight into liquidity, forcing the market to rebuild its floor over weeks.
💡 In trading, it is not about guessing which one will happen, but about having an execution plan for each level before price gets there. Tactical patience, capital management, and a cool head to navigate September! 🧠⚡
#september #cryptotrading #MarketAnalysis
🍂 SEPTEMBER EFFECT 📊🎯
September carries the historical reputation of being the most challenging and corrective month in the financial calendar. With $BTC trading at $79,763.72 after being rejected in the $81.5k zone, the daily chart (1D) lays out three clear roadmaps for the monthly close:
🟢 1. Favorable Scenario (Green Line): Holding above $76,000
🛡️ It implies outstanding absorption of selling pressure. Bitcoin successfully defends the Bollinger mid-band ($75,831.09) and the VWAP ($78,621.35), turning August's former resistance into an unbreakable support.
🚀 It would completely nullify the month's negative seasonality, confirming that institutional demand is eager to attack new highs before the fourth quarter begins.
🟡 2. Base Scenario (Yellow Line): Consolidation around $70,000
⚖️ A controlled correction of 12% to 14% from local tops. Price seeks natural support in the confluence of the MA25 ($73,172.89), the Supertrend support ($72,310.90), and the psychological barrier of $70k.
🧘 It would perfectly follow September's classic script: a healthy purge of leverage and a reset of oscillators (cooling the RSI and decompressing the MACD) without compromising the broader uptrend at all.
🔴 3. Bearish Scenario (red line): Break of support below $65,000.
⚠️ A cascading loss of the MA99 ($66,318.40) and the lower Bollinger band ($66,106.74), pushing the price back into the summer accumulation range ($58k - $63k).
🩸 It would invalidate the recent breakout impulse and trigger a massive capital flight into liquidity, forcing the market to rebuild its floor over weeks.
💡 In trading, it is not about guessing which one will happen, but about having an execution plan for each level before price gets there. Tactical patience, capital management, and a cool head to navigate September! 🧠⚡
🍂 SEPTEMBER EFFECT 📊🎯
September carries the historical reputation of being the most challenging and corrective month in the financial calendar. With $BTC trading at $79,763.72 after being rejected in the $81.5k zone, the daily chart (1D) lays out three clear roadmaps for the monthly close:
🟢 1. Favorable Scenario (Green Line): Holding above $76,000
🛡️ It implies outstanding absorption of selling pressure. Bitcoin successfully defends the Bollinger mid-band ($75,831.09) and the VWAP ($78,621.35), turning August's former resistance into an unbreakable support.
🚀 It would completely nullify the month's negative seasonality, confirming that institutional demand is eager to attack new highs before the fourth quarter begins.
🟡 2. Base Scenario (Yellow Line): Consolidation around $70,000
⚖️ A controlled correction of 12% to 14% from local tops. Price seeks natural support in the confluence of the MA25 ($73,172.89), the Supertrend support ($72,310.90), and the psychological barrier of $70k.
🧘 It would perfectly follow September's classic script: a healthy purge of leverage and a reset of oscillators (cooling the RSI and decompressing the MACD) without compromising the broader uptrend at all.
🔴 3. Bearish Scenario (red line): Break of support below $65,000.
⚠️ A cascading loss of the MA99 ($66,318.40) and the lower Bollinger band ($66,106.74), pushing the price back into the summer accumulation range ($58k - $63k).
🩸 It would invalidate the recent breakout impulse and trigger a massive capital flight into liquidity, forcing the market to rebuild its floor over weeks.
💡 In trading, it is not about guessing which one will happen, but about having an execution plan for each level before price gets there. Tactical patience, capital management, and a cool head to navigate September! 🧠⚡
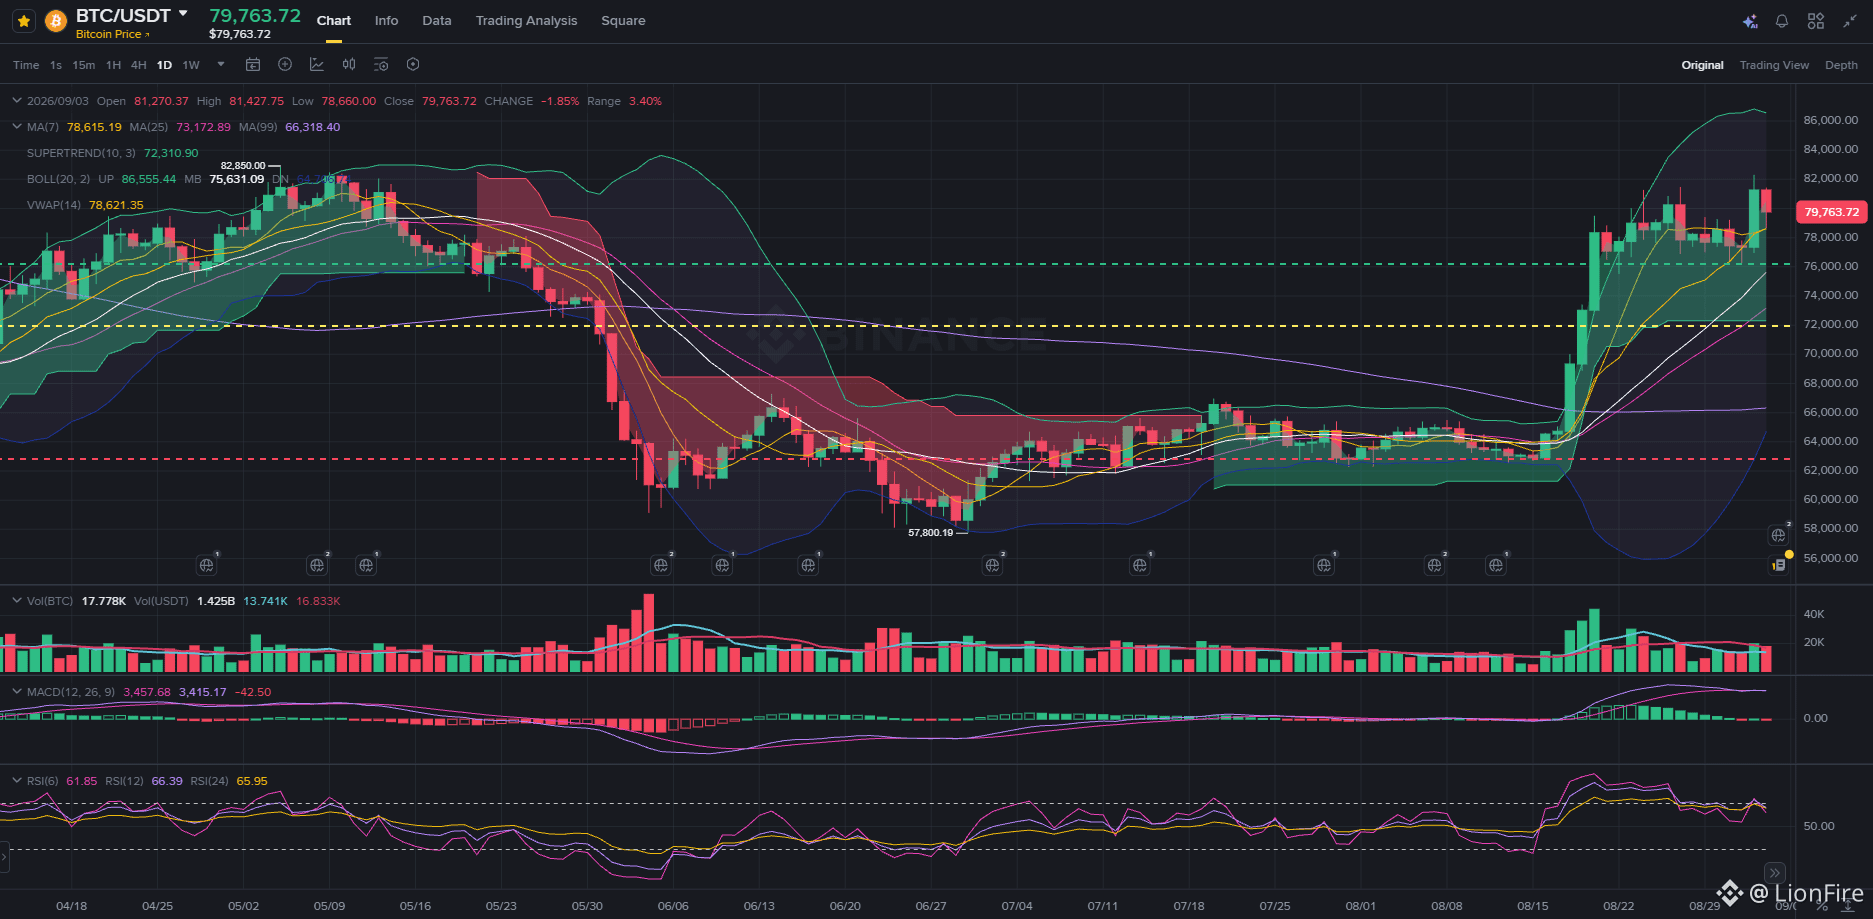
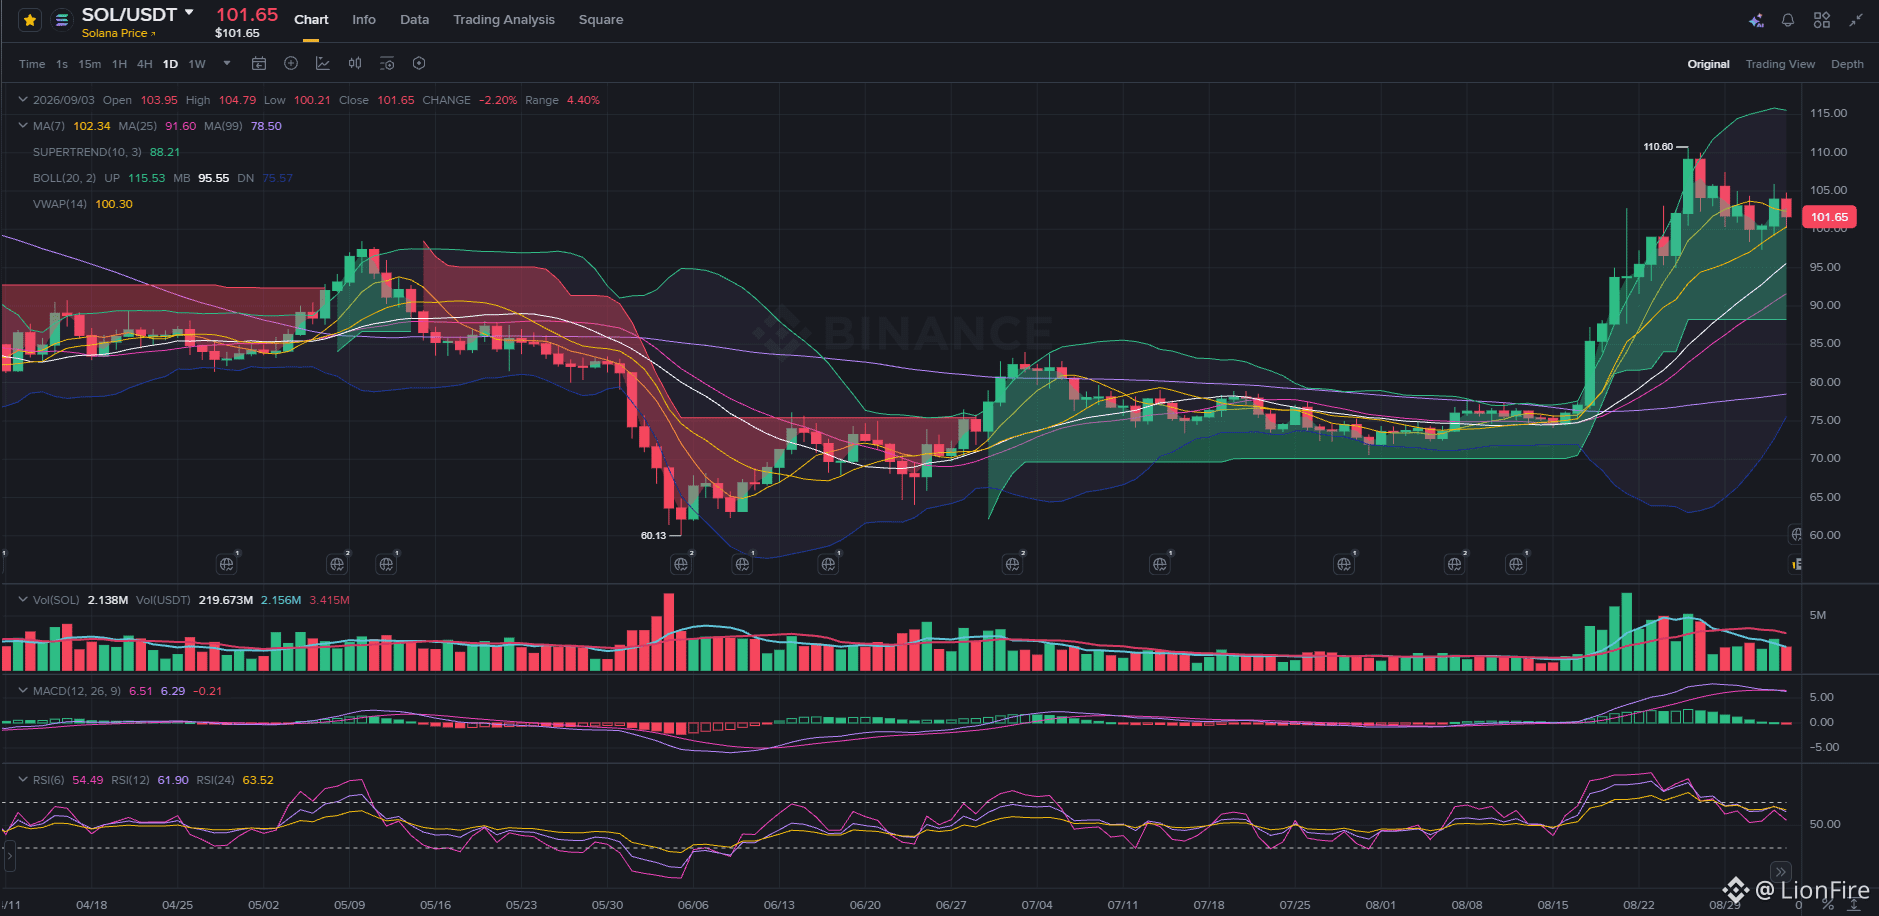
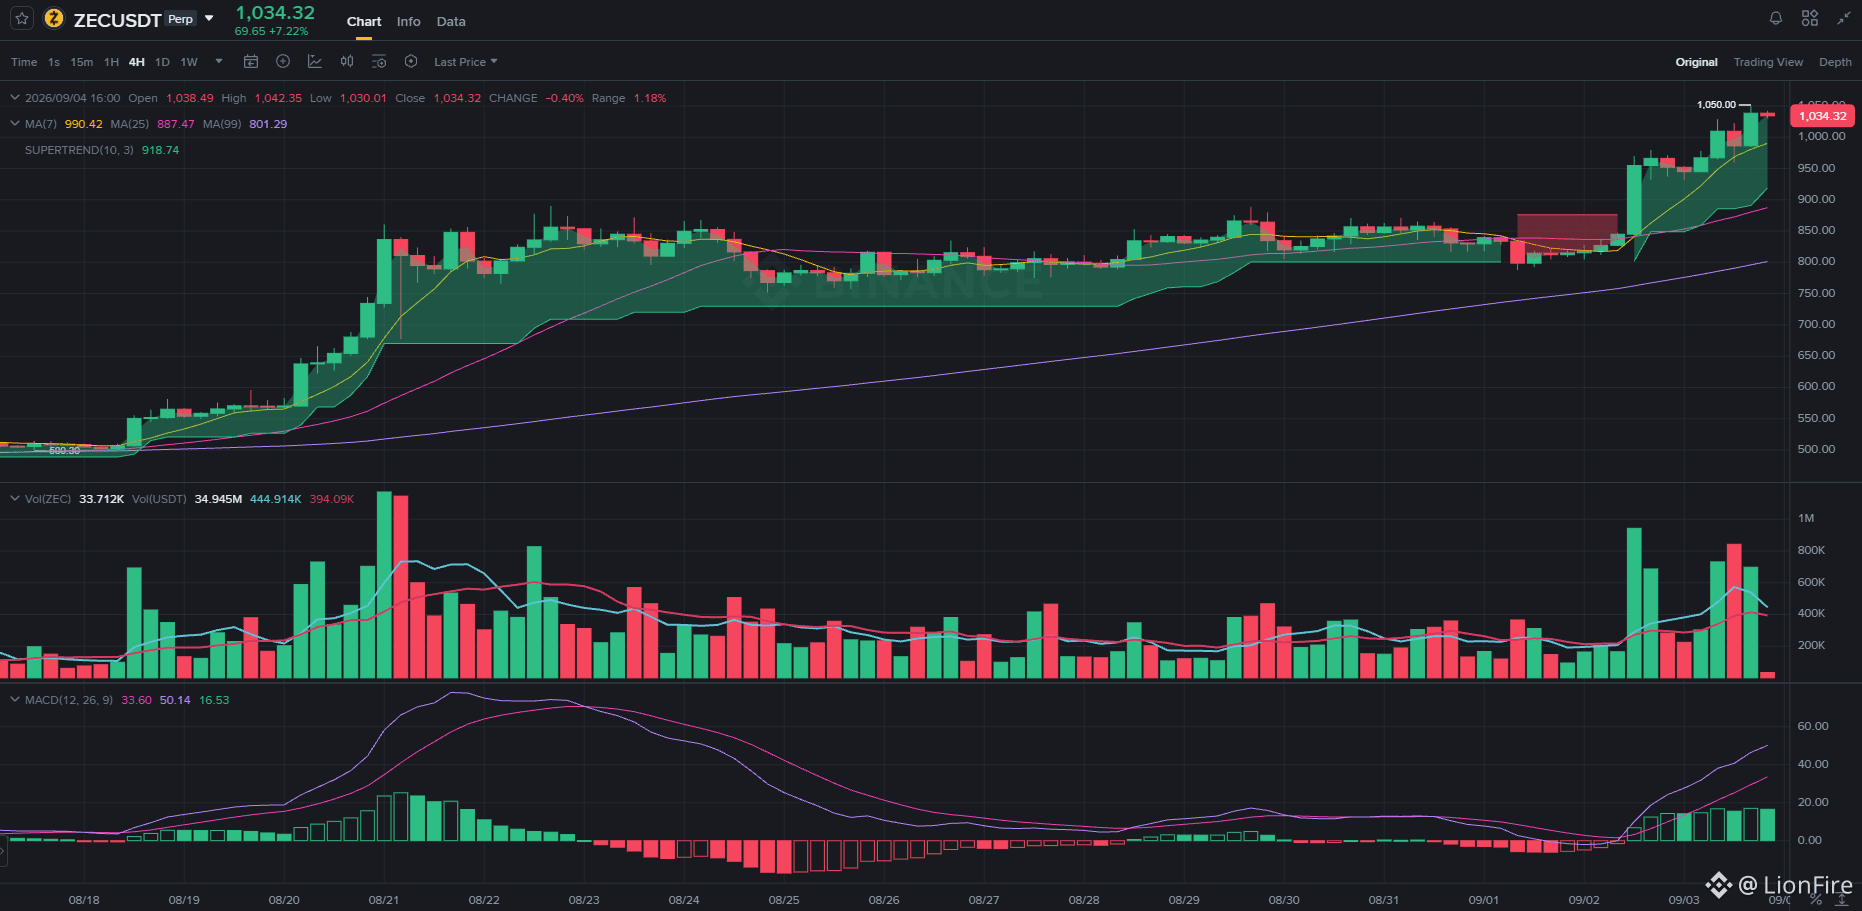
137
·
--
Bullish
#zcash #BTC #cryptotrading
🛡️ THE EXTREME DECOUPLING OF ZEC ($1,021): Why is Zcash soaring against the tide while BTC consolidates? 🚀🔥
Breaking through the $1,000 barrier and hitting an intraday peak of $1,050.00 with more than $151.9M USDT in volume in just one hour does not happen by chance. While $BTC ($79,584.89) digests the macroeconomic shock and struggles to reclaim the VWAP ($80,084), $ZEC is starring in one of the market's biggest bullish anomalies.
⚙️ 1. Monetary physics: illiquidity and strict scarcity
🔒 Choked floating supply: Zcash shares Bitcoin's strict 21 million issuance cap, but with a massive portion of its circulating supply locked in private addresses (shielded pools). With order books dry, any influx of capital triggers an immediate supply shock.
🕵️ Mathematical privacy: As financial and regulatory control tightens, zero-knowledge proof technology (zk-SNARKs) is shifting from being seen as a niche to being valued as an irreplaceable tool of sovereignty.
📊 2. Technical snapshot on 1H:
🚀 Parabolic structure: The price rides confidently above the MA7 ($999.60), keeping a massive gap from the MA25 ($972.23), the MA99 ($871.08) and the Supertrend support ($944.03).
💥 Relentless short squeeze: Every attempt to open short positions to call tops in the $950 - $1,000 range only fed the fire; forced liquidations catapulted the price toward $1,050.
📈 Divergence versus the market: While BTC shows heaviness with MACD in negative territory after the morning whip-saw, ZEC displays devastating momentum (+29.26 in MACD).
🎯 When money rests in large-cap leaders, aggressive liquidity rotates toward projects with reduced float and tangible utility. Those already positioned should trail with stops; those watching from the sidelines should remember not to chase parabolic impulses without waiting for a prior consolidation.
#zcash #BTC #cryptotrading
🛡️ THE EXTREME DECOUPLING OF ZEC ($1,021): Why is Zcash soaring against the tide while BTC consolidates? 🚀🔥
Breaking through the $1,000 barrier and hitting an intraday peak of $1,050.00 with more than $151.9M USDT in volume in just one hour does not happen by chance. While $BTC ($79,584.89) digests the macroeconomic shock and struggles to reclaim the VWAP ($80,084), $ZEC is starring in one of the market's biggest bullish anomalies.
⚙️ 1. Monetary physics: illiquidity and strict scarcity
🔒 Choked floating supply: Zcash shares Bitcoin's strict 21 million issuance cap, but with a massive portion of its circulating supply locked in private addresses (shielded pools). With order books dry, any influx of capital triggers an immediate supply shock.
🕵️ Mathematical privacy: As financial and regulatory control tightens, zero-knowledge proof technology (zk-SNARKs) is shifting from being seen as a niche to being valued as an irreplaceable tool of sovereignty.
📊 2. Technical snapshot on 1H:
🚀 Parabolic structure: The price rides confidently above the MA7 ($999.60), keeping a massive gap from the MA25 ($972.23), the MA99 ($871.08) and the Supertrend support ($944.03).
💥 Relentless short squeeze: Every attempt to open short positions to call tops in the $950 - $1,000 range only fed the fire; forced liquidations catapulted the price toward $1,050.
📈 Divergence versus the market: While BTC shows heaviness with MACD in negative territory after the morning whip-saw, ZEC displays devastating momentum (+29.26 in MACD).
🎯 When money rests in large-cap leaders, aggressive liquidity rotates toward projects with reduced float and tangible utility. Those already positioned should trail with stops; those watching from the sidelines should remember not to chase parabolic impulses without waiting for a prior consolidation.
🛡️ THE EXTREME DECOUPLING OF ZEC ($1,021): Why is Zcash soaring against the tide while BTC consolidates? 🚀🔥
Breaking through the $1,000 barrier and hitting an intraday peak of $1,050.00 with more than $151.9M USDT in volume in just one hour does not happen by chance. While $BTC ($79,584.89) digests the macroeconomic shock and struggles to reclaim the VWAP ($80,084), $ZEC is starring in one of the market's biggest bullish anomalies.
⚙️ 1. Monetary physics: illiquidity and strict scarcity
🔒 Choked floating supply: Zcash shares Bitcoin's strict 21 million issuance cap, but with a massive portion of its circulating supply locked in private addresses (shielded pools). With order books dry, any influx of capital triggers an immediate supply shock.
🕵️ Mathematical privacy: As financial and regulatory control tightens, zero-knowledge proof technology (zk-SNARKs) is shifting from being seen as a niche to being valued as an irreplaceable tool of sovereignty.
📊 2. Technical snapshot on 1H:
🚀 Parabolic structure: The price rides confidently above the MA7 ($999.60), keeping a massive gap from the MA25 ($972.23), the MA99 ($871.08) and the Supertrend support ($944.03).
💥 Relentless short squeeze: Every attempt to open short positions to call tops in the $950 - $1,000 range only fed the fire; forced liquidations catapulted the price toward $1,050.
📈 Divergence versus the market: While BTC shows heaviness with MACD in negative territory after the morning whip-saw, ZEC displays devastating momentum (+29.26 in MACD).
🎯 When money rests in large-cap leaders, aggressive liquidity rotates toward projects with reduced float and tangible utility. Those already positioned should trail with stops; those watching from the sidelines should remember not to chase parabolic impulses without waiting for a prior consolidation.
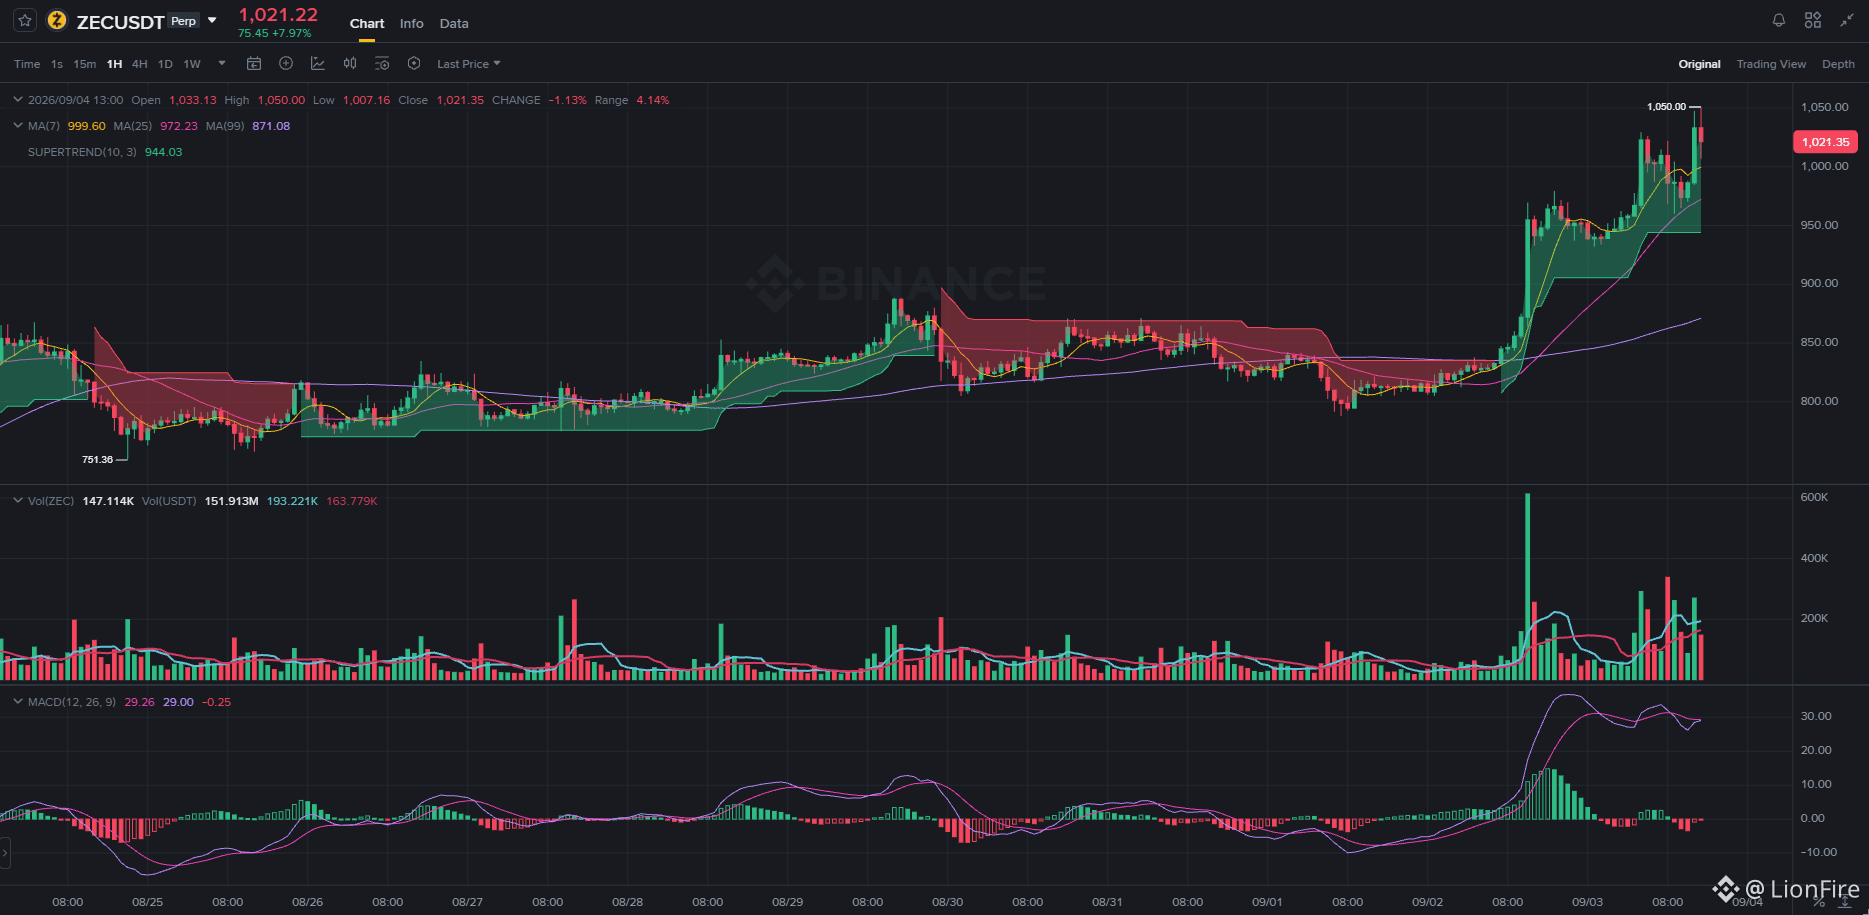
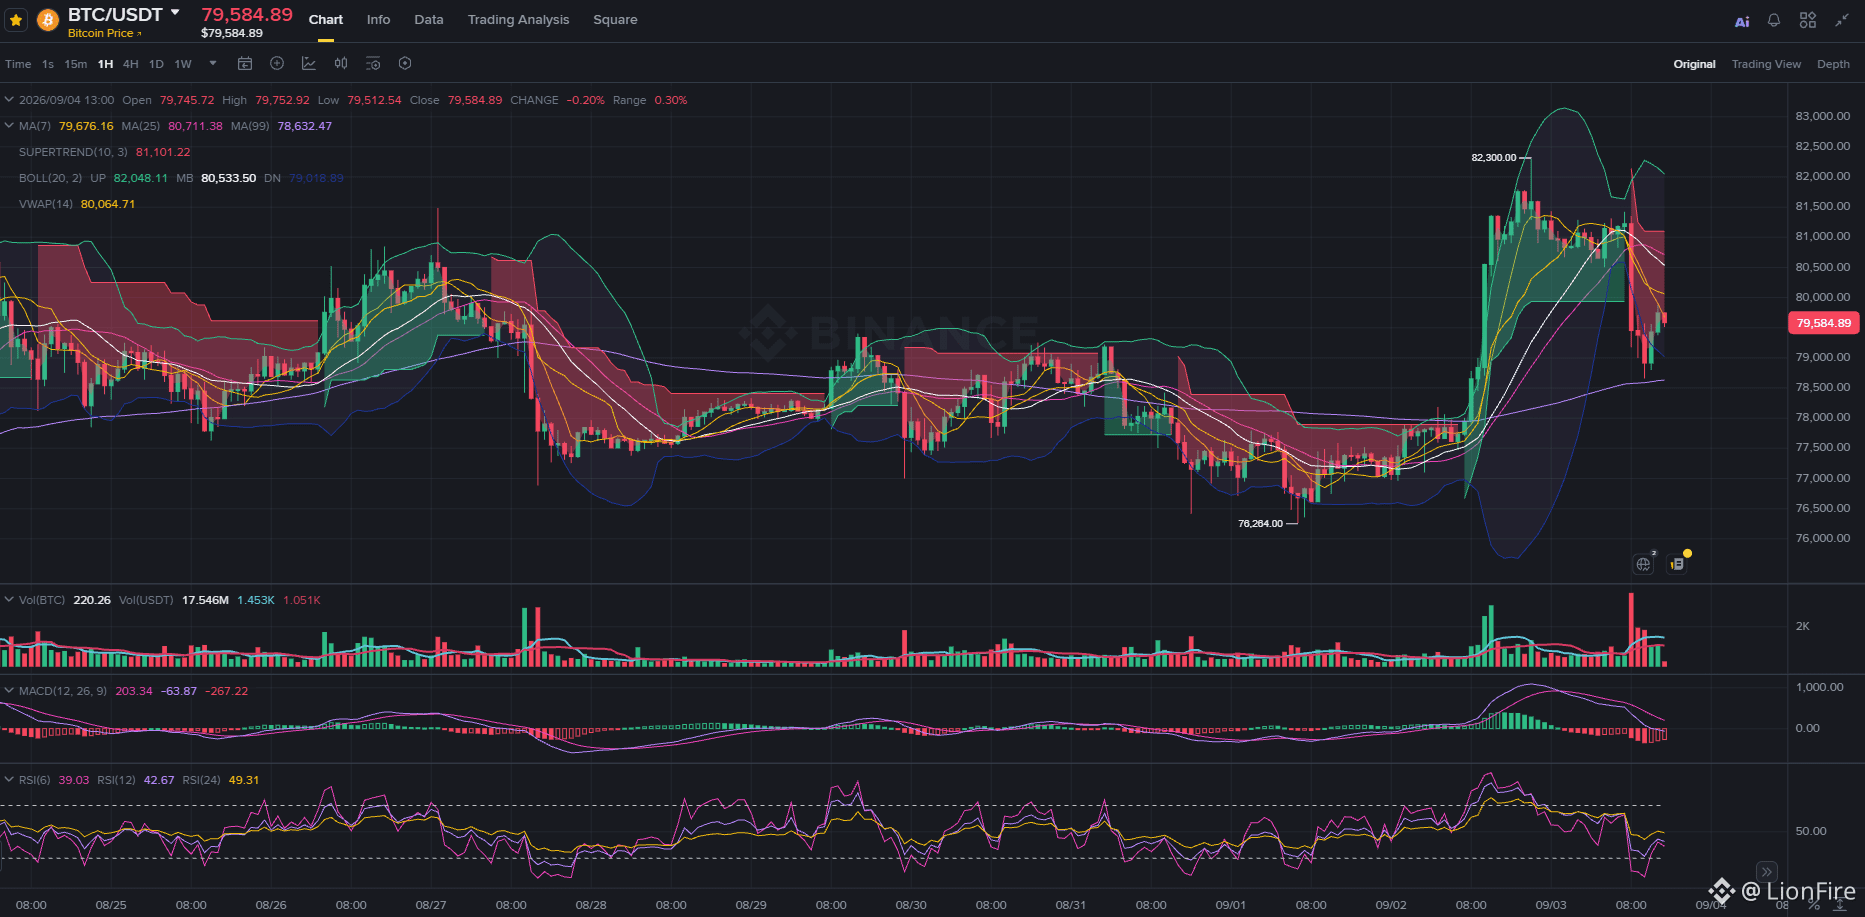
233
Log in to explore more content
Join global crypto users on Binance Square
⚡️ Get latest and useful information about crypto.
💬 Trusted by the world’s largest crypto exchange.
👍 Discover real insights from verified creators.
Email / Phone number