

老朝奉研究院
108 Posts

老朝奉研究院
Report
Block User
老朝奉研究院:洞察周期,发现价值。 手续费8折邀请码: LCFYJY 私信进VIP群
Open Trade
Frequent Trader
4.4 Months
8 Following
542 Followers
330 Liked
Posts
Portfolio
PINNED
·
--
Bullish
The Old Dynasty Research Institute is officially open to the public, welcome everyone to follow us.
Old Dynasty Research Institute: Insight into cycles, discover value.
Trading fee 20% off with invite code: LCFYJY DM to join the VIP group.
{future}(BTCUSDT)
The Old Dynasty Research Institute is officially open to the public, welcome everyone to follow us.
Old Dynasty Research Institute: Insight into cycles, discover value.
Trading fee 20% off with invite code: LCFYJY DM to join the VIP group.
Old Dynasty Research Institute: Insight into cycles, discover value.
Trading fee 20% off with invite code: LCFYJY DM to join the VIP group.

1
6
54
·
--
$BTC is still hovering around 80,000, while $ARB has already surged more than 40%+
$BTC has also been consolidating around 80,000 these past two days, while ARB once rose more than 40% today.
This rally is not just a normal catch-up move. Recently, Robinhood Chain’s activity has clearly increased, and its underlying technology is Arbitrum, so the market has begun to refocus on the actual usage and revenue potential of ARB’s infrastructure.
For BTC to keep pushing higher at this level, it needs a much larger amount of capital. By comparison, coins like ARB, with a smaller market cap and fresh catalysts, tend to show more price elasticity when funds flow in 집중ly.
So this move is closer to ARB being repriced based on its own logic, while BTC’s sideways movement merely gave altcoins more room to perform.
#BTC #ARB
$BTC is still hovering around 80,000, while $ARB has already surged more than 40%+
$BTC has also been consolidating around 80,000 these past two days, while ARB once rose more than 40% today.
This rally is not just a normal catch-up move. Recently, Robinhood Chain’s activity has clearly increased, and its underlying technology is Arbitrum, so the market has begun to refocus on the actual usage and revenue potential of ARB’s infrastructure.
For BTC to keep pushing higher at this level, it needs a much larger amount of capital. By comparison, coins like ARB, with a smaller market cap and fresh catalysts, tend to show more price elasticity when funds flow in 집중ly.
So this move is closer to ARB being repriced based on its own logic, while BTC’s sideways movement merely gave altcoins more room to perform.
#BTC #ARB
$BTC has also been consolidating around 80,000 these past two days, while ARB once rose more than 40% today.
This rally is not just a normal catch-up move. Recently, Robinhood Chain’s activity has clearly increased, and its underlying technology is Arbitrum, so the market has begun to refocus on the actual usage and revenue potential of ARB’s infrastructure.
For BTC to keep pushing higher at this level, it needs a much larger amount of capital. By comparison, coins like ARB, with a smaller market cap and fresh catalysts, tend to show more price elasticity when funds flow in 집중ly.
So this move is closer to ARB being repriced based on its own logic, while BTC’s sideways movement merely gave altcoins more room to perform.
#BTC #ARB


1
463
·
--
$BTC Just finished rushing through 80,000; the start of September is starting to feel a bit harder
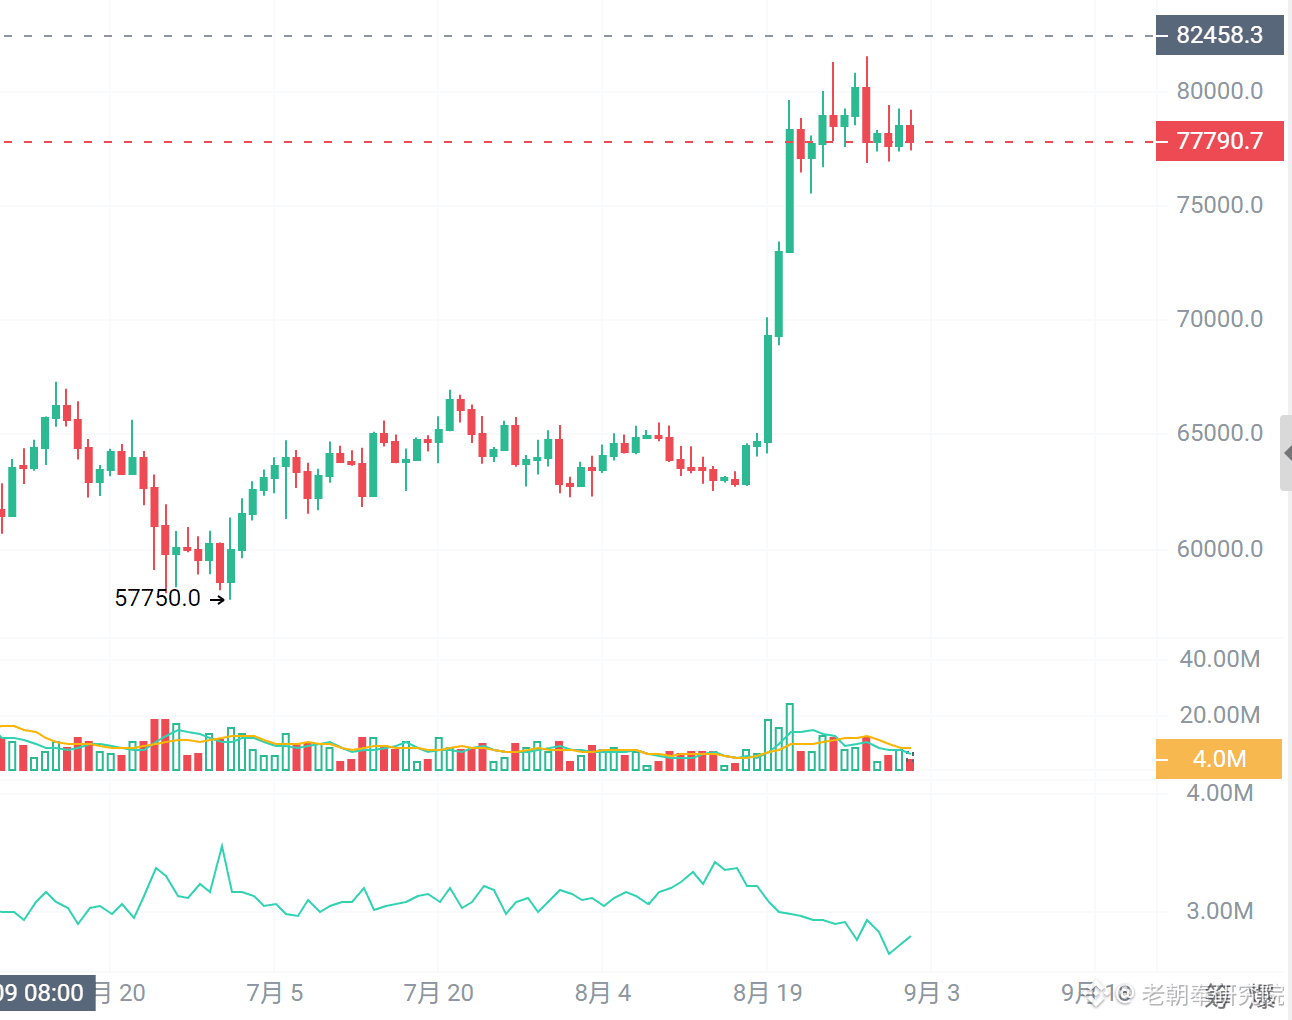
$BTC This run started from a little over 60,000 and was pulled up to around 80,000. The gains in the early part were fast, but over the past few days it has clearly begun to bounce repeatedly at high levels. Today it has also returned to around 77,000.
This round of pressure mainly comes from the macro side. Oil prices are rising again, U.S. Treasury yields are moving higher, and expectations that the Fed will continue tightening in September are also heating up. The liquidity expectations that previously drove BTC higher are starting to face some downside pressure in the short term.
From the daily chart, BTC has not yet given back this rally; the overall bullish structure is still intact, but it’s temporarily not as easy above 80,000. If macro data remains tight in September, this stretch will most likely first trade in a range. Whether it can continue pushing higher will depend on whether the following capital can keep stepping in.
#BTC
$BTC Just finished rushing through 80,000; the start of September is starting to feel a bit harder
$BTC This run started from a little over 60,000 and was pulled up to around 80,000. The gains in the early part were fast, but over the past few days it has clearly begun to bounce repeatedly at high levels. Today it has also returned to around 77,000.
This round of pressure mainly comes from the macro side. Oil prices are rising again, U.S. Treasury yields are moving higher, and expectations that the Fed will continue tightening in September are also heating up. The liquidity expectations that previously drove BTC higher are starting to face some downside pressure in the short term.
From the daily chart, BTC has not yet given back this rally; the overall bullish structure is still intact, but it’s temporarily not as easy above 80,000. If macro data remains tight in September, this stretch will most likely first trade in a range. Whether it can continue pushing higher will depend on whether the following capital can keep stepping in.
#BTC
$BTC This run started from a little over 60,000 and was pulled up to around 80,000. The gains in the early part were fast, but over the past few days it has clearly begun to bounce repeatedly at high levels. Today it has also returned to around 77,000.
This round of pressure mainly comes from the macro side. Oil prices are rising again, U.S. Treasury yields are moving higher, and expectations that the Fed will continue tightening in September are also heating up. The liquidity expectations that previously drove BTC higher are starting to face some downside pressure in the short term.
From the daily chart, BTC has not yet given back this rally; the overall bullish structure is still intact, but it’s temporarily not as easy above 80,000. If macro data remains tight in September, this stretch will most likely first trade in a range. Whether it can continue pushing higher will depend on whether the following capital can keep stepping in.
#BTC
1
287
·
--
Verified
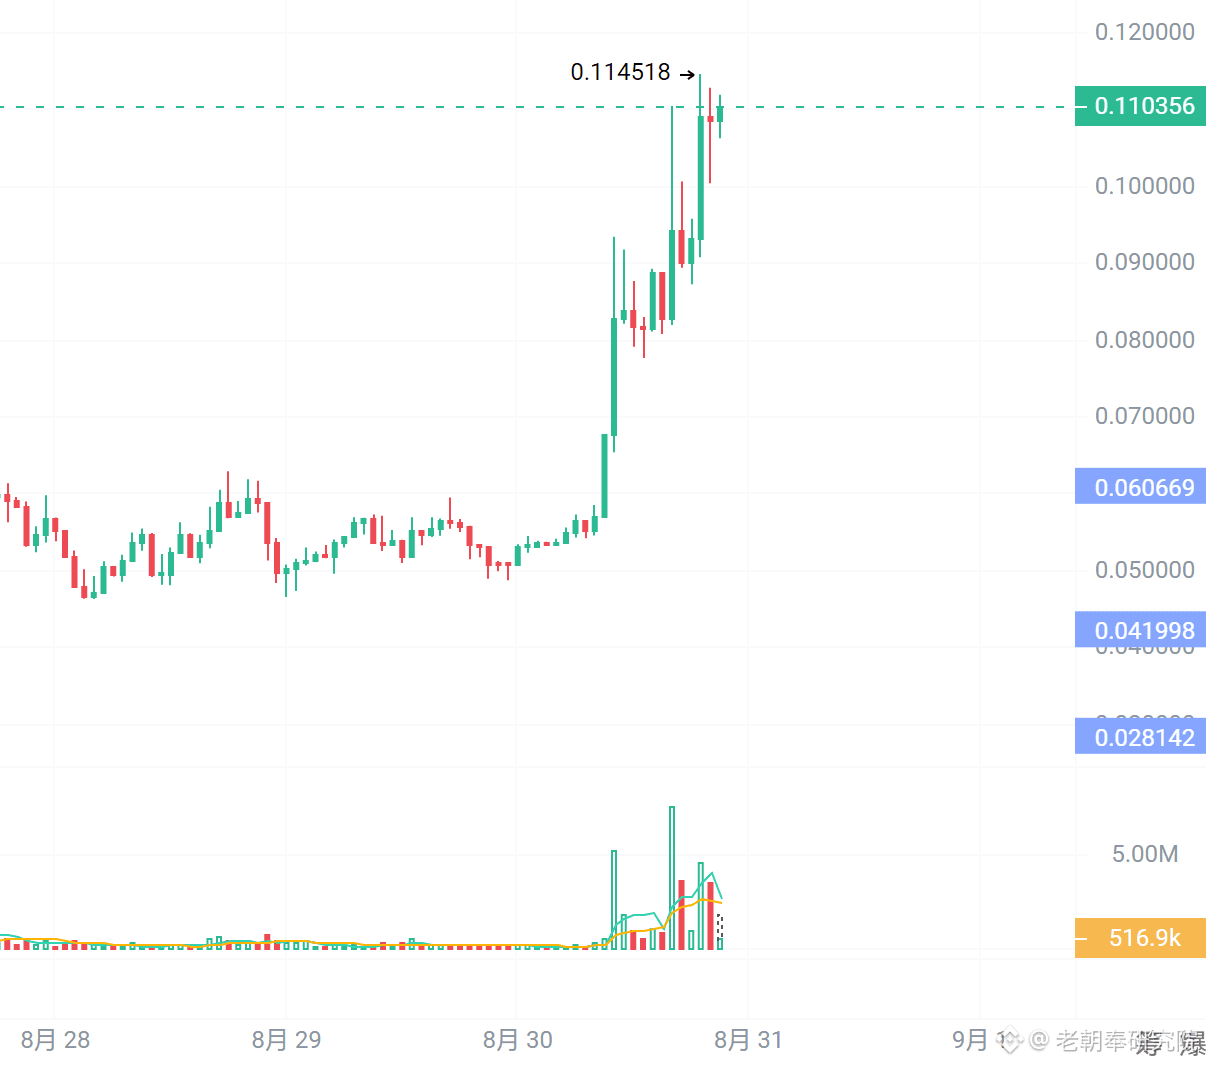
$牛来 This morning around 10:00, it rapidly surged from around 0.05 to above 0.09, with a peak of approximately 0.092. The on-chain monitoring is particularly noteworthy in that after the market started, two related addresses continued to buy again near a market cap of about $86 million, with a total投入 of about $1.51 million, purchasing 17.56 million 牛来 (NiuLai) tokens.
Even more interesting is that a few hours later, Binance officially announced the listing of the NiuLai USDT perpetual contract. There is currently no evidence that this funding learned the news in advance, but with prices already having surged, there were still million-dollar-level funds that kept chasing in—and then waited for the Binance contract. This timing alone is very likely to further reinforce market expectations.
$牛来 Now, its value is not just a Meme catchphrase by itself. Continuous participation by large funds, exposure of Alpha, and then access through Binance contracts indicate that it has gradually evolved from a purely on-chain speculation play into a target that larger ranges of capital can also participate in. After the contract goes live, long/short, hedging, and arbitrage funds will all come in, liquidity will increase, but volatility and the intensity of the game will also be higher than before.
How much further NiuLai can run will depend on whether new funds can keep coming in, and whether the hype after the contract launch can be sustained.
#牛来
$牛来 This morning around 10:00, it rapidly surged from around 0.05 to above 0.09, with a peak of approximately 0.092. The on-chain monitoring is particularly noteworthy in that after the market started, two related addresses continued to buy again near a market cap of about $86 million, with a total投入 of about $1.51 million, purchasing 17.56 million 牛来 (NiuLai) tokens.
Even more interesting is that a few hours later, Binance officially announced the listing of the NiuLai USDT perpetual contract. There is currently no evidence that this funding learned the news in advance, but with prices already having surged, there were still million-dollar-level funds that kept chasing in—and then waited for the Binance contract. This timing alone is very likely to further reinforce market expectations.
$牛来 Now, its value is not just a Meme catchphrase by itself. Continuous participation by large funds, exposure of Alpha, and then access through Binance contracts indicate that it has gradually evolved from a purely on-chain speculation play into a target that larger ranges of capital can also participate in. After the contract goes live, long/short, hedging, and arbitrage funds will all come in, liquidity will increase, but volatility and the intensity of the game will also be higher than before.
How much further NiuLai can run will depend on whether new funds can keep coming in, and whether the hype after the contract launch can be sustained.
#牛来
Even more interesting is that a few hours later, Binance officially announced the listing of the NiuLai USDT perpetual contract. There is currently no evidence that this funding learned the news in advance, but with prices already having surged, there were still million-dollar-level funds that kept chasing in—and then waited for the Binance contract. This timing alone is very likely to further reinforce market expectations.
$牛来 Now, its value is not just a Meme catchphrase by itself. Continuous participation by large funds, exposure of Alpha, and then access through Binance contracts indicate that it has gradually evolved from a purely on-chain speculation play into a target that larger ranges of capital can also participate in. After the contract goes live, long/short, hedging, and arbitrage funds will all come in, liquidity will increase, but volatility and the intensity of the game will also be higher than before.
How much further NiuLai can run will depend on whether new funds can keep coming in, and whether the hype after the contract launch can be sustained.
#牛来
2
1.1k
·
--
$BTC —does this move really count as a “bull comeback”?
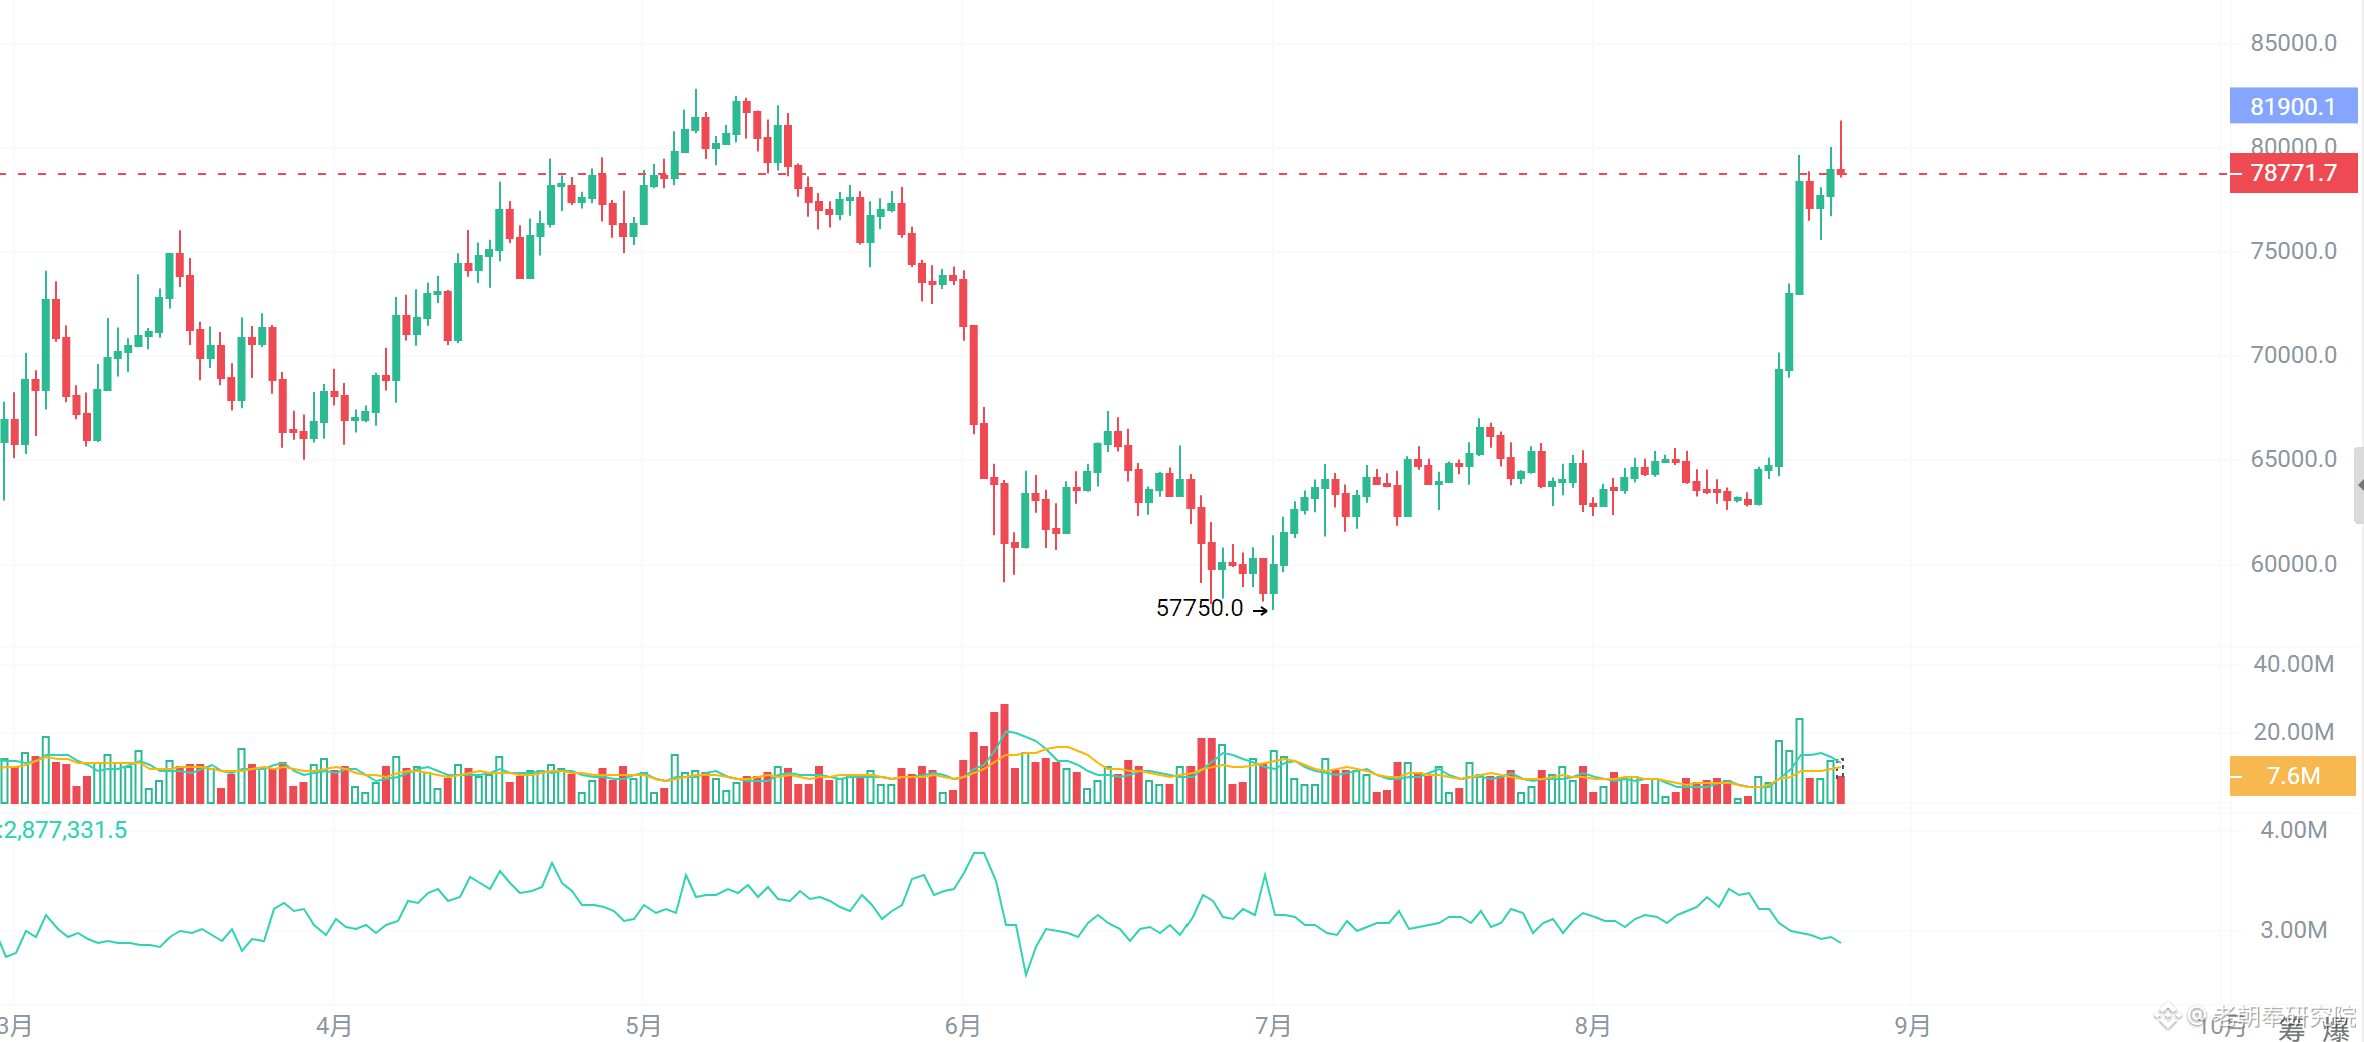
Over the past few days, $BTC has been pulled from just over 60,000 all the way to around 80,000. Today’s high has already touched above 81,000. From the chart structure, most of the losses since June have essentially been recovered. The range between 62,000 and 66,000, which had been grinding for more than a month, was also broken out of directly on increased volume.
This move isn’t just a pretty K-line.
After the U.S. long-term Treasury repo expanded, U.S. bond yields fell and the U.S. dollar weakened, and $BTC began to accelerate noticeably. Last week, U.S. spot BTC and ETH ETFs combined saw net inflows of about $2.6 billion. Add that to the roughly $4 billion worth of short positions that were squeezed out earlier, and these forces together pushed the market higher.
So now, saying “bull comeback” has more confidence than a few days ago. But 80,000–82,000 is also exactly the prior high-level zone. After today’s push up, it quickly returned to around 78,000. For the short term, I’m more inclined to expect consolidation here—and even a pullback—before going higher. A straight, nonstop rally upward isn’t as easy.
As long as it doesn’t get dumped back down toward the 72,000 area, which was the breakout platform this time, I still lean bullish on the overall structure. If it can really absorb the 82,000 area and hold there, then this cycle’s nature would be more like a return to an uptrend, rather than just a single large-scale rebound.
#BTC
$BTC —does this move really count as a “bull comeback”?
Over the past few days, $BTC has been pulled from just over 60,000 all the way to around 80,000. Today’s high has already touched above 81,000. From the chart structure, most of the losses since June have essentially been recovered. The range between 62,000 and 66,000, which had been grinding for more than a month, was also broken out of directly on increased volume.
This move isn’t just a pretty K-line.
After the U.S. long-term Treasury repo expanded, U.S. bond yields fell and the U.S. dollar weakened, and $BTC began to accelerate noticeably. Last week, U.S. spot BTC and ETH ETFs combined saw net inflows of about $2.6 billion. Add that to the roughly $4 billion worth of short positions that were squeezed out earlier, and these forces together pushed the market higher.
So now, saying “bull comeback” has more confidence than a few days ago. But 80,000–82,000 is also exactly the prior high-level zone. After today’s push up, it quickly returned to around 78,000. For the short term, I’m more inclined to expect consolidation here—and even a pullback—before going higher. A straight, nonstop rally upward isn’t as easy.
As long as it doesn’t get dumped back down toward the 72,000 area, which was the breakout platform this time, I still lean bullish on the overall structure. If it can really absorb the 82,000 area and hold there, then this cycle’s nature would be more like a return to an uptrend, rather than just a single large-scale rebound.
#BTC
Over the past few days, $BTC has been pulled from just over 60,000 all the way to around 80,000. Today’s high has already touched above 81,000. From the chart structure, most of the losses since June have essentially been recovered. The range between 62,000 and 66,000, which had been grinding for more than a month, was also broken out of directly on increased volume.
This move isn’t just a pretty K-line.
After the U.S. long-term Treasury repo expanded, U.S. bond yields fell and the U.S. dollar weakened, and $BTC began to accelerate noticeably. Last week, U.S. spot BTC and ETH ETFs combined saw net inflows of about $2.6 billion. Add that to the roughly $4 billion worth of short positions that were squeezed out earlier, and these forces together pushed the market higher.
So now, saying “bull comeback” has more confidence than a few days ago. But 80,000–82,000 is also exactly the prior high-level zone. After today’s push up, it quickly returned to around 78,000. For the short term, I’m more inclined to expect consolidation here—and even a pullback—before going higher. A straight, nonstop rally upward isn’t as easy.
As long as it doesn’t get dumped back down toward the 72,000 area, which was the breakout platform this time, I still lean bullish on the overall structure. If it can really absorb the 82,000 area and hold there, then this cycle’s nature would be more like a return to an uptrend, rather than just a single large-scale rebound.
#BTC
1
219
·
--
Fake afternoon collective pullback, with liquidations over $1.2B in 24 hours
This afternoon at 13:00, the crypto market saw a clear round of decline. $BTC pulled back from its previous high near $79,000, and altcoins such as $ETH , $SOL , $XRP, and $DOGE all dropped sharply as well—more importantly, many altcoins saw short-term losses noticeably larger than BTC.
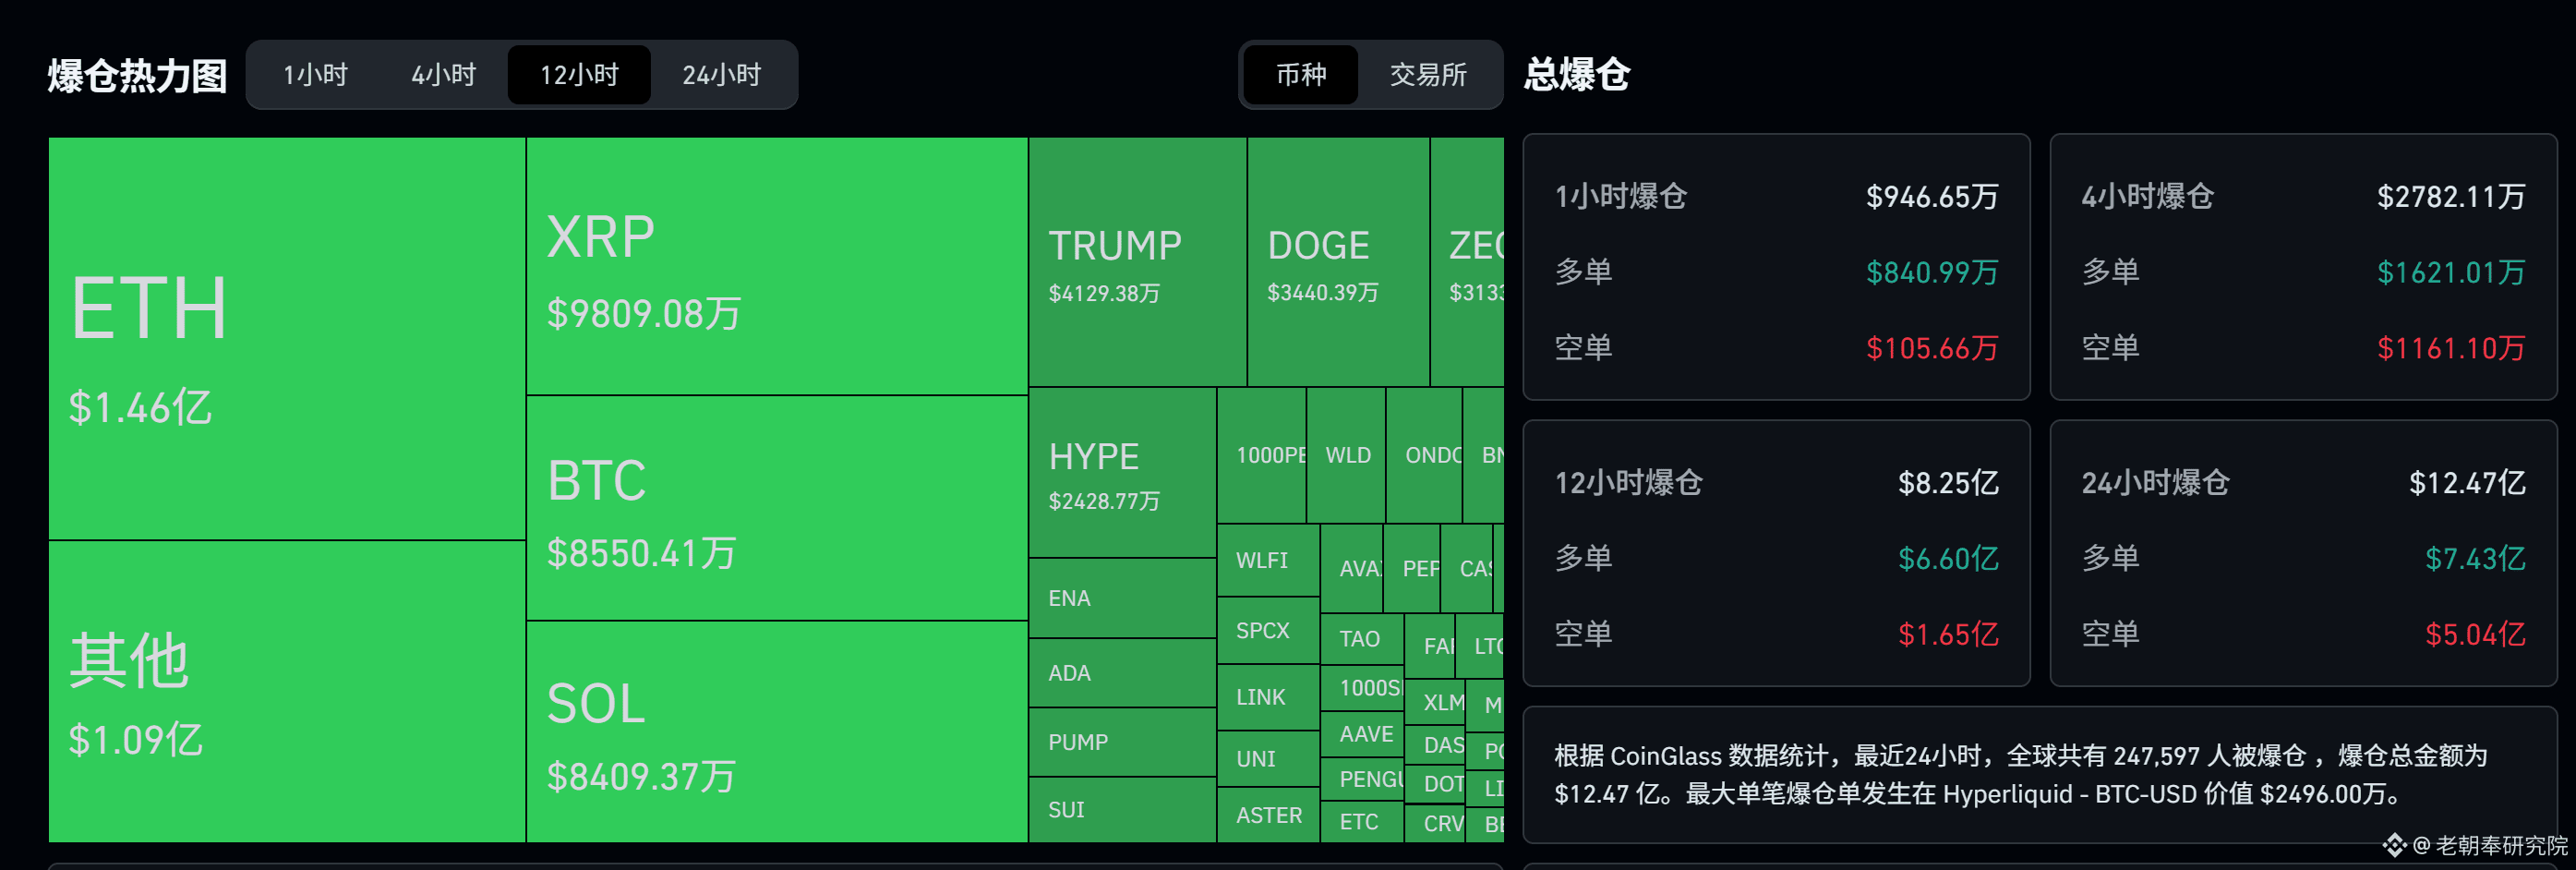
According to CoinGlass’s latest data, in the past 24 hours total liquidations across the entire network were about $1.247 billion, including roughly $743 million in long positions. $ETH, $XRP, $BTC, $SOL, $DOGE, and others all experienced large-scale liquidations. After the rapid rally in the past few days, leveraged positions that had built up began to unwind in a concentrated manner. This move today looks more like a concentrated pullback following the rapid rise earlier. As BTC fell from a high level, losses on the altcoin side were further amplified. The mass liquidation of large numbers of long positions in a short time also indicates that leverage in the market has become relatively high after this rally. #BTC #ETH
Fake afternoon collective pullback, with liquidations over $1.2B in 24 hours
This afternoon at 13:00, the crypto market saw a clear round of decline. $BTC pulled back from its previous high near $79,000, and altcoins such as $ETH , $SOL , $XRP, and $DOGE all dropped sharply as well—more importantly, many altcoins saw short-term losses noticeably larger than BTC.
According to CoinGlass’s latest data, in the past 24 hours total liquidations across the entire network were about $1.247 billion, including roughly $743 million in long positions. $ETH , $XRP, $BTC, $SOL , $DOGE, and others all experienced large-scale liquidations. After the rapid rally in the past few days, leveraged positions that had built up began to unwind in a concentrated manner. This move today looks more like a concentrated pullback following the rapid rise earlier. As BTC fell from a high level, losses on the altcoin side were further amplified. The mass liquidation of large numbers of long positions in a short time also indicates that leverage in the market has become relatively high after this rally. #BTC #ETH
This afternoon at 13:00, the crypto market saw a clear round of decline. $BTC pulled back from its previous high near $79,000, and altcoins such as $ETH , $SOL , $XRP, and $DOGE all dropped sharply as well—more importantly, many altcoins saw short-term losses noticeably larger than BTC.
According to CoinGlass’s latest data, in the past 24 hours total liquidations across the entire network were about $1.247 billion, including roughly $743 million in long positions. $ETH , $XRP, $BTC, $SOL , $DOGE, and others all experienced large-scale liquidations. After the rapid rally in the past few days, leveraged positions that had built up began to unwind in a concentrated manner. This move today looks more like a concentrated pullback following the rapid rise earlier. As BTC fell from a high level, losses on the altcoin side were further amplified. The mass liquidation of large numbers of long positions in a short time also indicates that leverage in the market has become relatively high after this rally. #BTC #ETH
2
2
925
·
--
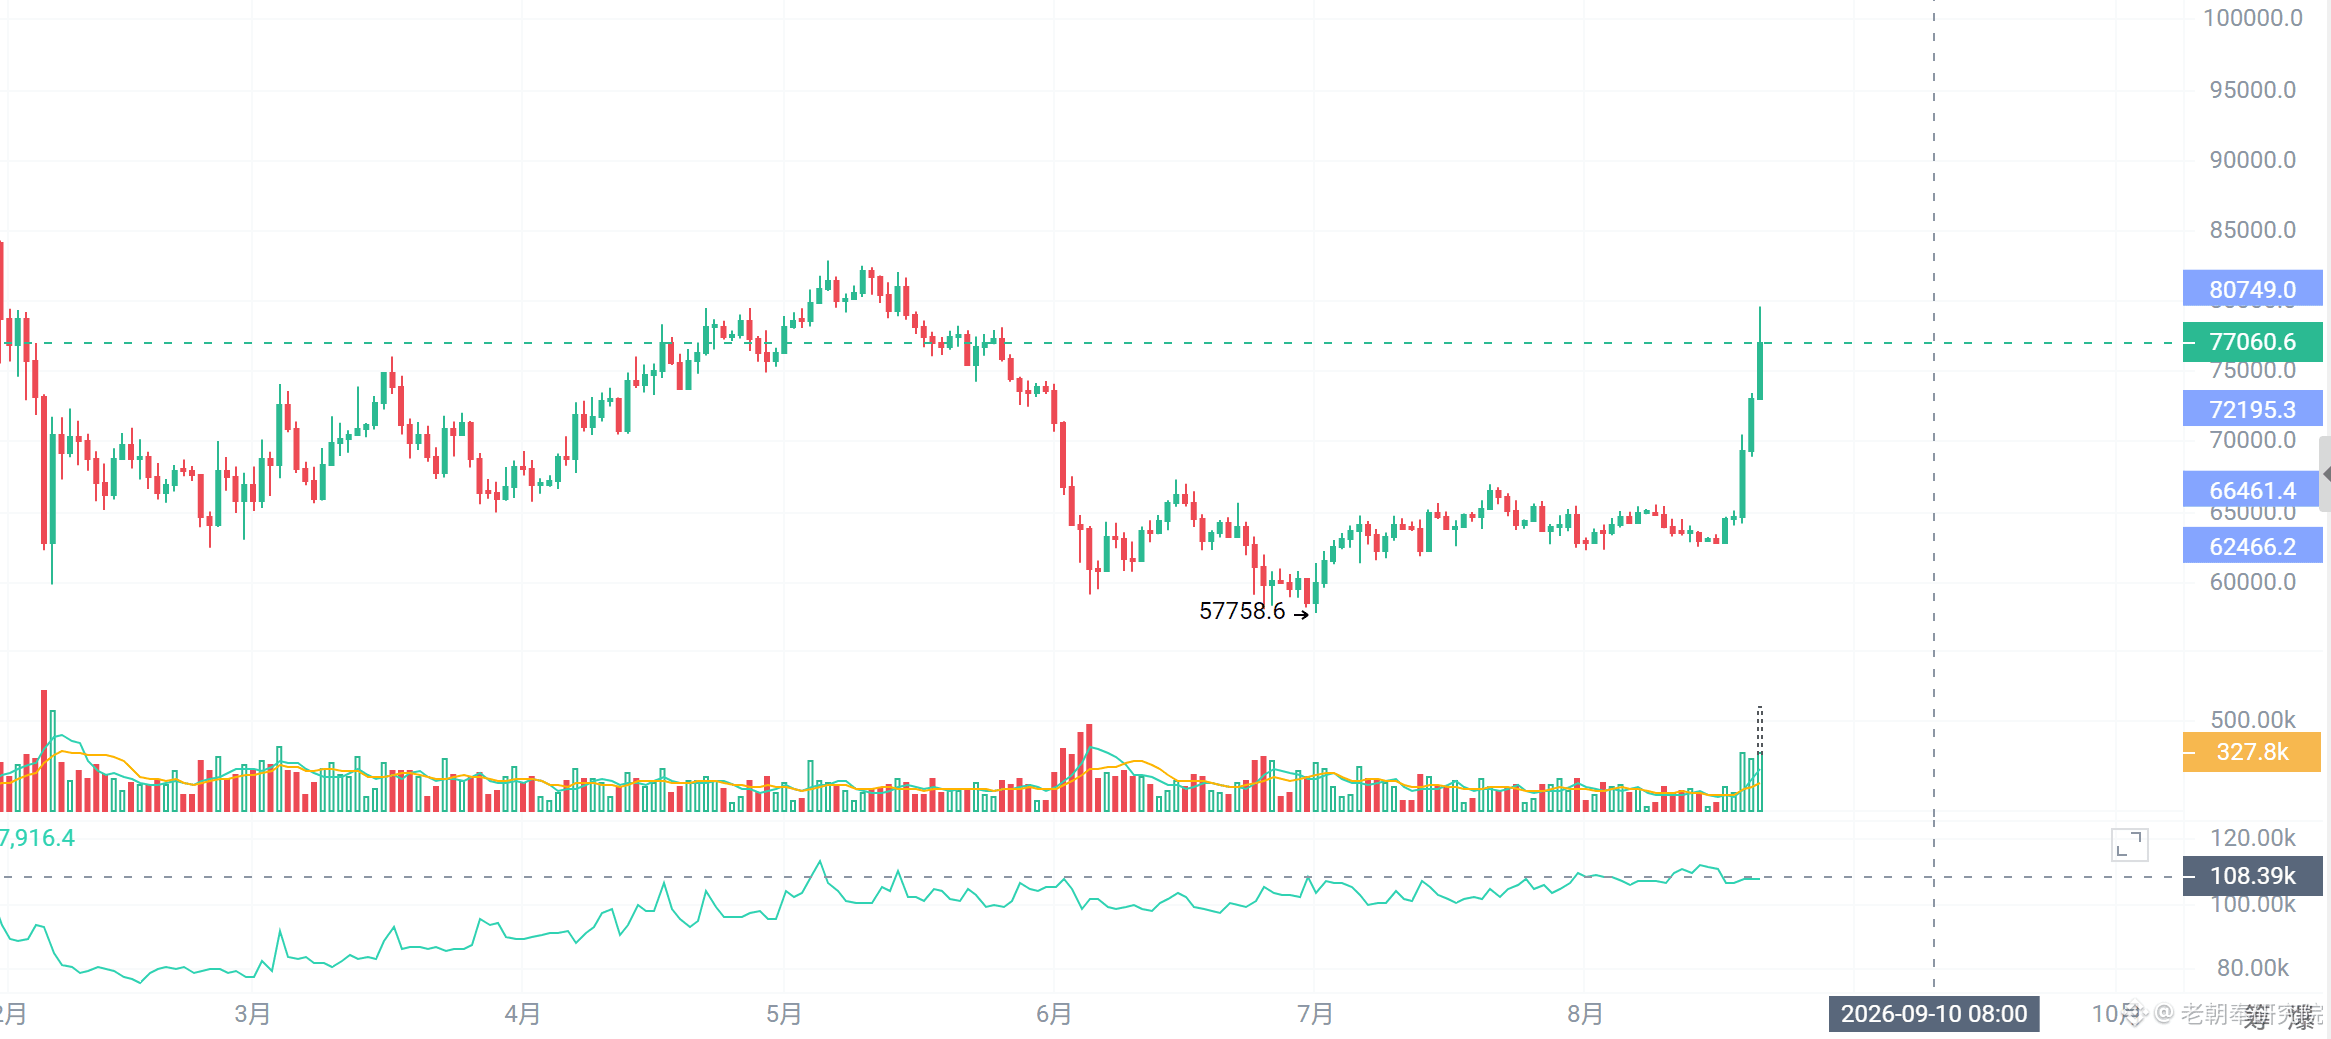
$BTC This surge suddenly pulled close to 80k—is the bull market back?
$BTC Over the past few days, it’s been lifted from just over 60k all the way to around the 80k area. After more than a month of choppy consolidation, in just a few days most of the move has been fully retraced upward.
Behind this upswing is the U.S. Treasury expanding long-term Treasury repurchases, which has clearly improved market expectations for liquidity. Meanwhile, the spot $BTC ETF also saw over $500 million in net inflows in a single day, and the large number of short positions that had piled up were continuously liquidated (“blown up”), pushing the price higher still. On top of that, recent U.S. attitudes toward crypto regulation have improved somewhat. With these factors stacking together, this fast rally happened.
This BTC move is indeed much stronger than the last few rebounds—both capital and trading volume have noticeably returned. Now it has already retraced back to the area near the previous highs. If the market can keep this rally’s momentum going, market sentiment will very likely continue to warm up.
#BTC
$BTC This surge suddenly pulled close to 80k—is the bull market back?
$BTC Over the past few days, it’s been lifted from just over 60k all the way to around the 80k area. After more than a month of choppy consolidation, in just a few days most of the move has been fully retraced upward.
Behind this upswing is the U.S. Treasury expanding long-term Treasury repurchases, which has clearly improved market expectations for liquidity. Meanwhile, the spot $BTC ETF also saw over $500 million in net inflows in a single day, and the large number of short positions that had piled up were continuously liquidated (“blown up”), pushing the price higher still. On top of that, recent U.S. attitudes toward crypto regulation have improved somewhat. With these factors stacking together, this fast rally happened.
This BTC move is indeed much stronger than the last few rebounds—both capital and trading volume have noticeably returned. Now it has already retraced back to the area near the previous highs. If the market can keep this rally’s momentum going, market sentiment will very likely continue to warm up.
#BTC
$BTC Over the past few days, it’s been lifted from just over 60k all the way to around the 80k area. After more than a month of choppy consolidation, in just a few days most of the move has been fully retraced upward.
Behind this upswing is the U.S. Treasury expanding long-term Treasury repurchases, which has clearly improved market expectations for liquidity. Meanwhile, the spot $BTC ETF also saw over $500 million in net inflows in a single day, and the large number of short positions that had piled up were continuously liquidated (“blown up”), pushing the price higher still. On top of that, recent U.S. attitudes toward crypto regulation have improved somewhat. With these factors stacking together, this fast rally happened.
This BTC move is indeed much stronger than the last few rebounds—both capital and trading volume have noticeably returned. Now it has already retraced back to the area near the previous highs. If the market can keep this rally’s momentum going, market sentiment will very likely continue to warm up.
#BTC
2
111
·
--
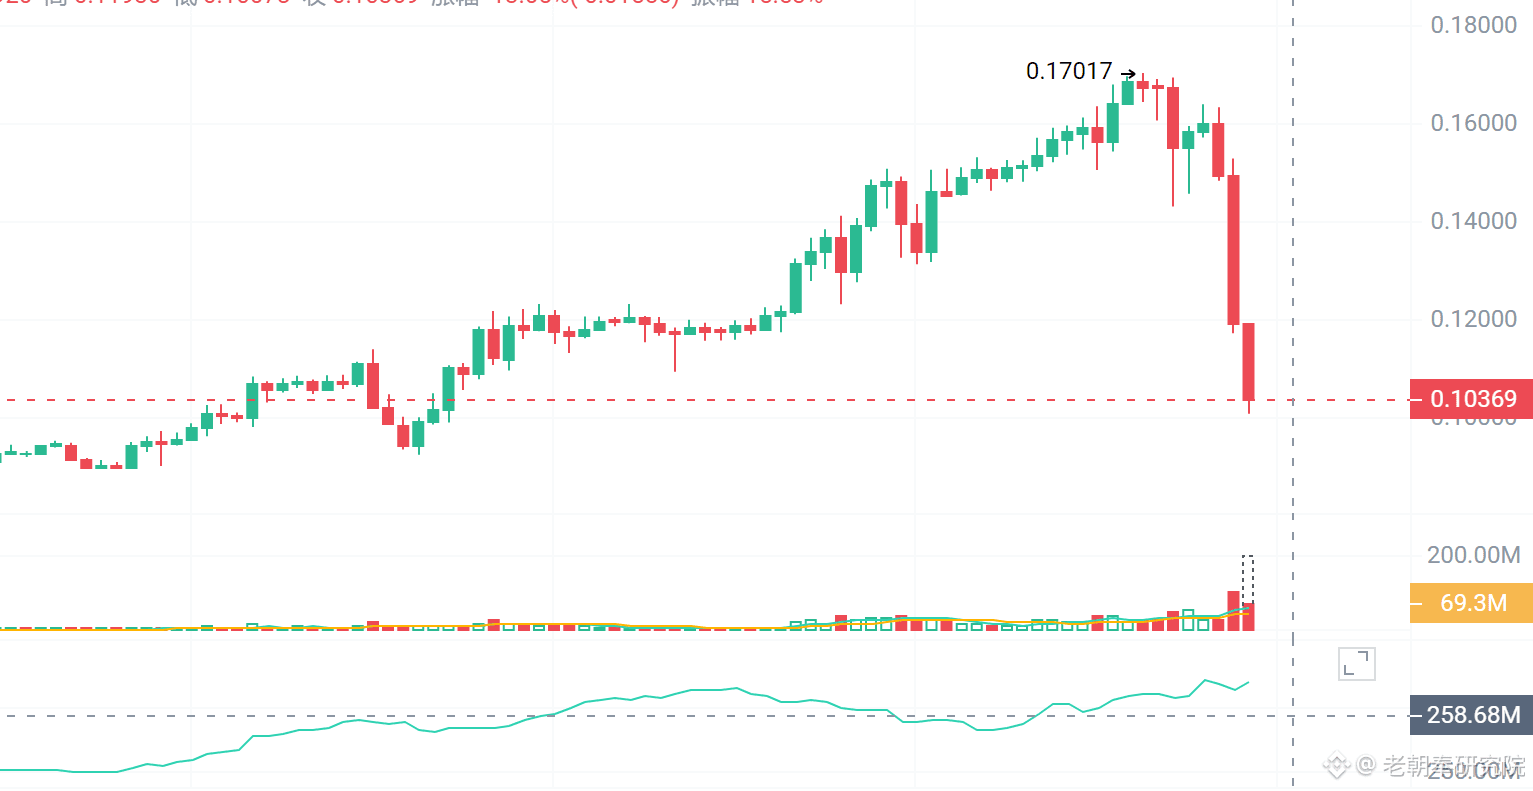
$H has been waiting for so long, and finally it starts to dump—falling all the way from around 0.17 back to 0.1. Luckily, I opened a short position with a small position size in advance.
$H has been waiting for so long, and finally it starts to dump—falling all the way from around 0.17 back to 0.1. Luckily, I opened a short position with a small position size in advance.
2
908
·
--
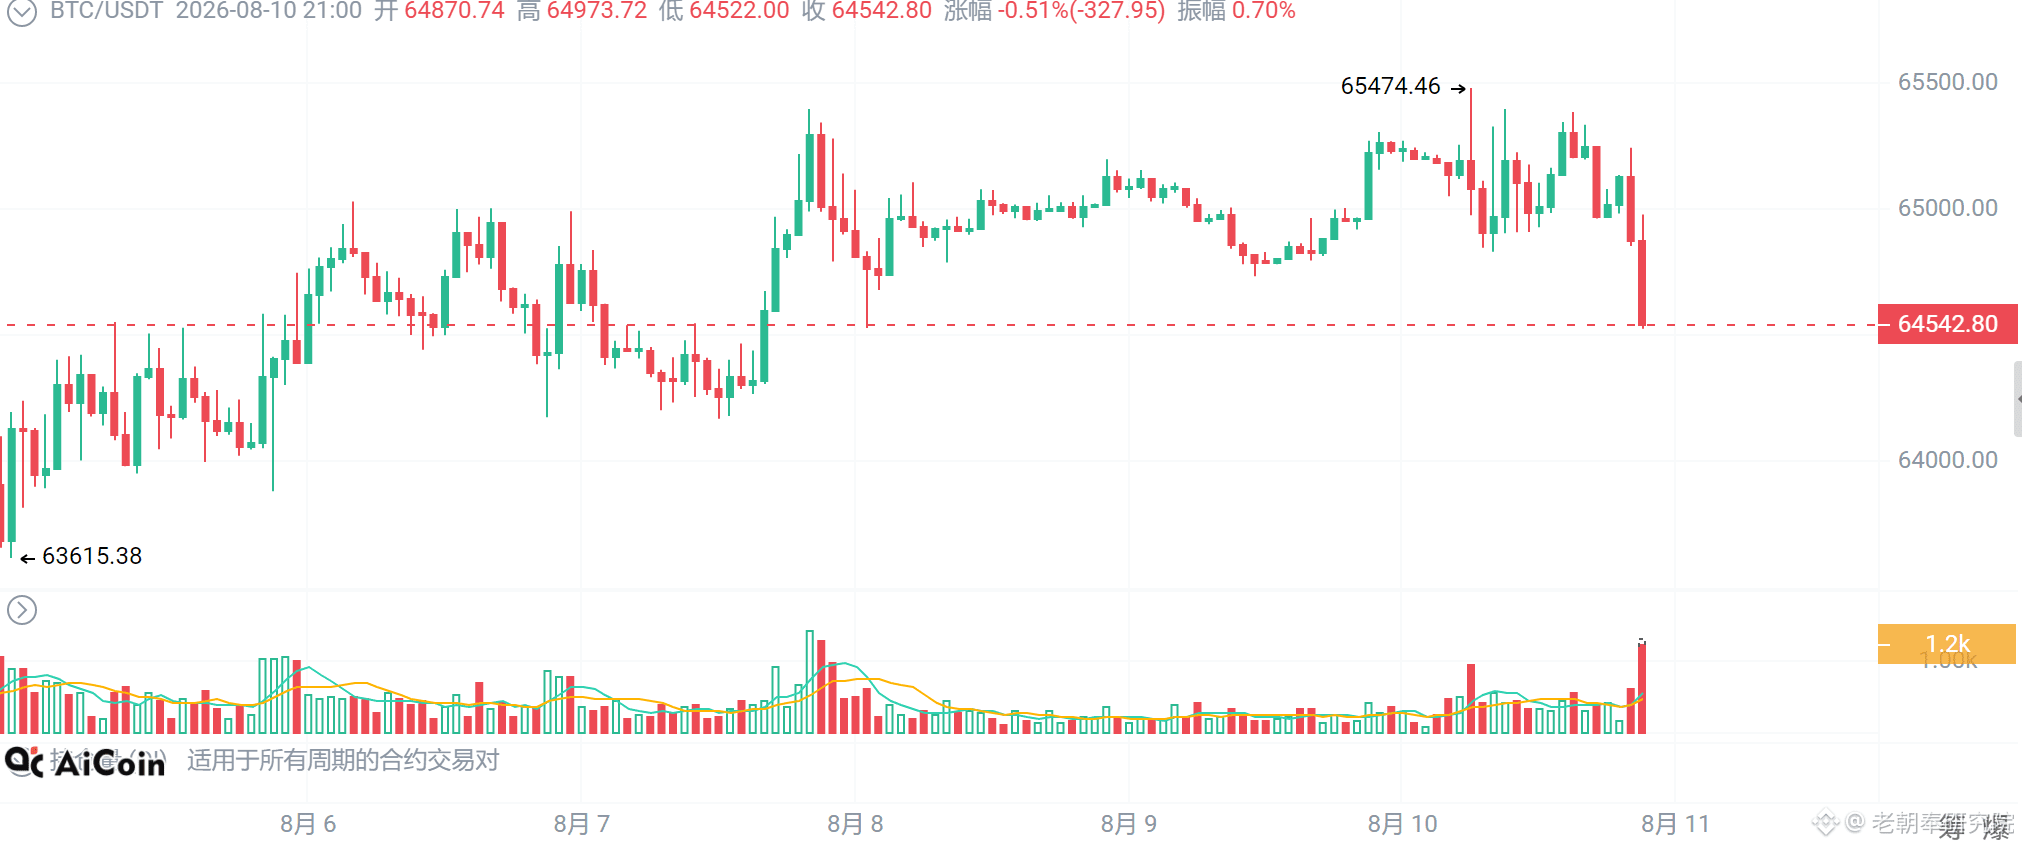
$BTC For the past two days, it has been repeatedly around 65,000. Today it tried to push again to 65,400, but it was quickly smashed back down. Just now, within the past hour, volumes surged and it returned to around 64,500. In the short term, it does look a bit weak.
The earlier attempts to break above 65,000 didn’t hold either, and today it got pushed back down again. Looking at the chart now, it still seems somewhat weak. Tonight, I’ll first see whether it continues to move toward the 64,000–64,000 range.
#BTC
$BTC For the past two days, it has been repeatedly around 65,000. Today it tried to push again to 65,400, but it was quickly smashed back down. Just now, within the past hour, volumes surged and it returned to around 64,500. In the short term, it does look a bit weak.
The earlier attempts to break above 65,000 didn’t hold either, and today it got pushed back down again. Looking at the chart now, it still seems somewhat weak. Tonight, I’ll first see whether it continues to move toward the 64,000–64,000 range.
#BTC
The earlier attempts to break above 65,000 didn’t hold either, and today it got pushed back down again. Looking at the chart now, it still seems somewhat weak. Tonight, I’ll first see whether it continues to move toward the 64,000–64,000 range.
#BTC
2
272
·
--
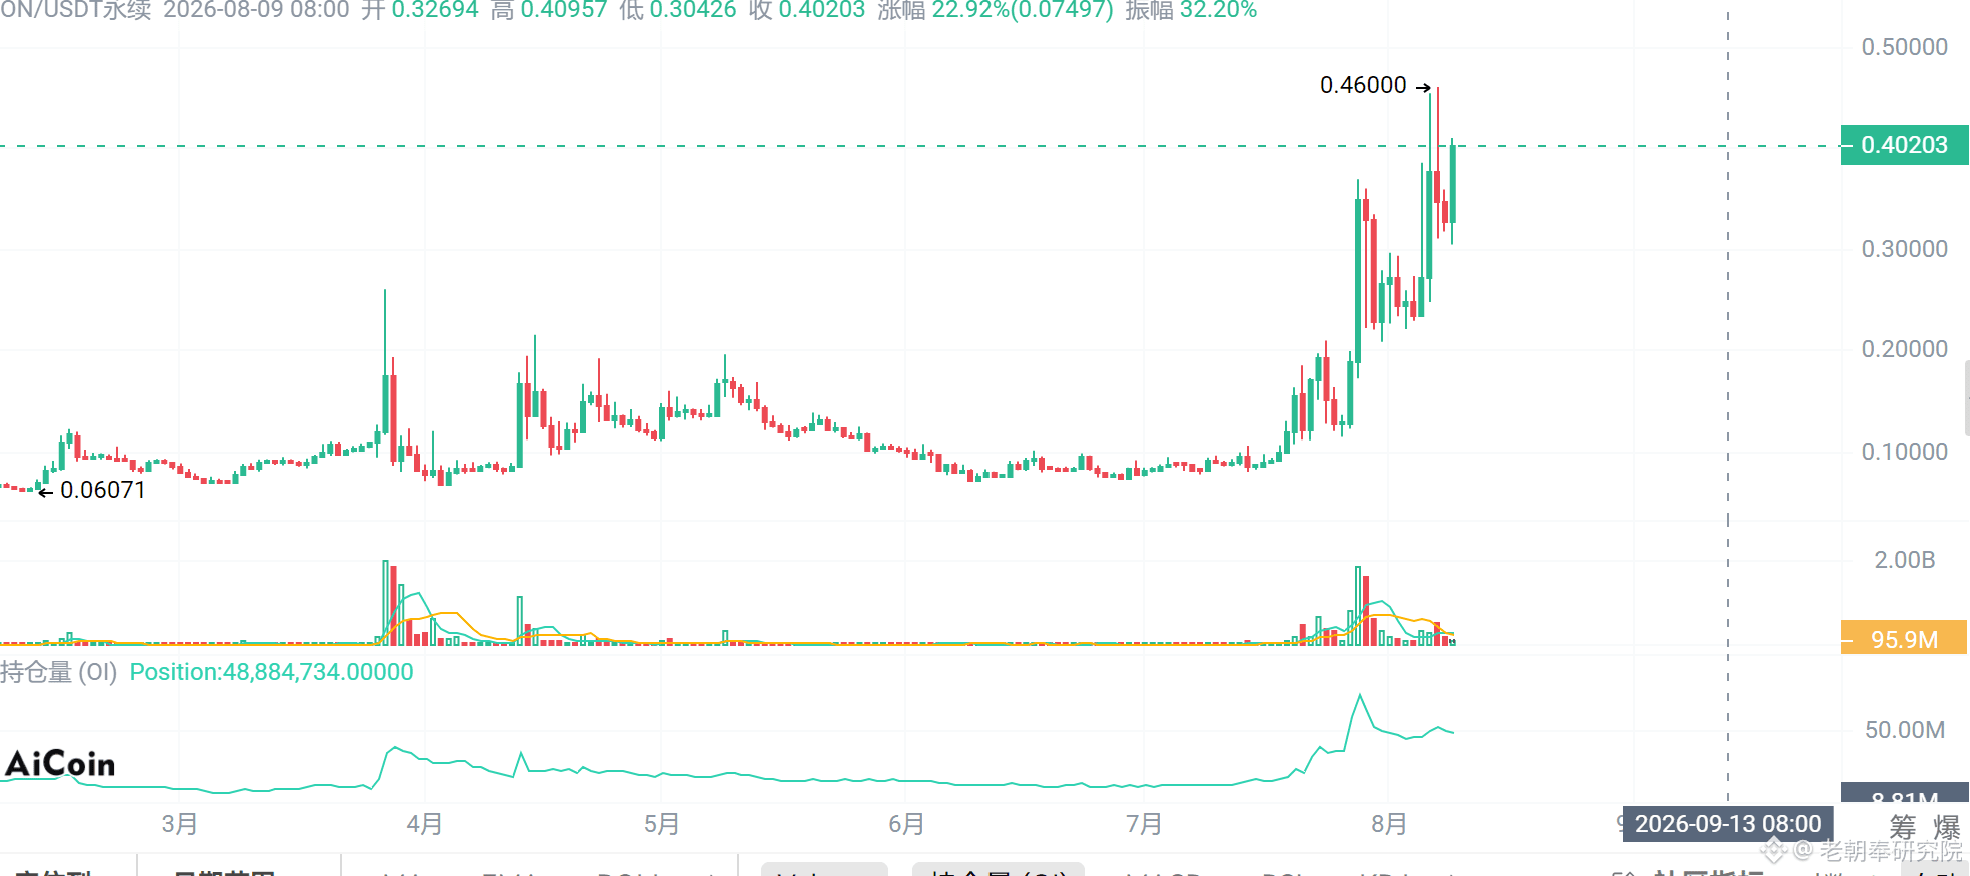
$ON A few days ago, it came down from a high level, then went through a pullback. Today it quickly rallied back, with the high almost reaching 0.46.
The price action these past few days has actually been quite strong. The earlier correction didn’t continue to weaken; instead, funds pulled it back again. However, the current position is already close to the prior breakout zone. For chasing longs in the short term, the cost-effectiveness feels mediocre, so I’ll test a small short position first and see if there’s an opportunity for a pullback.
If it continues to rally strongly afterward, I won’t try to guess the top.
#ON
$ON A few days ago, it came down from a high level, then went through a pullback. Today it quickly rallied back, with the high almost reaching 0.46.
The price action these past few days has actually been quite strong. The earlier correction didn’t continue to weaken; instead, funds pulled it back again. However, the current position is already close to the prior breakout zone. For chasing longs in the short term, the cost-effectiveness feels mediocre, so I’ll test a small short position first and see if there’s an opportunity for a pullback.
If it continues to rally strongly afterward, I won’t try to guess the top.
#ON
The price action these past few days has actually been quite strong. The earlier correction didn’t continue to weaken; instead, funds pulled it back again. However, the current position is already close to the prior breakout zone. For chasing longs in the short term, the cost-effectiveness feels mediocre, so I’ll test a small short position first and see if there’s an opportunity for a pullback.
If it continues to rally strongly afterward, I won’t try to guess the top.
#ON
2
454
·
--
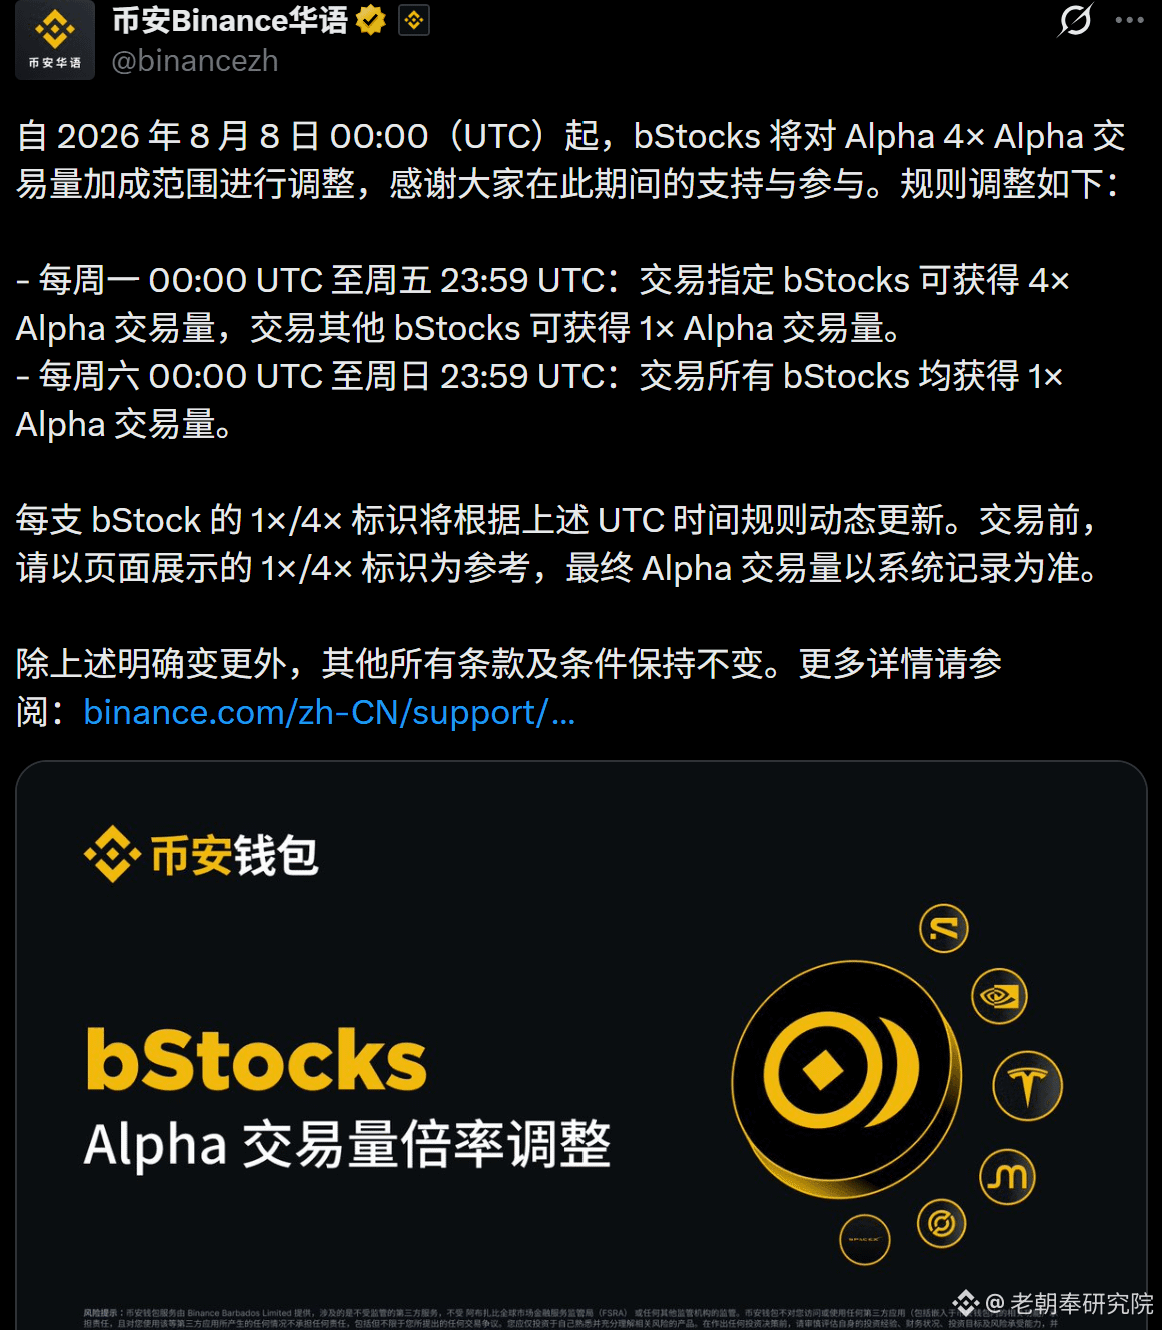
Starting from tomorrow morning at 8:00, Binance will keep only 4x Alpha volume for bStocks like $QQQB in the Binance wallet from Monday to Friday; on Saturday and Sunday, everything will be changed to 1x.
Previously, when there wasn’t much stable 4x available to use over the weekend, $QQQB could still be used to fill in. Now this route has also been cut off.
Going forward, when刷 Alpha you’ll have to pay even more attention to the timing. On weekdays, try to make the volume enough; on weekends, using this kind of security token has basically no good value.
Anzi’s rule change this time still has a pretty big impact on users who usually刷 QQQB. The number of coins that can be stably刷 is already getting smaller. After removing the 4x on weekends, the value of $QQQB is also much lower.
#QQQB #ALPHA
Starting from tomorrow morning at 8:00, Binance will keep only 4x Alpha volume for bStocks like $QQQB in the Binance wallet from Monday to Friday; on Saturday and Sunday, everything will be changed to 1x.
Previously, when there wasn’t much stable 4x available to use over the weekend, $QQQB could still be used to fill in. Now this route has also been cut off.
Going forward, when刷 Alpha you’ll have to pay even more attention to the timing. On weekdays, try to make the volume enough; on weekends, using this kind of security token has basically no good value.
Anzi’s rule change this time still has a pretty big impact on users who usually刷 QQQB. The number of coins that can be stably刷 is already getting smaller. After removing the 4x on weekends, the value of $QQQB is also much lower.
#QQQB #ALPHA
Previously, when there wasn’t much stable 4x available to use over the weekend, $QQQB could still be used to fill in. Now this route has also been cut off.
Going forward, when刷 Alpha you’ll have to pay even more attention to the timing. On weekdays, try to make the volume enough; on weekends, using this kind of security token has basically no good value.
Anzi’s rule change this time still has a pretty big impact on users who usually刷 QQQB. The number of coins that can be stably刷 is already getting smaller. After removing the 4x on weekends, the value of $QQQB is also much lower.
#QQQB #ALPHA
2
339
·
--
Bullish
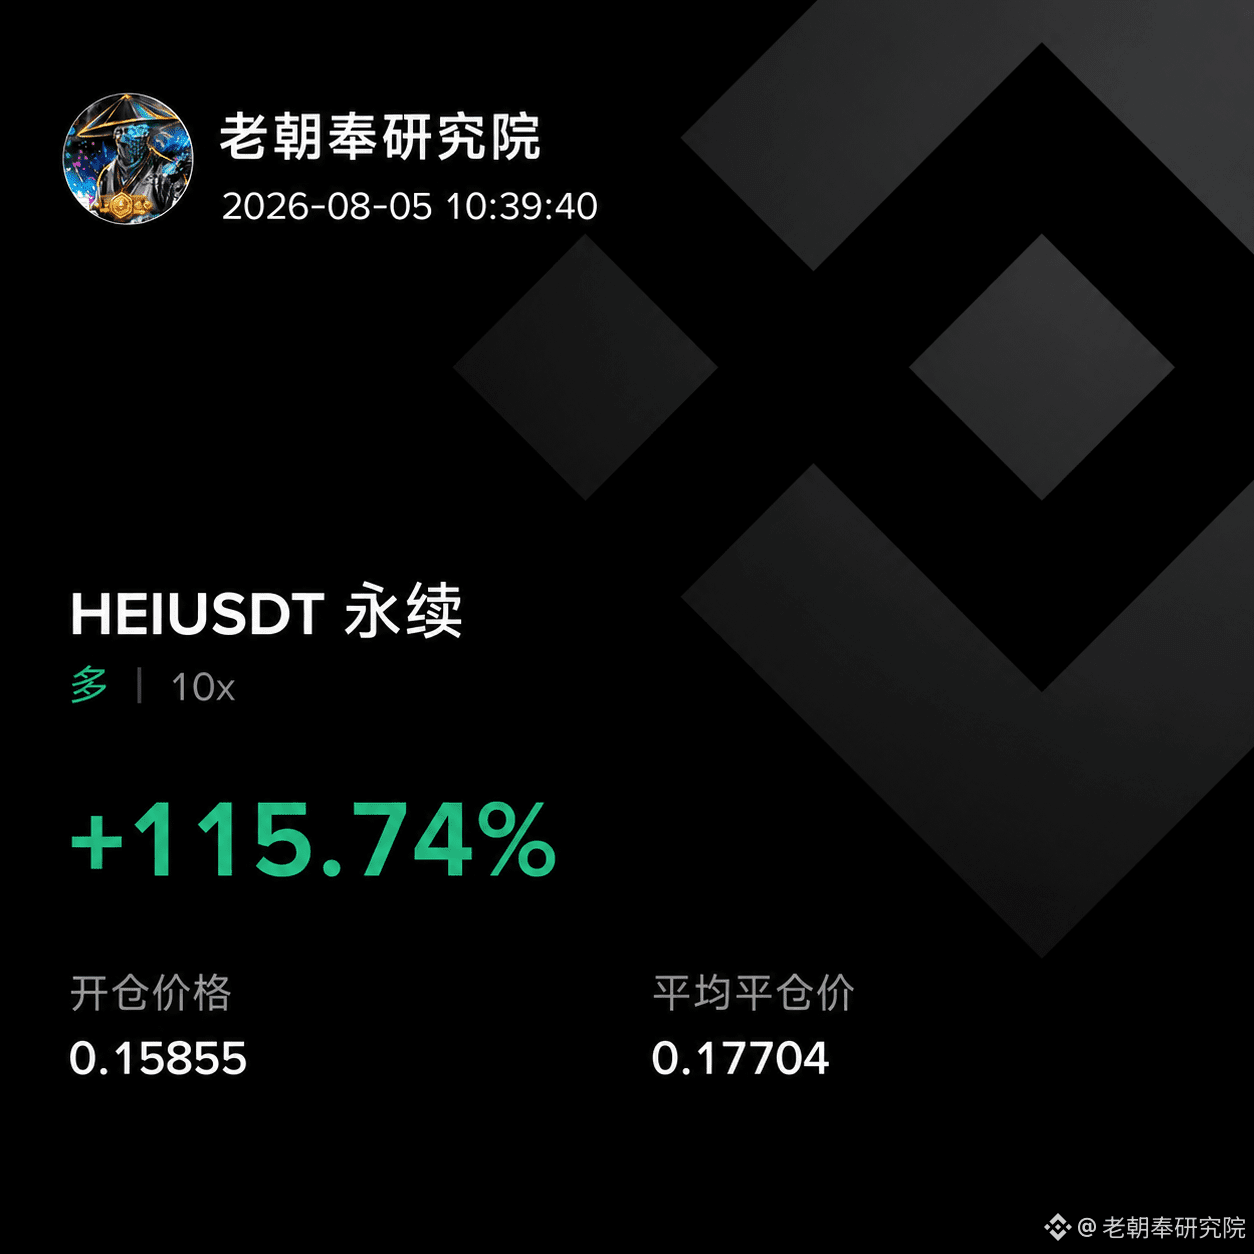
Today I caught up to a $HEI pump, and I guess I got to have a bite too.
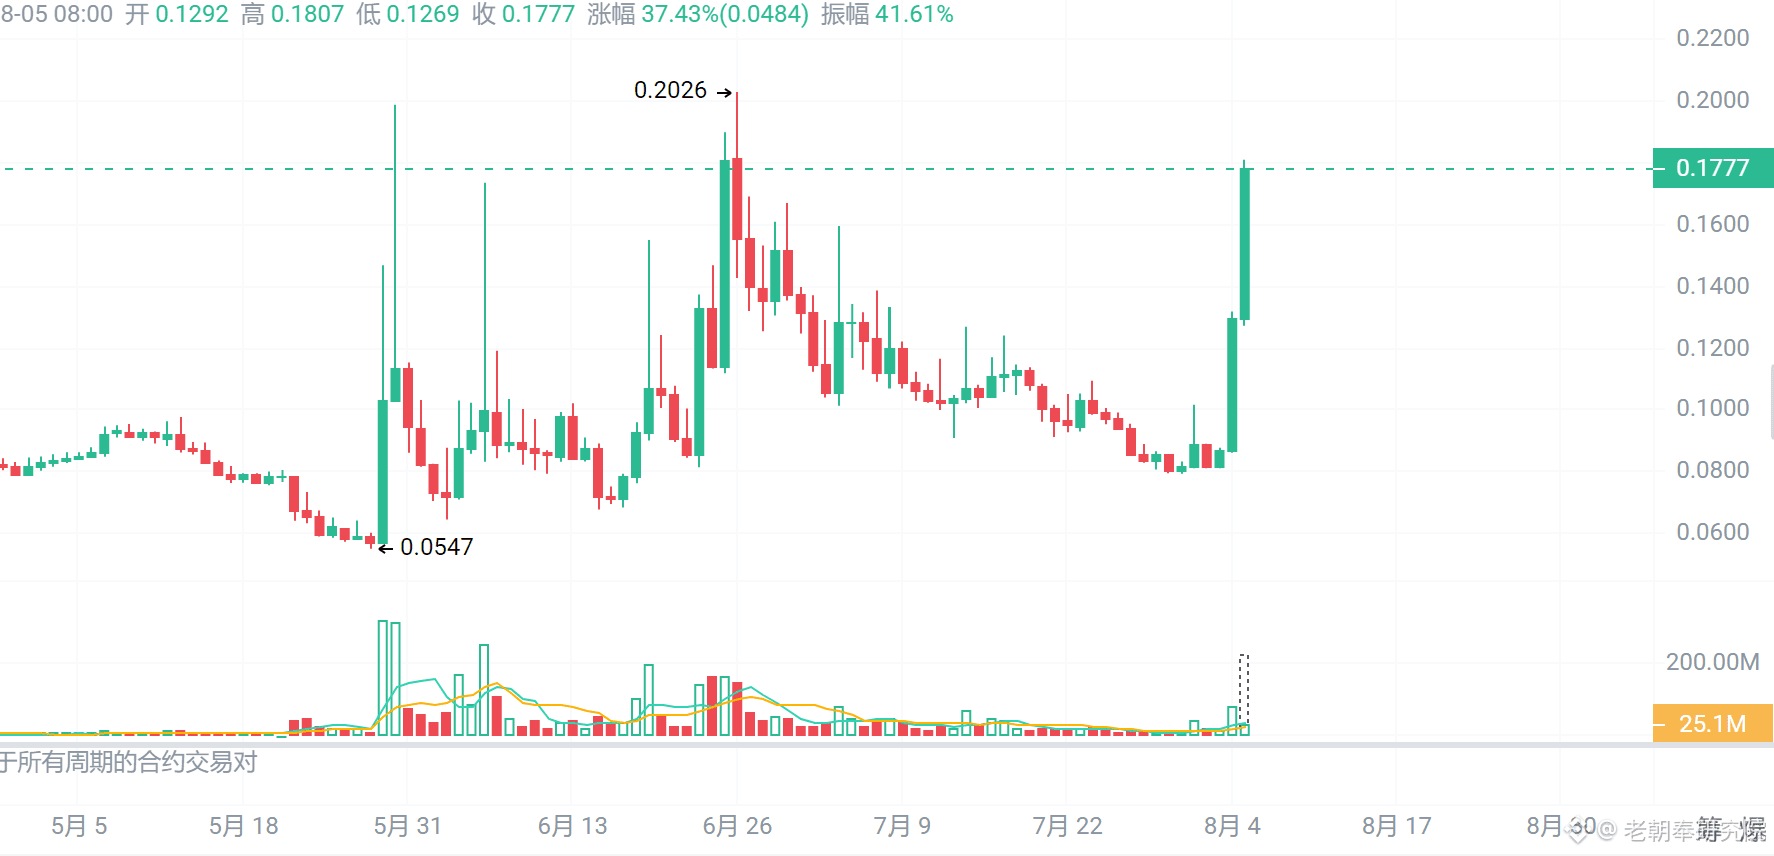
I’ve been watching $HEI these days. The price has been fluctuating back and forth, but the volume hasn’t fully dried up. After today’s breakout with increased volume, I followed the momentum for a bit. Then it was getting close to the previous high, and I was worried it might not break through and could pull back, so I decided to take profits first.
Going forward, if there are new price movements and new opportunities to enter, I’ll share them in the VIP group. Usually I focus on short-term market moves and new token developments. If you want to use a Binance invitation code, LCFYJY gives you 20% off trading fees. To join the VIP group and discuss the order book, you can also message me privately.
#HEI
Today I caught up to a $HEI pump, and I guess I got to have a bite too.
I’ve been watching $HEI these days. The price has been fluctuating back and forth, but the volume hasn’t fully dried up. After today’s breakout with increased volume, I followed the momentum for a bit. Then it was getting close to the previous high, and I was worried it might not break through and could pull back, so I decided to take profits first.
Going forward, if there are new price movements and new opportunities to enter, I’ll share them in the VIP group. Usually I focus on short-term market moves and new token developments. If you want to use a Binance invitation code, LCFYJY gives you 20% off trading fees. To join the VIP group and discuss the order book, you can also message me privately.
#HEI
I’ve been watching $HEI these days. The price has been fluctuating back and forth, but the volume hasn’t fully dried up. After today’s breakout with increased volume, I followed the momentum for a bit. Then it was getting close to the previous high, and I was worried it might not break through and could pull back, so I decided to take profits first.
Going forward, if there are new price movements and new opportunities to enter, I’ll share them in the VIP group. Usually I focus on short-term market moves and new token developments. If you want to use a Binance invitation code, LCFYJY gives you 20% off trading fees. To join the VIP group and discuss the order book, you can also message me privately.
#HEI
3
398
·
--
$GRVT Trading Competition starts today on the 4th. If you haven’t been trading Alpha today, you can join. The top 2,500 participants each receive 160 GRVT coins; the current price is roughly around 42U.
Trading volume on today and tomorrow has a 3x boost. It’s recommended that you trade up to the 130,000 tier these two days, and then go for the 65,000 tier afterward.
#ALPHA #grvt
$GRVT Trading Competition starts today on the 4th. If you haven’t been trading Alpha today, you can join. The top 2,500 participants each receive 160 GRVT coins; the current price is roughly around 42U.
Trading volume on today and tomorrow has a 3x boost. It’s recommended that you trade up to the 130,000 tier these two days, and then go for the 65,000 tier afterward.
#ALPHA #grvt
Trading volume on today and tomorrow has a 3x boost. It’s recommended that you trade up to the 130,000 tier these two days, and then go for the 65,000 tier afterward.
#ALPHA #grvt

3
506
·
--
The biggest change in the July market is that the行情 (market momentum) hasn’t disappeared, but opportunities have become more dispersed.
Assets like $BTC and $ETH , which are mainstream holdings, mostly stay in a range-bound consolidation most of the time and haven’t formed a sustained upward trend. But judging by market performance, capital hasn’t completely exited—it instead rapidly rotates among different hot spots.
During this period, it’s especially apparent that some ecosystem projects, newly launched tokens, and older projects have all regained attention, with short-term capital inflows showing up. The market is no longer broadly rising across the board; instead, only a few projects offer staged opportunities.
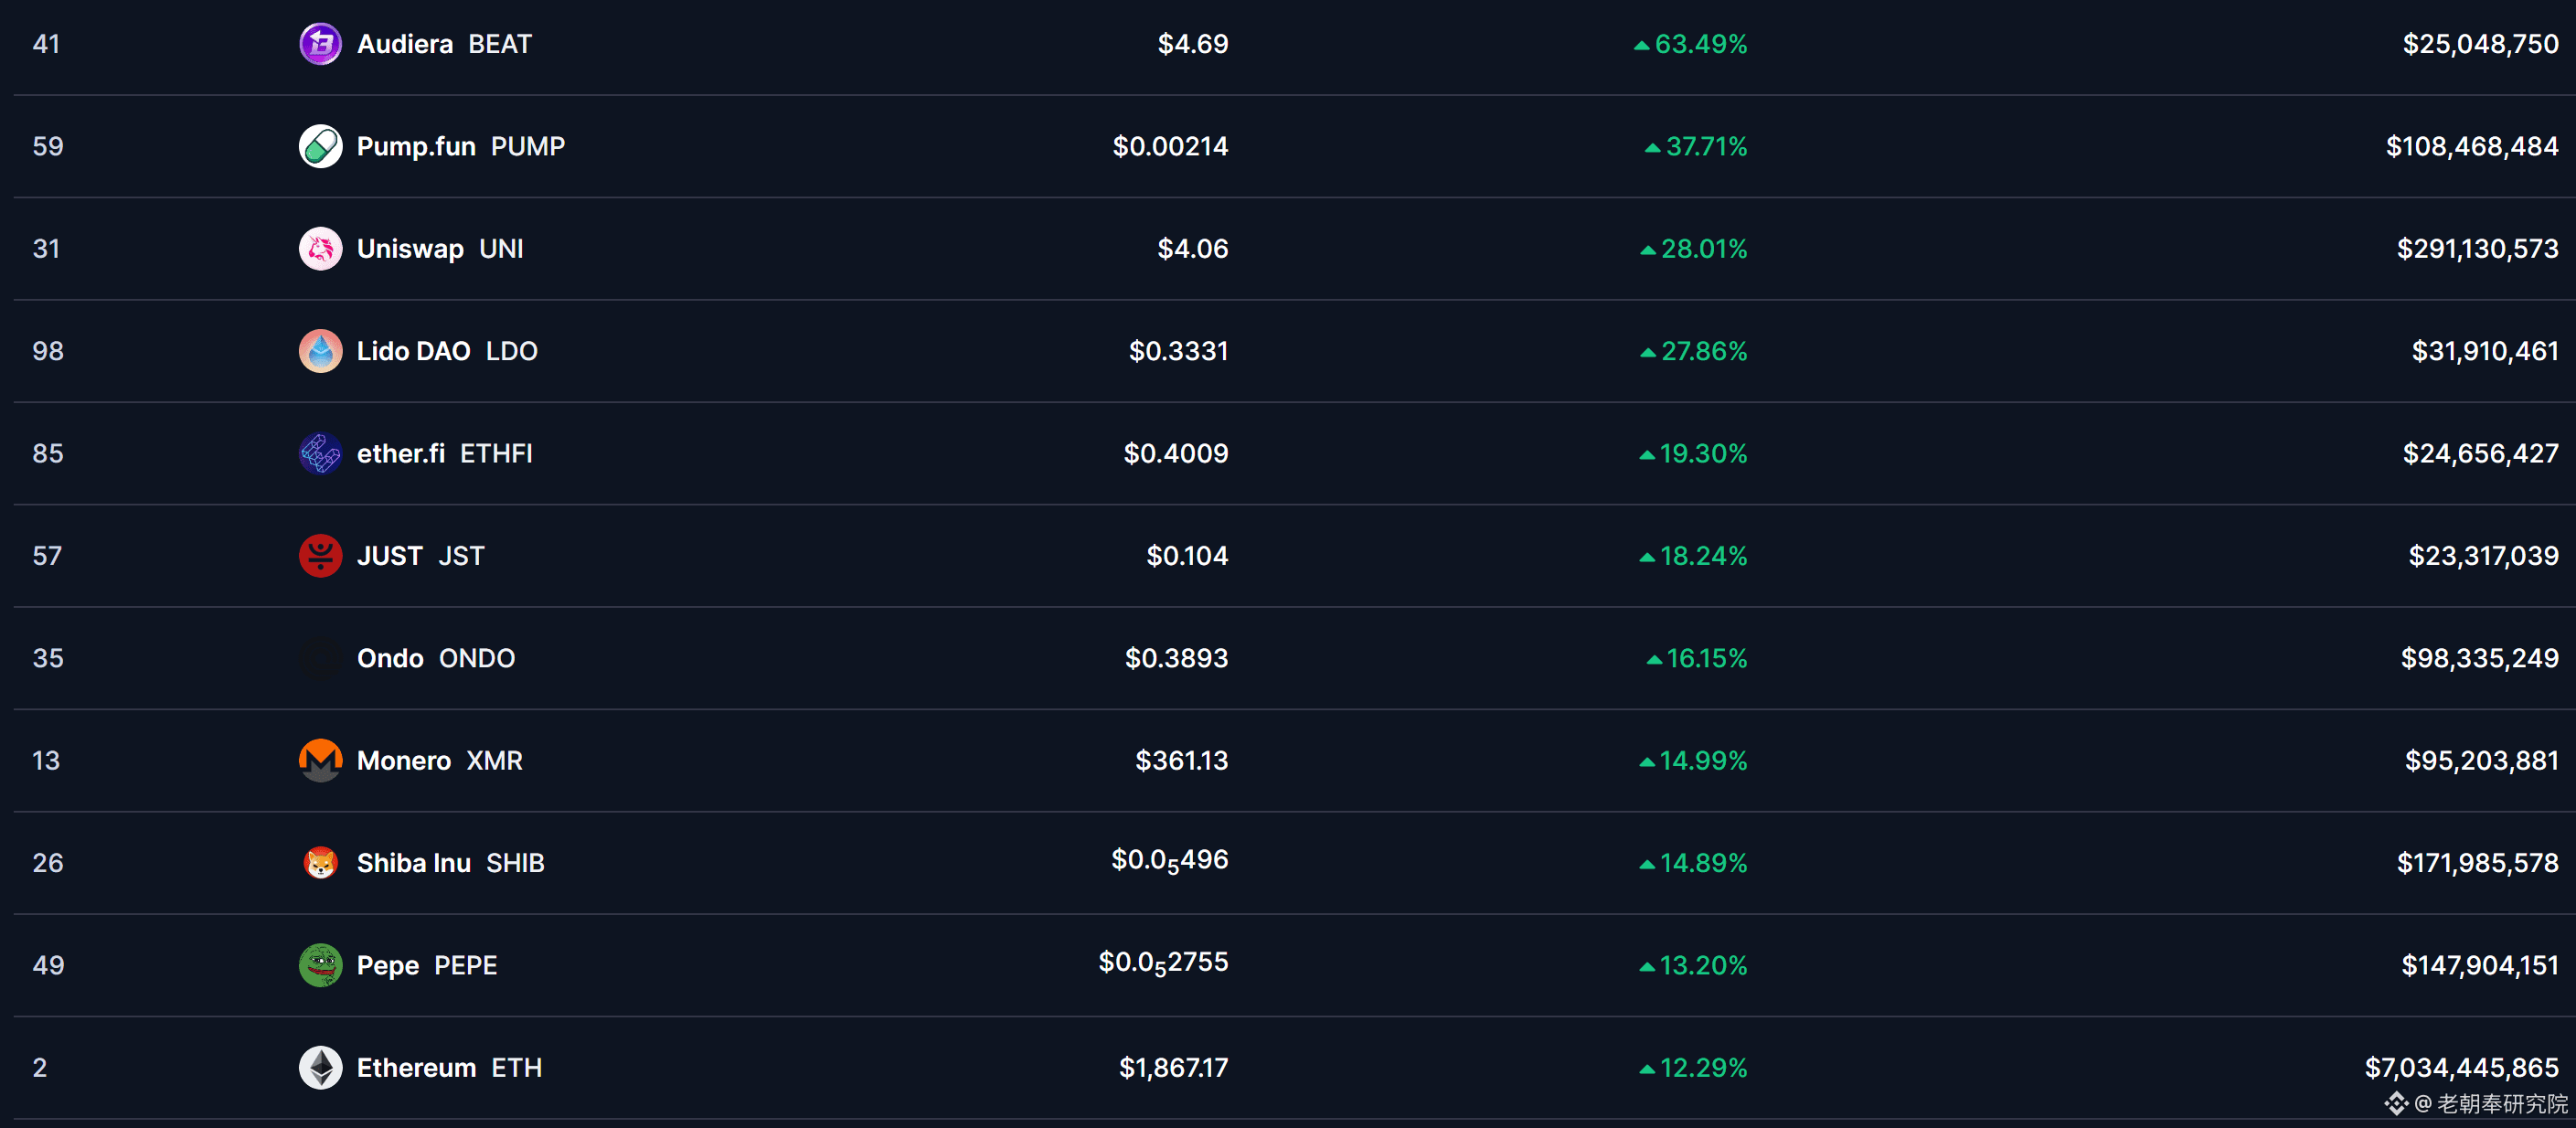
Looking at the recent top gainers list, you can also see that funds are关注 (being directed toward) established projects such as ETH, UNI, and ONDO, as well as certain small-cap tokens. However, this kind of market usually doesn’t last long, and the speed of hotspot rotation is fast.
#BTC #ETH
The biggest change in the July market is that the行情 (market momentum) hasn’t disappeared, but opportunities have become more dispersed.
Assets like $BTC and $ETH , which are mainstream holdings, mostly stay in a range-bound consolidation most of the time and haven’t formed a sustained upward trend. But judging by market performance, capital hasn’t completely exited—it instead rapidly rotates among different hot spots.
During this period, it’s especially apparent that some ecosystem projects, newly launched tokens, and older projects have all regained attention, with short-term capital inflows showing up. The market is no longer broadly rising across the board; instead, only a few projects offer staged opportunities.
Looking at the recent top gainers list, you can also see that funds are关注 (being directed toward) established projects such as ETH, UNI, and ONDO, as well as certain small-cap tokens. However, this kind of market usually doesn’t last long, and the speed of hotspot rotation is fast.
#BTC #ETH
Assets like $BTC and $ETH , which are mainstream holdings, mostly stay in a range-bound consolidation most of the time and haven’t formed a sustained upward trend. But judging by market performance, capital hasn’t completely exited—it instead rapidly rotates among different hot spots.
During this period, it’s especially apparent that some ecosystem projects, newly launched tokens, and older projects have all regained attention, with short-term capital inflows showing up. The market is no longer broadly rising across the board; instead, only a few projects offer staged opportunities.
Looking at the recent top gainers list, you can also see that funds are关注 (being directed toward) established projects such as ETH, UNI, and ONDO, as well as certain small-cap tokens. However, this kind of market usually doesn’t last long, and the speed of hotspot rotation is fast.
#BTC #ETH
2
763
·
--
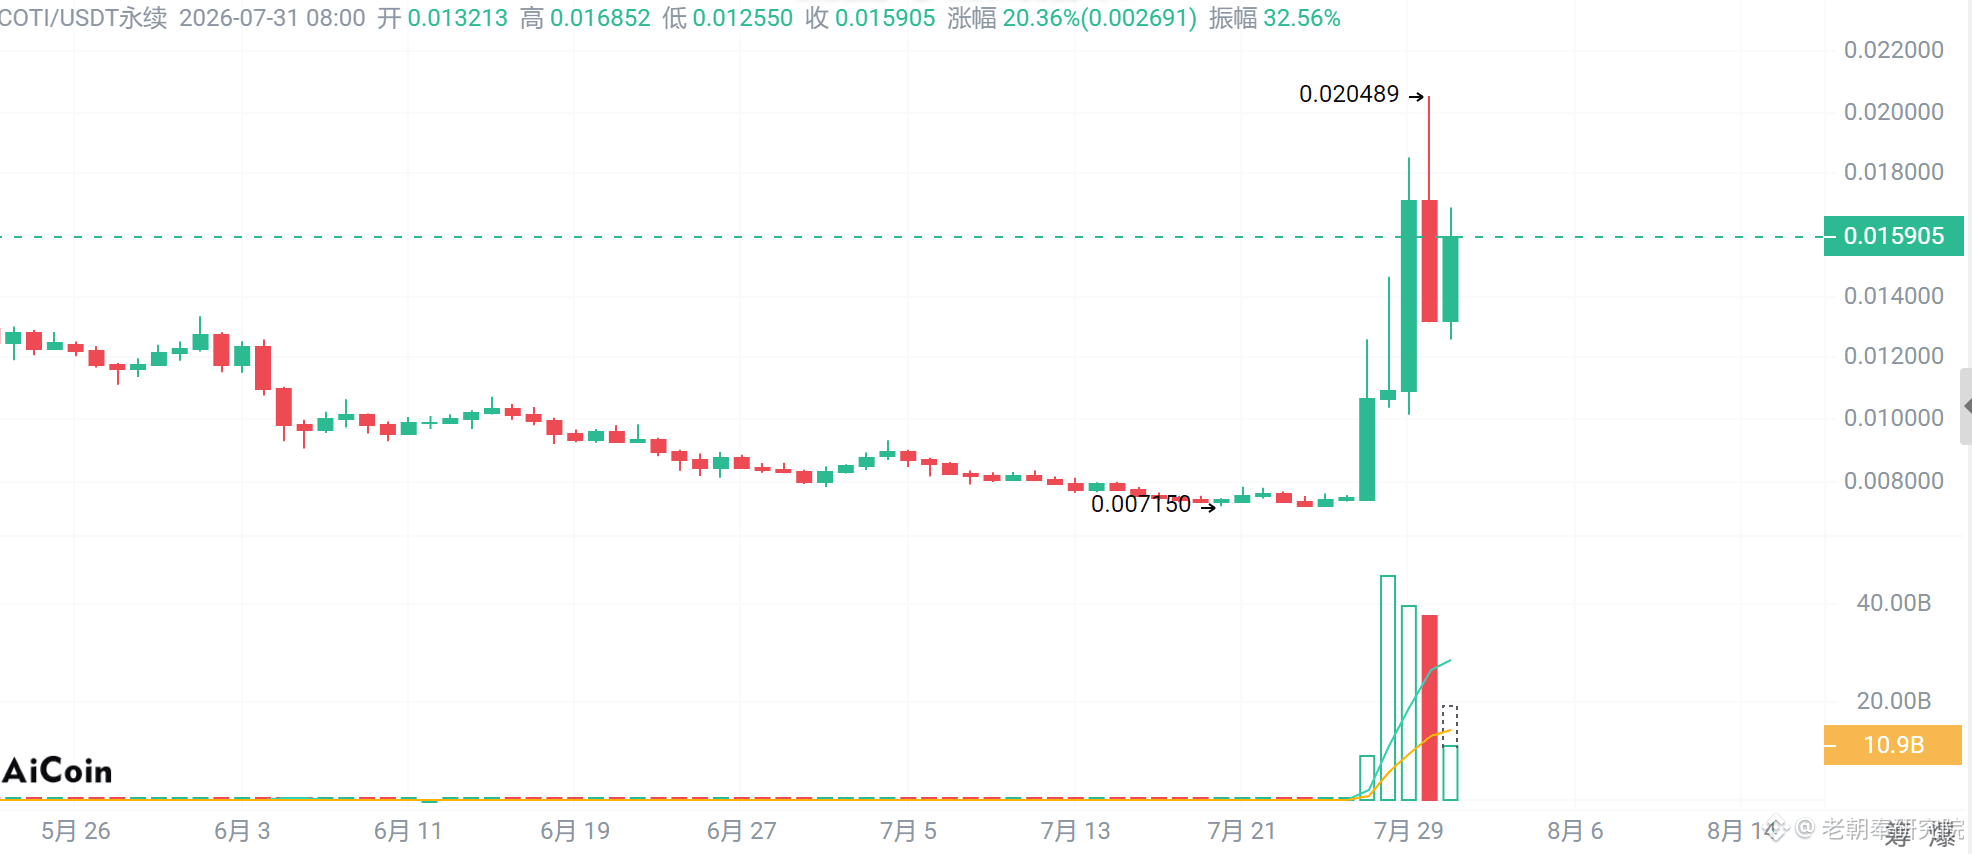
$COTI The day before yesterday, it was pulled up all the way from around 0.007 to 0.02. Yesterday it surged and then fell back—thinking it might start dumping. Today, it has been pulled back to around 0.016.
The most obvious thing about this move is that the volume hasn’t fully dropped off. Even though it closed with a big bearish candle yesterday, today it was quickly pulled back, which suggests the funds above haven’t completely exited yet. Right now it doesn’t look like the move is directly over; it seems more like churning and switching hands at a high level.
However, the volatility at this point is already quite high. Chasing longs could easily mean buying at a high point. Going short early could also mean it keeps getting pulled up. Let’s first see whether it can manage to hold back above 0.016.
#Coti
$COTI The day before yesterday, it was pulled up all the way from around 0.007 to 0.02. Yesterday it surged and then fell back—thinking it might start dumping. Today, it has been pulled back to around 0.016.
The most obvious thing about this move is that the volume hasn’t fully dropped off. Even though it closed with a big bearish candle yesterday, today it was quickly pulled back, which suggests the funds above haven’t completely exited yet. Right now it doesn’t look like the move is directly over; it seems more like churning and switching hands at a high level.
However, the volatility at this point is already quite high. Chasing longs could easily mean buying at a high point. Going short early could also mean it keeps getting pulled up. Let’s first see whether it can manage to hold back above 0.016.
#Coti
The most obvious thing about this move is that the volume hasn’t fully dropped off. Even though it closed with a big bearish candle yesterday, today it was quickly pulled back, which suggests the funds above haven’t completely exited yet. Right now it doesn’t look like the move is directly over; it seems more like churning and switching hands at a high level.
However, the volatility at this point is already quite high. Chasing longs could easily mean buying at a high point. Going short early could also mean it keeps getting pulled up. Let’s first see whether it can manage to hold back above 0.016.
#Coti
2
396
·
--
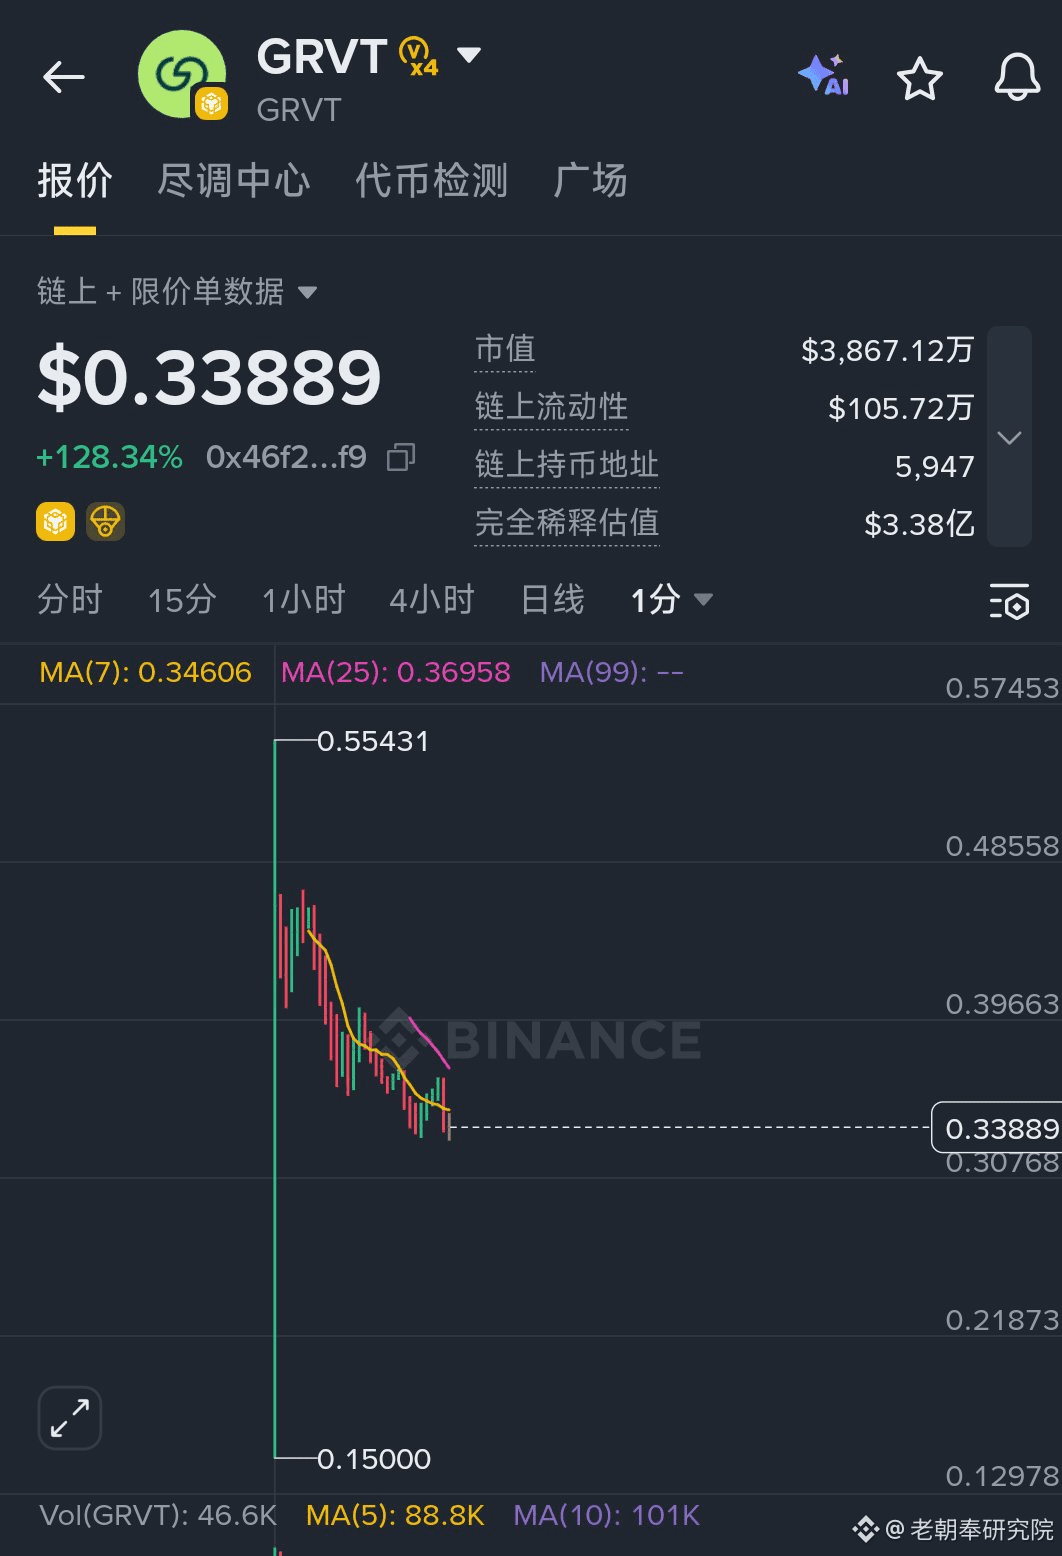
$GRVT officially launched today, after waiting for nearly a month. The airdrop on Binance Alpha is worth about 30U at the current price, which is lower than market expectations earlier.
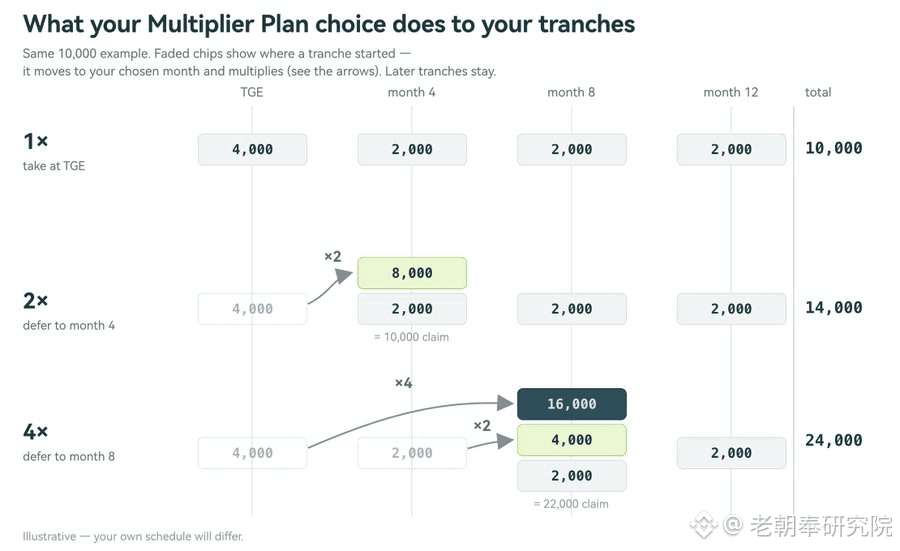
In addition, the TGE event airdrop of the $GRVT project itself uses a phased release. Most users can only receive the first batch of allocation on the day, while the remaining part will be gradually unlocked over the next 12 months, and the release ratio for each period may also differ.
One is that the Alpha airdrop has limited value, and the other is that the project event airdrop has a long redemption period. Looking only at the final result, the overall return rate of this $GRVT is not very good.
#grvt #alpha
$GRVT officially launched today, after waiting for nearly a month. The airdrop on Binance Alpha is worth about 30U at the current price, which is lower than market expectations earlier.
In addition, the TGE event airdrop of the $GRVT project itself uses a phased release. Most users can only receive the first batch of allocation on the day, while the remaining part will be gradually unlocked over the next 12 months, and the release ratio for each period may also differ.
One is that the Alpha airdrop has limited value, and the other is that the project event airdrop has a long redemption period. Looking only at the final result, the overall return rate of this $GRVT is not very good.
#grvt #alpha
In addition, the TGE event airdrop of the $GRVT project itself uses a phased release. Most users can only receive the first batch of allocation on the day, while the remaining part will be gradually unlocked over the next 12 months, and the release ratio for each period may also differ.
One is that the Alpha airdrop has limited value, and the other is that the project event airdrop has a long redemption period. Looking only at the final result, the overall return rate of this $GRVT is not very good.
#grvt #alpha
3
307
·
--
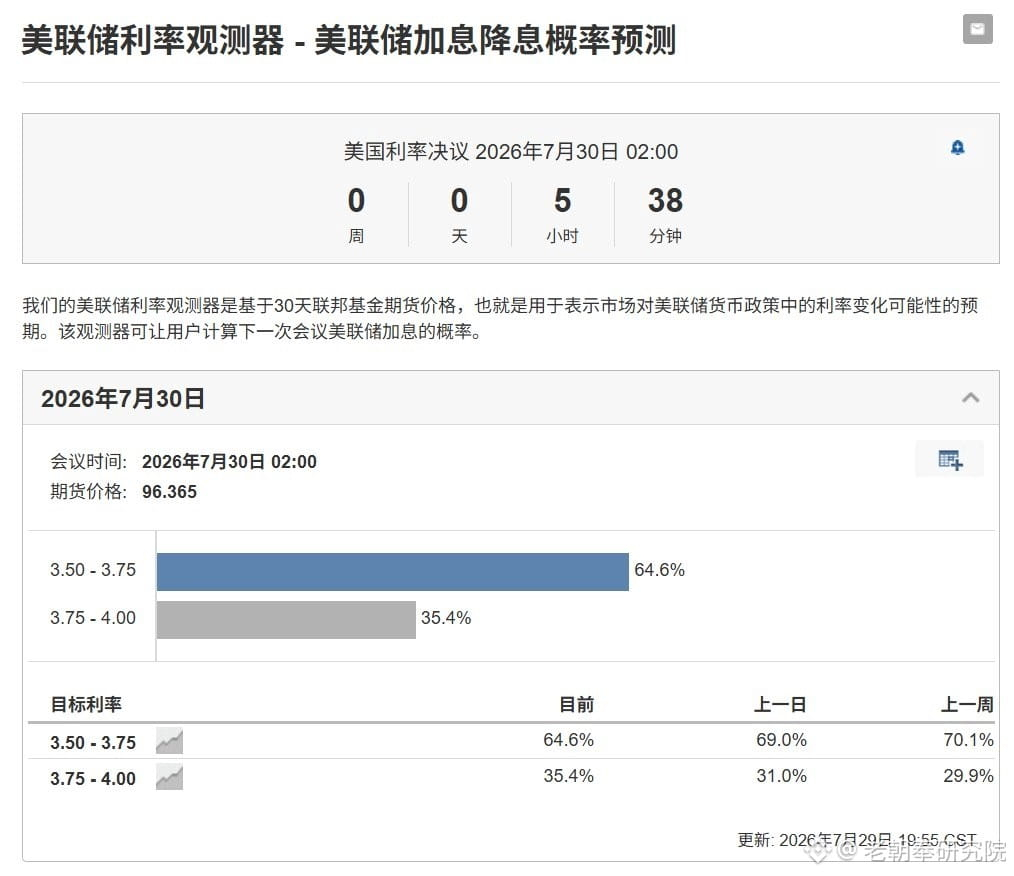
The biggest focus in the market tonight is the Federal Reserve’s interest rate decision.
Every time it’s a policy meeting night, trading volume and volatility tend to increase noticeably, so many people believe there will be the most opportunities tonight. But what is truly worth paying attention to may not be the interest rate outcome itself, but rather the signals the Fed provides about future monetary policy.
At present, the market generally expects that the rate will be kept unchanged. Therefore, Powell’s remarks at the press conference regarding inflation, employment, and the pace of subsequent rate cuts may be the key factors influencing market sentiment. If it releases clearer expectations of rate cuts, risk assets may continue to receive a boost; if the stance remains cautious, market volatility could intensify further.
For the crypto market, rather than rushing to guess the direction tonight, it’s better to first focus on the information the Fed conveys, and then observe how the market digests the news.
#美联储会议
The biggest focus in the market tonight is the Federal Reserve’s interest rate decision.
Every time it’s a policy meeting night, trading volume and volatility tend to increase noticeably, so many people believe there will be the most opportunities tonight. But what is truly worth paying attention to may not be the interest rate outcome itself, but rather the signals the Fed provides about future monetary policy.
At present, the market generally expects that the rate will be kept unchanged. Therefore, Powell’s remarks at the press conference regarding inflation, employment, and the pace of subsequent rate cuts may be the key factors influencing market sentiment. If it releases clearer expectations of rate cuts, risk assets may continue to receive a boost; if the stance remains cautious, market volatility could intensify further.
For the crypto market, rather than rushing to guess the direction tonight, it’s better to first focus on the information the Fed conveys, and then observe how the market digests the news.
#美联储会议
Every time it’s a policy meeting night, trading volume and volatility tend to increase noticeably, so many people believe there will be the most opportunities tonight. But what is truly worth paying attention to may not be the interest rate outcome itself, but rather the signals the Fed provides about future monetary policy.
At present, the market generally expects that the rate will be kept unchanged. Therefore, Powell’s remarks at the press conference regarding inflation, employment, and the pace of subsequent rate cuts may be the key factors influencing market sentiment. If it releases clearer expectations of rate cuts, risk assets may continue to receive a boost; if the stance remains cautious, market volatility could intensify further.
For the crypto market, rather than rushing to guess the direction tonight, it’s better to first focus on the information the Fed conveys, and then observe how the market digests the news.
#美联储会议
1
127
·
--
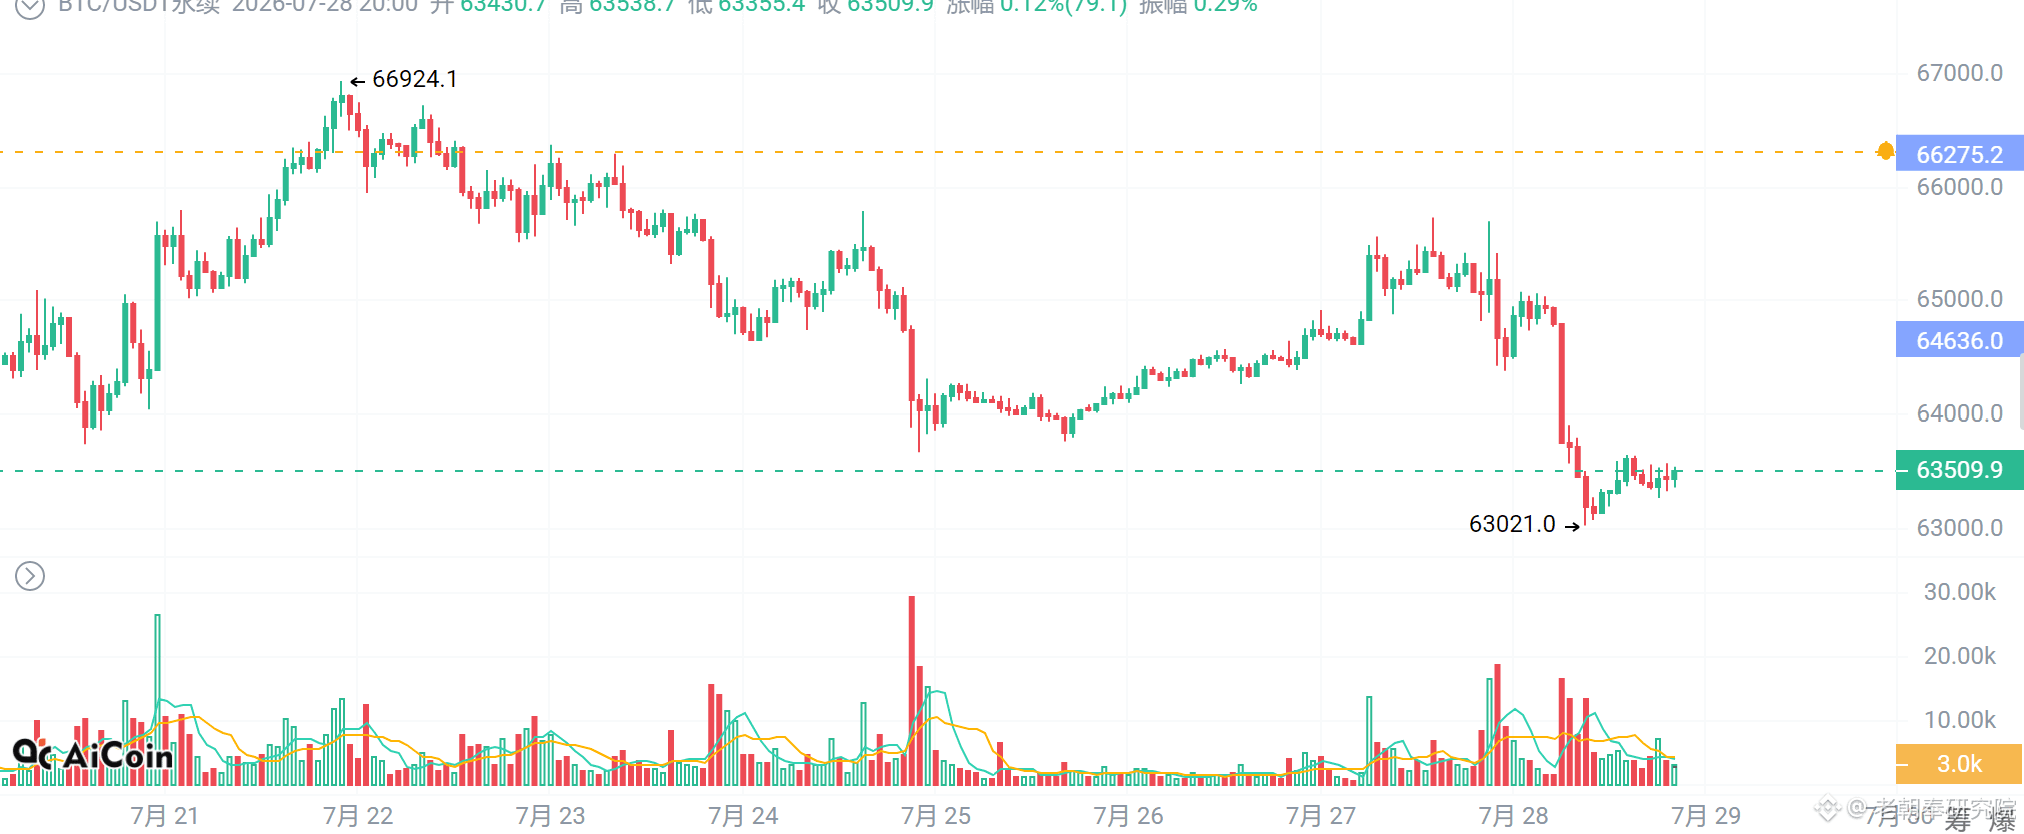
$BTC Today saw a sudden sharp pullback. The price fell steadily from around $65,000, reaching a low of $63,021. The loss in a single hour was nearly $2,000.
Judging from the order book, this decline saw a sudden surge in volume and a completed move within a ranging range. Previously, BTC had been repeatedly hovering around $64,000–$66,000, with some short-term funds waiting for a directional breakout. Today’s rapid drop also impacted leveraged positions.
In this kind of market, in addition to judging direction, transaction costs and risk management are equally important. Frequent entries and exits, as well as stop-loss adjustments, will increase fee expenses; over the long run, this becomes a considerable cost.
If you usually trade with a relatively high frequency, you can calculate your expected fee spending in advance. I currently trade on Binance, and you can get 20% off trading fees with the invitation code LCFYJY.
#BTC
$BTC Today saw a sudden sharp pullback. The price fell steadily from around $65,000, reaching a low of $63,021. The loss in a single hour was nearly $2,000.
Judging from the order book, this decline saw a sudden surge in volume and a completed move within a ranging range. Previously, BTC had been repeatedly hovering around $64,000–$66,000, with some short-term funds waiting for a directional breakout. Today’s rapid drop also impacted leveraged positions.
In this kind of market, in addition to judging direction, transaction costs and risk management are equally important. Frequent entries and exits, as well as stop-loss adjustments, will increase fee expenses; over the long run, this becomes a considerable cost.
If you usually trade with a relatively high frequency, you can calculate your expected fee spending in advance. I currently trade on Binance, and you can get 20% off trading fees with the invitation code LCFYJY.
#BTC
Judging from the order book, this decline saw a sudden surge in volume and a completed move within a ranging range. Previously, BTC had been repeatedly hovering around $64,000–$66,000, with some short-term funds waiting for a directional breakout. Today’s rapid drop also impacted leveraged positions.
In this kind of market, in addition to judging direction, transaction costs and risk management are equally important. Frequent entries and exits, as well as stop-loss adjustments, will increase fee expenses; over the long run, this becomes a considerable cost.
If you usually trade with a relatively high frequency, you can calculate your expected fee spending in advance. I currently trade on Binance, and you can get 20% off trading fees with the invitation code LCFYJY.
#BTC
2
237
·
--
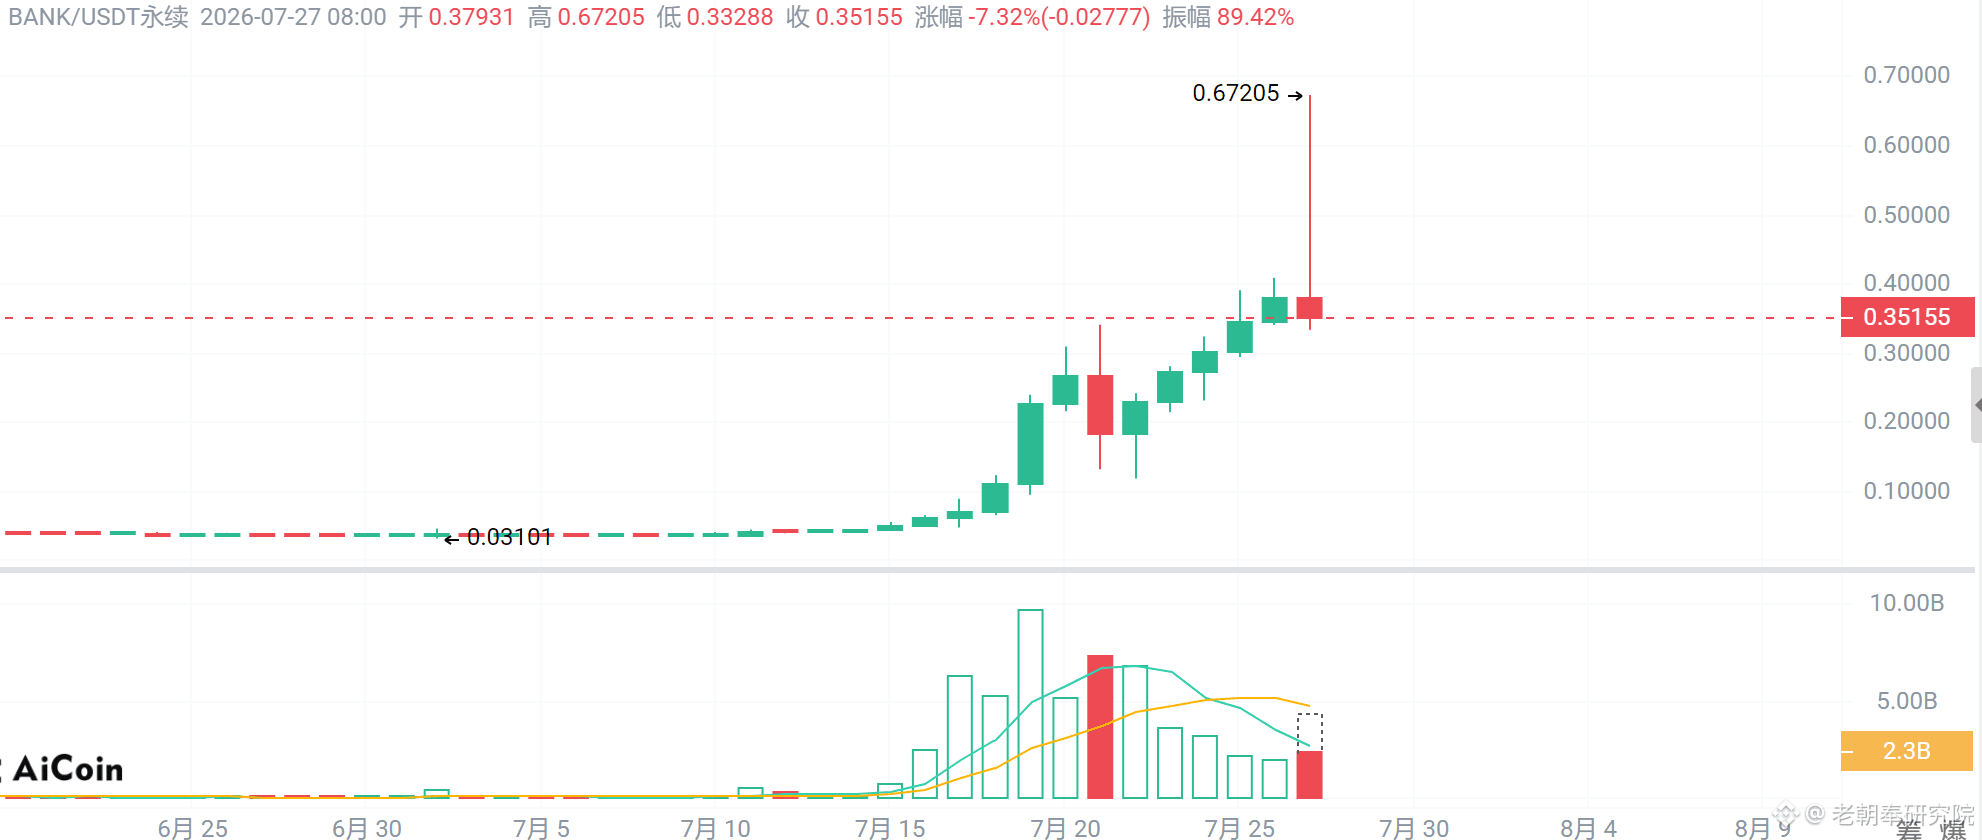
$BANK In the past few days, the trend has been very strong. The price has rapidly surged from the low end, reaching a peak near $0.67. Trading volume has also expanded noticeably, drawing considerable market attention.
However, after pushing higher today, there was a rapid pullback and the price has been fluctuating significantly in a short period. For such tokens that have been rising continuously, funds that entered at low levels earlier have already accumulated some profits, and it’s normal for some to take profit and exit.
Today’s pullback also marks a transition in this market cycle—from a one-way rally into a new phase. Momentum-chasing funds from the past few days are beginning to diverge, and the market will look for a new equilibrium point going forward.
#bank
$BANK In the past few days, the trend has been very strong. The price has rapidly surged from the low end, reaching a peak near $0.67. Trading volume has also expanded noticeably, drawing considerable market attention.
However, after pushing higher today, there was a rapid pullback and the price has been fluctuating significantly in a short period. For such tokens that have been rising continuously, funds that entered at low levels earlier have already accumulated some profits, and it’s normal for some to take profit and exit.
Today’s pullback also marks a transition in this market cycle—from a one-way rally into a new phase. Momentum-chasing funds from the past few days are beginning to diverge, and the market will look for a new equilibrium point going forward.
#bank
However, after pushing higher today, there was a rapid pullback and the price has been fluctuating significantly in a short period. For such tokens that have been rising continuously, funds that entered at low levels earlier have already accumulated some profits, and it’s normal for some to take profit and exit.
Today’s pullback also marks a transition in this market cycle—from a one-way rally into a new phase. Momentum-chasing funds from the past few days are beginning to diverge, and the market will look for a new equilibrium point going forward.
#bank
2
866
·
--
The Federal Reserve will hold its policy meeting on July 28–29, and the market is awaiting the interest rate decision and subsequent policy signals. Since the Fed’s stance often affects USD liquidity and risk-asset sentiment, $BTC ’s rising expectations for volatility ahead of the meeting are also heating up.
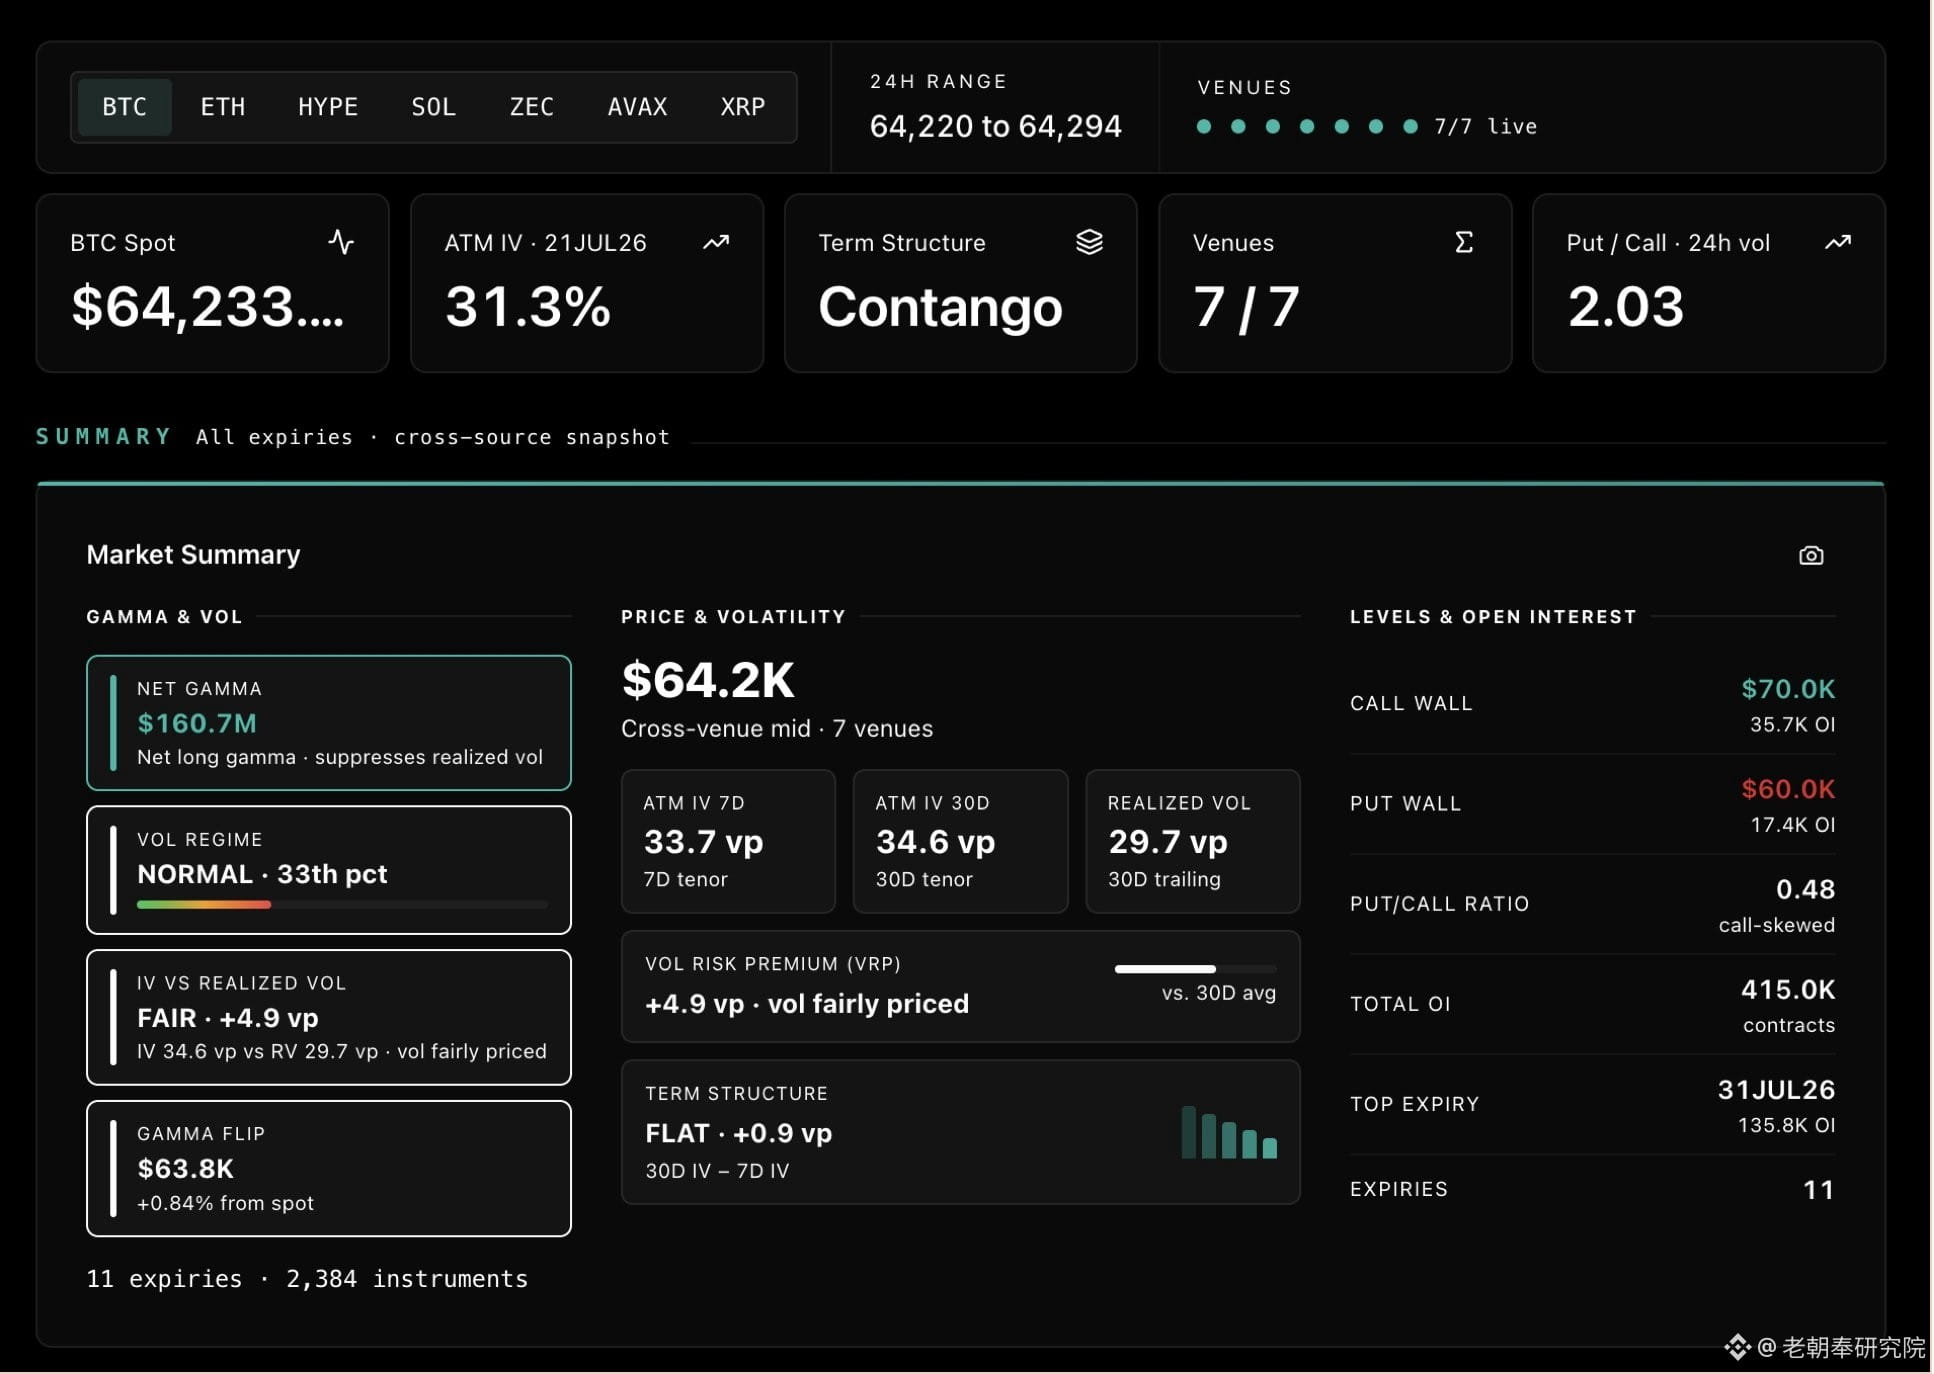
From the options market perspective, BTC is currently around $64,000. Deribit data shows that the market’s bullish open positions are mainly concentrated near $70,000; the Call Wall is at $70,000, while the Put Wall below is concentrated around $60,000.
This means that $60,000 and $70,000 are becoming key near-term battleground ranges. With the Fed meeting, end-of-month options expiry, and changes in fund positioning all overlapping, BTC’s short-term volatility could be further amplified.
#BTC #美联储会议
The Federal Reserve will hold its policy meeting on July 28–29, and the market is awaiting the interest rate decision and subsequent policy signals. Since the Fed’s stance often affects USD liquidity and risk-asset sentiment, $BTC ’s rising expectations for volatility ahead of the meeting are also heating up.
From the options market perspective, BTC is currently around $64,000. Deribit data shows that the market’s bullish open positions are mainly concentrated near $70,000; the Call Wall is at $70,000, while the Put Wall below is concentrated around $60,000.
This means that $60,000 and $70,000 are becoming key near-term battleground ranges. With the Fed meeting, end-of-month options expiry, and changes in fund positioning all overlapping, BTC’s short-term volatility could be further amplified.
#BTC #美联储会议
From the options market perspective, BTC is currently around $64,000. Deribit data shows that the market’s bullish open positions are mainly concentrated near $70,000; the Call Wall is at $70,000, while the Put Wall below is concentrated around $60,000.
This means that $60,000 and $70,000 are becoming key near-term battleground ranges. With the Fed meeting, end-of-month options expiry, and changes in fund positioning all overlapping, BTC’s short-term volatility could be further amplified.
#BTC #美联储会议
2
268
Log in to explore more content
Join global crypto users on Binance Square
⚡️ Get latest and useful information about crypto.
💬 Trusted by the world’s largest crypto exchange.
👍 Discover real insights from verified creators.
Email / Phone number
Trending Topics
BNBSurpasses$790
1,910 views
44 Discussing
$BNB strategic long plan -> FOCUS NOW
BNB has created 2 strong lows after taking out internal liquidity
I'm expecting a move towards swing high $815-$830 and looking for a long on a retest of the green box
#BNBSurpasses$790 #bnb
Ghost Writer
·0 Likes
·726 views
ZamaRises15.99%ToIntradayHigh$0.09
965 views
48 Discussing
BitcoinSpotETFsDraw$6.34BInflowsInQ3
1,836 views
39 Discussing