

BaykusCharts
394 Posts

BaykusCharts
 Square Verified
Report
Block User
13 Following
4.8K+ Followers
7.5K+ Liked
Posts
All
Quotes
Videos
PINNED
·
--
#Binance Launchpool project saw $#OMNI 55.
#Bitcoin Even though he had a bad week, $OMNI He left a sweet gift.
241k users $BNB
214k users participated in the staking program using $FDUSD .
Those who staked in the #BNB pool received 62% more returns than those who staked in the FDUSD pool (based on BNB = 574.2 USD)
Now all eyes are on the new #Launchpool project.
I hope it comes as soon as possible :)
#Binance Launchpool project saw $#OMNI 55.
#Bitcoin Even though he had a bad week, $OMNI He left a sweet gift.
241k users $BNB
214k users participated in the staking program using $FDUSD .
Those who staked in the #BNB pool received 62% more returns than those who staked in the FDUSD pool (based on BNB = 574.2 USD)
Now all eyes are on the new #Launchpool project.
I hope it comes as soon as possible :)
#Bitcoin Even though he had a bad week, $OMNI He left a sweet gift.
241k users $BNB
214k users participated in the staking program using $FDUSD .
Those who staked in the #BNB pool received 62% more returns than those who staked in the FDUSD pool (based on BNB = 574.2 USD)
Now all eyes are on the new #Launchpool project.
I hope it comes as soon as possible :)

47
1
49
195k
PINNED
·
--
Bullish
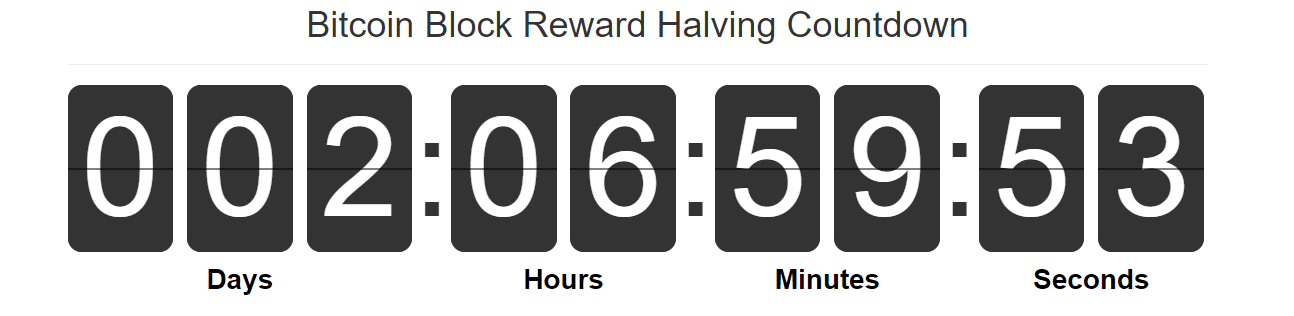
#Bitcoin Only a few days left for halving.
While the miner reward before the first halving was 50 #btc
It will be 3,125 with the last halving.
With the supply constantly decreasing, $BTC is making considerable gains.
Alright what now?
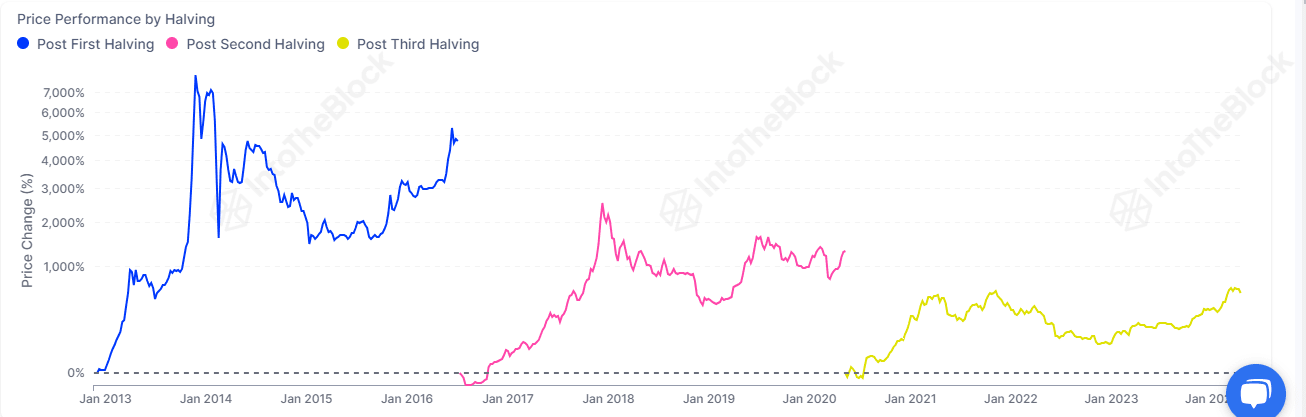
When we examine the previous movements, although there were very good increases after the Halving, BTC upward momentum has always lost its strength. Considering the regulations, this year may be the last period in which we will see incredible rises in altcoins.
Although short-term movements bother us as investors, it will not be possible to find these prices after a few months. Of course, it is not possible to call these bottoms, but they are definitely good places to buy.
So what do you think?
#Binance #ETH
#Bitcoin Only a few days left for halving.
While the miner reward before the first halving was 50 #btc
It will be 3,125 with the last halving.
With the supply constantly decreasing, $BTC is making considerable gains.
Alright what now?
When we examine the previous movements, although there were very good increases after the Halving, BTC upward momentum has always lost its strength. Considering the regulations, this year may be the last period in which we will see incredible rises in altcoins.
Although short-term movements bother us as investors, it will not be possible to find these prices after a few months. Of course, it is not possible to call these bottoms, but they are definitely good places to buy.
So what do you think?
#Binance #ETH
While the miner reward before the first halving was 50 #btc
It will be 3,125 with the last halving.
With the supply constantly decreasing, $BTC is making considerable gains.
Alright what now?
When we examine the previous movements, although there were very good increases after the Halving, BTC upward momentum has always lost its strength. Considering the regulations, this year may be the last period in which we will see incredible rises in altcoins.
Although short-term movements bother us as investors, it will not be possible to find these prices after a few months. Of course, it is not possible to call these bottoms, but they are definitely good places to buy.
So what do you think?
#Binance #ETH
5
13
115.9k
·
--
🦉 BAYKUS TD TRADE IDEA
$AAVE (AAVEUSDT) > 🔺 LONG
📍 Entry: 165.95
🎯 TP1: 169.09
🎯 TP2: 171.11
🎯 TP3: 173.94
🛑 Stop: 162.81
⚠️ Not investment advice.
#BaykusTD #LONG
🦉 BAYKUS TD TRADE IDEA
$AAVE (AAVEUSDT) > 🔺 LONG
📍 Entry: 165.95
🎯 TP1: 169.09
🎯 TP2: 171.11
🎯 TP3: 173.94
🛑 Stop: 162.81
⚠️ Not investment advice.
#BaykusTD #LONG
$AAVE (AAVEUSDT) > 🔺 LONG
📍 Entry: 165.95
🎯 TP1: 169.09
🎯 TP2: 171.11
🎯 TP3: 173.94
🛑 Stop: 162.81
⚠️ Not investment advice.
#BaykusTD #LONG
73
·
--
The rise in WLD this time is not visible only on the price chart: while the price rose 5.7%, spot volume increased by 179%, and buyers' share of taker trades climbed to 57.3%. The notable increase in the number of transactions also suggests that the move was not driven by a small number of large trades.
The fact that price, volume, and market participation are all moving in the same direction supports the rally with a stronger spot confirmation; however, since there is no open interest or funding data on the futures side, leverage contribution cannot be confirmed. The key point to watch is whether buyer flow and high trading activity will be sustained in the next candles.
The rise in WLD this time is not visible only on the price chart: while the price rose 5.7%, spot volume increased by 179%, and buyers' share of taker trades climbed to 57.3%. The notable increase in the number of transactions also suggests that the move was not driven by a small number of large trades.
The fact that price, volume, and market participation are all moving in the same direction supports the rally with a stronger spot confirmation; however, since there is no open interest or funding data on the futures side, leverage contribution cannot be confirmed. The key point to watch is whether buyer flow and high trading activity will be sustained in the next candles.
The fact that price, volume, and market participation are all moving in the same direction supports the rally with a stronger spot confirmation; however, since there is no open interest or funding data on the futures side, leverage contribution cannot be confirmed. The key point to watch is whether buyer flow and high trading activity will be sustained in the next candles.
345
·
--
The pullback in SAHARA is not a low-participation move: while the price fell 3.27%, spot volume surged 478.6% and the number of trades increased 198.5%. This picture shows that the decline occurred alongside clearly expanding market activity.
On the taker flow side, the share of selling reached 57.1%, while buyers appear to have struggled to stabilize the price. For now, the move can be read less as simple profit-taking and more as strengthening sell pressure accompanied by rising trading traffic. The key point to watch is whether the price confirms new lows while elevated volume is sustained.
The pullback in SAHARA is not a low-participation move: while the price fell 3.27%, spot volume surged 478.6% and the number of trades increased 198.5%. This picture shows that the decline occurred alongside clearly expanding market activity.
On the taker flow side, the share of selling reached 57.1%, while buyers appear to have struggled to stabilize the price. For now, the move can be read less as simple profit-taking and more as strengthening sell pressure accompanied by rising trading traffic. The key point to watch is whether the price confirms new lows while elevated volume is sustained.
On the taker flow side, the share of selling reached 57.1%, while buyers appear to have struggled to stabilize the price. For now, the move can be read less as simple profit-taking and more as strengthening sell pressure accompanied by rising trading traffic. The key point to watch is whether the price confirms new lows while elevated volume is sustained.
87
·
--
The decline in HEMI is not a low-participation pullback: while the price fell 21.2% in 24 hours, spot volume surged 749%. The sharp expansion in the number of transactions shows that the move was not driven by just a few large trades and that heavy market participation came in.
The share of sells in taker flow is at 57%; this indicates that the rising activity has not yet been balanced by buyers. Although the oversold picture does not rule out the possibility of a rebound, the data at this stage does not confirm a bottom. The main point to watch is whether HEMI will make new lows while sell volume remains high.
The decline in HEMI is not a low-participation pullback: while the price fell 21.2% in 24 hours, spot volume surged 749%. The sharp expansion in the number of transactions shows that the move was not driven by just a few large trades and that heavy market participation came in.
The share of sells in taker flow is at 57%; this indicates that the rising activity has not yet been balanced by buyers. Although the oversold picture does not rule out the possibility of a rebound, the data at this stage does not confirm a bottom. The main point to watch is whether HEMI will make new lows while sell volume remains high.
The share of sells in taker flow is at 57%; this indicates that the rising activity has not yet been balanced by buyers. Although the oversold picture does not rule out the possibility of a rebound, the data at this stage does not confirm a bottom. The main point to watch is whether HEMI will make new lows while sell volume remains high.
196
·
--
While the price in TUT fell by 8.8%, spot volume rose by 101%; however, the critical detail is that 58.9% of taker transactions were on the buy side.
In other words, although buyers were clearly active, that demand was not enough to push the price higher. A structure may have formed in which selling absorbed the buying; therefore, the increased volume alone does not confirm a recovery.
The main point to watch here is whether TUT price can find a new equilibrium while buyer dominance is maintained.
While the price in TUT fell by 8.8%, spot volume rose by 101%; however, the critical detail is that 58.9% of taker transactions were on the buy side.
In other words, although buyers were clearly active, that demand was not enough to push the price higher. A structure may have formed in which selling absorbed the buying; therefore, the increased volume alone does not confirm a recovery.
The main point to watch here is whether TUT price can find a new equilibrium while buyer dominance is maintained.
In other words, although buyers were clearly active, that demand was not enough to push the price higher. A structure may have formed in which selling absorbed the buying; therefore, the increased volume alone does not confirm a recovery.
The main point to watch here is whether TUT price can find a new equilibrium while buyer dominance is maintained.
201
·
--
While price fell 29.8% in MARSCOIN, spot volume rose 135.8%; the 125.5% increase in the number of trades shows that this move was not a low-participation pullback.
Even so, taker flow is nearly balanced. In other words, although selling pressure pushed the price down, there is no clear one-sided dominance by buyers or sellers in the market; the rising activity currently points more to heavy and indecisive trading than to a confirmed direction.
The key point to watch here is whether the rising volume turns into a clear selling flow in the next candles.
While price fell 29.8% in MARSCOIN, spot volume rose 135.8%; the 125.5% increase in the number of trades shows that this move was not a low-participation pullback.
Even so, taker flow is nearly balanced. In other words, although selling pressure pushed the price down, there is no clear one-sided dominance by buyers or sellers in the market; the rising activity currently points more to heavy and indecisive trading than to a confirmed direction.
The key point to watch here is whether the rising volume turns into a clear selling flow in the next candles.
Even so, taker flow is nearly balanced. In other words, although selling pressure pushed the price down, there is no clear one-sided dominance by buyers or sellers in the market; the rising activity currently points more to heavy and indecisive trading than to a confirmed direction.
The key point to watch here is whether the rising volume turns into a clear selling flow in the next candles.
438
·
--
While spot volume on PROM increased by 2.768%, the share of taker buys rose to 92.8%; however, this move did not come with broad-based participation.
The increase in the number of trades remained at 51.8%. In other words, there was a volume surge and strong buyer dominance, but the rise in activity did not broaden as much as the volume; a significant part of the move may have come from larger orders.
This picture points to strong spot demand in the short term, but it should not be considered confirmation of a sustainable trend. The main point to watch here is whether the high taker buy ratio and trading activity will be maintained in the following candles.
While spot volume on PROM increased by 2.768%, the share of taker buys rose to 92.8%; however, this move did not come with broad-based participation.
The increase in the number of trades remained at 51.8%. In other words, there was a volume surge and strong buyer dominance, but the rise in activity did not broaden as much as the volume; a significant part of the move may have come from larger orders.
This picture points to strong spot demand in the short term, but it should not be considered confirmation of a sustainable trend. The main point to watch here is whether the high taker buy ratio and trading activity will be maintained in the following candles.
The increase in the number of trades remained at 51.8%. In other words, there was a volume surge and strong buyer dominance, but the rise in activity did not broaden as much as the volume; a significant part of the move may have come from larger orders.
This picture points to strong spot demand in the short term, but it should not be considered confirmation of a sustainable trend. The main point to watch here is whether the high taker buy ratio and trading activity will be maintained in the following candles.
118
·
--
Spot demand for PROM has become unusually concentrated: Volume rose 2,769% while the share of taker buys climbed to 92.8%.
The price also increased 9.1% in 24 hours. The fact that such a sharp volume increase came with such clear buyer dominance suggests that the move is not merely a burst of activity, and that there is strong demand in the spot market.
Still, it has not been confirmed that this flow has turned into a lasting trend. The key point to watch here is how much the taker buy ratio will decline in the next candles while high volume is maintained.
Spot demand for PROM has become unusually concentrated: Volume rose 2,769% while the share of taker buys climbed to 92.8%.
The price also increased 9.1% in 24 hours. The fact that such a sharp volume increase came with such clear buyer dominance suggests that the move is not merely a burst of activity, and that there is strong demand in the spot market.
Still, it has not been confirmed that this flow has turned into a lasting trend. The key point to watch here is how much the taker buy ratio will decline in the next candles while high volume is maintained.
The price also increased 9.1% in 24 hours. The fact that such a sharp volume increase came with such clear buyer dominance suggests that the move is not merely a burst of activity, and that there is strong demand in the spot market.
Still, it has not been confirmed that this flow has turned into a lasting trend. The key point to watch here is how much the taker buy ratio will decline in the next candles while high volume is maintained.
119
·
--
Behind the rise in PROM, there is an unusual concentration on the buy side: Spot volume increased by about 28x, while 92.8% of taker trades occurred on the buyer side.
The price also rose 9.6% in 24 hours. This time, the increase in volume and the price move are heading in the same direction; moreover, the flow is driven not just by a balanced rise in activity, but by a clear dominance of buyers.
This picture shows that spot demand has kicked in strongly, but the sustainability of the move is not yet certain. The main point to watch here is whether the taker buy ratio will remain high in the next candles.
Behind the rise in PROM, there is an unusual concentration on the buy side: Spot volume increased by about 28x, while 92.8% of taker trades occurred on the buyer side.
The price also rose 9.6% in 24 hours. This time, the increase in volume and the price move are heading in the same direction; moreover, the flow is driven not just by a balanced rise in activity, but by a clear dominance of buyers.
This picture shows that spot demand has kicked in strongly, but the sustainability of the move is not yet certain. The main point to watch here is whether the taker buy ratio will remain high in the next candles.
The price also rose 9.6% in 24 hours. This time, the increase in volume and the price move are heading in the same direction; moreover, the flow is driven not just by a balanced rise in activity, but by a clear dominance of buyers.
This picture shows that spot demand has kicked in strongly, but the sustainability of the move is not yet certain. The main point to watch here is whether the taker buy ratio will remain high in the next candles.
163
·
--
Activity on EPIC exploded, but the price did not move: spot volume rose by 323% and the number of transactions increased by 424%.
Despite this intensity, 74% of taker trades took place on the sell side, and the price change remained at 0%. In other words, while new participation is coming into the market, selling is meeting buying; the increase in volume is not producing a bullish confirmation at this stage.
This structure may point to a picture where selling pressure is being balanced by price, rather than directionless accumulation. The key point to watch here is whether sell-side dominance continues while high activity is maintained.
Activity on EPIC exploded, but the price did not move: spot volume rose by 323% and the number of transactions increased by 424%.
Despite this intensity, 74% of taker trades took place on the sell side, and the price change remained at 0%. In other words, while new participation is coming into the market, selling is meeting buying; the increase in volume is not producing a bullish confirmation at this stage.
This structure may point to a picture where selling pressure is being balanced by price, rather than directionless accumulation. The key point to watch here is whether sell-side dominance continues while high activity is maintained.
Despite this intensity, 74% of taker trades took place on the sell side, and the price change remained at 0%. In other words, while new participation is coming into the market, selling is meeting buying; the increase in volume is not producing a bullish confirmation at this stage.
This structure may point to a picture where selling pressure is being balanced by price, rather than directionless accumulation. The key point to watch here is whether sell-side dominance continues while high activity is maintained.
74
·
--
The rise in LINK is not just about price movement: participation and buying pressure in the spot market accelerated at the same time.
Volume increased by 2,691% to 14.8 million USDT, while the number of transactions rose by 1,339%. The buy side’s share in taker trades reached 69.5%.
This picture shows that the move is supported by strong spot demand that is not evenly balanced; however, RSI at the 80 level also increases the risk of short-term overheating. The key point to watch here is whether the high trading activity and buyer dominance will be sustained in the following candles.
The rise in LINK is not just about price movement: participation and buying pressure in the spot market accelerated at the same time.
Volume increased by 2,691% to 14.8 million USDT, while the number of transactions rose by 1,339%. The buy side’s share in taker trades reached 69.5%.
This picture shows that the move is supported by strong spot demand that is not evenly balanced; however, RSI at the 80 level also increases the risk of short-term overheating. The key point to watch here is whether the high trading activity and buyer dominance will be sustained in the following candles.
Volume increased by 2,691% to 14.8 million USDT, while the number of transactions rose by 1,339%. The buy side’s share in taker trades reached 69.5%.
This picture shows that the move is supported by strong spot demand that is not evenly balanced; however, RSI at the 80 level also increases the risk of short-term overheating. The key point to watch here is whether the high trading activity and buyer dominance will be sustained in the following candles.
39
·
--
While TAO's price rose 14.6%, market participation moved in the opposite direction: spot volume fell 38.4%, and transaction count declined 30.1%.
Although the price increase was supported by buyers holding a 54.5% advantage in taker flow, the drop in volume and transaction count suggests that new participation in the rally is weakening. The RSI reaching 85.1 also shows that the move carries a short-term risk of overheating.
This picture does not invalidate the rally outright; however, for the move to continue, the current buyer flow needs to be confirmed by stronger activity. The key point to watch here is whether volume and transaction count recover while the price remains elevated.
While TAO's price rose 14.6%, market participation moved in the opposite direction: spot volume fell 38.4%, and transaction count declined 30.1%.
Although the price increase was supported by buyers holding a 54.5% advantage in taker flow, the drop in volume and transaction count suggests that new participation in the rally is weakening. The RSI reaching 85.1 also shows that the move carries a short-term risk of overheating.
This picture does not invalidate the rally outright; however, for the move to continue, the current buyer flow needs to be confirmed by stronger activity. The key point to watch here is whether volume and transaction count recover while the price remains elevated.
Although the price increase was supported by buyers holding a 54.5% advantage in taker flow, the drop in volume and transaction count suggests that new participation in the rally is weakening. The RSI reaching 85.1 also shows that the move carries a short-term risk of overheating.
This picture does not invalidate the rally outright; however, for the move to continue, the current buyer flow needs to be confirmed by stronger activity. The key point to watch here is whether volume and transaction count recover while the price remains elevated.
6
·
--
While volume on ZKC increased 7x, sellers were clearly ahead: 77.8% of taker transactions were on the sell side.
Even so, the price fell only 1% over the past 24 hours. This picture, seen alongside roughly 795,000 USDT in spot volume, shows that the strong sell flow is being absorbed for now; however, buyers have not yet established a clear advantage.
The main point to watch here is whether the price can hold at current levels while the high sell ratio persists. If selling pressure increases, the rise in volume could make a distribution risk more apparent.
While volume on ZKC increased 7x, sellers were clearly ahead: 77.8% of taker transactions were on the sell side.
Even so, the price fell only 1% over the past 24 hours. This picture, seen alongside roughly 795,000 USDT in spot volume, shows that the strong sell flow is being absorbed for now; however, buyers have not yet established a clear advantage.
The main point to watch here is whether the price can hold at current levels while the high sell ratio persists. If selling pressure increases, the rise in volume could make a distribution risk more apparent.
Even so, the price fell only 1% over the past 24 hours. This picture, seen alongside roughly 795,000 USDT in spot volume, shows that the strong sell flow is being absorbed for now; however, buyers have not yet established a clear advantage.
The main point to watch here is whether the price can hold at current levels while the high sell ratio persists. If selling pressure increases, the rise in volume could make a distribution risk more apparent.
32
·
--
Spot buyers on SUI clearly stood out, but the price has not yet fully reflected that demand: as volume rose 354%, the share of taker buys increased to 62.1%.
Even so, SUI’s 24-hour price change is only 1.2%. In other words, although trading activity and buyer inflows look strong, selling in the market may currently be meeting that demand; rather than a clear price confirmation, the picture points to a tension between intense demand and limited price response.
The key point to watch here is whether the rising spot volume and buyer dominance will be sustained. If price momentum does not strengthen while this flow continues, a structure where buys are being absorbed could come to the fore.
Spot buyers on SUI clearly stood out, but the price has not yet fully reflected that demand: as volume rose 354%, the share of taker buys increased to 62.1%.
Even so, SUI’s 24-hour price change is only 1.2%. In other words, although trading activity and buyer inflows look strong, selling in the market may currently be meeting that demand; rather than a clear price confirmation, the picture points to a tension between intense demand and limited price response.
The key point to watch here is whether the rising spot volume and buyer dominance will be sustained. If price momentum does not strengthen while this flow continues, a structure where buys are being absorbed could come to the fore.
Even so, SUI’s 24-hour price change is only 1.2%. In other words, although trading activity and buyer inflows look strong, selling in the market may currently be meeting that demand; rather than a clear price confirmation, the picture points to a tension between intense demand and limited price response.
The key point to watch here is whether the rising spot volume and buyer dominance will be sustained. If price momentum does not strengthen while this flow continues, a structure where buys are being absorbed could come to the fore.
73
·
--
As spot activity doubled on ASTER, the price declined: despite volume rising 105%, the price fell 0.6% in 24 hours.
The striking contradiction is that 70.5% of taker transactions occurred on the buy side. In other words, although buyer flow is clearly strong, it has not yet been enough to push the price higher; selling may be offsetting buys, or the market may be absorbing the buying flow.
This picture does not by itself confirm an uptrend, but it does show a divergence between spot demand and price action on ASTER that is worth watching. The key point to follow here is whether the price will react upward again while buyer dominance is maintained.
As spot activity doubled on ASTER, the price declined: despite volume rising 105%, the price fell 0.6% in 24 hours.
The striking contradiction is that 70.5% of taker transactions occurred on the buy side. In other words, although buyer flow is clearly strong, it has not yet been enough to push the price higher; selling may be offsetting buys, or the market may be absorbing the buying flow.
This picture does not by itself confirm an uptrend, but it does show a divergence between spot demand and price action on ASTER that is worth watching. The key point to follow here is whether the price will react upward again while buyer dominance is maintained.
The striking contradiction is that 70.5% of taker transactions occurred on the buy side. In other words, although buyer flow is clearly strong, it has not yet been enough to push the price higher; selling may be offsetting buys, or the market may be absorbing the buying flow.
This picture does not by itself confirm an uptrend, but it does show a divergence between spot demand and price action on ASTER that is worth watching. The key point to follow here is whether the price will react upward again while buyer dominance is maintained.
1
93
·
--
The price on RAY rose by 46%, but the critical detail is elsewhere: in spot taker transactions, sellers are ahead at 57.6%.
This sharp rise is accompanied by a 31.7% increase in spot volume and a 33.9% growth in the number of transactions. However, the dominance of the sell side shows that the move has not been directly confirmed by strong buyer flow.
This picture may suggest a structure where selling is being absorbed during the rally, but it could also point to short-term distribution risk; the data alone does not determine the direction conclusively. The main point to watch here is whether the taker buy ratio can overcome seller dominance while the price remains elevated.
The price on RAY rose by 46%, but the critical detail is elsewhere: in spot taker transactions, sellers are ahead at 57.6%.
This sharp rise is accompanied by a 31.7% increase in spot volume and a 33.9% growth in the number of transactions. However, the dominance of the sell side shows that the move has not been directly confirmed by strong buyer flow.
This picture may suggest a structure where selling is being absorbed during the rally, but it could also point to short-term distribution risk; the data alone does not determine the direction conclusively. The main point to watch here is whether the taker buy ratio can overcome seller dominance while the price remains elevated.
This sharp rise is accompanied by a 31.7% increase in spot volume and a 33.9% growth in the number of transactions. However, the dominance of the sell side shows that the move has not been directly confirmed by strong buyer flow.
This picture may suggest a structure where selling is being absorbed during the rally, but it could also point to short-term distribution risk; the data alone does not determine the direction conclusively. The main point to watch here is whether the taker buy ratio can overcome seller dominance while the price remains elevated.
57
·
--
The rise in TAO is not just about price action: as spot volume increased by 142.9%, the share of taker buys rose to 57.7%.
The price climbed 15.6% in 24 hours, and the number of transactions also rose by 106.4%. This picture shows that the move was supported by both buyer flow and broader market participation; however, RSI reaching 86.4 increases the risk of short-term overheating.
The key point to watch here is whether buyer flow can be sustained at higher levels. If volume remains strong while the taker buy ratio starts to decline, it may indicate that bullish momentum is weakening.
The rise in TAO is not just about price action: as spot volume increased by 142.9%, the share of taker buys rose to 57.7%.
The price climbed 15.6% in 24 hours, and the number of transactions also rose by 106.4%. This picture shows that the move was supported by both buyer flow and broader market participation; however, RSI reaching 86.4 increases the risk of short-term overheating.
The key point to watch here is whether buyer flow can be sustained at higher levels. If volume remains strong while the taker buy ratio starts to decline, it may indicate that bullish momentum is weakening.
The price climbed 15.6% in 24 hours, and the number of transactions also rose by 106.4%. This picture shows that the move was supported by both buyer flow and broader market participation; however, RSI reaching 86.4 increases the risk of short-term overheating.
The key point to watch here is whether buyer flow can be sustained at higher levels. If volume remains strong while the taker buy ratio starts to decline, it may indicate that bullish momentum is weakening.
1
75
·
--
Spot market activity on MBOX suddenly surged: volume jumped by 704% to 109.2K USDT, while the number of trades rose by 555% to 1,094. Despite this, taker flow remained almost balanced; the buy share was 50.9% and the sell share was 49.1%.
The price is at 0.0021 USDT, below EMA20 (0.00257) and EMA50 (0.00304). In other words, the increase in trading activity has not yet produced a clear directional confirmation; it more likely points to unusual activity emerging in a market under pressure.
The fact that the futures data cannot be used because it is in “delivering/settling” status makes the picture even riskier. For traders, the critical question is whether this volume spike will turn into a sustained flow or simply create short-term volatility within thin liquidity.
Spot market activity on MBOX suddenly surged: volume jumped by 704% to 109.2K USDT, while the number of trades rose by 555% to 1,094. Despite this, taker flow remained almost balanced; the buy share was 50.9% and the sell share was 49.1%.
The price is at 0.0021 USDT, below EMA20 (0.00257) and EMA50 (0.00304). In other words, the increase in trading activity has not yet produced a clear directional confirmation; it more likely points to unusual activity emerging in a market under pressure.
The fact that the futures data cannot be used because it is in “delivering/settling” status makes the picture even riskier. For traders, the critical question is whether this volume spike will turn into a sustained flow or simply create short-term volatility within thin liquidity.
The price is at 0.0021 USDT, below EMA20 (0.00257) and EMA50 (0.00304). In other words, the increase in trading activity has not yet produced a clear directional confirmation; it more likely points to unusual activity emerging in a market under pressure.
The fact that the futures data cannot be used because it is in “delivering/settling” status makes the picture even riskier. For traders, the critical question is whether this volume spike will turn into a sustained flow or simply create short-term volatility within thin liquidity.
1
1
Log in to explore more content
Join global crypto users on Binance Square
⚡️ Get latest and useful information about crypto.
💬 Trusted by the world’s largest crypto exchange.
👍 Discover real insights from verified creators.
Email / Phone number
Trending Topics
MetaMaskExitsLidoValidatorsAfterSecurityIncident
12,551 views
356 Discussing
🚨 METAMASK JUST STARTED EXITING ETH VALIDATORS AFTER A SECURITY INCIDENT.
MetaMask says an ongoing security incident hit part of its infrastructure, forcing it to proactively exit affected validators from its non-custodial staking operations. The company says it has found no immediate threat to MetaMask wallets so far.
The key detail?
These validators are tied to Lido staking, and the exit process may temporarily remove ETH from staking while the investigation continues. Lido-related reports say the full exit, withdrawal and re-entry cycle could take up to roughly 45 days.
That means the market should separate two things:
Wallet users are not currently being told they’re at immediate risk.
But validator infrastructure clearly was serious enough to trigger an emergency exit.
And when one of Ethereum’s biggest wallet brands starts pulling validators as a precaution, traders pay attention.
Security incidents don’t need stolen funds to become market-moving.
Sometimes the reaction itself is the signal. 👀
$ETH $LDO
#metamaskexitslidovalidatorsaftersecurityincident
KimHotbae
·0 Likes
·2.5k views
MicronBeatsEarningsLiftsGuidance
12,233 views
317 Discussing
CFTCSubmitsTwoEventContractRulesToWhiteHouse
11,251 views
308 Discussing