

凯伦宝典
108 Posts

凯伦宝典
 Square Verified
Report
Block User
13年入圈,13 年产业人,前基金管理人,做过交易所,现全职投研和投资。横跨:A股·美股·加密。X|KelenTreasure /XueQiu|同名/星球|同名

Top traders by profit in 30D

Top 30D Traders by Volume
14 Following
179 Followers
166 Liked
2 Badges
Posts
·
--
We’ve noticed something quite interesting. Just after the 86,000 level broke through, here’s what the sell orders above look like:
In terms of options, 86,000 actually has a Gamma wall, while 87,000 is a very large pressure wall. Looking at the contracts, at 87,148 there’s both pressure and liquidation positions. In the middle there aren’t really many big orders resting. The spot price is also around 87,046. So 87,000 will form a fairly strong resistance level; if it’s broken through, it looks like price could quickly move to test 88,000.
As for support, at the moment there aren’t that many buy orders between 84,000 and 86,000. It’s as if much of the heavy selling pressure above has been absorbed, while support below is still gradually forming. This kind of setup is actually relatively fragile.
I think this situation will lead to increased volatility on both the upside and downside. For execution: if a break above 87,000 is not successful, I’m planning to try placing a short order between 86,600 and 87,000; but if it does break through, then it will move to new highs
We’ve noticed something quite interesting. Just after the 86,000 level broke through, here’s what the sell orders above look like:
In terms of options, 86,000 actually has a Gamma wall, while 87,000 is a very large pressure wall. Looking at the contracts, at 87,148 there’s both pressure and liquidation positions. In the middle there aren’t really many big orders resting. The spot price is also around 87,046. So 87,000 will form a fairly strong resistance level; if it’s broken through, it looks like price could quickly move to test 88,000.
As for support, at the moment there aren’t that many buy orders between 84,000 and 86,000. It’s as if much of the heavy selling pressure above has been absorbed, while support below is still gradually forming. This kind of setup is actually relatively fragile.
I think this situation will lead to increased volatility on both the upside and downside. For execution: if a break above 87,000 is not successful, I’m planning to try placing a short order between 86,600 and 87,000; but if it does break through, then it will move to new highs
In terms of options, 86,000 actually has a Gamma wall, while 87,000 is a very large pressure wall. Looking at the contracts, at 87,148 there’s both pressure and liquidation positions. In the middle there aren’t really many big orders resting. The spot price is also around 87,046. So 87,000 will form a fairly strong resistance level; if it’s broken through, it looks like price could quickly move to test 88,000.
As for support, at the moment there aren’t that many buy orders between 84,000 and 86,000. It’s as if much of the heavy selling pressure above has been absorbed, while support below is still gradually forming. This kind of setup is actually relatively fragile.
I think this situation will lead to increased volatility on both the upside and downside. For execution: if a break above 87,000 is not successful, I’m planning to try placing a short order between 86,600 and 87,000; but if it does break through, then it will move to new highs
521
·
--
Bearish
📌 $BTC has reached the 86,600 area. I’ll watch for shorting opportunities, but I don’t plan to “short at the exact price.”
The 86,000 I was watching this morning has already been broken; the intraday high reached 86,915. Now the question has changed: after the breakout, can 86,000 hold?
🔴 86,600 is the leading edge of the observation zone, not the strongest resistance. Above that are technical levels at 86,895–87,399. The nearby confluence resistance is around 87,169; you can also see large sell orders around the 87,000 level. Orders will adjust, so you can’t rely on them alone to open a position.
⏳ I’m waiting for two types of weakening signals: (1) price falls back below 86,500 and the retest still can’t reclaim it; (2) it probes the 87,000 area, then drops, and after another attempt to push higher it fails to make a new high. Only after confirmation will I consider shorting.
🟢 If I enter, first I’ll see whether 86,000 can form support. After an effective breakdown, then I’ll watch 85,358. If it breaks above 87,399 and then pulls back while holding, the original short thesis is invalid. Around 87,148 there’s also a cluster of short liquidations—watch out for a surge that sweeps shorts.
This is a personal plan note, not a statement that a trade has been executed, and it does not constitute investment advice.
📌 $BTC has reached the 86,600 area. I’ll watch for shorting opportunities, but I don’t plan to “short at the exact price.”
The 86,000 I was watching this morning has already been broken; the intraday high reached 86,915. Now the question has changed: after the breakout, can 86,000 hold?
🔴 86,600 is the leading edge of the observation zone, not the strongest resistance. Above that are technical levels at 86,895–87,399. The nearby confluence resistance is around 87,169; you can also see large sell orders around the 87,000 level. Orders will adjust, so you can’t rely on them alone to open a position.
⏳ I’m waiting for two types of weakening signals: (1) price falls back below 86,500 and the retest still can’t reclaim it; (2) it probes the 87,000 area, then drops, and after another attempt to push higher it fails to make a new high. Only after confirmation will I consider shorting.
🟢 If I enter, first I’ll see whether 86,000 can form support. After an effective breakdown, then I’ll watch 85,358. If it breaks above 87,399 and then pulls back while holding, the original short thesis is invalid. Around 87,148 there’s also a cluster of short liquidations—watch out for a surge that sweeps shorts.
This is a personal plan note, not a statement that a trade has been executed, and it does not constitute investment advice.
The 86,000 I was watching this morning has already been broken; the intraday high reached 86,915. Now the question has changed: after the breakout, can 86,000 hold?
🔴 86,600 is the leading edge of the observation zone, not the strongest resistance. Above that are technical levels at 86,895–87,399. The nearby confluence resistance is around 87,169; you can also see large sell orders around the 87,000 level. Orders will adjust, so you can’t rely on them alone to open a position.
⏳ I’m waiting for two types of weakening signals: (1) price falls back below 86,500 and the retest still can’t reclaim it; (2) it probes the 87,000 area, then drops, and after another attempt to push higher it fails to make a new high. Only after confirmation will I consider shorting.
🟢 If I enter, first I’ll see whether 86,000 can form support. After an effective breakdown, then I’ll watch 85,358. If it breaks above 87,399 and then pulls back while holding, the original short thesis is invalid. Around 87,148 there’s also a cluster of short liquidations—watch out for a surge that sweeps shorts.
This is a personal plan note, not a statement that a trade has been executed, and it does not constitute investment advice.
410
·
--
📌 $BTC Personal note: I expect to look for a short opportunity at 85,000–85,600, but it hasn’t been executed yet. Don’t short just because it hits the price.
🔴 Why focus here? After the 11:34 refresh, the current price is about 85,385; the near-term combined resistance is 85,667 (5 sources, 3-factor confluence). At the 85,500 level you can see multiple sell walls; the technical prior high is 85,650, and 86,000 is also an options gamma wall. Several key levels are clustered together, but the pending orders can change at any time.
⏳ Entry requires confirmation: first a pullback, then a renewed push up that cannot break to a new high—then I consider shorting. If a 4-hour close is above 86,000 and the subsequent retest still holds, I’ll cancel this thesis.
🟢 Downside: first look at 84,712; if it breaks and the retest can’t hold back above, then look at 83,770. Support is not a guaranteed “bottom.”
Personal trading plan record only; not investment advice.
#BTC
📌 $BTC Personal note: I expect to look for a short opportunity at 85,000–85,600, but it hasn’t been executed yet. Don’t short just because it hits the price.
🔴 Why focus here? After the 11:34 refresh, the current price is about 85,385; the near-term combined resistance is 85,667 (5 sources, 3-factor confluence). At the 85,500 level you can see multiple sell walls; the technical prior high is 85,650, and 86,000 is also an options gamma wall. Several key levels are clustered together, but the pending orders can change at any time.
⏳ Entry requires confirmation: first a pullback, then a renewed push up that cannot break to a new high—then I consider shorting. If a 4-hour close is above 86,000 and the subsequent retest still holds, I’ll cancel this thesis.
🟢 Downside: first look at 84,712; if it breaks and the retest can’t hold back above, then look at 83,770. Support is not a guaranteed “bottom.”
Personal trading plan record only; not investment advice.
#BTC
🔴 Why focus here? After the 11:34 refresh, the current price is about 85,385; the near-term combined resistance is 85,667 (5 sources, 3-factor confluence). At the 85,500 level you can see multiple sell walls; the technical prior high is 85,650, and 86,000 is also an options gamma wall. Several key levels are clustered together, but the pending orders can change at any time.
⏳ Entry requires confirmation: first a pullback, then a renewed push up that cannot break to a new high—then I consider shorting. If a 4-hour close is above 86,000 and the subsequent retest still holds, I’ll cancel this thesis.
🟢 Downside: first look at 84,712; if it breaks and the retest can’t hold back above, then look at 83,770. Support is not a guaranteed “bottom.”
Personal trading plan record only; not investment advice.
#BTC
5
1
896
·
--
#比特币升破85200美元 Last night after the PCE, $BTC briefly surged to 85,650; now it has returned to around 83,800. I tried going up, but it hasn’t held.
🔴 Why is it hard to get past the upper levels?
85,200–86,000 remains the main pressure zone, with a center around 85,614. The daily pivot at 85,555, the options levels at 85,500/86,000, and the dense liquidation area near 85,233 all overlap here. The liquidation zone isn’t a simple “sell wall.” A real breakout could actually accelerate. Hitting a resistance level doesn’t automatically mean it will drop right away.
🟡 For now, watch whether 84,176 can hold. Above that there’s also a confluence resistance around 85,106. Repeatedly crossing near 84,000 isn’t enough to prove the direction has already been chosen.
🟢 On the downside, first look at whether 83,226 can absorb. 82,434–83,378 is a wider support observation band, with stronger confluence near 82,471. The daily pivot at 82,808, the prior low at 82,557, the options levels at 83,000/82,500, and buy-side resting orders all stack in this area. If it breaks below 82,434 and the rebound still can’t reclaim the level, then look to 81,685.
More important than the prices is the rhythm: after the first rally failed and pulled back, ask whether the second push up can make a new high.
For market-screening only; not investment advice.
#比特币升破85200美元 Last night after the PCE, $BTC briefly surged to 85,650; now it has returned to around 83,800. I tried going up, but it hasn’t held.
🔴 Why is it hard to get past the upper levels?
85,200–86,000 remains the main pressure zone, with a center around 85,614. The daily pivot at 85,555, the options levels at 85,500/86,000, and the dense liquidation area near 85,233 all overlap here. The liquidation zone isn’t a simple “sell wall.” A real breakout could actually accelerate. Hitting a resistance level doesn’t automatically mean it will drop right away.
🟡 For now, watch whether 84,176 can hold. Above that there’s also a confluence resistance around 85,106. Repeatedly crossing near 84,000 isn’t enough to prove the direction has already been chosen.
🟢 On the downside, first look at whether 83,226 can absorb. 82,434–83,378 is a wider support observation band, with stronger confluence near 82,471. The daily pivot at 82,808, the prior low at 82,557, the options levels at 83,000/82,500, and buy-side resting orders all stack in this area. If it breaks below 82,434 and the rebound still can’t reclaim the level, then look to 81,685.
More important than the prices is the rhythm: after the first rally failed and pulled back, ask whether the second push up can make a new high.
For market-screening only; not investment advice.
🔴 Why is it hard to get past the upper levels?
85,200–86,000 remains the main pressure zone, with a center around 85,614. The daily pivot at 85,555, the options levels at 85,500/86,000, and the dense liquidation area near 85,233 all overlap here. The liquidation zone isn’t a simple “sell wall.” A real breakout could actually accelerate. Hitting a resistance level doesn’t automatically mean it will drop right away.
🟡 For now, watch whether 84,176 can hold. Above that there’s also a confluence resistance around 85,106. Repeatedly crossing near 84,000 isn’t enough to prove the direction has already been chosen.
🟢 On the downside, first look at whether 83,226 can absorb. 82,434–83,378 is a wider support observation band, with stronger confluence near 82,471. The daily pivot at 82,808, the prior low at 82,557, the options levels at 83,000/82,500, and buy-side resting orders all stack in this area. If it breaks below 82,434 and the rebound still can’t reclaim the level, then look to 81,685.
More important than the prices is the rhythm: after the first rally failed and pulled back, ask whether the second push up can make a new high.
For market-screening only; not investment advice.
3
2
8.2k
·
--
📌【BTC Live Trading Review】85,500 short position—why did you take profit in two rounds around 83,500?
20X full position short|2 BTC
Entry average price: 85,500
Two-round take-profit weighted average: 83,754.80
Realized: +3,392.57 USDT|+39.68%
🔴【Short Setup Logic】
85,000—87,000 isn’t a single resistance line, but an entire resonance zone:
Technical resistance 85,158—85,259|URPD trapped coins 85,201|Options wall 85,000/86,000|~$116.5 million sell wall around 85,500.
🟢【Closing Logic】
After price dropped to around 83,500, the first layer of confluence support appeared:
83,526 confirmed by 8 data sources across 3 dimensions;
on-chain support 83,570;
options Gamma support 83,500;
4-hour pivot and prior lows clustered around 83,000—84,000.
Support is an area, not an exact point—so I took profit in two rounds.
83,754.80 is the weighted average of the two fills.
⚠️【Why not bet on a break below 83,000】
At the time, there was no new clear bearish catalyst. Relying only on normal sell orders to continuously break through 83,500 and 83,000 was not easy.
If we truly break below effectively, I would wait for three things to align: a new negative catalyst, increased volume, and after the break, the retest fails to reclaim.
✅Conclusion: Resistance confluence determines the entry, support confluence determines the exit.
Not guessing the top or bottom—it's completing a full loop using the same set of indicators.#比特币升破85200美元
High leverage involves extremely high risk. This is for trading review only and does not constitute investment advice.
$BTC
📌【BTC Live Trading Review】85,500 short position—why did you take profit in two rounds around 83,500?
20X full position short|2 BTC
Entry average price: 85,500
Two-round take-profit weighted average: 83,754.80
Realized: +3,392.57 USDT|+39.68%
🔴【Short Setup Logic】
85,000—87,000 isn’t a single resistance line, but an entire resonance zone:
Technical resistance 85,158—85,259|URPD trapped coins 85,201|Options wall 85,000/86,000|~$116.5 million sell wall around 85,500.
🟢【Closing Logic】
After price dropped to around 83,500, the first layer of confluence support appeared:
83,526 confirmed by 8 data sources across 3 dimensions;
on-chain support 83,570;
options Gamma support 83,500;
4-hour pivot and prior lows clustered around 83,000—84,000.
Support is an area, not an exact point—so I took profit in two rounds.
83,754.80 is the weighted average of the two fills.
⚠️【Why not bet on a break below 83,000】
At the time, there was no new clear bearish catalyst. Relying only on normal sell orders to continuously break through 83,500 and 83,000 was not easy.
If we truly break below effectively, I would wait for three things to align: a new negative catalyst, increased volume, and after the break, the retest fails to reclaim.
✅Conclusion: Resistance confluence determines the entry, support confluence determines the exit.
Not guessing the top or bottom—it's completing a full loop using the same set of indicators.#比特币升破85200美元
High leverage involves extremely high risk. This is for trading review only and does not constitute investment advice.
$BTC
20X full position short|2 BTC
Entry average price: 85,500
Two-round take-profit weighted average: 83,754.80
Realized: +3,392.57 USDT|+39.68%
🔴【Short Setup Logic】
85,000—87,000 isn’t a single resistance line, but an entire resonance zone:
Technical resistance 85,158—85,259|URPD trapped coins 85,201|Options wall 85,000/86,000|~$116.5 million sell wall around 85,500.
🟢【Closing Logic】
After price dropped to around 83,500, the first layer of confluence support appeared:
83,526 confirmed by 8 data sources across 3 dimensions;
on-chain support 83,570;
options Gamma support 83,500;
4-hour pivot and prior lows clustered around 83,000—84,000.
Support is an area, not an exact point—so I took profit in two rounds.
83,754.80 is the weighted average of the two fills.
⚠️【Why not bet on a break below 83,000】
At the time, there was no new clear bearish catalyst. Relying only on normal sell orders to continuously break through 83,500 and 83,000 was not easy.
If we truly break below effectively, I would wait for three things to align: a new negative catalyst, increased volume, and after the break, the retest fails to reclaim.
✅Conclusion: Resistance confluence determines the entry, support confluence determines the exit.
Not guessing the top or bottom—it's completing a full loop using the same set of indicators.#比特币升破85200美元
High leverage involves extremely high risk. This is for trading review only and does not constitute investment advice.
$BTC
358
·
--
Bearish
📌【Live trading】I started shorting around 86,500 $BTC
Current position average price: 【85,500】(position details shown below)
🔴【Pressure resonance: 85,000—87,000】
① Technical analysis: 85,158—85,259
② On-chain URPD: 85,201
③ Options wall: 85,000 / 86,000
④ Sell wall: 85K 1,078万|85.5K 1,165万|87K 2,089万美元
⑤ Liquidation cluster: 85,254 (not a sell wall; a breakout will accelerate a short squeeze)
🟢【Support below】
84,429 → 83,526 → 82,400—82,884
⚠️【Trading plan】
Break below 84,429: continue to look for shorts
Regain 85,558: short advantage weakens
4H recapture of 86,000: reassess
87,250—87,918: invalidation of the thesis
✅【Conclusion】The short thesis is still intact, but we’ve reached the first support—no chasing shorts.
#比特币升破85200美元
📌【Live trading】I started shorting around 86,500 $BTC
Current position average price: 【85,500】(position details shown below)
🔴【Pressure resonance: 85,000—87,000】
① Technical analysis: 85,158—85,259
② On-chain URPD: 85,201
③ Options wall: 85,000 / 86,000
④ Sell wall: 85K 1,078万|85.5K 1,165万|87K 2,089万美元
⑤ Liquidation cluster: 85,254 (not a sell wall; a breakout will accelerate a short squeeze)
🟢【Support below】
84,429 → 83,526 → 82,400—82,884
⚠️【Trading plan】
Break below 84,429: continue to look for shorts
Regain 85,558: short advantage weakens
4H recapture of 86,000: reassess
87,250—87,918: invalidation of the thesis
✅【Conclusion】The short thesis is still intact, but we’ve reached the first support—no chasing shorts.
#比特币升破85200美元
Current position average price: 【85,500】(position details shown below)
🔴【Pressure resonance: 85,000—87,000】
① Technical analysis: 85,158—85,259
② On-chain URPD: 85,201
③ Options wall: 85,000 / 86,000
④ Sell wall: 85K 1,078万|85.5K 1,165万|87K 2,089万美元
⑤ Liquidation cluster: 85,254 (not a sell wall; a breakout will accelerate a short squeeze)
🟢【Support below】
84,429 → 83,526 → 82,400—82,884
⚠️【Trading plan】
Break below 84,429: continue to look for shorts
Regain 85,558: short advantage weakens
4H recapture of 86,000: reassess
87,250—87,918: invalidation of the thesis
✅【Conclusion】The short thesis is still intact, but we’ve reached the first support—no chasing shorts.
#比特币升破85200美元
7
3
4.2k
·
--
This opened a small position:
1. In options, there’s a gamma wall here.
2. For the contract, there’s a certain amount of resting orders on the short side to close out—if they get filled, it’ll be clean.
3. This is a very strong pressure level.
This opened a small position:
1. In options, there’s a gamma wall here.
2. For the contract, there’s a certain amount of resting orders on the short side to close out—if they get filled, it’ll be clean.
3. This is a very strong pressure level.
1. In options, there’s a gamma wall here.
2. For the contract, there’s a certain amount of resting orders on the short side to close out—if they get filled, it’ll be clean.
3. This is a very strong pressure level.
6
1
596
·
--
There is still support near 83,000.
There are more events this week
✅ Rising oil prices are intensifying inflation concerns
✅ I’m not optimistic that short-term political conflicts will be resolved
✅ High bond yields + high oil prices put pressure on gold and silver / high-growth stocks
BTC has support around 82,500. I don’t think it will drop directly; most likely it will continue to grind in a range
There is still support near 83,000.
There are more events this week
✅ Rising oil prices are intensifying inflation concerns
✅ I’m not optimistic that short-term political conflicts will be resolved
✅ High bond yields + high oil prices put pressure on gold and silver / high-growth stocks
BTC has support around 82,500. I don’t think it will drop directly; most likely it will continue to grind in a range
There are more events this week
✅ Rising oil prices are intensifying inflation concerns
✅ I’m not optimistic that short-term political conflicts will be resolved
✅ High bond yields + high oil prices put pressure on gold and silver / high-growth stocks
BTC has support around 82,500. I don’t think it will drop directly; most likely it will continue to grind in a range

1
1
352
·
--
Latest views on BTC:
1. 83,000–84,000 does form a tactical support zone, but it is not an unconditional dip-buying area. The position with the best odds is around 83,500, not the current price near 84,400.
2. On the perpetual side, participants are actively selling or reducing positions, but in the past hour there has been some spot absorption, and the price has not continued to drop. This suggests there is support around 83,000–84,000, but the strength of that support is not high enough—especially since the 24-hour spot CVD is still negative.
3. The ETF and CME are closed, so perpetuals are taking on more of the price discovery. The quality of confirmed trading volume and order flow needs to be discounted. Holding the level over the weekend does not guarantee it will hold once liquidity fully returns on Monday.
4. STH profitable supply accounts for 94.1%, and short-term holders are generally in the green. This both indicates structural recovery and also implies that profit-taking around 85,000 is likely.
5. The accumulation trend score is only 0.37, still leaning toward distribution. This indicates that the people buying the bottom are continuously selling.
6. Stablecoins have had net outflows of about $602 million over the past 7 days.
Mainly stay on the sidelines.
Latest views on BTC:
1. 83,000–84,000 does form a tactical support zone, but it is not an unconditional dip-buying area. The position with the best odds is around 83,500, not the current price near 84,400.
2. On the perpetual side, participants are actively selling or reducing positions, but in the past hour there has been some spot absorption, and the price has not continued to drop. This suggests there is support around 83,000–84,000, but the strength of that support is not high enough—especially since the 24-hour spot CVD is still negative.
3. The ETF and CME are closed, so perpetuals are taking on more of the price discovery. The quality of confirmed trading volume and order flow needs to be discounted. Holding the level over the weekend does not guarantee it will hold once liquidity fully returns on Monday.
4. STH profitable supply accounts for 94.1%, and short-term holders are generally in the green. This both indicates structural recovery and also implies that profit-taking around 85,000 is likely.
5. The accumulation trend score is only 0.37, still leaning toward distribution. This indicates that the people buying the bottom are continuously selling.
6. Stablecoins have had net outflows of about $602 million over the past 7 days.
Mainly stay on the sidelines.
1. 83,000–84,000 does form a tactical support zone, but it is not an unconditional dip-buying area. The position with the best odds is around 83,500, not the current price near 84,400.
2. On the perpetual side, participants are actively selling or reducing positions, but in the past hour there has been some spot absorption, and the price has not continued to drop. This suggests there is support around 83,000–84,000, but the strength of that support is not high enough—especially since the 24-hour spot CVD is still negative.
3. The ETF and CME are closed, so perpetuals are taking on more of the price discovery. The quality of confirmed trading volume and order flow needs to be discounted. Holding the level over the weekend does not guarantee it will hold once liquidity fully returns on Monday.
4. STH profitable supply accounts for 94.1%, and short-term holders are generally in the green. This both indicates structural recovery and also implies that profit-taking around 85,000 is likely.
5. The accumulation trend score is only 0.37, still leaning toward distribution. This indicates that the people buying the bottom are continuously selling.
6. Stablecoins have had net outflows of about $602 million over the past 7 days.
Mainly stay on the sidelines.
1
470
·
--
I bought the dip.
This level won’t break down that quickly.
I bought the dip.
This level won’t break down that quickly.
This level won’t break down that quickly.
11
6
8.5k
·
--
Predicting a move to form an M top.
1. High growth is not sustainable.
2. We need more narrative.
Predicting a move to form an M top.
1. High growth is not sustainable.
2. We need more narrative.
1. High growth is not sustainable.
2. We need more narrative.
1
4
427
·
--
Bearish
{spot}(BTCUSDT)
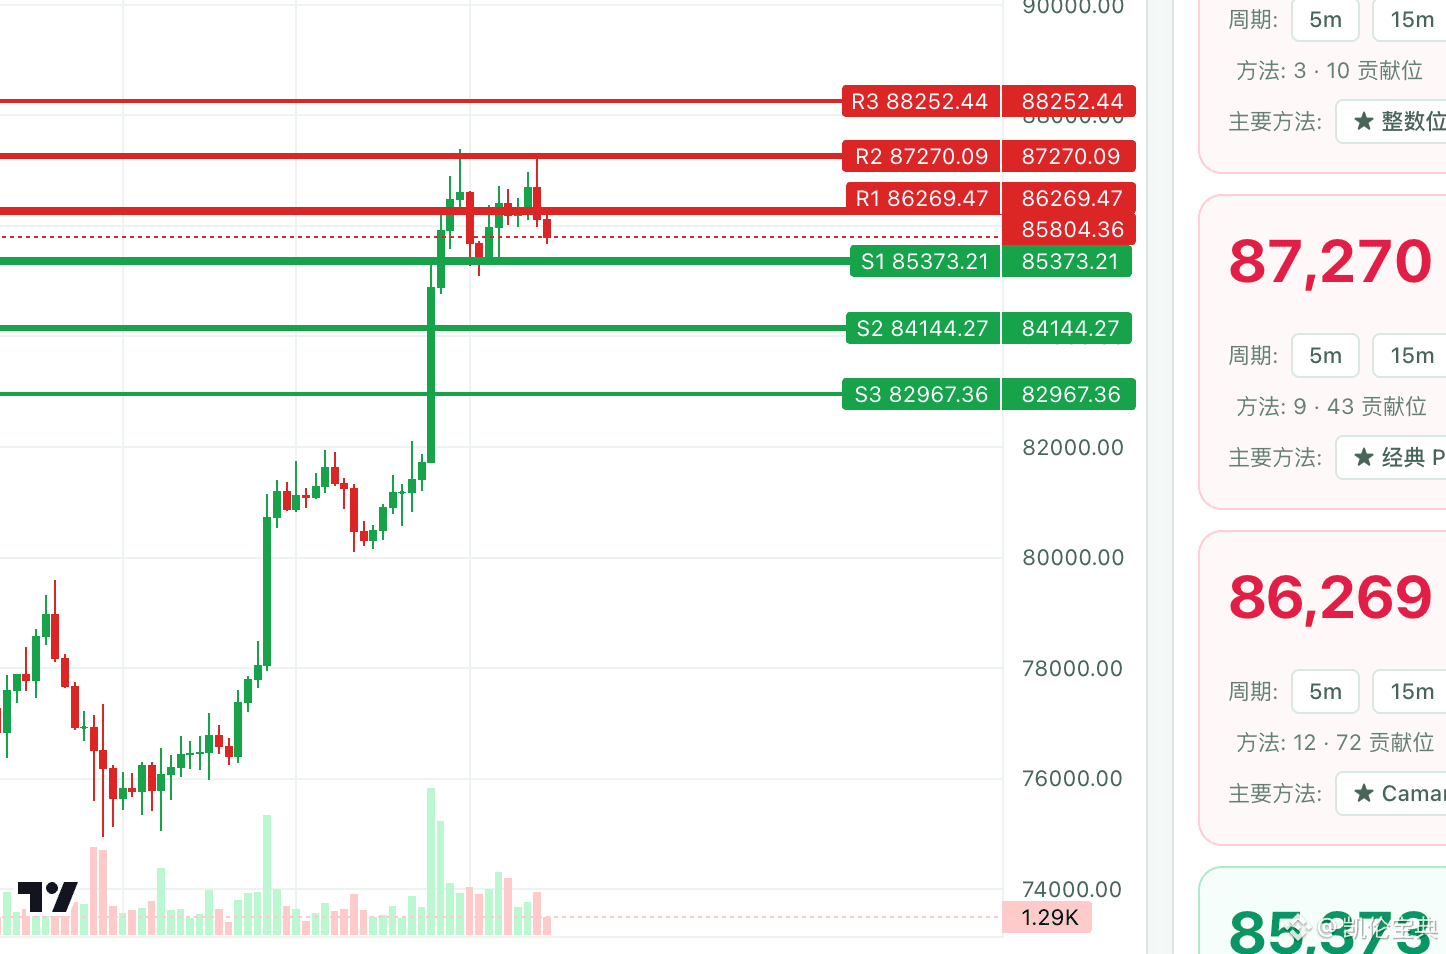
There is a clear problem with the current trend:
1. Two times it was rejected around 87300.
2. The 1-hour chart’s middle band is sloping downward.
3. Clearly defined pressure and resistance levels $$
There is a clear problem with the current trend:
1. Two times it was rejected around 87300.
2. The 1-hour chart’s middle band is sloping downward.
3. Clearly defined pressure and resistance levels $$
1. Two times it was rejected around 87300.
2. The 1-hour chart’s middle band is sloping downward.
3. Clearly defined pressure and resistance levels $$
1
1.9k
·
--
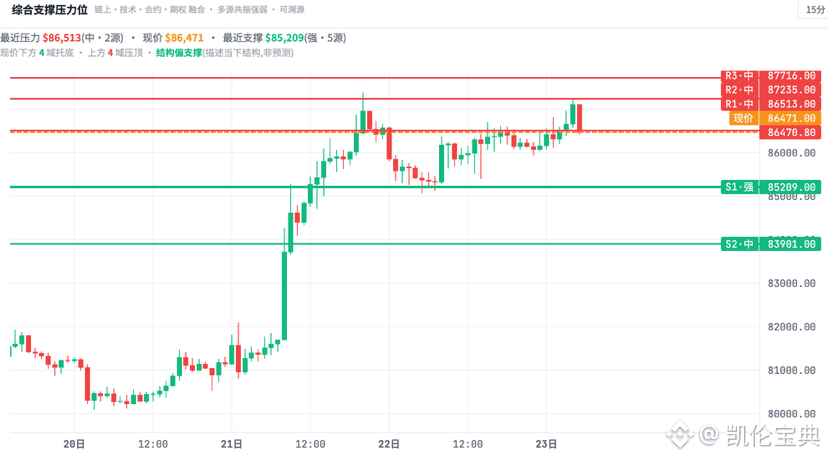
Keep adding positions to continue shorting
The pressure level has failed a second test
Keep adding positions to continue shorting
The pressure level has failed a second test
The pressure level has failed a second test
11
1
3.4k
·
--
Bearish
$SNDK Sandisk today put in one bullish candlestick surge upward, breaking through 1900, and now it's back around 1860.
The main driving force is that Meta's MUSE product has become really popular, proving that it works on the consumer side. If it works there, then storage might see even greater demand, which is why Sandisk's earnings have benefited a lot.
But in reality, I think this narrative is just a continuation of the original KV Cache story, not a brand-new big narrative. So the 1900 level still has some pressure. I put on a short position around 1900 and will take a short-term look to see if I can catch it.
$SNDK Sandisk today put in one bullish candlestick surge upward, breaking through 1900, and now it's back around 1860.
The main driving force is that Meta's MUSE product has become really popular, proving that it works on the consumer side. If it works there, then storage might see even greater demand, which is why Sandisk's earnings have benefited a lot.
But in reality, I think this narrative is just a continuation of the original KV Cache story, not a brand-new big narrative. So the 1900 level still has some pressure. I put on a short position around 1900 and will take a short-term look to see if I can catch it.
The main driving force is that Meta's MUSE product has become really popular, proving that it works on the consumer side. If it works there, then storage might see even greater demand, which is why Sandisk's earnings have benefited a lot.
But in reality, I think this narrative is just a continuation of the original KV Cache story, not a brand-new big narrative. So the 1900 level still has some pressure. I put on a short position around 1900 and will take a short-term look to see if I can catch it.
9
1
2.5k
·
--
My view on Bitcoin is very simple: go long on pullbacks, or go long while it is consolidating.
This morning it already reached a position above 87,000. This is pretty much at the extreme, and it needs to digest the current profit-taking. So either it pulls back a bit, or it consolidates and trades sideways within a range.
This morning it moved down out of the lower bound of a range and reached and stabilized around the low 85,000s—just above 85,000. If it continues to trade sideways, I’d lean toward it doing so within a channel range. The upper boundary of the channel is actually very clear: it’s around 87,300, which is what it moved out to this morning. The lower boundary is 85,000. On the short-term 15-minute timeframe, the extreme downside I can see is 84,000. At most, it might retrace to about 84,200.
I think from here onward, it will most likely keep ranging within this channel.
If you’re trading short-term right now, I think it will be this kind of movement on the 15-minute level.
And above all, don’t go short with a heavy position—punch out the “go short with heavy size” button!$
My view on Bitcoin is very simple: go long on pullbacks, or go long while it is consolidating.
This morning it already reached a position above 87,000. This is pretty much at the extreme, and it needs to digest the current profit-taking. So either it pulls back a bit, or it consolidates and trades sideways within a range.
This morning it moved down out of the lower bound of a range and reached and stabilized around the low 85,000s—just above 85,000. If it continues to trade sideways, I’d lean toward it doing so within a channel range. The upper boundary of the channel is actually very clear: it’s around 87,300, which is what it moved out to this morning. The lower boundary is 85,000. On the short-term 15-minute timeframe, the extreme downside I can see is 84,000. At most, it might retrace to about 84,200.
I think from here onward, it will most likely keep ranging within this channel.
If you’re trading short-term right now, I think it will be this kind of movement on the 15-minute level.
And above all, don’t go short with a heavy position—punch out the “go short with heavy size” button!$
This morning it already reached a position above 87,000. This is pretty much at the extreme, and it needs to digest the current profit-taking. So either it pulls back a bit, or it consolidates and trades sideways within a range.
This morning it moved down out of the lower bound of a range and reached and stabilized around the low 85,000s—just above 85,000. If it continues to trade sideways, I’d lean toward it doing so within a channel range. The upper boundary of the channel is actually very clear: it’s around 87,300, which is what it moved out to this morning. The lower boundary is 85,000. On the short-term 15-minute timeframe, the extreme downside I can see is 84,000. At most, it might retrace to about 84,200.
I think from here onward, it will most likely keep ranging within this channel.
If you’re trading short-term right now, I think it will be this kind of movement on the 15-minute level.
And above all, don’t go short with a heavy position—punch out the “go short with heavy size” button!$
3
1.3k
·
--
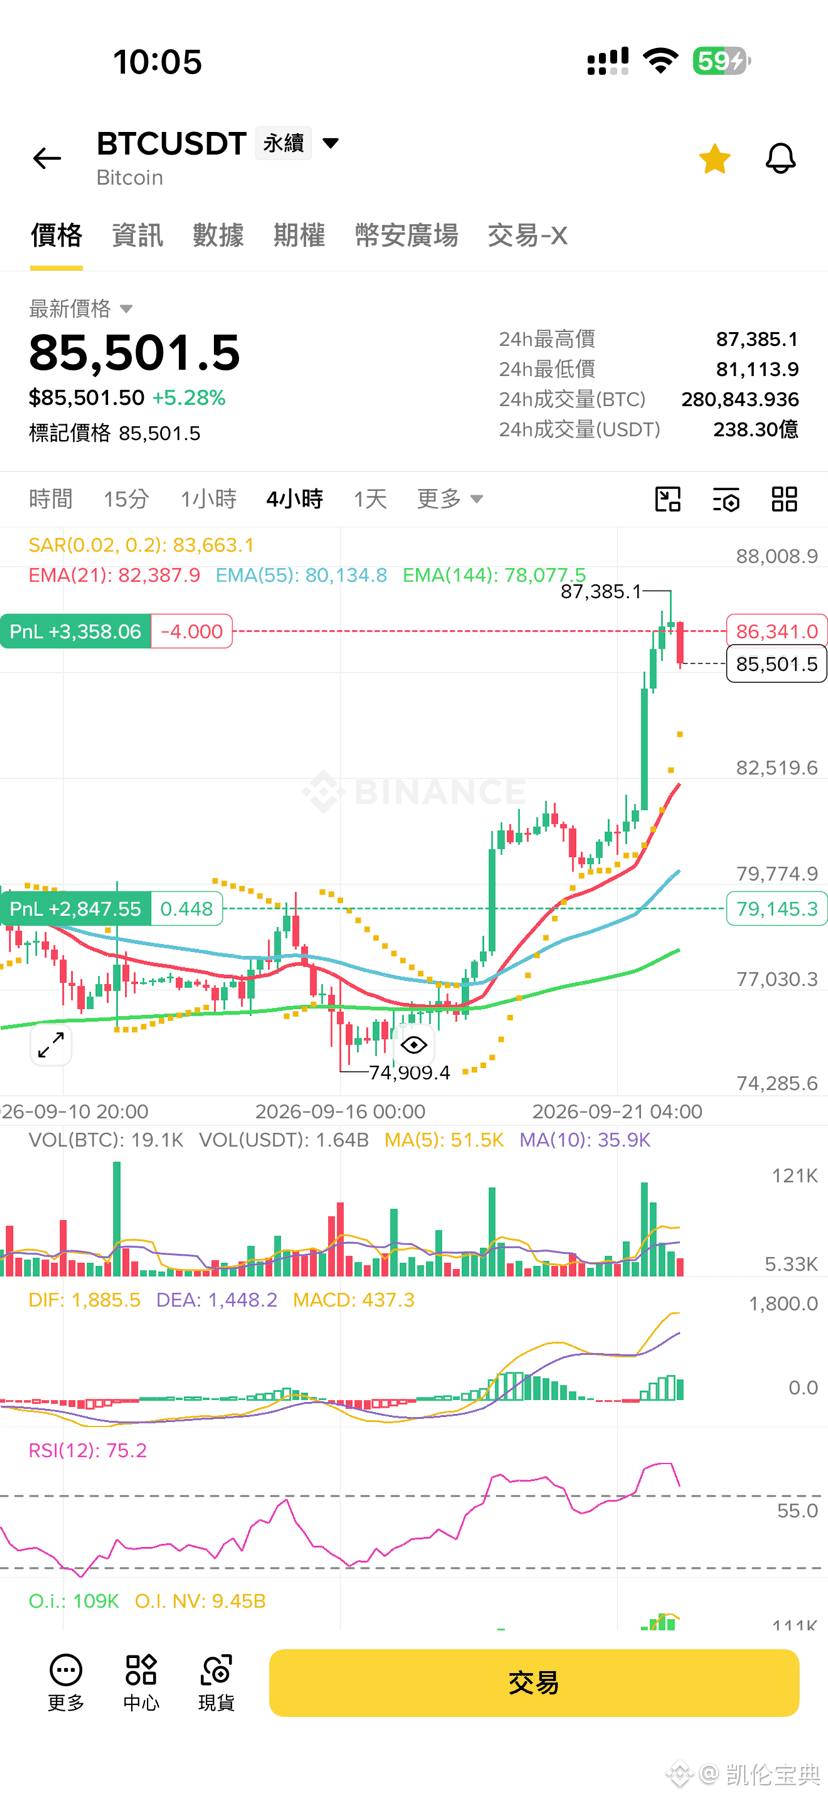
$BTC This Bitcoin long position is basically about to be finished. Leave a bit of a core position and observe for now.
From the 4-hour timeframe, it really has formed a pattern that looks a bit like a bearish evening star. In the area from around 87,000 to over 88,000, there’s very heavy resistance. As we mentioned yesterday, 82,000 to 88,000 is essentially a vacuum zone. “Vacuum zone” means there are relatively fewer pending orders here, so price swings—up or down—are both relatively easy.
Right now, the sentiment in the group is that people are shouting for a pullback and likely many will go bottom-fishing. I think this area might trap some people.
However, from the weekly chart perspective, the overall trend is still bullish. So my next plan is:
1. Reduce most of the previous long positions at this level.
2. When there’s a pullback to the 4-hour support area, then buy again.
$BTC This Bitcoin long position is basically about to be finished. Leave a bit of a core position and observe for now.
From the 4-hour timeframe, it really has formed a pattern that looks a bit like a bearish evening star. In the area from around 87,000 to over 88,000, there’s very heavy resistance. As we mentioned yesterday, 82,000 to 88,000 is essentially a vacuum zone. “Vacuum zone” means there are relatively fewer pending orders here, so price swings—up or down—are both relatively easy.
Right now, the sentiment in the group is that people are shouting for a pullback and likely many will go bottom-fishing. I think this area might trap some people.
However, from the weekly chart perspective, the overall trend is still bullish. So my next plan is:
1. Reduce most of the previous long positions at this level.
2. When there’s a pullback to the 4-hour support area, then buy again.
From the 4-hour timeframe, it really has formed a pattern that looks a bit like a bearish evening star. In the area from around 87,000 to over 88,000, there’s very heavy resistance. As we mentioned yesterday, 82,000 to 88,000 is essentially a vacuum zone. “Vacuum zone” means there are relatively fewer pending orders here, so price swings—up or down—are both relatively easy.
Right now, the sentiment in the group is that people are shouting for a pullback and likely many will go bottom-fishing. I think this area might trap some people.
However, from the weekly chart perspective, the overall trend is still bullish. So my next plan is:
1. Reduce most of the previous long positions at this level.
2. When there’s a pullback to the 4-hour support area, then buy again.
2
3
5.5k
·
--
Light shorting. The logic is
1. Test the top position.
2. The strong pressure level test fails.
3. Break the line to short.
Light shorting. The logic is
1. Test the top position.
2. The strong pressure level test fails.
3. Break the line to short.
1. Test the top position.
2. The strong pressure level test fails.
3. Break the line to short.
2
363
·
--
Just now I counted RPCs on the mainnet by myself for 62 seconds: 232 slots, 268.7 milliseconds per slot.
What people call “Solana’s target block time reduced to 250 milliseconds” sounds like an upgrade that hasn’t happened yet. In practice, it’s not like that.
Tonight at 22:58, three sets of one-minute sampling per slot were 265.5 / 275.2 / 265.5 milliseconds; my own run stretched to 62 seconds was 268.7.
From current epoch 1039 until now, with 660 validators, a total of 241,011 block slots were produced, 50 were missed, and the skip rate is 0.021%.
This shows that 250ms isn’t “speeding up” — it’s “ratifying” what was already true. The network has already been running at 265 to 275 milliseconds; hard-coding the parameter only turns an existing fact into a protocol requirement. Performance won’t suddenly get faster by another chunk.
What’s truly not priced-in is the other half: in the same batch of sampling, total transactions were 5,315 to 5,547 TPS, and vote transactions alone accounted for 152,281, nearly half. The confirmation latency users feel is mainly where this consensus overhead comes in, not the inter-block interval.
My view: treating 250ms as good news to buy SOL is buying the wrong thesis. SOL is now 118.00, up +9.06% over 24 hours. The perpetual funding rate is still the 0.0100% baseline, and retail—63.4%—is long.
Here’s a falsifiable one: if, within one month after 250ms officially takes effect, non-vote TPS does not rise by 30% or more relative to tonight’s 2,869 to 3,009, then this upgrade has zero impact on real usage. When that happens, I’ll come back and post the numbers.
#Solana目标出块时间降至250毫秒 $SOL
Just now I counted RPCs on the mainnet by myself for 62 seconds: 232 slots, 268.7 milliseconds per slot.
What people call “Solana’s target block time reduced to 250 milliseconds” sounds like an upgrade that hasn’t happened yet. In practice, it’s not like that.
Tonight at 22:58, three sets of one-minute sampling per slot were 265.5 / 275.2 / 265.5 milliseconds; my own run stretched to 62 seconds was 268.7.
From current epoch 1039 until now, with 660 validators, a total of 241,011 block slots were produced, 50 were missed, and the skip rate is 0.021%.
This shows that 250ms isn’t “speeding up” — it’s “ratifying” what was already true. The network has already been running at 265 to 275 milliseconds; hard-coding the parameter only turns an existing fact into a protocol requirement. Performance won’t suddenly get faster by another chunk.
What’s truly not priced-in is the other half: in the same batch of sampling, total transactions were 5,315 to 5,547 TPS, and vote transactions alone accounted for 152,281, nearly half. The confirmation latency users feel is mainly where this consensus overhead comes in, not the inter-block interval.
My view: treating 250ms as good news to buy SOL is buying the wrong thesis. SOL is now 118.00, up +9.06% over 24 hours. The perpetual funding rate is still the 0.0100% baseline, and retail—63.4%—is long.
Here’s a falsifiable one: if, within one month after 250ms officially takes effect, non-vote TPS does not rise by 30% or more relative to tonight’s 2,869 to 3,009, then this upgrade has zero impact on real usage. When that happens, I’ll come back and post the numbers.
#Solana目标出块时间降至250毫秒 $SOL
What people call “Solana’s target block time reduced to 250 milliseconds” sounds like an upgrade that hasn’t happened yet. In practice, it’s not like that.
Tonight at 22:58, three sets of one-minute sampling per slot were 265.5 / 275.2 / 265.5 milliseconds; my own run stretched to 62 seconds was 268.7.
From current epoch 1039 until now, with 660 validators, a total of 241,011 block slots were produced, 50 were missed, and the skip rate is 0.021%.
This shows that 250ms isn’t “speeding up” — it’s “ratifying” what was already true. The network has already been running at 265 to 275 milliseconds; hard-coding the parameter only turns an existing fact into a protocol requirement. Performance won’t suddenly get faster by another chunk.
What’s truly not priced-in is the other half: in the same batch of sampling, total transactions were 5,315 to 5,547 TPS, and vote transactions alone accounted for 152,281, nearly half. The confirmation latency users feel is mainly where this consensus overhead comes in, not the inter-block interval.
My view: treating 250ms as good news to buy SOL is buying the wrong thesis. SOL is now 118.00, up +9.06% over 24 hours. The perpetual funding rate is still the 0.0100% baseline, and retail—63.4%—is long.
Here’s a falsifiable one: if, within one month after 250ms officially takes effect, non-vote TPS does not rise by 30% or more relative to tonight’s 2,869 to 3,009, then this upgrade has zero impact on real usage. When that happens, I’ll come back and post the numbers.
#Solana目标出块时间降至250毫秒 $SOL
1
1
240
·
--
Six hours ago, what I wrote to myself was: “Before September 30, if the BTC daily close stands above 85,000, then the script is considered fulfilled.” Today it briefly touched a high of 85,473.68; now it’s at 84,972.58—since the daily candle hasn’t closed yet, I won’t count this one.
Today it opened at 81,178, hit a high of 85,473.68, a low of 80,850.22, and is up 5.5% over the last 24 hours. At 85,100 I closed one of the two long positions. The position opened at 78,438.64 realized $31,536.99; the one I still hold was opened at 79,145.35.
Why half? In the afternoon, my assessment for this segment was that it’s a move pushed up by short liquidations: from the close on September 17 at 76,417 to now, it’s up 11%. In the same period, Binance USDT perpetuals’ open interest rose from 107,918 contracts to 111,857 contracts—an increase of only 3.7%. This kind of rally looks steady on the way up, but the pushers are limited: once shorts liquidate, there’s no next wave. So I’m not betting that it keeps going, and I’m not betting that it turns around either.
85,000 is the target level I wrote down. Once it hits half of that fulfillment, I reserve the other half for “in case I underestimated.” This isn’t a technical call—it’s position management. I wrote “I might be wrong” into the account in the form of a half position.
My view: tonight will have the answer. The open interest is currently just 143 contracts away from the 112,000 level I marked. If it breaks above that, I’ll change this segment’s label from “short liquidations pushing up” to “longs adding leverage.” The odds on the remaining half position will worsen accordingly. If I change the label, I’ll post it. Also, the funding rate is still the base value of 0.0100%/8h. Next settlement is at 00:00—once the price reaches 85,000, the longs still haven’t started paying. 78,000 remains the invalidation level.
$BTC #比特币突破8.5万美元
Six hours ago, what I wrote to myself was: “Before September 30, if the BTC daily close stands above 85,000, then the script is considered fulfilled.” Today it briefly touched a high of 85,473.68; now it’s at 84,972.58—since the daily candle hasn’t closed yet, I won’t count this one.
Today it opened at 81,178, hit a high of 85,473.68, a low of 80,850.22, and is up 5.5% over the last 24 hours. At 85,100 I closed one of the two long positions. The position opened at 78,438.64 realized $31,536.99; the one I still hold was opened at 79,145.35.
Why half? In the afternoon, my assessment for this segment was that it’s a move pushed up by short liquidations: from the close on September 17 at 76,417 to now, it’s up 11%. In the same period, Binance USDT perpetuals’ open interest rose from 107,918 contracts to 111,857 contracts—an increase of only 3.7%. This kind of rally looks steady on the way up, but the pushers are limited: once shorts liquidate, there’s no next wave. So I’m not betting that it keeps going, and I’m not betting that it turns around either.
85,000 is the target level I wrote down. Once it hits half of that fulfillment, I reserve the other half for “in case I underestimated.” This isn’t a technical call—it’s position management. I wrote “I might be wrong” into the account in the form of a half position.
My view: tonight will have the answer. The open interest is currently just 143 contracts away from the 112,000 level I marked. If it breaks above that, I’ll change this segment’s label from “short liquidations pushing up” to “longs adding leverage.” The odds on the remaining half position will worsen accordingly. If I change the label, I’ll post it. Also, the funding rate is still the base value of 0.0100%/8h. Next settlement is at 00:00—once the price reaches 85,000, the longs still haven’t started paying. 78,000 remains the invalidation level.
$BTC #比特币突破8.5万美元
Today it opened at 81,178, hit a high of 85,473.68, a low of 80,850.22, and is up 5.5% over the last 24 hours. At 85,100 I closed one of the two long positions. The position opened at 78,438.64 realized $31,536.99; the one I still hold was opened at 79,145.35.
Why half? In the afternoon, my assessment for this segment was that it’s a move pushed up by short liquidations: from the close on September 17 at 76,417 to now, it’s up 11%. In the same period, Binance USDT perpetuals’ open interest rose from 107,918 contracts to 111,857 contracts—an increase of only 3.7%. This kind of rally looks steady on the way up, but the pushers are limited: once shorts liquidate, there’s no next wave. So I’m not betting that it keeps going, and I’m not betting that it turns around either.
85,000 is the target level I wrote down. Once it hits half of that fulfillment, I reserve the other half for “in case I underestimated.” This isn’t a technical call—it’s position management. I wrote “I might be wrong” into the account in the form of a half position.
My view: tonight will have the answer. The open interest is currently just 143 contracts away from the 112,000 level I marked. If it breaks above that, I’ll change this segment’s label from “short liquidations pushing up” to “longs adding leverage.” The odds on the remaining half position will worsen accordingly. If I change the label, I’ll post it. Also, the funding rate is still the base value of 0.0100%/8h. Next settlement is at 00:00—once the price reaches 85,000, the longs still haven’t started paying. 78,000 remains the invalidation level.
$BTC #比特币突破8.5万美元
3
574
·
--
MSTR’s 8-K just came out, covering the week of September 14 to 20. I’ll lay out what I did and what the results were.
I did three things: bought 950 Bitcoins, $75.7 million, at an average price of $79,670; issued no new shares of common stock via ATM; and repurchased 1,771,238 shares of STRC preferred stock for $174 million.
The two wallets match—USD Reserve went from $5.10B to $4.74B, and the $57.4 million difference is dividends and interest; USD Cash went from $1.30B to $1.05B, and the decrease is exactly the $75.7 million used to buy the coins plus the $174 million for the repurchase.
Results: Bitcoins held increased from 845,050 to 846,000, average cost $75,416, total cost $6.38B.
There’s a set of numbers that’s worth looking at side by side. The money this week spent on Bitcoin is less than half of what it spent on repurchasing its own preferred stock. 950 Bitcoins versus 846,000 coins is 0.11%—rounded, it didn’t move. And in the same week, Bitcoin itself went from 76,805 to 81,144, up 5.6%—just that alone means the book value on those 846,000 coins went up by roughly $3.7B.
In other words, of the extra money on its books this week, 98% is given by the coin price, and 2% is from its own buying—and even that 2% is only swapping cash into coins, not adding anything new.
So when you look at MSTR’s 8-K, the real thing you should never focus on is how much it bought this week. Even if it does nothing at all this week, its book value will still rise by $3.7B. The company’s income statement, in essence, is the income statement of its 846,000 Bitcoins; the only thing in between is a layer of premium.
That premium is moving now: after U.S. stock market open, Bitcoin is 85,275, up 5.9%; MSTR is 166.91, up 8.4%. The extra 2.5 percentage points that the stock gained more than the coin—that’s it.
Two consecutive weeks of zero common share issuances, and two consecutive weeks of preferred stock repurchases—combined over two weeks, $313 million. I’ll keep an eye on this direction next week.
#比特币突破8.5万美元
MSTR’s 8-K just came out, covering the week of September 14 to 20. I’ll lay out what I did and what the results were.
I did three things: bought 950 Bitcoins, $75.7 million, at an average price of $79,670; issued no new shares of common stock via ATM; and repurchased 1,771,238 shares of STRC preferred stock for $174 million.
The two wallets match—USD Reserve went from $5.10B to $4.74B, and the $57.4 million difference is dividends and interest; USD Cash went from $1.30B to $1.05B, and the decrease is exactly the $75.7 million used to buy the coins plus the $174 million for the repurchase.
Results: Bitcoins held increased from 845,050 to 846,000, average cost $75,416, total cost $6.38B.
There’s a set of numbers that’s worth looking at side by side. The money this week spent on Bitcoin is less than half of what it spent on repurchasing its own preferred stock. 950 Bitcoins versus 846,000 coins is 0.11%—rounded, it didn’t move. And in the same week, Bitcoin itself went from 76,805 to 81,144, up 5.6%—just that alone means the book value on those 846,000 coins went up by roughly $3.7B.
In other words, of the extra money on its books this week, 98% is given by the coin price, and 2% is from its own buying—and even that 2% is only swapping cash into coins, not adding anything new.
So when you look at MSTR’s 8-K, the real thing you should never focus on is how much it bought this week. Even if it does nothing at all this week, its book value will still rise by $3.7B. The company’s income statement, in essence, is the income statement of its 846,000 Bitcoins; the only thing in between is a layer of premium.
That premium is moving now: after U.S. stock market open, Bitcoin is 85,275, up 5.9%; MSTR is 166.91, up 8.4%. The extra 2.5 percentage points that the stock gained more than the coin—that’s it.
Two consecutive weeks of zero common share issuances, and two consecutive weeks of preferred stock repurchases—combined over two weeks, $313 million. I’ll keep an eye on this direction next week.
#比特币突破8.5万美元
I did three things: bought 950 Bitcoins, $75.7 million, at an average price of $79,670; issued no new shares of common stock via ATM; and repurchased 1,771,238 shares of STRC preferred stock for $174 million.
The two wallets match—USD Reserve went from $5.10B to $4.74B, and the $57.4 million difference is dividends and interest; USD Cash went from $1.30B to $1.05B, and the decrease is exactly the $75.7 million used to buy the coins plus the $174 million for the repurchase.
Results: Bitcoins held increased from 845,050 to 846,000, average cost $75,416, total cost $6.38B.
There’s a set of numbers that’s worth looking at side by side. The money this week spent on Bitcoin is less than half of what it spent on repurchasing its own preferred stock. 950 Bitcoins versus 846,000 coins is 0.11%—rounded, it didn’t move. And in the same week, Bitcoin itself went from 76,805 to 81,144, up 5.6%—just that alone means the book value on those 846,000 coins went up by roughly $3.7B.
In other words, of the extra money on its books this week, 98% is given by the coin price, and 2% is from its own buying—and even that 2% is only swapping cash into coins, not adding anything new.
So when you look at MSTR’s 8-K, the real thing you should never focus on is how much it bought this week. Even if it does nothing at all this week, its book value will still rise by $3.7B. The company’s income statement, in essence, is the income statement of its 846,000 Bitcoins; the only thing in between is a layer of premium.
That premium is moving now: after U.S. stock market open, Bitcoin is 85,275, up 5.9%; MSTR is 166.91, up 8.4%. The extra 2.5 percentage points that the stock gained more than the coin—that’s it.
Two consecutive weeks of zero common share issuances, and two consecutive weeks of preferred stock repurchases—combined over two weeks, $313 million. I’ll keep an eye on this direction next week.
#比特币突破8.5万美元
277
Log in to explore more content
Join global crypto users on Binance Square
⚡️ Get latest and useful information about crypto.
💬 Trusted by the world’s largest crypto exchange.
👍 Discover real insights from verified creators.
Email / Phone number