
blockchainballer1
627 Posts

blockchainballer1
Report
Block User
8 years in crypto markets. Sharing high probability trade setups with clear risk management.
Frequent Trader
3 Years
70 Following
531 Followers
1.2K+ Liked
Posts
All
Quotes
PINNED

Article
Dogecoin Creator Responds to
DOGE Price Crash With Brutal HonestyDogecoin’s recent price drop has caught the attention of investors, especially after Elon Musk’s statement about taking DOGE to the moon. Just two weeks later, the cryptocurrency lost 40% of its value in under three days.
The decline happened amid a larger $2.2 billion liquidation event, primarily influenced by ongoing tariff issues. While multiple assets suffered losses, much of the discussion centered around Dogecoin. Some investors looked to Musk for reassurance, while others turned to Billy Markus, known as Shibetoshi Nakamoto, one of Dogecoin’s co-creators.
Markus, however, had no interest in offering explanations. His response was brief and direct, reminding people that market behavior isn’t magic and should be understood by now.
This reaction wasn’t surprising. Markus has long distanced himself from Dogecoin, frequently emphasizing that he has no influence over its price, development, or adoption. Still, questions continue to come his way whenever the market takes a downturn.
Despite the dip, Dogecoin showed some resilience. After dropping to an intraday low of $0.20, it rebounded by 26%. While this partial recovery helped stabilize prices, investor sentiment remains uncertain.
For now, the meme coin holds steady, though its future remains unpredictable—just as it always has. Both Musk and Markus seem content to let the market play out on its own, leaving investors to decide what’s next for DOGE.
#DOGE #MarketPullback $DOGE
{future}(DOGEUSDT)
Dogecoin Creator Responds to DOGE Price Crash With Brutal Honesty
Dogecoin’s recent price drop has caught the attention of investors, especially after Elon Musk’s statement about taking DOGE to the moon. Just two weeks later, the cryptocurrency lost 40% of its value in under three days.
The decline happened amid a larger $2.2 billion liquidation event, primarily influenced by ongoing tariff issues. While multiple assets suffered losses, much of the discussion centered around Dogecoin. Some investors looked to Musk for reassurance, while others turned to Billy Markus, known as Shibetoshi Nakamoto, one of Dogecoin’s co-creators.
Markus, however, had no interest in offering explanations. His response was brief and direct, reminding people that market behavior isn’t magic and should be understood by now.
This reaction wasn’t surprising. Markus has long distanced himself from Dogecoin, frequently emphasizing that he has no influence over its price, development, or adoption. Still, questions continue to come his way whenever the market takes a downturn.
Despite the dip, Dogecoin showed some resilience. After dropping to an intraday low of $0.20, it rebounded by 26%. While this partial recovery helped stabilize prices, investor sentiment remains uncertain.
For now, the meme coin holds steady, though its future remains unpredictable—just as it always has. Both Musk and Markus seem content to let the market play out on its own, leaving investors to decide what’s next for DOGE.
#DOGE #MarketPullback $DOGE
The decline happened amid a larger $2.2 billion liquidation event, primarily influenced by ongoing tariff issues. While multiple assets suffered losses, much of the discussion centered around Dogecoin. Some investors looked to Musk for reassurance, while others turned to Billy Markus, known as Shibetoshi Nakamoto, one of Dogecoin’s co-creators.
Markus, however, had no interest in offering explanations. His response was brief and direct, reminding people that market behavior isn’t magic and should be understood by now.
This reaction wasn’t surprising. Markus has long distanced himself from Dogecoin, frequently emphasizing that he has no influence over its price, development, or adoption. Still, questions continue to come his way whenever the market takes a downturn.
Despite the dip, Dogecoin showed some resilience. After dropping to an intraday low of $0.20, it rebounded by 26%. While this partial recovery helped stabilize prices, investor sentiment remains uncertain.
For now, the meme coin holds steady, though its future remains unpredictable—just as it always has. Both Musk and Markus seem content to let the market play out on its own, leaving investors to decide what’s next for DOGE.
#DOGE #MarketPullback $DOGE
21
12
62
123.3k
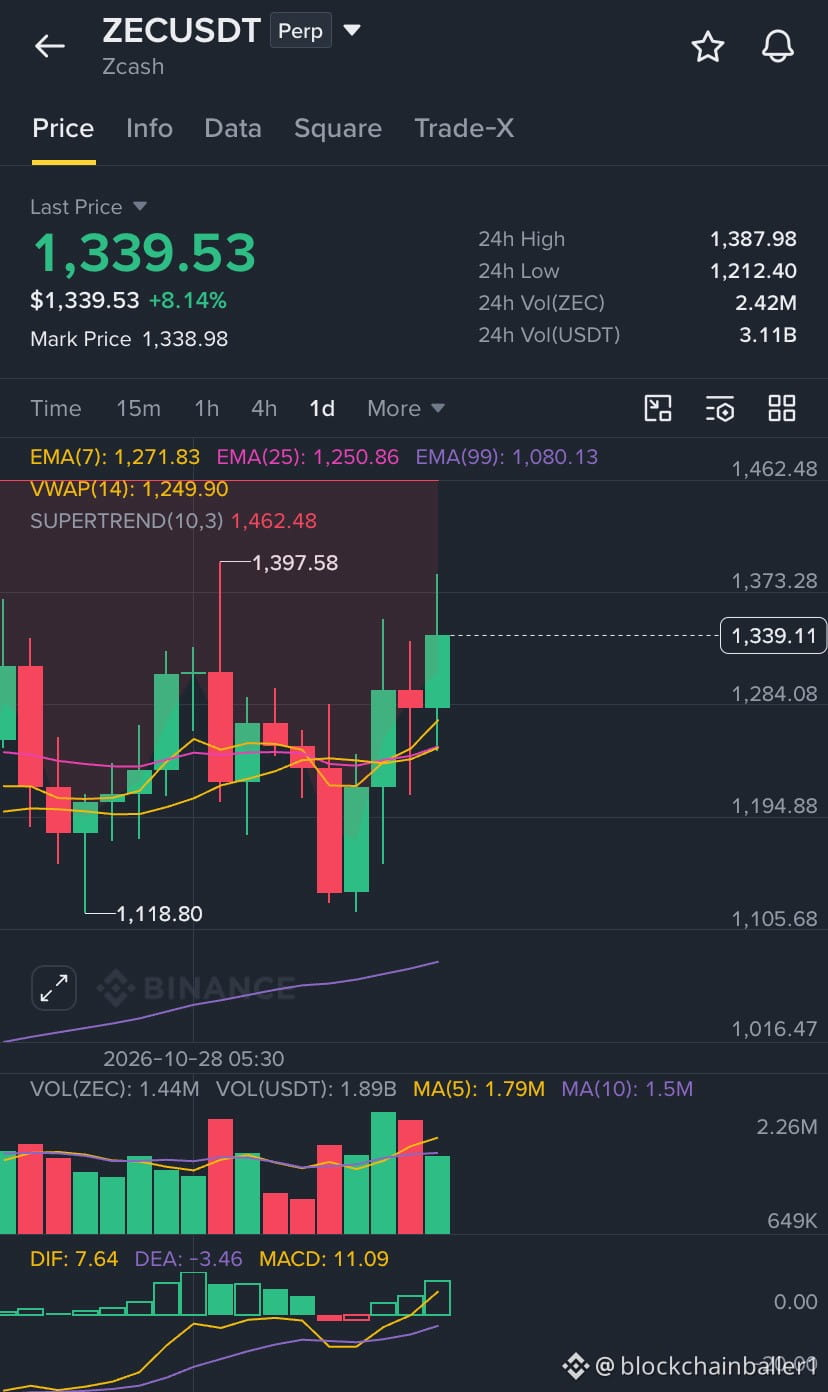
🚀 $ZEC Delivers an Impressive Rally! Is Another Move Coming?
ZEC has made a powerful recovery, climbing from $1,213 to nearly $1,388.
However, the price is now entering a critical supply zone between $1,388 and $1,420.
📉 Bearish Scenario:
If sellers defend this resistance, ZEC could face a pullback toward $1,280, with $1,213 as a deeper downside level.
📈 Bullish Scenario:
A convincing breakout above $1,420 could open the door for another upward move toward $1,500–$1,600.
🔥 My Take:
Momentum remains positive, but chasing the rally near resistance carries additional risk.
Keep an eye on the $1,420 level. The next move could determine ZEC’s short-term direction.
{future}(ZECUSDT)
🚀 $ZEC Delivers an Impressive Rally! Is Another Move Coming?
ZEC has made a powerful recovery, climbing from $1,213 to nearly $1,388.
However, the price is now entering a critical supply zone between $1,388 and $1,420.
📉 Bearish Scenario:
If sellers defend this resistance, ZEC could face a pullback toward $1,280, with $1,213 as a deeper downside level.
📈 Bullish Scenario:
A convincing breakout above $1,420 could open the door for another upward move toward $1,500–$1,600.
🔥 My Take:
Momentum remains positive, but chasing the rally near resistance carries additional risk.
Keep an eye on the $1,420 level. The next move could determine ZEC’s short-term direction.
ZEC has made a powerful recovery, climbing from $1,213 to nearly $1,388.
However, the price is now entering a critical supply zone between $1,388 and $1,420.
📉 Bearish Scenario:
If sellers defend this resistance, ZEC could face a pullback toward $1,280, with $1,213 as a deeper downside level.
📈 Bullish Scenario:
A convincing breakout above $1,420 could open the door for another upward move toward $1,500–$1,600.
🔥 My Take:
Momentum remains positive, but chasing the rally near resistance carries additional risk.
Keep an eye on the $1,420 level. The next move could determine ZEC’s short-term direction.
2
327
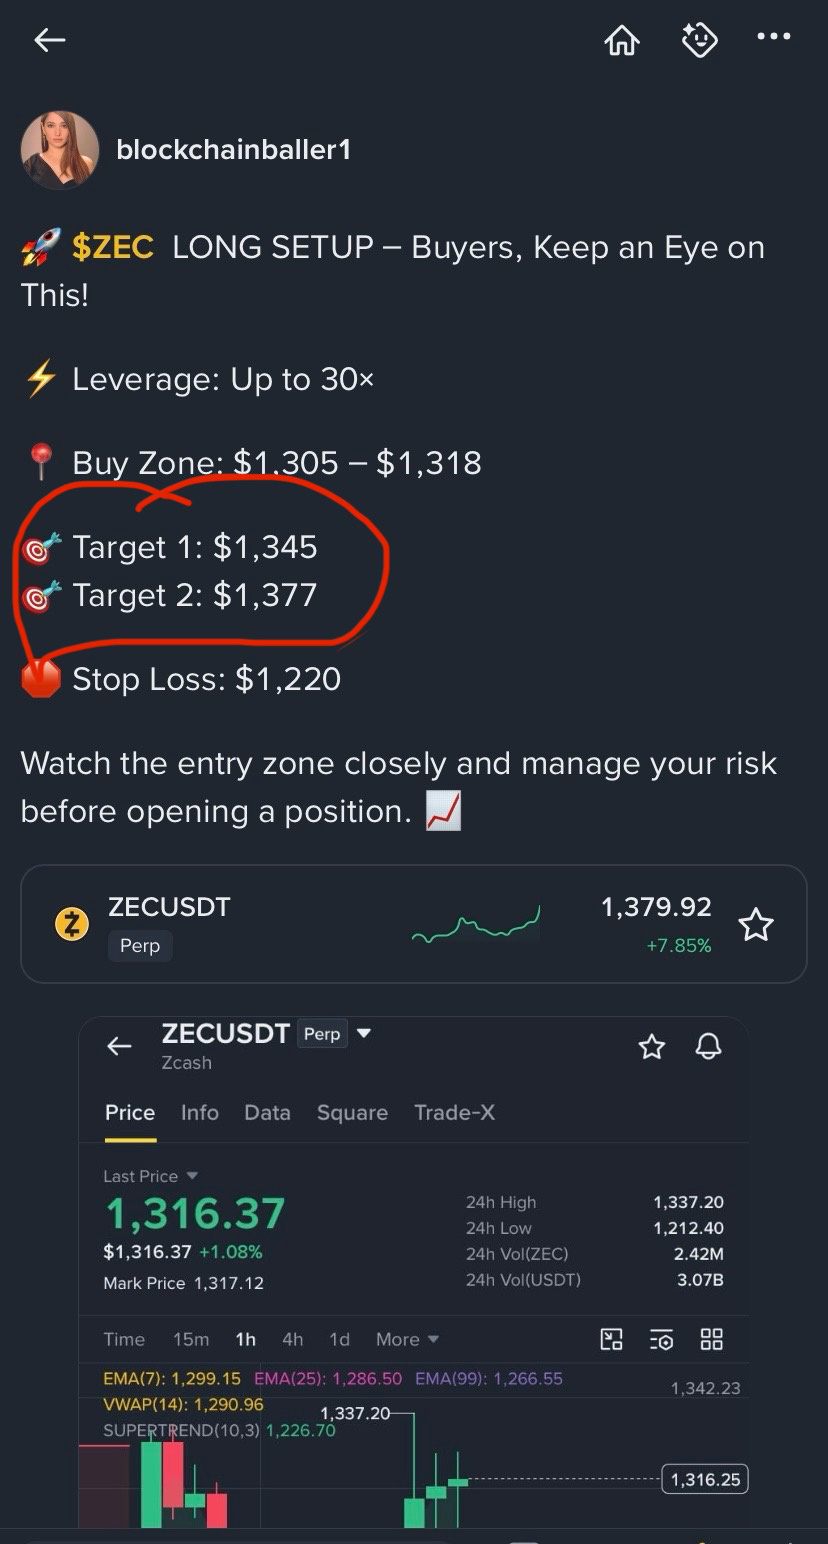
🚀 All targets have been successfully achieved from our LONG trade signal! 🎯💰 $ZEC
{future}(ZECUSDT)
🚀 All targets have been successfully achieved from our LONG trade signal! 🎯💰 $ZEC
blockchainballer1
·
--
🚀 $ZEC LONG SETUP – Buyers, Keep an Eye on This!
⚡ Leverage: Up to 30×
📍 Buy Zone: $1,305 – $1,318
🎯 Target 1: $1,345
🎯 Target 2: $1,377
🛑 Stop Loss: $1,220
Watch the entry zone closely and manage your risk before opening a position. 📈
⚡ Leverage: Up to 30×
📍 Buy Zone: $1,305 – $1,318
🎯 Target 1: $1,345
🎯 Target 2: $1,377
🛑 Stop Loss: $1,220
Watch the entry zone closely and manage your risk before opening a position. 📈
2
378
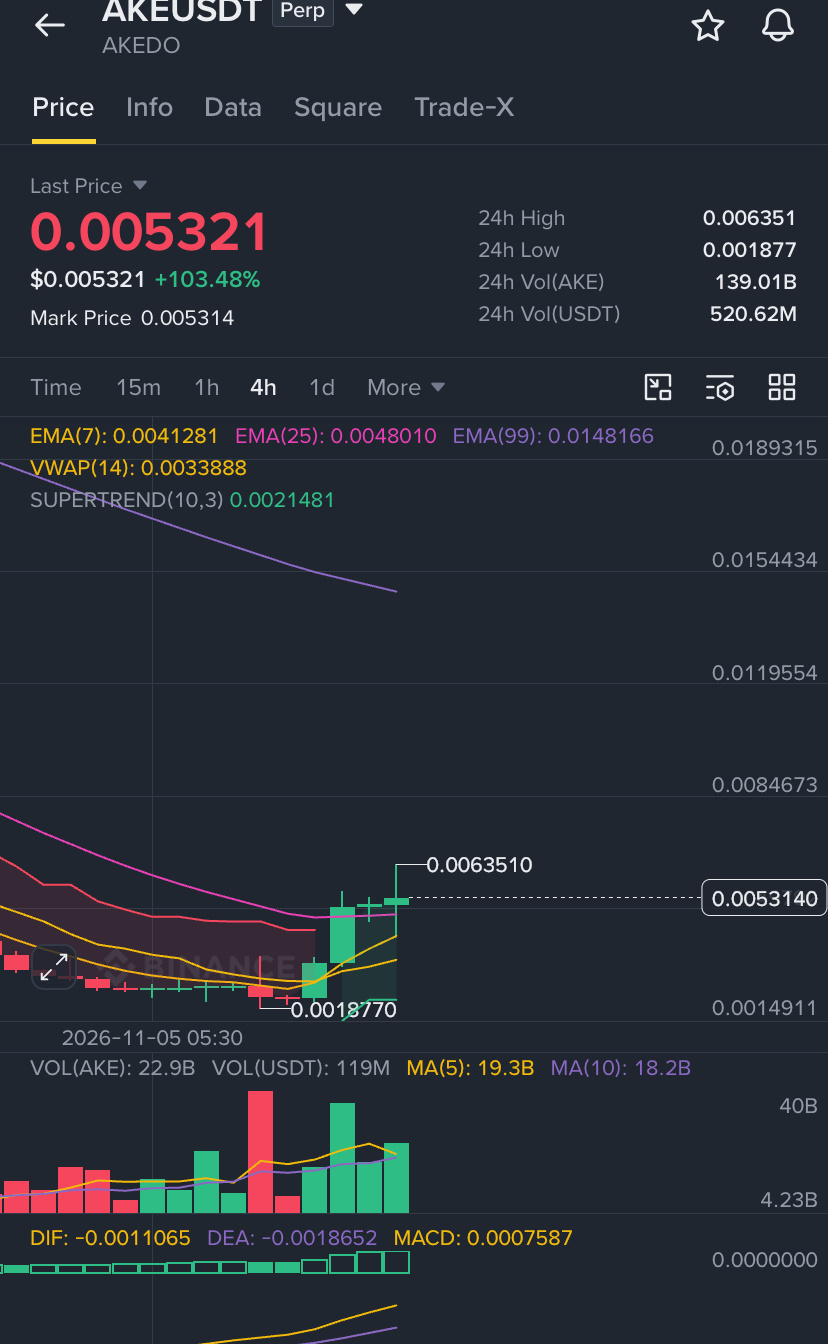
🚀 $AKE could be heading toward $0.011 soon!
Bulls are keeping their eyes on this level. Will $AKE make its next big move? 📈🔥
{future}(AKEUSDT)
🚀 $AKE could be heading toward $0.011 soon!
Bulls are keeping their eyes on this level. Will $AKE make its next big move? 📈🔥
Bulls are keeping their eyes on this level. Will $AKE make its next big move? 📈🔥
5
1
3
783
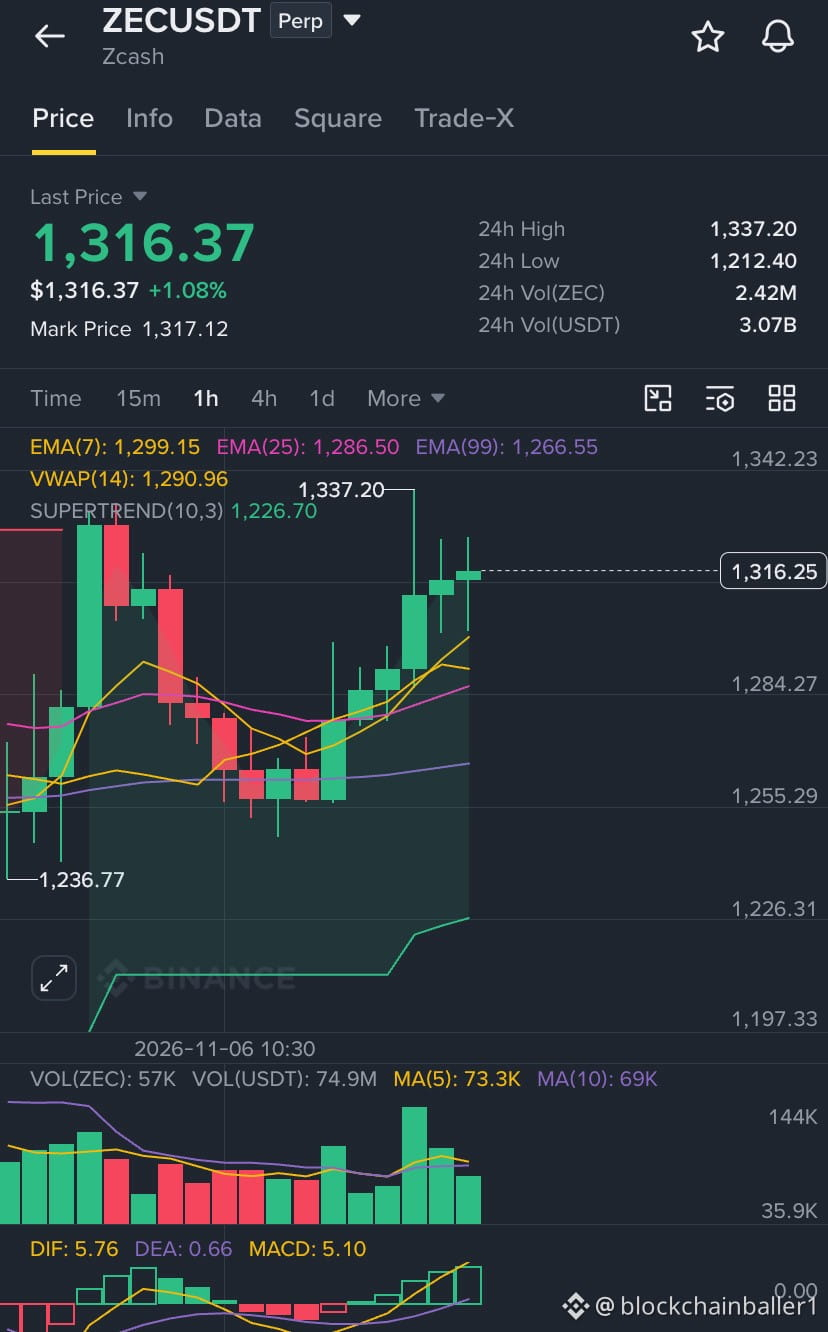
🚀 $ZEC LONG SETUP – Buyers, Keep an Eye on This!
⚡ Leverage: Up to 30×
📍 Buy Zone: $1,305 – $1,318
🎯 Target 1: $1,345
🎯 Target 2: $1,377
🛑 Stop Loss: $1,220
Watch the entry zone closely and manage your risk before opening a position. 📈
{future}(ZECUSDT)
🚀 $ZEC LONG SETUP – Buyers, Keep an Eye on This!
⚡ Leverage: Up to 30×
📍 Buy Zone: $1,305 – $1,318
🎯 Target 1: $1,345
🎯 Target 2: $1,377
🛑 Stop Loss: $1,220
Watch the entry zone closely and manage your risk before opening a position. 📈
⚡ Leverage: Up to 30×
📍 Buy Zone: $1,305 – $1,318
🎯 Target 1: $1,345
🎯 Target 2: $1,377
🛑 Stop Loss: $1,220
Watch the entry zone closely and manage your risk before opening a position. 📈
1
2
388
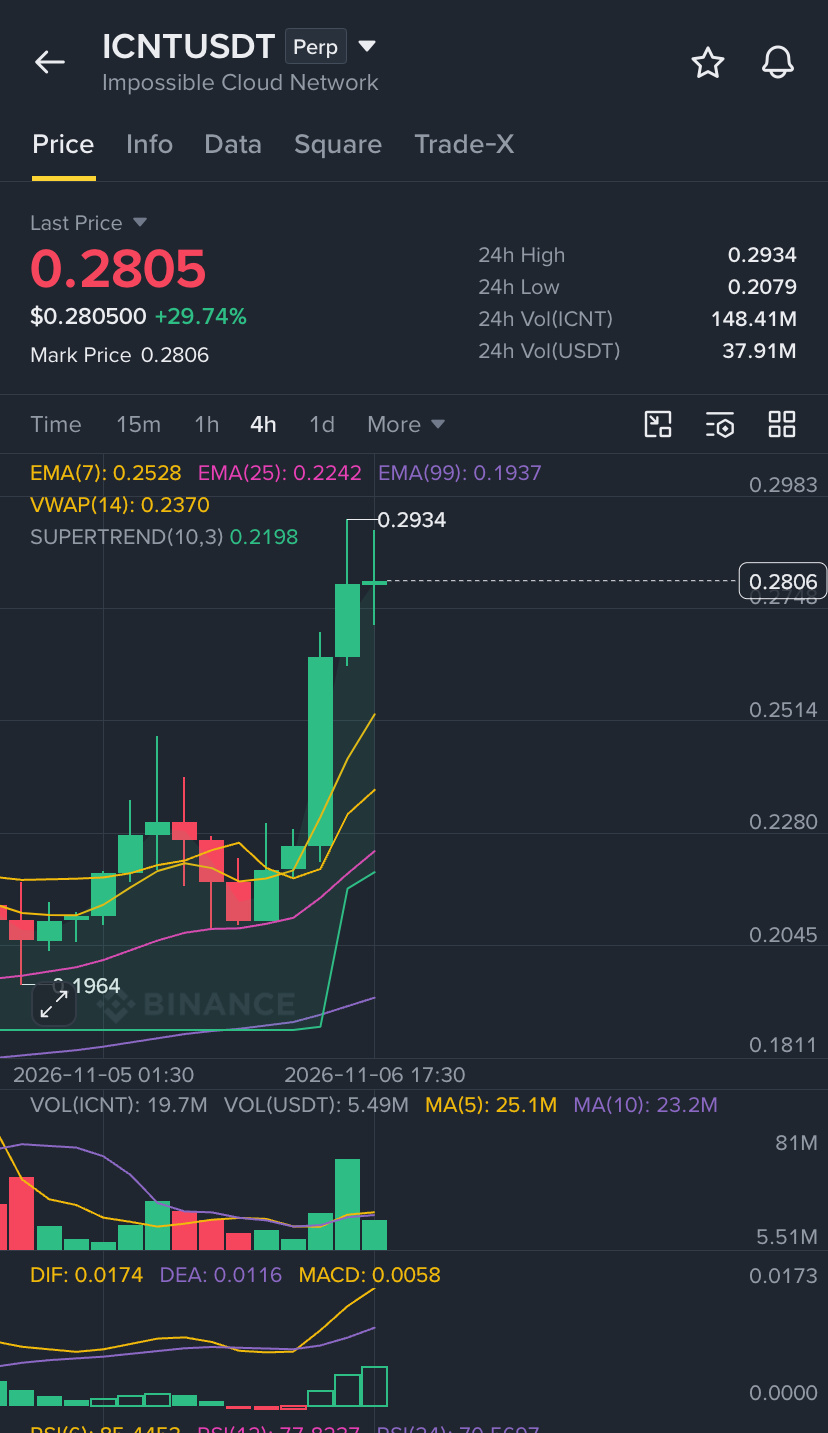
🚀 $ICNT – Bullish Opportunity! Buyers, Watch This Zone.
Considering a LONG position on $ICNT around the following entry range:
📍 Entry: $0.2790 – $0.2822
🎯 Take Profit Targets:
* TP1: $0.3045
* TP2: $0.3200
🛑 Stop Loss: $0.2580
Keep an eye on price action and manage your risk carefully. Don’t chase the move!
{future}(ICNTUSDT)
🚀 $ICNT – Bullish Opportunity! Buyers, Watch This Zone.
Considering a LONG position on $ICNT around the following entry range:
📍 Entry: $0.2790 – $0.2822
🎯 Take Profit Targets:
* TP1: $0.3045
* TP2: $0.3200
🛑 Stop Loss: $0.2580
Keep an eye on price action and manage your risk carefully. Don’t chase the move!
Considering a LONG position on $ICNT around the following entry range:
📍 Entry: $0.2790 – $0.2822
🎯 Take Profit Targets:
* TP1: $0.3045
* TP2: $0.3200
🛑 Stop Loss: $0.2580
Keep an eye on price action and manage your risk carefully. Don’t chase the move!
1
190
Article
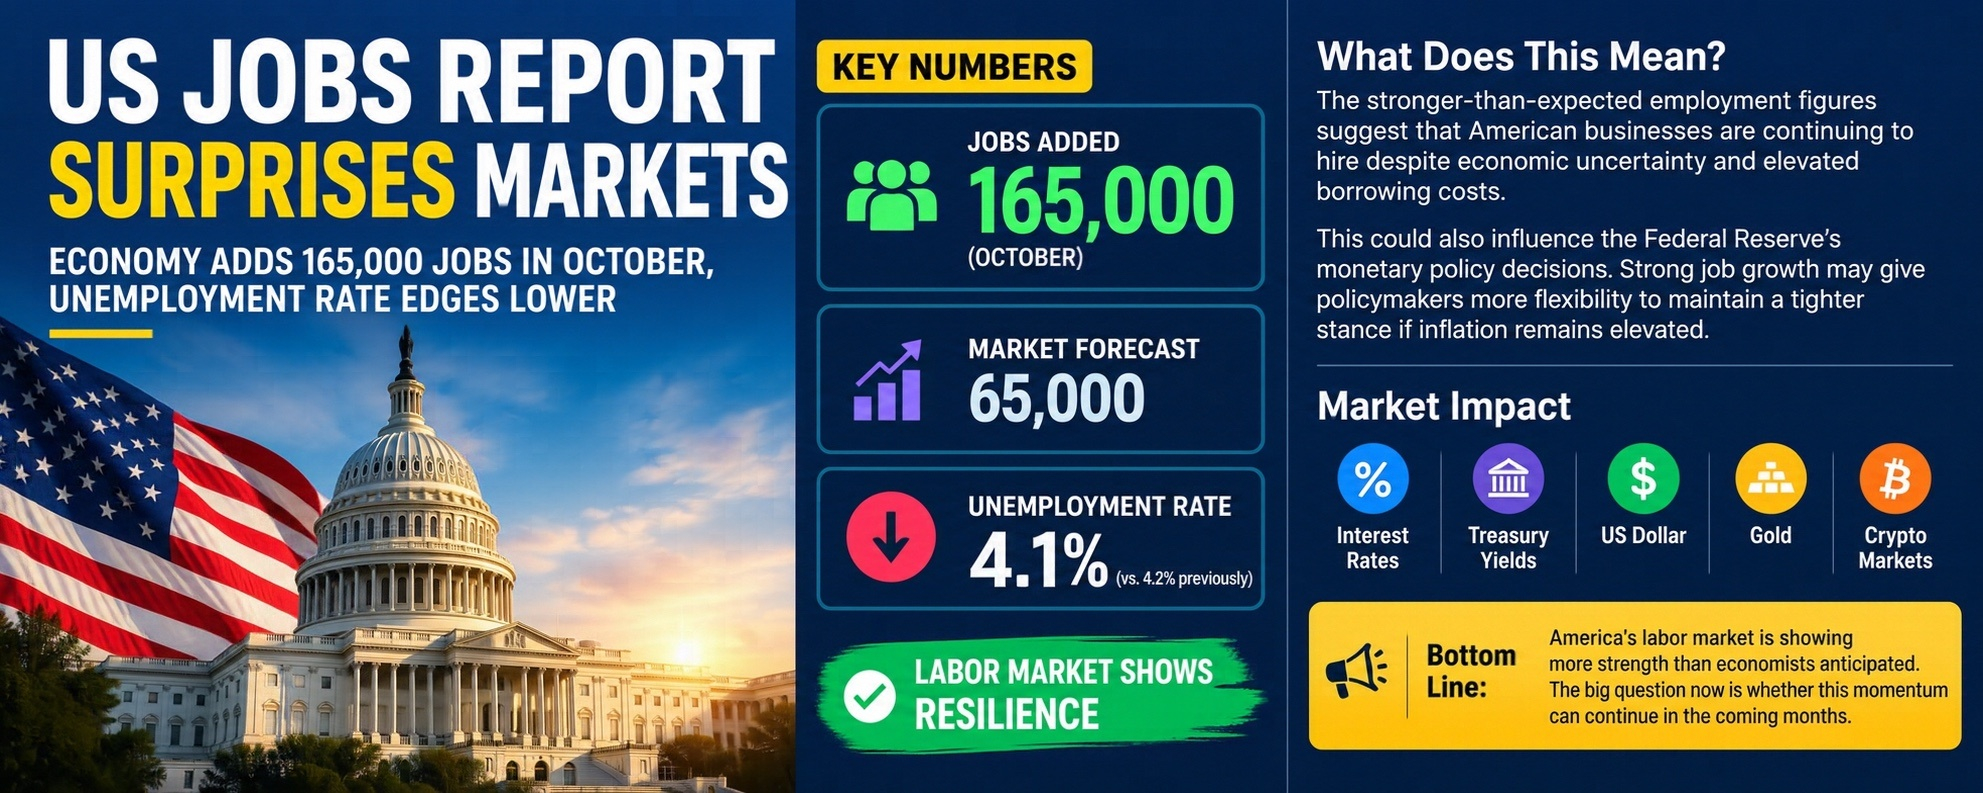
🇺🇸 US ECONOMY DELIVERS A MAJOR SURPRISE: 165,000 JOBS ADDED IN OCTOBER!The US labor market showed unexpected strength in October, with the economy adding 165,000 jobs, significantly exceeding economists’ expectations of just 65,000.
📊 Key Highlights:
🇺🇸 New jobs added: 165,000
📈 Market forecast: 65,000
📉 Unemployment rate: Fell from 4.2% to 4.1%
💼 Job creation significantly exceeded expectations.
💪 The labor market continues to demonstrate resilience.
What Does This Mean for the US Economy?
The stronger-than-expected employment figures suggest that American businesses are continuing to hire despite economic uncertainty and elevated borrowing costs.
The unexpected improvement could also influence the Federal Reserve’s monetary policy decisions. Strong employment growth may give policymakers more flexibility to maintain a tighter monetary stance if inflation remains elevated.
Market Impact:
Investors will closely monitor how the latest employment data affects expectations for interest rates, Treasury yields, the US dollar, gold and cryptocurrency markets.
🚨 Bottom Line: America’s labor market is showing more strength than economists anticipated. The big question now is whether this momentum can continue in the coming months.
$BTC
#BinanceReopensWithdrawalsForMoreAssets #CanUSStocksReboundAfterNonfarmPayrolls? $SPCXB $TSLAB
🇺🇸 US ECONOMY DELIVERS A MAJOR SURPRISE: 165,000 JOBS ADDED IN OCTOBER!
The US labor market showed unexpected strength in October, with the economy adding 165,000 jobs, significantly exceeding economists’ expectations of just 65,000.
📊 Key Highlights:
🇺🇸 New jobs added: 165,000
📈 Market forecast: 65,000
📉 Unemployment rate: Fell from 4.2% to 4.1%
💼 Job creation significantly exceeded expectations.
💪 The labor market continues to demonstrate resilience.
What Does This Mean for the US Economy?
The stronger-than-expected employment figures suggest that American businesses are continuing to hire despite economic uncertainty and elevated borrowing costs.
The unexpected improvement could also influence the Federal Reserve’s monetary policy decisions. Strong employment growth may give policymakers more flexibility to maintain a tighter monetary stance if inflation remains elevated.
Market Impact:
Investors will closely monitor how the latest employment data affects expectations for interest rates, Treasury yields, the US dollar, gold and cryptocurrency markets.
🚨 Bottom Line: America’s labor market is showing more strength than economists anticipated. The big question now is whether this momentum can continue in the coming months.
$BTC
#BinanceReopensWithdrawalsForMoreAssets #CanUSStocksReboundAfterNonfarmPayrolls? $SPCXB $TSLAB
📊 Key Highlights:
🇺🇸 New jobs added: 165,000
📈 Market forecast: 65,000
📉 Unemployment rate: Fell from 4.2% to 4.1%
💼 Job creation significantly exceeded expectations.
💪 The labor market continues to demonstrate resilience.
What Does This Mean for the US Economy?
The stronger-than-expected employment figures suggest that American businesses are continuing to hire despite economic uncertainty and elevated borrowing costs.
The unexpected improvement could also influence the Federal Reserve’s monetary policy decisions. Strong employment growth may give policymakers more flexibility to maintain a tighter monetary stance if inflation remains elevated.
Market Impact:
Investors will closely monitor how the latest employment data affects expectations for interest rates, Treasury yields, the US dollar, gold and cryptocurrency markets.
🚨 Bottom Line: America’s labor market is showing more strength than economists anticipated. The big question now is whether this momentum can continue in the coming months.
$BTC
#BinanceReopensWithdrawalsForMoreAssets #CanUSStocksReboundAfterNonfarmPayrolls? $SPCXB $TSLAB
1
70
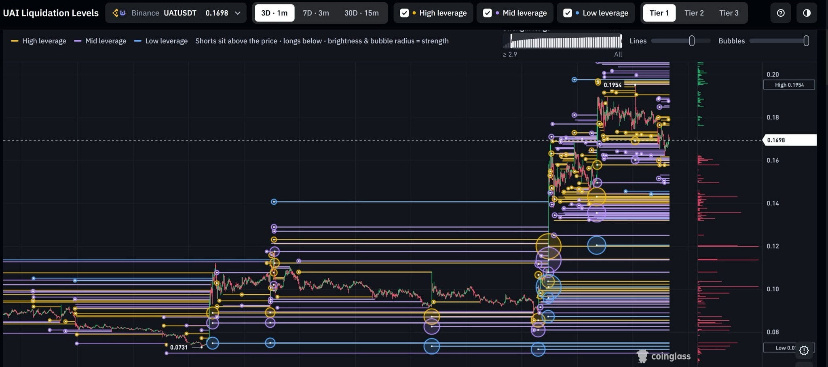
🚨 Something unusual is happening with $UAI .
The team wallet has reportedly transferred over $1 million to 10 newly created wallets within a short period.
Meanwhile, $UAI has surged nearly 100% today.
⚠️ Keep an eye on these wallet movements. If funds are moved to exchanges, it could signal potential selling pressure.
Stay alert and manage your risk. DYOR.
{future}(UAIUSDT)
🚨 Something unusual is happening with $UAI .
The team wallet has reportedly transferred over $1 million to 10 newly created wallets within a short period.
Meanwhile, $UAI has surged nearly 100% today.
⚠️ Keep an eye on these wallet movements. If funds are moved to exchanges, it could signal potential selling pressure.
Stay alert and manage your risk. DYOR.
The team wallet has reportedly transferred over $1 million to 10 newly created wallets within a short period.
Meanwhile, $UAI has surged nearly 100% today.
⚠️ Keep an eye on these wallet movements. If funds are moved to exchanges, it could signal potential selling pressure.
Stay alert and manage your risk. DYOR.
1
183
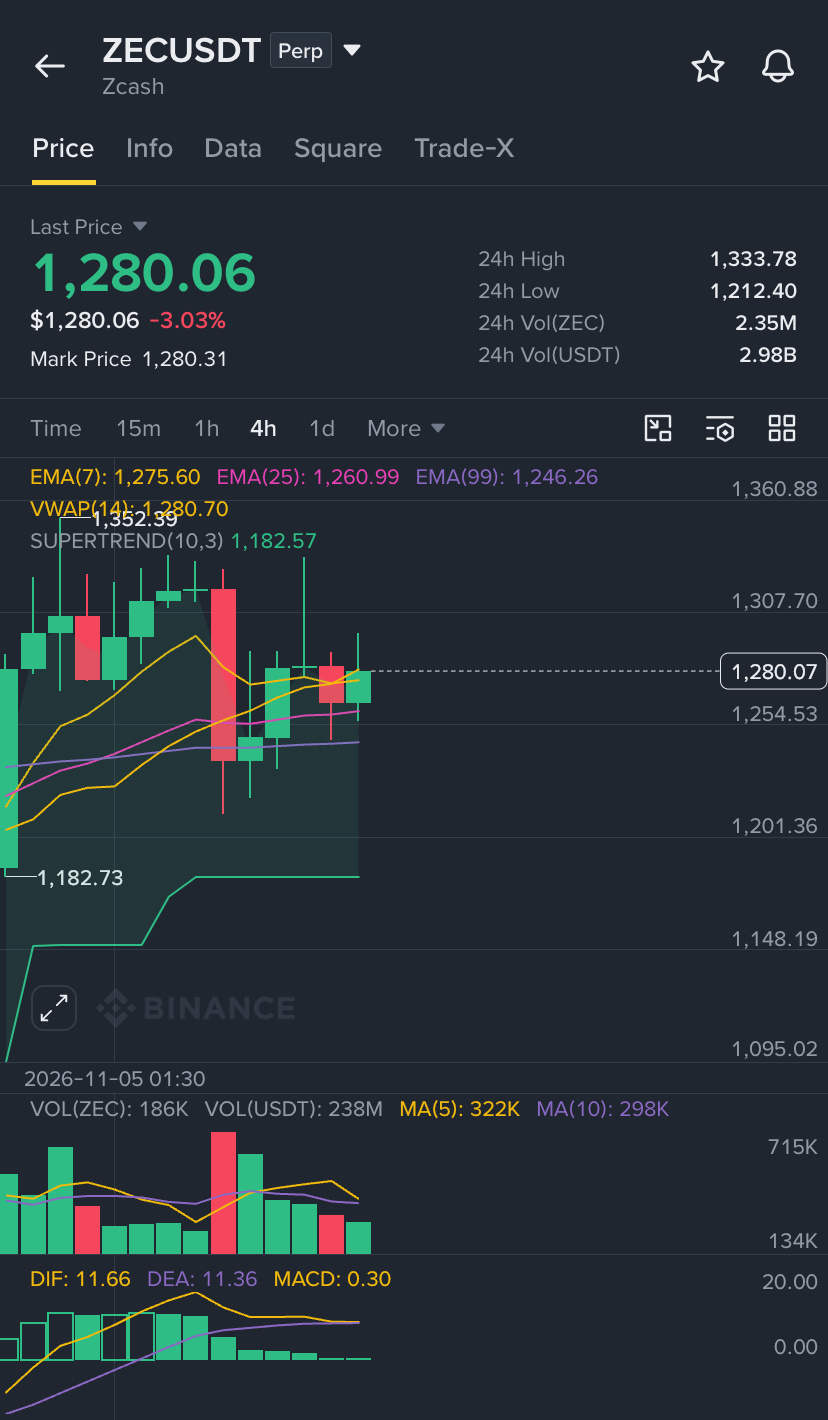
🚀 $ZEC LONG — Can Bulls Defend $1,283 on the 4H Chart?
🟢 LONG SETUP
📍 Entry Zone: $1,283–$1,289
🎯 TP1: $1,308
🎯 TP2: $1,323
🎯 TP3: $1,345
🛑 Stop Loss: $1,250
Technical Overview:
* Price is hovering around $1,286, above the 4H EMA50 near $1,253, suggesting the bullish trend remains intact.
* The stop-loss represents approximately 2.8% downside risk, while TP3 offers around 4.6% potential upside.
* On the daily timeframe, ZEC remains well above its EMA200 near $848, supporting the broader bullish structure.
⚠️ A breakdown below $1,250 invalidates this setup.
Patience is key. Wait for confirmation before entering.
{future}(ZECUSDT)
🚀 $ZEC LONG — Can Bulls Defend $1,283 on the 4H Chart?
🟢 LONG SETUP
📍 Entry Zone: $1,283–$1,289
🎯 TP1: $1,308
🎯 TP2: $1,323
🎯 TP3: $1,345
🛑 Stop Loss: $1,250
Technical Overview:
* Price is hovering around $1,286, above the 4H EMA50 near $1,253, suggesting the bullish trend remains intact.
* The stop-loss represents approximately 2.8% downside risk, while TP3 offers around 4.6% potential upside.
* On the daily timeframe, ZEC remains well above its EMA200 near $848, supporting the broader bullish structure.
⚠️ A breakdown below $1,250 invalidates this setup.
Patience is key. Wait for confirmation before entering.
🟢 LONG SETUP
📍 Entry Zone: $1,283–$1,289
🎯 TP1: $1,308
🎯 TP2: $1,323
🎯 TP3: $1,345
🛑 Stop Loss: $1,250
Technical Overview:
* Price is hovering around $1,286, above the 4H EMA50 near $1,253, suggesting the bullish trend remains intact.
* The stop-loss represents approximately 2.8% downside risk, while TP3 offers around 4.6% potential upside.
* On the daily timeframe, ZEC remains well above its EMA200 near $848, supporting the broader bullish structure.
⚠️ A breakdown below $1,250 invalidates this setup.
Patience is key. Wait for confirmation before entering.
2
206
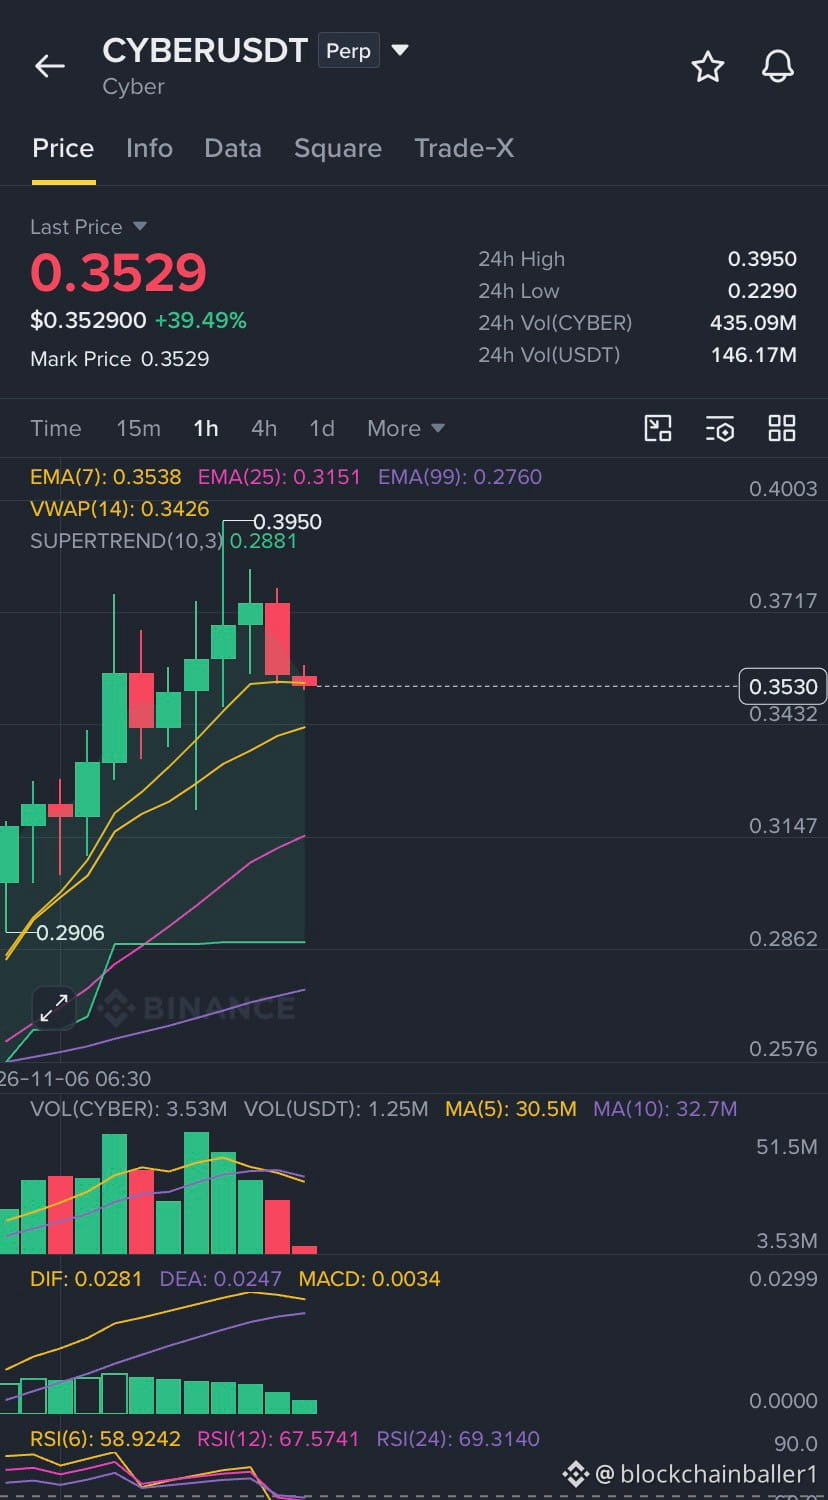
⚠️ $CYBER — Potential Downside Ahead!
After a sharp rally of more than 40%, $CYBER is showing signs of exhaustion near the $0.3950 resistance zone.
Bears could take control if the $0.40 level continues to reject buyers.
🔻 SHORT TRADE PLAN
📍 Entry: $0.3564
🎯 TP1: $0.3400
🎯 TP2: $0.3200
🎯 Final Target: $0.3000
🛑 Stop Loss: $0.4050
Key Levels to Watch:
As long as $0.40 remains unbroken, a pullback toward $0.33–$0.30 is possible.
A sustained breakout above $0.40 would invalidate this bearish outlook.
⚠️ Manage risk carefully and always use a stop loss.
{future}(CYBERUSDT)
⚠️ $CYBER — Potential Downside Ahead!
After a sharp rally of more than 40%, $CYBER is showing signs of exhaustion near the $0.3950 resistance zone.
Bears could take control if the $0.40 level continues to reject buyers.
🔻 SHORT TRADE PLAN
📍 Entry: $0.3564
🎯 TP1: $0.3400
🎯 TP2: $0.3200
🎯 Final Target: $0.3000
🛑 Stop Loss: $0.4050
Key Levels to Watch:
As long as $0.40 remains unbroken, a pullback toward $0.33–$0.30 is possible.
A sustained breakout above $0.40 would invalidate this bearish outlook.
⚠️ Manage risk carefully and always use a stop loss.
After a sharp rally of more than 40%, $CYBER is showing signs of exhaustion near the $0.3950 resistance zone.
Bears could take control if the $0.40 level continues to reject buyers.
🔻 SHORT TRADE PLAN
📍 Entry: $0.3564
🎯 TP1: $0.3400
🎯 TP2: $0.3200
🎯 Final Target: $0.3000
🛑 Stop Loss: $0.4050
Key Levels to Watch:
As long as $0.40 remains unbroken, a pullback toward $0.33–$0.30 is possible.
A sustained breakout above $0.40 would invalidate this bearish outlook.
⚠️ Manage risk carefully and always use a stop loss.
1
155
🚨 RUSSIAN DIESEL SHIPMENTS TO THE U.S. ARE HITTING A ROADBLOCK!
Well, that didn’t go as planned, Trump! 🤣
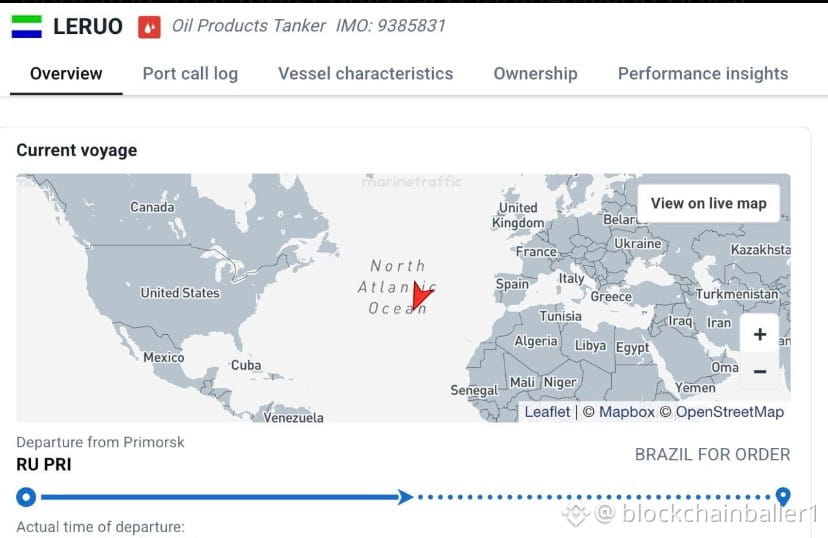
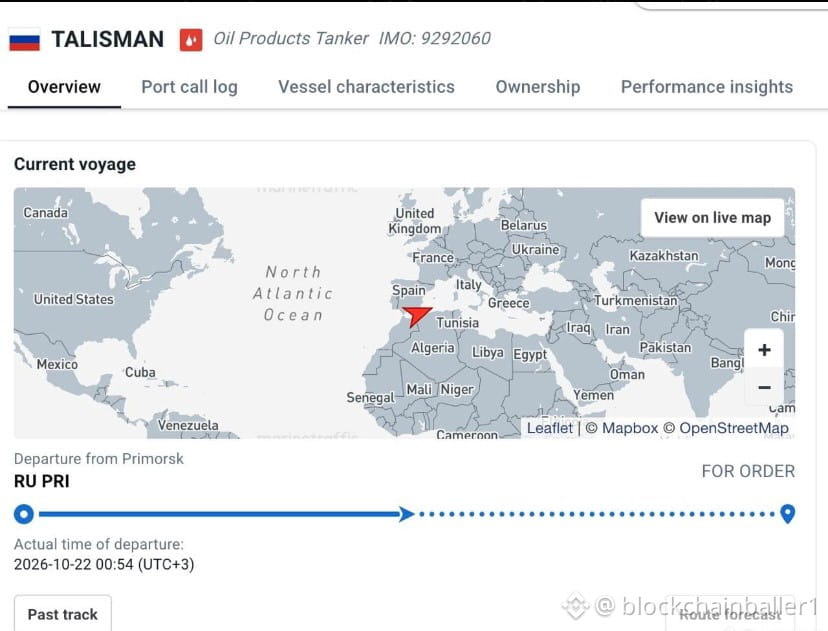
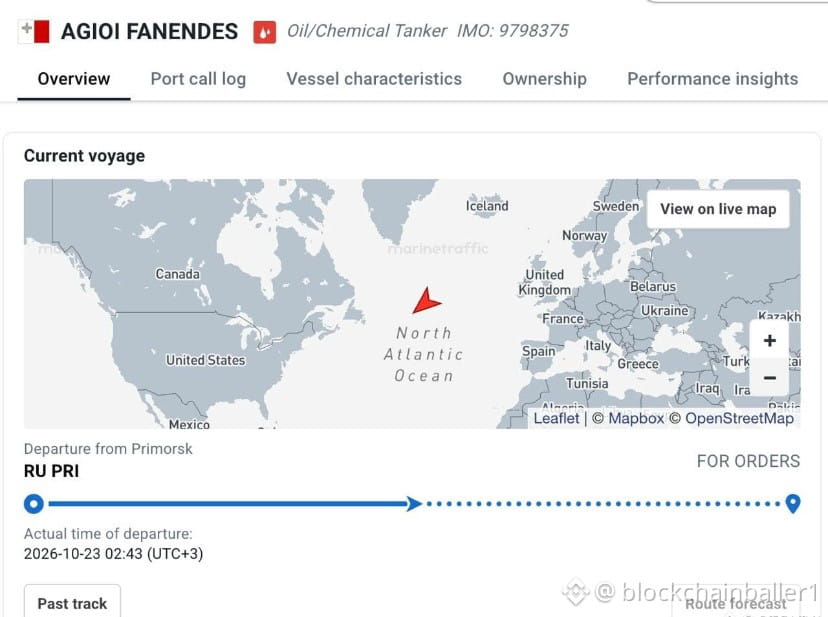
Two of three Russian tankers carrying approximately 140,000 tonnes of diesel have reportedly abandoned their original routes toward U.S. ports.
Only one vessel is still heading toward American waters, and even that ship has removed New York as its destination while waiting for new instructions.
Why the sudden change?
🇺🇸 American buyers are avoiding Russian fuel due to sanctions-related legal exposure and reputational concerns.
⚠️ New Jersey’s governor has also reportedly warned port operators of potential multimillion-dollar penalties for accepting Russian diesel.
Cheap fuel isn’t worth the legal headache!
The question now is: Where will these tankers go next?
#TRUMP $BTC $TRUMP
🚨 RUSSIAN DIESEL SHIPMENTS TO THE U.S. ARE HITTING A ROADBLOCK!
Well, that didn’t go as planned, Trump! 🤣
Two of three Russian tankers carrying approximately 140,000 tonnes of diesel have reportedly abandoned their original routes toward U.S. ports.
Only one vessel is still heading toward American waters, and even that ship has removed New York as its destination while waiting for new instructions.
Why the sudden change?
🇺🇸 American buyers are avoiding Russian fuel due to sanctions-related legal exposure and reputational concerns.
⚠️ New Jersey’s governor has also reportedly warned port operators of potential multimillion-dollar penalties for accepting Russian diesel.
Cheap fuel isn’t worth the legal headache!
The question now is: Where will these tankers go next?
#TRUMP $BTC $TRUMP
Well, that didn’t go as planned, Trump! 🤣
Two of three Russian tankers carrying approximately 140,000 tonnes of diesel have reportedly abandoned their original routes toward U.S. ports.
Only one vessel is still heading toward American waters, and even that ship has removed New York as its destination while waiting for new instructions.
Why the sudden change?
🇺🇸 American buyers are avoiding Russian fuel due to sanctions-related legal exposure and reputational concerns.
⚠️ New Jersey’s governor has also reportedly warned port operators of potential multimillion-dollar penalties for accepting Russian diesel.
Cheap fuel isn’t worth the legal headache!
The question now is: Where will these tankers go next?
#TRUMP $BTC $TRUMP
1
236
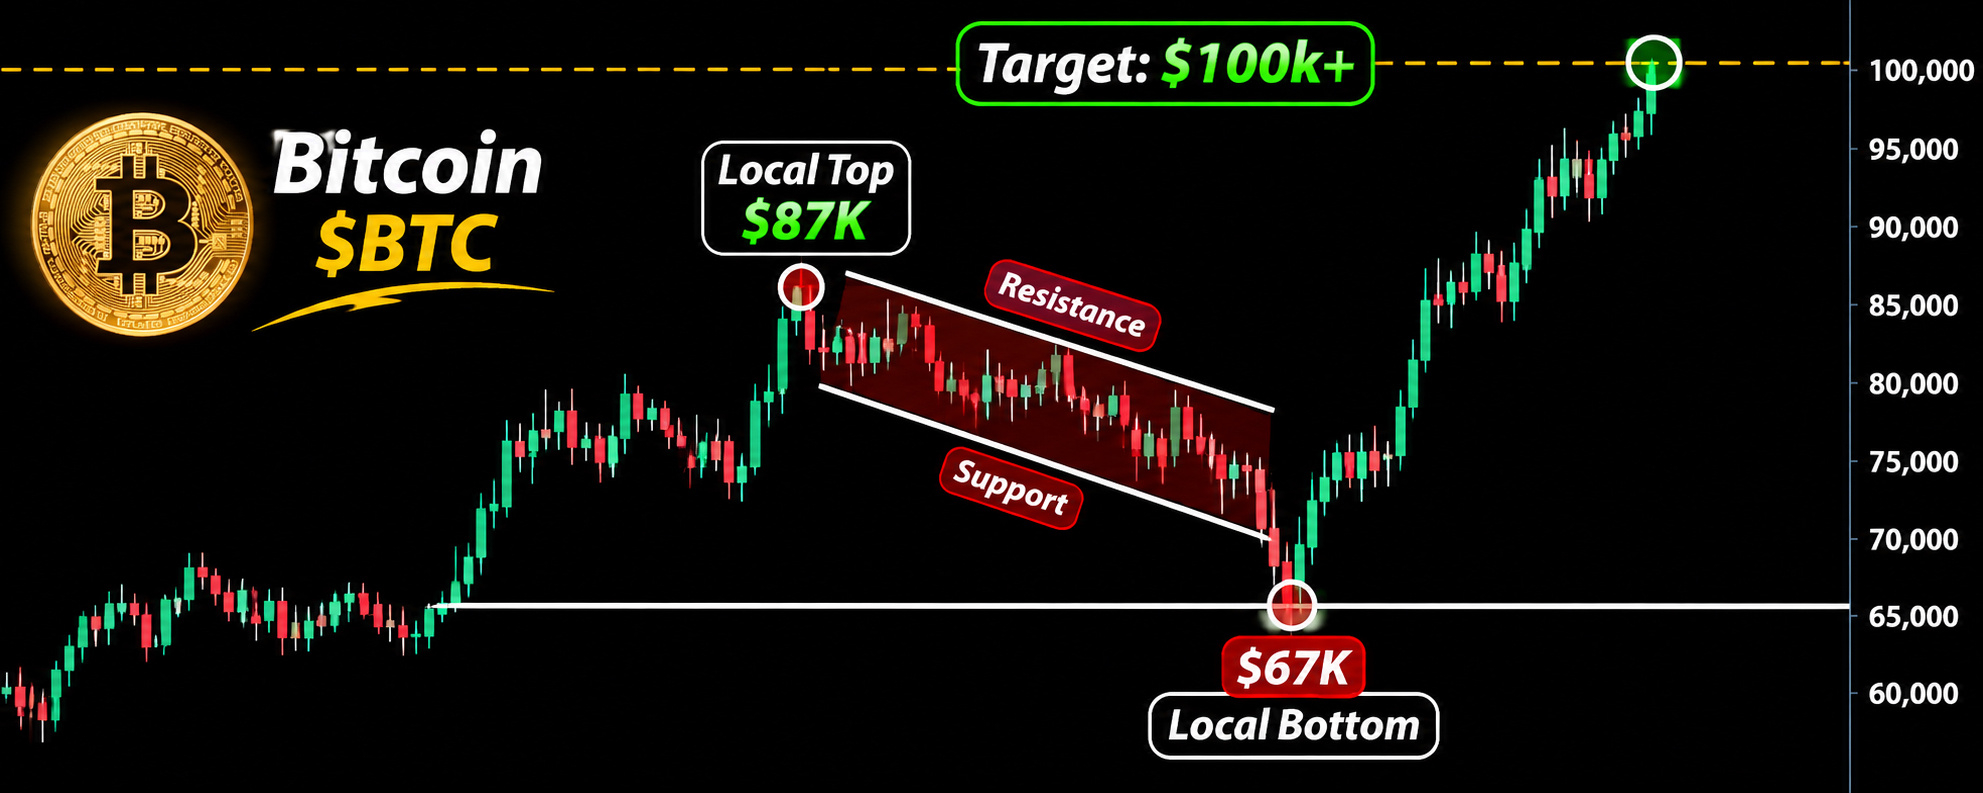
Article
Bitcoin Drops to $78K: Is the Final Liquidation Phase About to Begin?Bitcoin’s recent decline to the $78,000 level has raised fresh concerns across the cryptocurrency market. This move comes after an earlier warning that the $81,000 region could act as a final bull trap before another significant downside move.
The market now appears to be entering a critical phase, with liquidation pressure and bearish momentum potentially influencing Bitcoin’s next move.
Key Bitcoin Price Levels to Watch
The current downside scenario highlights several important price levels:
$78,000: Current critical price area.
$75,000: First major downside target.
$67,000: Potential deeper support zone.
Local Bottom: A possible area where selling pressure could begin to weaken and buyers may return.
What Comes Next for BTC?
If bearish momentum continues, Bitcoin could potentially move through the $75,000 level before testing the $67,000 region.
However, these levels remain projections rather than confirmed outcomes. Market conditions, liquidity, trading volume, and broader investor sentiment will determine whether this scenario develops.
The coming weeks could be particularly important for Bitcoin traders and investors.
The chart and these key levels are worth monitoring as the market develops. Keep an eye on upcoming updates for further analysis of $BTC.
Stay alert. The next few weeks could be decisive for Bitcoin’s short-term direction.
$AKE
$BTC
Bitcoin Drops to $78K: Is the Final Liquidation Phase About to Begin?
Bitcoin’s recent decline to the $78,000 level has raised fresh concerns across the cryptocurrency market. This move comes after an earlier warning that the $81,000 region could act as a final bull trap before another significant downside move.
The market now appears to be entering a critical phase, with liquidation pressure and bearish momentum potentially influencing Bitcoin’s next move.
Key Bitcoin Price Levels to Watch
The current downside scenario highlights several important price levels:
$78,000: Current critical price area.
$75,000: First major downside target.
$67,000: Potential deeper support zone.
Local Bottom: A possible area where selling pressure could begin to weaken and buyers may return.
What Comes Next for BTC?
If bearish momentum continues, Bitcoin could potentially move through the $75,000 level before testing the $67,000 region.
However, these levels remain projections rather than confirmed outcomes. Market conditions, liquidity, trading volume, and broader investor sentiment will determine whether this scenario develops.
The coming weeks could be particularly important for Bitcoin traders and investors.
The chart and these key levels are worth monitoring as the market develops. Keep an eye on upcoming updates for further analysis of $BTC .
Stay alert. The next few weeks could be decisive for Bitcoin’s short-term direction.
$AKE
$BTC
The market now appears to be entering a critical phase, with liquidation pressure and bearish momentum potentially influencing Bitcoin’s next move.
Key Bitcoin Price Levels to Watch
The current downside scenario highlights several important price levels:
$78,000: Current critical price area.
$75,000: First major downside target.
$67,000: Potential deeper support zone.
Local Bottom: A possible area where selling pressure could begin to weaken and buyers may return.
What Comes Next for BTC?
If bearish momentum continues, Bitcoin could potentially move through the $75,000 level before testing the $67,000 region.
However, these levels remain projections rather than confirmed outcomes. Market conditions, liquidity, trading volume, and broader investor sentiment will determine whether this scenario develops.
The coming weeks could be particularly important for Bitcoin traders and investors.
The chart and these key levels are worth monitoring as the market develops. Keep an eye on upcoming updates for further analysis of $BTC .
Stay alert. The next few weeks could be decisive for Bitcoin’s short-term direction.
$AKE
$BTC
3
584
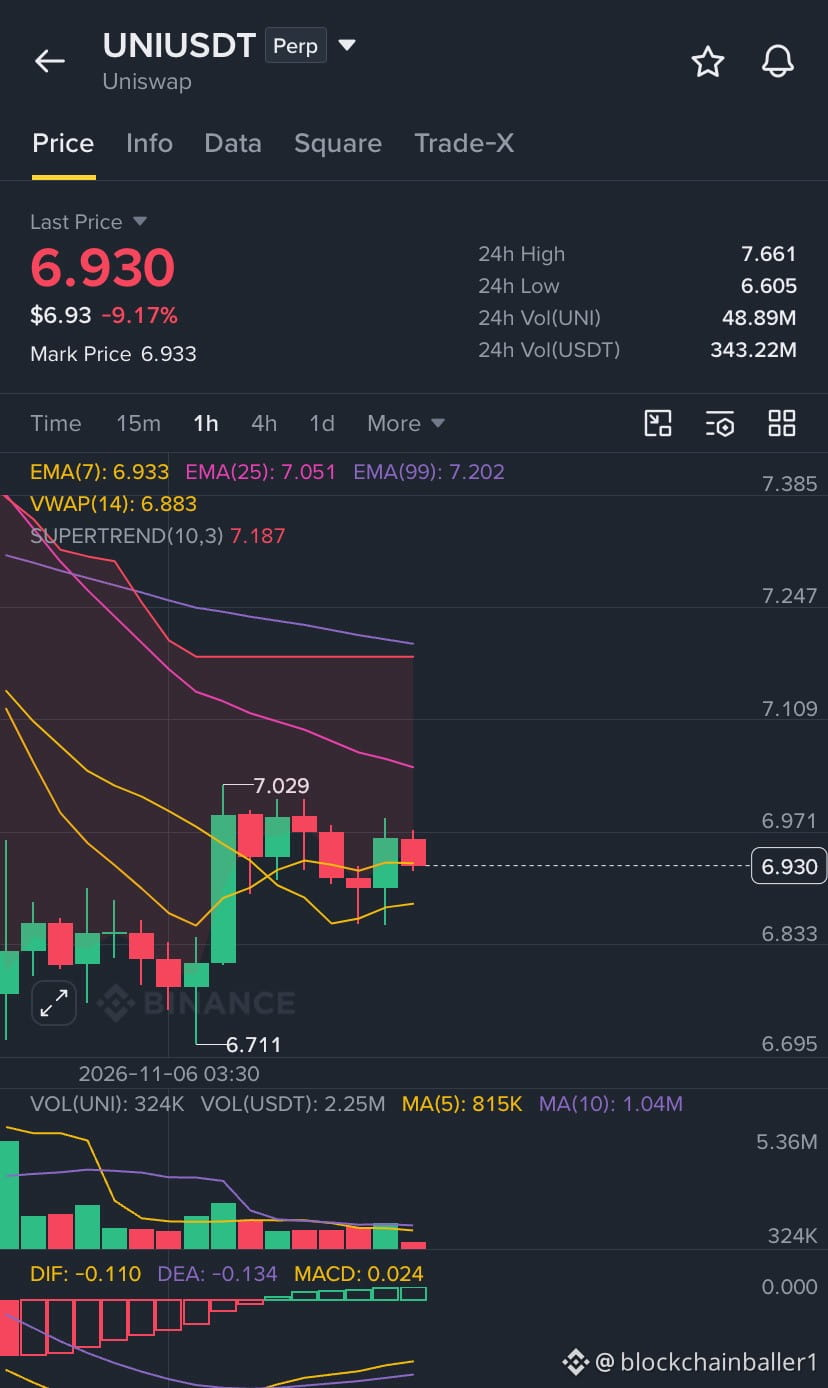
🔴 $UNI SHORT SETUP 📉
📍 Entry Zone: $6.928 – $6.952
🎯 TP1: $6.854
🎯 TP2: $6.797
🎯 TP3: $6.710
🛑 Stop Loss: $7.084
📊 Market Outlook:
UNI is trading around $6.94 on the 4H timeframe, below the EMA50 near $7.17, suggesting continued bearish pressure.
The invalidation level is approximately 2.1% above entry, while the final target offers around 3.3% downside — roughly a 1.6R risk/reward ratio.
BTC’s short-term bearish momentum could provide additional support for this setup.
👀 Key Level to Watch: Can $6.95 continue acting as resistance, or will buyers push above it?
Trade carefully and manage your risk!
{future}(UNIUSDT)
🔴 $UNI SHORT SETUP 📉
📍 Entry Zone: $6.928 – $6.952
🎯 TP1: $6.854
🎯 TP2: $6.797
🎯 TP3: $6.710
🛑 Stop Loss: $7.084
📊 Market Outlook:
UNI is trading around $6.94 on the 4H timeframe, below the EMA50 near $7.17, suggesting continued bearish pressure.
The invalidation level is approximately 2.1% above entry, while the final target offers around 3.3% downside — roughly a 1.6R risk/reward ratio.
BTC’s short-term bearish momentum could provide additional support for this setup.
👀 Key Level to Watch: Can $6.95 continue acting as resistance, or will buyers push above it?
Trade carefully and manage your risk!
📍 Entry Zone: $6.928 – $6.952
🎯 TP1: $6.854
🎯 TP2: $6.797
🎯 TP3: $6.710
🛑 Stop Loss: $7.084
📊 Market Outlook:
UNI is trading around $6.94 on the 4H timeframe, below the EMA50 near $7.17, suggesting continued bearish pressure.
The invalidation level is approximately 2.1% above entry, while the final target offers around 3.3% downside — roughly a 1.6R risk/reward ratio.
BTC’s short-term bearish momentum could provide additional support for this setup.
👀 Key Level to Watch: Can $6.95 continue acting as resistance, or will buyers push above it?
Trade carefully and manage your risk!
1
88
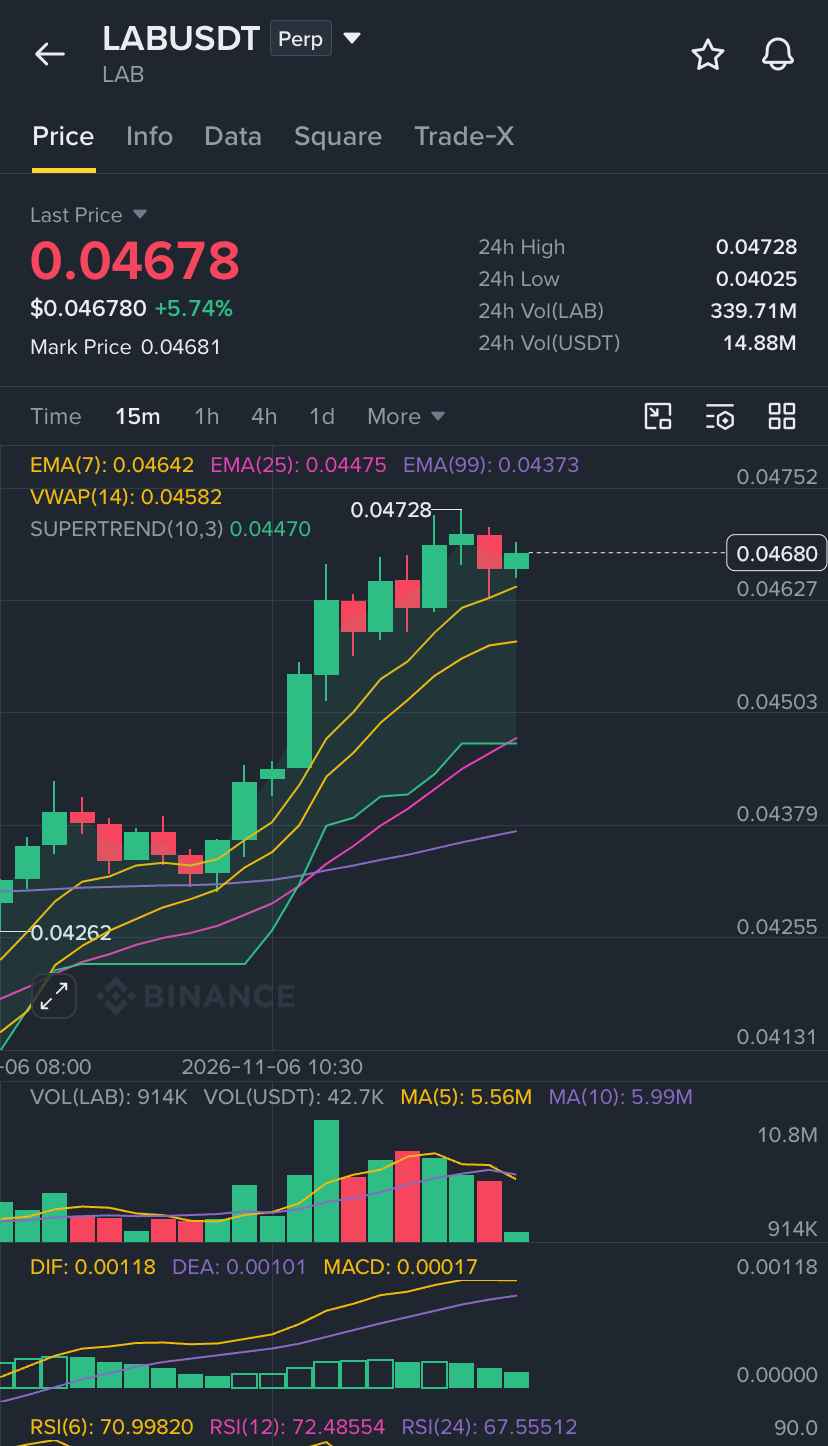
🚀 $LAB LONG OPPORTUNITY! 🔥
📍 Entry Zone: $0.0450 – $0.0472
🎯 TP1: $0.0490
🎯 TP2: $0.0510
🎯 TP3: $0.0540
🛑 Stop Loss: $0.0440
Manage your risk and trade smart! 📈
{future}(LABUSDT)
🚀 $LAB LONG OPPORTUNITY! 🔥
📍 Entry Zone: $0.0450 – $0.0472
🎯 TP1: $0.0490
🎯 TP2: $0.0510
🎯 TP3: $0.0540
🛑 Stop Loss: $0.0440
Manage your risk and trade smart! 📈
📍 Entry Zone: $0.0450 – $0.0472
🎯 TP1: $0.0490
🎯 TP2: $0.0510
🎯 TP3: $0.0540
🛑 Stop Loss: $0.0440
Manage your risk and trade smart! 📈
2
1
2
477
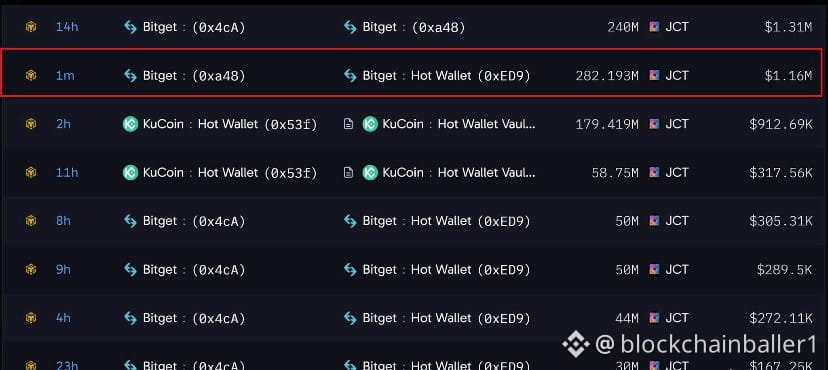
🚨 $JCT is starting to look concerning…
Around 456M $JCT has reportedly moved across the transfers shown. 👀
Keep an eye on these movements.
{future}(JCTUSDT)
🚨 $JCT is starting to look concerning…
Around 456M $JCT has reportedly moved across the transfers shown. 👀
Keep an eye on these movements.
Around 456M $JCT has reportedly moved across the transfers shown. 👀
Keep an eye on these movements.
4
2
535
Article
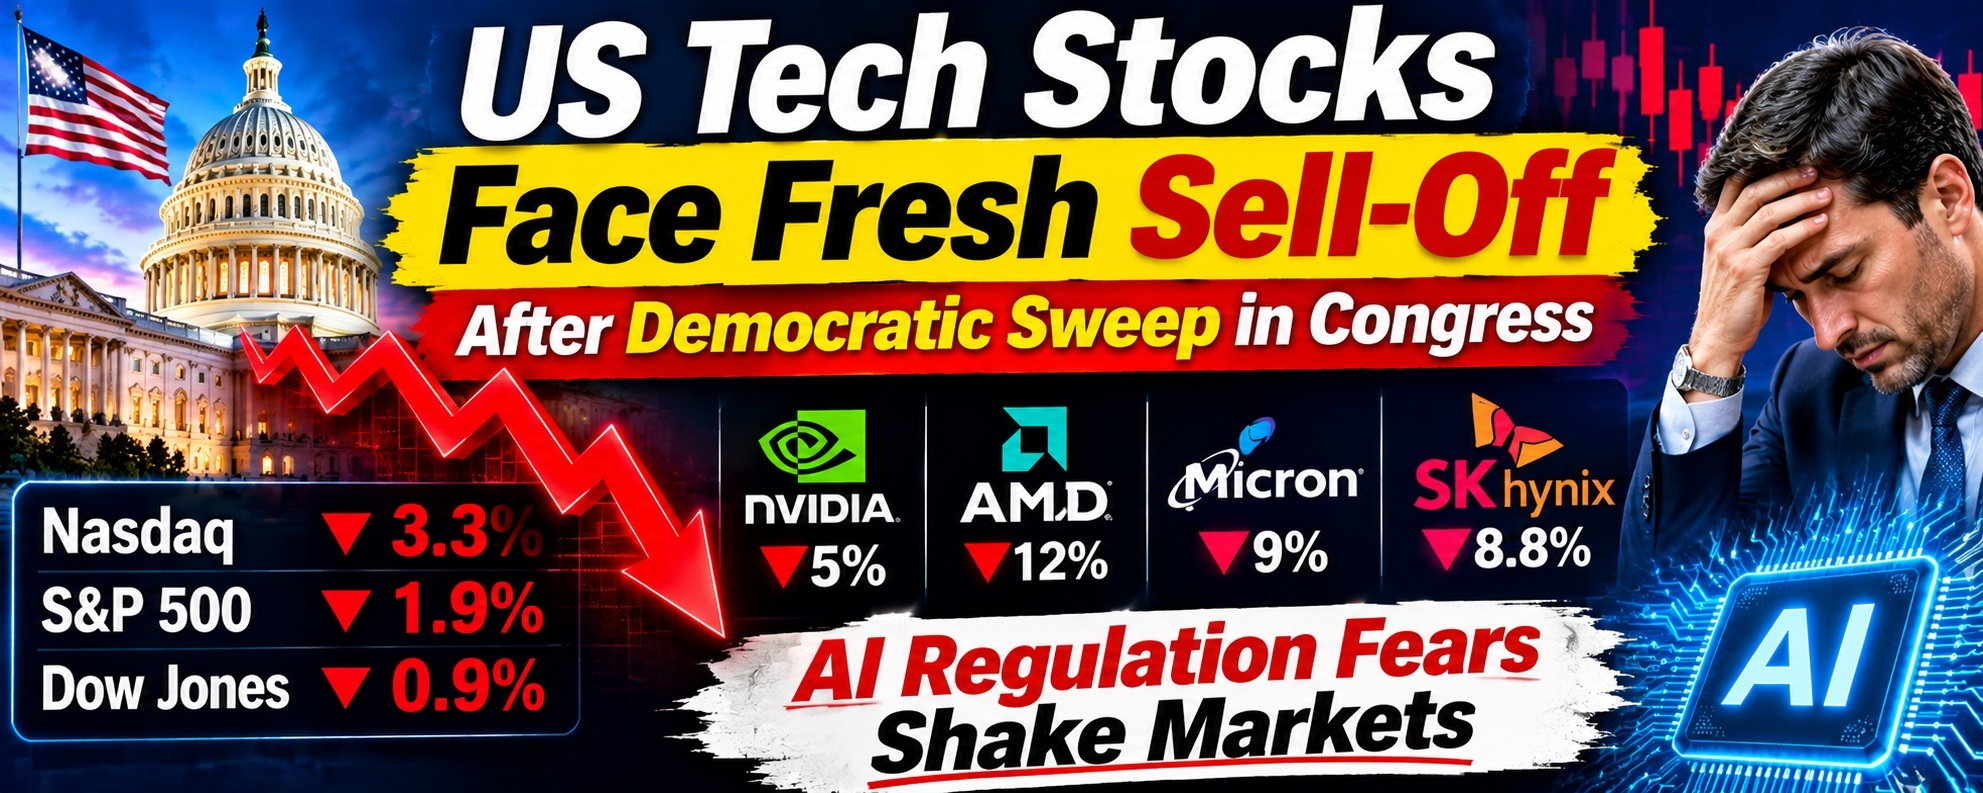
📉 STOCK MARKET UPDATE | AI Regulation Fears Trigger Fresh Sell-Off in US Tech StocksWall Street’s post-election rally quickly lost momentum as investors turned cautious about the future of AI infrastructure spending.
According to Jin10, US equities climbed Wednesday following the Democratic Party’s midterm victories, but technology stocks came under heavy selling pressure on Thursday for a second consecutive session.
📊 Market Performance
🔻 Nasdaq Composite: -3.3%
🔻 S&P 500: -1.9%
🔻 Dow Jones: -489 points (-0.9%)
Gains in defensive names such as Chevron and Johnson & Johnson were unable to offset the broader decline.
💻 AI & Semiconductor Stocks Under Pressure
The technology sell-off intensified across chipmakers and data center-related companies:
• AMD: -12%
• Micron Technology: -9%
• SK Hynix: -8.8%
• Nvidia: -5%
The Philadelphia Semiconductor Index dropped 8%, reaching its lowest level since April 20.
Meanwhile, the Nasdaq Composite has fallen more than 10% from its October 6 closing record.
🏛️ Why Are Investors Worried?
Markets are increasingly concerned that Democratic control of Congress, combined with victories in several key gubernatorial races, could pave the way for tighter restrictions on AI infrastructure development.
Potential regulatory changes surrounding data centers and AI expansion are creating uncertainty for companies heavily dependent on the sector’s growth.
📈 What Comes Next?
Jordan Watson, portfolio manager at Tandem Investment Advisors, suggested that the recent market movements and capital outflows from AI stocks may prove temporary.
However, investors could face continued volatility as markets assess the election outcome and its possible implications for future policies.
⚠️ Key Takeaway: AI stocks are facing a new wave of uncertainty as investors weigh regulatory risks against the sector’s long-term growth potential.
$NVDAB
$MSFTB $SPCXB
📉 STOCK MARKET UPDATE | AI Regulation Fears Trigger Fresh Sell-Off in US Tech Stocks
Wall Street’s post-election rally quickly lost momentum as investors turned cautious about the future of AI infrastructure spending.
According to Jin10, US equities climbed Wednesday following the Democratic Party’s midterm victories, but technology stocks came under heavy selling pressure on Thursday for a second consecutive session.
📊 Market Performance
🔻 Nasdaq Composite: -3.3%
🔻 S&P 500: -1.9%
🔻 Dow Jones: -489 points (-0.9%)
Gains in defensive names such as Chevron and Johnson & Johnson were unable to offset the broader decline.
💻 AI & Semiconductor Stocks Under Pressure
The technology sell-off intensified across chipmakers and data center-related companies:
• AMD: -12%
• Micron Technology: -9%
• SK Hynix: -8.8%
• Nvidia: -5%
The Philadelphia Semiconductor Index dropped 8%, reaching its lowest level since April 20.
Meanwhile, the Nasdaq Composite has fallen more than 10% from its October 6 closing record.
🏛️ Why Are Investors Worried?
Markets are increasingly concerned that Democratic control of Congress, combined with victories in several key gubernatorial races, could pave the way for tighter restrictions on AI infrastructure development.
Potential regulatory changes surrounding data centers and AI expansion are creating uncertainty for companies heavily dependent on the sector’s growth.
📈 What Comes Next?
Jordan Watson, portfolio manager at Tandem Investment Advisors, suggested that the recent market movements and capital outflows from AI stocks may prove temporary.
However, investors could face continued volatility as markets assess the election outcome and its possible implications for future policies.
⚠️ Key Takeaway: AI stocks are facing a new wave of uncertainty as investors weigh regulatory risks against the sector’s long-term growth potential.
$NVDAB
$MSFTB $SPCXB
According to Jin10, US equities climbed Wednesday following the Democratic Party’s midterm victories, but technology stocks came under heavy selling pressure on Thursday for a second consecutive session.
📊 Market Performance
🔻 Nasdaq Composite: -3.3%
🔻 S&P 500: -1.9%
🔻 Dow Jones: -489 points (-0.9%)
Gains in defensive names such as Chevron and Johnson & Johnson were unable to offset the broader decline.
💻 AI & Semiconductor Stocks Under Pressure
The technology sell-off intensified across chipmakers and data center-related companies:
• AMD: -12%
• Micron Technology: -9%
• SK Hynix: -8.8%
• Nvidia: -5%
The Philadelphia Semiconductor Index dropped 8%, reaching its lowest level since April 20.
Meanwhile, the Nasdaq Composite has fallen more than 10% from its October 6 closing record.
🏛️ Why Are Investors Worried?
Markets are increasingly concerned that Democratic control of Congress, combined with victories in several key gubernatorial races, could pave the way for tighter restrictions on AI infrastructure development.
Potential regulatory changes surrounding data centers and AI expansion are creating uncertainty for companies heavily dependent on the sector’s growth.
📈 What Comes Next?
Jordan Watson, portfolio manager at Tandem Investment Advisors, suggested that the recent market movements and capital outflows from AI stocks may prove temporary.
However, investors could face continued volatility as markets assess the election outcome and its possible implications for future policies.
⚠️ Key Takeaway: AI stocks are facing a new wave of uncertainty as investors weigh regulatory risks against the sector’s long-term growth potential.
$NVDAB
$MSFTB $SPCXB
1
217
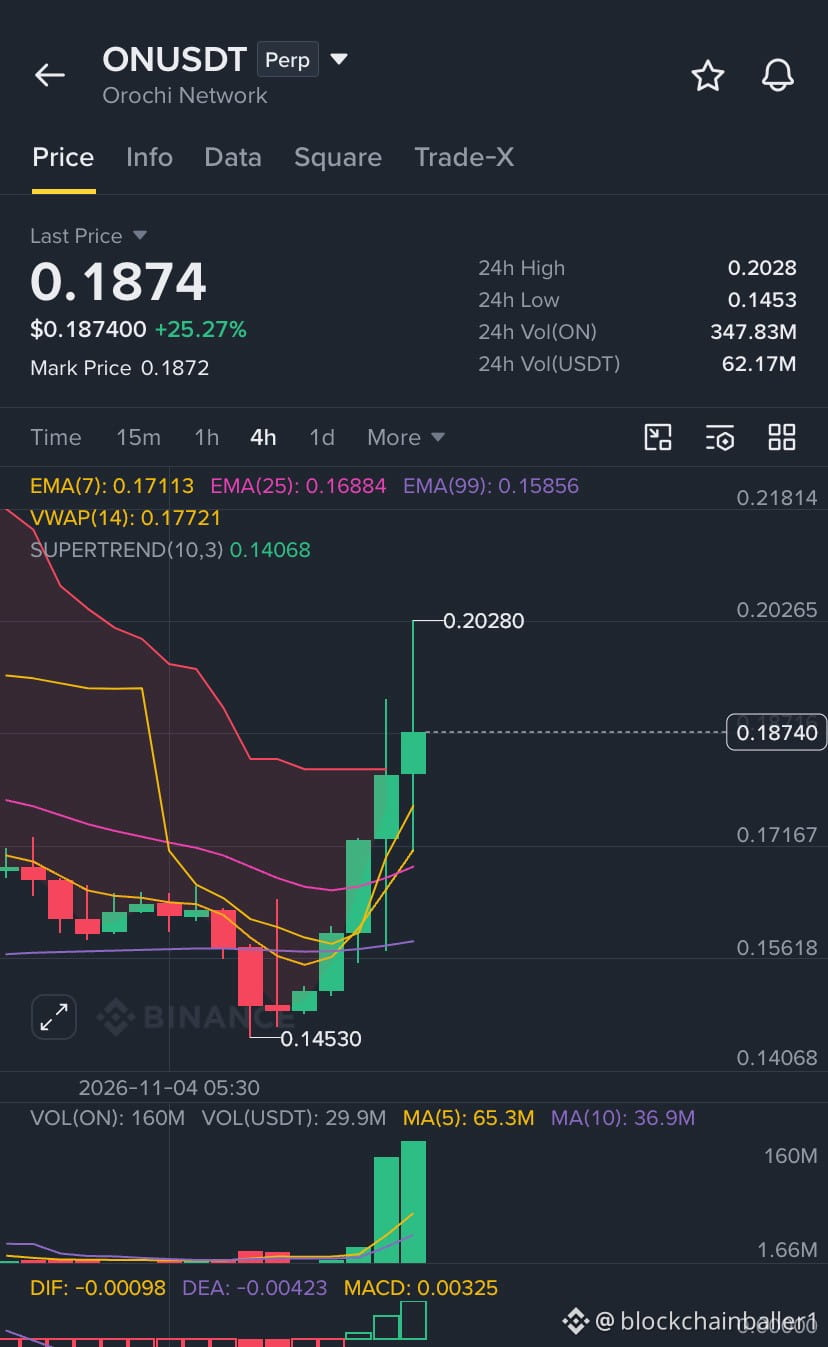
🚀 $ON LONG SETUP — Bullish Momentum Building!
Buyers appear to be regaining control following the recent dip. I’m watching $ON for a potential upside move toward the $0.2050 zone.
📍 Entry Range: $0.1848 – $0.1860
🎯 Profit Targets:
• TP1: $0.1900
• TP2: $0.1950
• TP3: $0.2050
🛑 Stop Loss: $0.1732
⚠️ Always use proper risk management and avoid risking more than you can afford to lose.
{future}(ONUSDT)
🚀 $ON LONG SETUP — Bullish Momentum Building!
Buyers appear to be regaining control following the recent dip. I’m watching $ON for a potential upside move toward the $0.2050 zone.
📍 Entry Range: $0.1848 – $0.1860
🎯 Profit Targets:
• TP1: $0.1900
• TP2: $0.1950
• TP3: $0.2050
🛑 Stop Loss: $0.1732
⚠️ Always use proper risk management and avoid risking more than you can afford to lose.
Buyers appear to be regaining control following the recent dip. I’m watching $ON for a potential upside move toward the $0.2050 zone.
📍 Entry Range: $0.1848 – $0.1860
🎯 Profit Targets:
• TP1: $0.1900
• TP2: $0.1950
• TP3: $0.2050
🛑 Stop Loss: $0.1732
⚠️ Always use proper risk management and avoid risking more than you can afford to lose.
2
2
178

Article
🚨 Jim Cramer Issues Warning: October Jobs Data Could Reverse Wall Street’s Midterm RallyWall Street and the crypto market experienced a strong rally following the Democrats’ congressional victory. However, CNBC’s Jim Cramer believes the upcoming US employment report could put those gains at risk.
According to BeInCrypto, Cramer warned that Friday’s October jobs data could become the next major market catalyst, potentially shifting expectations for Federal Reserve interest rates.
📊 Wall Street’s Powerful Rally
US equities recorded significant gains:
🔹 Dow Jones: +3.03% to 53,356.12
🔹 S&P 500: +1.58% to 7,688.62
🔹 Nasdaq Composite: +1.44% to 25,736.51
The rally reportedly added approximately $1.2 trillion to the US stock market’s total value. Meanwhile, the overall crypto market capitalization climbed nearly 2%, with all 10 leading cryptocurrencies trading higher.
💻 AI Stocks Move in Different Directions
The market reaction was not uniform across the technology sector.
Microsoft surged 6.70%, Amazon gained 6.58%, and Apple advanced 5.54%, reaching a new record.
Meanwhile, Nvidia fell 2.76%, while AMD, CoreWeave, Nebius, and Iren also faced selling pressure.
Investors are weighing whether political opposition to data center expansion could slow AI infrastructure investment and affect companies dependent on that spending.
🏦 The Federal Reserve Remains in Focus
Cramer argued that election results do not fundamentally change the underlying business cycle.
JPMorgan strategist Michael Cembalest shares a similar view, emphasizing that interest rates, Fed policy, corporate earnings, and AI-related borrowing remain the major drivers of financial markets.
The Federal Reserve previously maintained its benchmark rate at 3.75%–4.00%, with two officials voting in favor of an increase.
According to CME FedWatch, the probability of a December rate hike remained elevated at 82%, compared with 77.4% a day earlier.
📅 Friday’s Jobs Report Could Change Everything
Economists surveyed by Reuters expect October payrolls to increase by 65,000, compared with September’s 29,000. The unemployment rate is forecast to remain at 4.2%.
Early employment indicators have shown stronger numbers:
• ADP reported 86,000 private-sector jobs, exceeding expectations of 75,000.
• Vanguard estimates that October employment growth could reach 120,000.
However, ADP’s figures have historically been an unreliable predictor of the government’s official employment report.
📉 What Could Happen Next?
A stronger-than-expected jobs report could increase expectations of a Fed rate hike, push Treasury yields higher, and put pressure on technology stocks and cryptocurrencies.
Conversely, weaker employment data could reduce rate-hike expectations and potentially support another leg higher in risk assets.
Cramer cautioned that Wednesday’s rally was heavily influenced by the election outcome, but Friday’s economic data could quickly shift investor sentiment.
The key question now: Will the October jobs report extend the rally or trigger a major reversal?
#BTCRebounds80K #USMidterms-WhatAreMarketsExpecting?
$TSLAB
{spot}(TSLABUSDT)
$AAPLB $SPCXB
🚨 Jim Cramer Issues Warning: October Jobs Data Could Reverse Wall Street’s Midterm Rally
Wall Street and the crypto market experienced a strong rally following the Democrats’ congressional victory. However, CNBC’s Jim Cramer believes the upcoming US employment report could put those gains at risk.
According to BeInCrypto, Cramer warned that Friday’s October jobs data could become the next major market catalyst, potentially shifting expectations for Federal Reserve interest rates.
📊 Wall Street’s Powerful Rally
US equities recorded significant gains:
🔹 Dow Jones: +3.03% to 53,356.12
🔹 S&P 500: +1.58% to 7,688.62
🔹 Nasdaq Composite: +1.44% to 25,736.51
The rally reportedly added approximately $1.2 trillion to the US stock market’s total value. Meanwhile, the overall crypto market capitalization climbed nearly 2%, with all 10 leading cryptocurrencies trading higher.
💻 AI Stocks Move in Different Directions
The market reaction was not uniform across the technology sector.
Microsoft surged 6.70%, Amazon gained 6.58%, and Apple advanced 5.54%, reaching a new record.
Meanwhile, Nvidia fell 2.76%, while AMD, CoreWeave, Nebius, and Iren also faced selling pressure.
Investors are weighing whether political opposition to data center expansion could slow AI infrastructure investment and affect companies dependent on that spending.
🏦 The Federal Reserve Remains in Focus
Cramer argued that election results do not fundamentally change the underlying business cycle.
JPMorgan strategist Michael Cembalest shares a similar view, emphasizing that interest rates, Fed policy, corporate earnings, and AI-related borrowing remain the major drivers of financial markets.
The Federal Reserve previously maintained its benchmark rate at 3.75%–4.00%, with two officials voting in favor of an increase.
According to CME FedWatch, the probability of a December rate hike remained elevated at 82%, compared with 77.4% a day earlier.
📅 Friday’s Jobs Report Could Change Everything
Economists surveyed by Reuters expect October payrolls to increase by 65,000, compared with September’s 29,000. The unemployment rate is forecast to remain at 4.2%.
Early employment indicators have shown stronger numbers:
• ADP reported 86,000 private-sector jobs, exceeding expectations of 75,000.
• Vanguard estimates that October employment growth could reach 120,000.
However, ADP’s figures have historically been an unreliable predictor of the government’s official employment report.
📉 What Could Happen Next?
A stronger-than-expected jobs report could increase expectations of a Fed rate hike, push Treasury yields higher, and put pressure on technology stocks and cryptocurrencies.
Conversely, weaker employment data could reduce rate-hike expectations and potentially support another leg higher in risk assets.
Cramer cautioned that Wednesday’s rally was heavily influenced by the election outcome, but Friday’s economic data could quickly shift investor sentiment.
The key question now: Will the October jobs report extend the rally or trigger a major reversal?
#BTCRebounds80K #USMidterms-WhatAreMarketsExpecting?
$TSLAB
$AAPLB $SPCXB
According to BeInCrypto, Cramer warned that Friday’s October jobs data could become the next major market catalyst, potentially shifting expectations for Federal Reserve interest rates.
📊 Wall Street’s Powerful Rally
US equities recorded significant gains:
🔹 Dow Jones: +3.03% to 53,356.12
🔹 S&P 500: +1.58% to 7,688.62
🔹 Nasdaq Composite: +1.44% to 25,736.51
The rally reportedly added approximately $1.2 trillion to the US stock market’s total value. Meanwhile, the overall crypto market capitalization climbed nearly 2%, with all 10 leading cryptocurrencies trading higher.
💻 AI Stocks Move in Different Directions
The market reaction was not uniform across the technology sector.
Microsoft surged 6.70%, Amazon gained 6.58%, and Apple advanced 5.54%, reaching a new record.
Meanwhile, Nvidia fell 2.76%, while AMD, CoreWeave, Nebius, and Iren also faced selling pressure.
Investors are weighing whether political opposition to data center expansion could slow AI infrastructure investment and affect companies dependent on that spending.
🏦 The Federal Reserve Remains in Focus
Cramer argued that election results do not fundamentally change the underlying business cycle.
JPMorgan strategist Michael Cembalest shares a similar view, emphasizing that interest rates, Fed policy, corporate earnings, and AI-related borrowing remain the major drivers of financial markets.
The Federal Reserve previously maintained its benchmark rate at 3.75%–4.00%, with two officials voting in favor of an increase.
According to CME FedWatch, the probability of a December rate hike remained elevated at 82%, compared with 77.4% a day earlier.
📅 Friday’s Jobs Report Could Change Everything
Economists surveyed by Reuters expect October payrolls to increase by 65,000, compared with September’s 29,000. The unemployment rate is forecast to remain at 4.2%.
Early employment indicators have shown stronger numbers:
• ADP reported 86,000 private-sector jobs, exceeding expectations of 75,000.
• Vanguard estimates that October employment growth could reach 120,000.
However, ADP’s figures have historically been an unreliable predictor of the government’s official employment report.
📉 What Could Happen Next?
A stronger-than-expected jobs report could increase expectations of a Fed rate hike, push Treasury yields higher, and put pressure on technology stocks and cryptocurrencies.
Conversely, weaker employment data could reduce rate-hike expectations and potentially support another leg higher in risk assets.
Cramer cautioned that Wednesday’s rally was heavily influenced by the election outcome, but Friday’s economic data could quickly shift investor sentiment.
The key question now: Will the October jobs report extend the rally or trigger a major reversal?
#BTCRebounds80K #USMidterms-WhatAreMarketsExpecting?
$TSLAB
$AAPLB $SPCXB
1
221
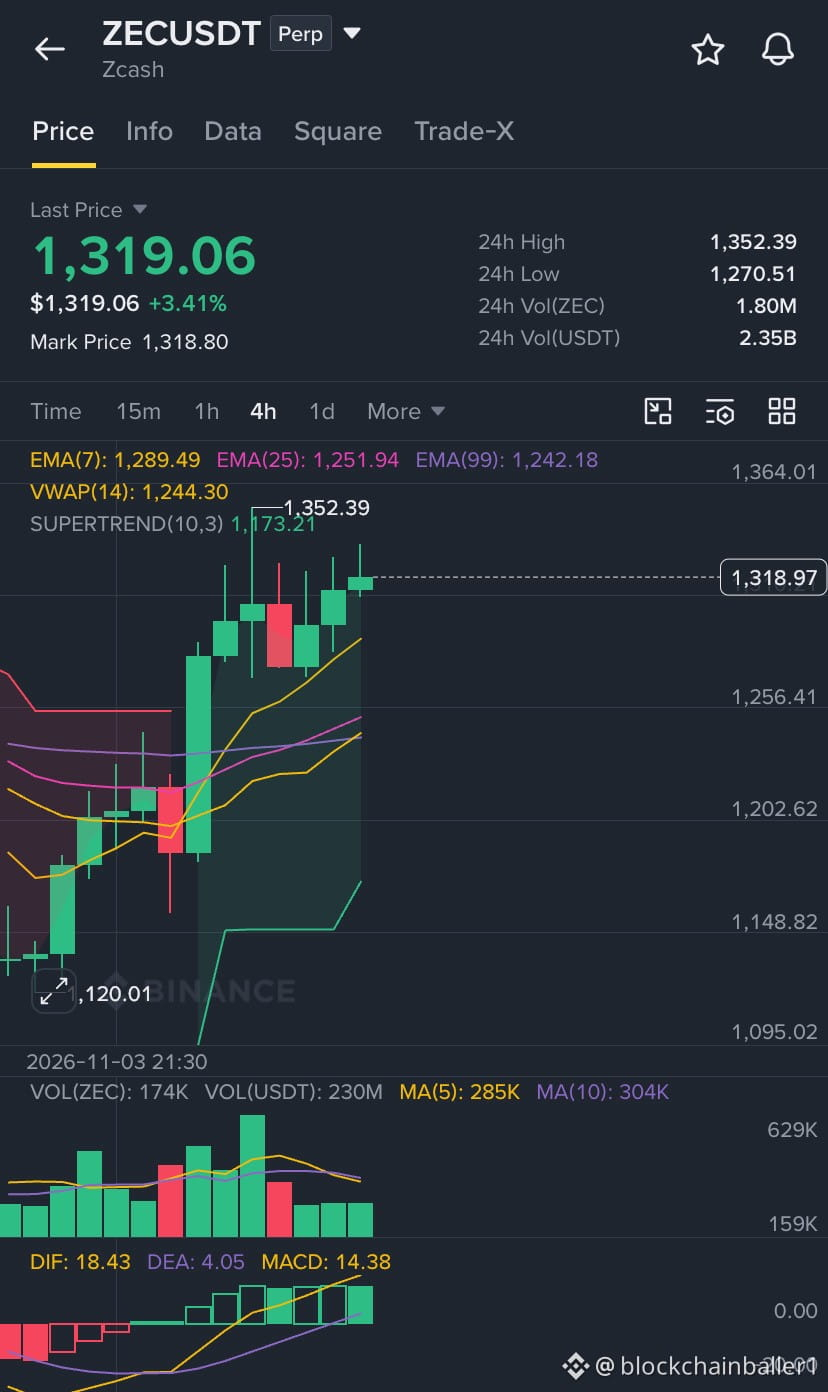
🚀 $ZEC — THE NEXT BIG MOVE? 👀
💰 $1,334 → $2,000 in focus!
🎯 Potential targets:
$1,500 → $1,700 → $2,000
🔑 Key price levels:
✅ Holding above $1,321 could keep the bullish momentum alive.
⚠️ Losing $1,350 may trigger a pullback toward $1,200.
🔥 Are you positioning for the next move?
{future}(ZECUSDT)
🚀 $ZEC — THE NEXT BIG MOVE? 👀
💰 $1,334 → $2,000 in focus!
🎯 Potential targets:
$1,500 → $1,700 → $2,000
🔑 Key price levels:
✅ Holding above $1,321 could keep the bullish momentum alive.
⚠️ Losing $1,350 may trigger a pullback toward $1,200.
🔥 Are you positioning for the next move?
💰 $1,334 → $2,000 in focus!
🎯 Potential targets:
$1,500 → $1,700 → $2,000
🔑 Key price levels:
✅ Holding above $1,321 could keep the bullish momentum alive.
⚠️ Losing $1,350 may trigger a pullback toward $1,200.
🔥 Are you positioning for the next move?
2
216
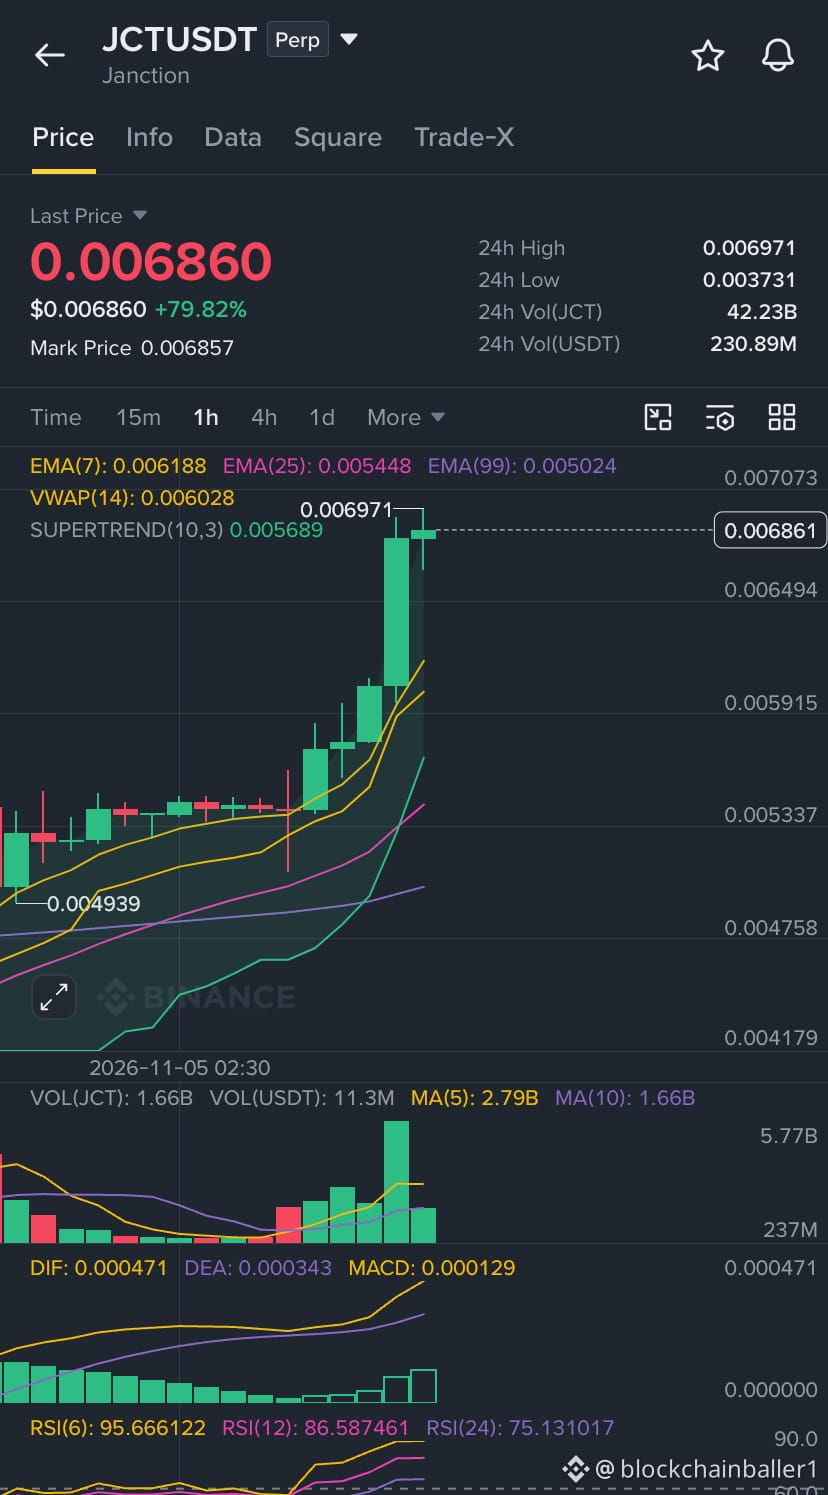
🚀 $JCT — LONG SETUP IS LIVE! 📈
📍 Entry Price: $0.0680 (CMP)
🎯 Target 1: $0.0710
🎯 Target 2: $0.0750
🛑 Stop Loss: $0.0600
⚡ Keep an eye on momentum and trade with proper risk management!
{future}(JCTUSDT)
🚀 $JCT — LONG SETUP IS LIVE! 📈
📍 Entry Price: $0.0680 (CMP)
🎯 Target 1: $0.0710
🎯 Target 2: $0.0750
🛑 Stop Loss: $0.0600
⚡ Keep an eye on momentum and trade with proper risk management!
📍 Entry Price: $0.0680 (CMP)
🎯 Target 1: $0.0710
🎯 Target 2: $0.0750
🛑 Stop Loss: $0.0600
⚡ Keep an eye on momentum and trade with proper risk management!
2
482
Log in to explore more content
Join global crypto users on Binance Square
⚡️ Get latest and useful information about crypto.
💬 Trusted by the world’s largest crypto exchange.
👍 Discover real insights from verified creators.
Email / Phone number
Trending Topics
BitcoinRebounds$75KAsChipsLead
425 views
22 Discussing
Market Watch | Bitcoin Rebounds to $75,600 After Dip Below $75,000 as Chip Stocks Lead Rally on Jobs Beat
Binance News
·1 Likes
·1.4k views
JobsReportRaisesHikeOdds
33,033 views
525 Discussing
US Data Center Rules May Constrain AI Expansion
4,838 views
61 Discussing