

jimwilldoit积木
18.1k Posts

jimwilldoit积木
Report
Block User
听说点关注的都赚麻了! 币安钱包专属邀请码:jimwilldoit X:@jimwilldoitnow 合作私我 爱你们!祝打赏的家人们发发发!全网同名:jimwilldoit

BNB Holder
Frequent Trader
4 Years
269 Following
10.0K+ Followers
18.7K+ Liked
Posts
All
Quotes
Videos
Live
·
--
Bullish
$BTC The US crypto regulation is moving ahead—before Congress even pushes it!
The CLARITY Act failed to make progress in Congress.
SEC Chair Paul Atkins has clearly stated he won’t stop.
One key focus is to establish clearer rules for on-chain fundraising.
The US is trying to pull crypto projects back into domestic financing!
The core signal Atkins just released is unmistakable: even if the CLARITY Act doesn’t move forward for now, the SEC will still use existing statutory authority to further refine on-chain capital formation rules. In practice, the SEC has already proposed Regulation Crypto Assets, designing special fundraising exemptions for certain crypto projects— including a startup funding route of up to $5 million, and a funding route of up to $75 million every 12 months, provided disclosure requirements are met.
More importantly, this is no longer just talk. This month, the SEC also rolled out a temporary Innovation Exemption for certain tokenized US stock on-chain trading. Congressional legislation may be more stable and long-term, but the SEC’s direction is now clear: fundraising, tokenization, and on-chain trading are all being moved, step by step, from a “regulatory gray area” toward a framework with rules to follow.
While Congress is still working, the SEC is laying the groundwork first.
The focus of US crypto regulation is shifting from “whether you can do it” to “what rules you must follow”!
Click the card below and get started! 👇
$ETH $ZEC
$BTC The US crypto regulation is moving ahead—before Congress even pushes it!
The CLARITY Act failed to make progress in Congress.
SEC Chair Paul Atkins has clearly stated he won’t stop.
One key focus is to establish clearer rules for on-chain fundraising.
The US is trying to pull crypto projects back into domestic financing!
The core signal Atkins just released is unmistakable: even if the CLARITY Act doesn’t move forward for now, the SEC will still use existing statutory authority to further refine on-chain capital formation rules. In practice, the SEC has already proposed Regulation Crypto Assets, designing special fundraising exemptions for certain crypto projects— including a startup funding route of up to $5 million, and a funding route of up to $75 million every 12 months, provided disclosure requirements are met.
More importantly, this is no longer just talk. This month, the SEC also rolled out a temporary Innovation Exemption for certain tokenized US stock on-chain trading. Congressional legislation may be more stable and long-term, but the SEC’s direction is now clear: fundraising, tokenization, and on-chain trading are all being moved, step by step, from a “regulatory gray area” toward a framework with rules to follow.
While Congress is still working, the SEC is laying the groundwork first.
The focus of US crypto regulation is shifting from “whether you can do it” to “what rules you must follow”!
Click the card below and get started! 👇
$ETH $ZEC
The CLARITY Act failed to make progress in Congress.
SEC Chair Paul Atkins has clearly stated he won’t stop.
One key focus is to establish clearer rules for on-chain fundraising.
The US is trying to pull crypto projects back into domestic financing!
The core signal Atkins just released is unmistakable: even if the CLARITY Act doesn’t move forward for now, the SEC will still use existing statutory authority to further refine on-chain capital formation rules. In practice, the SEC has already proposed Regulation Crypto Assets, designing special fundraising exemptions for certain crypto projects— including a startup funding route of up to $5 million, and a funding route of up to $75 million every 12 months, provided disclosure requirements are met.
More importantly, this is no longer just talk. This month, the SEC also rolled out a temporary Innovation Exemption for certain tokenized US stock on-chain trading. Congressional legislation may be more stable and long-term, but the SEC’s direction is now clear: fundraising, tokenization, and on-chain trading are all being moved, step by step, from a “regulatory gray area” toward a framework with rules to follow.
While Congress is still working, the SEC is laying the groundwork first.
The focus of US crypto regulation is shifting from “whether you can do it” to “what rules you must follow”!
Click the card below and get started! 👇
$ETH $ZEC

2
8
7.7k
·
--
Bullish
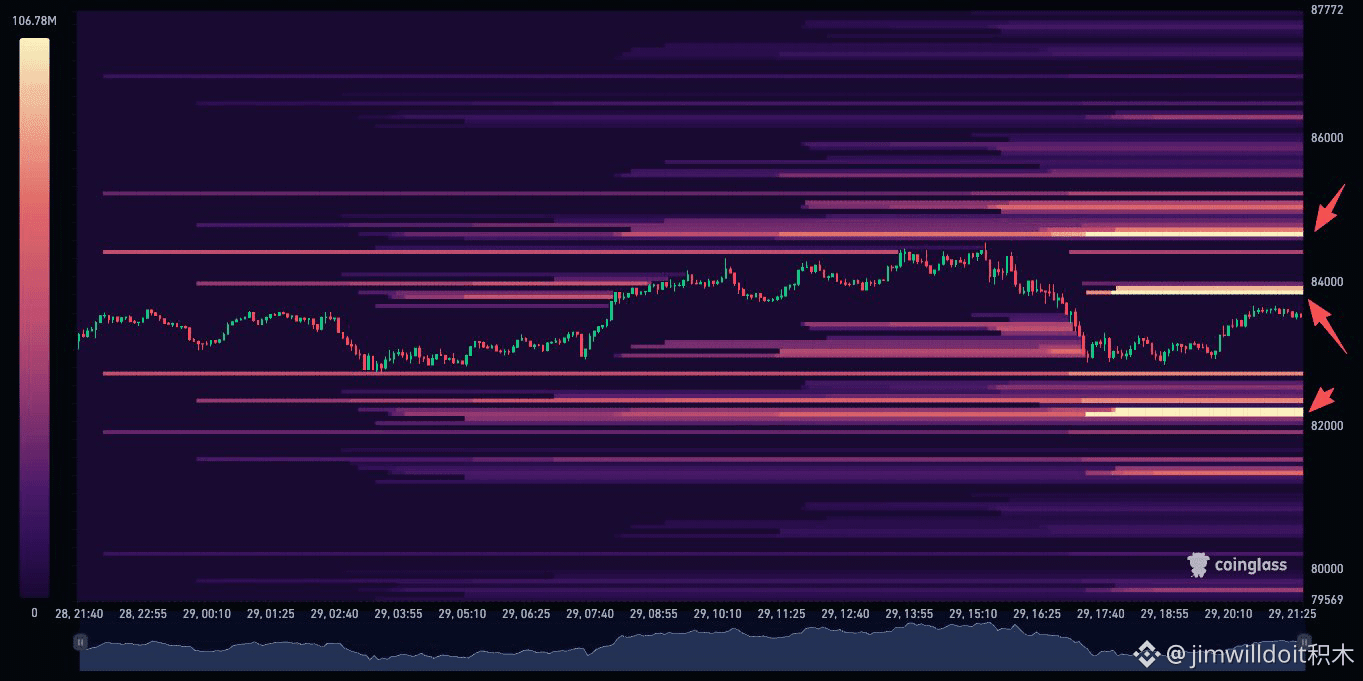
$BTC Trapped again by three high-leverage liquidity zones!
Above, a clear short-liquidation zone is stacked at $84,700.
Right overhead is $83,800!
Below, $82,200 also hides a large amount of long-side liquidity.
Which side BTC’s next sweep targets could quickly amplify short-term volatility!
Based on the 24-hour liquidation heatmap, the three most important levels to watch right now are $84,700, $83,800, and $82,200. BTC is currently trading above $83,000. The nearest level overhead at $83,800 is likely to become the first “liquidity magnet.” Once it’s reclaimed again, the attractiveness of the $84,700 short-liquidation zone will keep growing.
On the other hand, if the rebound keeps failing to break through and hold above $83,800, and price turns back down, then the large long-liquidation zone near $82,200 is worth watching closely. The heatmap shows potential liquidation liquidity—it doesn’t mean price is guaranteed to sweep it—but right now, the “fuel” on both the upside and downside is laid out very clearly.
Get back $83,800 first, and only then will the bulls have a chance to sweep higher.
If it can’t be reclaimed, the $82,200 liquidity zone will become increasingly hard to ignore!
Click the card below and go straight at it!👇
$ETH $ZEC
$BTC Trapped again by three high-leverage liquidity zones!
Above, a clear short-liquidation zone is stacked at $84,700.
Right overhead is $83,800!
Below, $82,200 also hides a large amount of long-side liquidity.
Which side BTC’s next sweep targets could quickly amplify short-term volatility!
Based on the 24-hour liquidation heatmap, the three most important levels to watch right now are $84,700, $83,800, and $82,200. BTC is currently trading above $83,000. The nearest level overhead at $83,800 is likely to become the first “liquidity magnet.” Once it’s reclaimed again, the attractiveness of the $84,700 short-liquidation zone will keep growing.
On the other hand, if the rebound keeps failing to break through and hold above $83,800, and price turns back down, then the large long-liquidation zone near $82,200 is worth watching closely. The heatmap shows potential liquidation liquidity—it doesn’t mean price is guaranteed to sweep it—but right now, the “fuel” on both the upside and downside is laid out very clearly.
Get back $83,800 first, and only then will the bulls have a chance to sweep higher.
If it can’t be reclaimed, the $82,200 liquidity zone will become increasingly hard to ignore!
Click the card below and go straight at it!👇
$ETH $ZEC
Above, a clear short-liquidation zone is stacked at $84,700.
Right overhead is $83,800!
Below, $82,200 also hides a large amount of long-side liquidity.
Which side BTC’s next sweep targets could quickly amplify short-term volatility!
Based on the 24-hour liquidation heatmap, the three most important levels to watch right now are $84,700, $83,800, and $82,200. BTC is currently trading above $83,000. The nearest level overhead at $83,800 is likely to become the first “liquidity magnet.” Once it’s reclaimed again, the attractiveness of the $84,700 short-liquidation zone will keep growing.
On the other hand, if the rebound keeps failing to break through and hold above $83,800, and price turns back down, then the large long-liquidation zone near $82,200 is worth watching closely. The heatmap shows potential liquidation liquidity—it doesn’t mean price is guaranteed to sweep it—but right now, the “fuel” on both the upside and downside is laid out very clearly.
Get back $83,800 first, and only then will the bulls have a chance to sweep higher.
If it can’t be reclaimed, the $82,200 liquidity zone will become increasingly hard to ignore!
Click the card below and go straight at it!👇
$ETH $ZEC
2
1
3.2k
·
--
Bullish
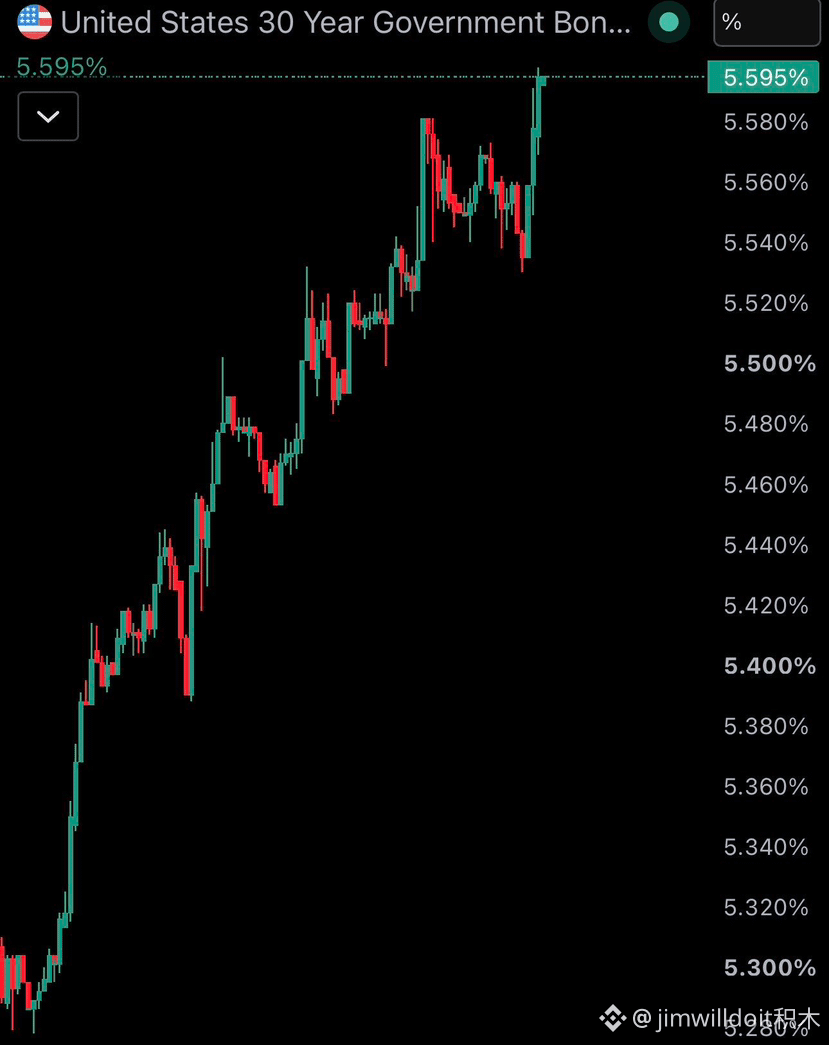
$BTC US Treasury market is sounding alarms again!
The yield on the US 30-year Treasury has surged to 5.61%.
Straight up to the highest level since 2002!
The 10-year yield has also climbed to around 5.27%.
Global risk assets are once again facing pressure from long-term interest rates.
This round of US Treasury selloff has clearly spread to the long end: during the session, the 30-year yield rose to about 5.61%, while the 10-year yield is now at the highest level since 2007. The pressure isn’t only driven by expectations of further Federal Reserve rate hikes. Concerns about inflation from rising oil prices, the US fiscal deficit, and the ongoing increase in Treasury issuance are all causing investors to demand higher long-term yields.
For BTC, this is still one of the key macro variables that needs close monitoring. The higher the long-end yields, the tighter the financial conditions become, and the stronger the appeal of the dollar and risk-free yield assets. If the 30-year yield continues breaking upward, BTC, US stocks, and gold could all face further valuation pressure.
A 30-year US Treasury yield of 5.6% isn’t just ordinary volatility.
If BTC wants to regain momentum, it’s best to first see this Treasury selloff hit the brakes!
Click the card below—go for it!👇
$ETH $ZEC
$BTC US Treasury market is sounding alarms again!
The yield on the US 30-year Treasury has surged to 5.61%.
Straight up to the highest level since 2002!
The 10-year yield has also climbed to around 5.27%.
Global risk assets are once again facing pressure from long-term interest rates.
This round of US Treasury selloff has clearly spread to the long end: during the session, the 30-year yield rose to about 5.61%, while the 10-year yield is now at the highest level since 2007. The pressure isn’t only driven by expectations of further Federal Reserve rate hikes. Concerns about inflation from rising oil prices, the US fiscal deficit, and the ongoing increase in Treasury issuance are all causing investors to demand higher long-term yields.
For BTC, this is still one of the key macro variables that needs close monitoring. The higher the long-end yields, the tighter the financial conditions become, and the stronger the appeal of the dollar and risk-free yield assets. If the 30-year yield continues breaking upward, BTC, US stocks, and gold could all face further valuation pressure.
A 30-year US Treasury yield of 5.6% isn’t just ordinary volatility.
If BTC wants to regain momentum, it’s best to first see this Treasury selloff hit the brakes!
Click the card below—go for it!👇
$ETH $ZEC
The yield on the US 30-year Treasury has surged to 5.61%.
Straight up to the highest level since 2002!
The 10-year yield has also climbed to around 5.27%.
Global risk assets are once again facing pressure from long-term interest rates.
This round of US Treasury selloff has clearly spread to the long end: during the session, the 30-year yield rose to about 5.61%, while the 10-year yield is now at the highest level since 2007. The pressure isn’t only driven by expectations of further Federal Reserve rate hikes. Concerns about inflation from rising oil prices, the US fiscal deficit, and the ongoing increase in Treasury issuance are all causing investors to demand higher long-term yields.
For BTC, this is still one of the key macro variables that needs close monitoring. The higher the long-end yields, the tighter the financial conditions become, and the stronger the appeal of the dollar and risk-free yield assets. If the 30-year yield continues breaking upward, BTC, US stocks, and gold could all face further valuation pressure.
A 30-year US Treasury yield of 5.6% isn’t just ordinary volatility.
If BTC wants to regain momentum, it’s best to first see this Treasury selloff hit the brakes!
Click the card below—go for it!👇
$ETH $ZEC
BTC+0.02%
TLTETF+0.42%
1
9
15.3k
·
--
Bullish
Verified
$BTC Yet another Wall Street giant is starting to move financial business onto the blockchain!
Morgan Stanley has set up a digital asset lab.
Stablecoins and asset tokenization are all within the scope of testing!
Even DeFi applications are being put on the table.
Banking on-chain has moved from research papers to real product testing!
The latest reports show that Morgan Stanley is using its digital asset lab to test use cases such as stablecoin payments, tokenization of real-world assets, and DeFi applications. This year, Morgan Stanley has also been strengthening its digital asset positioning, and has publicly said that stablecoins and asset tokenization are gradually entering the mainstream financial system.
What’s truly worth watching isn’t that a single bank suddenly “takes a liking” to crypto, but that traditional finance is directly studying how to move payments, settlement, asset issuance, and trading onto the chain. Previously, Morgan Stanley’s investment management more directly suggested that future financial infrastructure may become increasingly “on-chain,” with stablecoins potentially serving as an important foundational component.
In the past, Wall Street studied blockchain.
Now, Wall Street is starting to directly test how to use the chain!
Click the card below and get started!👇
$ETH $ZEC
$BTC Yet another Wall Street giant is starting to move financial business onto the blockchain!
Morgan Stanley has set up a digital asset lab.
Stablecoins and asset tokenization are all within the scope of testing!
Even DeFi applications are being put on the table.
Banking on-chain has moved from research papers to real product testing!
The latest reports show that Morgan Stanley is using its digital asset lab to test use cases such as stablecoin payments, tokenization of real-world assets, and DeFi applications. This year, Morgan Stanley has also been strengthening its digital asset positioning, and has publicly said that stablecoins and asset tokenization are gradually entering the mainstream financial system.
What’s truly worth watching isn’t that a single bank suddenly “takes a liking” to crypto, but that traditional finance is directly studying how to move payments, settlement, asset issuance, and trading onto the chain. Previously, Morgan Stanley’s investment management more directly suggested that future financial infrastructure may become increasingly “on-chain,” with stablecoins potentially serving as an important foundational component.
In the past, Wall Street studied blockchain.
Now, Wall Street is starting to directly test how to use the chain!
Click the card below and get started!👇
$ETH $ZEC
Morgan Stanley has set up a digital asset lab.
Stablecoins and asset tokenization are all within the scope of testing!
Even DeFi applications are being put on the table.
Banking on-chain has moved from research papers to real product testing!
The latest reports show that Morgan Stanley is using its digital asset lab to test use cases such as stablecoin payments, tokenization of real-world assets, and DeFi applications. This year, Morgan Stanley has also been strengthening its digital asset positioning, and has publicly said that stablecoins and asset tokenization are gradually entering the mainstream financial system.
What’s truly worth watching isn’t that a single bank suddenly “takes a liking” to crypto, but that traditional finance is directly studying how to move payments, settlement, asset issuance, and trading onto the chain. Previously, Morgan Stanley’s investment management more directly suggested that future financial infrastructure may become increasingly “on-chain,” with stablecoins potentially serving as an important foundational component.
In the past, Wall Street studied blockchain.
Now, Wall Street is starting to directly test how to use the chain!
Click the card below and get started!👇
$ETH $ZEC


1
1
1.1k
·
--
Bullish
$BTC BlackRock ETF clients are picking up again!
The latest net inflow is about $54.84 million.
As BTC pulls back, the funds on the ETF side haven’t stopped!
Over the past few days, spot ETFs have already absorbed several billion dollars in a row.
Prices are choppy, but institutional channels are still continuously accumulating shares!
BlackRock’s IBIT has recently been one of the main buyers in the U.S. spot BTC ETF market. In the previous round of consecutive inflows, IBIT alone contributed more than $1 billion, indicating that this round of ETF demand isn’t just a one-day spike.
What needs to be distinguished is that these figures represent the net inflows of clients’ money into BlackRock’s ETFs—not BlackRock’s own capital directly buying BTC. The real thing to watch is consistency: if ETFs continue to maintain net inflows during a BTC pullback, then spot demand hasn’t shown any clear signs of retreat.
Prices can shake out leverage, but ETF buying is still there.
As long as this type of fund continuity doesn’t break, spot buying power will keep propping up BTC from below!
Click the card below to jump right in!👇
$ETH $ZEC
$BTC BlackRock ETF clients are picking up again!
The latest net inflow is about $54.84 million.
As BTC pulls back, the funds on the ETF side haven’t stopped!
Over the past few days, spot ETFs have already absorbed several billion dollars in a row.
Prices are choppy, but institutional channels are still continuously accumulating shares!
BlackRock’s IBIT has recently been one of the main buyers in the U.S. spot BTC ETF market. In the previous round of consecutive inflows, IBIT alone contributed more than $1 billion, indicating that this round of ETF demand isn’t just a one-day spike.
What needs to be distinguished is that these figures represent the net inflows of clients’ money into BlackRock’s ETFs—not BlackRock’s own capital directly buying BTC. The real thing to watch is consistency: if ETFs continue to maintain net inflows during a BTC pullback, then spot demand hasn’t shown any clear signs of retreat.
Prices can shake out leverage, but ETF buying is still there.
As long as this type of fund continuity doesn’t break, spot buying power will keep propping up BTC from below!
Click the card below to jump right in!👇
$ETH $ZEC
The latest net inflow is about $54.84 million.
As BTC pulls back, the funds on the ETF side haven’t stopped!
Over the past few days, spot ETFs have already absorbed several billion dollars in a row.
Prices are choppy, but institutional channels are still continuously accumulating shares!
BlackRock’s IBIT has recently been one of the main buyers in the U.S. spot BTC ETF market. In the previous round of consecutive inflows, IBIT alone contributed more than $1 billion, indicating that this round of ETF demand isn’t just a one-day spike.
What needs to be distinguished is that these figures represent the net inflows of clients’ money into BlackRock’s ETFs—not BlackRock’s own capital directly buying BTC. The real thing to watch is consistency: if ETFs continue to maintain net inflows during a BTC pullback, then spot demand hasn’t shown any clear signs of retreat.
Prices can shake out leverage, but ETF buying is still there.
As long as this type of fund continuity doesn’t break, spot buying power will keep propping up BTC from below!
Click the card below to jump right in!👇
$ETH $ZEC


1
19
13.4k
·
--
Bullish
Verified
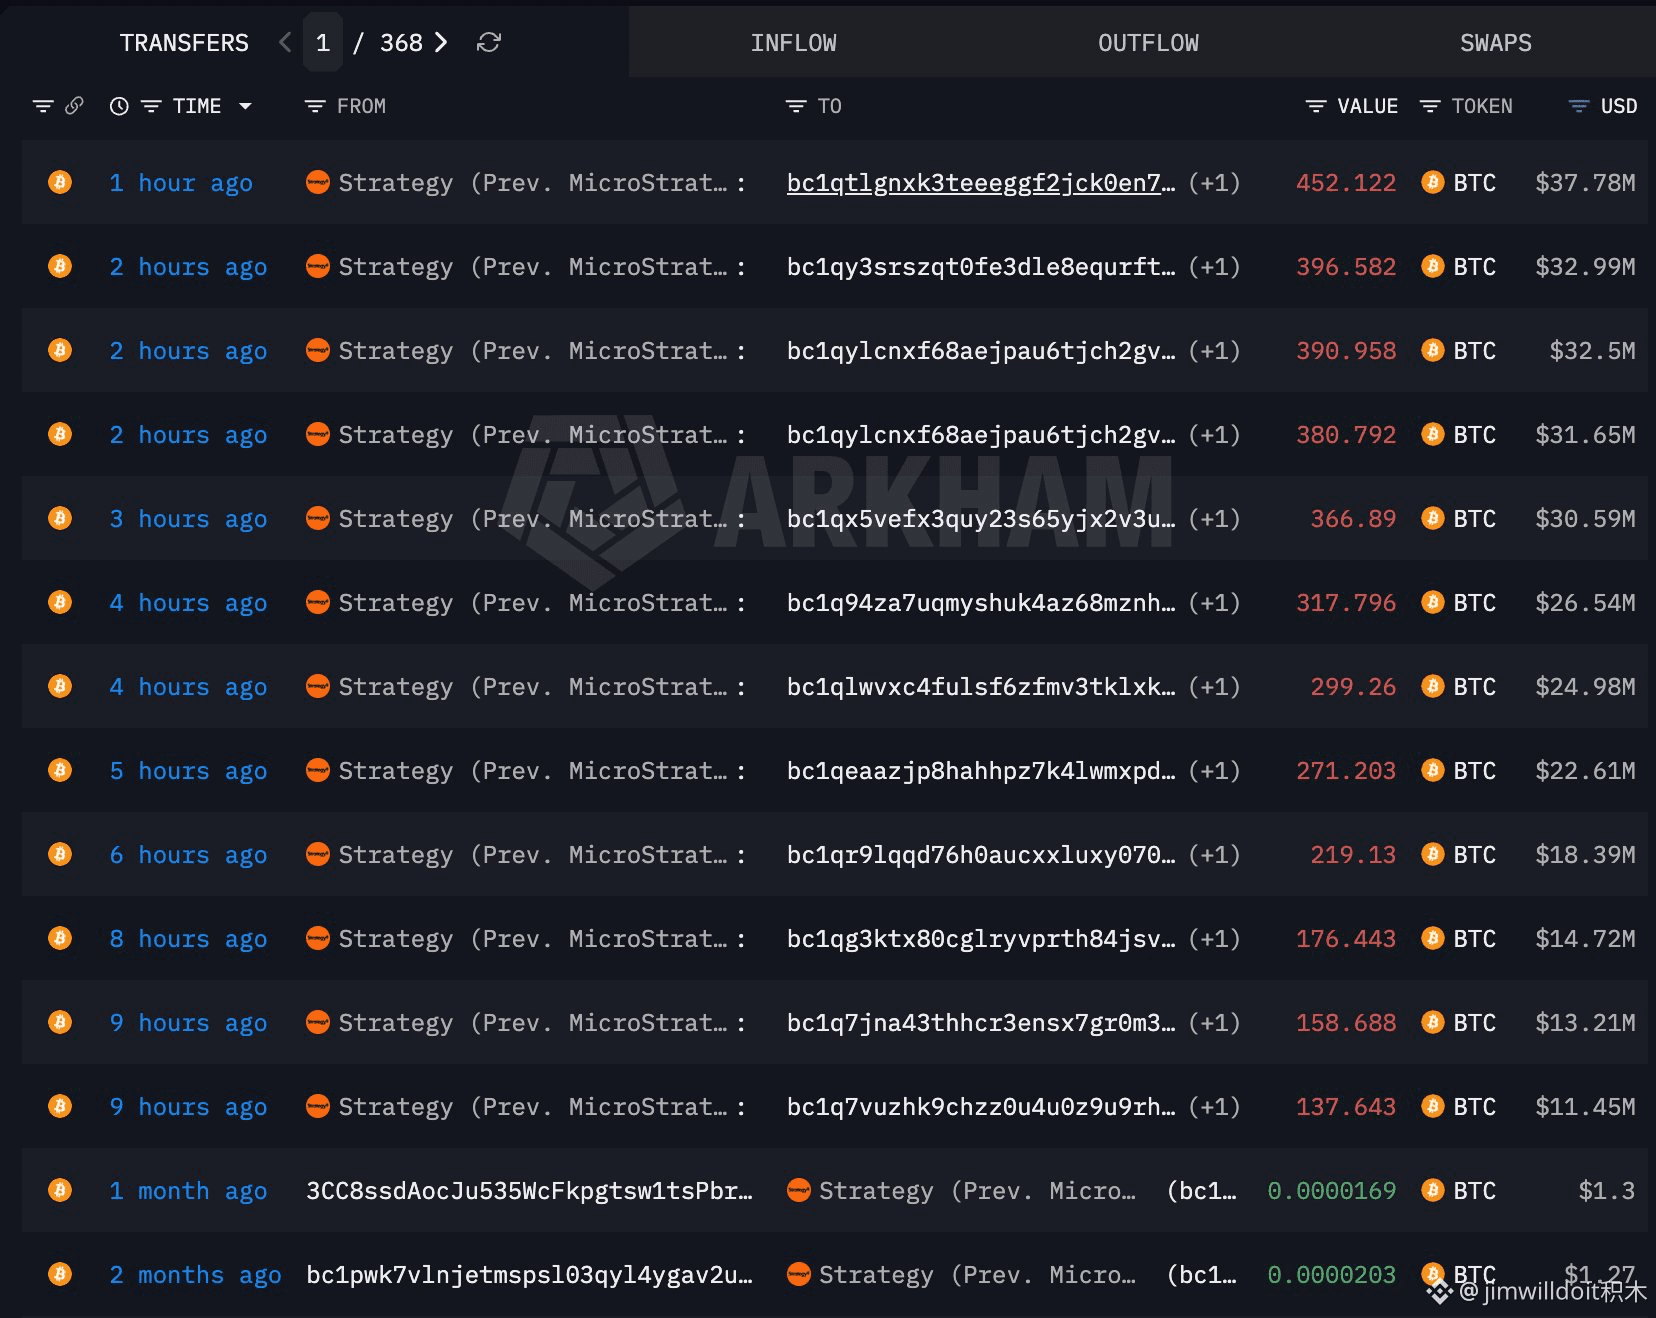
$BTC Strategy suddenly transferred nearly $300 million worth of Bitcoin!
In the past 9 hours, the relevant wallets transferred out 3,568 BTC.
At current rates, that’s worth approximately $297 million!
It was only just announced that they would continue accumulating, and large on-chain movements appeared immediately.
Is Saylor selling, or is this another round of wallet reorganization?!
On-chain data shows that wallets associated with Strategy have initiated large-scale BTC transfers, but based on “transfers out” alone, it’s not yet possible to directly conclude a selloff. Strategy may move assets between different custody addresses, internal wallets, or settlement accounts. To truly confirm a sale, you typically need to see where the coins went to exchange addresses, changes in ownership, or further company disclosures. Arkham itself also notes that its tracking of corporate wallets only covers addresses with confirmed attribution, which doesn’t necessarily reflect the company’s entire actual holdings.
This timing is especially worth watching: Strategy only officially disclosed an additional 1,665 BTC yesterday, costing about $142.7 million, bringing total holdings up to 847,666 BTC. So now that you’re seeing 3,568 BTC transferred out, don’t immediately shout “Saylor dumping.” Focus instead on where these coins ultimately flow, and whether Strategy’s next disclosure shows a decline in total holdings.
The movement of 3,568 BTC is real, but the selling hasn’t been substantiated yet.
If it ultimately turns out to be just switching wallets, this wave of panic may be another false alarm!
Click the card below—let’s get started!👇
$ETH $ZEC
$BTC Strategy suddenly transferred nearly $300 million worth of Bitcoin!
In the past 9 hours, the relevant wallets transferred out 3,568 BTC.
At current rates, that’s worth approximately $297 million!
It was only just announced that they would continue accumulating, and large on-chain movements appeared immediately.
Is Saylor selling, or is this another round of wallet reorganization?!
On-chain data shows that wallets associated with Strategy have initiated large-scale BTC transfers, but based on “transfers out” alone, it’s not yet possible to directly conclude a selloff. Strategy may move assets between different custody addresses, internal wallets, or settlement accounts. To truly confirm a sale, you typically need to see where the coins went to exchange addresses, changes in ownership, or further company disclosures. Arkham itself also notes that its tracking of corporate wallets only covers addresses with confirmed attribution, which doesn’t necessarily reflect the company’s entire actual holdings.
This timing is especially worth watching: Strategy only officially disclosed an additional 1,665 BTC yesterday, costing about $142.7 million, bringing total holdings up to 847,666 BTC. So now that you’re seeing 3,568 BTC transferred out, don’t immediately shout “Saylor dumping.” Focus instead on where these coins ultimately flow, and whether Strategy’s next disclosure shows a decline in total holdings.
The movement of 3,568 BTC is real, but the selling hasn’t been substantiated yet.
If it ultimately turns out to be just switching wallets, this wave of panic may be another false alarm!
Click the card below—let’s get started!👇
$ETH $ZEC
In the past 9 hours, the relevant wallets transferred out 3,568 BTC.
At current rates, that’s worth approximately $297 million!
It was only just announced that they would continue accumulating, and large on-chain movements appeared immediately.
Is Saylor selling, or is this another round of wallet reorganization?!
On-chain data shows that wallets associated with Strategy have initiated large-scale BTC transfers, but based on “transfers out” alone, it’s not yet possible to directly conclude a selloff. Strategy may move assets between different custody addresses, internal wallets, or settlement accounts. To truly confirm a sale, you typically need to see where the coins went to exchange addresses, changes in ownership, or further company disclosures. Arkham itself also notes that its tracking of corporate wallets only covers addresses with confirmed attribution, which doesn’t necessarily reflect the company’s entire actual holdings.
This timing is especially worth watching: Strategy only officially disclosed an additional 1,665 BTC yesterday, costing about $142.7 million, bringing total holdings up to 847,666 BTC. So now that you’re seeing 3,568 BTC transferred out, don’t immediately shout “Saylor dumping.” Focus instead on where these coins ultimately flow, and whether Strategy’s next disclosure shows a decline in total holdings.
The movement of 3,568 BTC is real, but the selling hasn’t been substantiated yet.
If it ultimately turns out to be just switching wallets, this wave of panic may be another false alarm!
Click the card below—let’s get started!👇
$ETH $ZEC

8
28
31k
·
--
Bullish
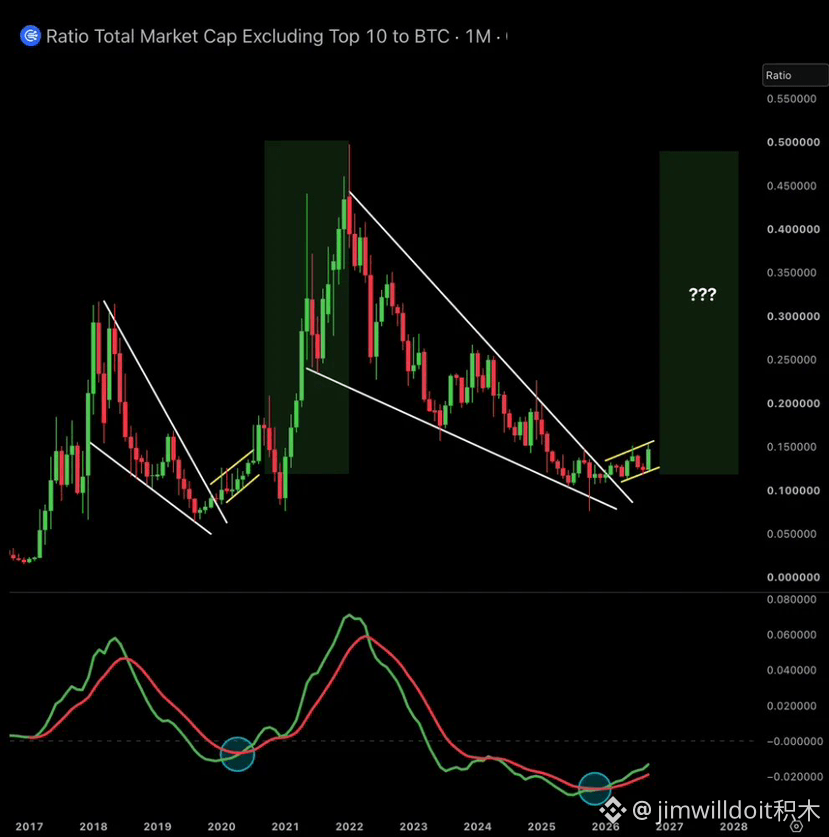
$BTC Fake coins are printing a multi-year, once-in-a-while major structure!
OTHERS/BTC is challenging a long-standing downtrend.
After the 2026 breakout, the uptrend structure is starting to rebuild!
Momentum indicators also show a bullish crossover.
This pattern is increasingly reminiscent of the look before the previous altseason kickoff!
Looking at the bigger cycle, the weakening structure of altcoins versus BTC really is improving. Recently, OTHERS—i.e., the total altcoin market cap excluding the top ten crypto assets—has already broken above the 100-day and 200-day moving averages; at the same time, the market is watching the multi-year downtrend line of OTHERS/BTC, suggesting that conditions for capital rotation are gradually forming.
But “looks like 2021” doesn’t necessarily mean it will replicate 2021. The real confirmation depends on whether the breakout can hold steady; meanwhile, BTC Dominance (Bitcoin’s market share) must keep falling, ETH/BTC must remain strong, and mid- and small-cap coins should show broader participation and follow-through. These signals are improving now, but they can’t be directly equated to a full-blown altseason yet.
After being compressed for years, the structure is finally starting to loosen.
If capital rotation is truly confirmed, this alt move’s upside elasticity could be amplified completely!
Click the card below and just go for it!👇
$ETH $ZEC
$BTC Fake coins are printing a multi-year, once-in-a-while major structure!
OTHERS/BTC is challenging a long-standing downtrend.
After the 2026 breakout, the uptrend structure is starting to rebuild!
Momentum indicators also show a bullish crossover.
This pattern is increasingly reminiscent of the look before the previous altseason kickoff!
Looking at the bigger cycle, the weakening structure of altcoins versus BTC really is improving. Recently, OTHERS—i.e., the total altcoin market cap excluding the top ten crypto assets—has already broken above the 100-day and 200-day moving averages; at the same time, the market is watching the multi-year downtrend line of OTHERS/BTC, suggesting that conditions for capital rotation are gradually forming.
But “looks like 2021” doesn’t necessarily mean it will replicate 2021. The real confirmation depends on whether the breakout can hold steady; meanwhile, BTC Dominance (Bitcoin’s market share) must keep falling, ETH/BTC must remain strong, and mid- and small-cap coins should show broader participation and follow-through. These signals are improving now, but they can’t be directly equated to a full-blown altseason yet.
After being compressed for years, the structure is finally starting to loosen.
If capital rotation is truly confirmed, this alt move’s upside elasticity could be amplified completely!
Click the card below and just go for it!👇
$ETH $ZEC
OTHERS/BTC is challenging a long-standing downtrend.
After the 2026 breakout, the uptrend structure is starting to rebuild!
Momentum indicators also show a bullish crossover.
This pattern is increasingly reminiscent of the look before the previous altseason kickoff!
Looking at the bigger cycle, the weakening structure of altcoins versus BTC really is improving. Recently, OTHERS—i.e., the total altcoin market cap excluding the top ten crypto assets—has already broken above the 100-day and 200-day moving averages; at the same time, the market is watching the multi-year downtrend line of OTHERS/BTC, suggesting that conditions for capital rotation are gradually forming.
But “looks like 2021” doesn’t necessarily mean it will replicate 2021. The real confirmation depends on whether the breakout can hold steady; meanwhile, BTC Dominance (Bitcoin’s market share) must keep falling, ETH/BTC must remain strong, and mid- and small-cap coins should show broader participation and follow-through. These signals are improving now, but they can’t be directly equated to a full-blown altseason yet.
After being compressed for years, the structure is finally starting to loosen.
If capital rotation is truly confirmed, this alt move’s upside elasticity could be amplified completely!
Click the card below and just go for it!👇
$ETH $ZEC
7
1
36
32.8k
·
--
Bullish
$BTC On-chain funds are still stacking in!
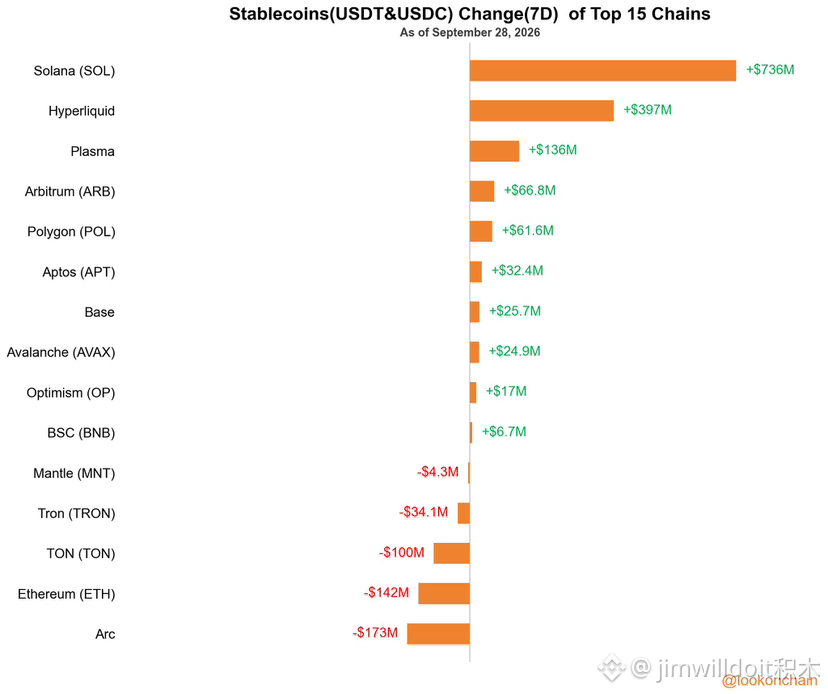
Last week, stablecoin supply increased by $2.79 billion.
Four listed companies scooped up another 2,938 BTC!
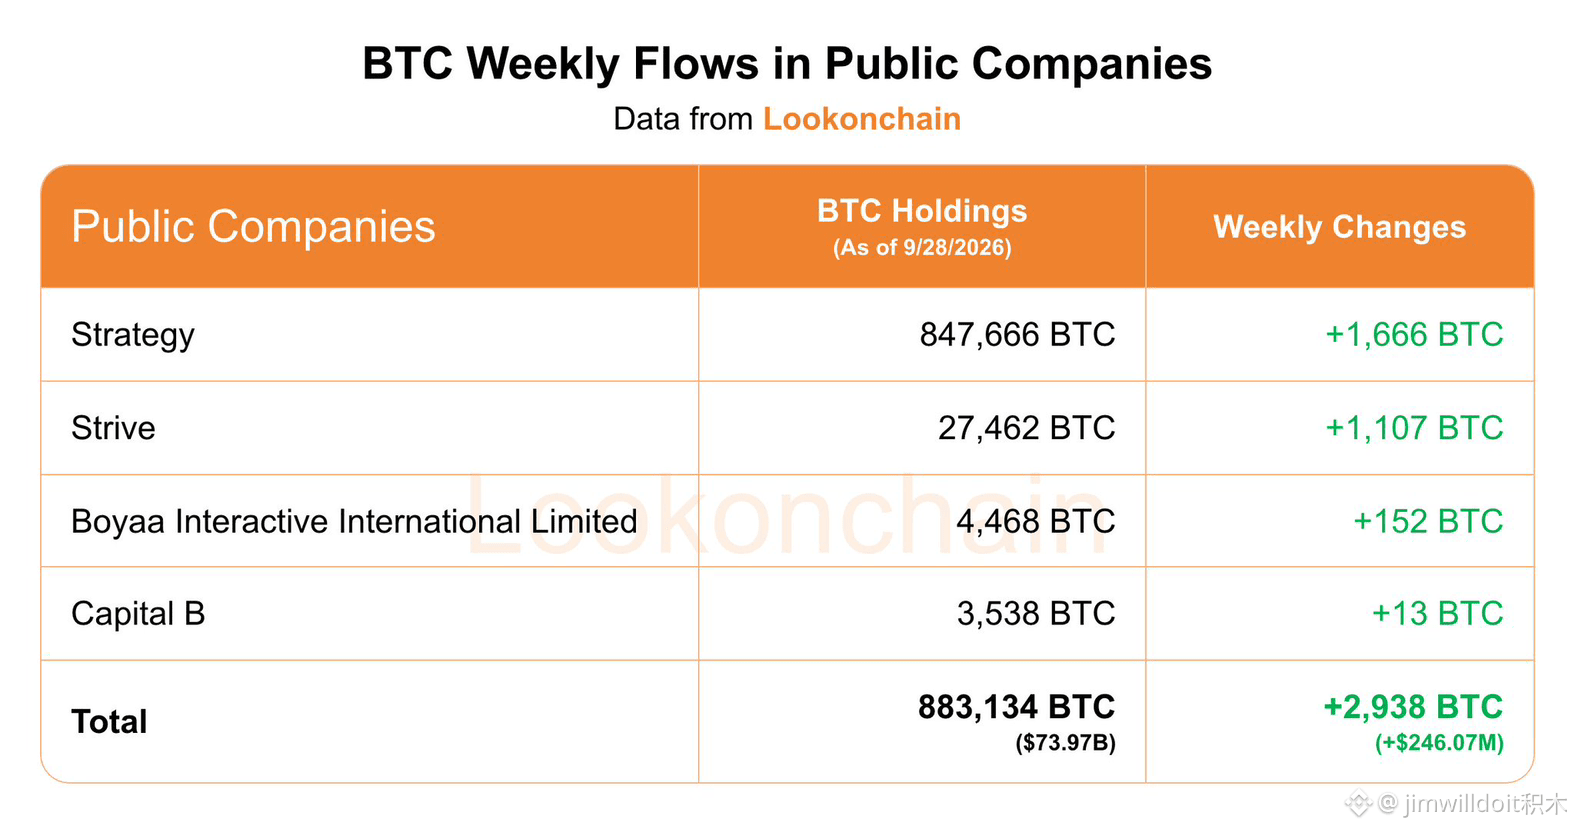
Strategy bought 1,666 BTC in a single week.
Trading has cooled off, but big players’ chips are still growing!
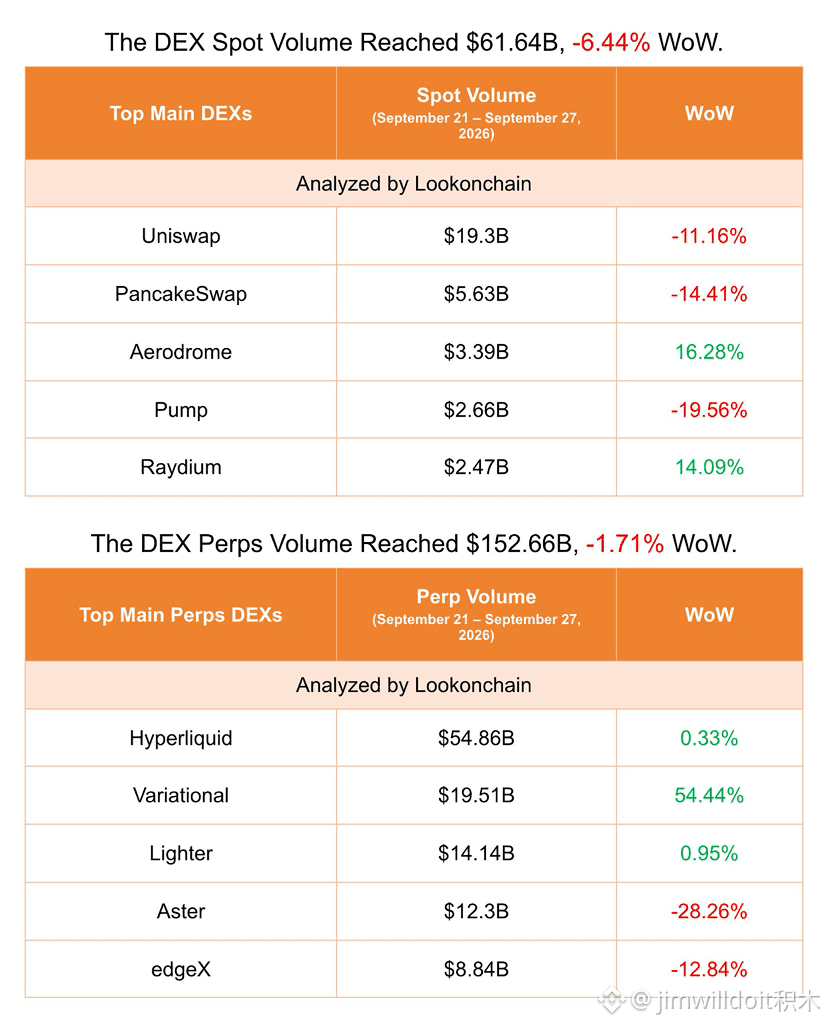
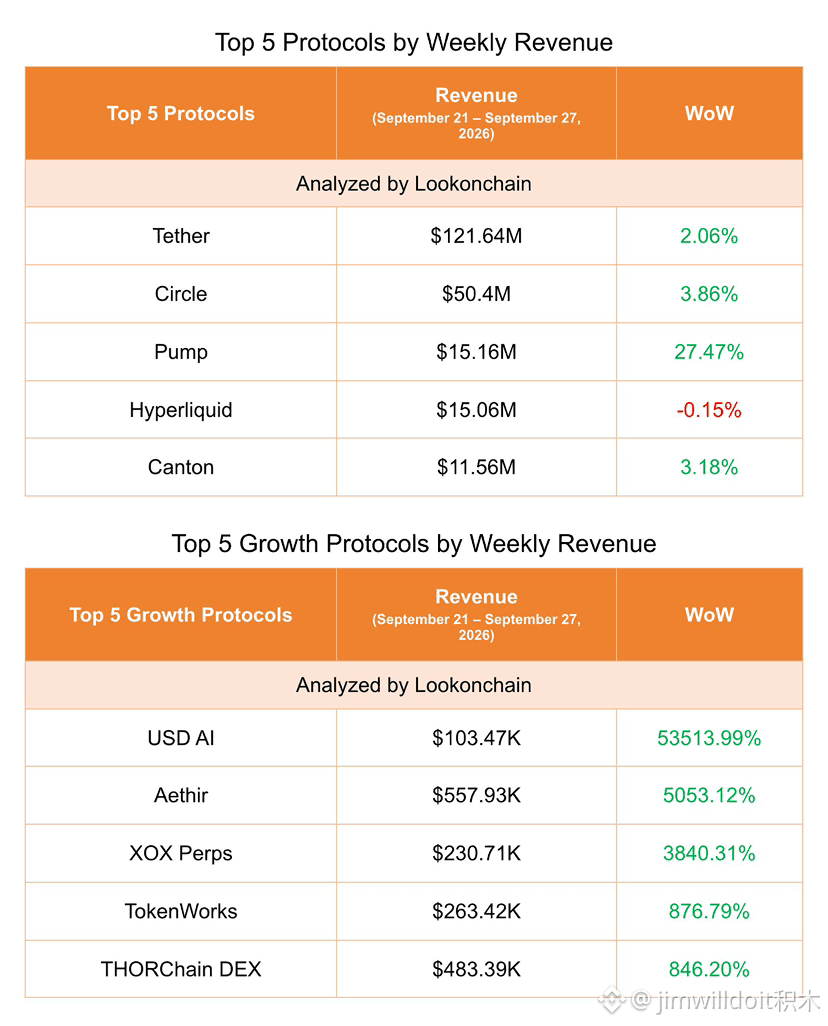
Lookonchain’s weekly report shows that from September 21 to 27, the total market cap of stablecoins increased by about $2.79 billion—equivalent to more on-chain dollar liquidity entering the market. At the same time, DEX spot trading volume fell 6.44% month-over-month, and perpetual futures trading volume dropped 1.71%, indicating trading heat has cooled somewhat, but capital hasn’t clearly pulled out.
What’s even more worth watching is the corporate and institutional side: four companies collectively increased their holdings by 2,938 BTC over the week, worth about $246 million, including Strategy’s purchase of 1,666 BTC; BitMine also continued to add to its ETH holdings during the same period. Protocol revenue also grew 3.41% month-over-month. With short-term trading volume cooling down while stablecoin supply and corporate holdings continue to increase, this divergence is actually worth paying attention to.
Short-term momentum is fading, but long-term chips are still being taken.
If the market starts expanding volume again, only then can this new liquidity truly begin to unleash its power!
Click the card below and go straight at it! 👇
$ETH $ZEC
$BTC On-chain funds are still stacking in!
Last week, stablecoin supply increased by $2.79 billion.
Four listed companies scooped up another 2,938 BTC!
Strategy bought 1,666 BTC in a single week.
Trading has cooled off, but big players’ chips are still growing!
Lookonchain’s weekly report shows that from September 21 to 27, the total market cap of stablecoins increased by about $2.79 billion—equivalent to more on-chain dollar liquidity entering the market. At the same time, DEX spot trading volume fell 6.44% month-over-month, and perpetual futures trading volume dropped 1.71%, indicating trading heat has cooled somewhat, but capital hasn’t clearly pulled out.
What’s even more worth watching is the corporate and institutional side: four companies collectively increased their holdings by 2,938 BTC over the week, worth about $246 million, including Strategy’s purchase of 1,666 BTC; BitMine also continued to add to its ETH holdings during the same period. Protocol revenue also grew 3.41% month-over-month. With short-term trading volume cooling down while stablecoin supply and corporate holdings continue to increase, this divergence is actually worth paying attention to.
Short-term momentum is fading, but long-term chips are still being taken.
If the market starts expanding volume again, only then can this new liquidity truly begin to unleash its power!
Click the card below and go straight at it! 👇
$ETH $ZEC
Last week, stablecoin supply increased by $2.79 billion.
Four listed companies scooped up another 2,938 BTC!
Strategy bought 1,666 BTC in a single week.
Trading has cooled off, but big players’ chips are still growing!
Lookonchain’s weekly report shows that from September 21 to 27, the total market cap of stablecoins increased by about $2.79 billion—equivalent to more on-chain dollar liquidity entering the market. At the same time, DEX spot trading volume fell 6.44% month-over-month, and perpetual futures trading volume dropped 1.71%, indicating trading heat has cooled somewhat, but capital hasn’t clearly pulled out.
What’s even more worth watching is the corporate and institutional side: four companies collectively increased their holdings by 2,938 BTC over the week, worth about $246 million, including Strategy’s purchase of 1,666 BTC; BitMine also continued to add to its ETH holdings during the same period. Protocol revenue also grew 3.41% month-over-month. With short-term trading volume cooling down while stablecoin supply and corporate holdings continue to increase, this divergence is actually worth paying attention to.
Short-term momentum is fading, but long-term chips are still being taken.
If the market starts expanding volume again, only then can this new liquidity truly begin to unleash its power!
Click the card below and go straight at it! 👇
$ETH $ZEC
1
5
2.4k
·
--
Bullish
$BTC Two listed companies team up again to buy up 2,773 BTC!
Strategy added 1,666 more units in one go.
Strive also simultaneously secured 1,107 BTC!
Based on the disclosed amounts, the two companies together invested approximately USD 232.5 million.
The market pulls back, but corporate balance sheets are still continuing to pick up the bids!
The signal from this round of corporate buying is very direct: Strategy and Strive combined added 2,773 BTC—Strategy accounted for 1,666, and Strive for 1,107. Using the total investment of USD 232.5 million as reference, the average cost comes out to around USD 83,800, meaning these corporate funds did not wait for BTC to dip further before stepping in.
What’s even more worth watching is the continuity. Strategy had just disclosed a purchase of 950 BTC, while Strive has also recently continued expanding its BTC reserves. The accumulation of funds in the corporate treasury has not stopped due to short-term price fluctuations. In the previous round of publicly disclosed holdings, the two companies’ BTC positions had already reached 846,000 BTC and 26,355 BTC, respectively.
Prices are choppy, but companies are still buying.
As long as this treasury-bid buying continues, there will always be someone picking up BTC with real money below the market!
Click the card below and go straight in!👇
$ETH $ZEC
$BTC Two listed companies team up again to buy up 2,773 BTC!
Strategy added 1,666 more units in one go.
Strive also simultaneously secured 1,107 BTC!
Based on the disclosed amounts, the two companies together invested approximately USD 232.5 million.
The market pulls back, but corporate balance sheets are still continuing to pick up the bids!
The signal from this round of corporate buying is very direct: Strategy and Strive combined added 2,773 BTC—Strategy accounted for 1,666, and Strive for 1,107. Using the total investment of USD 232.5 million as reference, the average cost comes out to around USD 83,800, meaning these corporate funds did not wait for BTC to dip further before stepping in.
What’s even more worth watching is the continuity. Strategy had just disclosed a purchase of 950 BTC, while Strive has also recently continued expanding its BTC reserves. The accumulation of funds in the corporate treasury has not stopped due to short-term price fluctuations. In the previous round of publicly disclosed holdings, the two companies’ BTC positions had already reached 846,000 BTC and 26,355 BTC, respectively.
Prices are choppy, but companies are still buying.
As long as this treasury-bid buying continues, there will always be someone picking up BTC with real money below the market!
Click the card below and go straight in!👇
$ETH $ZEC
Strategy added 1,666 more units in one go.
Strive also simultaneously secured 1,107 BTC!
Based on the disclosed amounts, the two companies together invested approximately USD 232.5 million.
The market pulls back, but corporate balance sheets are still continuing to pick up the bids!
The signal from this round of corporate buying is very direct: Strategy and Strive combined added 2,773 BTC—Strategy accounted for 1,666, and Strive for 1,107. Using the total investment of USD 232.5 million as reference, the average cost comes out to around USD 83,800, meaning these corporate funds did not wait for BTC to dip further before stepping in.
What’s even more worth watching is the continuity. Strategy had just disclosed a purchase of 950 BTC, while Strive has also recently continued expanding its BTC reserves. The accumulation of funds in the corporate treasury has not stopped due to short-term price fluctuations. In the previous round of publicly disclosed holdings, the two companies’ BTC positions had already reached 846,000 BTC and 26,355 BTC, respectively.
Prices are choppy, but companies are still buying.
As long as this treasury-bid buying continues, there will always be someone picking up BTC with real money below the market!
Click the card below and go straight in!👇
$ETH $ZEC


1
2
2.1k
·
--
Bullish
$COIN Wall Street giants begin direct stablecoin payment integration!
Citibank and Coinbase officially expand their partnership.
This time, the target is large enterprises and institutional clients!
Coinbase provides on-chain infrastructure for stablecoin payments.
The boundary between traditional banking and crypto payments continues to be breached!
The latest developments show that Citibank is leveraging Coinbase’s digital asset infrastructure to enable business customers to accept stablecoin payments from their clients. The two sides actually announced the partnership as far back as 2025; initially, the focus was on fiat deposits/withdrawals and payment orchestration, and now the collaboration is extending further into stablecoin payment scenarios.
What’s truly worth watching isn’t how many coins Citibank itself buys, but the fact that large banks are gradually bringing stablecoins from the crypto market’s settlement tools into traditional institutional payment systems. Citibank alone processes nearly $600 billion in payments every day. If this infrastructure keeps expanding, stablecoins won’t be facing just exchange users—they’ll be facing global enterprise capital flows.
Exchanges are turning into Wall Street’s crypto infrastructure.
The real big wave for stablecoins may come when they start entering the payment pipelines of banks and enterprises!
Click the card below and get started!👇
$BTC $ETH
$COIN Wall Street giants begin direct stablecoin payment integration!
Citibank and Coinbase officially expand their partnership.
This time, the target is large enterprises and institutional clients!
Coinbase provides on-chain infrastructure for stablecoin payments.
The boundary between traditional banking and crypto payments continues to be breached!
The latest developments show that Citibank is leveraging Coinbase’s digital asset infrastructure to enable business customers to accept stablecoin payments from their clients. The two sides actually announced the partnership as far back as 2025; initially, the focus was on fiat deposits/withdrawals and payment orchestration, and now the collaboration is extending further into stablecoin payment scenarios.
What’s truly worth watching isn’t how many coins Citibank itself buys, but the fact that large banks are gradually bringing stablecoins from the crypto market’s settlement tools into traditional institutional payment systems. Citibank alone processes nearly $600 billion in payments every day. If this infrastructure keeps expanding, stablecoins won’t be facing just exchange users—they’ll be facing global enterprise capital flows.
Exchanges are turning into Wall Street’s crypto infrastructure.
The real big wave for stablecoins may come when they start entering the payment pipelines of banks and enterprises!
Click the card below and get started!👇
$BTC $ETH
Citibank and Coinbase officially expand their partnership.
This time, the target is large enterprises and institutional clients!
Coinbase provides on-chain infrastructure for stablecoin payments.
The boundary between traditional banking and crypto payments continues to be breached!
The latest developments show that Citibank is leveraging Coinbase’s digital asset infrastructure to enable business customers to accept stablecoin payments from their clients. The two sides actually announced the partnership as far back as 2025; initially, the focus was on fiat deposits/withdrawals and payment orchestration, and now the collaboration is extending further into stablecoin payment scenarios.
What’s truly worth watching isn’t how many coins Citibank itself buys, but the fact that large banks are gradually bringing stablecoins from the crypto market’s settlement tools into traditional institutional payment systems. Citibank alone processes nearly $600 billion in payments every day. If this infrastructure keeps expanding, stablecoins won’t be facing just exchange users—they’ll be facing global enterprise capital flows.
Exchanges are turning into Wall Street’s crypto infrastructure.
The real big wave for stablecoins may come when they start entering the payment pipelines of banks and enterprises!
Click the card below and get started!👇
$BTC $ETH


1
1
463
·
--
Bullish
$BTC Longs are actively retreating!
This time, it’s not just the price pulling back from around $87,000.
BTC open interest is also continuing to decline!
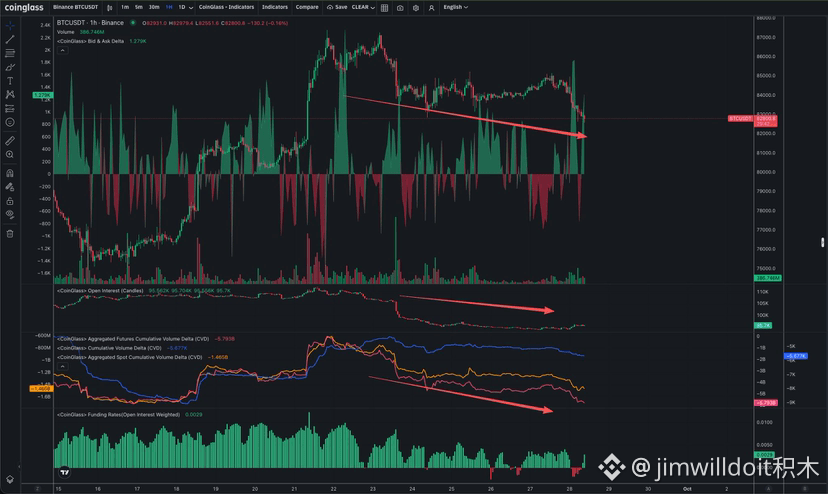
The cumulative volume difference in the futures market continues to trend downward, with aggressive sell orders holding the upper hand.
Highly leveraged long positions are being squeezed out of the market, layer by layer!
From the chart, as BTC drops to around $82,800, open interest has fallen significantly from its prior peak to about 957,000 BTC, indicating that some contract positions have exited. At the same time, the cumulative volume difference continues to weaken, reflecting that in recent trading, the volume from aggressive selling remains stronger.
However, there’s a key distinction here: a decline in open interest alone only confirms that positions are being closed, but it cannot independently prove that all of it is long liquidation. Combined with the simultaneous price drop, the weakening cumulative volume difference, and the earlier decline in funding rates, it is more consistent with the characteristics of longs deleveraging. The upside is that the cleaner the leverage is cleared, the lower the market’s sensitivity to a chain-reaction liquidation later on.
Prices are falling, and leverage is retreating.
What BTC truly needs to watch now is whether, after the longs have fully cleared, spot will come back to take the order!
Click the card below and get started!👇
$ETH $ZEC
$BTC Longs are actively retreating!
This time, it’s not just the price pulling back from around $87,000.
BTC open interest is also continuing to decline!
The cumulative volume difference in the futures market continues to trend downward, with aggressive sell orders holding the upper hand.
Highly leveraged long positions are being squeezed out of the market, layer by layer!
From the chart, as BTC drops to around $82,800, open interest has fallen significantly from its prior peak to about 957,000 BTC, indicating that some contract positions have exited. At the same time, the cumulative volume difference continues to weaken, reflecting that in recent trading, the volume from aggressive selling remains stronger.
However, there’s a key distinction here: a decline in open interest alone only confirms that positions are being closed, but it cannot independently prove that all of it is long liquidation. Combined with the simultaneous price drop, the weakening cumulative volume difference, and the earlier decline in funding rates, it is more consistent with the characteristics of longs deleveraging. The upside is that the cleaner the leverage is cleared, the lower the market’s sensitivity to a chain-reaction liquidation later on.
Prices are falling, and leverage is retreating.
What BTC truly needs to watch now is whether, after the longs have fully cleared, spot will come back to take the order!
Click the card below and get started!👇
$ETH $ZEC
This time, it’s not just the price pulling back from around $87,000.
BTC open interest is also continuing to decline!
The cumulative volume difference in the futures market continues to trend downward, with aggressive sell orders holding the upper hand.
Highly leveraged long positions are being squeezed out of the market, layer by layer!
From the chart, as BTC drops to around $82,800, open interest has fallen significantly from its prior peak to about 957,000 BTC, indicating that some contract positions have exited. At the same time, the cumulative volume difference continues to weaken, reflecting that in recent trading, the volume from aggressive selling remains stronger.
However, there’s a key distinction here: a decline in open interest alone only confirms that positions are being closed, but it cannot independently prove that all of it is long liquidation. Combined with the simultaneous price drop, the weakening cumulative volume difference, and the earlier decline in funding rates, it is more consistent with the characteristics of longs deleveraging. The upside is that the cleaner the leverage is cleared, the lower the market’s sensitivity to a chain-reaction liquidation later on.
Prices are falling, and leverage is retreating.
What BTC truly needs to watch now is whether, after the longs have fully cleared, spot will come back to take the order!
Click the card below and get started!👇
$ETH $ZEC
1
1
1.7k
·
--
Bullish
Verified
$BTC Gold and Silver Suddenly Suffer an Epic Selloff!
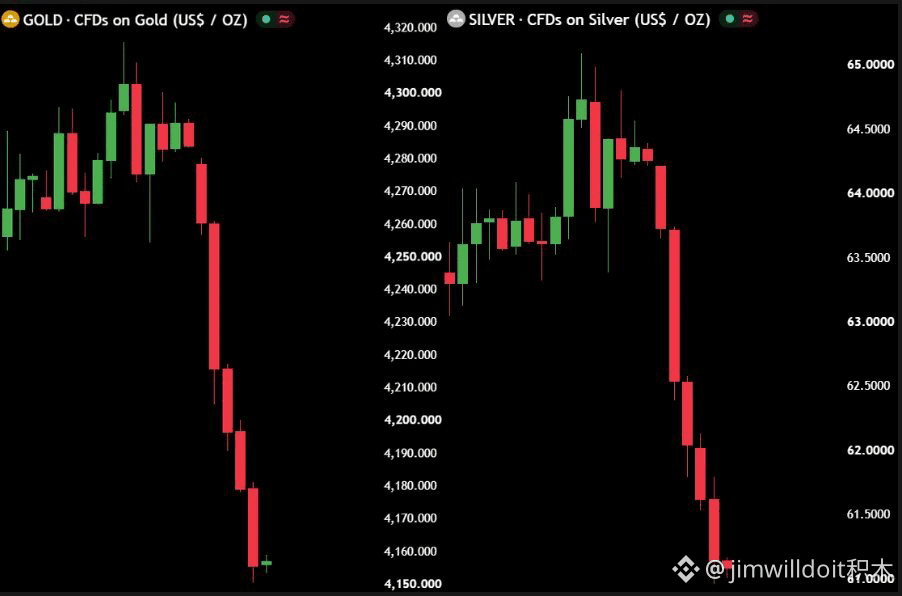
In just 9 hours, the market value of precious metals was reported to have evaporated by about $1.1 trillion.
Gold briefly fell below $4,200!
Silver’s drop was even sharper, briefly exceeding 4%.
Funds are rapidly repricing the trade of “higher rates for longer.”
Behind this round of heavy selling, the core pressures are still rising at the same time: the U.S. dollar, Treasury yields, and expectations of further rate hikes. During the day, spot gold once slid to about $4,189, while silver fell to about $61.65; meanwhile, the U.S. dollar index climbed back above the 101 level, and the high-interest-rate environment is squeezing the appeal of non-yielding assets.
However, the figure of “$1.1 trillion wiped out in 9 hours” is currently an estimate based on changes in the overall market values of gold and silver. What’s truly worth watching is whether money will continue to withdraw from precious metals—and whether BTC can stand on its own and take up the slack under the same high-rate pressure.
Gold and silver can’t withstand the renewed high-rate repricing.
If BTC can still hold up at a time like this, then the relative strength of the funds becomes truly interesting!
Click the card below—let’s get to it!👇
$ETH $ZEC
$BTC Gold and Silver Suddenly Suffer an Epic Selloff!
In just 9 hours, the market value of precious metals was reported to have evaporated by about $1.1 trillion.
Gold briefly fell below $4,200!
Silver’s drop was even sharper, briefly exceeding 4%.
Funds are rapidly repricing the trade of “higher rates for longer.”
Behind this round of heavy selling, the core pressures are still rising at the same time: the U.S. dollar, Treasury yields, and expectations of further rate hikes. During the day, spot gold once slid to about $4,189, while silver fell to about $61.65; meanwhile, the U.S. dollar index climbed back above the 101 level, and the high-interest-rate environment is squeezing the appeal of non-yielding assets.
However, the figure of “$1.1 trillion wiped out in 9 hours” is currently an estimate based on changes in the overall market values of gold and silver. What’s truly worth watching is whether money will continue to withdraw from precious metals—and whether BTC can stand on its own and take up the slack under the same high-rate pressure.
Gold and silver can’t withstand the renewed high-rate repricing.
If BTC can still hold up at a time like this, then the relative strength of the funds becomes truly interesting!
Click the card below—let’s get to it!👇
$ETH $ZEC
In just 9 hours, the market value of precious metals was reported to have evaporated by about $1.1 trillion.
Gold briefly fell below $4,200!
Silver’s drop was even sharper, briefly exceeding 4%.
Funds are rapidly repricing the trade of “higher rates for longer.”
Behind this round of heavy selling, the core pressures are still rising at the same time: the U.S. dollar, Treasury yields, and expectations of further rate hikes. During the day, spot gold once slid to about $4,189, while silver fell to about $61.65; meanwhile, the U.S. dollar index climbed back above the 101 level, and the high-interest-rate environment is squeezing the appeal of non-yielding assets.
However, the figure of “$1.1 trillion wiped out in 9 hours” is currently an estimate based on changes in the overall market values of gold and silver. What’s truly worth watching is whether money will continue to withdraw from precious metals—and whether BTC can stand on its own and take up the slack under the same high-rate pressure.
Gold and silver can’t withstand the renewed high-rate repricing.
If BTC can still hold up at a time like this, then the relative strength of the funds becomes truly interesting!
Click the card below—let’s get to it!👇
$ETH $ZEC
1
1
1.9k
·
--
Bullish
$BTC ETF funds are fully flowing back into the crypto market!
BTC saw a net inflow of $2.39 billion over the week.
ETH also attracted nearly $690 million!
SOL and XRP likewise kept pulling in real money.
This round of capital isn’t just targeting BTC anymore!
Last week, U.S. spot crypto ETFs recorded net inflows across the board: BTC about $2.39 billion, ETH about $690 million, SOL about $188 million, XRP about $75.59 million. Combined, these four assets attracted roughly $3.35 billion, with BTC still firmly the main driver, but capital support for ETH and major altcoins has clearly stepped up as well.
Even more worth paying attention to is the breadth of the flows. Previously, ETF market activity was more concentrated in BTC. Now, with ETH, SOL, and XRP all showing net inflows at the same time, it indicates that demand on the ETF side is spreading to more crypto assets. If this kind of continuity can be maintained, what’s worth watching next won’t be only whether BTC can keep pushing higher—there’s also the question of whether the funds will further rotate into higher-volatility assets.
BTC pulls in the big money, while ETH, SOL, and XRP start to follow.
As ETF buy pressure keeps expanding, real capital rotation is only just beginning to be worth watching!
Click the card below and go for it!👇
$ETH $ZEC
$BTC ETF funds are fully flowing back into the crypto market!
BTC saw a net inflow of $2.39 billion over the week.
ETH also attracted nearly $690 million!
SOL and XRP likewise kept pulling in real money.
This round of capital isn’t just targeting BTC anymore!
Last week, U.S. spot crypto ETFs recorded net inflows across the board: BTC about $2.39 billion, ETH about $690 million, SOL about $188 million, XRP about $75.59 million. Combined, these four assets attracted roughly $3.35 billion, with BTC still firmly the main driver, but capital support for ETH and major altcoins has clearly stepped up as well.
Even more worth paying attention to is the breadth of the flows. Previously, ETF market activity was more concentrated in BTC. Now, with ETH, SOL, and XRP all showing net inflows at the same time, it indicates that demand on the ETF side is spreading to more crypto assets. If this kind of continuity can be maintained, what’s worth watching next won’t be only whether BTC can keep pushing higher—there’s also the question of whether the funds will further rotate into higher-volatility assets.
BTC pulls in the big money, while ETH, SOL, and XRP start to follow.
As ETF buy pressure keeps expanding, real capital rotation is only just beginning to be worth watching!
Click the card below and go for it!👇
$ETH $ZEC
BTC saw a net inflow of $2.39 billion over the week.
ETH also attracted nearly $690 million!
SOL and XRP likewise kept pulling in real money.
This round of capital isn’t just targeting BTC anymore!
Last week, U.S. spot crypto ETFs recorded net inflows across the board: BTC about $2.39 billion, ETH about $690 million, SOL about $188 million, XRP about $75.59 million. Combined, these four assets attracted roughly $3.35 billion, with BTC still firmly the main driver, but capital support for ETH and major altcoins has clearly stepped up as well.
Even more worth paying attention to is the breadth of the flows. Previously, ETF market activity was more concentrated in BTC. Now, with ETH, SOL, and XRP all showing net inflows at the same time, it indicates that demand on the ETF side is spreading to more crypto assets. If this kind of continuity can be maintained, what’s worth watching next won’t be only whether BTC can keep pushing higher—there’s also the question of whether the funds will further rotate into higher-volatility assets.
BTC pulls in the big money, while ETH, SOL, and XRP start to follow.
As ETF buy pressure keeps expanding, real capital rotation is only just beginning to be worth watching!
Click the card below and go for it!👇
$ETH $ZEC


9
1
23
23k
·
--
Bullish
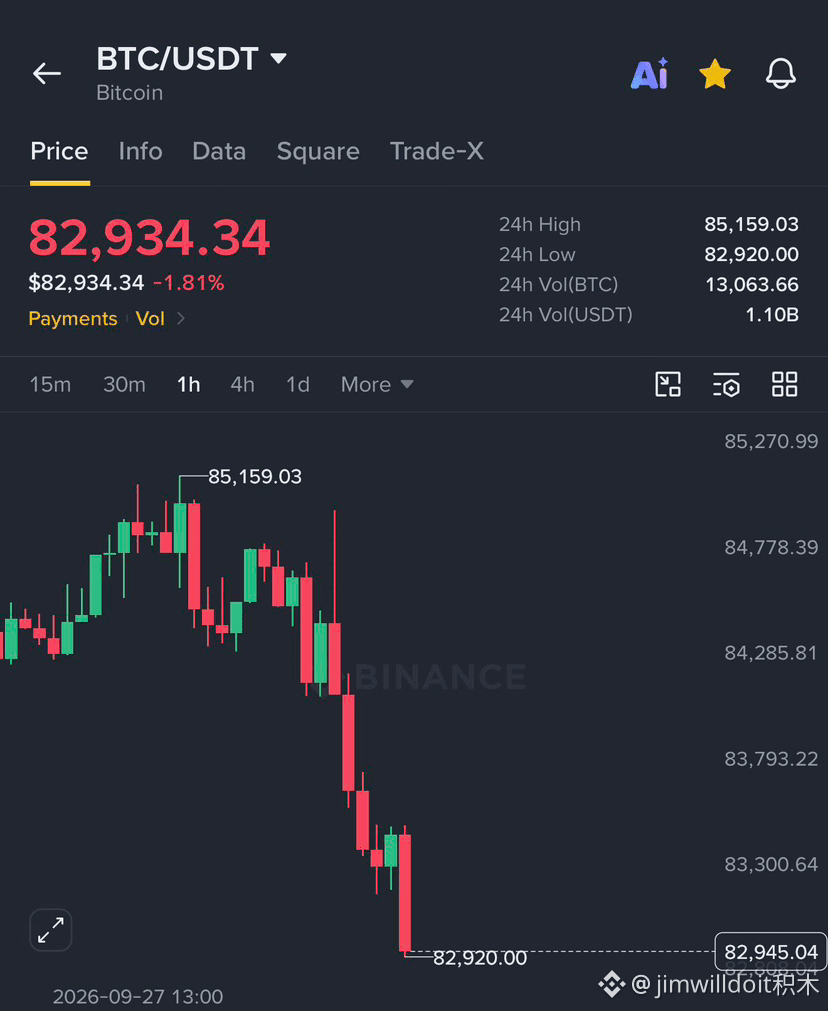
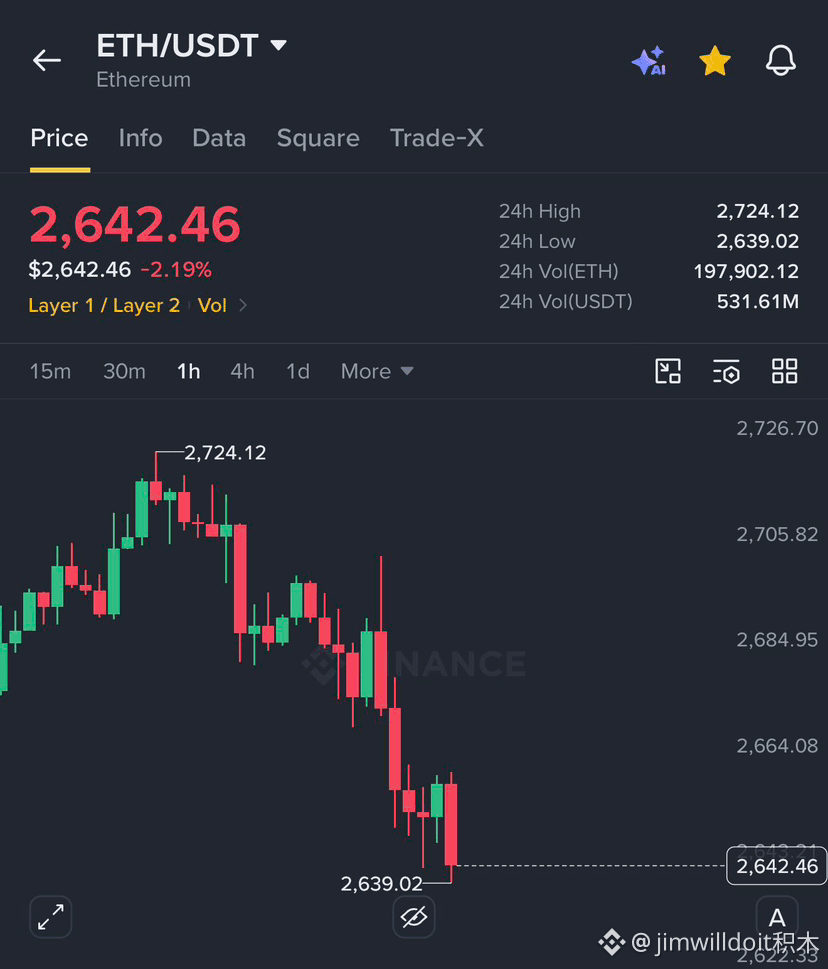
$BTC 83,000 US dollars lost ground, longs begin to get liquidated!
ETH also falls below $2,650 in sync.
In just 60 minutes, about $50 million in long positions were cleared!
Just a moment ago it was still ranging near the highs, but leverage couldn’t hold out first.
The market is rapidly unwinding the accumulated long-risk from this round!
After BTC broke below $83,000, ETH also followed and lost $2,650. In the past hour, around $50 million in long positions were liquidated. Price pressure combined with leveraged forced selling can easily trigger a short-term domino effect, especially since high-leverage capital had already been piled back up beforehand.
The key now isn’t just watching this single drop, but seeing whether spot buying steps in again below $83,000. If liquidation keeps expanding but the price quickly recovers key levels, this round is more like a leverage washout; if support still doesn’t show up, liquidity below could continue to be swept.
Leverage gets washed first—the real test is whether spot steps in.
Whether BTC can quickly reclaim $83,000 will determine whether this turns out to be a shakeout or continues to probe lower!
Click the card below and get started!👇
$ETH $ZEC
$BTC 83,000 US dollars lost ground, longs begin to get liquidated!
ETH also falls below $2,650 in sync.
In just 60 minutes, about $50 million in long positions were cleared!
Just a moment ago it was still ranging near the highs, but leverage couldn’t hold out first.
The market is rapidly unwinding the accumulated long-risk from this round!
After BTC broke below $83,000, ETH also followed and lost $2,650. In the past hour, around $50 million in long positions were liquidated. Price pressure combined with leveraged forced selling can easily trigger a short-term domino effect, especially since high-leverage capital had already been piled back up beforehand.
The key now isn’t just watching this single drop, but seeing whether spot buying steps in again below $83,000. If liquidation keeps expanding but the price quickly recovers key levels, this round is more like a leverage washout; if support still doesn’t show up, liquidity below could continue to be swept.
Leverage gets washed first—the real test is whether spot steps in.
Whether BTC can quickly reclaim $83,000 will determine whether this turns out to be a shakeout or continues to probe lower!
Click the card below and get started!👇
$ETH $ZEC
ETH also falls below $2,650 in sync.
In just 60 minutes, about $50 million in long positions were cleared!
Just a moment ago it was still ranging near the highs, but leverage couldn’t hold out first.
The market is rapidly unwinding the accumulated long-risk from this round!
After BTC broke below $83,000, ETH also followed and lost $2,650. In the past hour, around $50 million in long positions were liquidated. Price pressure combined with leveraged forced selling can easily trigger a short-term domino effect, especially since high-leverage capital had already been piled back up beforehand.
The key now isn’t just watching this single drop, but seeing whether spot buying steps in again below $83,000. If liquidation keeps expanding but the price quickly recovers key levels, this round is more like a leverage washout; if support still doesn’t show up, liquidity below could continue to be swept.
Leverage gets washed first—the real test is whether spot steps in.
Whether BTC can quickly reclaim $83,000 will determine whether this turns out to be a shakeout or continues to probe lower!
Click the card below and get started!👇
$ETH $ZEC
3
12
20k
·
--
Bullish
Verified
$BTC U.S. Treasury Secretary Begins “Cooling Down” the Federal Reserve!
Bessent Urges the Federal Reserve to Keep an Open Mind on Interest Rates.
The rationale directly points to an AI-driven productivity surge!
Improved productivity boosts economic growth without necessarily leading to higher inflation.
The necessity of continuing to pile on high interest rates has started to spark a new debate!
U.S. Treasury Secretary Scott Bessent most recently said the Federal Reserve should not presume a predetermined path for interest rates. He believes that AI enhances productivity, along with eased regulation, could allow the U.S. economy to sustain relatively strong growth while keeping inflation under control. He also noted that recent core inflation has been relatively calm. However, this reflects Bessent’s assessment of the inflation and productivity outlook and does not mean the Fed is already prepared to turn dovish.
What’s more interesting now is the market’s split: on one side, oil prices and U.S. Treasury yields remain elevated, and the market is still pricing in potential further rate hikes; on the other, Bessent emphasizes that AI productivity could form a long-term disinflationary force. For BTC, if future inflation data truly cools and expectations for rate hikes recede, the pressure on the U.S. dollar and Treasury yields could finally ease.
If AI really can hold down inflation, the Fed’s script may need to be rewritten.
What BTC needs most right now is for this macro hand to stop stepping on the brakes!
Click the card below and get started!👇
$ETH $ZEC
$BTC U.S. Treasury Secretary Begins “Cooling Down” the Federal Reserve!
Bessent Urges the Federal Reserve to Keep an Open Mind on Interest Rates.
The rationale directly points to an AI-driven productivity surge!
Improved productivity boosts economic growth without necessarily leading to higher inflation.
The necessity of continuing to pile on high interest rates has started to spark a new debate!
U.S. Treasury Secretary Scott Bessent most recently said the Federal Reserve should not presume a predetermined path for interest rates. He believes that AI enhances productivity, along with eased regulation, could allow the U.S. economy to sustain relatively strong growth while keeping inflation under control. He also noted that recent core inflation has been relatively calm. However, this reflects Bessent’s assessment of the inflation and productivity outlook and does not mean the Fed is already prepared to turn dovish.
What’s more interesting now is the market’s split: on one side, oil prices and U.S. Treasury yields remain elevated, and the market is still pricing in potential further rate hikes; on the other, Bessent emphasizes that AI productivity could form a long-term disinflationary force. For BTC, if future inflation data truly cools and expectations for rate hikes recede, the pressure on the U.S. dollar and Treasury yields could finally ease.
If AI really can hold down inflation, the Fed’s script may need to be rewritten.
What BTC needs most right now is for this macro hand to stop stepping on the brakes!
Click the card below and get started!👇
$ETH $ZEC
Bessent Urges the Federal Reserve to Keep an Open Mind on Interest Rates.
The rationale directly points to an AI-driven productivity surge!
Improved productivity boosts economic growth without necessarily leading to higher inflation.
The necessity of continuing to pile on high interest rates has started to spark a new debate!
U.S. Treasury Secretary Scott Bessent most recently said the Federal Reserve should not presume a predetermined path for interest rates. He believes that AI enhances productivity, along with eased regulation, could allow the U.S. economy to sustain relatively strong growth while keeping inflation under control. He also noted that recent core inflation has been relatively calm. However, this reflects Bessent’s assessment of the inflation and productivity outlook and does not mean the Fed is already prepared to turn dovish.
What’s more interesting now is the market’s split: on one side, oil prices and U.S. Treasury yields remain elevated, and the market is still pricing in potential further rate hikes; on the other, Bessent emphasizes that AI productivity could form a long-term disinflationary force. For BTC, if future inflation data truly cools and expectations for rate hikes recede, the pressure on the U.S. dollar and Treasury yields could finally ease.
If AI really can hold down inflation, the Fed’s script may need to be rewritten.
What BTC needs most right now is for this macro hand to stop stepping on the brakes!
Click the card below and get started!👇
$ETH $ZEC


2
18
16.5k
·
--
Bullish
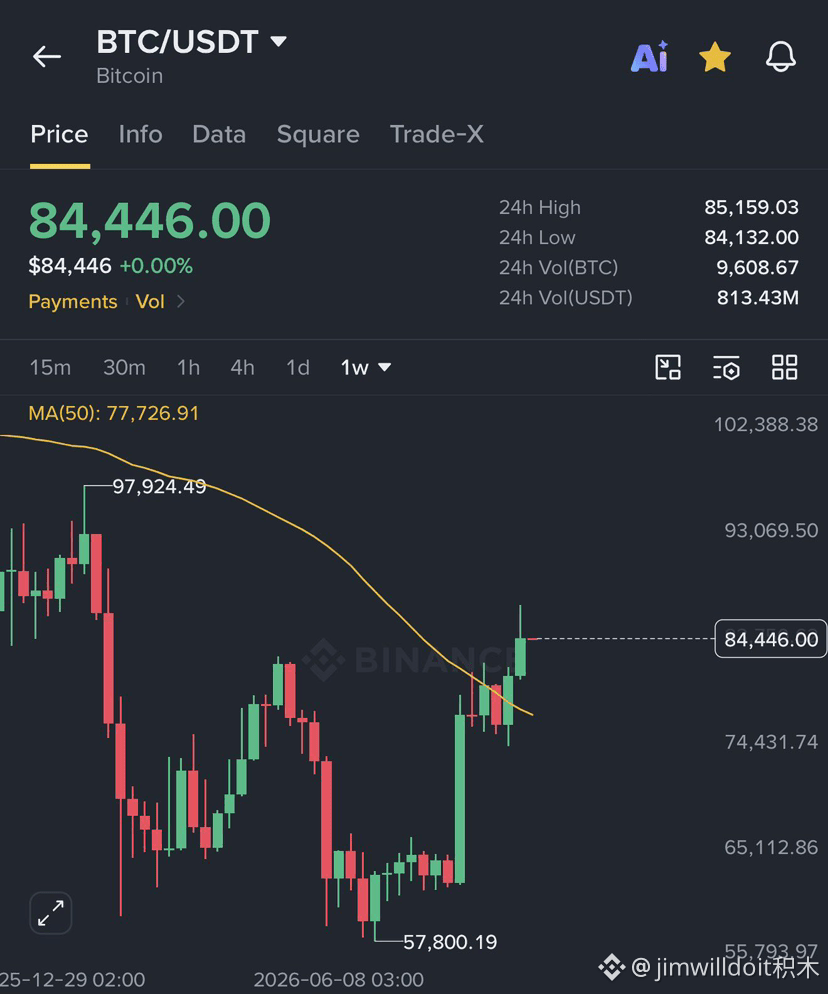
$BTC Weekly chart directly closes out a fresh 8-month high!
This isn’t just an intraday spike anymore.
BTC has truly kept its strength at the weekly chart level!
It also recently regained the key 50-week moving average.
The structure of the larger cycle is continuing to repair further in a bullish direction!
BTC’s latest weekly close has refreshed the nearly 8-month high. Previously, price had already broken through the 50-week moving average that has long pressured the market. Compared with a wick that shoots up intraday, a weekly close can truly reclaim the key levels, which is much more meaningful for the medium-term trend. Recently, BTC also pushed toward the $87,000 area and set a new high since January.
What’s most worth watching now is the follow-through after the breakout. If the weekly chart can continue to hold the 50-week moving average, and the ETF spot inflows don’t show any clear signs of fading, then this leg of the rally may have a chance to move from a “bounce” into advancing the repair toward a bigger trend.
The daily breakout is about sentiment; a higher weekly close is about trend.
Now that the strongest weekly close in 8 months is in hand, the next question is whether BTC can keep pushing the highs higher!
Tap the card below and get straight into it!👇
$ETH $ZEC
$BTC Weekly chart directly closes out a fresh 8-month high!
This isn’t just an intraday spike anymore.
BTC has truly kept its strength at the weekly chart level!
It also recently regained the key 50-week moving average.
The structure of the larger cycle is continuing to repair further in a bullish direction!
BTC’s latest weekly close has refreshed the nearly 8-month high. Previously, price had already broken through the 50-week moving average that has long pressured the market. Compared with a wick that shoots up intraday, a weekly close can truly reclaim the key levels, which is much more meaningful for the medium-term trend. Recently, BTC also pushed toward the $87,000 area and set a new high since January.
What’s most worth watching now is the follow-through after the breakout. If the weekly chart can continue to hold the 50-week moving average, and the ETF spot inflows don’t show any clear signs of fading, then this leg of the rally may have a chance to move from a “bounce” into advancing the repair toward a bigger trend.
The daily breakout is about sentiment; a higher weekly close is about trend.
Now that the strongest weekly close in 8 months is in hand, the next question is whether BTC can keep pushing the highs higher!
Tap the card below and get straight into it!👇
$ETH $ZEC
This isn’t just an intraday spike anymore.
BTC has truly kept its strength at the weekly chart level!
It also recently regained the key 50-week moving average.
The structure of the larger cycle is continuing to repair further in a bullish direction!
BTC’s latest weekly close has refreshed the nearly 8-month high. Previously, price had already broken through the 50-week moving average that has long pressured the market. Compared with a wick that shoots up intraday, a weekly close can truly reclaim the key levels, which is much more meaningful for the medium-term trend. Recently, BTC also pushed toward the $87,000 area and set a new high since January.
What’s most worth watching now is the follow-through after the breakout. If the weekly chart can continue to hold the 50-week moving average, and the ETF spot inflows don’t show any clear signs of fading, then this leg of the rally may have a chance to move from a “bounce” into advancing the repair toward a bigger trend.
The daily breakout is about sentiment; a higher weekly close is about trend.
Now that the strongest weekly close in 8 months is in hand, the next question is whether BTC can keep pushing the highs higher!
Tap the card below and get straight into it!👇
$ETH $ZEC
1
2
3
2.3k
·
--
Bullish
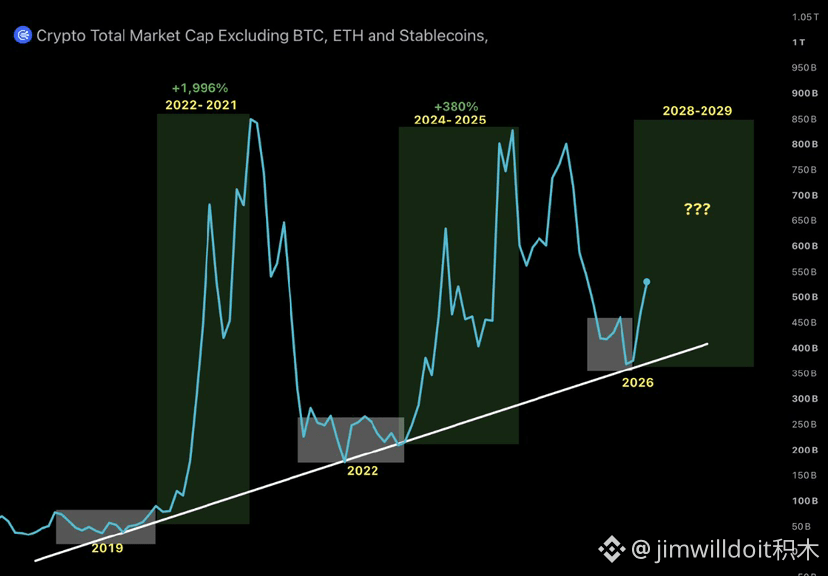
$BTC Fake coins are collectively rebounding on a multi-year support level!
Many fake coins have already held key positions on the long-term cycle.
But the real ignition signal is still just one final step away!
First, confirm the BTC bull market trend; then the market share can break down further below 58%.
Once fund rotation kicks in, fake coins may show even more upside elasticity!
At the moment, many fake altcoins are appearing to repair near multi-year support levels, but at this stage it looks more like a prelude to fund rotation. What really needs watching is whether BTC can keep its strength, while BTC Dominance (Bitcoin’s market share) begins a sustained decline. This would indicate that funds may be moving from BTC into ETH and a wider range of altcoins.
58% will be an important level to monitor. If BTC’s market share effectively breaks below 58% and fails to reclaim it, while the total market cap of altcoins continues to break out and ETH strengthens relative to BTC, then the breadth of the altcoin rally may truly expand. Simply breaking one number can’t confirm an “alt season”; it’s more meaningful when multiple signals converge.
Altcoins have already started to rise off the support level.
If BTC’s market share breaks another 58%, fund rotation may truly accelerate!
Click the card below and go straight for it!👇
$ETH $ZEC
$BTC Fake coins are collectively rebounding on a multi-year support level!
Many fake coins have already held key positions on the long-term cycle.
But the real ignition signal is still just one final step away!
First, confirm the BTC bull market trend; then the market share can break down further below 58%.
Once fund rotation kicks in, fake coins may show even more upside elasticity!
At the moment, many fake altcoins are appearing to repair near multi-year support levels, but at this stage it looks more like a prelude to fund rotation. What really needs watching is whether BTC can keep its strength, while BTC Dominance (Bitcoin’s market share) begins a sustained decline. This would indicate that funds may be moving from BTC into ETH and a wider range of altcoins.
58% will be an important level to monitor. If BTC’s market share effectively breaks below 58% and fails to reclaim it, while the total market cap of altcoins continues to break out and ETH strengthens relative to BTC, then the breadth of the altcoin rally may truly expand. Simply breaking one number can’t confirm an “alt season”; it’s more meaningful when multiple signals converge.
Altcoins have already started to rise off the support level.
If BTC’s market share breaks another 58%, fund rotation may truly accelerate!
Click the card below and go straight for it!👇
$ETH $ZEC
Many fake coins have already held key positions on the long-term cycle.
But the real ignition signal is still just one final step away!
First, confirm the BTC bull market trend; then the market share can break down further below 58%.
Once fund rotation kicks in, fake coins may show even more upside elasticity!
At the moment, many fake altcoins are appearing to repair near multi-year support levels, but at this stage it looks more like a prelude to fund rotation. What really needs watching is whether BTC can keep its strength, while BTC Dominance (Bitcoin’s market share) begins a sustained decline. This would indicate that funds may be moving from BTC into ETH and a wider range of altcoins.
58% will be an important level to monitor. If BTC’s market share effectively breaks below 58% and fails to reclaim it, while the total market cap of altcoins continues to break out and ETH strengthens relative to BTC, then the breadth of the altcoin rally may truly expand. Simply breaking one number can’t confirm an “alt season”; it’s more meaningful when multiple signals converge.
Altcoins have already started to rise off the support level.
If BTC’s market share breaks another 58%, fund rotation may truly accelerate!
Click the card below and go straight for it!👇
$ETH $ZEC
2
2.6k
·
--
Bullish
Verified
$NVDA China market suddenly shows loosened signals!
ByteDance and Alibaba may be newly re-approved to purchase NVIDIA chips again.
China’s regulatory authorities have already started asking about specific procurement needs!
This time, it involves the new RTX Pro 5500.
The window for NVIDIA to reclaim China’s AI orders is opening again!
The latest news indicates that relevant Chinese authorities are considering allowing some domestic companies to purchase NVIDIA RTX Pro 5500, and have already required companies such as Alibaba and ByteDance to submit their planned purchase quantities and specific intended uses. The signals being released so far are relatively positive, but the final approval timeline, quantities, and applicable standards have not yet been formally confirmed.
It’s worth noting that this time does not involve NVIDIA’s top-tier data-center AI chips. It is also not yet fully clear whether the U.S. will impose export restrictions on the RTX Pro 5500. But if China ultimately grants clearance, the most important implication for NVDA is that the China AI market once again presents an incremental order window—ByteDance is even reported to be considering purchasing around 1 million units.
If the door to the China market truly reopens even a crack, the volume likely won’t be small.
What NVDA should watch next is exactly how large a scale will be approved!
Click the card below—let’s get to it!👇
$BTC $ETH
$NVDA China market suddenly shows loosened signals!
ByteDance and Alibaba may be newly re-approved to purchase NVIDIA chips again.
China’s regulatory authorities have already started asking about specific procurement needs!
This time, it involves the new RTX Pro 5500.
The window for NVIDIA to reclaim China’s AI orders is opening again!
The latest news indicates that relevant Chinese authorities are considering allowing some domestic companies to purchase NVIDIA RTX Pro 5500, and have already required companies such as Alibaba and ByteDance to submit their planned purchase quantities and specific intended uses. The signals being released so far are relatively positive, but the final approval timeline, quantities, and applicable standards have not yet been formally confirmed.
It’s worth noting that this time does not involve NVIDIA’s top-tier data-center AI chips. It is also not yet fully clear whether the U.S. will impose export restrictions on the RTX Pro 5500. But if China ultimately grants clearance, the most important implication for NVDA is that the China AI market once again presents an incremental order window—ByteDance is even reported to be considering purchasing around 1 million units.
If the door to the China market truly reopens even a crack, the volume likely won’t be small.
What NVDA should watch next is exactly how large a scale will be approved!
Click the card below—let’s get to it!👇
$BTC $ETH
ByteDance and Alibaba may be newly re-approved to purchase NVIDIA chips again.
China’s regulatory authorities have already started asking about specific procurement needs!
This time, it involves the new RTX Pro 5500.
The window for NVIDIA to reclaim China’s AI orders is opening again!
The latest news indicates that relevant Chinese authorities are considering allowing some domestic companies to purchase NVIDIA RTX Pro 5500, and have already required companies such as Alibaba and ByteDance to submit their planned purchase quantities and specific intended uses. The signals being released so far are relatively positive, but the final approval timeline, quantities, and applicable standards have not yet been formally confirmed.
It’s worth noting that this time does not involve NVIDIA’s top-tier data-center AI chips. It is also not yet fully clear whether the U.S. will impose export restrictions on the RTX Pro 5500. But if China ultimately grants clearance, the most important implication for NVDA is that the China AI market once again presents an incremental order window—ByteDance is even reported to be considering purchasing around 1 million units.
If the door to the China market truly reopens even a crack, the volume likely won’t be small.
What NVDA should watch next is exactly how large a scale will be approved!
Click the card below—let’s get to it!👇
$BTC $ETH


1
2
735
·
--
Bullish
$BTC The top and bottom are both packed with liquidation fuel!
Above $85,600, there’s a large pool of short-side liquidity hidden.
Around $84,000 is another key magnet zone!
Further down, at $83,000, there’s even denser long liquidation.
Right now, BTC is squeezed in the middle between three high-leverage liquidity pockets!
From the 24-hour liquidation heatmap, the three most obvious concentration areas are currently clustered around $85,600, $84,000, and $83,000. Price is currently near $85,000; the bright zone above at $85,600 suggests that if it pushes higher, it’s easy to trigger short liquidations. Meanwhile, below are two layers of long-side liquidity waiting to be tested.
This kind of structure is most likely to amplify short-term volatility, but the liquidation heatmap only shows potential liquidity concentration areas—it doesn’t mean price will necessarily sweep them in a fixed order. The key now is which side BTC hits first: a breakout above $85,600 may set the short-side fuel alight; if it breaks below $84,000, the pull toward $83,000 will become much stronger.
Short fuel above, long liquidations below.
BTC is already squeezed in the middle—its next liquidity sweep may not be small!
Click the card below and go for it!👇
$ETH $ZEC
$BTC The top and bottom are both packed with liquidation fuel!
Above $85,600, there’s a large pool of short-side liquidity hidden.
Around $84,000 is another key magnet zone!
Further down, at $83,000, there’s even denser long liquidation.
Right now, BTC is squeezed in the middle between three high-leverage liquidity pockets!
From the 24-hour liquidation heatmap, the three most obvious concentration areas are currently clustered around $85,600, $84,000, and $83,000. Price is currently near $85,000; the bright zone above at $85,600 suggests that if it pushes higher, it’s easy to trigger short liquidations. Meanwhile, below are two layers of long-side liquidity waiting to be tested.
This kind of structure is most likely to amplify short-term volatility, but the liquidation heatmap only shows potential liquidity concentration areas—it doesn’t mean price will necessarily sweep them in a fixed order. The key now is which side BTC hits first: a breakout above $85,600 may set the short-side fuel alight; if it breaks below $84,000, the pull toward $83,000 will become much stronger.
Short fuel above, long liquidations below.
BTC is already squeezed in the middle—its next liquidity sweep may not be small!
Click the card below and go for it!👇
$ETH $ZEC
Above $85,600, there’s a large pool of short-side liquidity hidden.
Around $84,000 is another key magnet zone!
Further down, at $83,000, there’s even denser long liquidation.
Right now, BTC is squeezed in the middle between three high-leverage liquidity pockets!
From the 24-hour liquidation heatmap, the three most obvious concentration areas are currently clustered around $85,600, $84,000, and $83,000. Price is currently near $85,000; the bright zone above at $85,600 suggests that if it pushes higher, it’s easy to trigger short liquidations. Meanwhile, below are two layers of long-side liquidity waiting to be tested.
This kind of structure is most likely to amplify short-term volatility, but the liquidation heatmap only shows potential liquidity concentration areas—it doesn’t mean price will necessarily sweep them in a fixed order. The key now is which side BTC hits first: a breakout above $85,600 may set the short-side fuel alight; if it breaks below $84,000, the pull toward $83,000 will become much stronger.
Short fuel above, long liquidations below.
BTC is already squeezed in the middle—its next liquidity sweep may not be small!
Click the card below and go for it!👇
$ETH $ZEC
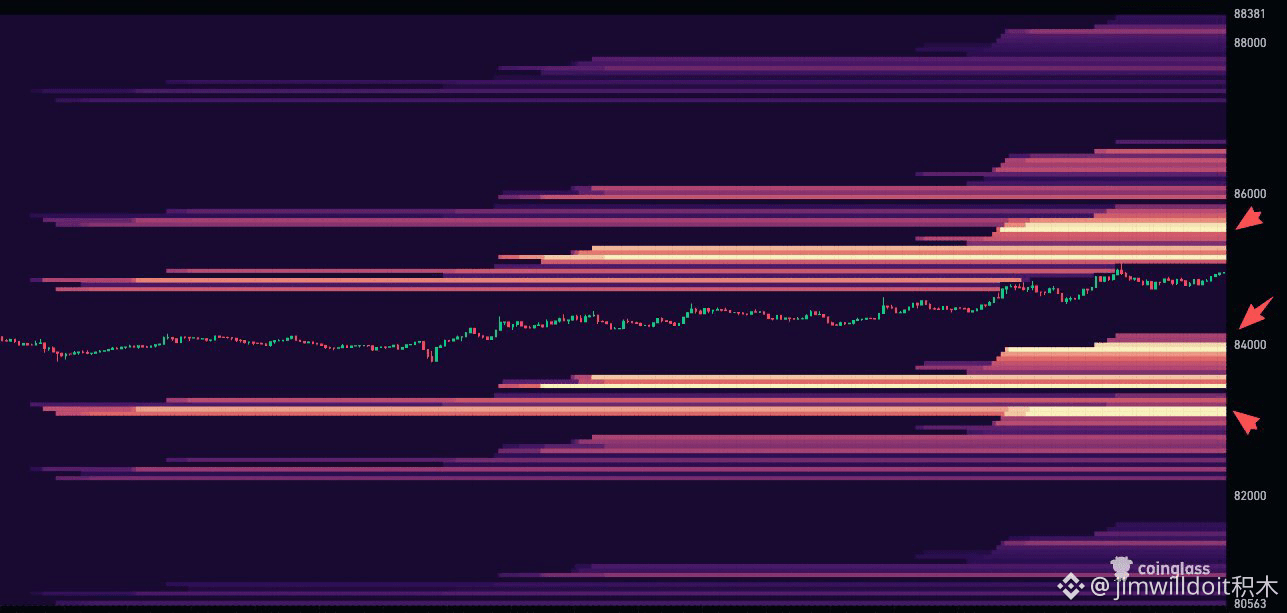
1
2
2.3k
·
--
Bullish
$BTC Saylor is hinting at adding more again!
With one line, “Even more orange,” the market instantly got the message.
That familiar orange-dot code is back!
Just last week, the Strategy bought 950 BTC.
Now the next tranche of accumulation may be on the way!
Michael Saylor again used “orange” to hint that Strategy might continue to accumulate BTC. This orange-dot signal has appeared multiple times in the past before Strategy released details of a new round of buys, but so far it’s only a hint—whether there was actually a purchase and how much will only be confirmed when the company makes an official disclosure.
It’s worth noting that last week Strategy bought 950 BTC at an average price of about $79,700, spending roughly $75.7 million, bringing total holdings to 846,000 BTC. Now that BTC is still consolidating at elevated levels, Saylor has started sending “orange” signals again—so naturally, the market will be watching for the next announcement.
Just after buying 950, they’re already hinting at “more orange.”
This BTC accumulation machine by Saylor may not have stopped yet!
Click the card below and go straight for it!👇
$ETH $ZEC
$BTC Saylor is hinting at adding more again!
With one line, “Even more orange,” the market instantly got the message.
That familiar orange-dot code is back!
Just last week, the Strategy bought 950 BTC.
Now the next tranche of accumulation may be on the way!
Michael Saylor again used “orange” to hint that Strategy might continue to accumulate BTC. This orange-dot signal has appeared multiple times in the past before Strategy released details of a new round of buys, but so far it’s only a hint—whether there was actually a purchase and how much will only be confirmed when the company makes an official disclosure.
It’s worth noting that last week Strategy bought 950 BTC at an average price of about $79,700, spending roughly $75.7 million, bringing total holdings to 846,000 BTC. Now that BTC is still consolidating at elevated levels, Saylor has started sending “orange” signals again—so naturally, the market will be watching for the next announcement.
Just after buying 950, they’re already hinting at “more orange.”
This BTC accumulation machine by Saylor may not have stopped yet!
Click the card below and go straight for it!👇
$ETH $ZEC
With one line, “Even more orange,” the market instantly got the message.
That familiar orange-dot code is back!
Just last week, the Strategy bought 950 BTC.
Now the next tranche of accumulation may be on the way!
Michael Saylor again used “orange” to hint that Strategy might continue to accumulate BTC. This orange-dot signal has appeared multiple times in the past before Strategy released details of a new round of buys, but so far it’s only a hint—whether there was actually a purchase and how much will only be confirmed when the company makes an official disclosure.
It’s worth noting that last week Strategy bought 950 BTC at an average price of about $79,700, spending roughly $75.7 million, bringing total holdings to 846,000 BTC. Now that BTC is still consolidating at elevated levels, Saylor has started sending “orange” signals again—so naturally, the market will be watching for the next announcement.
Just after buying 950, they’re already hinting at “more orange.”
This BTC accumulation machine by Saylor may not have stopped yet!
Click the card below and go straight for it!👇
$ETH $ZEC
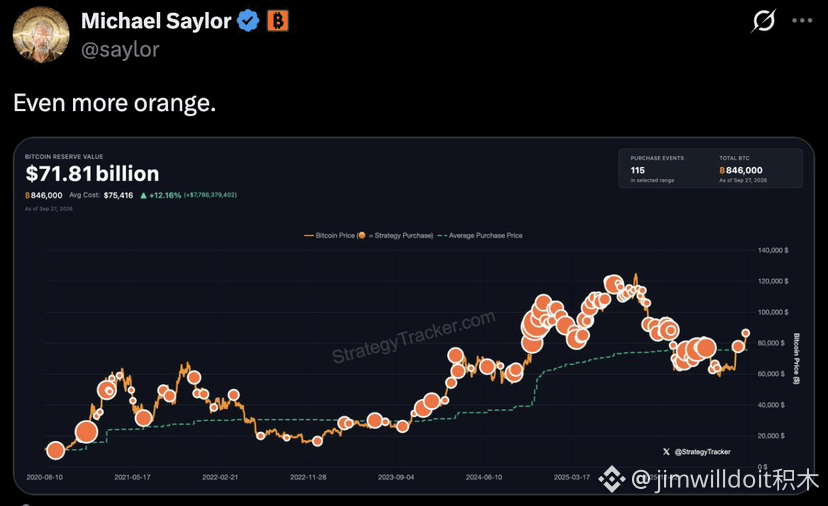
1
2
2.6k
Log in to explore more content
Join global crypto users on Binance Square
⚡️ Get latest and useful information about crypto.
💬 Trusted by the world’s largest crypto exchange.
👍 Discover real insights from verified creators.
Email / Phone number
Trending Topics
OpenAIUnveilsAlwaysOnAgentDots
5 views
25 Discussing
#OpenAIUnveilsAlwaysOnAgentDots OpenAI Unveils Always-On AI Agent "Dots"
OpenAI introduced "Dots", a brand-new class of always-on AI agents built on their latest models. Unlike traditional chatbots that require a prompt to respond, Dots are designed to run continuously in the background to handle autonomous, long-running tasks.
Key Features & Technical Highlights
Dedicated Cloud Computing: Every Dot operates within its own cloud-based virtual computer and dedicated browser environment.
Continuous Background Operation: Runs 24/7 independently. While you sleep, a Dot can perform deep market research, process backlogged invoices, monitor data streams, or draft emails.
Massive Integration Network: Integrates with over 4,000 enterprise and daily tools, including Slack, Microsoft Teams, email clients, and custom APIs.
Proactive Execution: Executes multi-step workflows autonomously and notifies you only when human approval or input is required.
Key Discussions on Binance & Crypto Platforms
The announcement quickly gained traction across crypto channels, particularly on Binance Square and crypto-focused social media, due to its potential impact on decentralized technology and financial markets.
Surge in AI-Token Sentiment: Traders and analysts on Binance are evaluating the positive spillover effect on decentralized AI protocols and AI-focused tokens (such as FET, TAO, and AGIX). The main focus is how continuous AI agents will reshape tokenized data networks.
Automated Market & On-Chain Research: Crypto investors are discussing practical use cases for Dots, including continuous on-chain transaction monitoring, automated portfolio rebalancing, sentiment analysis on breaking news, and real-time yield opportunity detection.
Decentralized Agent Protocols: The launch has sparked debates comparing centralized always-on agents like Dots with decentralized AI frameworks, focusing on privacy, self-custody, and permissionless API usage.
costajui12
·0 Likes
·1 views
ChainlinkLaunchesBankSWIFTLedgerFramework
800 views
42 Discussing
EarningsSeason
418,496 views
3,170 Discussing