
natural_tradex
57 Posts

natural_tradex
Report
Block User
📈 FX & Crypto Swing Trader 🌊 Swing Trading Strategies 📊 Technical Analysis 📰 Breaking Crypto News & Market Updates 🧠 Trading Psychology & Risk Management
Open Trade
Frequent Trader
2.2 Years
9 Following
4 Followers
94 Liked
Posts
Portfolio
💥 Institutions Are NOT Slowing Down On Bitcoin 🟠
This week alone:
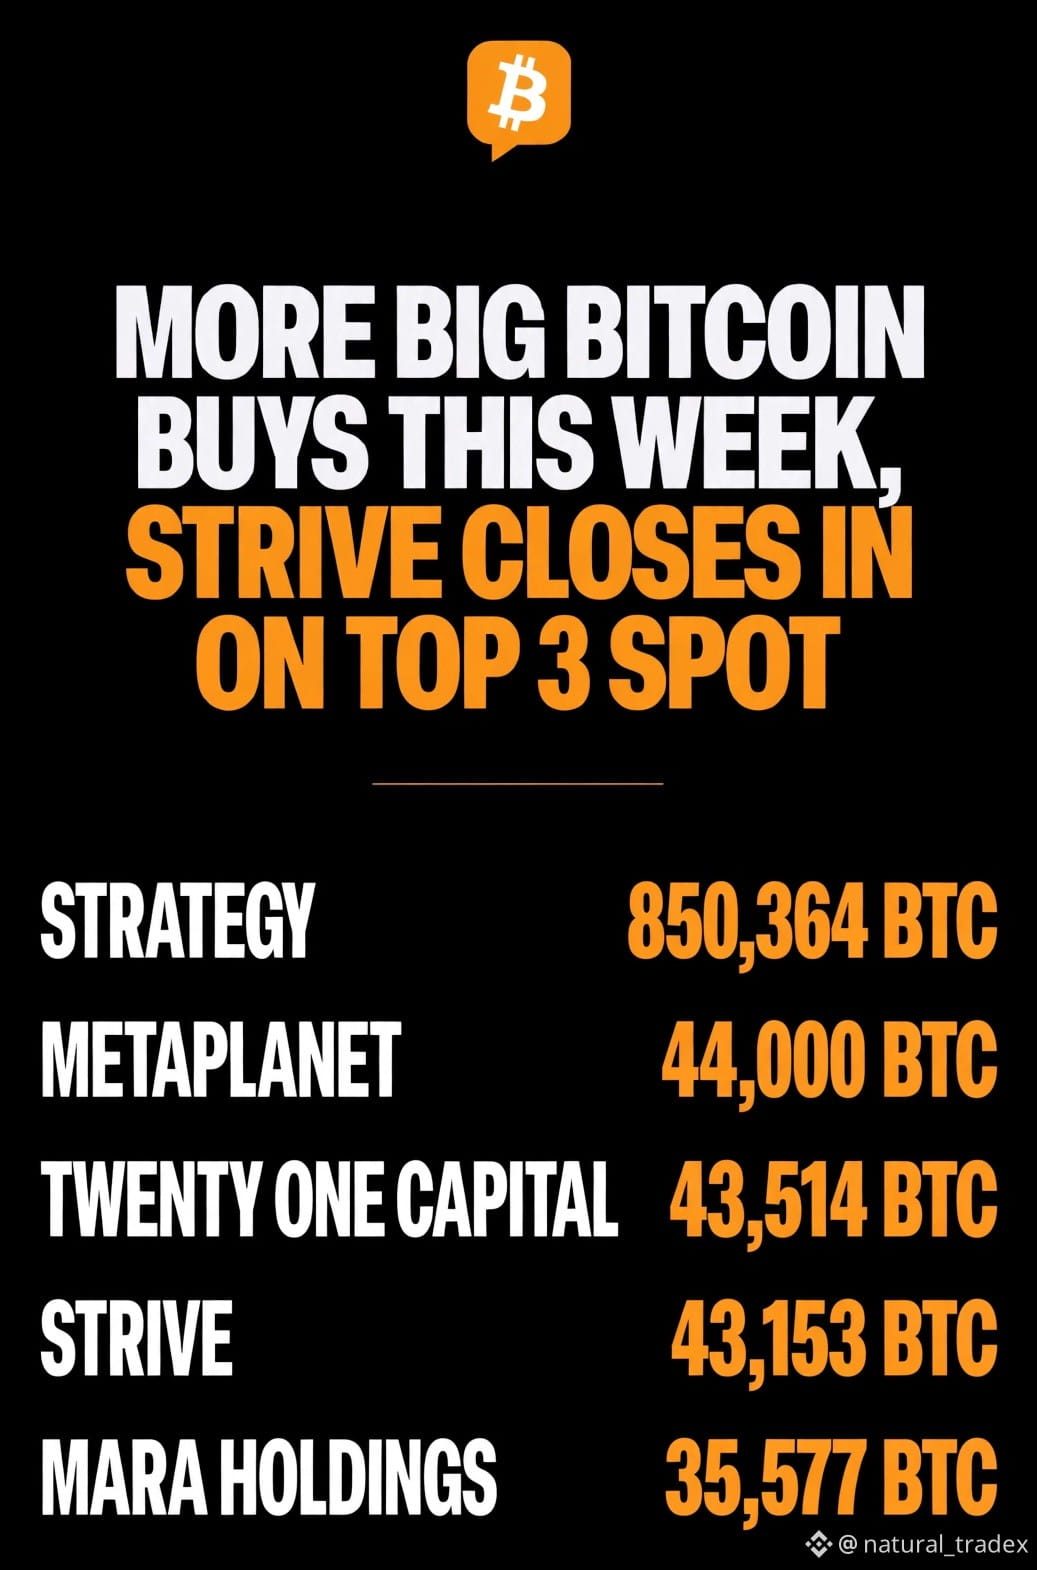
🟠 Strive bought 29 BTC — total now 43,153 BTC
🟠 Strategy bought 1,036 BTC for $81.9M — total now 850,364 BTC
Strive is now just 361 BTC away from overtaking Twenty One Capital for the Top 3 spot! 👀
This is a race to accumulate $BTC . 🏁
Smart money buys $BTC in fear. Dumb money sells $BTC in fear. Which one are you? 💎
#Bitcoin #Crypto #HODL #BullMarket
💥 Institutions Are NOT Slowing Down On Bitcoin 🟠
This week alone:
🟠 Strive bought 29 BTC — total now 43,153 BTC
🟠 Strategy bought 1,036 BTC for $81.9M — total now 850,364 BTC
Strive is now just 361 BTC away from overtaking Twenty One Capital for the Top 3 spot! 👀
This is a race to accumulate $BTC . 🏁
Smart money buys $BTC in fear. Dumb money sells $BTC in fear. Which one are you? 💎
#Bitcoin #Crypto #HODL #BullMarket
This week alone:
🟠 Strive bought 29 BTC — total now 43,153 BTC
🟠 Strategy bought 1,036 BTC for $81.9M — total now 850,364 BTC
Strive is now just 361 BTC away from overtaking Twenty One Capital for the Top 3 spot! 👀
This is a race to accumulate $BTC . 🏁
Smart money buys $BTC in fear. Dumb money sells $BTC in fear. Which one are you? 💎
#Bitcoin #Crypto #HODL #BullMarket
1
184
💥 Bitcoin vs The Banks — $BTC WON ⚖️🔥
$BTC's market cap is bigger than 【entity-Visa¦canonical_name=Visa】, HSBC, 【entity-Bank of America¦canonical_name=Bank of America】 and 【entity-Allianz¦canonical_name=Allianz】... COMBINED 😳
This is not just a chart. This is history. 📊
The banks had 100+ years. $BTC did it in 16 years. 💎
Decentralized money > Centralized money.
We are winning! 🚀
Are you on the $BTC side or the bank side? 👀
#Bitcoin #Crypto #HODL
💥 Bitcoin vs The Banks — $BTC WON ⚖️🔥
$BTC 's market cap is bigger than 【entity-Visa¦canonical_name=Visa】, HSBC, 【entity-Bank of America¦canonical_name=Bank of America】 and 【entity-Allianz¦canonical_name=Allianz】... COMBINED 😳
This is not just a chart. This is history. 📊
The banks had 100+ years. $BTC did it in 16 years. 💎
Decentralized money > Centralized money.
We are winning! 🚀
Are you on the $BTC side or the bank side? 👀
#Bitcoin #Crypto #HODL
$BTC 's market cap is bigger than 【entity-Visa¦canonical_name=Visa】, HSBC, 【entity-Bank of America¦canonical_name=Bank of America】 and 【entity-Allianz¦canonical_name=Allianz】... COMBINED 😳
This is not just a chart. This is history. 📊
The banks had 100+ years. $BTC did it in 16 years. 💎
Decentralized money > Centralized money.
We are winning! 🚀
Are you on the $BTC side or the bank side? 👀
#Bitcoin #Crypto #HODL

1
78
·
--
Bullish
💥 Congrats to those who held through the 2026 $BTC bear market 🫡
You deserve what is coming next. 🚀
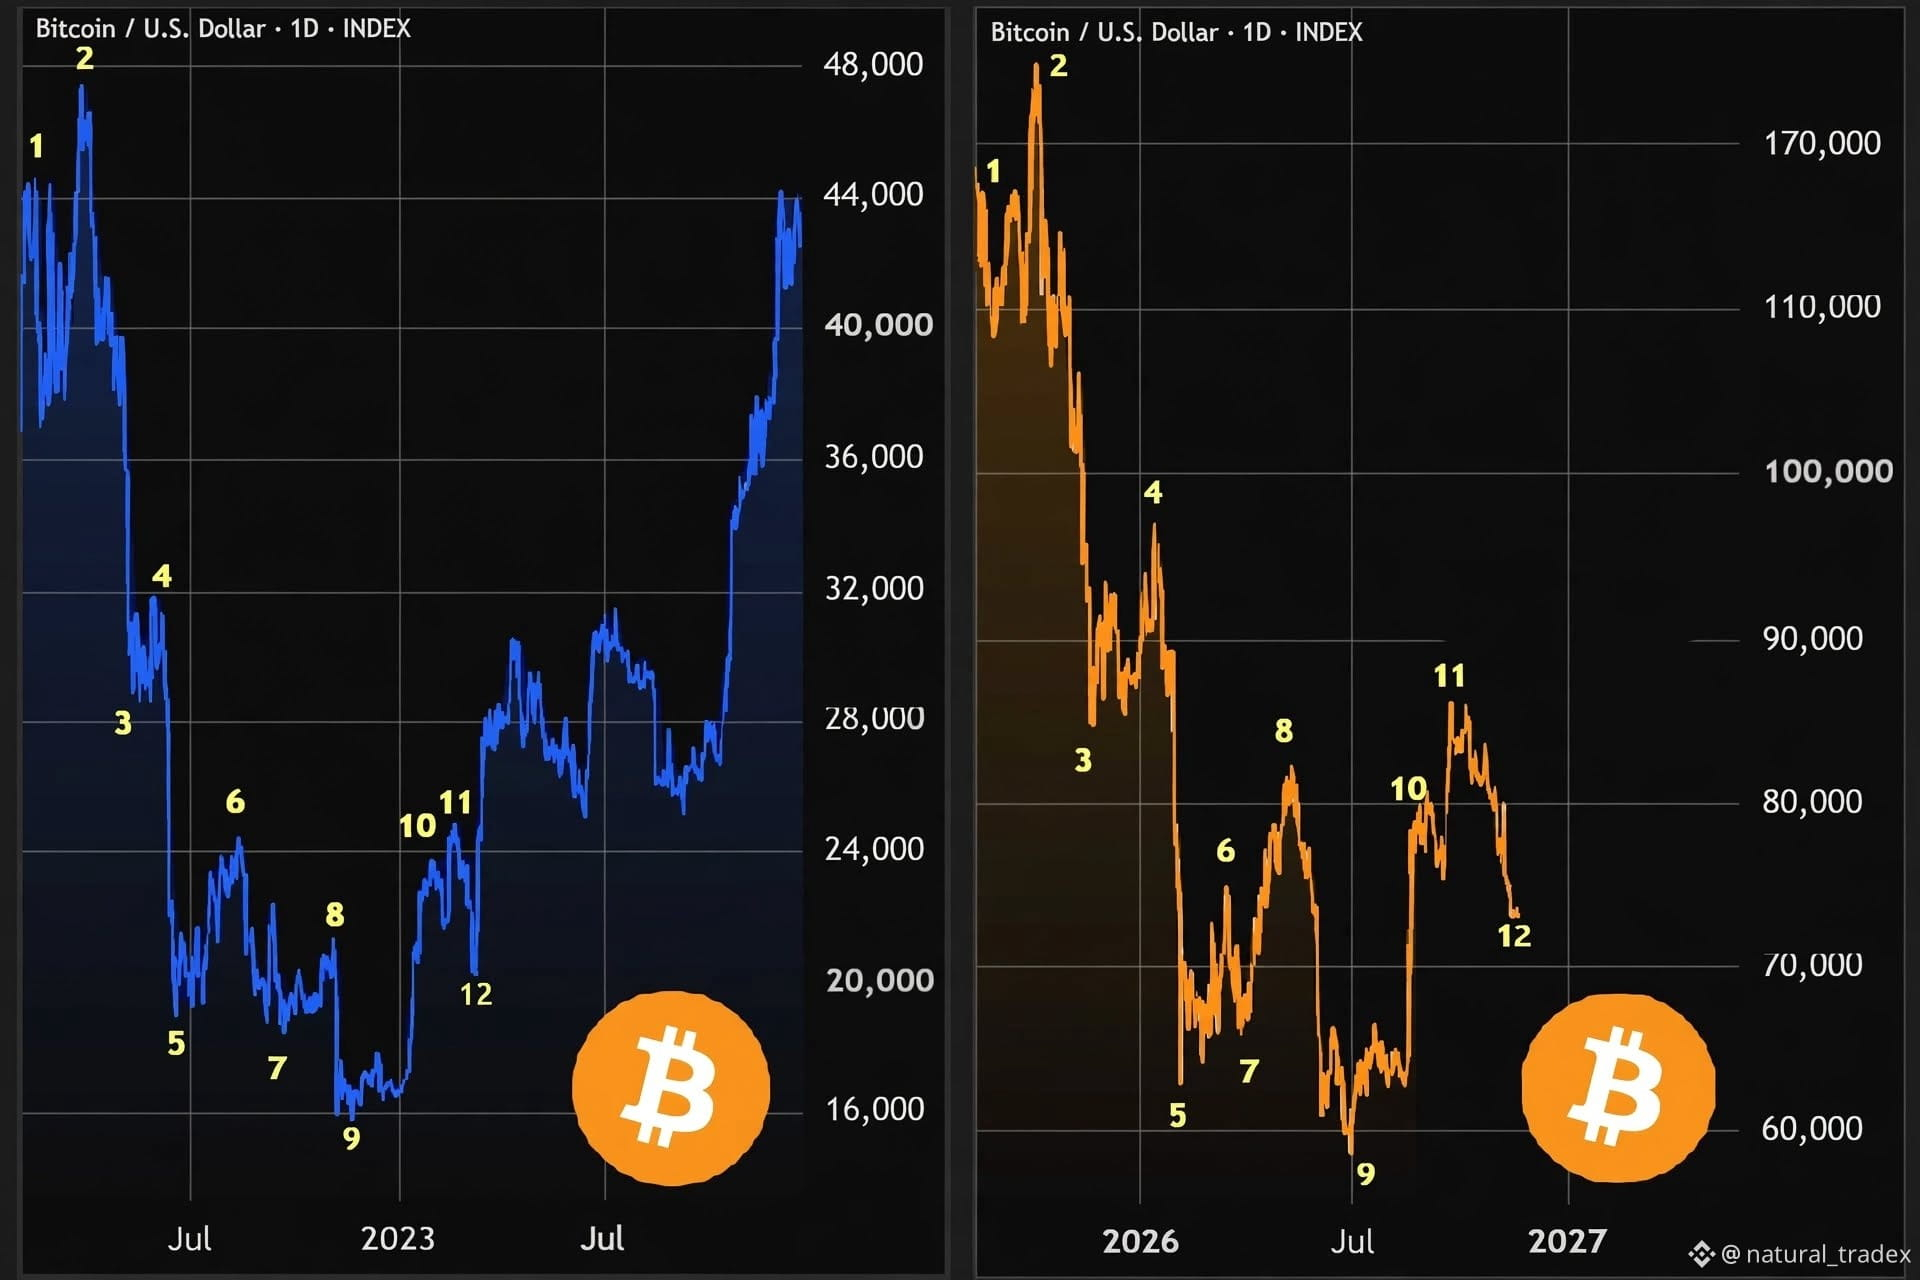
2022 vs 2026 — THE SAME STRUCTURE 📊
In 2022, everyone panicked. 😨 Then $BTC recovered and surprised everyone. 📈
In 2026, we saw the exact same pattern play out again for $BTC. 🔁
The market tested patience, not conviction. 💎
Holders stayed. Weak hands left. And now the next chapter begins for $BTC. 🔥
Send $BTC to $120k! 💥🚀
Are you still holding $BTC? 👀
#bitcoin #Crypto #HODL
💥 Congrats to those who held through the 2026 $BTC bear market 🫡
You deserve what is coming next. 🚀
2022 vs 2026 — THE SAME STRUCTURE 📊
In 2022, everyone panicked. 😨 Then $BTC recovered and surprised everyone. 📈
In 2026, we saw the exact same pattern play out again for $BTC . 🔁
The market tested patience, not conviction. 💎
Holders stayed. Weak hands left. And now the next chapter begins for $BTC . 🔥
Send $BTC to $120k! 💥🚀
Are you still holding $BTC ? 👀
#bitcoin #Crypto #HODL
You deserve what is coming next. 🚀
2022 vs 2026 — THE SAME STRUCTURE 📊
In 2022, everyone panicked. 😨 Then $BTC recovered and surprised everyone. 📈
In 2026, we saw the exact same pattern play out again for $BTC . 🔁
The market tested patience, not conviction. 💎
Holders stayed. Weak hands left. And now the next chapter begins for $BTC . 🔥
Send $BTC to $120k! 💥🚀
Are you still holding $BTC ? 👀
#bitcoin #Crypto #HODL
1
6
1.3k
🚨 Bitcoin investors, don't wait until $126K before you start paying attention!
The market always tests investors' patience.
At $75K, some people are scared to buy. But if Bitcoin climbs toward $126K, those same people may suddenly rush into the market because they don't want to miss the rally.
That's how FOMO works.
The opportunity to build a position doesn't always come when everyone is celebrating. Sometimes it comes when sentiment is weak and uncertainty is high.
If you believe in Bitcoin's long-term potential, consider a disciplined accumulation strategy during dips.
Remember: You don't have to catch the exact bottom. You just need a plan and the patience to follow it.
Don't chase Bitcoin after the excitement. Prepare before it. 🔥
#Bitcoin #BTC #BinanceSquare
🚨 Bitcoin investors, don't wait until $126K before you start paying attention!
The market always tests investors' patience.
At $75K, some people are scared to buy. But if Bitcoin climbs toward $126K, those same people may suddenly rush into the market because they don't want to miss the rally.
That's how FOMO works.
The opportunity to build a position doesn't always come when everyone is celebrating. Sometimes it comes when sentiment is weak and uncertainty is high.
If you believe in Bitcoin's long-term potential, consider a disciplined accumulation strategy during dips.
Remember: You don't have to catch the exact bottom. You just need a plan and the patience to follow it.
Don't chase Bitcoin after the excitement. Prepare before it. 🔥
#Bitcoin #BTC #BinanceSquare
The market always tests investors' patience.
At $75K, some people are scared to buy. But if Bitcoin climbs toward $126K, those same people may suddenly rush into the market because they don't want to miss the rally.
That's how FOMO works.
The opportunity to build a position doesn't always come when everyone is celebrating. Sometimes it comes when sentiment is weak and uncertainty is high.
If you believe in Bitcoin's long-term potential, consider a disciplined accumulation strategy during dips.
Remember: You don't have to catch the exact bottom. You just need a plan and the patience to follow it.
Don't chase Bitcoin after the excitement. Prepare before it. 🔥
#Bitcoin #BTC #BinanceSquare

1
223
·
--
Bullish
🔥 Fire sale? Bitcoin is in the lowest band of the Rainbow Chart 🌈
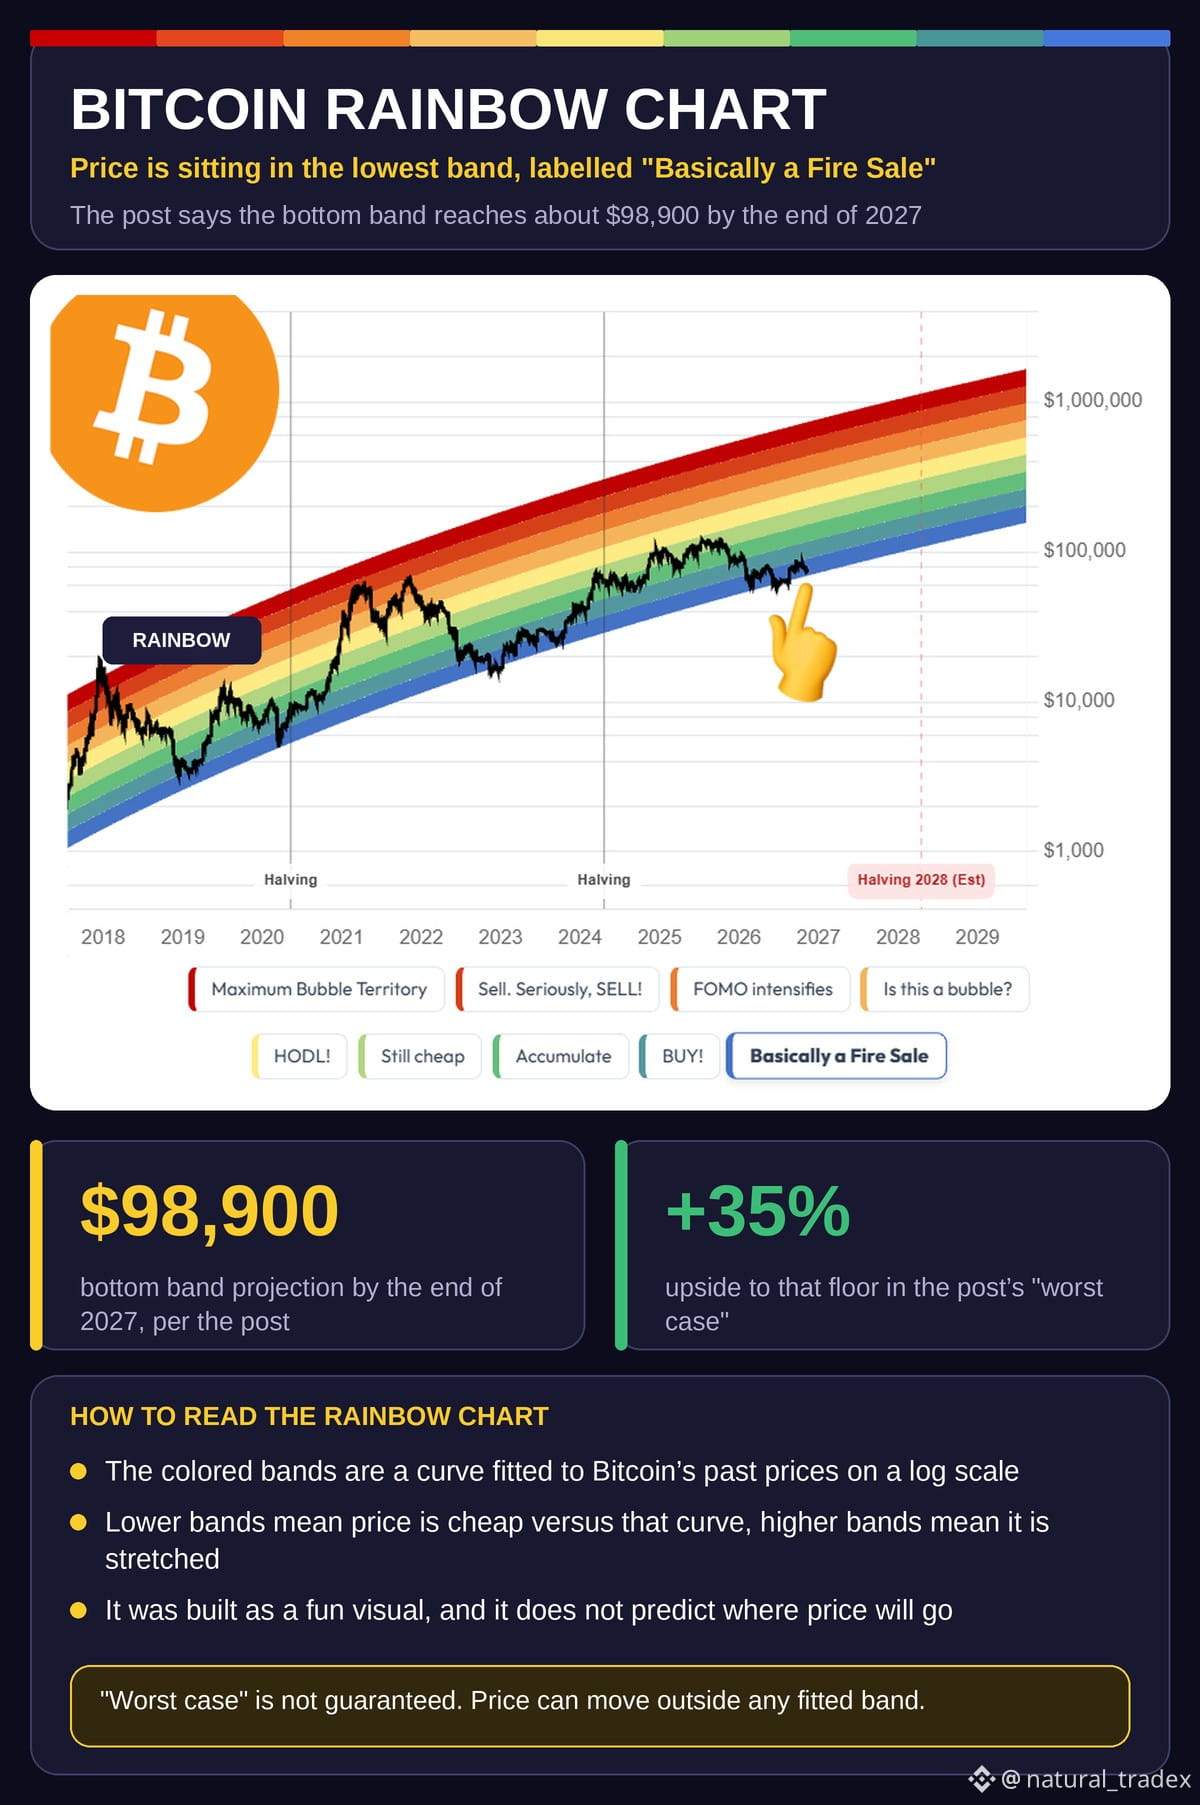
🔦 The popular Bitcoin Rainbow Chart places $BTC in its bottom blue band, labelled "Basically a Fire Sale". A viral post says that band is near $98,900 by the end of 2027, a gap of about 35% from the price it used 📊
🗺️ THE BAND LABELS, TOP TO BOTTOM
🔸 Maximum Bubble Territory
🔸 Sell. Seriously, SELL!
🔸 FOMO intensifies
🔸 Is this a bubble?
🔸 HODL!
🔸 Still cheap
🔸 Accumulate
🔸 BUY!
🔸 Basically a Fire Sale
🧠 HOW TO READ IT
The bands come from a logarithmic curve through past highs and lows. A low band means price is below its long-term trend, not that a rebound is certain 🔬
⚠️ REMEMBER
The chart was designed for fun, and it can be wrong. The "worst case" label is a story the chart tells, not a guarantee. Keep your risk limits and wait for confirmation before acting 🧘
🙋 Do you use the Rainbow Chart in your plan? Share below 👇
#CryptoTrading #SwingTrading #TechnicalAnalysis #Binance #BinanceSquare
🔥 Fire sale? Bitcoin is in the lowest band of the Rainbow Chart 🌈
🔦 The popular Bitcoin Rainbow Chart places $BTC in its bottom blue band, labelled "Basically a Fire Sale". A viral post says that band is near $98,900 by the end of 2027, a gap of about 35% from the price it used 📊
🗺️ THE BAND LABELS, TOP TO BOTTOM
🔸 Maximum Bubble Territory
🔸 Sell. Seriously, SELL!
🔸 FOMO intensifies
🔸 Is this a bubble?
🔸 HODL!
🔸 Still cheap
🔸 Accumulate
🔸 BUY!
🔸 Basically a Fire Sale
🧠 HOW TO READ IT
The bands come from a logarithmic curve through past highs and lows. A low band means price is below its long-term trend, not that a rebound is certain 🔬
⚠️ REMEMBER
The chart was designed for fun, and it can be wrong. The "worst case" label is a story the chart tells, not a guarantee. Keep your risk limits and wait for confirmation before acting 🧘
🙋 Do you use the Rainbow Chart in your plan? Share below 👇
#CryptoTrading #SwingTrading #TechnicalAnalysis #Binance #BinanceSquare
🔦 The popular Bitcoin Rainbow Chart places $BTC in its bottom blue band, labelled "Basically a Fire Sale". A viral post says that band is near $98,900 by the end of 2027, a gap of about 35% from the price it used 📊
🗺️ THE BAND LABELS, TOP TO BOTTOM
🔸 Maximum Bubble Territory
🔸 Sell. Seriously, SELL!
🔸 FOMO intensifies
🔸 Is this a bubble?
🔸 HODL!
🔸 Still cheap
🔸 Accumulate
🔸 BUY!
🔸 Basically a Fire Sale
🧠 HOW TO READ IT
The bands come from a logarithmic curve through past highs and lows. A low band means price is below its long-term trend, not that a rebound is certain 🔬
⚠️ REMEMBER
The chart was designed for fun, and it can be wrong. The "worst case" label is a story the chart tells, not a guarantee. Keep your risk limits and wait for confirmation before acting 🧘
🙋 Do you use the Rainbow Chart in your plan? Share below 👇
#CryptoTrading #SwingTrading #TechnicalAnalysis #Binance #BinanceSquare
1
168
·
--
Bullish
📊 BITCOIN AT A CRITICAL CROSSROAD!
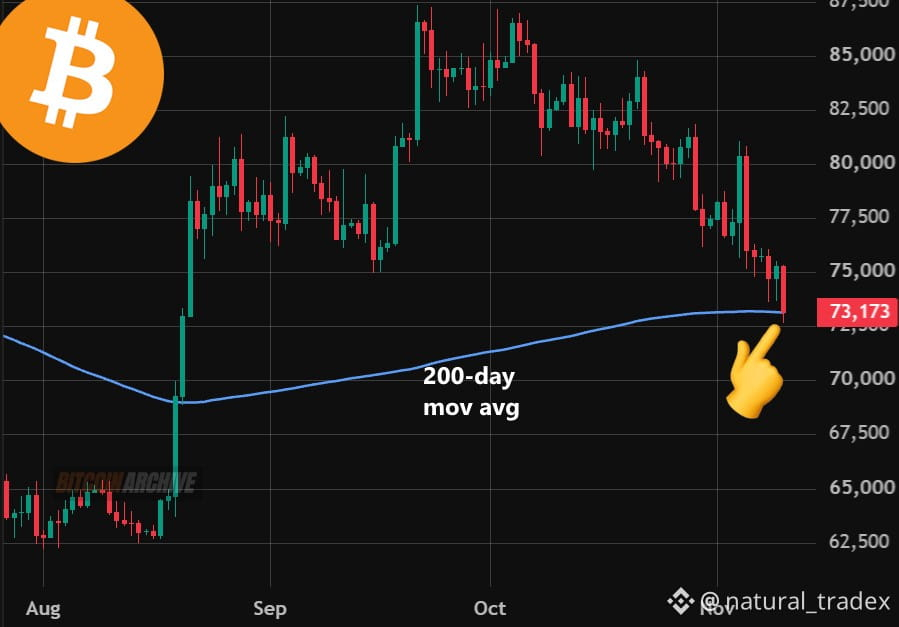
$BTC is testing its 200-day moving average for the first time since breaking above it in mid-August.
This is a major technical level because the 200-day moving average is widely used to assess Bitcoin's longer-term market direction.
🔥 Bulls need to defend this level to prevent further deterioration in market sentiment.
🐻 Bears, on the other hand, will be watching for a breakdown that could accelerate selling pressure.
One level. Two possible outcomes. The next move matters!
Are we looking at a potential Bitcoin rebound or the beginning of another leg down?
Drop your thoughts below! 👇
#Bitcoin #BTC #Crypto
📊 BITCOIN AT A CRITICAL CROSSROAD!
$BTC is testing its 200-day moving average for the first time since breaking above it in mid-August.
This is a major technical level because the 200-day moving average is widely used to assess Bitcoin's longer-term market direction.
🔥 Bulls need to defend this level to prevent further deterioration in market sentiment.
🐻 Bears, on the other hand, will be watching for a breakdown that could accelerate selling pressure.
One level. Two possible outcomes. The next move matters!
Are we looking at a potential Bitcoin rebound or the beginning of another leg down?
Drop your thoughts below! 👇
#Bitcoin #BTC #Crypto
$BTC is testing its 200-day moving average for the first time since breaking above it in mid-August.
This is a major technical level because the 200-day moving average is widely used to assess Bitcoin's longer-term market direction.
🔥 Bulls need to defend this level to prevent further deterioration in market sentiment.
🐻 Bears, on the other hand, will be watching for a breakdown that could accelerate selling pressure.
One level. Two possible outcomes. The next move matters!
Are we looking at a potential Bitcoin rebound or the beginning of another leg down?
Drop your thoughts below! 👇
#Bitcoin #BTC #Crypto
1
136
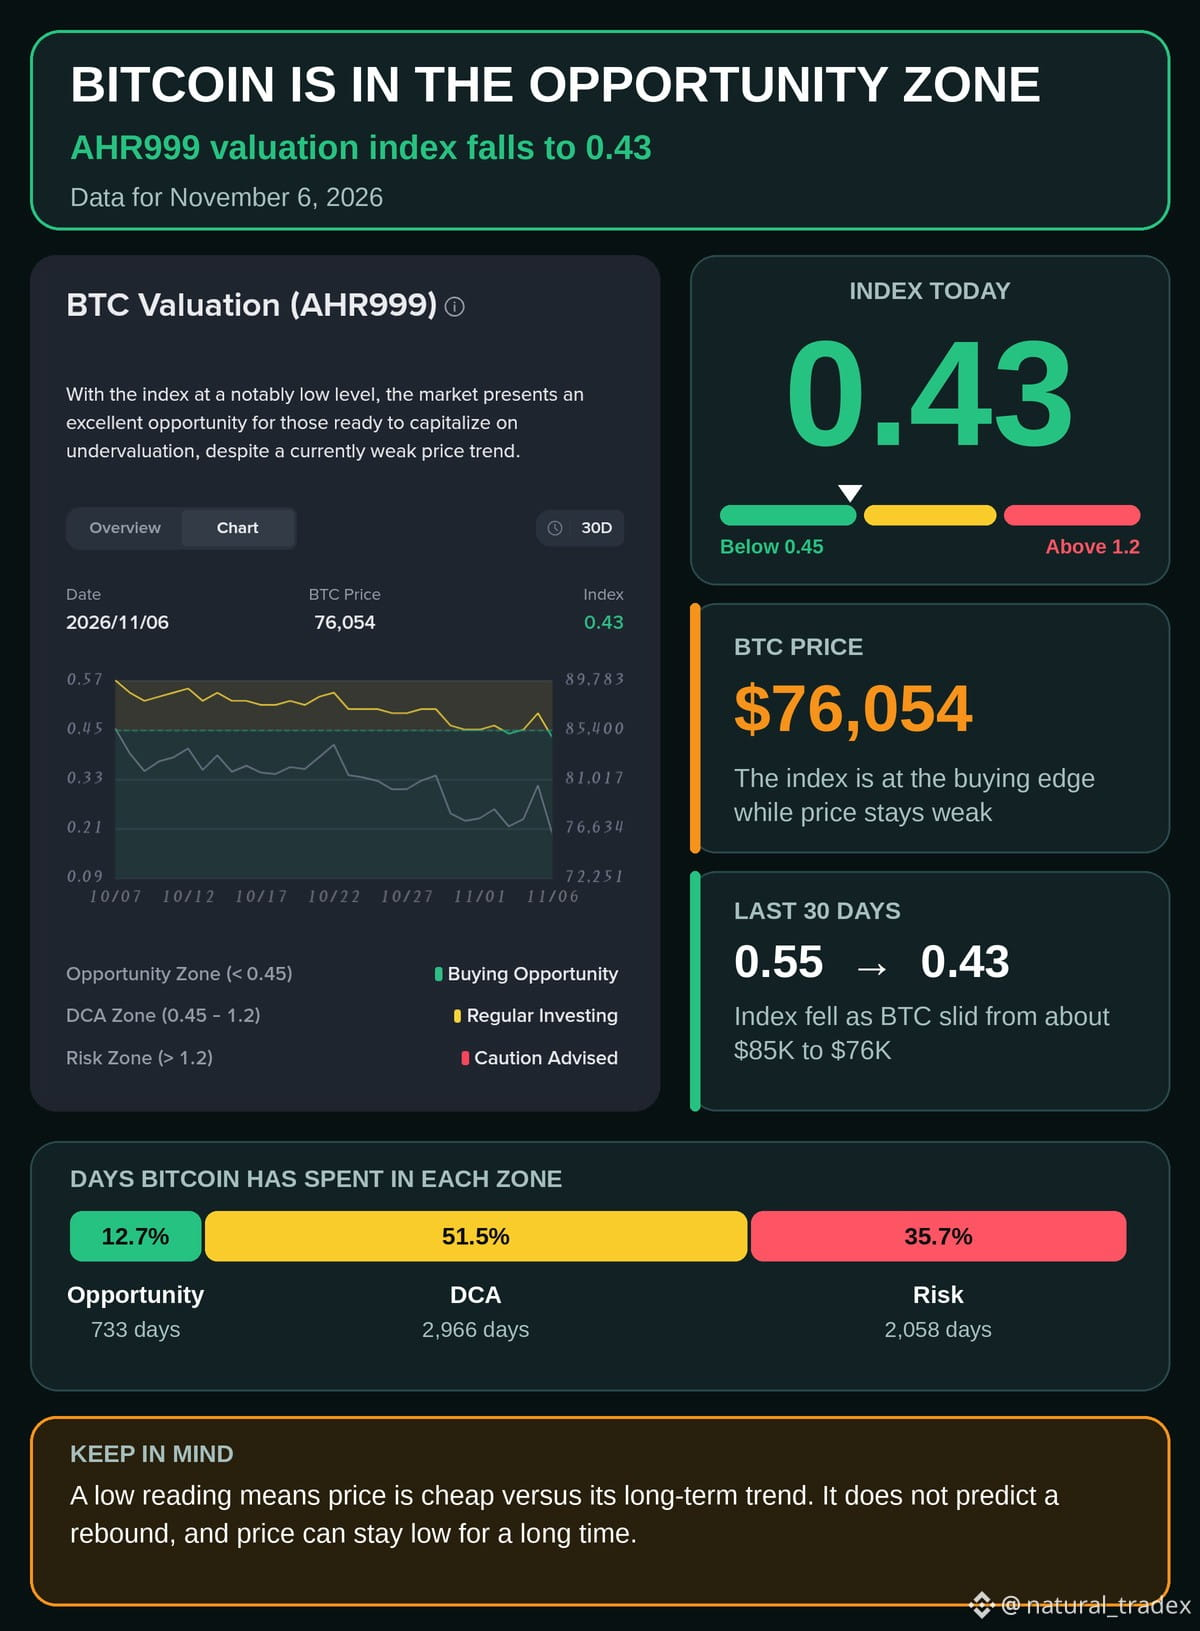
🔥 IS BITCOIN BECOMING TOO CHEAP TO IGNORE?
The AHR999 indicator is flashing an interesting signal!
Bitcoin's valuation index has dropped to 0.43, entering the historical opportunity zone.
Here are the key numbers:
💰 $BTC Price: $76,054
📉 AHR999: 0.43
🟢 Buying Opportunity Zone: Below 0.45
The indicator is designed to identify periods when Bitcoin's price may be attractive compared with historical valuation trends.
For long-term investors, readings in this zone may deserve attention, especially when considering a gradual dollar-cost averaging strategy.
Still, a low reading doesn't mean the bottom is in.
The big question is: Are we looking at a potential Bitcoin accumulation window, or is another correction coming?
What's your strategy? 👇
#Bitcoin #BTC #BinanceSquare
🔥 IS BITCOIN BECOMING TOO CHEAP TO IGNORE?
The AHR999 indicator is flashing an interesting signal!
Bitcoin's valuation index has dropped to 0.43, entering the historical opportunity zone.
Here are the key numbers:
💰 $BTC Price: $76,054
📉 AHR999: 0.43
🟢 Buying Opportunity Zone: Below 0.45
The indicator is designed to identify periods when Bitcoin's price may be attractive compared with historical valuation trends.
For long-term investors, readings in this zone may deserve attention, especially when considering a gradual dollar-cost averaging strategy.
Still, a low reading doesn't mean the bottom is in.
The big question is: Are we looking at a potential Bitcoin accumulation window, or is another correction coming?
What's your strategy? 👇
#Bitcoin #BTC #BinanceSquare
The AHR999 indicator is flashing an interesting signal!
Bitcoin's valuation index has dropped to 0.43, entering the historical opportunity zone.
Here are the key numbers:
💰 $BTC Price: $76,054
📉 AHR999: 0.43
🟢 Buying Opportunity Zone: Below 0.45
The indicator is designed to identify periods when Bitcoin's price may be attractive compared with historical valuation trends.
For long-term investors, readings in this zone may deserve attention, especially when considering a gradual dollar-cost averaging strategy.
Still, a low reading doesn't mean the bottom is in.
The big question is: Are we looking at a potential Bitcoin accumulation window, or is another correction coming?
What's your strategy? 👇
#Bitcoin #BTC #BinanceSquare
1
157
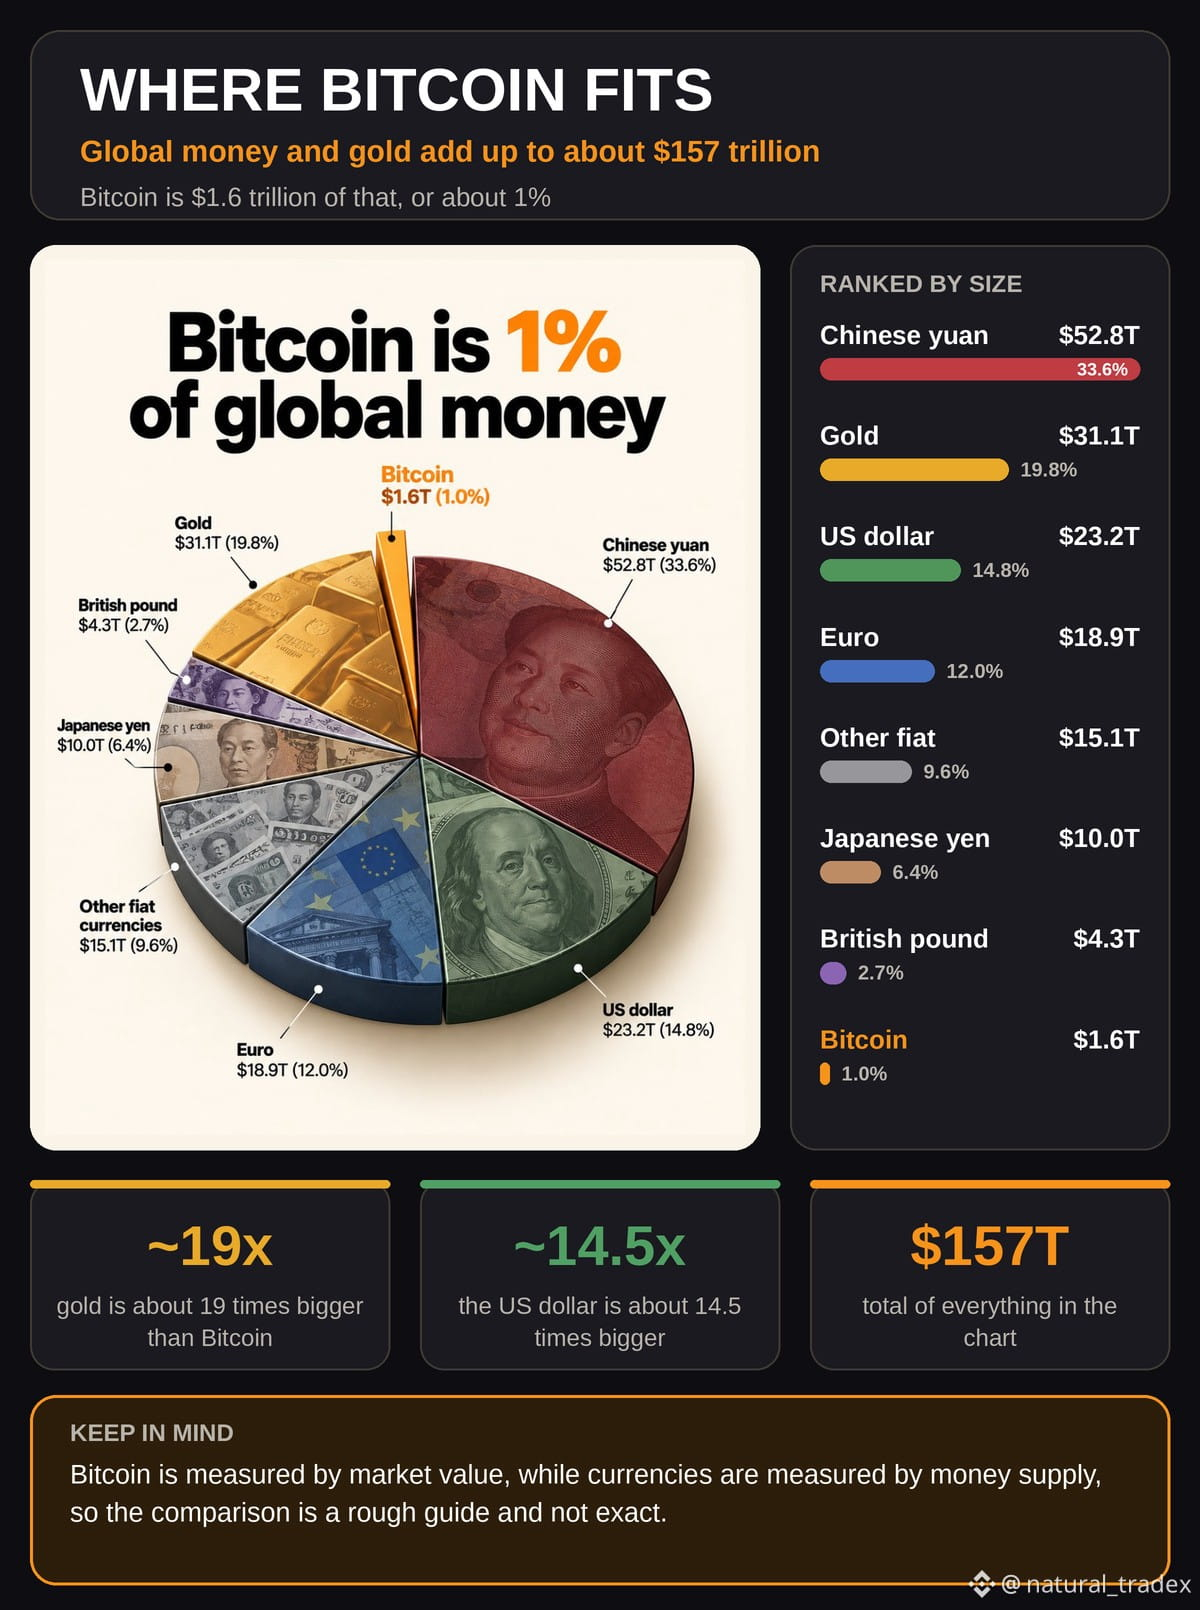
🌍 Big picture: Bitcoin is only about 1% of global money 🔍
📏 If you add up the major currencies and gold, the total is around $157 trillion. The chart puts $BTC at about $1.6 trillion of that, or 1.0% 📊
🏆 THE BIGGEST SLICES
✅ Chinese yuan: $52.8T, the largest
✅ Gold: $31.1T
✅ US dollar: $23.2T
✅ Euro: $18.9T
✅ Bitcoin: $1.6T
🧮 WHAT STANDS OUT
Gold is roughly 19 times larger than Bitcoin, and the dollar is about 14.5 times larger. Even so, Bitcoin has reached about the same scale as the British pound's money supply of $4.3T when you look at the chart's smallest slices 🪙
⚖️ KEEP IN MIND
The values are measured in different ways, so treat the chart as a rough guide to size. A small share can mean room to grow, but it can also mean higher risk and bigger price swings ⚠️
🙋 Do you see Bitcoin as digital gold, a new currency or neither? Share below 👇
#Bitcoin #GlobalMoney #BinanceSquare
🌍 Big picture: Bitcoin is only about 1% of global money 🔍
📏 If you add up the major currencies and gold, the total is around $157 trillion. The chart puts $BTC at about $1.6 trillion of that, or 1.0% 📊
🏆 THE BIGGEST SLICES
✅ Chinese yuan: $52.8T, the largest
✅ Gold: $31.1T
✅ US dollar: $23.2T
✅ Euro: $18.9T
✅ Bitcoin: $1.6T
🧮 WHAT STANDS OUT
Gold is roughly 19 times larger than Bitcoin, and the dollar is about 14.5 times larger. Even so, Bitcoin has reached about the same scale as the British pound's money supply of $4.3T when you look at the chart's smallest slices 🪙
⚖️ KEEP IN MIND
The values are measured in different ways, so treat the chart as a rough guide to size. A small share can mean room to grow, but it can also mean higher risk and bigger price swings ⚠️
🙋 Do you see Bitcoin as digital gold, a new currency or neither? Share below 👇
#Bitcoin #GlobalMoney #BinanceSquare
📏 If you add up the major currencies and gold, the total is around $157 trillion. The chart puts $BTC at about $1.6 trillion of that, or 1.0% 📊
🏆 THE BIGGEST SLICES
✅ Chinese yuan: $52.8T, the largest
✅ Gold: $31.1T
✅ US dollar: $23.2T
✅ Euro: $18.9T
✅ Bitcoin: $1.6T
🧮 WHAT STANDS OUT
Gold is roughly 19 times larger than Bitcoin, and the dollar is about 14.5 times larger. Even so, Bitcoin has reached about the same scale as the British pound's money supply of $4.3T when you look at the chart's smallest slices 🪙
⚖️ KEEP IN MIND
The values are measured in different ways, so treat the chart as a rough guide to size. A small share can mean room to grow, but it can also mean higher risk and bigger price swings ⚠️
🙋 Do you see Bitcoin as digital gold, a new currency or neither? Share below 👇
#Bitcoin #GlobalMoney #BinanceSquare
1
116
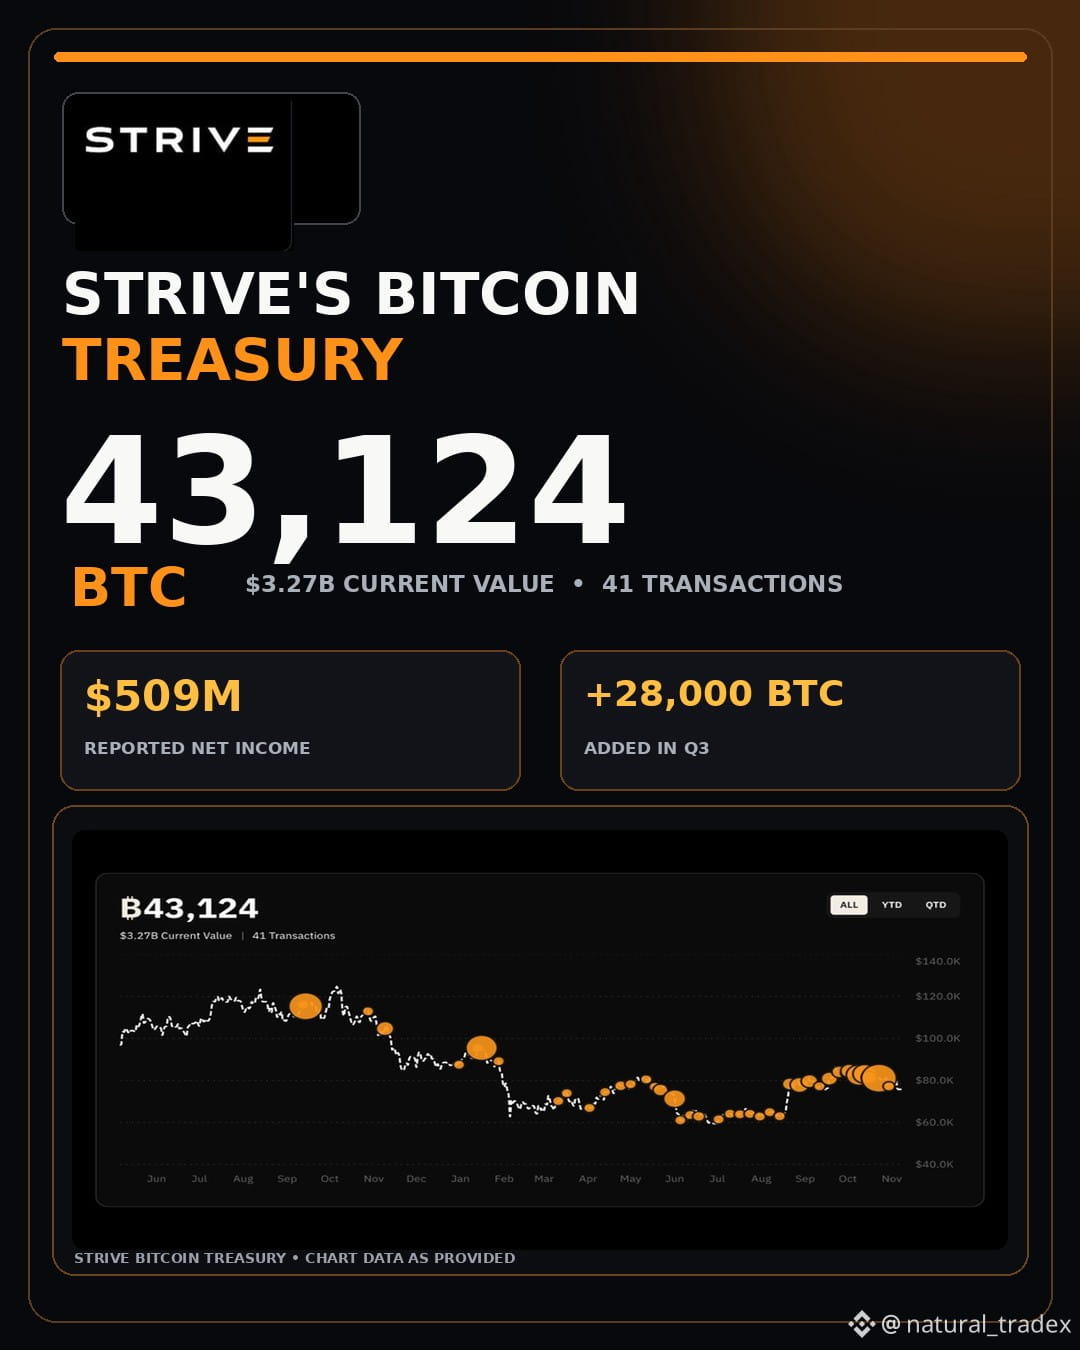
🚨 43,124 BTC! STRIVE IS BUILDING A MASSIVE BITCOIN TREASURY!
Strive has made another significant move in the Bitcoin market, adding 28,000 BTC in Q3.
Here's what you need to know:
₿ Total Bitcoin holdings: 43,124 BTC
📊 BTC added in Q3: 28,000 BTC
💰 Reported net income: $509 million
🚀 Treasury value: Approximately $3.26 billion
This development highlights the growing role of Bitcoin in corporate treasury strategies.
As more publicly traded companies increase their exposure to $BTC , institutional adoption remains a major narrative in the crypto market.
👀 Who do you think will be the next company to make a massive Bitcoin purchase?
#Bitcoin #BTC #Crypto
🚨 43,124 BTC! STRIVE IS BUILDING A MASSIVE BITCOIN TREASURY!
Strive has made another significant move in the Bitcoin market, adding 28,000 BTC in Q3.
Here's what you need to know:
₿ Total Bitcoin holdings: 43,124 BTC
📊 BTC added in Q3: 28,000 BTC
💰 Reported net income: $509 million
🚀 Treasury value: Approximately $3.26 billion
This development highlights the growing role of Bitcoin in corporate treasury strategies.
As more publicly traded companies increase their exposure to $BTC , institutional adoption remains a major narrative in the crypto market.
👀 Who do you think will be the next company to make a massive Bitcoin purchase?
#Bitcoin #BTC #Crypto
Strive has made another significant move in the Bitcoin market, adding 28,000 BTC in Q3.
Here's what you need to know:
₿ Total Bitcoin holdings: 43,124 BTC
📊 BTC added in Q3: 28,000 BTC
💰 Reported net income: $509 million
🚀 Treasury value: Approximately $3.26 billion
This development highlights the growing role of Bitcoin in corporate treasury strategies.
As more publicly traded companies increase their exposure to $BTC , institutional adoption remains a major narrative in the crypto market.
👀 Who do you think will be the next company to make a massive Bitcoin purchase?
#Bitcoin #BTC #Crypto
2
272
🔥 STRATEGY JUST ADDED ANOTHER 1,036 BITCOIN!
Michael Saylor's company continues to demonstrate its long-term conviction in $BTC
While market sentiment changes and traders debate whether Bitcoin is heading higher or lower, Strategy keeps accumulating.
This raises an interesting question:
Are large institutions positioning themselves for the next major Bitcoin rally?
One thing is clear: Strategy's Bitcoin strategy remains a major story in the crypto market. 🐋
Would you keep accumulating Bitcoin at these market levels?
#Bitcoin #BTC #InstitutionalAdoption
🔥 STRATEGY JUST ADDED ANOTHER 1,036 BITCOIN!
Michael Saylor's company continues to demonstrate its long-term conviction in $BTC
While market sentiment changes and traders debate whether Bitcoin is heading higher or lower, Strategy keeps accumulating.
This raises an interesting question:
Are large institutions positioning themselves for the next major Bitcoin rally?
One thing is clear: Strategy's Bitcoin strategy remains a major story in the crypto market. 🐋
Would you keep accumulating Bitcoin at these market levels?
#Bitcoin #BTC #InstitutionalAdoption
Michael Saylor's company continues to demonstrate its long-term conviction in $BTC
While market sentiment changes and traders debate whether Bitcoin is heading higher or lower, Strategy keeps accumulating.
This raises an interesting question:
Are large institutions positioning themselves for the next major Bitcoin rally?
One thing is clear: Strategy's Bitcoin strategy remains a major story in the crypto market. 🐋
Would you keep accumulating Bitcoin at these market levels?
#Bitcoin #BTC #InstitutionalAdoption

2
212
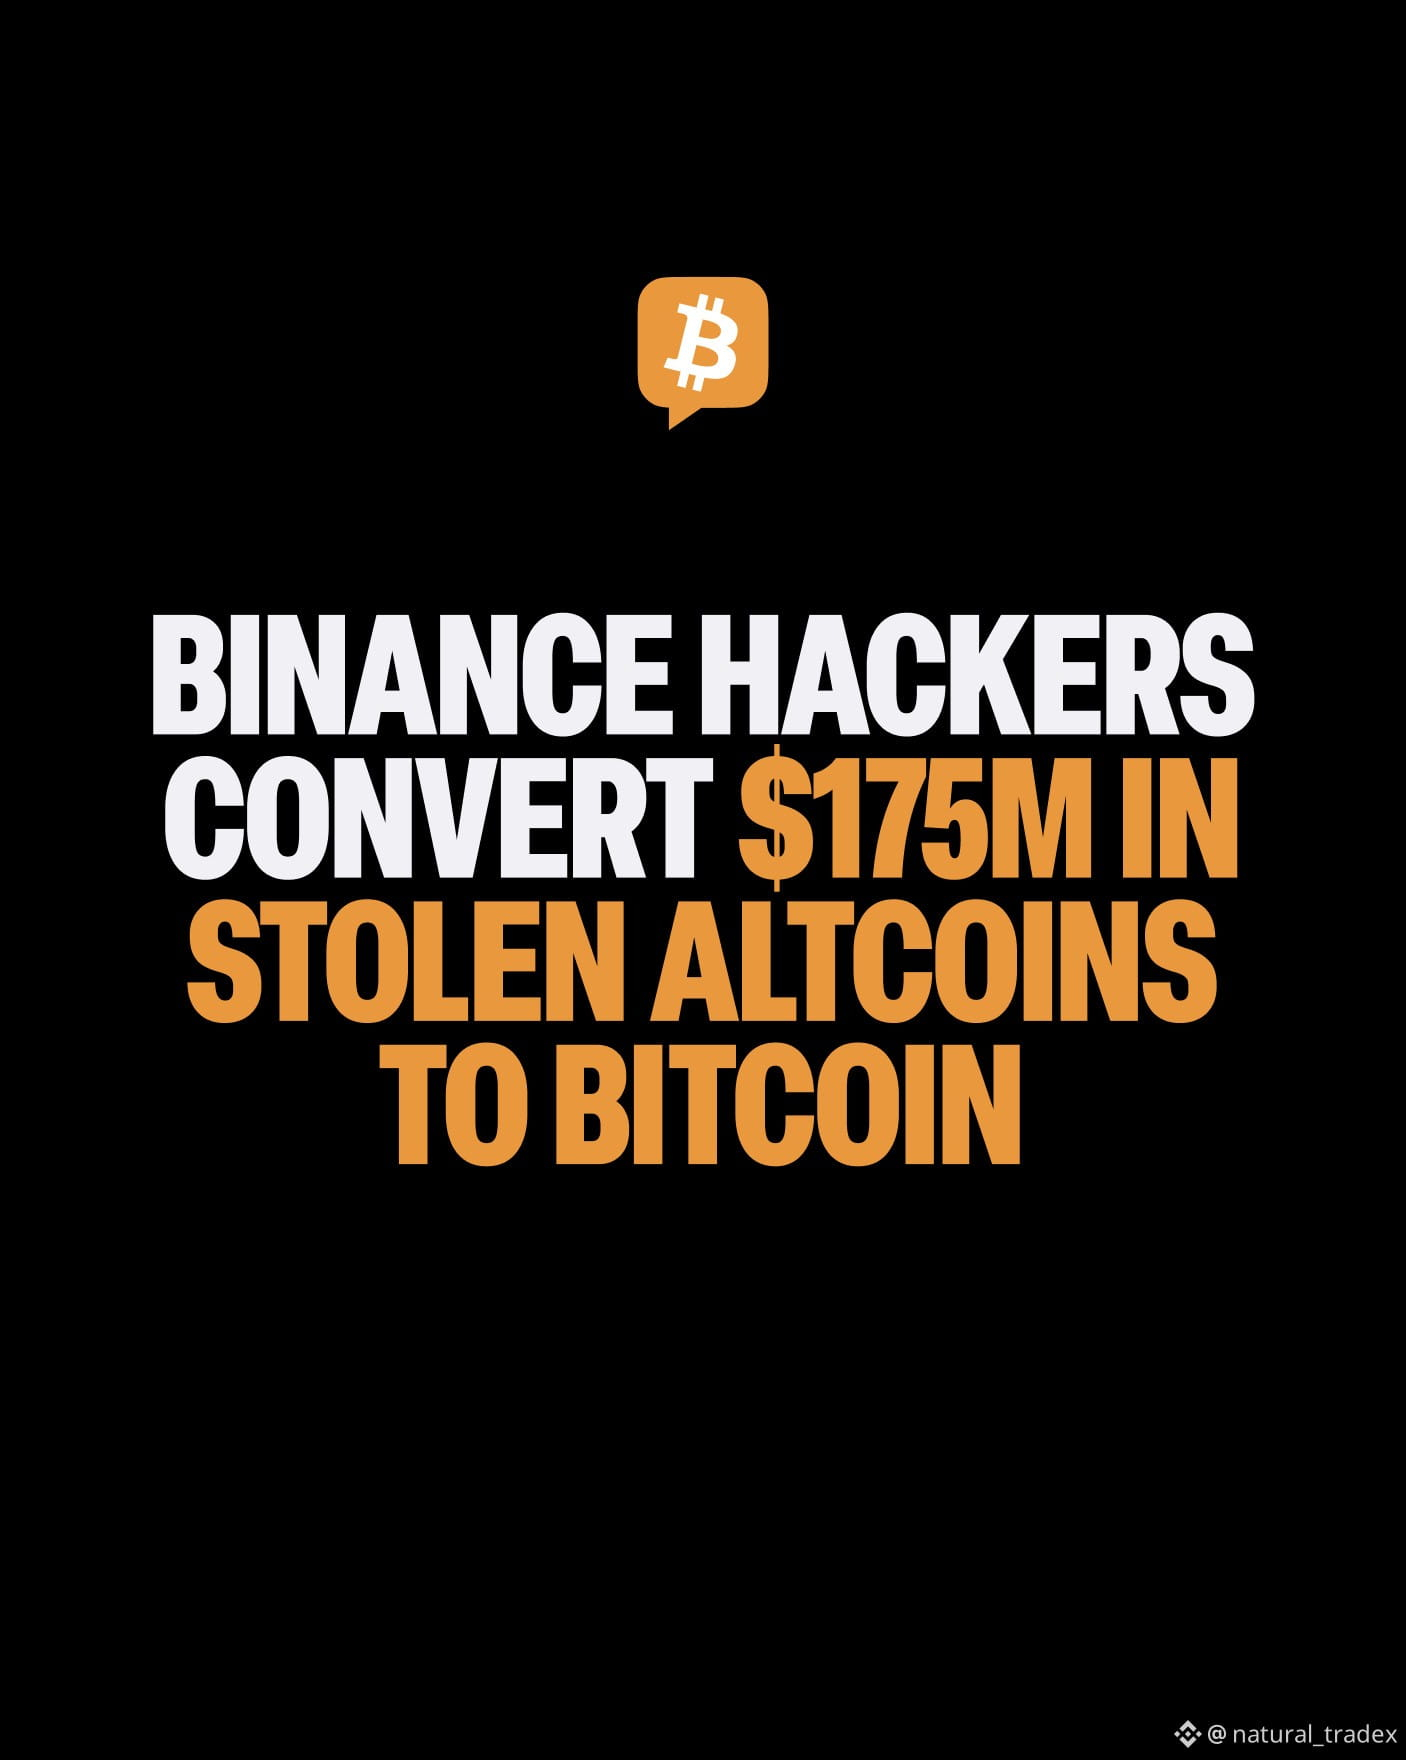
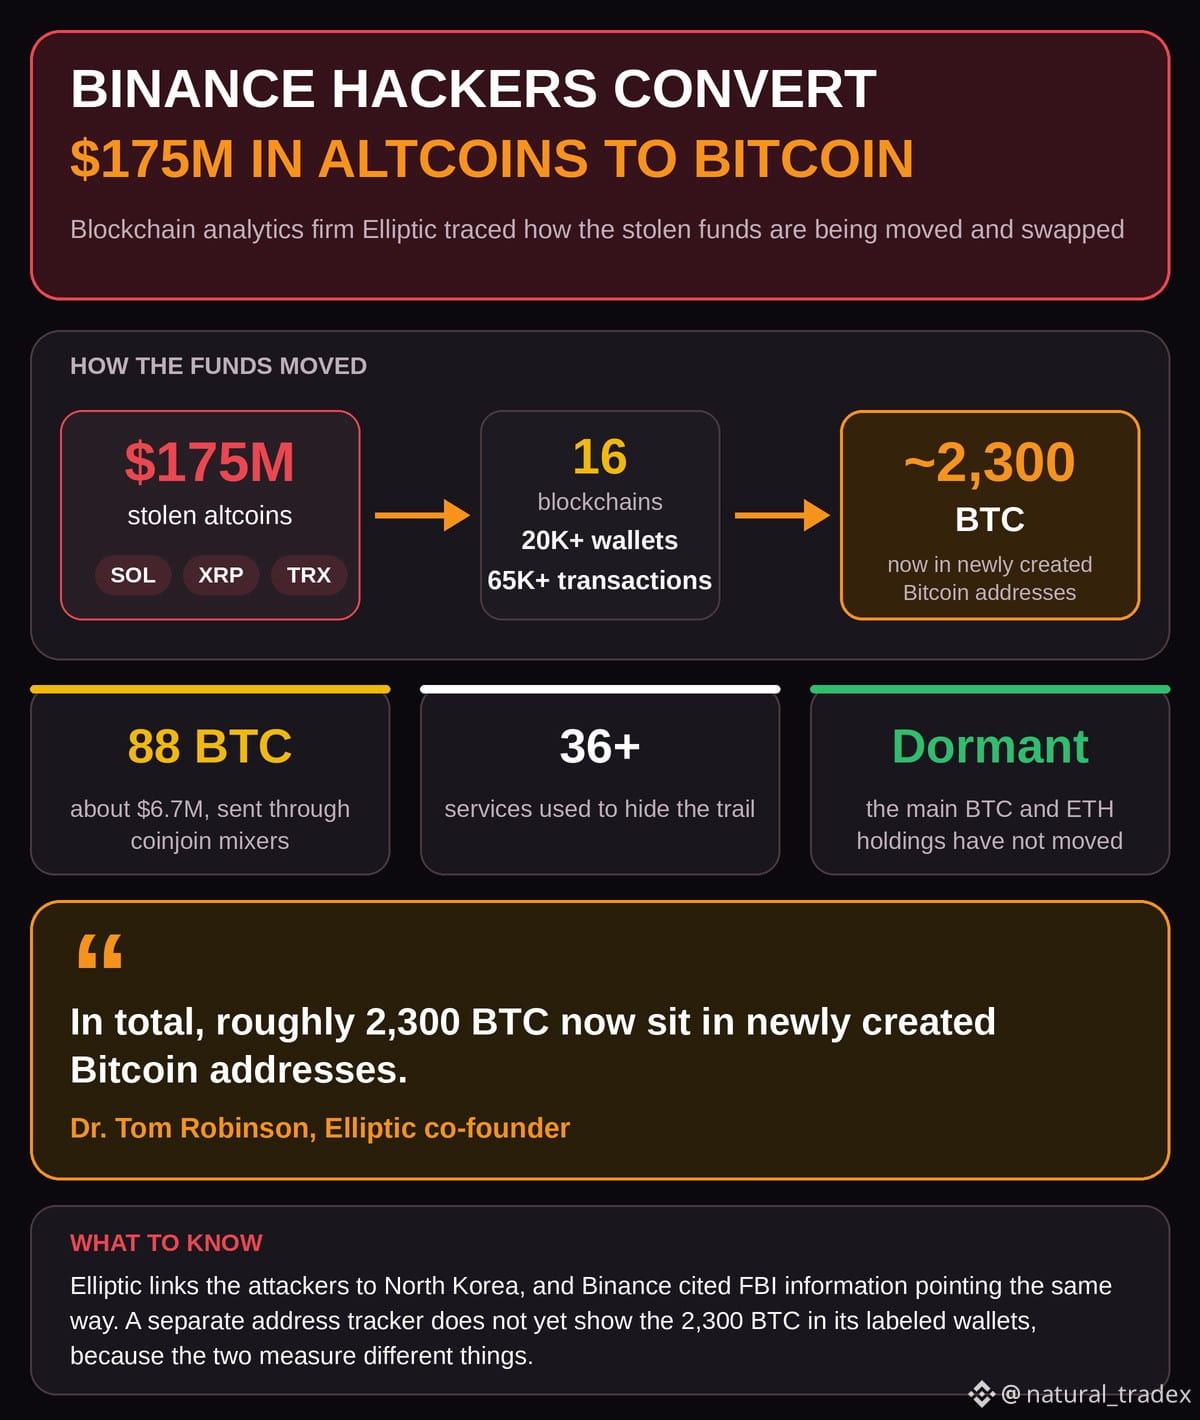
🕵️ Trail: here is where the stolen Binance funds are going now 🔍
📣 Elliptic has published a new update on the October hack. The attackers have converted about $175 million in stolen altcoins into roughly 2,300 $BTC C 💱
🗂️ KEY FACTS
✅ The coins were spread over 16 blockchains
✅ More than 20,000 wallets and 65,000 transactions were used
✅ About 88 BTC went through coinjoin mixers
✅ The main BTC and $ETH holdings are still dormant
💬 THE QUOTE
Dr. Tom Robinson, Elliptic's co-founder, said that in total roughly 2,300 BTC now sit in newly created Bitcoin addresses 🧾
🛡️ WHAT BINANCE USERS SHOULD KNOW
Binance has said user funds are safe and that it will cover the losses. This update is about where the attackers' coins are moving, not about user balances 🔐
🚨 STAY ALERT
Scammers love big news like this. Ignore any messages offering refunds or asking for your login codes, and use only official Binance channels for updates 🧠
🙋 Do you think investigators can freeze more of the stolen coins? Share below 👇
#Bitcoin #BinanceHack #BinanceSquare
🕵️ Trail: here is where the stolen Binance funds are going now 🔍
📣 Elliptic has published a new update on the October hack. The attackers have converted about $175 million in stolen altcoins into roughly 2,300 $BTC C 💱
🗂️ KEY FACTS
✅ The coins were spread over 16 blockchains
✅ More than 20,000 wallets and 65,000 transactions were used
✅ About 88 BTC went through coinjoin mixers
✅ The main BTC and $ETH holdings are still dormant
💬 THE QUOTE
Dr. Tom Robinson, Elliptic's co-founder, said that in total roughly 2,300 BTC now sit in newly created Bitcoin addresses 🧾
🛡️ WHAT BINANCE USERS SHOULD KNOW
Binance has said user funds are safe and that it will cover the losses. This update is about where the attackers' coins are moving, not about user balances 🔐
🚨 STAY ALERT
Scammers love big news like this. Ignore any messages offering refunds or asking for your login codes, and use only official Binance channels for updates 🧠
🙋 Do you think investigators can freeze more of the stolen coins? Share below 👇
#Bitcoin #BinanceHack #BinanceSquare
📣 Elliptic has published a new update on the October hack. The attackers have converted about $175 million in stolen altcoins into roughly 2,300 $BTC C 💱
🗂️ KEY FACTS
✅ The coins were spread over 16 blockchains
✅ More than 20,000 wallets and 65,000 transactions were used
✅ About 88 BTC went through coinjoin mixers
✅ The main BTC and $ETH holdings are still dormant
💬 THE QUOTE
Dr. Tom Robinson, Elliptic's co-founder, said that in total roughly 2,300 BTC now sit in newly created Bitcoin addresses 🧾
🛡️ WHAT BINANCE USERS SHOULD KNOW
Binance has said user funds are safe and that it will cover the losses. This update is about where the attackers' coins are moving, not about user balances 🔐
🚨 STAY ALERT
Scammers love big news like this. Ignore any messages offering refunds or asking for your login codes, and use only official Binance channels for updates 🧠
🙋 Do you think investigators can freeze more of the stolen coins? Share below 👇
#Bitcoin #BinanceHack #BinanceSquare

1
176
📜 History lesson: the median currency lasts just 33 years ⏳
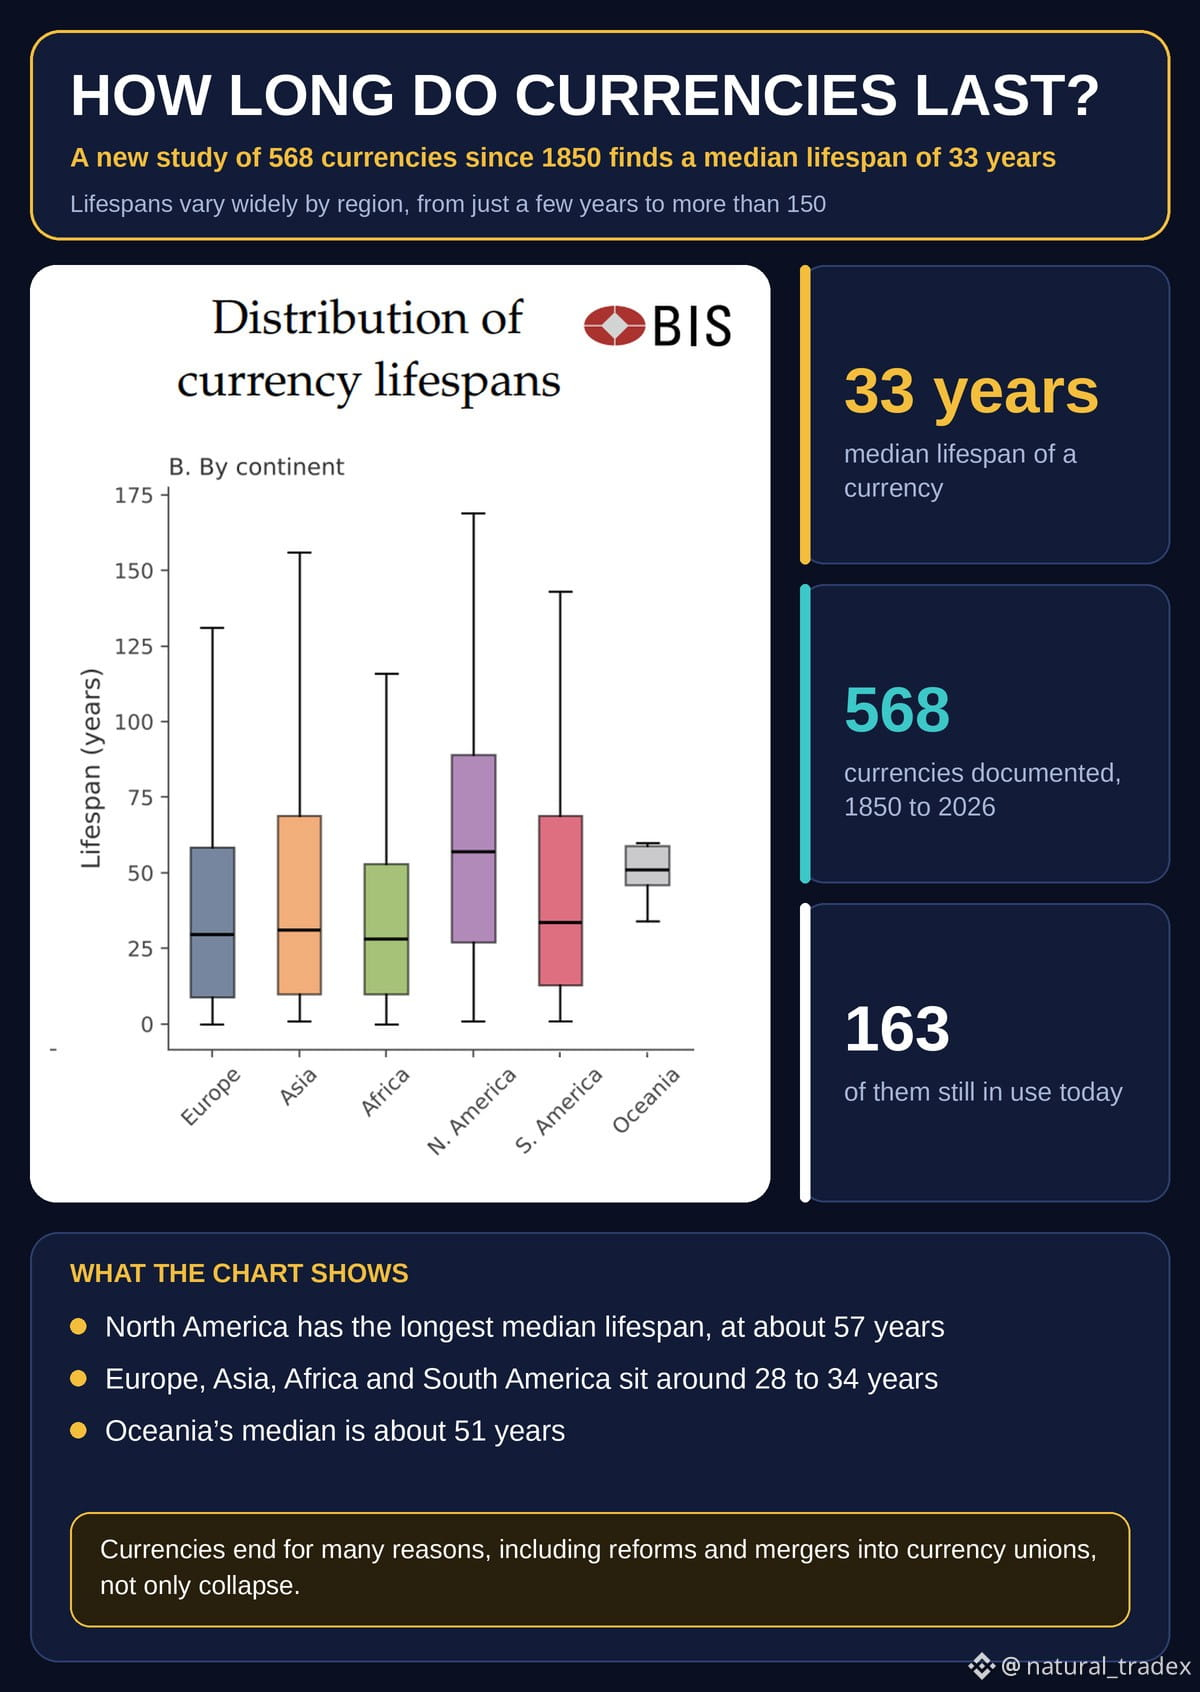
🧭 The Bank for International Settlements has published a database of 568 currencies from 1850 to 2026. Only 163 are still around, and the median lifespan is 33 years 📊
🔍 THE BIG PICTURE
✅ Lifespans vary a lot by region
✅ North America has the longest median, at about 57 years
✅ Europe, Asia, Africa and South America are closer to 28 to 34 years
✅ Some currencies lasted more than 150 years, while others ended within a few years
🧠 WHY THE NUMBER IS MISLEADING IF YOU STOP THERE
Currencies end for different reasons: hyperinflation, reforms and merging into currency unions are all counted. So a 33-year median does not mean any currency is about to disappear 🔄
🪙 WHY IT MATTERS TO CRYPTO
The story shows that money has changed many times in history. Today, $BTC and stablecoins are new experiments next to government currencies, and their long-term role is still being tested 🧪
🙋 Do you think money will look different in 20 years? Share below 👇
#Bitcoin #BIS #BinanceSquare
📜 History lesson: the median currency lasts just 33 years ⏳
🧭 The Bank for International Settlements has published a database of 568 currencies from 1850 to 2026. Only 163 are still around, and the median lifespan is 33 years 📊
🔍 THE BIG PICTURE
✅ Lifespans vary a lot by region
✅ North America has the longest median, at about 57 years
✅ Europe, Asia, Africa and South America are closer to 28 to 34 years
✅ Some currencies lasted more than 150 years, while others ended within a few years
🧠 WHY THE NUMBER IS MISLEADING IF YOU STOP THERE
Currencies end for different reasons: hyperinflation, reforms and merging into currency unions are all counted. So a 33-year median does not mean any currency is about to disappear 🔄
🪙 WHY IT MATTERS TO CRYPTO
The story shows that money has changed many times in history. Today, $BTC and stablecoins are new experiments next to government currencies, and their long-term role is still being tested 🧪
🙋 Do you think money will look different in 20 years? Share below 👇
#Bitcoin #BIS #BinanceSquare
🧭 The Bank for International Settlements has published a database of 568 currencies from 1850 to 2026. Only 163 are still around, and the median lifespan is 33 years 📊
🔍 THE BIG PICTURE
✅ Lifespans vary a lot by region
✅ North America has the longest median, at about 57 years
✅ Europe, Asia, Africa and South America are closer to 28 to 34 years
✅ Some currencies lasted more than 150 years, while others ended within a few years
🧠 WHY THE NUMBER IS MISLEADING IF YOU STOP THERE
Currencies end for different reasons: hyperinflation, reforms and merging into currency unions are all counted. So a 33-year median does not mean any currency is about to disappear 🔄
🪙 WHY IT MATTERS TO CRYPTO
The story shows that money has changed many times in history. Today, $BTC and stablecoins are new experiments next to government currencies, and their long-term role is still being tested 🧪
🙋 Do you think money will look different in 20 years? Share below 👇
#Bitcoin #BIS #BinanceSquare
1
172
📉 Red flag: Bitcoin trades at a discount on Coinbase 🇺🇸
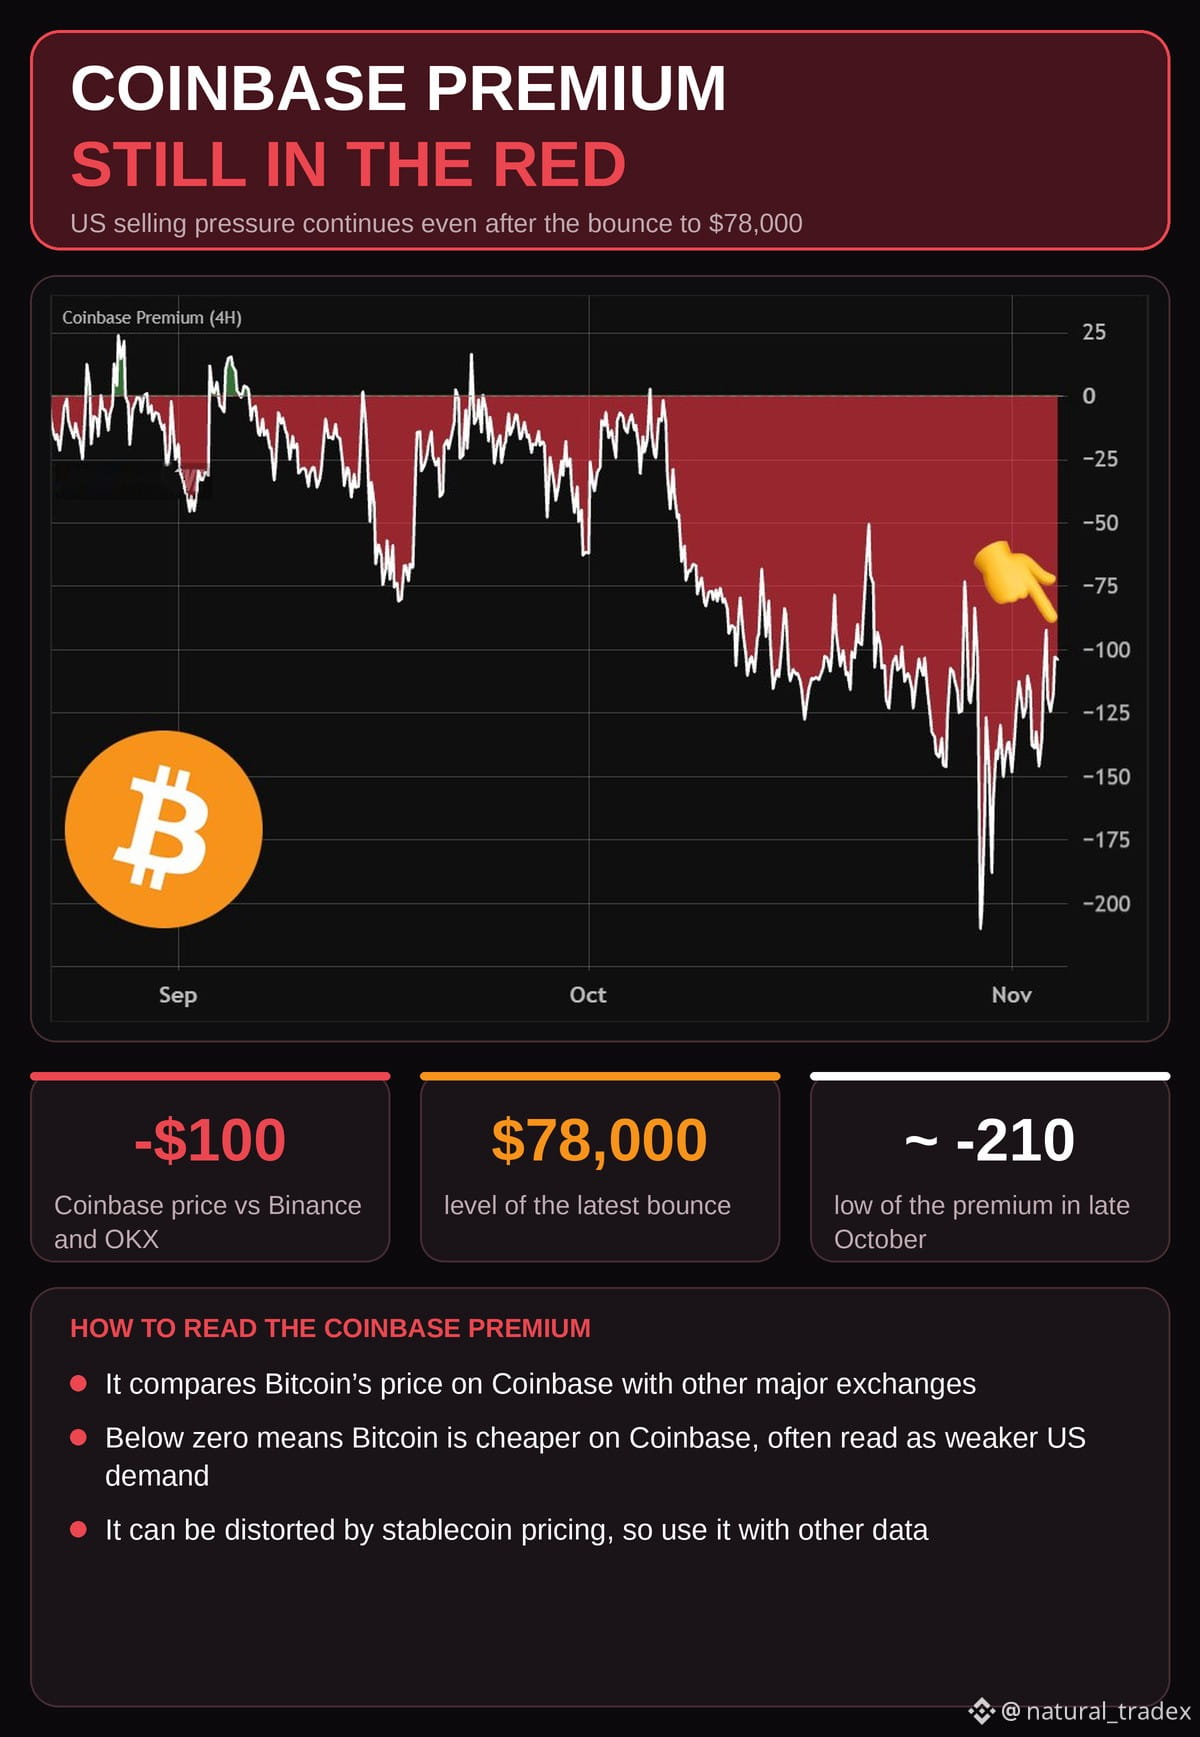
🔦 Even after $BTC TC bounced to $78,000, the Coinbase Premium chart is still deeply negative. Bitcoin on Coinbase was priced about $100 below Binance and OKX 💵
📌 THE KEY POINTS
✅ The premium has been negative for weeks
✅ It hit a low near -210 in late October
✅ It has recovered to about -100, but it is still well below zero
✅ A negative reading often means weaker US demand or heavier selling in the US
🧭 WHY IT MATTERS
US markets are a big source of demand for Bitcoin, including funds and institutions. When that demand fades, rallies can struggle to last, which is why traders watch this gauge 👀
⚠️ BUT REMEMBER
The reading can be affected by differences between dollar and stablecoin prices, so one chart does not tell the whole story. Look at several indicators before drawing a conclusion 🔬
🙋 Do you think US demand will come back soon? Share below 👇
#Bitcoin #CoinbasePremium #BinanceSquare
📉 Red flag: Bitcoin trades at a discount on Coinbase 🇺🇸
🔦 Even after $BTC TC bounced to $78,000, the Coinbase Premium chart is still deeply negative. Bitcoin on Coinbase was priced about $100 below Binance and OKX 💵
📌 THE KEY POINTS
✅ The premium has been negative for weeks
✅ It hit a low near -210 in late October
✅ It has recovered to about -100, but it is still well below zero
✅ A negative reading often means weaker US demand or heavier selling in the US
🧭 WHY IT MATTERS
US markets are a big source of demand for Bitcoin, including funds and institutions. When that demand fades, rallies can struggle to last, which is why traders watch this gauge 👀
⚠️ BUT REMEMBER
The reading can be affected by differences between dollar and stablecoin prices, so one chart does not tell the whole story. Look at several indicators before drawing a conclusion 🔬
🙋 Do you think US demand will come back soon? Share below 👇
#Bitcoin #CoinbasePremium #BinanceSquare
🔦 Even after $BTC TC bounced to $78,000, the Coinbase Premium chart is still deeply negative. Bitcoin on Coinbase was priced about $100 below Binance and OKX 💵
📌 THE KEY POINTS
✅ The premium has been negative for weeks
✅ It hit a low near -210 in late October
✅ It has recovered to about -100, but it is still well below zero
✅ A negative reading often means weaker US demand or heavier selling in the US
🧭 WHY IT MATTERS
US markets are a big source of demand for Bitcoin, including funds and institutions. When that demand fades, rallies can struggle to last, which is why traders watch this gauge 👀
⚠️ BUT REMEMBER
The reading can be affected by differences between dollar and stablecoin prices, so one chart does not tell the whole story. Look at several indicators before drawing a conclusion 🔬
🙋 Do you think US demand will come back soon? Share below 👇
#Bitcoin #CoinbasePremium #BinanceSquare
1
78
🚀 COULD THE NEXT 12 MONTHS BE BULLISH FOR BITCOIN?
Here's a historical pattern worth paying attention to!
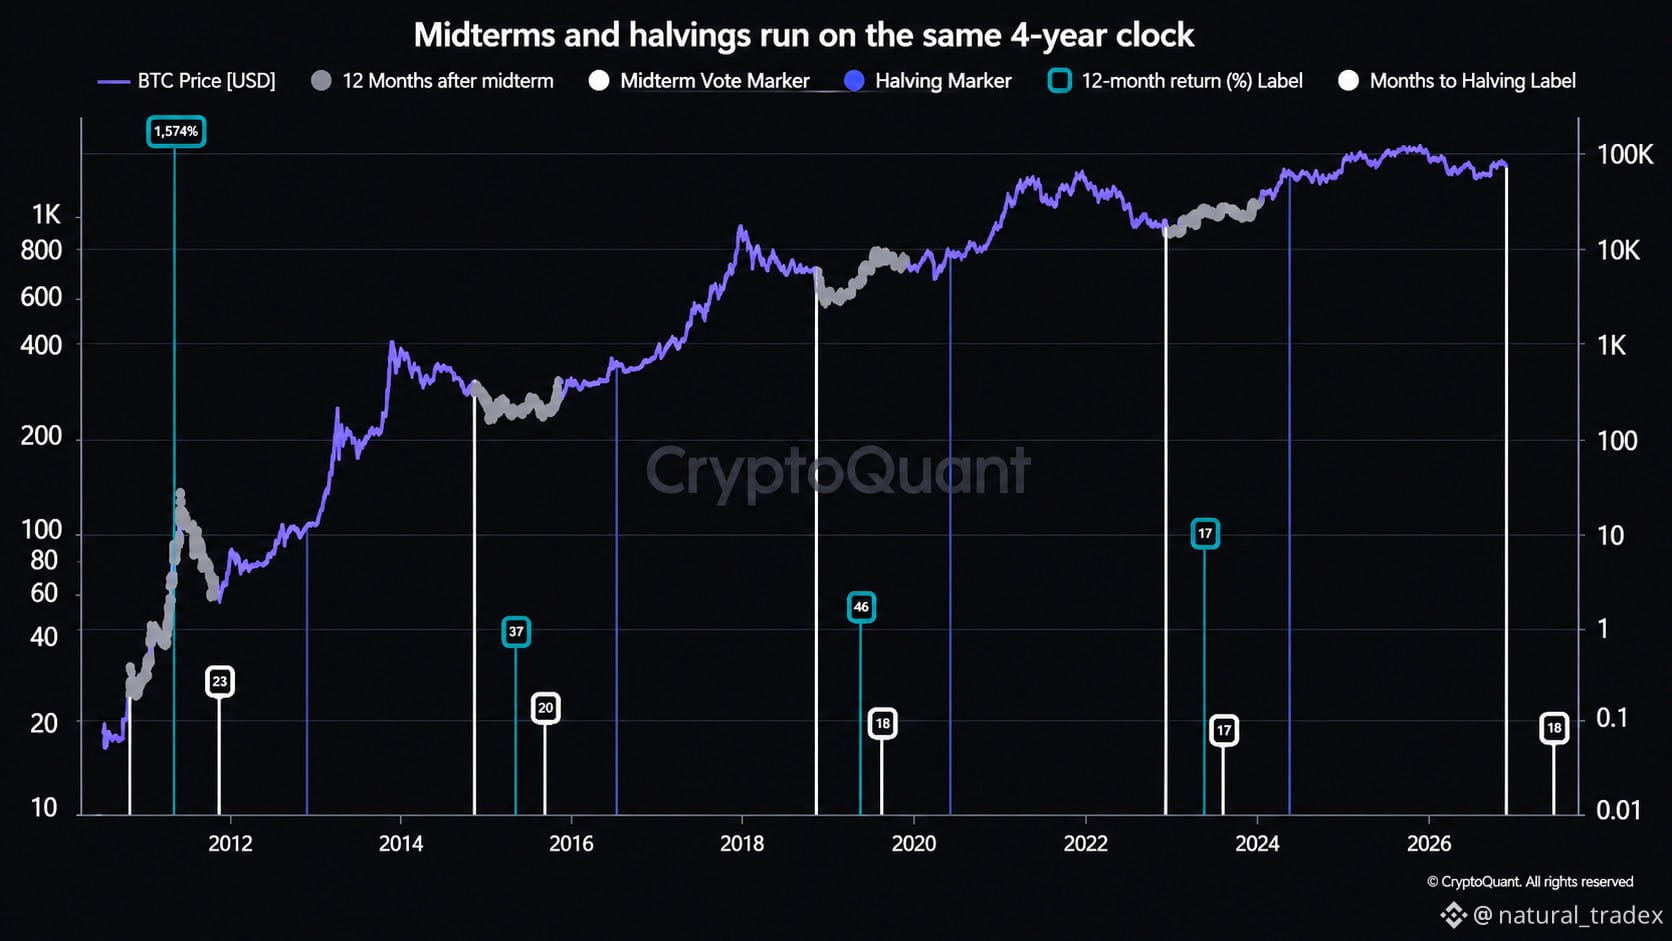
According to CryptoQuant, $BTC TC has moved higher during the 12 months after every U.S. midterm election since 2010.
What's interesting is how the U.S. election cycle and Bitcoin's four-year halving cycle overlap.
Could this combination create another opportunity for long-term Bitcoin investors?
Of course, history is not a guarantee. Market liquidity, economic conditions and investor demand still matter.
🔥 Will Bitcoin repeat its post-midterm performance this time?
#Bitcoin #BTC #Crypto
🚀 COULD THE NEXT 12 MONTHS BE BULLISH FOR BITCOIN?
Here's a historical pattern worth paying attention to!
According to CryptoQuant, $BTC TC has moved higher during the 12 months after every U.S. midterm election since 2010.
What's interesting is how the U.S. election cycle and Bitcoin's four-year halving cycle overlap.
Could this combination create another opportunity for long-term Bitcoin investors?
Of course, history is not a guarantee. Market liquidity, economic conditions and investor demand still matter.
🔥 Will Bitcoin repeat its post-midterm performance this time?
#Bitcoin #BTC #Crypto
Here's a historical pattern worth paying attention to!
According to CryptoQuant, $BTC TC has moved higher during the 12 months after every U.S. midterm election since 2010.
What's interesting is how the U.S. election cycle and Bitcoin's four-year halving cycle overlap.
Could this combination create another opportunity for long-term Bitcoin investors?
Of course, history is not a guarantee. Market liquidity, economic conditions and investor demand still matter.
🔥 Will Bitcoin repeat its post-midterm performance this time?
#Bitcoin #BTC #Crypto
1
152
🐋 CORPORATE BITCOIN ACCUMULATION IS GETTING INTERESTING!
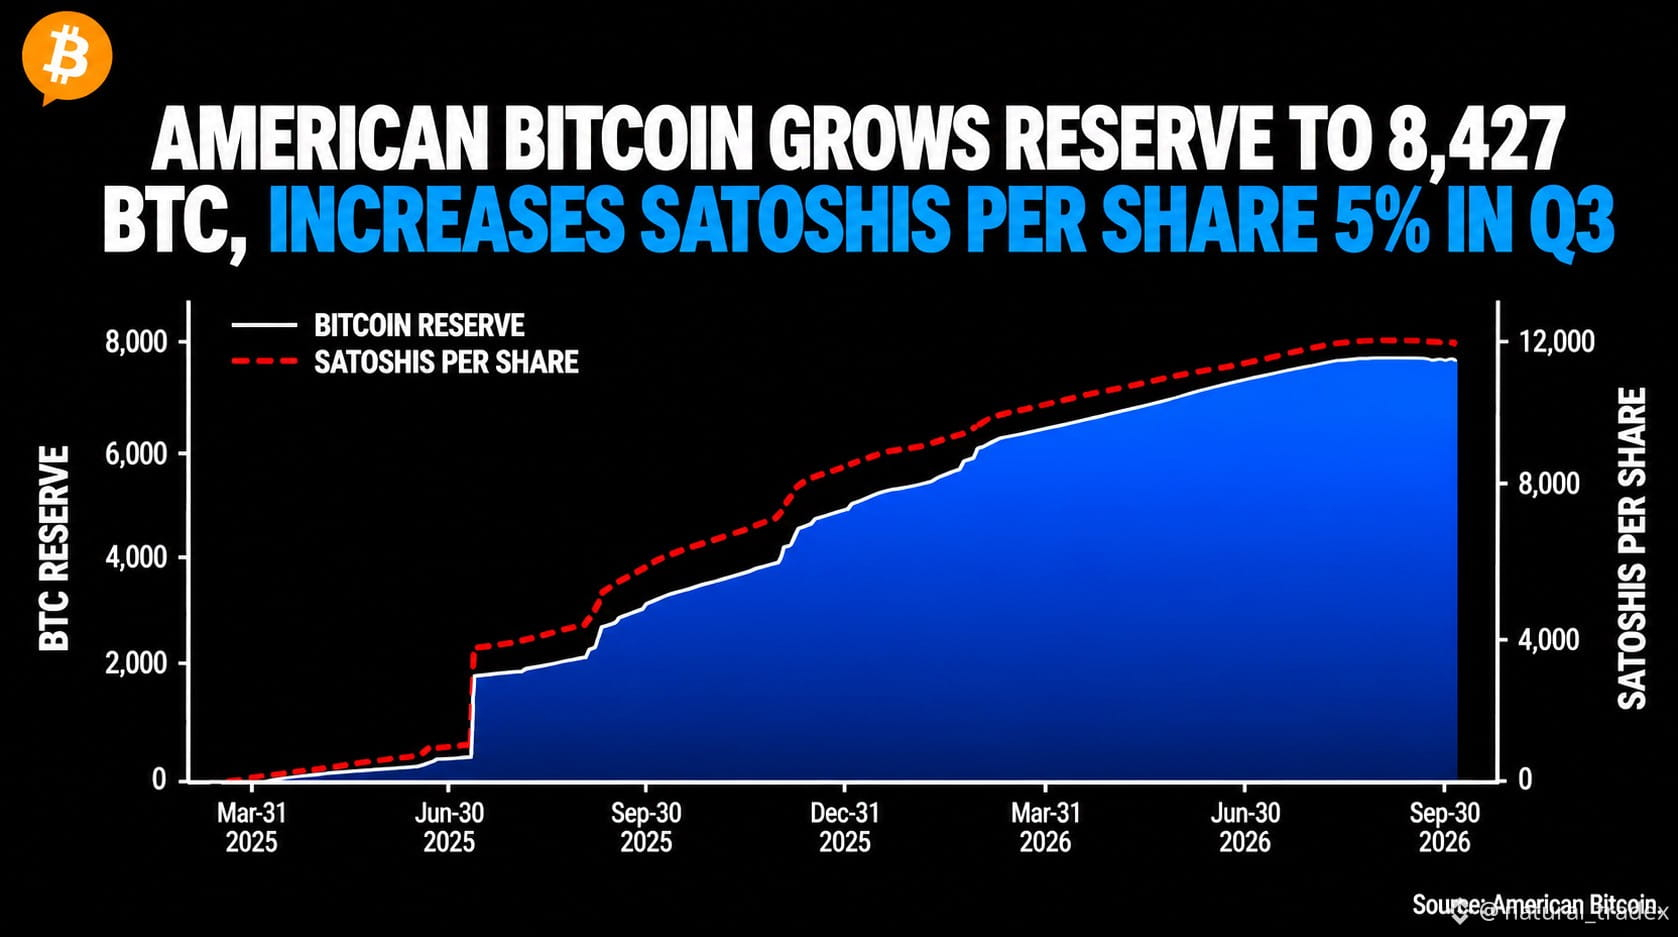
American Bitcoin's Q3 figures reveal a company continuing to build its Bitcoin position.
But there's something investors should pay attention to:
It's not just about how much Bitcoin a company owns. It's also about how much Bitcoin exposure each share represents.
American Bitcoin reported:
🔥 8,427 BTC in reserves ⛏️ 891 BTC mined in Q3 📈 5% growth in satoshis per share 💰 $126M net income 🚀 $221M adjusted EBITDA
With corporate Bitcoin strategies attracting more attention, this is definitely a development worth watching.
Would you invest in a company whose strategy revolves around accumulating Bitcoin?
$BTC TC #Bitcoin #CryptoInvesting
🐋 CORPORATE BITCOIN ACCUMULATION IS GETTING INTERESTING!
American Bitcoin's Q3 figures reveal a company continuing to build its Bitcoin position.
But there's something investors should pay attention to:
It's not just about how much Bitcoin a company owns. It's also about how much Bitcoin exposure each share represents.
American Bitcoin reported:
🔥 8,427 BTC in reserves ⛏️ 891 BTC mined in Q3 📈 5% growth in satoshis per share 💰 $126M net income 🚀 $221M adjusted EBITDA
With corporate Bitcoin strategies attracting more attention, this is definitely a development worth watching.
Would you invest in a company whose strategy revolves around accumulating Bitcoin?
$BTC TC #Bitcoin #CryptoInvesting
American Bitcoin's Q3 figures reveal a company continuing to build its Bitcoin position.
But there's something investors should pay attention to:
It's not just about how much Bitcoin a company owns. It's also about how much Bitcoin exposure each share represents.
American Bitcoin reported:
🔥 8,427 BTC in reserves ⛏️ 891 BTC mined in Q3 📈 5% growth in satoshis per share 💰 $126M net income 🚀 $221M adjusted EBITDA
With corporate Bitcoin strategies attracting more attention, this is definitely a development worth watching.
Would you invest in a company whose strategy revolves around accumulating Bitcoin?
$BTC TC #Bitcoin #CryptoInvesting
1
70
·
--
Bearish
🚨 WHEN BITCOIN FALLS AND NASDAQ FALLS TOO, EVERYONE STARTS WATCHING!
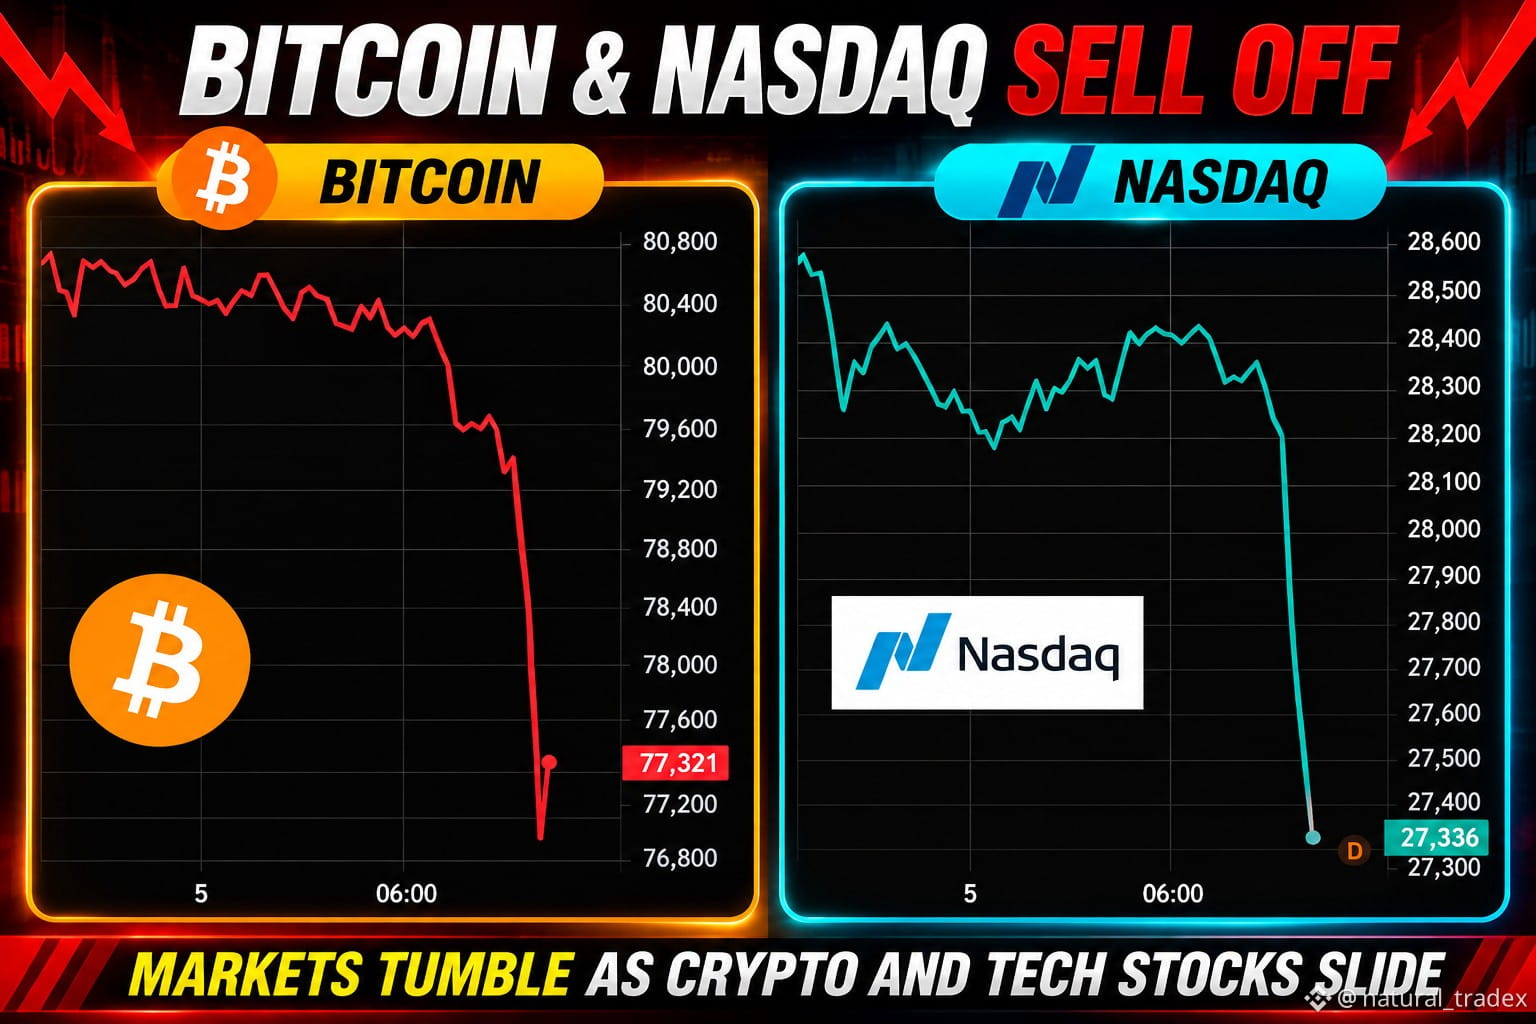
The charts show a sharp decline in both markets, with $BTC C around $77,321 and Nasdaq around 27,336 in this snapshot.
This is a reminder that crypto doesn't always move independently of traditional financial markets.
Investors are watching liquidity, risk appetite and whether buyers will step in after the sell-off.
But remember: a sharp drop doesn't automatically mean the bottom is in.
🔥 What's your move?
BUY THE DIP or WAIT FOR CONFIRMATION?
$BTC #Bitcoin #Nasdaq #Crypto
🚨 WHEN BITCOIN FALLS AND NASDAQ FALLS TOO, EVERYONE STARTS WATCHING!
The charts show a sharp decline in both markets, with $BTC C around $77,321 and Nasdaq around 27,336 in this snapshot.
This is a reminder that crypto doesn't always move independently of traditional financial markets.
Investors are watching liquidity, risk appetite and whether buyers will step in after the sell-off.
But remember: a sharp drop doesn't automatically mean the bottom is in.
🔥 What's your move?
BUY THE DIP or WAIT FOR CONFIRMATION?
$BTC #Bitcoin #Nasdaq #Crypto
The charts show a sharp decline in both markets, with $BTC C around $77,321 and Nasdaq around 27,336 in this snapshot.
This is a reminder that crypto doesn't always move independently of traditional financial markets.
Investors are watching liquidity, risk appetite and whether buyers will step in after the sell-off.
But remember: a sharp drop doesn't automatically mean the bottom is in.
🔥 What's your move?
BUY THE DIP or WAIT FOR CONFIRMATION?
$BTC #Bitcoin #Nasdaq #Crypto
1
171
🚀 “WE'RE BACK!” — MICHAEL SAYLOR
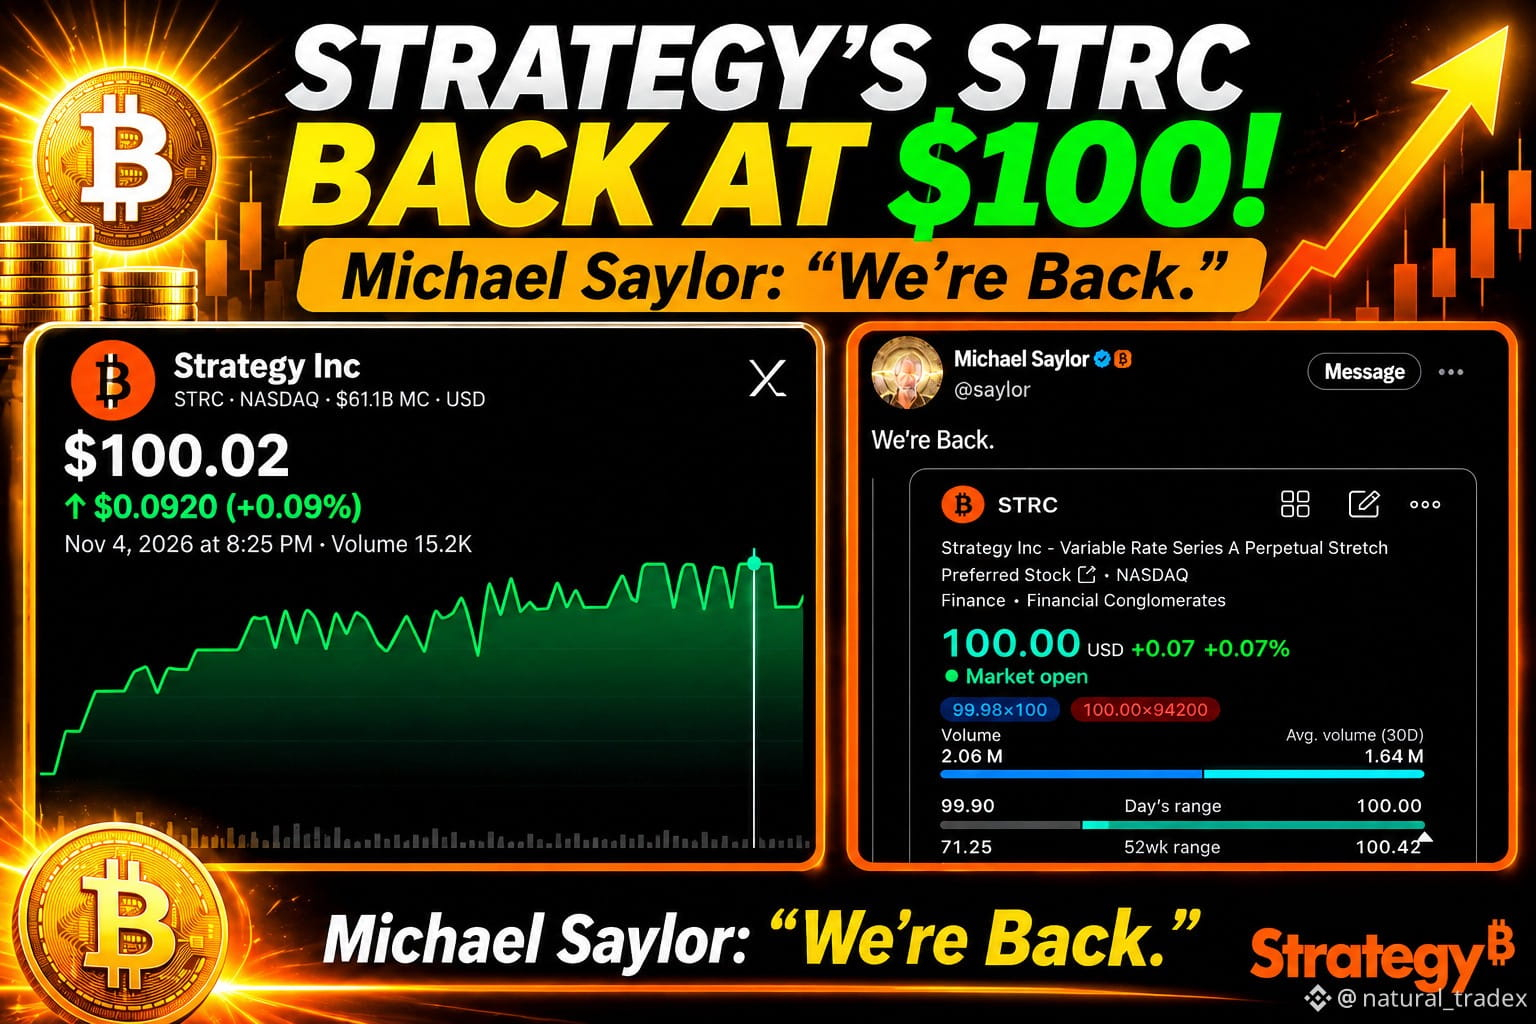
Strategy's $STRC is trading around $100.02, according to the screenshot.
Here's what stands out:
🟢 STRC price: $100.02
📈 Daily change: +0.09%
🏢 Strategy Inc.
Saylor's short message has sparked attention. Strategy continues to be one of the most closely watched companies in the Bitcoin market.
Is this a bullish signal for Strategy investors? 👀
#Bitcoin #STRC #Crypto $BTC
🚀 “WE'RE BACK!” — MICHAEL SAYLOR
Strategy's $STRC is trading around $100.02, according to the screenshot.
Here's what stands out:
🟢 STRC price: $100.02
📈 Daily change: +0.09%
🏢 Strategy Inc.
Saylor's short message has sparked attention. Strategy continues to be one of the most closely watched companies in the Bitcoin market.
Is this a bullish signal for Strategy investors? 👀
#Bitcoin #STRC #Crypto $BTC
Strategy's $STRC is trading around $100.02, according to the screenshot.
Here's what stands out:
🟢 STRC price: $100.02
📈 Daily change: +0.09%
🏢 Strategy Inc.
Saylor's short message has sparked attention. Strategy continues to be one of the most closely watched companies in the Bitcoin market.
Is this a bullish signal for Strategy investors? 👀
#Bitcoin #STRC #Crypto $BTC
1
137
📢 A REMINDER THAT EVEN BILLIONAIRES CAN GET IT WRONG!
Warren Buffett reportedly dismissed Bitcoin in March 2014 when $BTC C was trading around $614.
His famous words?
“The idea that Bitcoin has intrinsic value is a joke.”
Bitcoin supporters have spent years challenging that view as adoption, institutional interest, and global recognition have grown. 🚀
Imagine having the conviction to buy $BTC at $614!
Would you have believed in Bitcoin back then? 👇
#Bitcoin #BTC #Crypto
📢 A REMINDER THAT EVEN BILLIONAIRES CAN GET IT WRONG!
Warren Buffett reportedly dismissed Bitcoin in March 2014 when $BTC C was trading around $614.
His famous words?
“The idea that Bitcoin has intrinsic value is a joke.”
Bitcoin supporters have spent years challenging that view as adoption, institutional interest, and global recognition have grown. 🚀
Imagine having the conviction to buy $BTC at $614!
Would you have believed in Bitcoin back then? 👇
#Bitcoin #BTC #Crypto
Warren Buffett reportedly dismissed Bitcoin in March 2014 when $BTC C was trading around $614.
His famous words?
“The idea that Bitcoin has intrinsic value is a joke.”
Bitcoin supporters have spent years challenging that view as adoption, institutional interest, and global recognition have grown. 🚀
Imagine having the conviction to buy $BTC at $614!
Would you have believed in Bitcoin back then? 👇
#Bitcoin #BTC #Crypto

101
🏛️ Milestone: the US national debt has passed $40 trillion 💥
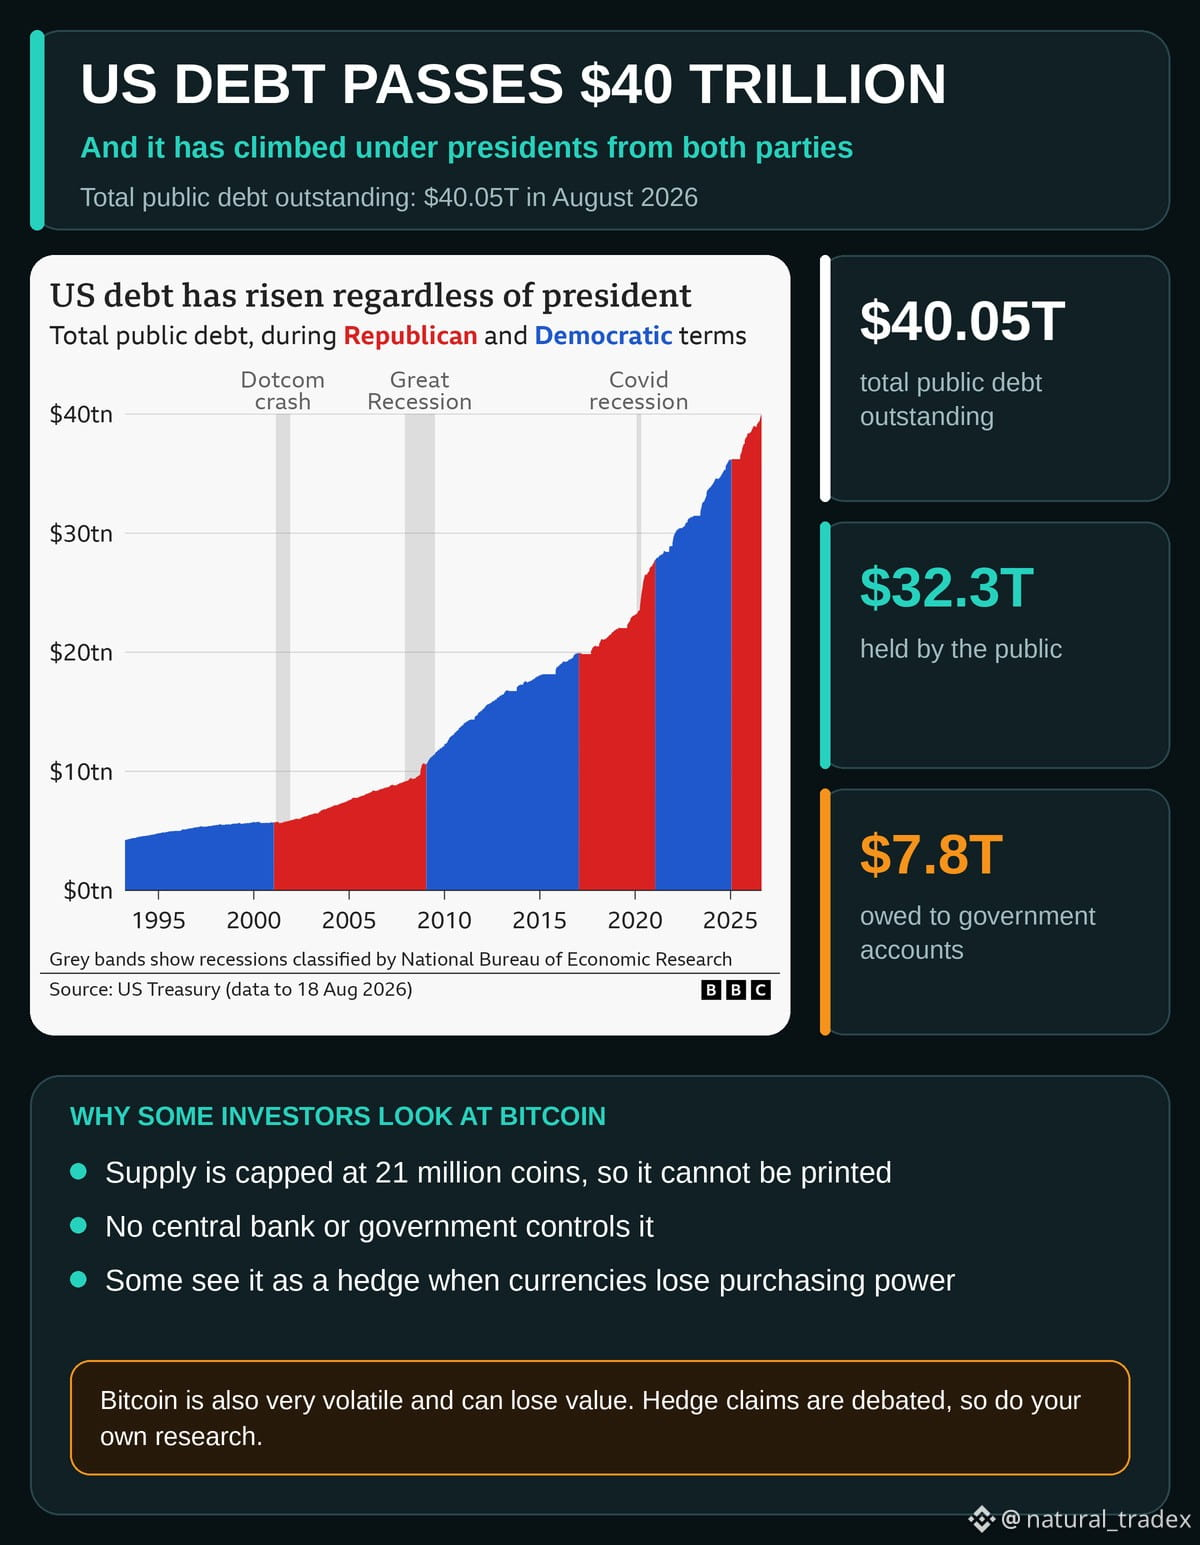
🔎 The latest Treasury figures show total public debt at about $40.05 trillion. About $32.3 trillion is held by the public, and about $7.8 trillion is owed to government accounts 🗂️
📈 WHAT THE CHART TELLS US
Debt has climbed under presidents of both parties, and it has risen faster in recent years. In just five months it went from $39 trillion to $40 trillion 🚀
🪙 WHY BITCOIN COMES UP
Because $BTC C has a fixed supply of 21 million coins and is not run by any central bank, some people see it as a possible hedge against currency debasement. Others see it as a risky, volatile asset that behaves more like tech stocks than gold 🧭
📌 KEEP IN MIND
✅ A big debt number does not mean any specific price move for Bitcoin
✅ Hedge claims are debated by economists
✅ Diversify, size positions carefully and avoid money you cannot afford to lose
🙋 Is Bitcoin a hedge against debt, or just another risk asset? Share your view below 👇
#Bitcoin #USDebt #BinanceSquare
🏛️ Milestone: the US national debt has passed $40 trillion 💥
🔎 The latest Treasury figures show total public debt at about $40.05 trillion. About $32.3 trillion is held by the public, and about $7.8 trillion is owed to government accounts 🗂️
📈 WHAT THE CHART TELLS US
Debt has climbed under presidents of both parties, and it has risen faster in recent years. In just five months it went from $39 trillion to $40 trillion 🚀
🪙 WHY BITCOIN COMES UP
Because $BTC C has a fixed supply of 21 million coins and is not run by any central bank, some people see it as a possible hedge against currency debasement. Others see it as a risky, volatile asset that behaves more like tech stocks than gold 🧭
📌 KEEP IN MIND
✅ A big debt number does not mean any specific price move for Bitcoin
✅ Hedge claims are debated by economists
✅ Diversify, size positions carefully and avoid money you cannot afford to lose
🙋 Is Bitcoin a hedge against debt, or just another risk asset? Share your view below 👇
#Bitcoin #USDebt #BinanceSquare
🔎 The latest Treasury figures show total public debt at about $40.05 trillion. About $32.3 trillion is held by the public, and about $7.8 trillion is owed to government accounts 🗂️
📈 WHAT THE CHART TELLS US
Debt has climbed under presidents of both parties, and it has risen faster in recent years. In just five months it went from $39 trillion to $40 trillion 🚀
🪙 WHY BITCOIN COMES UP
Because $BTC C has a fixed supply of 21 million coins and is not run by any central bank, some people see it as a possible hedge against currency debasement. Others see it as a risky, volatile asset that behaves more like tech stocks than gold 🧭
📌 KEEP IN MIND
✅ A big debt number does not mean any specific price move for Bitcoin
✅ Hedge claims are debated by economists
✅ Diversify, size positions carefully and avoid money you cannot afford to lose
🙋 Is Bitcoin a hedge against debt, or just another risk asset? Share your view below 👇
#Bitcoin #USDebt #BinanceSquare
1
251
·
--
Bearish
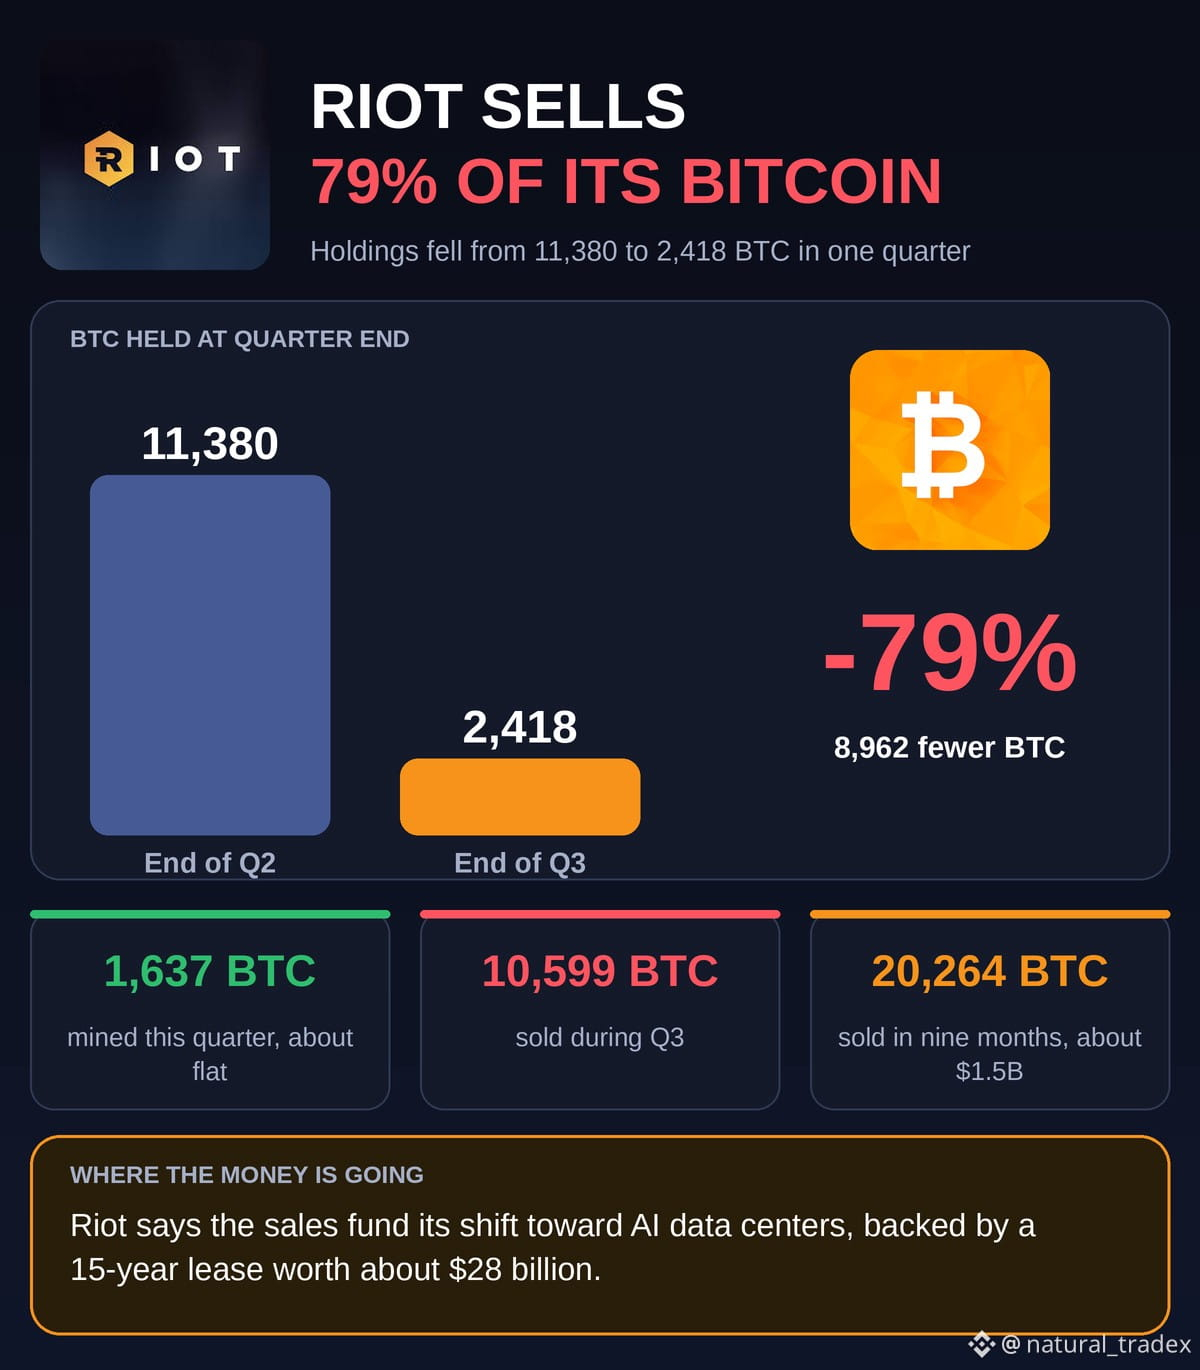
🔄 Pivot: Riot sells most of its Bitcoin to build AI data centers 🏭
📊 Riot's $BTC C holdings fell from 11,380 to 2,418 in Q3, a drop of about 79%. Mining output stayed flat at 1,637 BTC, while sales reached 10,599 BTC and about 20,264 BTC over nine months 💵
🧠 The proceeds are going toward data center growth, a sign that some miners are changing their business model 🔧
🙋 Is this good or bad for Bitcoin? Share your view below 👇
#Bitcoin #BitcoinMining #BinanceSquare
🔄 Pivot: Riot sells most of its Bitcoin to build AI data centers 🏭
📊 Riot's $BTC C holdings fell from 11,380 to 2,418 in Q3, a drop of about 79%. Mining output stayed flat at 1,637 BTC, while sales reached 10,599 BTC and about 20,264 BTC over nine months 💵
🧠 The proceeds are going toward data center growth, a sign that some miners are changing their business model 🔧
🙋 Is this good or bad for Bitcoin? Share your view below 👇
#Bitcoin #BitcoinMining #BinanceSquare
📊 Riot's $BTC C holdings fell from 11,380 to 2,418 in Q3, a drop of about 79%. Mining output stayed flat at 1,637 BTC, while sales reached 10,599 BTC and about 20,264 BTC over nine months 💵
🧠 The proceeds are going toward data center growth, a sign that some miners are changing their business model 🔧
🙋 Is this good or bad for Bitcoin? Share your view below 👇
#Bitcoin #BitcoinMining #BinanceSquare
BTC-2.89%
RIOTUS-2.50%
1
131
Log in to explore more content
Join global crypto users on Binance Square
⚡️ Get latest and useful information about crypto.
💬 Trusted by the world’s largest crypto exchange.
👍 Discover real insights from verified creators.
Email / Phone number
Trending Topics
HuangExitNvidiaStrategyInFocus
1,294 views
140 Discussing
STOCKS | Nvidia’s Jensen Huang Resigns, Colette Kress Named as Interim CEO
Binance News
·2 Likes
·4.9k views
AnthropicRejectsIPODelayValuationinQuestion
556,623 views
4,588 Discussing
BitMineReports$6.3BNetLossForFiscal2026
1,141 views
52 Discussing