

Freeman Sevick Rjlr
304 Posts

Freeman Sevick Rjlr
Report
Block User
49 Following
39 Followers
12 Liked
Posts
⬇️ Just now: RootData: GMT will unlock approximately $2.43 million worth of tokens in one week
My first reaction upon seeing this: worth a closer look, but stay calm! Negative news can hit suddenly, and the market’s initial reaction is often an overreaction. Staying calm matters more than anything.
$GMT Latest 0.00645 (24h -3.59%)
⬇️ Just now: RootData: GMT will unlock approximately $2.43 million worth of tokens in one week
My first reaction upon seeing this: worth a closer look, but stay calm! Negative news can hit suddenly, and the market’s initial reaction is often an overreaction. Staying calm matters more than anything.
$GMT Latest 0.00645 (24h -3.59%)
My first reaction upon seeing this: worth a closer look, but stay calm! Negative news can hit suddenly, and the market’s initial reaction is often an overreaction. Staying calm matters more than anything.
$GMT Latest 0.00645 (24h -3.59%)
4
This is getting a bit exciting now!
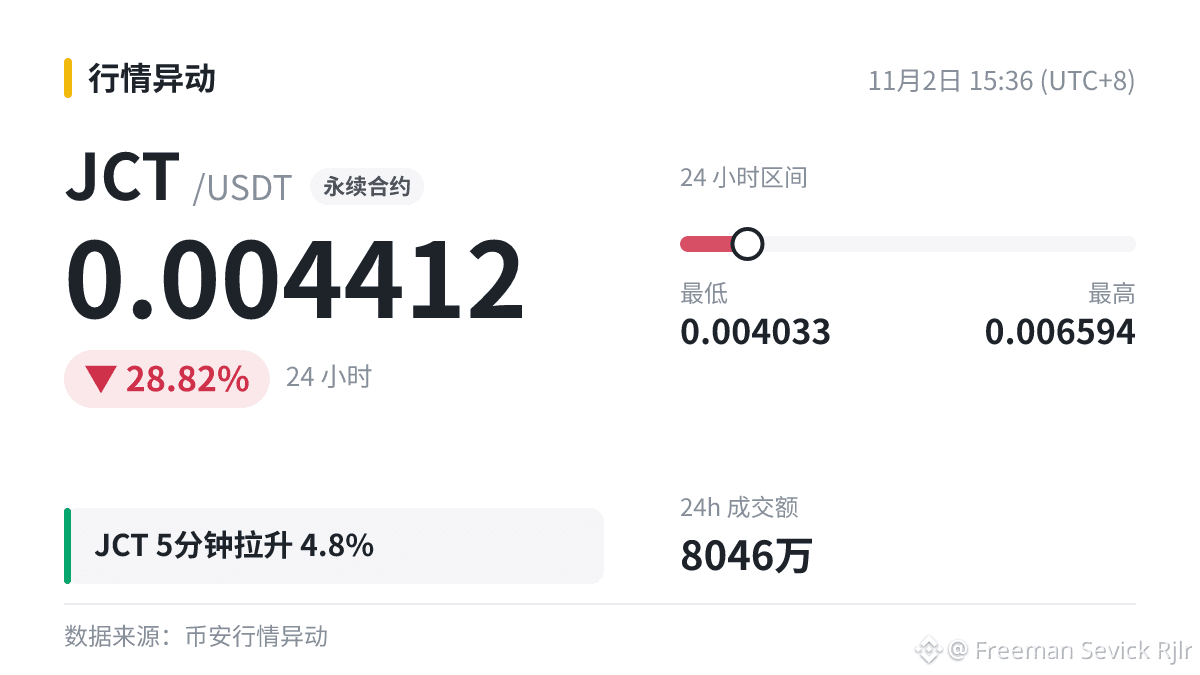
$JCT 5 minutes and it shot up directly by +4.8%📈🆙
Current price is 0.004412, are the shorts still alive?
Volume is starting to come in; after a pump there’s usually some divergence, and only a pullback reveals the real picture. Chase it or not?
This is getting a bit exciting now!
$JCT 5 minutes and it shot up directly by +4.8%📈🆙
Current price is 0.004412, are the shorts still alive?
Volume is starting to come in; after a pump there’s usually some divergence, and only a pullback reveals the real picture. Chase it or not?
$JCT 5 minutes and it shot up directly by +4.8%📈🆙
Current price is 0.004412, are the shorts still alive?
Volume is starting to come in; after a pump there’s usually some divergence, and only a pullback reveals the real picture. Chase it or not?
1
229
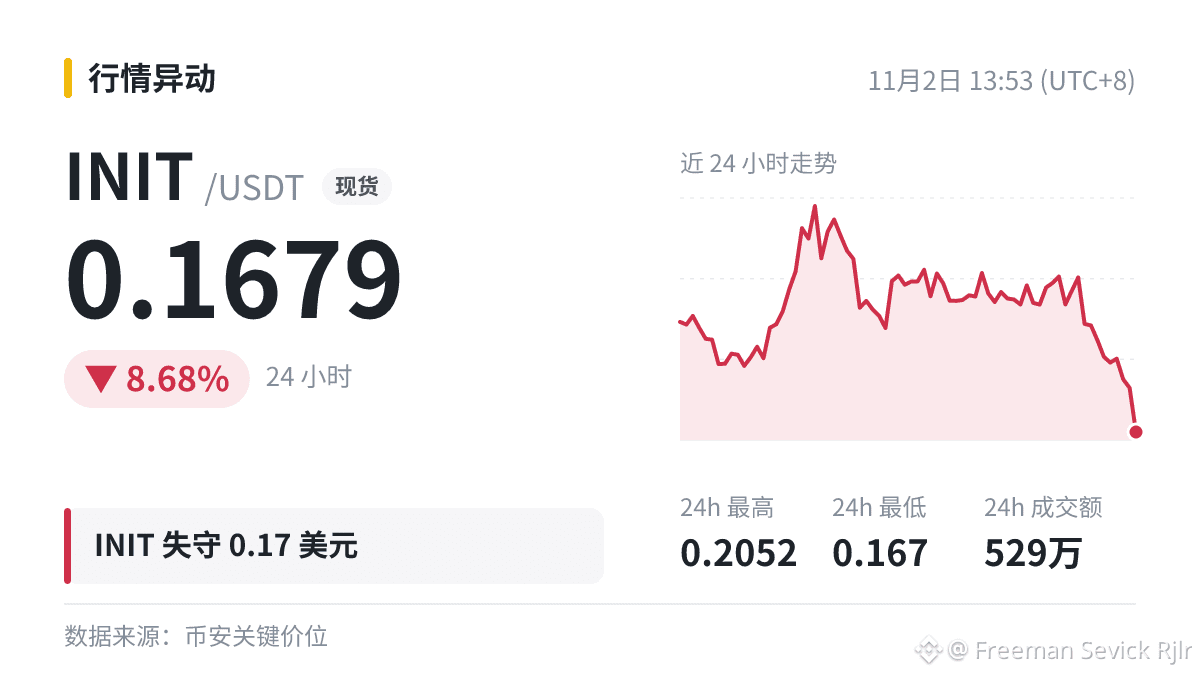
Key level breached: $INIT has fallen below 0.17.
It’ll be easier to draw a conclusion after trading volume contracts. If you agree, comment 1.
Key level breached: $INIT has fallen below 0.17.
It’ll be easier to draw a conclusion after trading volume contracts. If you agree, comment 1.
It’ll be easier to draw a conclusion after trading volume contracts. If you agree, comment 1.
105
News: Leung Fung-yee plans to develop a cybersecurity framework for licensed institutions.
$BTC 78542.55, my approach: first watch whether the volume follows.
News: Leung Fung-yee plans to develop a cybersecurity framework for licensed institutions.
$BTC 78542.55, my approach: first watch whether the volume follows.
$BTC 78542.55, my approach: first watch whether the volume follows.
29
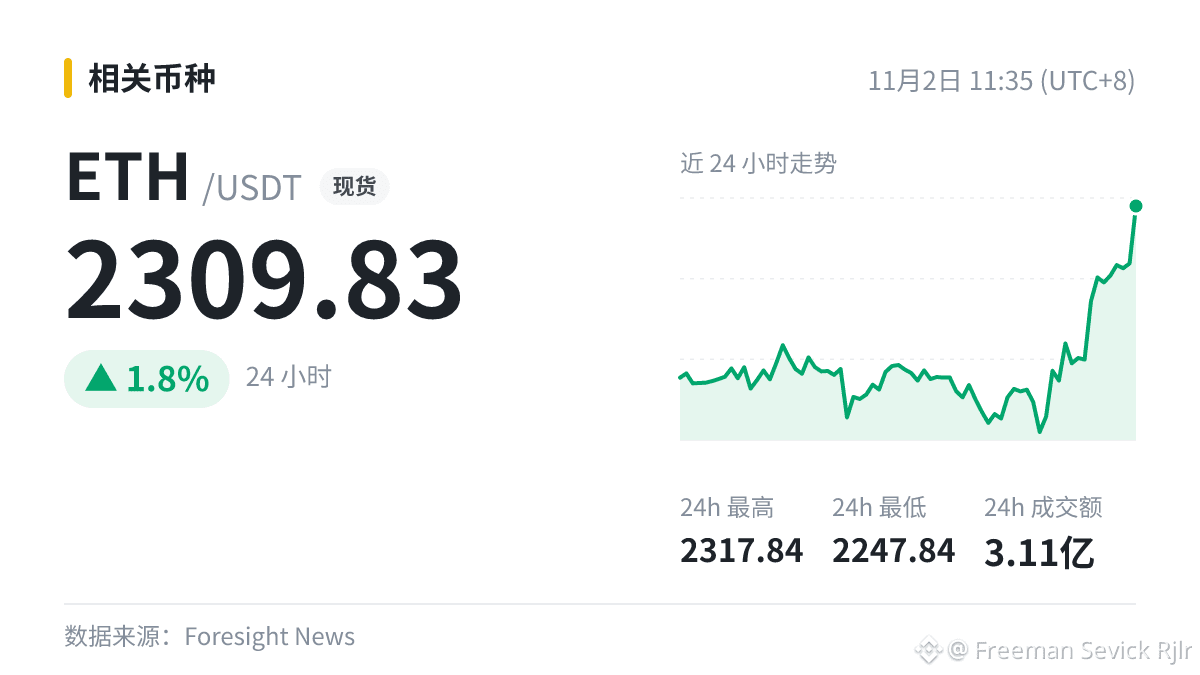
Guys, check this out: Ethereum breaks above 2,300 USDT
With this bullish news, I’m more interested in whether buyers will step in strongly during a pullback. My first reaction: there’s potential, but let’s stay calm!
$ETH Up 1.8% today—how do you interpret this?
Guys, check this out: Ethereum breaks above 2,300 USDT
With this bullish news, I’m more interested in whether buyers will step in strongly during a pullback. My first reaction: there’s potential, but let’s stay calm!
$ETH Up 1.8% today—how do you interpret this?
With this bullish news, I’m more interested in whether buyers will step in strongly during a pullback. My first reaction: there’s potential, but let’s stay calm!
$ETH Up 1.8% today—how do you interpret this?
145
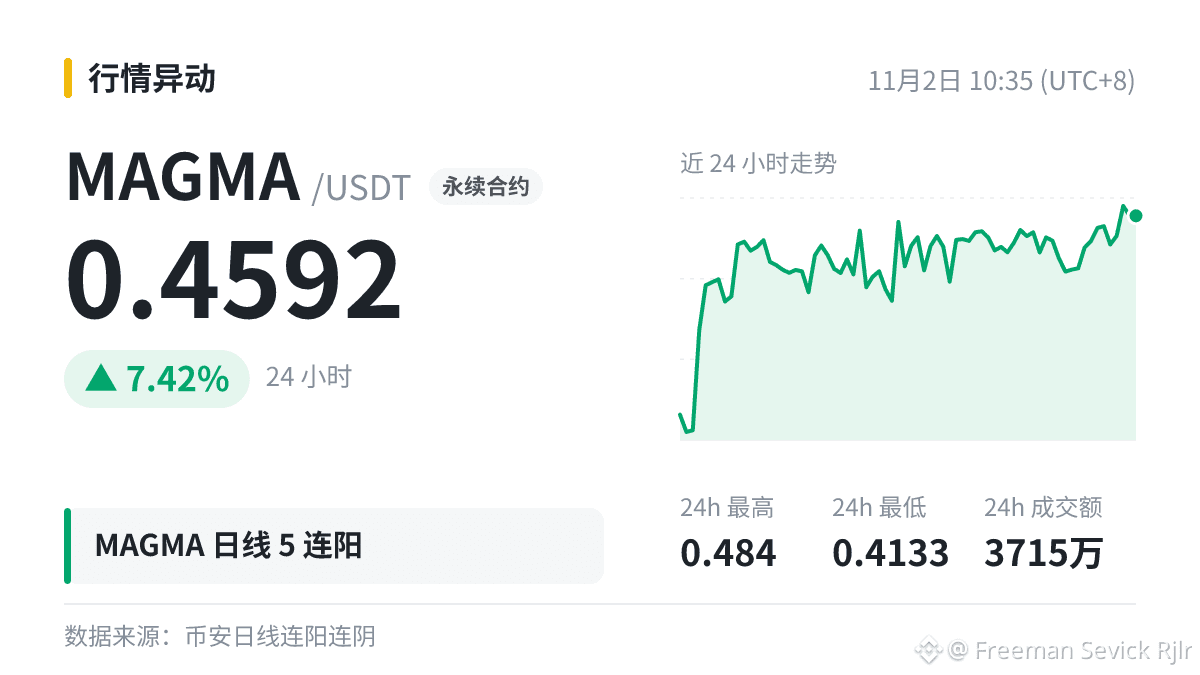
$MAGMA The daily chart has had 5 consecutive bullish candles, gaining a total of +77.56% over that period, and is up +0.93% so far today.
Let’s use these figures to talk about consecutive bullish candles on the daily chart.
Consecutive bullish or bearish candles simply record the direction of a series of candlesticks, without considering the size of each candle’s body: several small bullish candles and several large bullish candles carry very different weight.
When trading volume steadily increases over a run of consecutive candles, it is often taken to mean that buyers are continuing to come in; gradually shrinking volume is often seen as a sign that fewer funds are following through.
Learning to read indicators isn’t hard. The hard part is sticking to your plan even when the market is at its most exciting.
$MAGMA The daily chart has had 5 consecutive bullish candles, gaining a total of +77.56% over that period, and is up +0.93% so far today.
Let’s use these figures to talk about consecutive bullish candles on the daily chart.
Consecutive bullish or bearish candles simply record the direction of a series of candlesticks, without considering the size of each candle’s body: several small bullish candles and several large bullish candles carry very different weight.
When trading volume steadily increases over a run of consecutive candles, it is often taken to mean that buyers are continuing to come in; gradually shrinking volume is often seen as a sign that fewer funds are following through.
Learning to read indicators isn’t hard. The hard part is sticking to your plan even when the market is at its most exciting.
Let’s use these figures to talk about consecutive bullish candles on the daily chart.
Consecutive bullish or bearish candles simply record the direction of a series of candlesticks, without considering the size of each candle’s body: several small bullish candles and several large bullish candles carry very different weight.
When trading volume steadily increases over a run of consecutive candles, it is often taken to mean that buyers are continuing to come in; gradually shrinking volume is often seen as a sign that fewer funds are following through.
Learning to read indicators isn’t hard. The hard part is sticking to your plan even when the market is at its most exciting.
1
201
🔔 Buzz on the forum: #研究称CircleAI代理钱包限额可被绕过
$BTC is worth keeping an eye on. Seeing whether the discussion lasts two or three days is far more useful than a brief spike in popularity. Leave a comment and share your thoughts.
🔔 Buzz on the forum: #研究称CircleAI代理钱包限额可被绕过
$BTC is worth keeping an eye on. Seeing whether the discussion lasts two or three days is far more useful than a brief spike in popularity. Leave a comment and share your thoughts.
$BTC is worth keeping an eye on. Seeing whether the discussion lasts two or three days is far more useful than a brief spike in popularity. Leave a comment and share your thoughts.
98
$CRCLB (24h +0.94%), here’s the news: A study found that spending limits on Circle AI agent wallets can be bypassed.
In the face of bearish news, I’ll pay more attention to whether there’s support below. The first pullback after the news breaks is the most important: holding that level would indicate solid support.
$CRCLB (24h +0.94%), here’s the news: A study found that spending limits on Circle AI agent wallets can be bypassed.
In the face of bearish news, I’ll pay more attention to whether there’s support below. The first pullback after the news breaks is the most important: holding that level would indicate solid support.
In the face of bearish news, I’ll pay more attention to whether there’s support below. The first pullback after the news breaks is the most important: holding that level would indicate solid support.
766
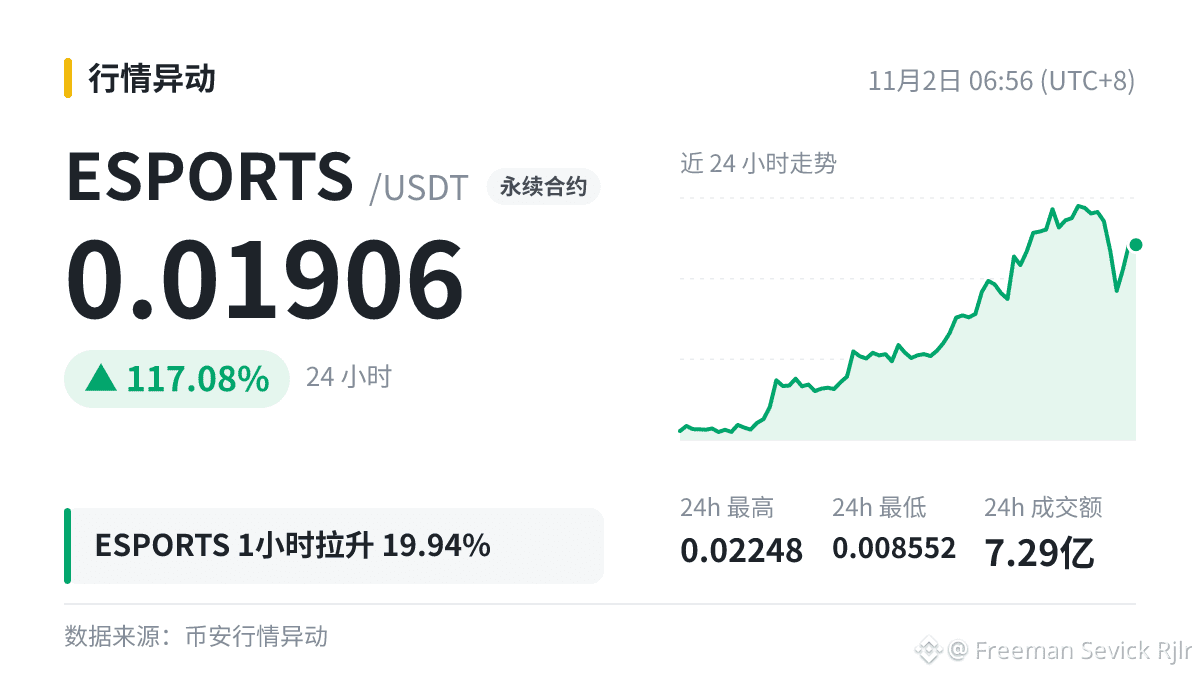
Structure Observation | $ESPORTS
1 hour +19.94%, 4h -3.31%, 24h +117.08%
When it's rising, don't just focus on the gains; also look at how far the price is from its previous high.
Structure Observation | $ESPORTS
1 hour +19.94%, 4h -3.31%, 24h +117.08%
When it's rising, don't just focus on the gains; also look at how far the price is from its previous high.
1 hour +19.94%, 4h -3.31%, 24h +117.08%
When it's rising, don't just focus on the gains; also look at how far the price is from its previous high.
9
Oh my god!
$NEAR has broken down 💔 The 24-hour low has been breached!
Current price: 4.322. The previous low of 4.322 didn’t hold…
During a decline, what matters more is whether trading volume is shrinking. Now that it’s fallen this far, what’s the first thing that comes to mind?
Oh my god!
$NEAR has broken down 💔 The 24-hour low has been breached!
Current price: 4.322. The previous low of 4.322 didn’t hold…
During a decline, what matters more is whether trading volume is shrinking. Now that it’s fallen this far, what’s the first thing that comes to mind?
$NEAR has broken down 💔 The 24-hour low has been breached!
Current price: 4.322. The previous low of 4.322 didn’t hold…
During a decline, what matters more is whether trading volume is shrinking. Now that it’s fallen this far, what’s the first thing that comes to mind?
405
$AIOT broke through the 0.09 level.
There are plenty of orders near this level, and volatility often increases at the moment of a breakout.
Technically, the previous high and key moving averages are more worth watching than the size of this move.
$AIOT broke through the 0.09 level.
There are plenty of orders near this level, and volatility often increases at the moment of a breakout.
Technically, the previous high and key moving averages are more worth watching than the size of this move.
There are plenty of orders near this level, and volatility often increases at the moment of a breakout.
Technically, the previous high and key moving averages are more worth watching than the size of this move.
212
$APR 4-hour RSI (14) is 76.6, entering overbought territory, with the current price at 0.07415.
Overbought conditions mean prices have risen sharply in the short term; they don’t mean a top is imminent. In a strong market, RSI can stay above 70 for a long time. What’s more worth watching is bearish divergence: the price makes a new high, but RSI does not.
Don’t go all in or out based on a single signal; keeping some room to maneuver makes it easier to stay calm.
$APR 4-hour RSI (14) is 76.6, entering overbought territory, with the current price at 0.07415.
Overbought conditions mean prices have risen sharply in the short term; they don’t mean a top is imminent. In a strong market, RSI can stay above 70 for a long time. What’s more worth watching is bearish divergence: the price makes a new high, but RSI does not.
Don’t go all in or out based on a single signal; keeping some room to maneuver makes it easier to stay calm.
Overbought conditions mean prices have risen sharply in the short term; they don’t mean a top is imminent. In a strong market, RSI can stay above 70 for a long time. What’s more worth watching is bearish divergence: the price makes a new high, but RSI does not.
Don’t go all in or out based on a single signal; keeping some room to maneuver makes it easier to stay calm.
3
Binance resumes withdrawals for some assets on the Arbitrum and TRX networks.
I usually look at the daily chart structure first; I only use news to explain price movements.
If the direction still isn't clear, I let the market speak for itself.
$TRX , 24h -1.8%.
Binance resumes withdrawals for some assets on the Arbitrum and TRX networks.
I usually look at the daily chart structure first; I only use news to explain price movements.
If the direction still isn't clear, I let the market speak for itself.
$TRX , 24h -1.8%.
I usually look at the daily chart structure first; I only use news to explain price movements.
If the direction still isn't clear, I let the market speak for itself.
$TRX , 24h -1.8%.
91
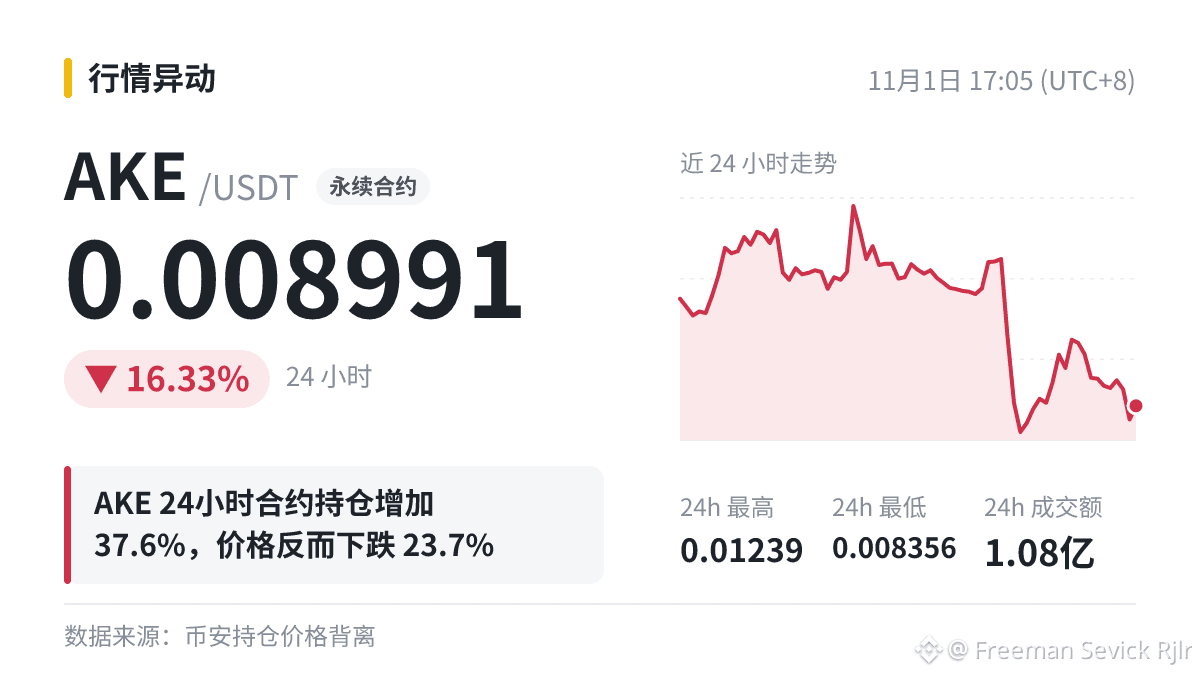
👀 Unusual contract activity over $AKE 24 hours!
More and more traders are opening positions during the decline (open interest +37.61%, price -23.67%)!
Contract open interest is currently around $10.69 million. With so many positions battling it out, I’m keeping a close eye on things!
Whichever way it breaks, volatility is likely to be significant. Don’t act impulsively!
👀 Unusual contract activity over $AKE 24 hours!
More and more traders are opening positions during the decline (open interest +37.61%, price -23.67%)!
Contract open interest is currently around $10.69 million. With so many positions battling it out, I’m keeping a close eye on things!
Whichever way it breaks, volatility is likely to be significant. Don’t act impulsively!
More and more traders are opening positions during the decline (open interest +37.61%, price -23.67%)!
Contract open interest is currently around $10.69 million. With so many positions battling it out, I’m keeping a close eye on things!
Whichever way it breaks, volatility is likely to be significant. Don’t act impulsively!
19
Whoa, this price action is intense!
$EVAA 15-minute open interest rose 4.52%, while the price rose 18.03%!
There’s no shame in setting a stop-loss; the real pain is holding on until you get liquidated.
Whoa, this price action is intense!
$EVAA 15-minute open interest rose 4.52%, while the price rose 18.03%!
There’s no shame in setting a stop-loss; the real pain is holding on until you get liquidated.
$EVAA 15-minute open interest rose 4.52%, while the price rose 18.03%!
There’s no shame in setting a stop-loss; the real pain is holding on until you get liquidated.
257
Reading the Charts|Bitcoin miners’ holdings rose to 1.1941 million BTC, the largest weekly increase in six weeks
Where are the previous high and key moving averages? The news won’t change that—these are the price levels to watch. We can see whether enthusiasm in the community continues to heat up or cools off quickly.
This is fairly neutral and won’t have much impact on the plan; just be aware of it.
$BTC currently at 77846.24 (24h +0.73%).
Reading the Charts|Bitcoin miners’ holdings rose to 1.1941 million BTC, the largest weekly increase in six weeks
Where are the previous high and key moving averages? The news won’t change that—these are the price levels to watch. We can see whether enthusiasm in the community continues to heat up or cools off quickly.
This is fairly neutral and won’t have much impact on the plan; just be aware of it.
$BTC currently at 77846.24 (24h +0.73%).
Where are the previous high and key moving averages? The news won’t change that—these are the price levels to watch. We can see whether enthusiasm in the community continues to heat up or cools off quickly.
This is fairly neutral and won’t have much impact on the plan; just be aware of it.
$BTC currently at 77846.24 (24h +0.73%).
98
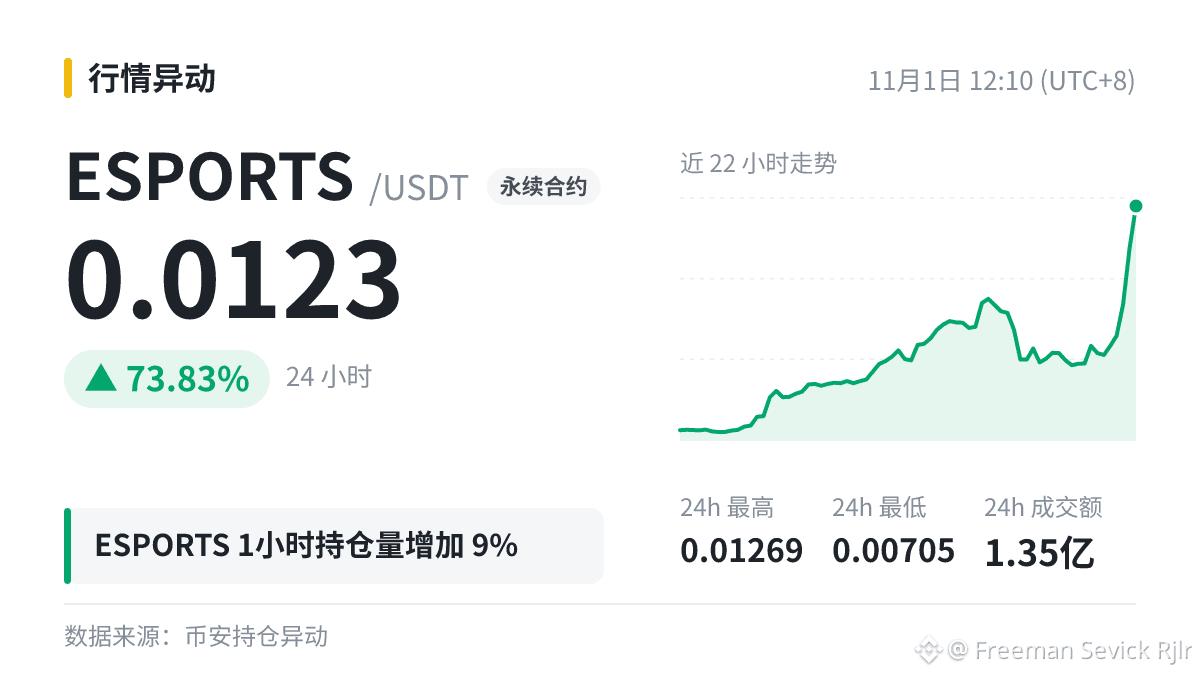
$ESPORTS 1 hours: Open interest increased by 9.01%, and the price rose by 23.26%.
The more open interest builds up, the greater the volatility from liquidations once the market picks a direction.
I’ll use the range before the unusual move as the dividing line: only a sustained move outside the range counts as valid.
$ESPORTS 1 hours: Open interest increased by 9.01%, and the price rose by 23.26%.
The more open interest builds up, the greater the volatility from liquidations once the market picks a direction.
I’ll use the range before the unusual move as the dividing line: only a sustained move outside the range counts as valid.
The more open interest builds up, the greater the volatility from liquidations once the market picks a direction.
I’ll use the range before the unusual move as the dividing line: only a sustained move outside the range counts as valid.
235
No way!
$ESPORTS 15-minute open interest surged 4.27%! Contract traders are all rushing in 🔥
Price rose in sync by +2.85%, and the bulls are going all out!
With this much leverage piled up, volatility won't be small from here on. Keep positions light and test the waters!
#ESPORTS
No way!
$ESPORTS 15-minute open interest surged 4.27%! Contract traders are all rushing in 🔥
Price rose in sync by +2.85%, and the bulls are going all out!
With this much leverage piled up, volatility won't be small from here on. Keep positions light and test the waters!
#ESPORTS
$ESPORTS 15-minute open interest surged 4.27%! Contract traders are all rushing in 🔥
Price rose in sync by +2.85%, and the bulls are going all out!
With this much leverage piled up, volatility won't be small from here on. Keep positions light and test the waters!
#ESPORTS
285
The first pullback after the news breaks is the most important: holding steady means buying support is solid.
Take this situation as an example: The Balancer team has wrapped up its last regular working day, but the protocol wind-down will continue.
Is there a timeline for this? If so, please indicate it.
$BTC Current price: 77734.01.
#BTC
The first pullback after the news breaks is the most important: holding steady means buying support is solid.
Take this situation as an example: The Balancer team has wrapped up its last regular working day, but the protocol wind-down will continue.
Is there a timeline for this? If so, please indicate it.
$BTC Current price: 77734.01.
#BTC
Take this situation as an example: The Balancer team has wrapped up its last regular working day, but the protocol wind-down will continue.
Is there a timeline for this? If so, please indicate it.
$BTC Current price: 77734.01.
#BTC
155
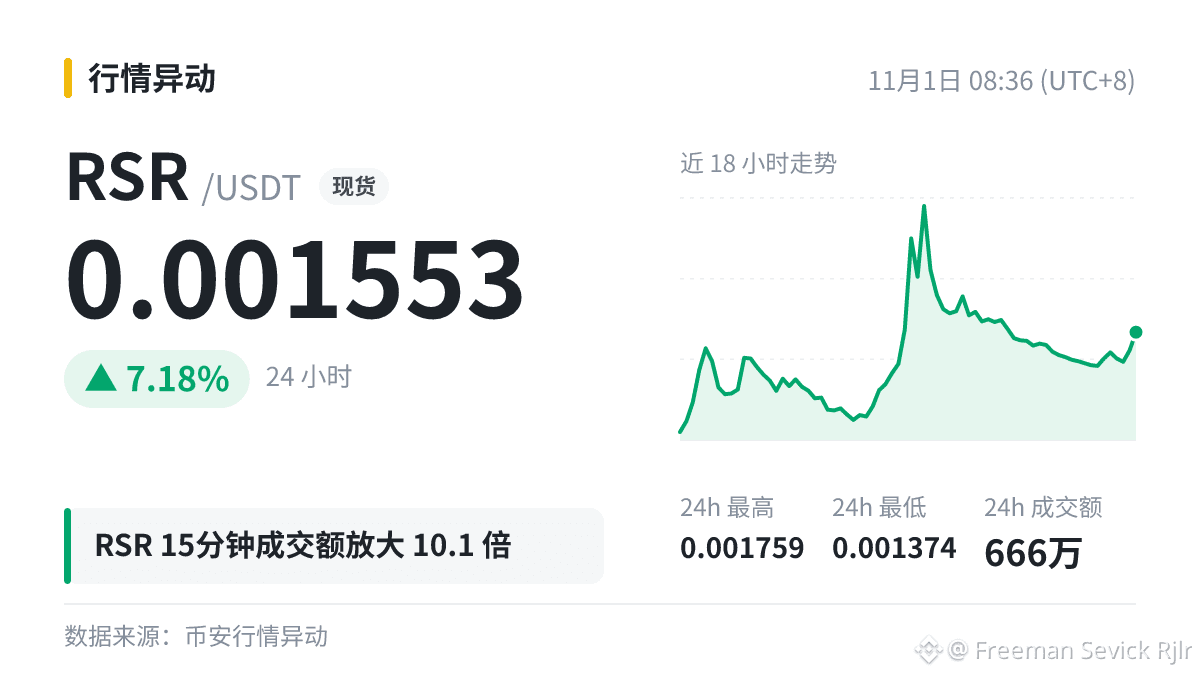
$RSR 15-minute trading volume was approximately $2.05 million, 10.1 times the previous average; the price rose 0.99% over the same period.
Let’s use this figure to break down trading volume.
When analyzing trading activity, read it alongside the candlestick chart: where the price closes and how long the wicks are usually tell you more than volume alone.
High volume with almost no price movement means buyers and sellers are exchanging hands extensively at the current price. To see which way the market moves next, watch for who gives way first.
With leveraged trading, first consider whether you can handle the worst-case outcome, then think about what the indicators are saying.
$RSR 15-minute trading volume was approximately $2.05 million, 10.1 times the previous average; the price rose 0.99% over the same period.
Let’s use this figure to break down trading volume.
When analyzing trading activity, read it alongside the candlestick chart: where the price closes and how long the wicks are usually tell you more than volume alone.
High volume with almost no price movement means buyers and sellers are exchanging hands extensively at the current price. To see which way the market moves next, watch for who gives way first.
With leveraged trading, first consider whether you can handle the worst-case outcome, then think about what the indicators are saying.
Let’s use this figure to break down trading volume.
When analyzing trading activity, read it alongside the candlestick chart: where the price closes and how long the wicks are usually tell you more than volume alone.
High volume with almost no price movement means buyers and sellers are exchanging hands extensively at the current price. To see which way the market moves next, watch for who gives way first.
With leveraged trading, first consider whether you can handle the worst-case outcome, then think about what the indicators are saying.
240
Log in to explore more content
Join global crypto users on Binance Square
⚡️ Get latest and useful information about crypto.
💬 Trusted by the world’s largest crypto exchange.
👍 Discover real insights from verified creators.
Email / Phone number
Trending Topics
BinanceRestores28FiatWithdrawals
4,039 views
141 Discussing
Binance Restores Fiat Withdrawals for USD, AED and Three Asian Currencies, Bringing the Total to 28
Binance News
·8 Likes
·2.5k views
BinanceProcesses$4.65BWithdrawals
62,233 views
270 Discussing
ETHFalls16.1%InOctober
0 views
3 Discussing