
Hodl_Trading
154 Posts

Hodl_Trading
Report
Block User
Daily Analysis and crypto news from our professional team🚀 English/عربي
3 Following
626 Followers
983 Liked
Posts
All
Quotes
PINNED
·
--
Bullish
$BTC | 4H Timeframe 📍
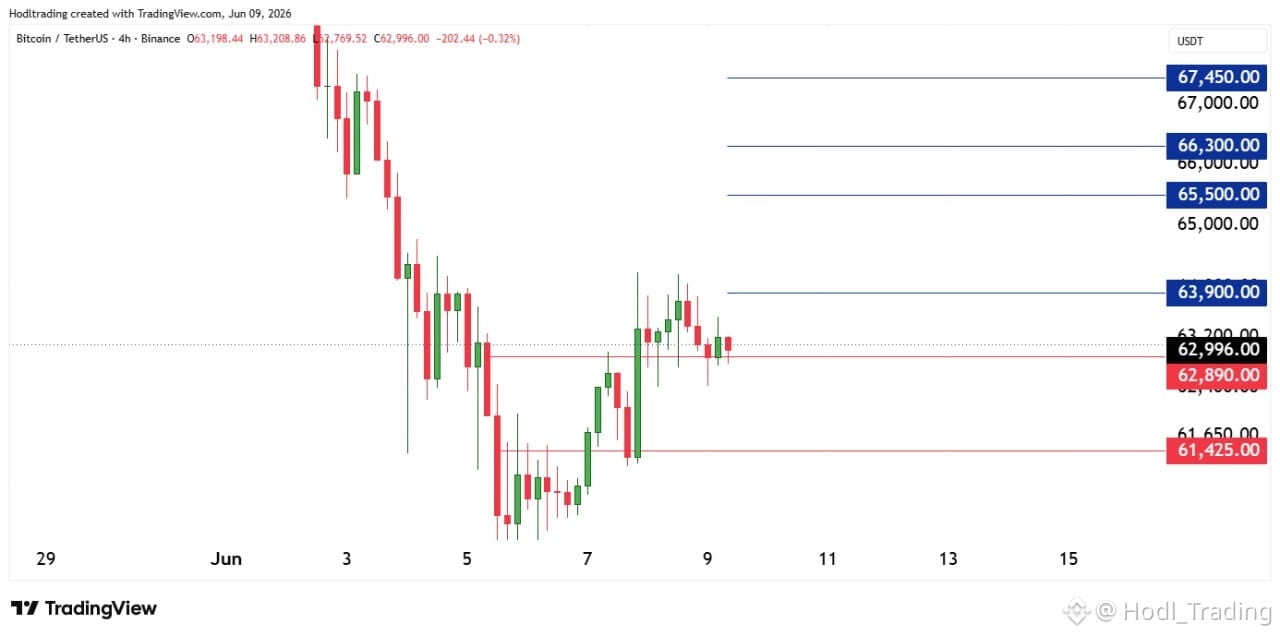
Holding above the $62,890 support level keeps the bullish scenario intact, with $63,900 as the first upside target in the near term.
On the other hand, a 4-hour candle close below $62,890 would be a negative signal and could trigger a correction toward $61,425.
$BTC | 4H Timeframe 📍
Holding above the $62,890 support level keeps the bullish scenario intact, with $63,900 as the first upside target in the near term.
On the other hand, a 4-hour candle close below $62,890 would be a negative signal and could trigger a correction toward $61,425.
Holding above the $62,890 support level keeps the bullish scenario intact, with $63,900 as the first upside target in the near term.
On the other hand, a 4-hour candle close below $62,890 would be a negative signal and could trigger a correction toward $61,425.
12
5
79
293.1k
·
--
Weekly $AVAX Update📍
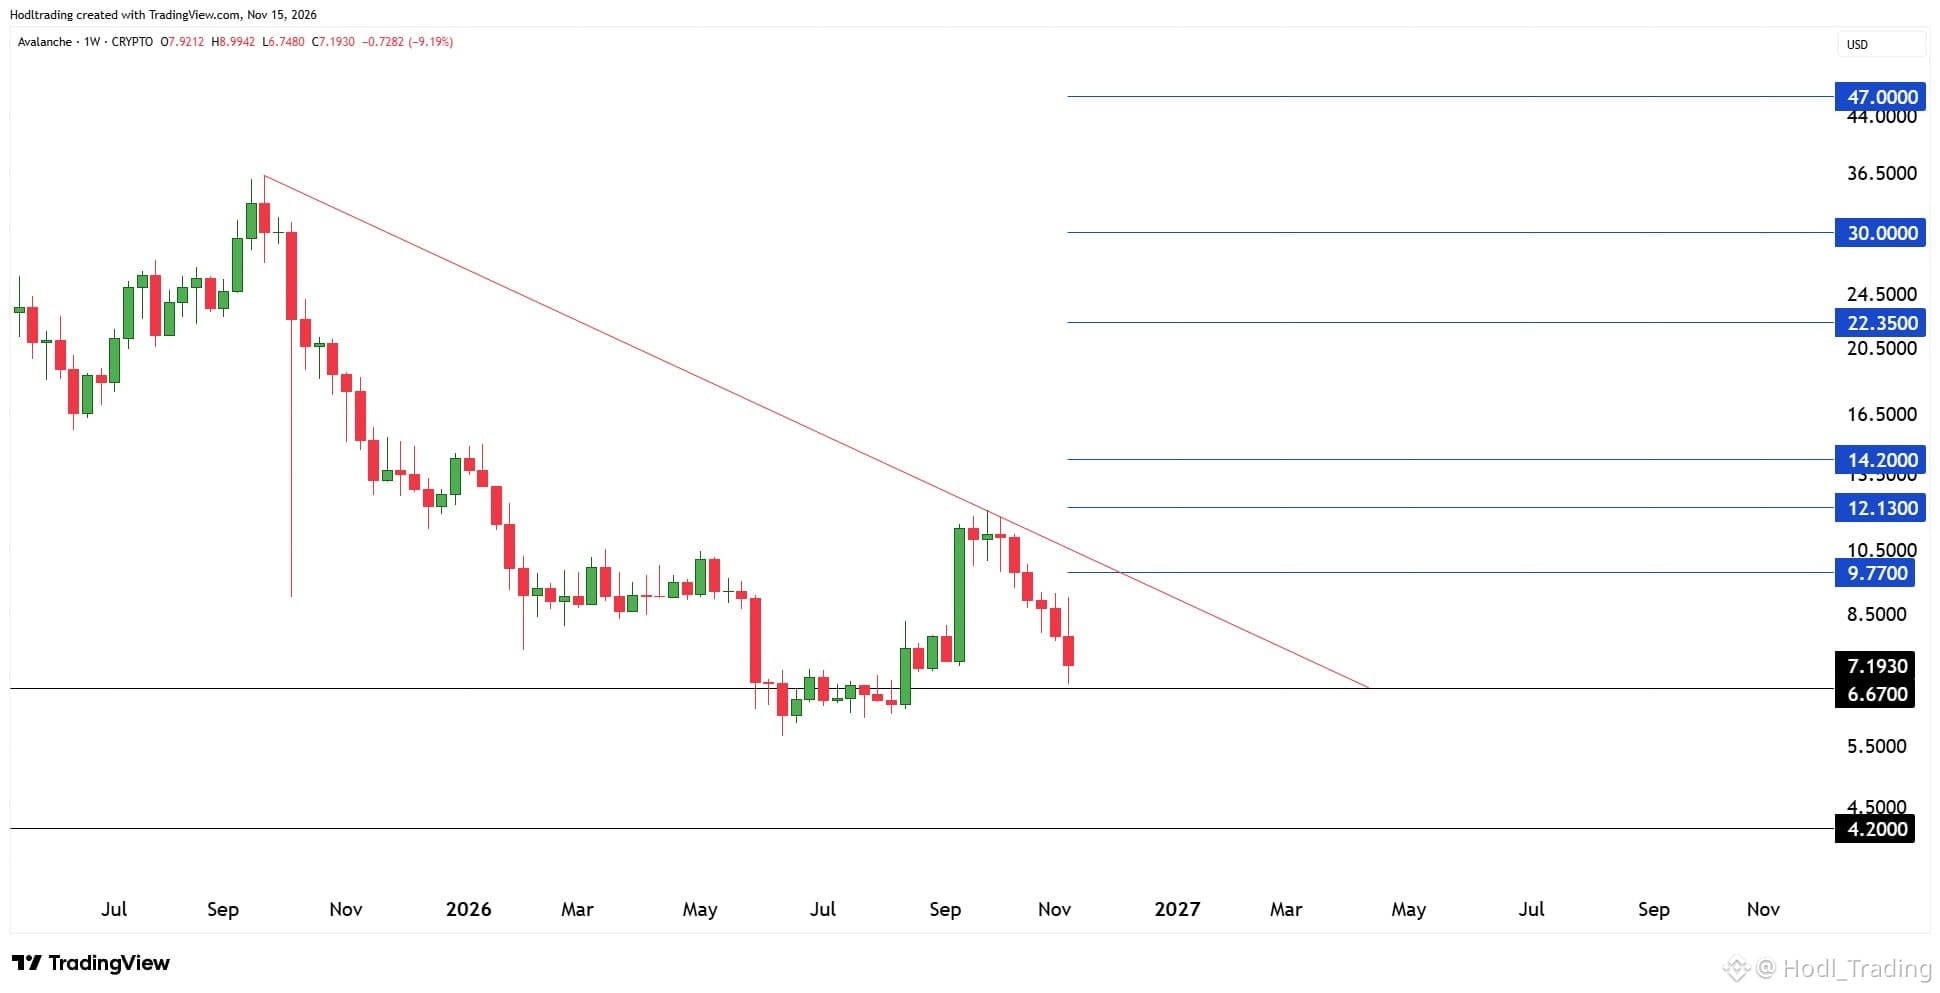
The coin has reached levels I consider very attractive for accumulation, and I will start accumulating at current prices. If the current support at $6.6700 is lost, the next potential accumulation zone could be around the next support at $4.2000.
For now, holding above the $6.6700 support is positive and opens the door for an upside move toward $9.7700 as the first target.
Weekly $AVAX Update📍
The coin has reached levels I consider very attractive for accumulation, and I will start accumulating at current prices. If the current support at $6.6700 is lost, the next potential accumulation zone could be around the next support at $4.2000.
For now, holding above the $6.6700 support is positive and opens the door for an upside move toward $9.7700 as the first target.
The coin has reached levels I consider very attractive for accumulation, and I will start accumulating at current prices. If the current support at $6.6700 is lost, the next potential accumulation zone could be around the next support at $4.2000.
For now, holding above the $6.6700 support is positive and opens the door for an upside move toward $9.7700 as the first target.
6
3.6k
·
--
Bullish
$POL Daily Analysis 📍
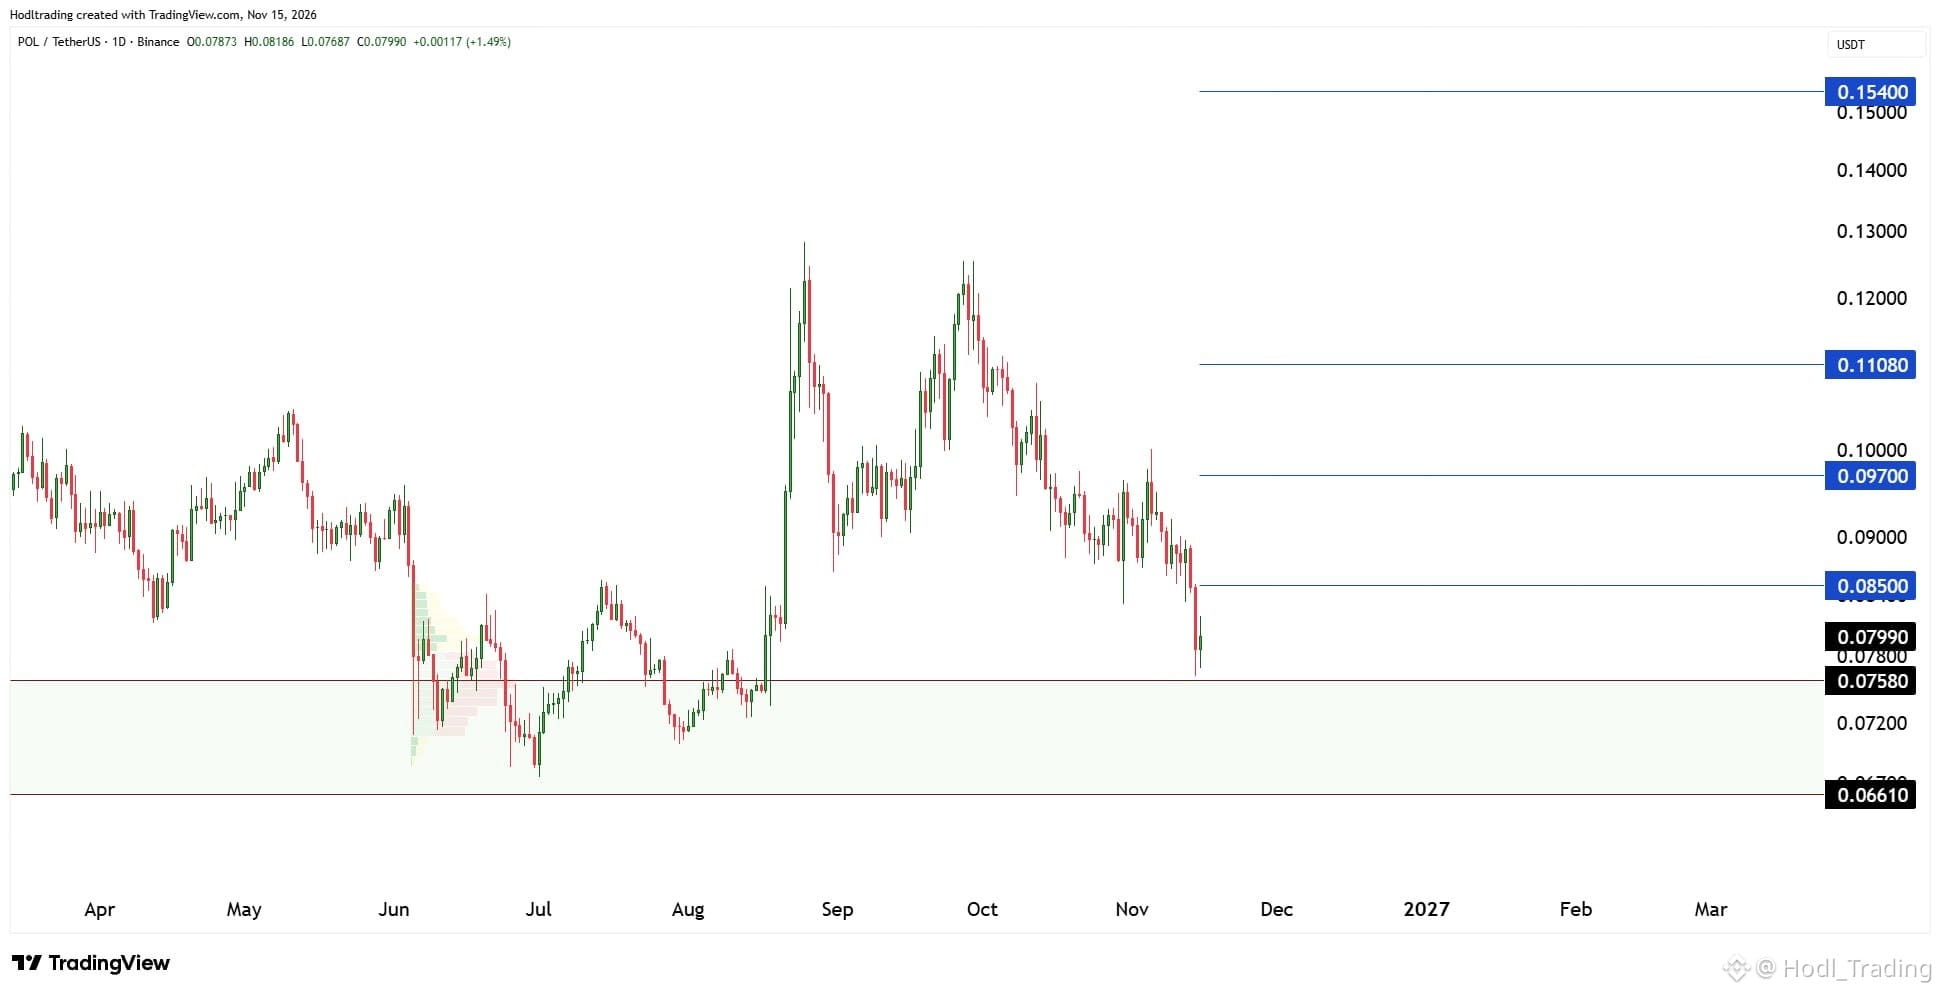
The coin is currently holding support at $0.07580, with a move towards the initial target of $0.08500 in focus as long as this level holds.
A break below the current support could open the door to a correction towards the next support at $0.06610.
$POL Daily Analysis 📍
The coin is currently holding support at $0.07580, with a move towards the initial target of $0.08500 in focus as long as this level holds.
A break below the current support could open the door to a correction towards the next support at $0.06610.
The coin is currently holding support at $0.07580, with a move towards the initial target of $0.08500 in focus as long as this level holds.
A break below the current support could open the door to a correction towards the next support at $0.06610.
1
496
·
--
Bullish
$HBAR Daily Analysis📍
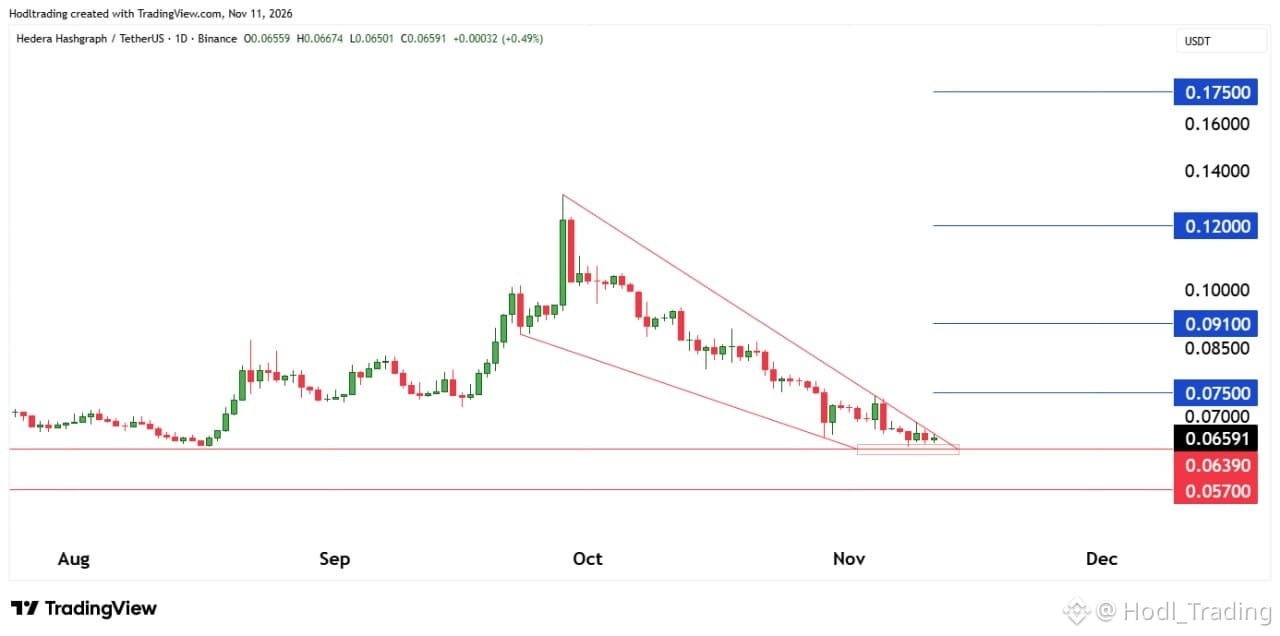
A bullish pattern is beginning to take shape, with the potential to push the price toward the targets marked in blue.
The price is still holding above the $0.06390 support, keeping the upside potential toward the initial target of $0.07500 intact.
However, losing the current support at $0.06390 could open the way for a move toward the next support at $0.05700.
$HBAR Daily Analysis📍
A bullish pattern is beginning to take shape, with the potential to push the price toward the targets marked in blue.
The price is still holding above the $0.06390 support, keeping the upside potential toward the initial target of $0.07500 intact.
However, losing the current support at $0.06390 could open the way for a move toward the next support at $0.05700.
A bullish pattern is beginning to take shape, with the potential to push the price toward the targets marked in blue.
The price is still holding above the $0.06390 support, keeping the upside potential toward the initial target of $0.07500 intact.
However, losing the current support at $0.06390 could open the way for a move toward the next support at $0.05700.
1
1.2k
·
--
Bullish
NYSE will use Avalanche to settle tokenized stock trades exclusively on its planned 24/7 trading platform, per WSJ.
Amazing news for $AVAX 🔥
NYSE will use Avalanche to settle tokenized stock trades exclusively on its planned 24/7 trading platform, per WSJ.
Amazing news for $AVAX 🔥
Amazing news for $AVAX 🔥

2
532
·
--
Bullish
$AVAX Weekly Analysis 📍
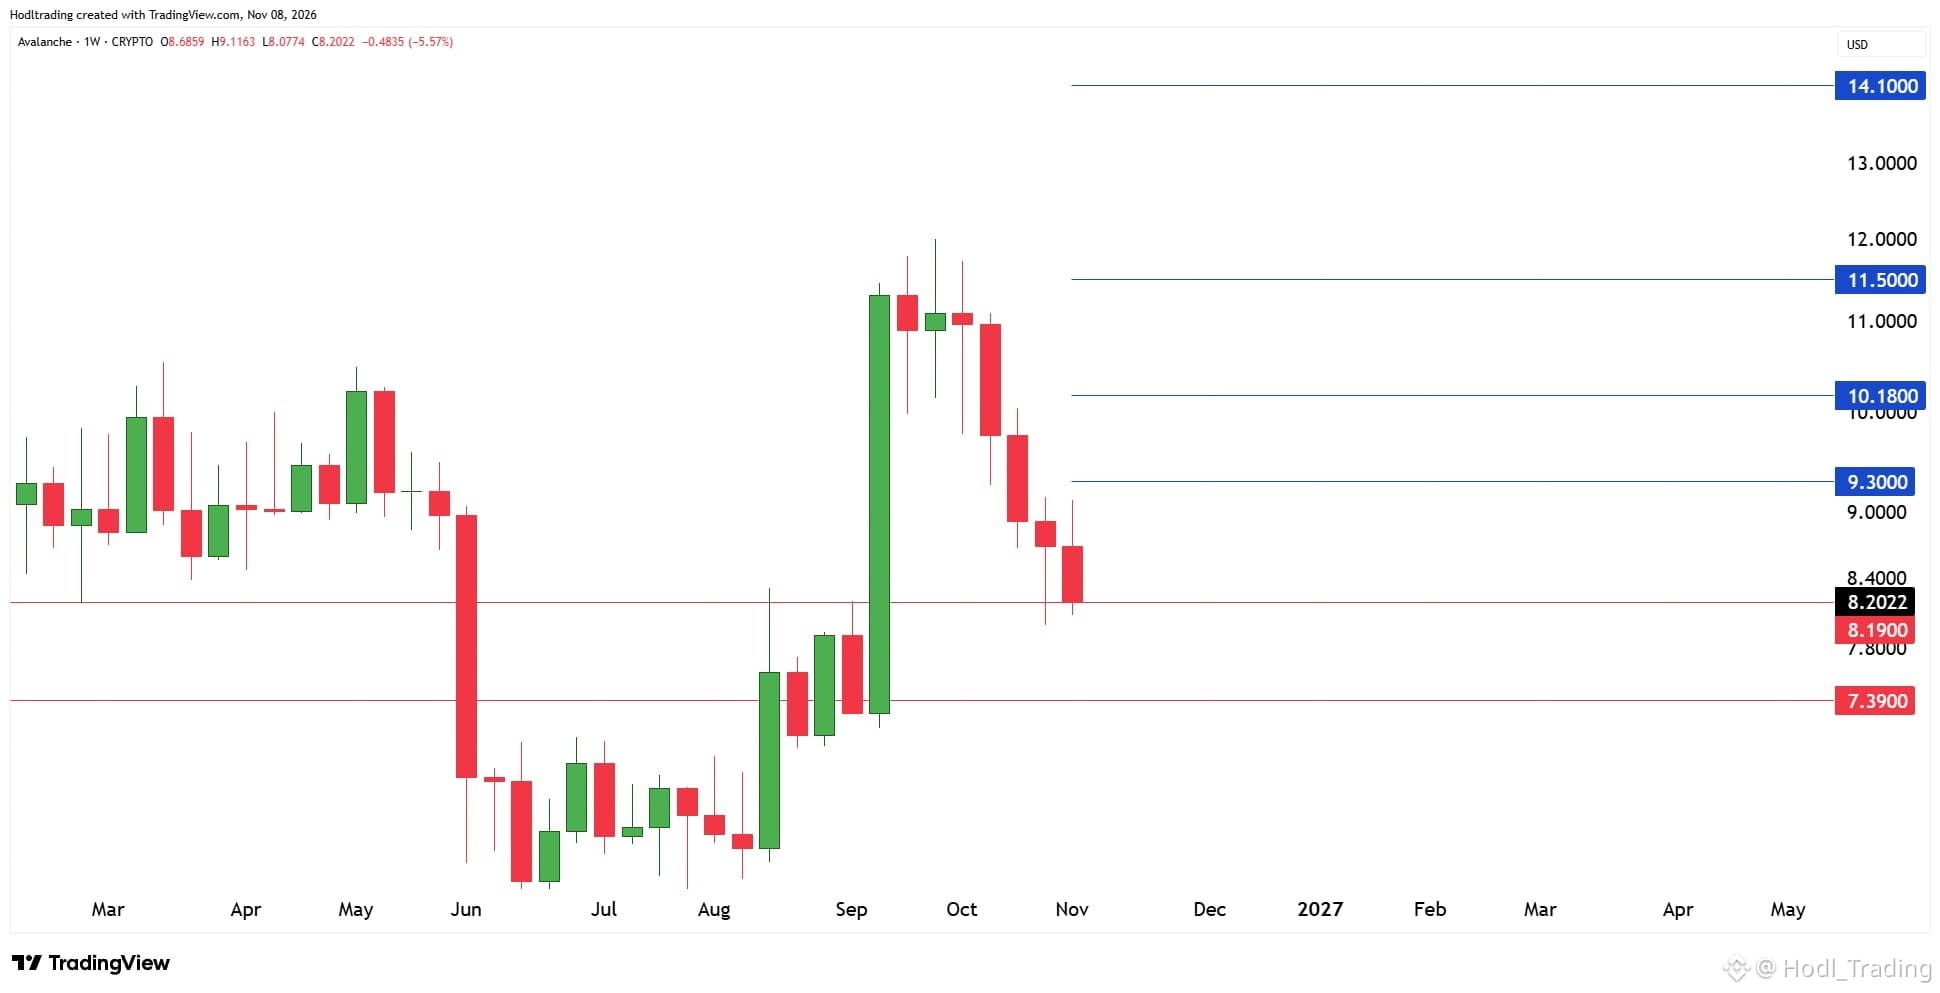
AVAX is currently trading at a major weekly support level of $8.1900. Holding above this level keeps the $9.3000 target in play.
However, if selling pressure returns and this support is broken, the next support level stands at $7.3900.
Targets are marked in blue.
$AVAX Weekly Analysis 📍
AVAX is currently trading at a major weekly support level of $8.1900. Holding above this level keeps the $9.3000 target in play.
However, if selling pressure returns and this support is broken, the next support level stands at $7.3900.
Targets are marked in blue.
AVAX is currently trading at a major weekly support level of $8.1900. Holding above this level keeps the $9.3000 target in play.
However, if selling pressure returns and this support is broken, the next support level stands at $7.3900.
Targets are marked in blue.
2
1k
·
--
Bullish
$OP Analysis | Daily Timeframe📍
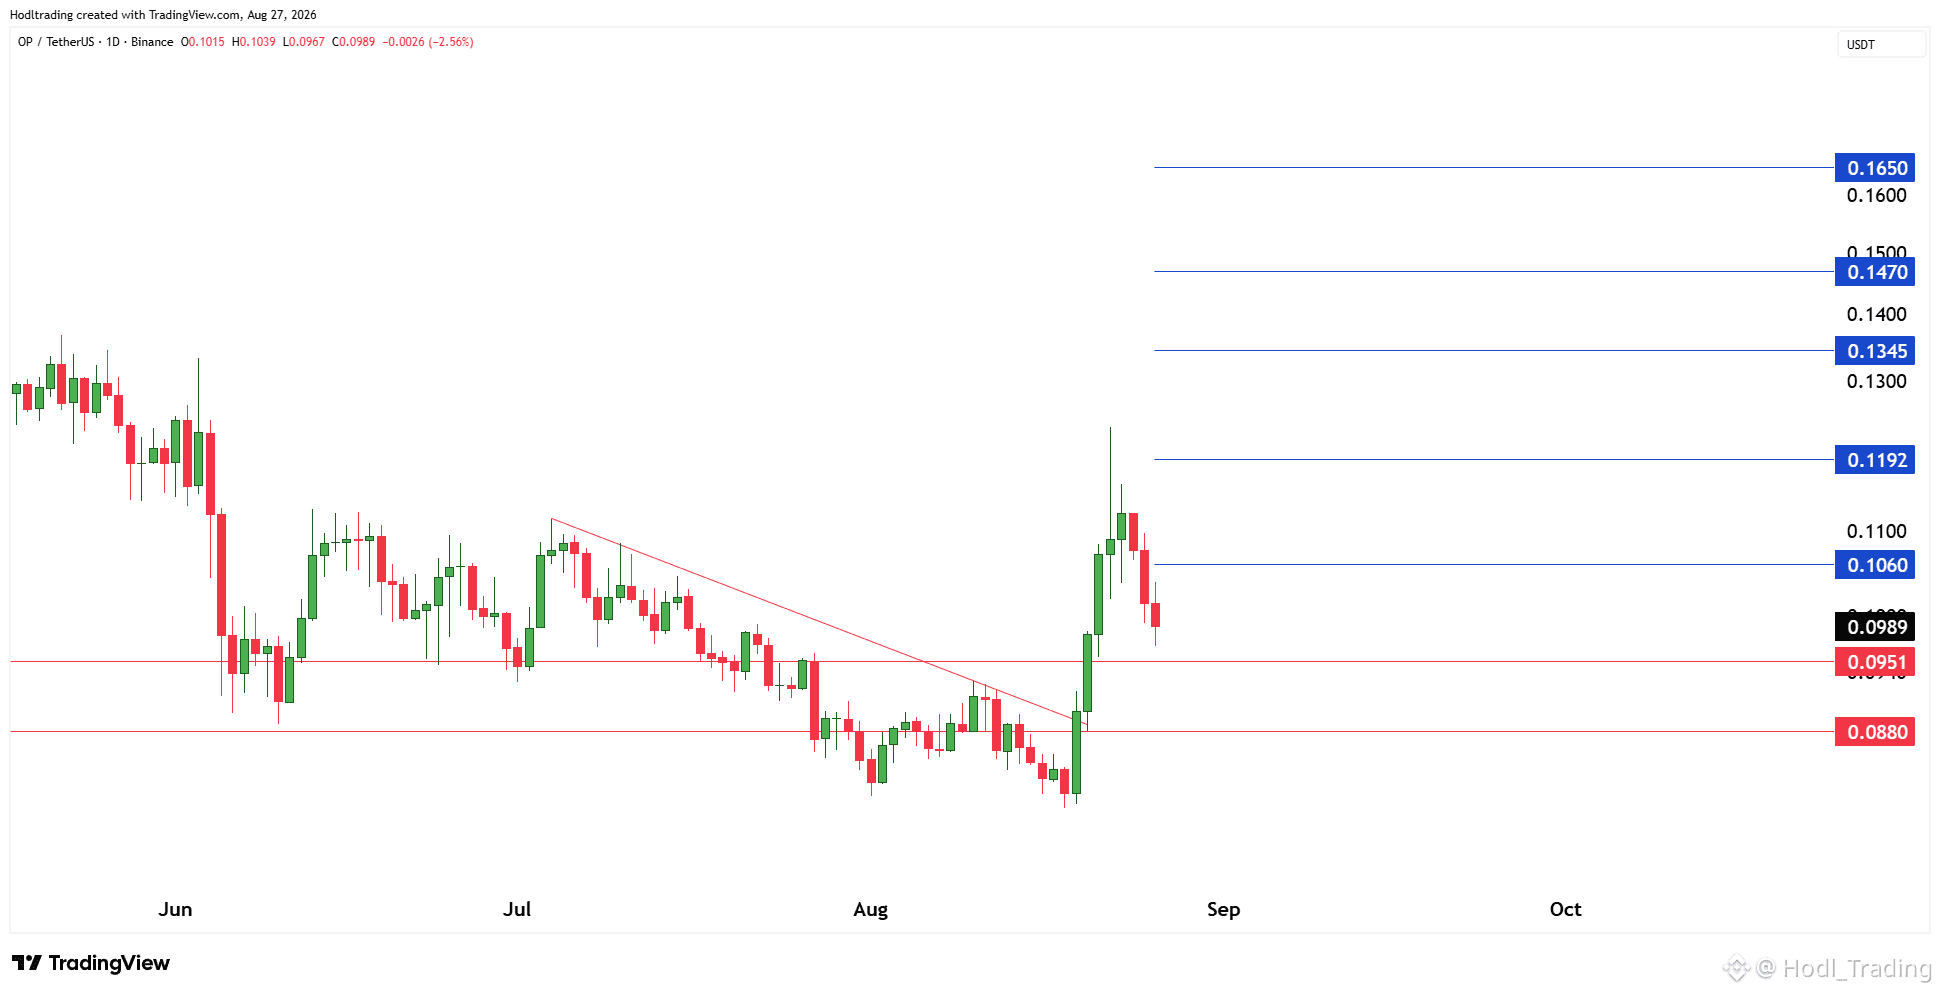
OP is expected to retest the $0.0951 support level, with a potential continuation higher toward $0.1192 as the first target.
If a daily candle closes below $0.0951, the price could correct toward $0.0880.
$OP Analysis | Daily Timeframe📍
OP is expected to retest the $0.0951 support level, with a potential continuation higher toward $0.1192 as the first target.
If a daily candle closes below $0.0951, the price could correct toward $0.0880.
OP is expected to retest the $0.0951 support level, with a potential continuation higher toward $0.1192 as the first target.
If a daily candle closes below $0.0951, the price could correct toward $0.0880.
3
4.7k
·
--
Bullish
$SUI | Daily Timeframe 📍
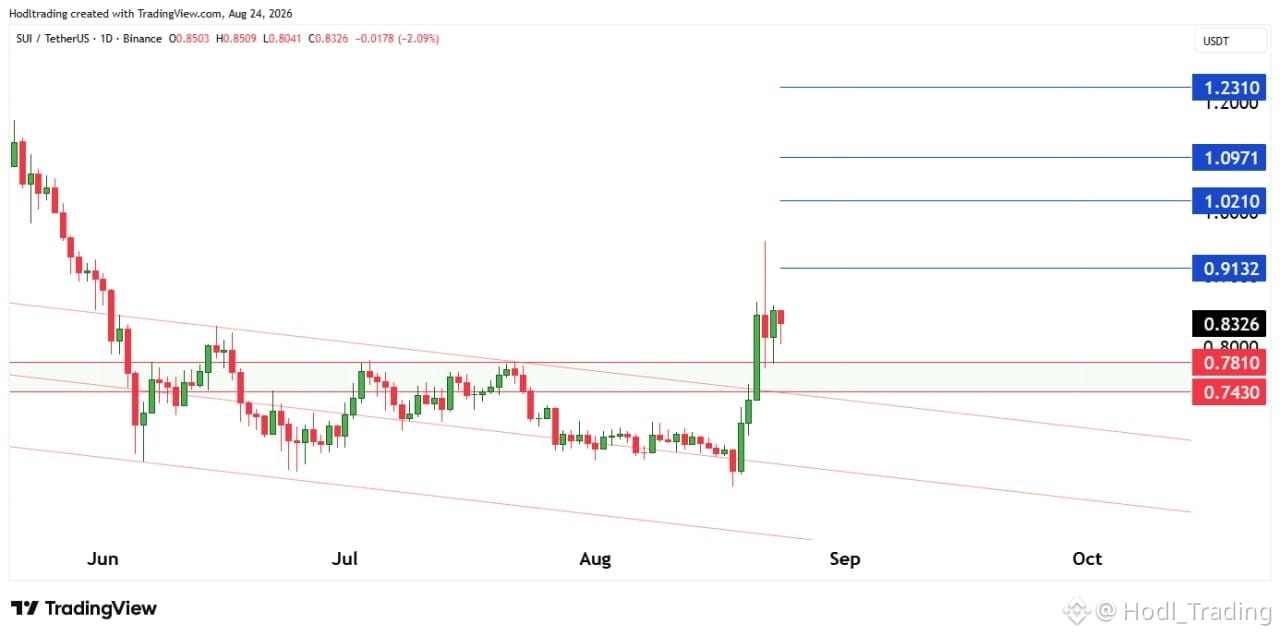
SUI has broken above a key descending price channel and is currently trading near a major support zone between $0.7810 and $0.7430.
Holding this zone could support further upside and pave the way toward $0.9132 as the first target.
$SUI | Daily Timeframe 📍
SUI has broken above a key descending price channel and is currently trading near a major support zone between $0.7810 and $0.7430.
Holding this zone could support further upside and pave the way toward $0.9132 as the first target.
SUI has broken above a key descending price channel and is currently trading near a major support zone between $0.7810 and $0.7430.
Holding this zone could support further upside and pave the way toward $0.9132 as the first target.
5
20
42.1k
·
--
Bullish
$ETH Analysis | Weekly Time Frame📍
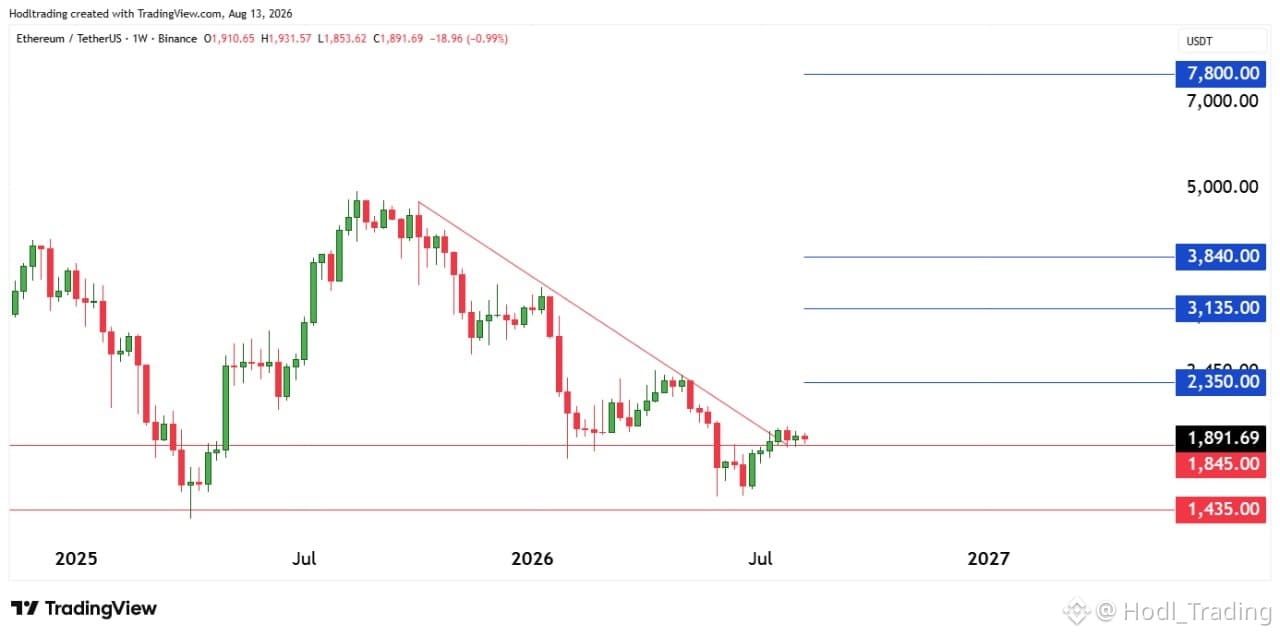
Ethereum is currently trading at the weekly support of $1,845. Holding above this level keeps the $2,350 target in play, especially with expectations surrounding the upcoming Ethereum network upgrade this year. If bullish momentum continues, the price could extend toward $3,135.
The bearish scenario would be triggered by a weekly candle close below the $1,845 support, potentially opening the way for a correction toward the next support at $1,435.
$ETH Analysis | Weekly Time Frame📍
Ethereum is currently trading at the weekly support of $1,845. Holding above this level keeps the $2,350 target in play, especially with expectations surrounding the upcoming Ethereum network upgrade this year. If bullish momentum continues, the price could extend toward $3,135.
The bearish scenario would be triggered by a weekly candle close below the $1,845 support, potentially opening the way for a correction toward the next support at $1,435.
Ethereum is currently trading at the weekly support of $1,845. Holding above this level keeps the $2,350 target in play, especially with expectations surrounding the upcoming Ethereum network upgrade this year. If bullish momentum continues, the price could extend toward $3,135.
The bearish scenario would be triggered by a weekly candle close below the $1,845 support, potentially opening the way for a correction toward the next support at $1,435.
3
14
11.1k
·
--
Bullish
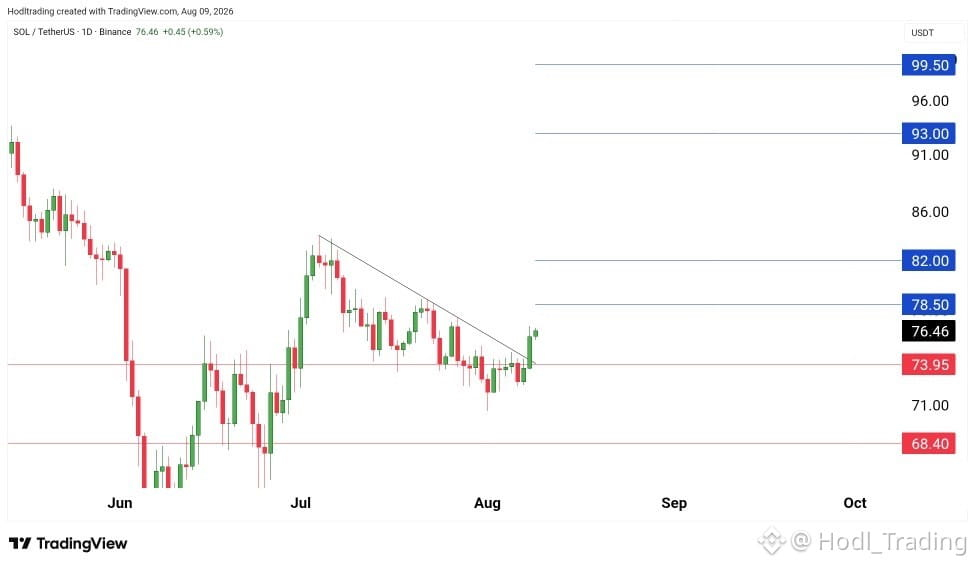
$SOL – Daily Timeframe 📍
After breaking above the daily downtrend, the coin maintains a bullish structure as long as it continues trading above the $73.95 support.
🎯 Targets: $78.50 first, followed by $82.00.
A break below $73.95 could bring selling pressure back and open the door for a correction toward $68.40.
$SOL – Daily Timeframe 📍
After breaking above the daily downtrend, the coin maintains a bullish structure as long as it continues trading above the $73.95 support.
🎯 Targets: $78.50 first, followed by $82.00.
A break below $73.95 could bring selling pressure back and open the door for a correction toward $68.40.
After breaking above the daily downtrend, the coin maintains a bullish structure as long as it continues trading above the $73.95 support.
🎯 Targets: $78.50 first, followed by $82.00.
A break below $73.95 could bring selling pressure back and open the door for a correction toward $68.40.
23
1
83
192.2k
·
--
Bullish
After a long absence... 👋
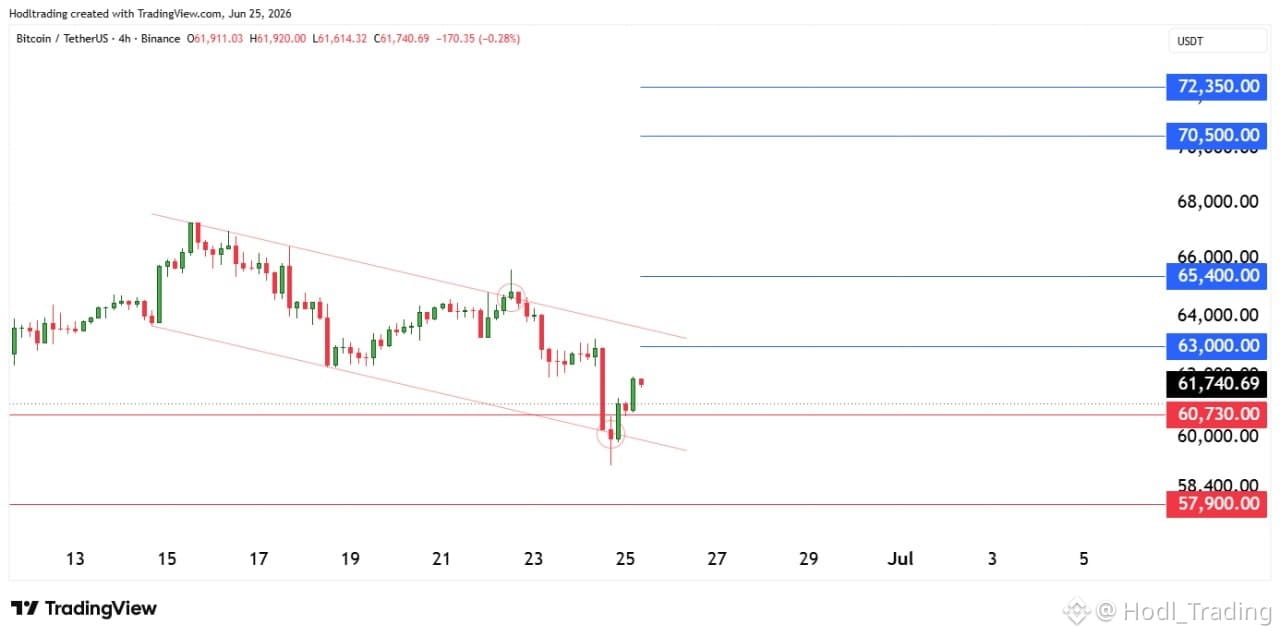
$BTC Analysis – 4H Timeframe
The current support is at $60,730. Holding above this level keeps the short-term target at $63,000.
A break below the support would be a bearish signal and could open the way for a correction toward $57,900.
After a long absence... 👋
$BTC Analysis – 4H Timeframe
The current support is at $60,730. Holding above this level keeps the short-term target at $63,000.
A break below the support would be a bearish signal and could open the way for a correction toward $57,900.
$BTC Analysis – 4H Timeframe
The current support is at $60,730. Holding above this level keeps the short-term target at $63,000.
A break below the support would be a bearish signal and could open the way for a correction toward $57,900.
5
3.6k
·
--
Bullish
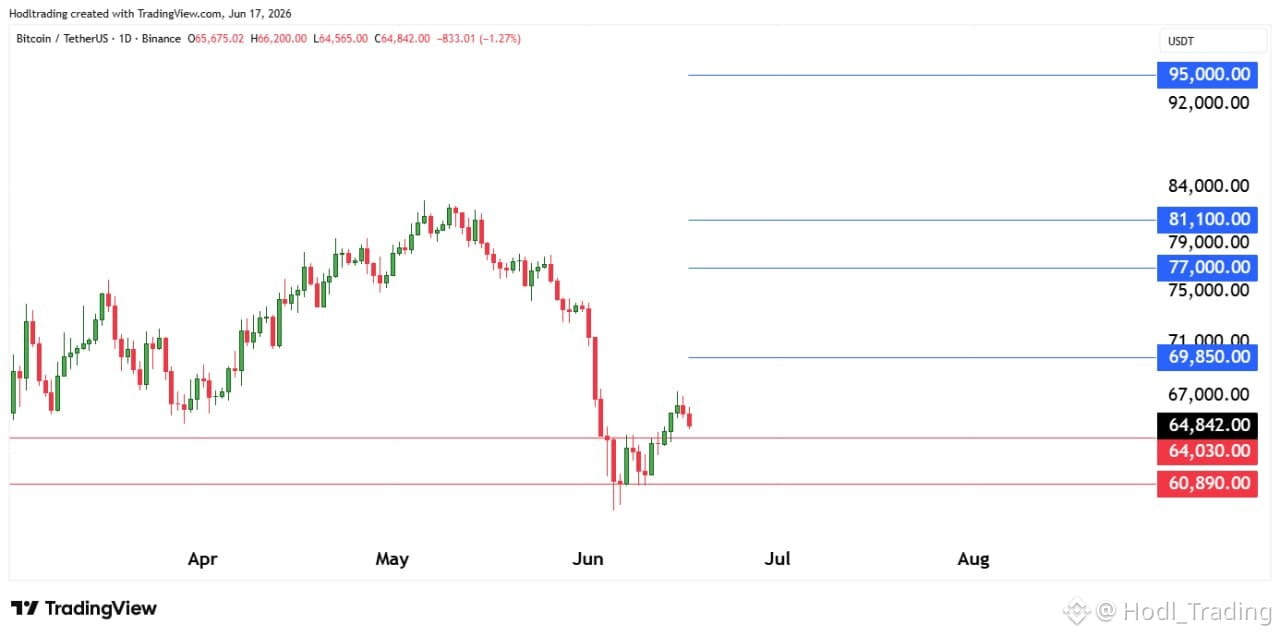
$BTC | Daily Timeframe 📍
As long as Bitcoin continues trading above the $64,030 support level, the bullish scenario remains intact, with $69,850 as the first upside target.
On the other hand, a daily candle close below $64,030 would be considered a bearish signal and could trigger a correction toward $60,890.
The Federal Reserve's interest rate decision is scheduled for 9:00 PM (Saudi Arabia time) tonight, with markets widely expecting rates to remain unchanged. This will be followed by the Fed Chair's speech at 9:30 PM, which could provide important signals on future monetary policy and market direction.
$BTC | Daily Timeframe 📍
As long as Bitcoin continues trading above the $64,030 support level, the bullish scenario remains intact, with $69,850 as the first upside target.
On the other hand, a daily candle close below $64,030 would be considered a bearish signal and could trigger a correction toward $60,890.
The Federal Reserve's interest rate decision is scheduled for 9:00 PM (Saudi Arabia time) tonight, with markets widely expecting rates to remain unchanged. This will be followed by the Fed Chair's speech at 9:30 PM, which could provide important signals on future monetary policy and market direction.
As long as Bitcoin continues trading above the $64,030 support level, the bullish scenario remains intact, with $69,850 as the first upside target.
On the other hand, a daily candle close below $64,030 would be considered a bearish signal and could trigger a correction toward $60,890.
The Federal Reserve's interest rate decision is scheduled for 9:00 PM (Saudi Arabia time) tonight, with markets widely expecting rates to remain unchanged. This will be followed by the Fed Chair's speech at 9:30 PM, which could provide important signals on future monetary policy and market direction.
2
2.7k
·
--
Bullish
2
14
4.5k
·
--
🚨 Pakistan's Prime Minister: We are pleased to announce that a peace agreement has been reached between the United States and Iran.
It is now time for the markets to breathe a sigh of relief, with oil prices expected to decline and market uncertainty likely to ease. ✍🏻
$BTC $CL
🚨 Pakistan's Prime Minister: We are pleased to announce that a peace agreement has been reached between the United States and Iran.
It is now time for the markets to breathe a sigh of relief, with oil prices expected to decline and market uncertainty likely to ease. ✍🏻
$BTC $CL
It is now time for the markets to breathe a sigh of relief, with oil prices expected to decline and market uncertainty likely to ease. ✍🏻
$BTC $CL
4
9
7.2k
·
--
Bullish
$BTC Analysis | Daily Timeframe📍
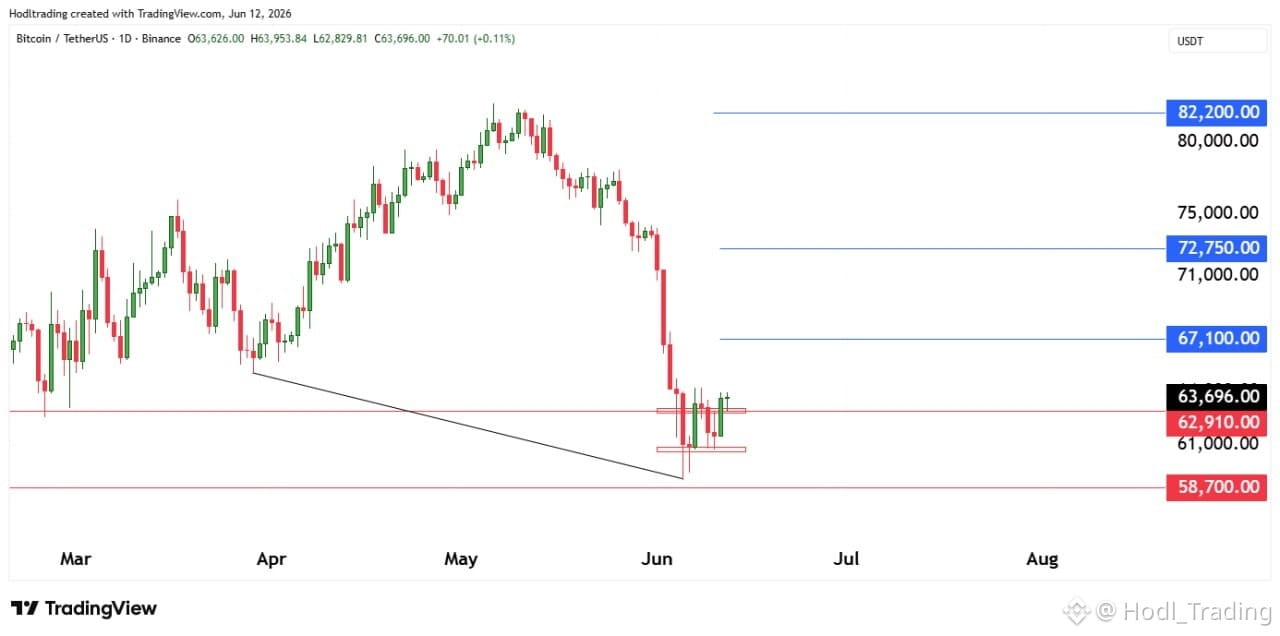
Bitcoin has successfully broken above the resistance level at 62,910$ and closed above it, turning this level into a key support in the current phase. This supports the continuation of the bullish momentum toward the first target at 67,100$.
On the other hand, holding above this support reduces the probability of a deeper correction toward the 58,700$ area, which remains a major support level in case selling pressure returns.
$BTC Analysis | Daily Timeframe📍
Bitcoin has successfully broken above the resistance level at 62,910$ and closed above it, turning this level into a key support in the current phase. This supports the continuation of the bullish momentum toward the first target at 67,100$.
On the other hand, holding above this support reduces the probability of a deeper correction toward the 58,700$ area, which remains a major support level in case selling pressure returns.
Bitcoin has successfully broken above the resistance level at 62,910$ and closed above it, turning this level into a key support in the current phase. This supports the continuation of the bullish momentum toward the first target at 67,100$.
On the other hand, holding above this support reduces the probability of a deeper correction toward the 58,700$ area, which remains a major support level in case selling pressure returns.
4
5
2.6k
·
--
Bullish
$BTC Analysis | Daily Timeframe📍
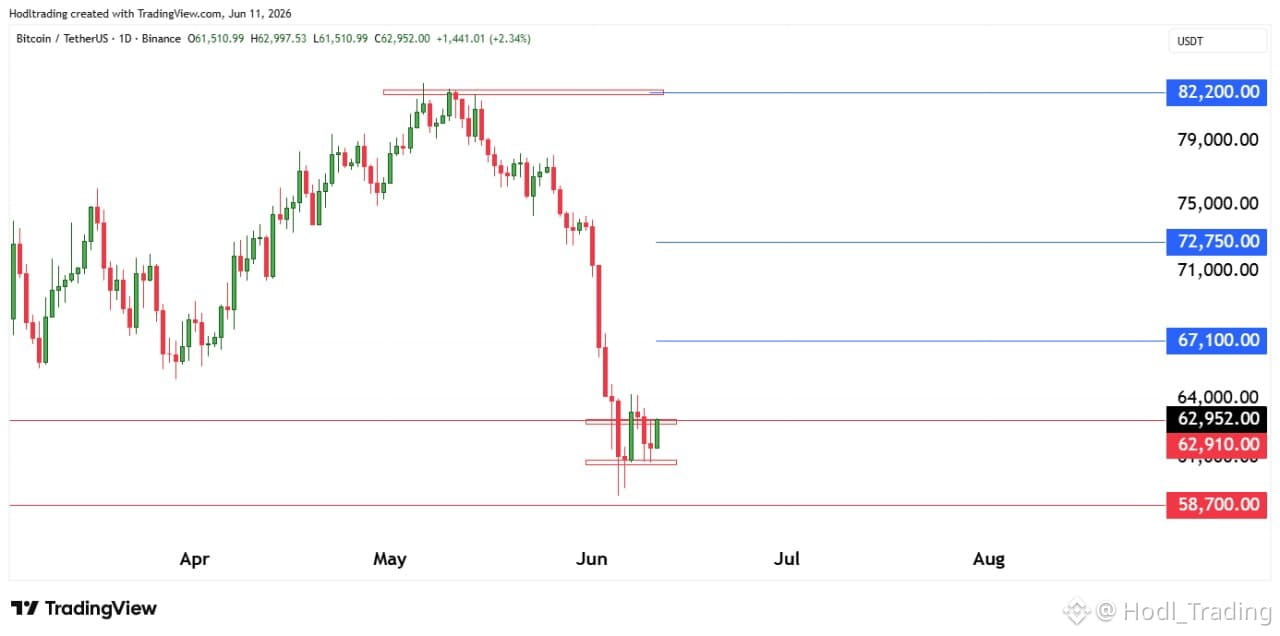
Bitcoin is currently facing a key resistance level at $62,910. A successful breakout and sustained price action above this level could pave the way for a move toward $67,100 as the first target.
However, if the breakout fails, $58,700 remains the nearest major support level to watch.
✍🏻 Risk management remains essential amid the current market volatility.
$BTC Analysis | Daily Timeframe📍
Bitcoin is currently facing a key resistance level at $62,910. A successful breakout and sustained price action above this level could pave the way for a move toward $67,100 as the first target.
However, if the breakout fails, $58,700 remains the nearest major support level to watch.
✍🏻 Risk management remains essential amid the current market volatility.
Bitcoin is currently facing a key resistance level at $62,910. A successful breakout and sustained price action above this level could pave the way for a move toward $67,100 as the first target.
However, if the breakout fails, $58,700 remains the nearest major support level to watch.
✍🏻 Risk management remains essential amid the current market volatility.
3
765
·
--
Verified
🇮🇷🇺🇸 Iran announces full shut down of the Strait of Hormuz following US strikes.
$BTC $CL
🇮🇷🇺🇸 Iran announces full shut down of the Strait of Hormuz following US strikes.
$BTC $CL
$BTC $CL

4
2k
·
--
Bullish
$XRP Analysis | 4H Timeframe 📍
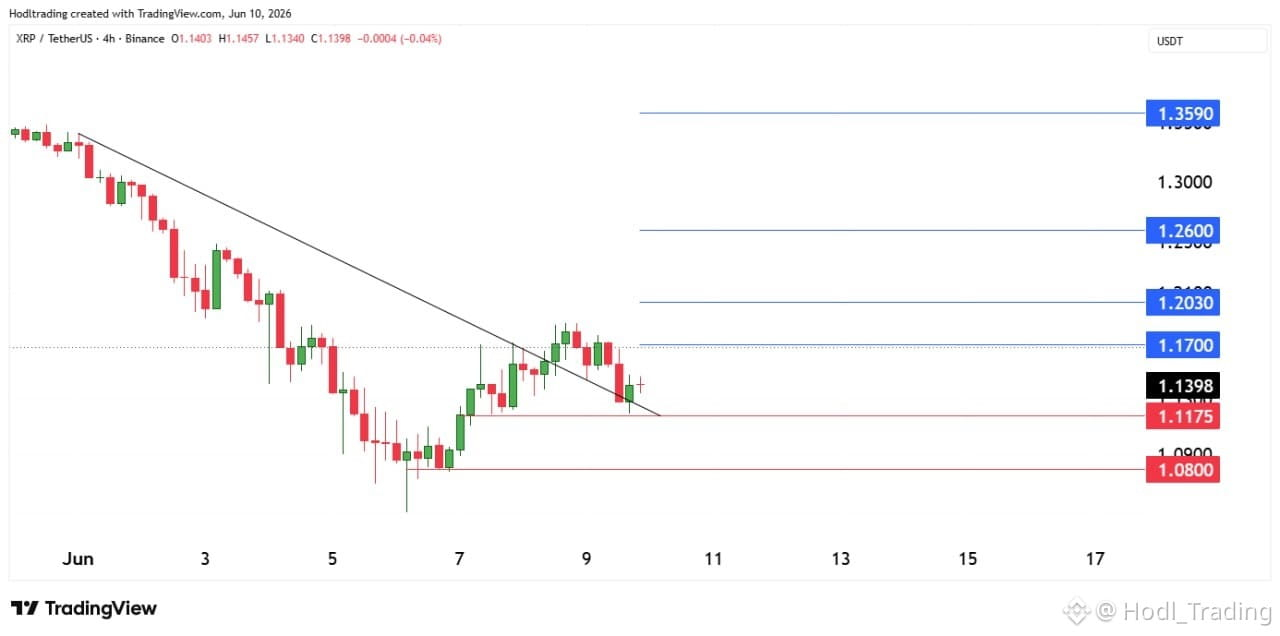
XRP continues to trade above the broken descending trendline while holding above the key support level at $1.1175, keeping the bullish outlook intact and supporting a move toward $1.1700 as the first target.
However, a break below $1.1175 and a 4-hour candle close under this level would be a negative signal, potentially opening the door for a correction toward $1.0800.
$XRP Analysis | 4H Timeframe 📍
XRP continues to trade above the broken descending trendline while holding above the key support level at $1.1175, keeping the bullish outlook intact and supporting a move toward $1.1700 as the first target.
However, a break below $1.1175 and a 4-hour candle close under this level would be a negative signal, potentially opening the door for a correction toward $1.0800.
XRP continues to trade above the broken descending trendline while holding above the key support level at $1.1175, keeping the bullish outlook intact and supporting a move toward $1.1700 as the first target.
However, a break below $1.1175 and a 4-hour candle close under this level would be a negative signal, potentially opening the door for a correction toward $1.0800.
1
4
2.7k
·
--
Bullish
3
13
4.5k
Log in to explore more content
Join global crypto users on Binance Square
⚡️ Get latest and useful information about crypto.
💬 Trusted by the world’s largest crypto exchange.
👍 Discover real insights from verified creators.
Email / Phone number