
Haider Hunter
542 Posts

Haider Hunter
Report
Block User
Crypto Spot and future Trader | , 💎 Real-time analysis & breakout alerts | 🔥 Smart entries, profit-taking strategies, and market insights daily!
3 Following
111 Followers
920 Liked
Posts
PINNED
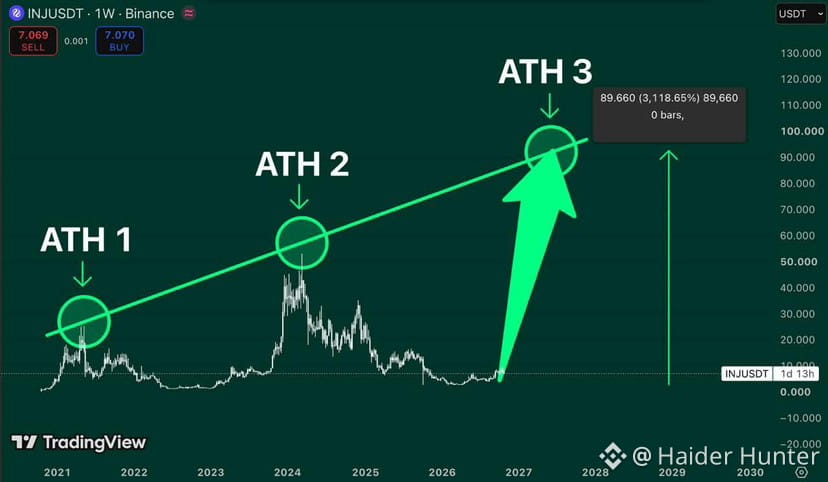
🔥 $INJ FROM $7 TO $95 IN THE NEXT CYCLE
$INJ has made higher highs across previous cycles around $25 in 2021 and $50 in 2024. Now trading near $7 could the next cycle bring another major move
A $95 target is a speculative scenario not a guarantee but if history repeats today's skeptics might see the chart differently
🔥 $INJ FROM $7 TO $95 IN THE NEXT CYCLE
$INJ has made higher highs across previous cycles around $25 in 2021 and $50 in 2024. Now trading near $7 could the next cycle bring another major move
A $95 target is a speculative scenario not a guarantee but if history repeats today's skeptics might see the chart differently
$INJ has made higher highs across previous cycles around $25 in 2021 and $50 in 2024. Now trading near $7 could the next cycle bring another major move
A $95 target is a speculative scenario not a guarantee but if history repeats today's skeptics might see the chart differently
17
3
16
11.8k
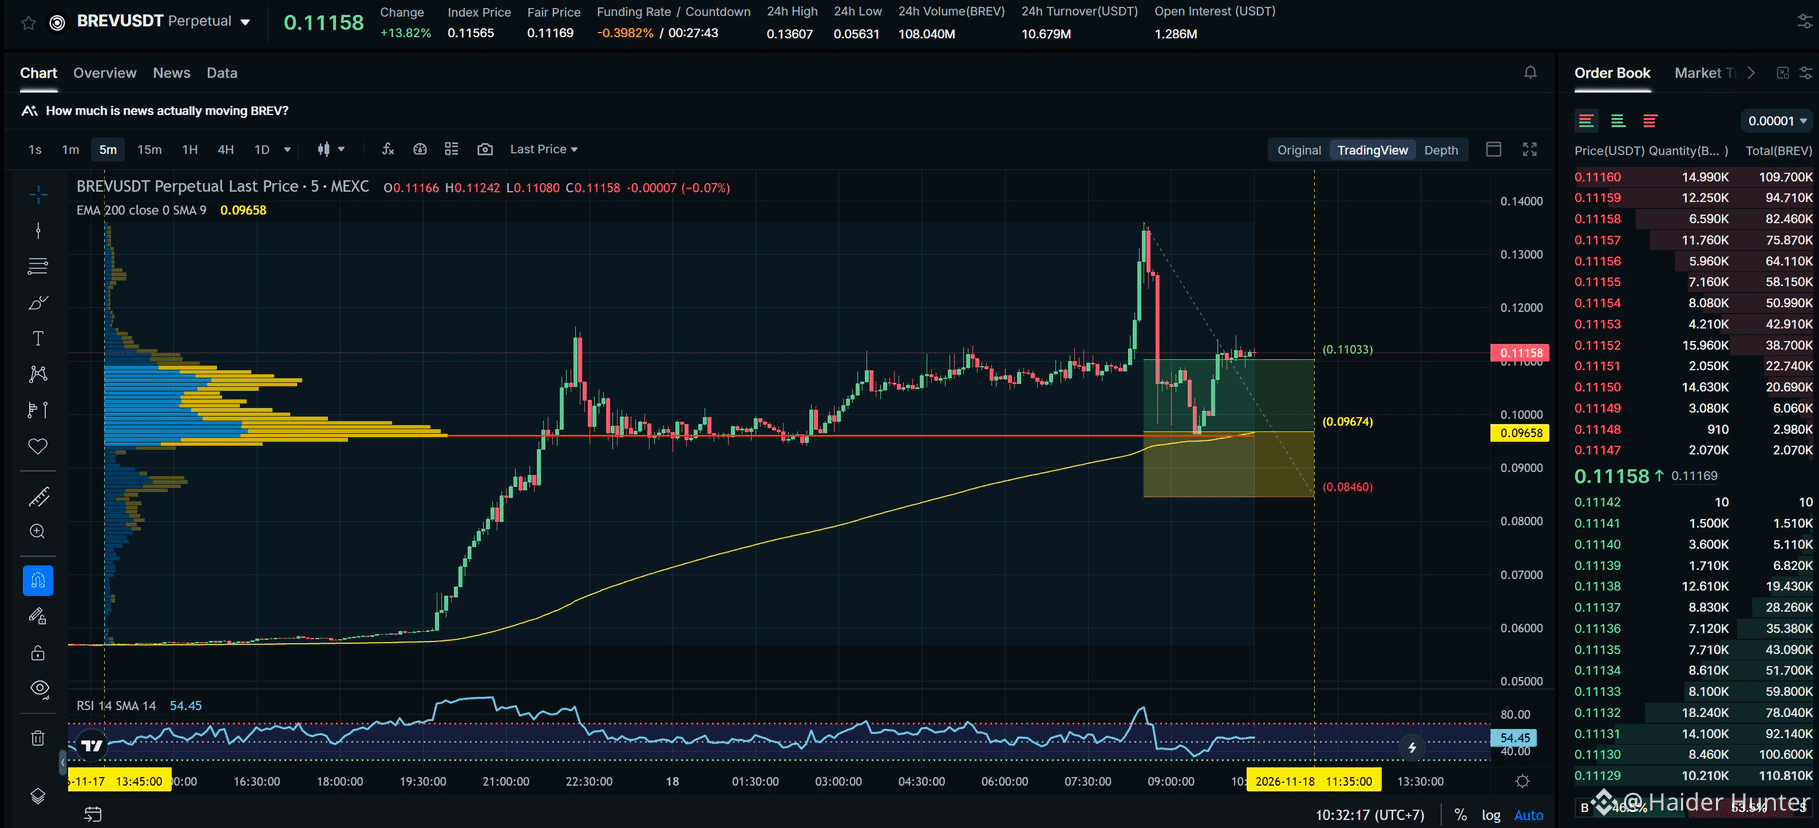
🚀 $BREV Bulls Are Taking Control 140% Surge!
$BREV has a $28.7M market cap with bullish sentiment at +1.77. The uptrend has continued for 20h 45m delivering a maximum gain of 140.09%.
A pending SC02 M5 Long order is targeting an entry around the POC with no weak zone interference. Buyers remain in control as long as support holds.
Key Levels:
Support Zone: ~12.60% wide
Trend: Bullish
Max Gain: +140.09%
Risk: Support breakdown could trigger a bearish reversal.
$BREV
{future}(BREVUSDT)
🚀 $BREV Bulls Are Taking Control 140% Surge!
$BREV has a $28.7M market cap with bullish sentiment at +1.77. The uptrend has continued for 20h 45m delivering a maximum gain of 140.09%.
A pending SC02 M5 Long order is targeting an entry around the POC with no weak zone interference. Buyers remain in control as long as support holds.
Key Levels:
Support Zone: ~12.60% wide
Trend: Bullish
Max Gain: +140.09%
Risk: Support breakdown could trigger a bearish reversal.
$BREV
$BREV has a $28.7M market cap with bullish sentiment at +1.77. The uptrend has continued for 20h 45m delivering a maximum gain of 140.09%.
A pending SC02 M5 Long order is targeting an entry around the POC with no weak zone interference. Buyers remain in control as long as support holds.
Key Levels:
Support Zone: ~12.60% wide
Trend: Bullish
Max Gain: +140.09%
Risk: Support breakdown could trigger a bearish reversal.
$BREV
1
80
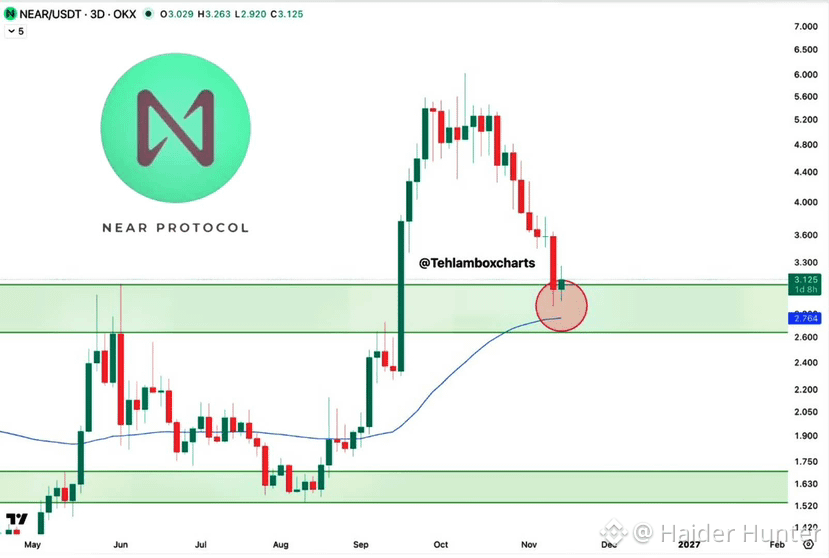
🚨 $NEAR 𝐁𝐔𝐋𝐋𝐈𝐒𝐇 𝐌𝐎𝐌𝐄𝐍𝐓𝐔𝐌 𝐈𝐒 𝐁𝐔𝐈𝐋𝐃𝐈𝐍𝐆!
Adding more $NEAR as market structure strengthens buyers are stepping up, and a potential breakout could be closer than expected!
🔥 Eyes on NEAR the next move could be explosive
🚨 $NEAR 𝐁𝐔𝐋𝐋𝐈𝐒𝐇 𝐌𝐎𝐌𝐄𝐍𝐓𝐔𝐌 𝐈𝐒 𝐁𝐔𝐈𝐋𝐃𝐈𝐍𝐆!
Adding more $NEAR as market structure strengthens buyers are stepping up, and a potential breakout could be closer than expected!
🔥 Eyes on NEAR the next move could be explosive
Adding more $NEAR as market structure strengthens buyers are stepping up, and a potential breakout could be closer than expected!
🔥 Eyes on NEAR the next move could be explosive
4
3
190
🐸🔥$PEPE IS WAKING UP! BULLS ARE BACK?
$PEPE is showing fresh strength after bouncing from the $0.00000371 low on the 1H chart With claims of Justin Sun accumulation adding to the buzz buyers are stepping in but resistance still needs to break
A clean retest of the $0.00000378–$0.00000382 entry zone could offer another push higher. Don't chase the pump. Wait for confirmation and manage risk!
TP: $0.00000405
Stop Loss: $0.00000368
$PEPE
{spot}(PEPEUSDT)
🐸🔥$PEPE IS WAKING UP! BULLS ARE BACK?
$PEPE is showing fresh strength after bouncing from the $0.00000371 low on the 1H chart With claims of Justin Sun accumulation adding to the buzz buyers are stepping in but resistance still needs to break
A clean retest of the $0.00000378–$0.00000382 entry zone could offer another push higher. Don't chase the pump. Wait for confirmation and manage risk!
TP: $0.00000405
Stop Loss: $0.00000368
$PEPE
$PEPE is showing fresh strength after bouncing from the $0.00000371 low on the 1H chart With claims of Justin Sun accumulation adding to the buzz buyers are stepping in but resistance still needs to break
A clean retest of the $0.00000378–$0.00000382 entry zone could offer another push higher. Don't chase the pump. Wait for confirmation and manage risk!
TP: $0.00000405
Stop Loss: $0.00000368
$PEPE

1
3
81
·
--
Bullish
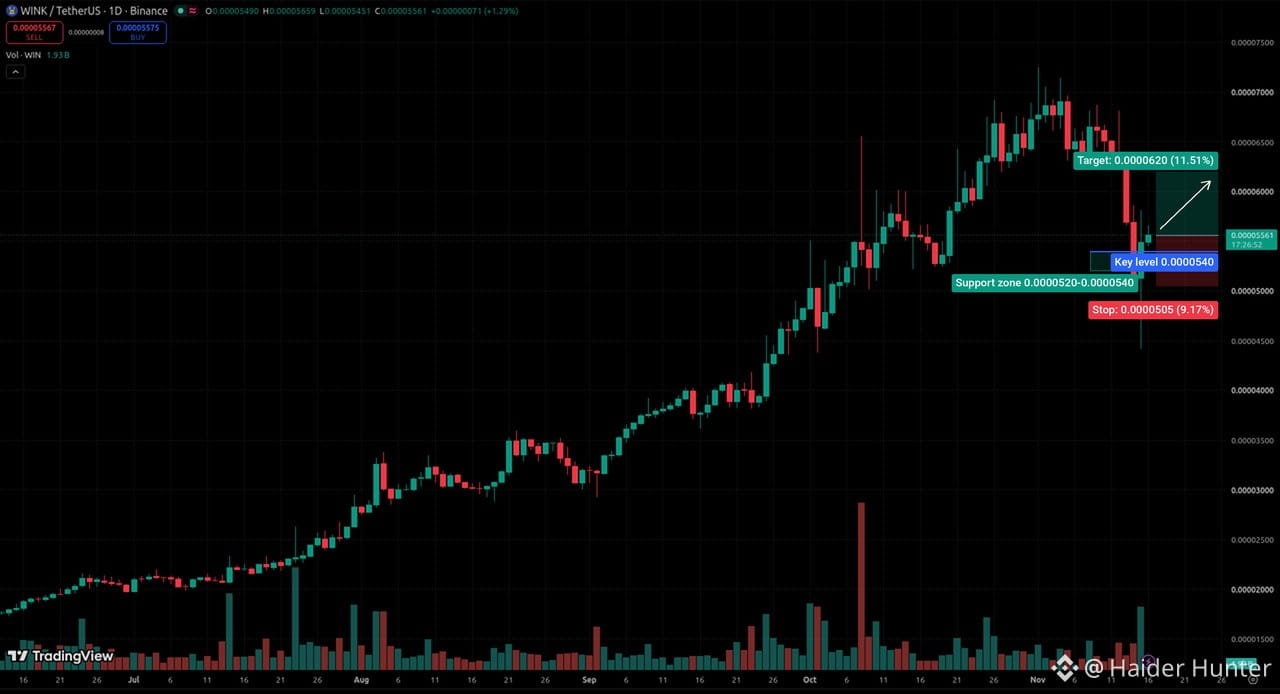
🚨 $WIN BOTTOM FORMATION OR JUST A TEMPORARY BOUNCE
The chart is showing early signs of a possible bottom after a sharp sell off but buying pressure remains weak low volume and a small daily candle suggest bulls haven’t confirmed a recovery yet
The setup looks interesting but the risk reward ratio remains questionable, especially with a tight stop loss.
Patience is key eait for the daily candle to close and confirm whether buyers can defend support before entering.
🚨 $WIN BOTTOM FORMATION OR JUST A TEMPORARY BOUNCE
The chart is showing early signs of a possible bottom after a sharp sell off but buying pressure remains weak low volume and a small daily candle suggest bulls haven’t confirmed a recovery yet
The setup looks interesting but the risk reward ratio remains questionable, especially with a tight stop loss.
Patience is key eait for the daily candle to close and confirm whether buyers can defend support before entering.
The chart is showing early signs of a possible bottom after a sharp sell off but buying pressure remains weak low volume and a small daily candle suggest bulls haven’t confirmed a recovery yet
The setup looks interesting but the risk reward ratio remains questionable, especially with a tight stop loss.
Patience is key eait for the daily candle to close and confirm whether buyers can defend support before entering.
4
4
333
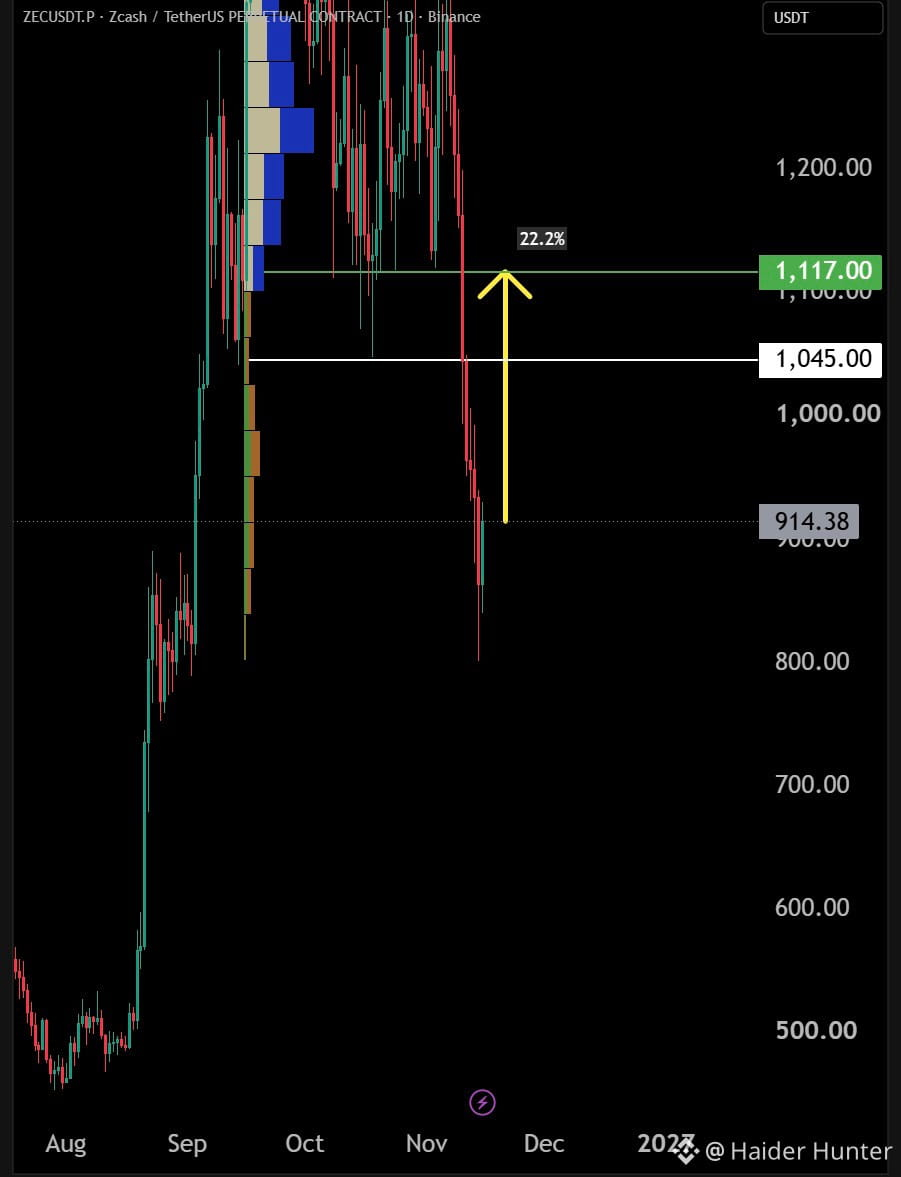
$ZEC is down 26% in a week and positioning is almost dead even at 0.92 longs per short big accounts at 1.01 funding 0.0059%. Open interest only slipped 2.2%. There's no big crowd to flush here.
Price is 900, up 4.6% in a day and 47% under the 1,699 high from Sep 26. 1,045 has turned it back five times and sits about 16% above. A coin that fell this far without a crowd stacked on one side is a cleaner chart than the ones where everyone's long.
$ZEC is down 26% in a week and positioning is almost dead even at 0.92 longs per short big accounts at 1.01 funding 0.0059%. Open interest only slipped 2.2%. There's no big crowd to flush here.
Price is 900, up 4.6% in a day and 47% under the 1,699 high from Sep 26. 1,045 has turned it back five times and sits about 16% above. A coin that fell this far without a crowd stacked on one side is a cleaner chart than the ones where everyone's long.
Price is 900, up 4.6% in a day and 47% under the 1,699 high from Sep 26. 1,045 has turned it back five times and sits about 16% above. A coin that fell this far without a crowd stacked on one side is a cleaner chart than the ones where everyone's long.
2
278
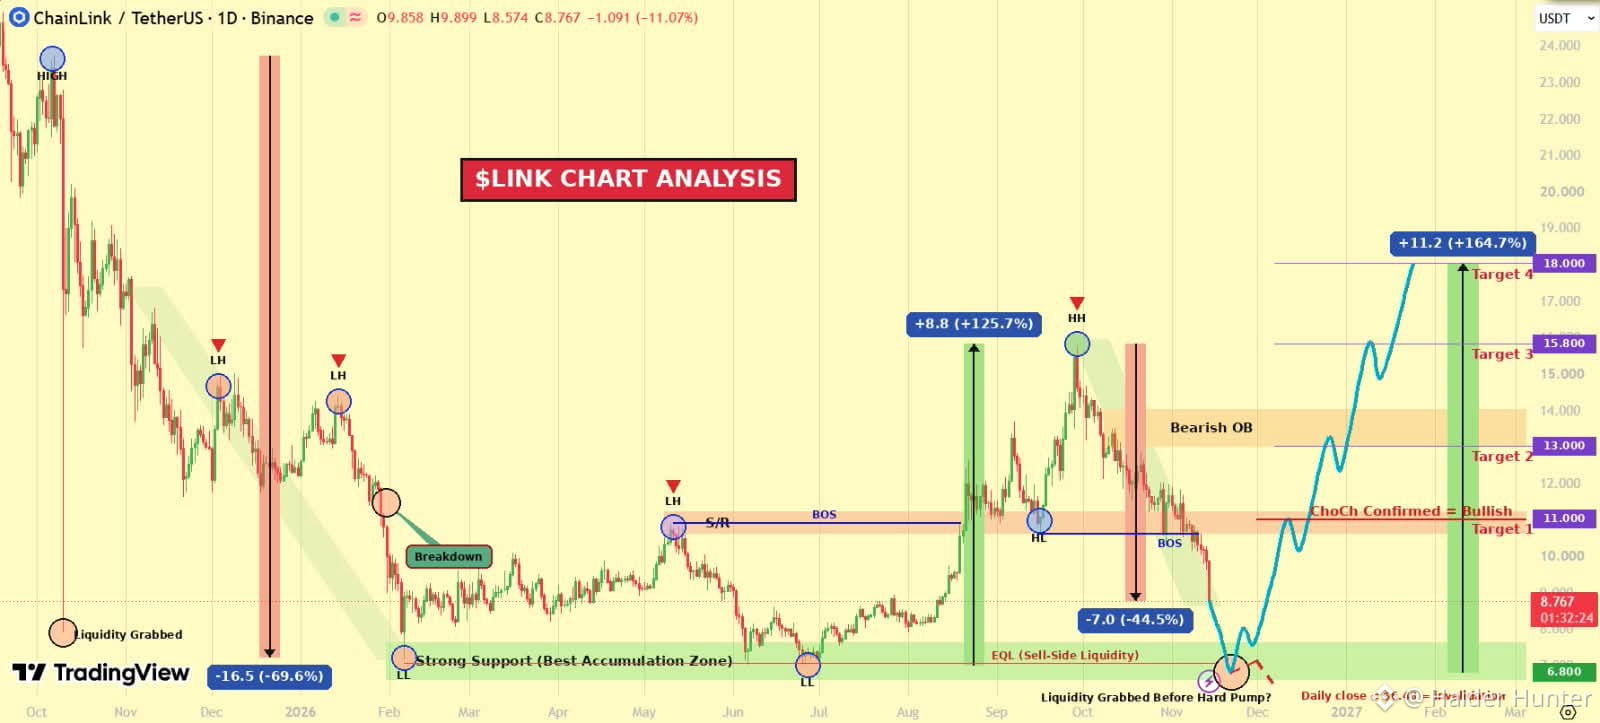
🔗 $LINK EQUAL LOWS AT $7 IS A LIQUIDITY SWEEP COMING
February and July both marked lows near $7 creating a potential pool of sell side liquidity The last bounce from this zone delivered a 125.7% rally to $15.80 but LINK has since broken bearish structure and dropped 44.5%
The current thesis a sweep toward $6.80 followed by a possible reversal a daily close above $11 would signal a bullish change of character. Confirmation matters no blind entries!
Target: $11
🔗 $LINK EQUAL LOWS AT $7 IS A LIQUIDITY SWEEP COMING
February and July both marked lows near $7 creating a potential pool of sell side liquidity The last bounce from this zone delivered a 125.7% rally to $15.80 but LINK has since broken bearish structure and dropped 44.5%
The current thesis a sweep toward $6.80 followed by a possible reversal a daily close above $11 would signal a bullish change of character. Confirmation matters no blind entries!
Target: $11
February and July both marked lows near $7 creating a potential pool of sell side liquidity The last bounce from this zone delivered a 125.7% rally to $15.80 but LINK has since broken bearish structure and dropped 44.5%
The current thesis a sweep toward $6.80 followed by a possible reversal a daily close above $11 would signal a bullish change of character. Confirmation matters no blind entries!
Target: $11
2
702
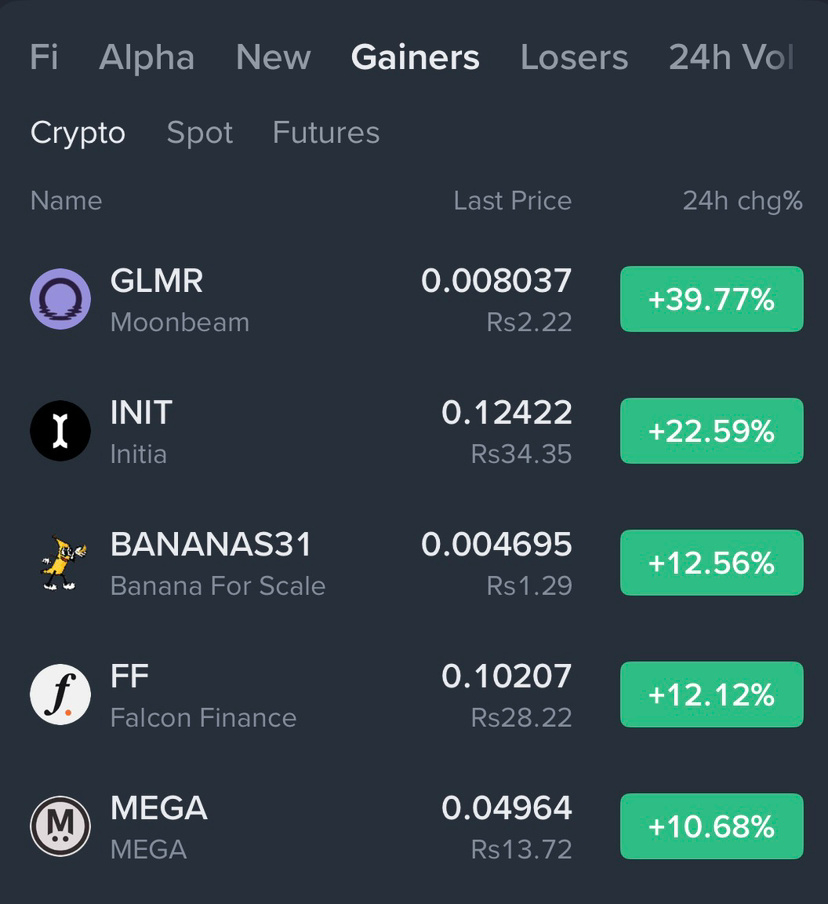
🚀 TOP 5 CRYPTO GAINERS – GREEN IS BACK! 🔥
The market is showing strong momentum! These coins are leading today’s gainers with GLMR taking the top spot at an impressive +39.77%.
📈 Top Gainers:
$GLMR +39.77% | $0.008037
$INIT +22.59% | $0.12422
$BANANAS31 +12.56% | $0.004695
#FF +12.12% | $0.10207
#MEGA +10.68% | $0.04964
🔥 Which coin do you think will pump next?
🚀 TOP 5 CRYPTO GAINERS – GREEN IS BACK! 🔥
The market is showing strong momentum! These coins are leading today’s gainers with GLMR taking the top spot at an impressive +39.77%.
📈 Top Gainers:
$GLMR +39.77% | $0.008037
$INIT +22.59% | $0.12422
$BANANAS31 +12.56% | $0.004695
#FF +12.12% | $0.10207
#MEGA +10.68% | $0.04964
🔥 Which coin do you think will pump next?
The market is showing strong momentum! These coins are leading today’s gainers with GLMR taking the top spot at an impressive +39.77%.
📈 Top Gainers:
$GLMR +39.77% | $0.008037
$INIT +22.59% | $0.12422
$BANANAS31 +12.56% | $0.004695
#FF +12.12% | $0.10207
#MEGA +10.68% | $0.04964
🔥 Which coin do you think will pump next?
4
723
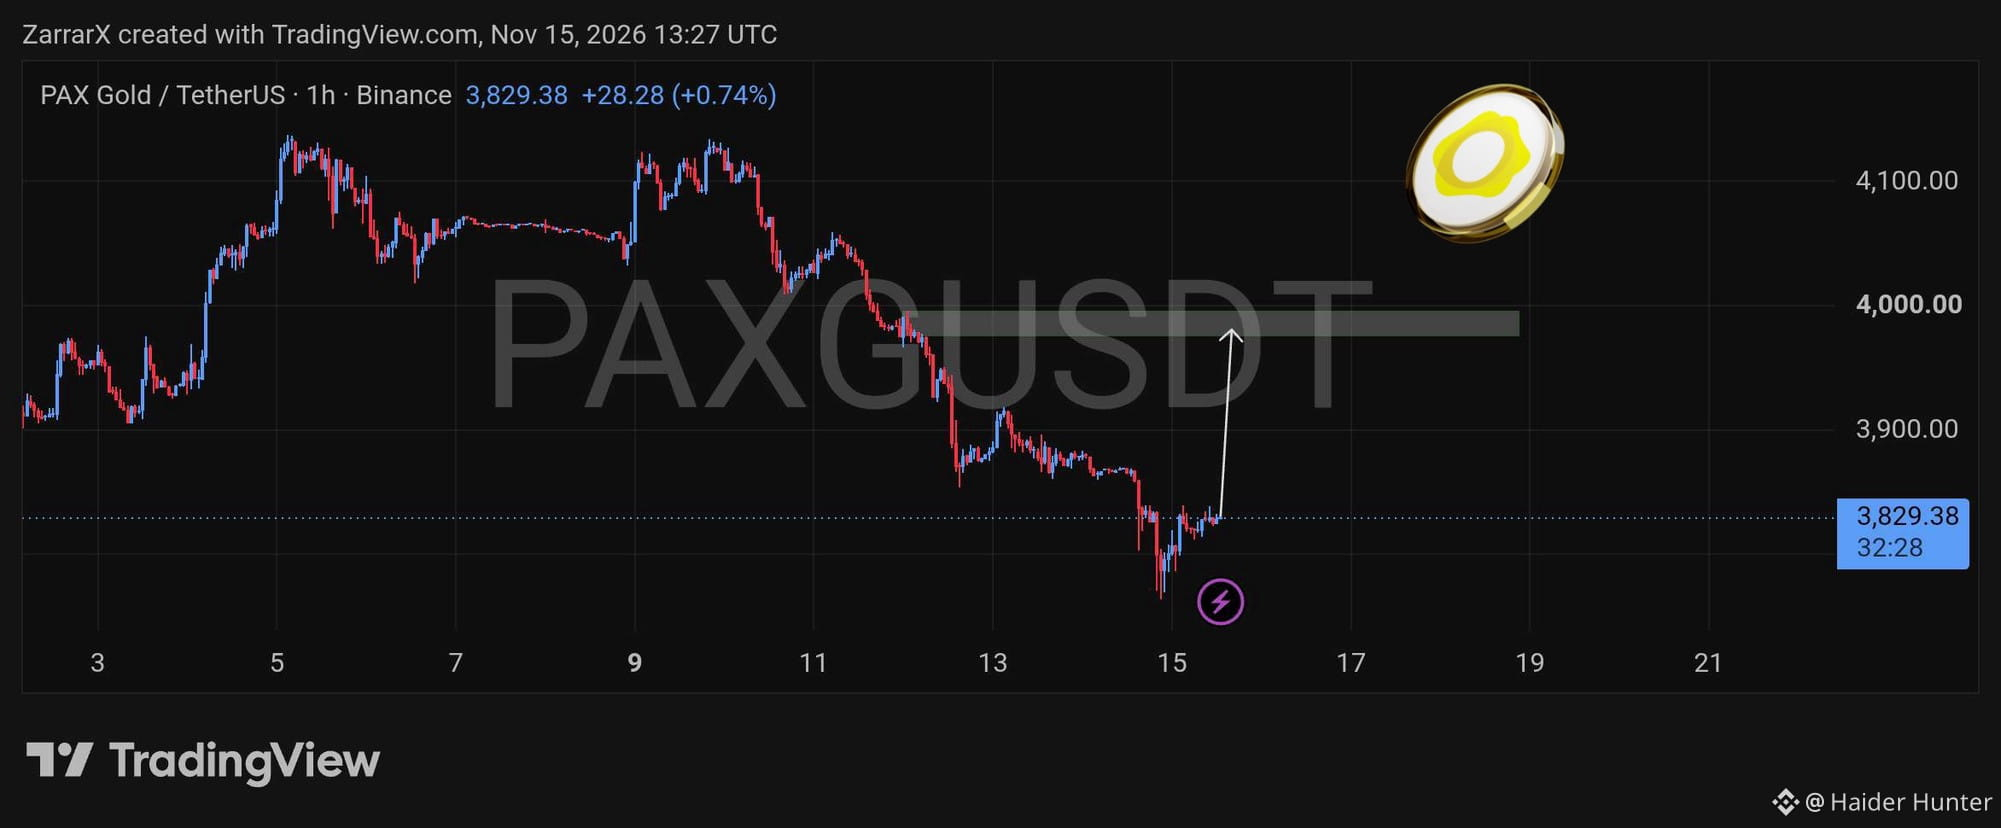
🚀 $PAXG EYES A BULLISH RECOVERY CAN BUYERS PUSH HIGHER?
$PAXG is attempting a rebound on the 1H chart after a prolonged decline from the $4,100 region. Currently trading near $3,829.38 price is showing signs of recovery but short-term pressure remains.
Bulls are now eyeing the $3,975–$3,995 resistance zone. A successful move toward this area could strengthen recovery hopes while rejection may trigger another wave of selling. The next move depends on how price reacts at resistance.
🎯 Key Levels
Resistance: $3,975–$3,995
Current Price: $3,829.38
Previous High Zone: $4,100
🚀 $PAXG EYES A BULLISH RECOVERY CAN BUYERS PUSH HIGHER?
$PAXG is attempting a rebound on the 1H chart after a prolonged decline from the $4,100 region. Currently trading near $3,829.38 price is showing signs of recovery but short-term pressure remains.
Bulls are now eyeing the $3,975–$3,995 resistance zone. A successful move toward this area could strengthen recovery hopes while rejection may trigger another wave of selling. The next move depends on how price reacts at resistance.
🎯 Key Levels
Resistance: $3,975–$3,995
Current Price: $3,829.38
Previous High Zone: $4,100
$PAXG is attempting a rebound on the 1H chart after a prolonged decline from the $4,100 region. Currently trading near $3,829.38 price is showing signs of recovery but short-term pressure remains.
Bulls are now eyeing the $3,975–$3,995 resistance zone. A successful move toward this area could strengthen recovery hopes while rejection may trigger another wave of selling. The next move depends on how price reacts at resistance.
🎯 Key Levels
Resistance: $3,975–$3,995
Current Price: $3,829.38
Previous High Zone: $4,100
2
154
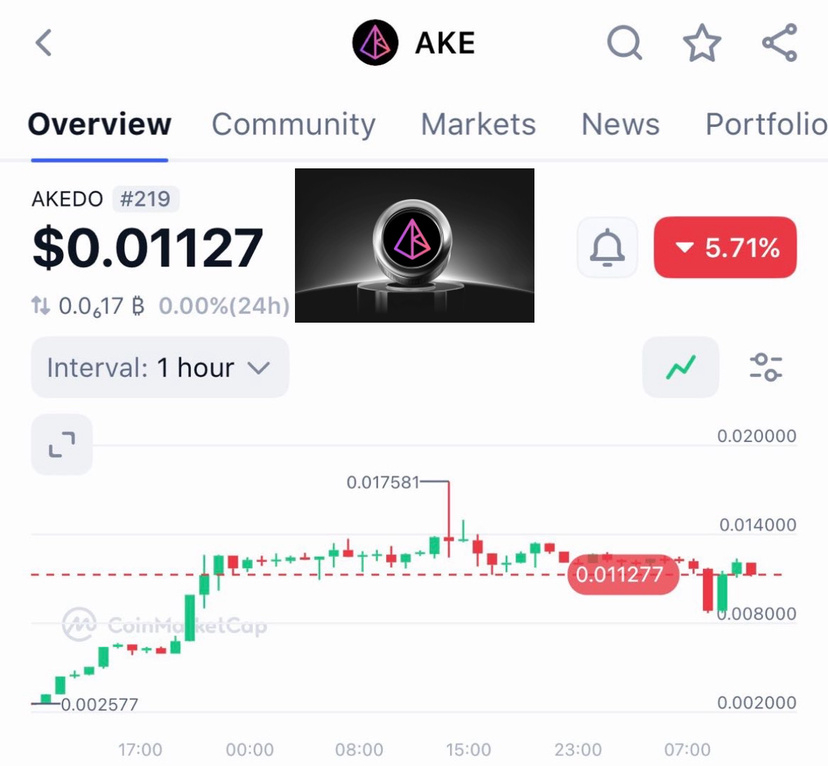
$AKE is facing a cooldown after its massive
previous rally.
Current price: $0.01127
Displayed change: -5.71%
Recent chart high: $0.01758
Price is consolidating around $0.011.
$AKE is facing a cooldown after its massive
previous rally.
Current price: $0.01127
Displayed change: -5.71%
Recent chart high: $0.01758
Price is consolidating around $0.011.
previous rally.
Current price: $0.01127
Displayed change: -5.71%
Recent chart high: $0.01758
Price is consolidating around $0.011.
4
96
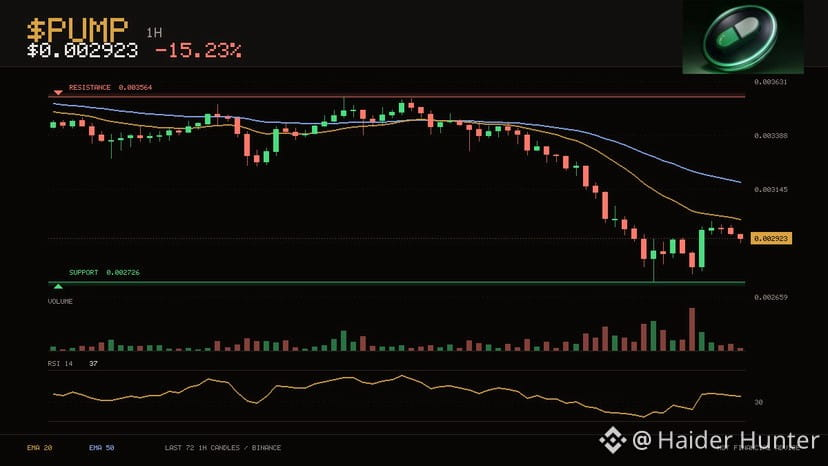
$PUMP trades at $0.002923 still on the weak side of its hourly averages. The three day range runs from $0.002726 up to $0.003564.
Price is down in the lower third of that range. The floor is 6.7% away and the ceiling is nowhere close. The
20 has stayed below the 50 for 33 candles. RSI at
37 is neutral so momentum is not blocking a move either way.
Over the past day it has traded between $0.002726 and $0.003449, sitting near the bottom of it now. The last 24 hours carried roughly 2.1x normal volume. Down 15.2% over 24
$PUMP trades at $0.002923 still on the weak side of its hourly averages. The three day range runs from $0.002726 up to $0.003564.
Price is down in the lower third of that range. The floor is 6.7% away and the ceiling is nowhere close. The
20 has stayed below the 50 for 33 candles. RSI at
37 is neutral so momentum is not blocking a move either way.
Over the past day it has traded between $0.002726 and $0.003449, sitting near the bottom of it now. The last 24 hours carried roughly 2.1x normal volume. Down 15.2% over 24
Price is down in the lower third of that range. The floor is 6.7% away and the ceiling is nowhere close. The
20 has stayed below the 50 for 33 candles. RSI at
37 is neutral so momentum is not blocking a move either way.
Over the past day it has traded between $0.002726 and $0.003449, sitting near the bottom of it now. The last 24 hours carried roughly 2.1x normal volume. Down 15.2% over 24
3
72
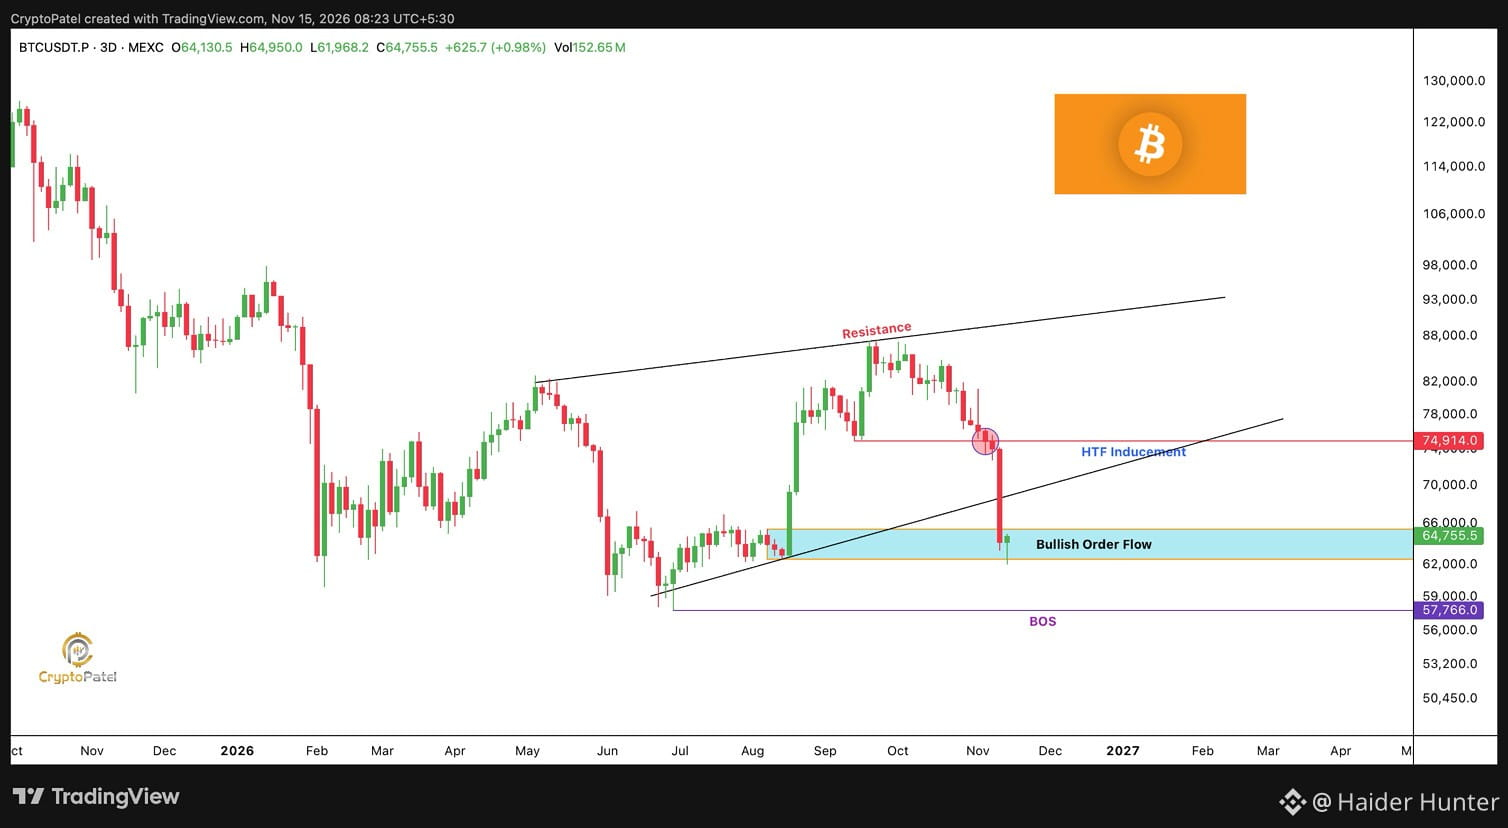
$BTC ONE SUPPORT ZONE COULD DECIDE
WHETHER WE SEE $100K OR $40K NEXT.
Bitcoin has entered a key Bullish Order Block
Bullish Order Flow zone
Here's the simple breakdown If
$BTC holds above $62,499 on HTF candle closes, we can expect a recovery toward $75K followed by a potential move toward new highs and eventually $100K.
But if #BTC closes below $62,499 on a HTF things could turn ugly.
Watch the $57,766 BOS level. A HTF close below this level could open the door toward $50K-
$40K.
I gave my exit signal above $85K. Hopefully you booked profits on the way down and protected your hard-earned capital instead of blindly holding longs.
No need to thank me. Just remember:
Follow the charts respect the levels and make your decisions carefully.
Your capital comes first. Always.
$BTC ONE SUPPORT ZONE COULD DECIDE
WHETHER WE SEE $100K OR $40K NEXT.
Bitcoin has entered a key Bullish Order Block
Bullish Order Flow zone
Here's the simple breakdown If
$BTC holds above $62,499 on HTF candle closes, we can expect a recovery toward $75K followed by a potential move toward new highs and eventually $100K.
But if #BTC closes below $62,499 on a HTF things could turn ugly.
Watch the $57,766 BOS level. A HTF close below this level could open the door toward $50K-
$40K.
I gave my exit signal above $85K. Hopefully you booked profits on the way down and protected your hard-earned capital instead of blindly holding longs.
No need to thank me. Just remember:
Follow the charts respect the levels and make your decisions carefully.
Your capital comes first. Always.
WHETHER WE SEE $100K OR $40K NEXT.
Bitcoin has entered a key Bullish Order Block
Bullish Order Flow zone
Here's the simple breakdown If
$BTC holds above $62,499 on HTF candle closes, we can expect a recovery toward $75K followed by a potential move toward new highs and eventually $100K.
But if #BTC closes below $62,499 on a HTF things could turn ugly.
Watch the $57,766 BOS level. A HTF close below this level could open the door toward $50K-
$40K.
I gave my exit signal above $85K. Hopefully you booked profits on the way down and protected your hard-earned capital instead of blindly holding longs.
No need to thank me. Just remember:
Follow the charts respect the levels and make your decisions carefully.
Your capital comes first. Always.
4
106
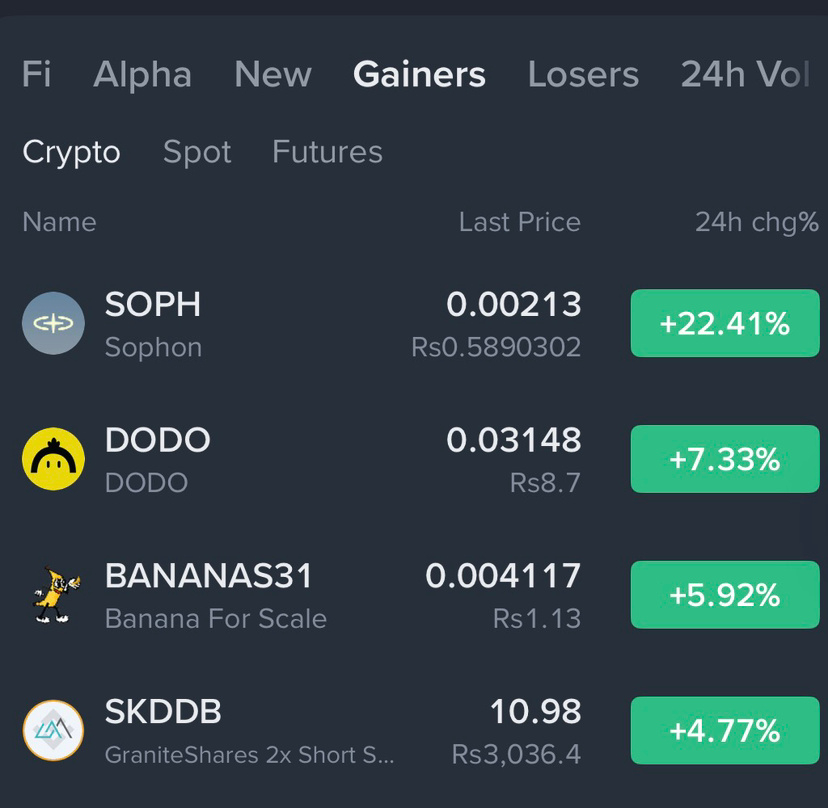
🚀🔥 TOP GAINERS ARE SHOWING GREEN!
$SOPH leads the board with +22.41% followed by $DODO at +7.33% and $BANANAS31 at +5.92%.
Momentum is building but smart traders always watch volume before chasing pumps 💎
🚀🔥 TOP GAINERS ARE SHOWING GREEN!
$SOPH leads the board with +22.41% followed by $DODO at +7.33% and $BANANAS31 at +5.92%.
Momentum is building but smart traders always watch volume before chasing pumps 💎
$SOPH leads the board with +22.41% followed by $DODO at +7.33% and $BANANAS31 at +5.92%.
Momentum is building but smart traders always watch volume before chasing pumps 💎
3
458
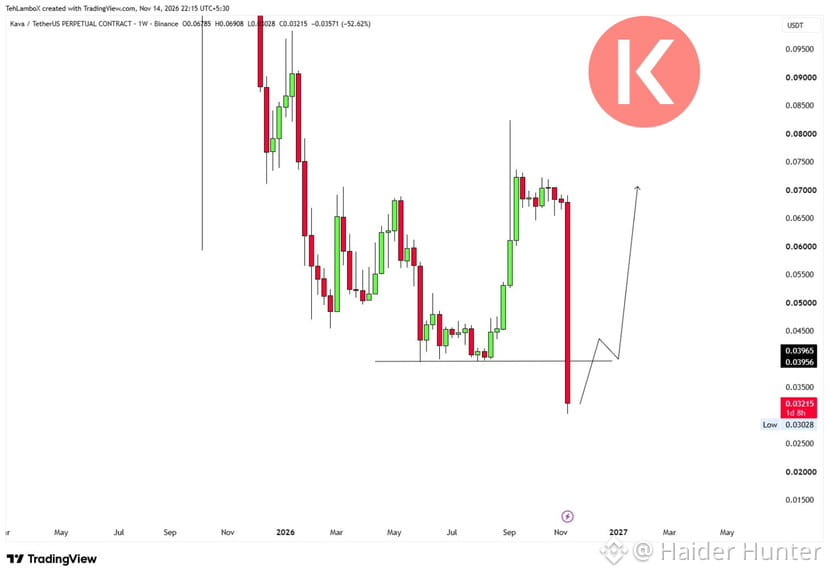
🚨 $KAVA IS DYING CAN IT RECLAIM $0.04
$KAVA is sitting at a critical point reclaiming $0.04 could signal that this dip is forming a bottom and open the door toward $0.07. Bulls need to step in and prove their strength!
But failure to recover $0.04 would keep the bearish pressure alive Until buyers reclaim that level the risk of further downside remains
🚨 $KAVA IS DYING CAN IT RECLAIM $0.04
$KAVA is sitting at a critical point reclaiming $0.04 could signal that this dip is forming a bottom and open the door toward $0.07. Bulls need to step in and prove their strength!
But failure to recover $0.04 would keep the bearish pressure alive Until buyers reclaim that level the risk of further downside remains
$KAVA is sitting at a critical point reclaiming $0.04 could signal that this dip is forming a bottom and open the door toward $0.07. Bulls need to step in and prove their strength!
But failure to recover $0.04 would keep the bearish pressure alive Until buyers reclaim that level the risk of further downside remains
4
8
1.6k
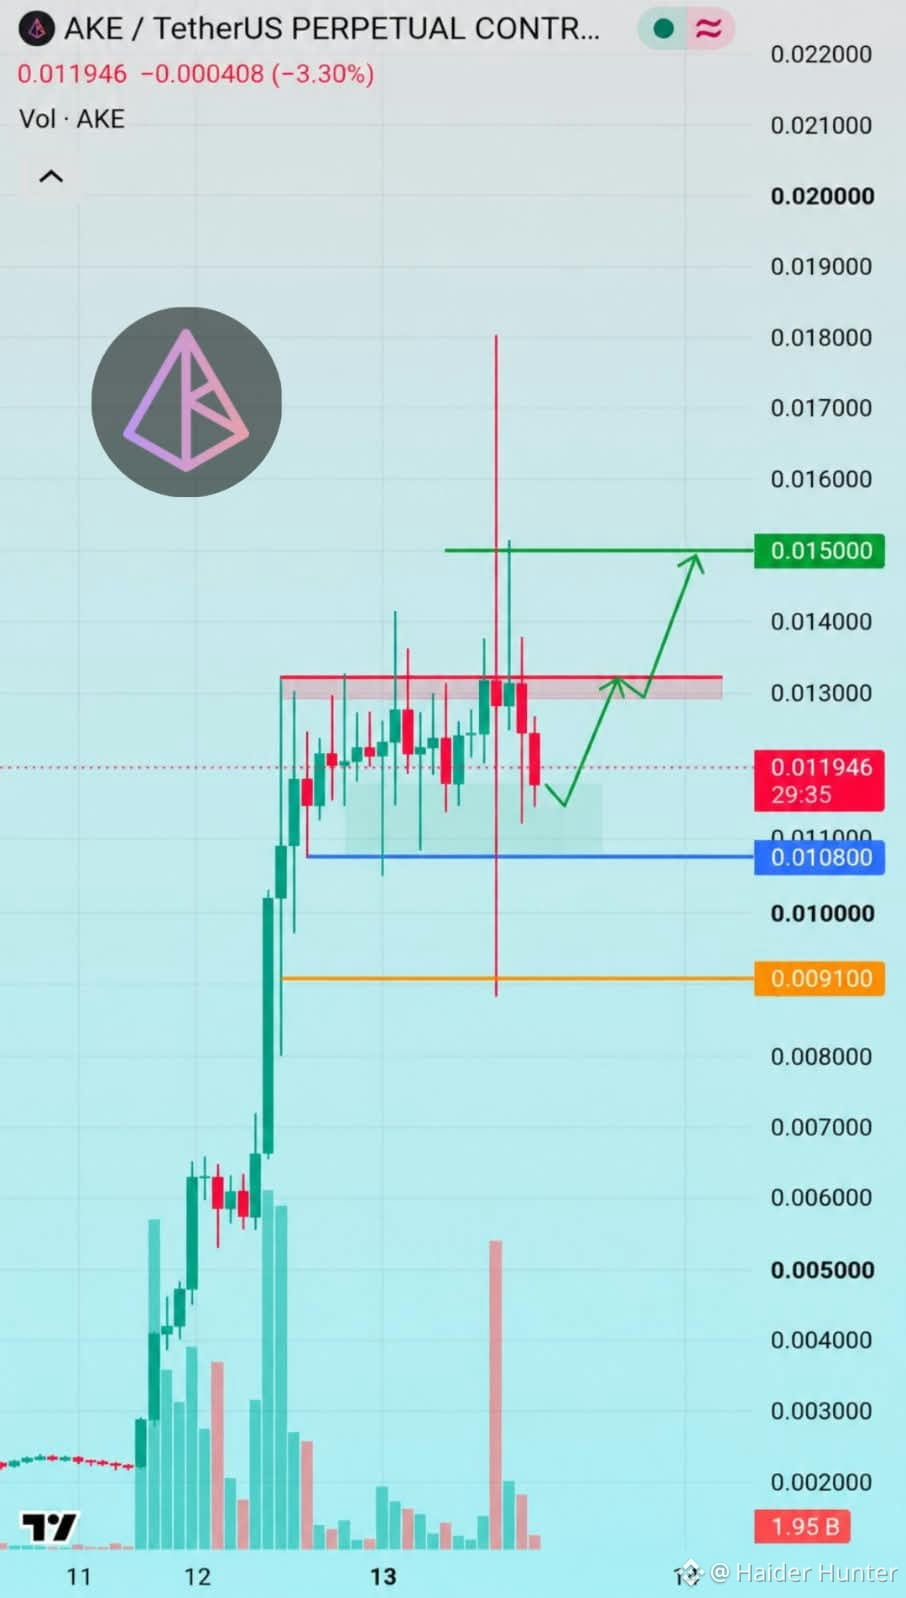
⚠️ $AKE LIQUIDITY HUNT A SHARP REVERSAL WAS ON THE RADAR!
I warned that the explosive rally could end in a correction. Price exceeded expectations wicked toward $0.018 then faced a hard rejection and fell near $0.012
The sell walls are worth watching: $316K at $0.0128 and $206K at $0.0150. The rejection looks suspicious, but it doesn't prove manipulation
Now $0.0108 is the key support. Hold it and reclaim $0.0133,
and another push toward $0.015 could follow. Lose support and $0.0091 comes into focus. Don't chase the hype respect the levels!
Target 1: $0.0150
Target 2: $0.0091
⚠️ $AKE LIQUIDITY HUNT A SHARP REVERSAL WAS ON THE RADAR!
I warned that the explosive rally could end in a correction. Price exceeded expectations wicked toward $0.018 then faced a hard rejection and fell near $0.012
The sell walls are worth watching: $316K at $0.0128 and $206K at $0.0150. The rejection looks suspicious, but it doesn't prove manipulation
Now $0.0108 is the key support. Hold it and reclaim $0.0133,
and another push toward $0.015 could follow. Lose support and $0.0091 comes into focus. Don't chase the hype respect the levels!
Target 1: $0.0150
Target 2: $0.0091
I warned that the explosive rally could end in a correction. Price exceeded expectations wicked toward $0.018 then faced a hard rejection and fell near $0.012
The sell walls are worth watching: $316K at $0.0128 and $206K at $0.0150. The rejection looks suspicious, but it doesn't prove manipulation
Now $0.0108 is the key support. Hold it and reclaim $0.0133,
and another push toward $0.015 could follow. Lose support and $0.0091 comes into focus. Don't chase the hype respect the levels!
Target 1: $0.0150
Target 2: $0.0091
5
655
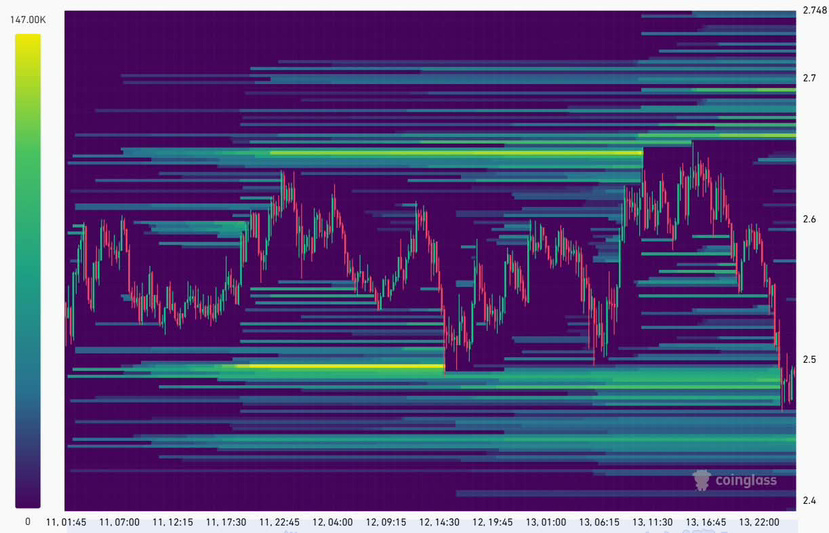
♾️ $ICP TWO MAJOR LIQUIDATION CLUSTERS CLEARED WHAT’S NEXT
Both major clusters at $2.65 and $2.49 have been wiped out price now sits near $2.48, with the next long liquidation zone at $2.44–$2.46
A bounce could target $2.55–$2.59, while the bigger liquidity magnet sits at $2.66–$2.69 Will price sweep lower first or head straight for the short liquidations
Target 1: $2.55–$2.59
Target 2: $2.66–$2.69
♾️ $ICP TWO MAJOR LIQUIDATION CLUSTERS CLEARED WHAT’S NEXT
Both major clusters at $2.65 and $2.49 have been wiped out price now sits near $2.48, with the next long liquidation zone at $2.44–$2.46
A bounce could target $2.55–$2.59, while the bigger liquidity magnet sits at $2.66–$2.69 Will price sweep lower first or head straight for the short liquidations
Target 1: $2.55–$2.59
Target 2: $2.66–$2.69
Both major clusters at $2.65 and $2.49 have been wiped out price now sits near $2.48, with the next long liquidation zone at $2.44–$2.46
A bounce could target $2.55–$2.59, while the bigger liquidity magnet sits at $2.66–$2.69 Will price sweep lower first or head straight for the short liquidations
Target 1: $2.55–$2.59
Target 2: $2.66–$2.69
5
1.3k
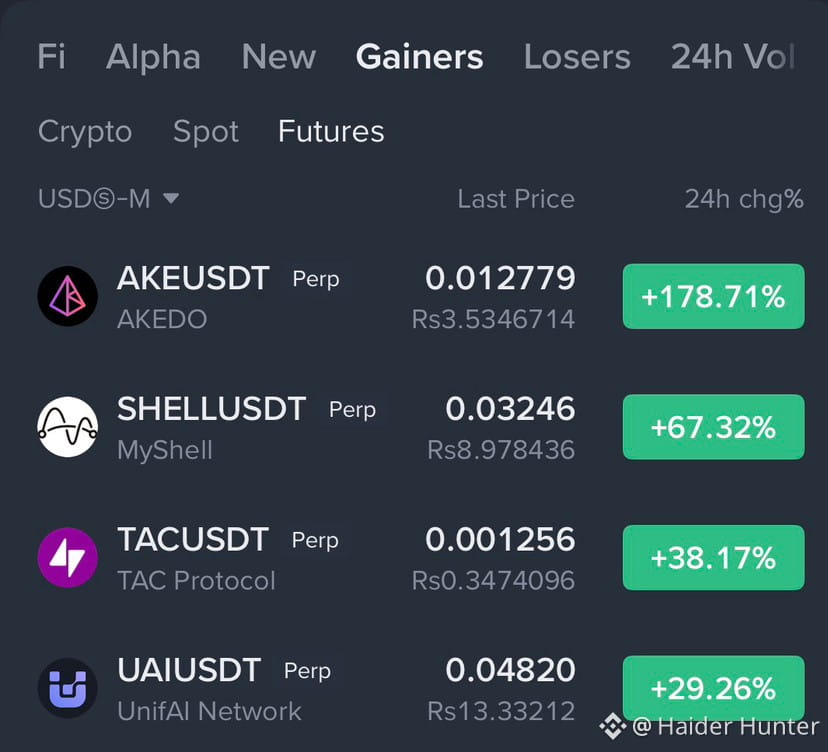
🚀 FUTURES MARKET EXPLODES AKEDO SURGES 178% IN 24 HOURS
Crypto futures are seeing massive gains AKEDO #AKEUSDT leads the leaderboard with an impressive +178.71% surge followed by MyShell +67.32% and TAC Protocol +38.17% UnifAI Network is also climbing with a solid +29.26% gain.
🔥 Top Futures Gainers (24H)
$AKE USDT: +178.71%
$SHELL USDT: +67.32%
$TAC USDT: +38.17%
#UAI USDT: +29.26%
🚀 FUTURES MARKET EXPLODES AKEDO SURGES 178% IN 24 HOURS
Crypto futures are seeing massive gains AKEDO #AKEUSDT leads the leaderboard with an impressive +178.71% surge followed by MyShell +67.32% and TAC Protocol +38.17% UnifAI Network is also climbing with a solid +29.26% gain.
🔥 Top Futures Gainers (24H)
$AKE USDT: +178.71%
$SHELL USDT: +67.32%
$TAC USDT: +38.17%
#UAI USDT: +29.26%
Crypto futures are seeing massive gains AKEDO #AKEUSDT leads the leaderboard with an impressive +178.71% surge followed by MyShell +67.32% and TAC Protocol +38.17% UnifAI Network is also climbing with a solid +29.26% gain.
🔥 Top Futures Gainers (24H)
$AKE USDT: +178.71%
$SHELL USDT: +67.32%
$TAC USDT: +38.17%
#UAI USDT: +29.26%
1
5
1.2k
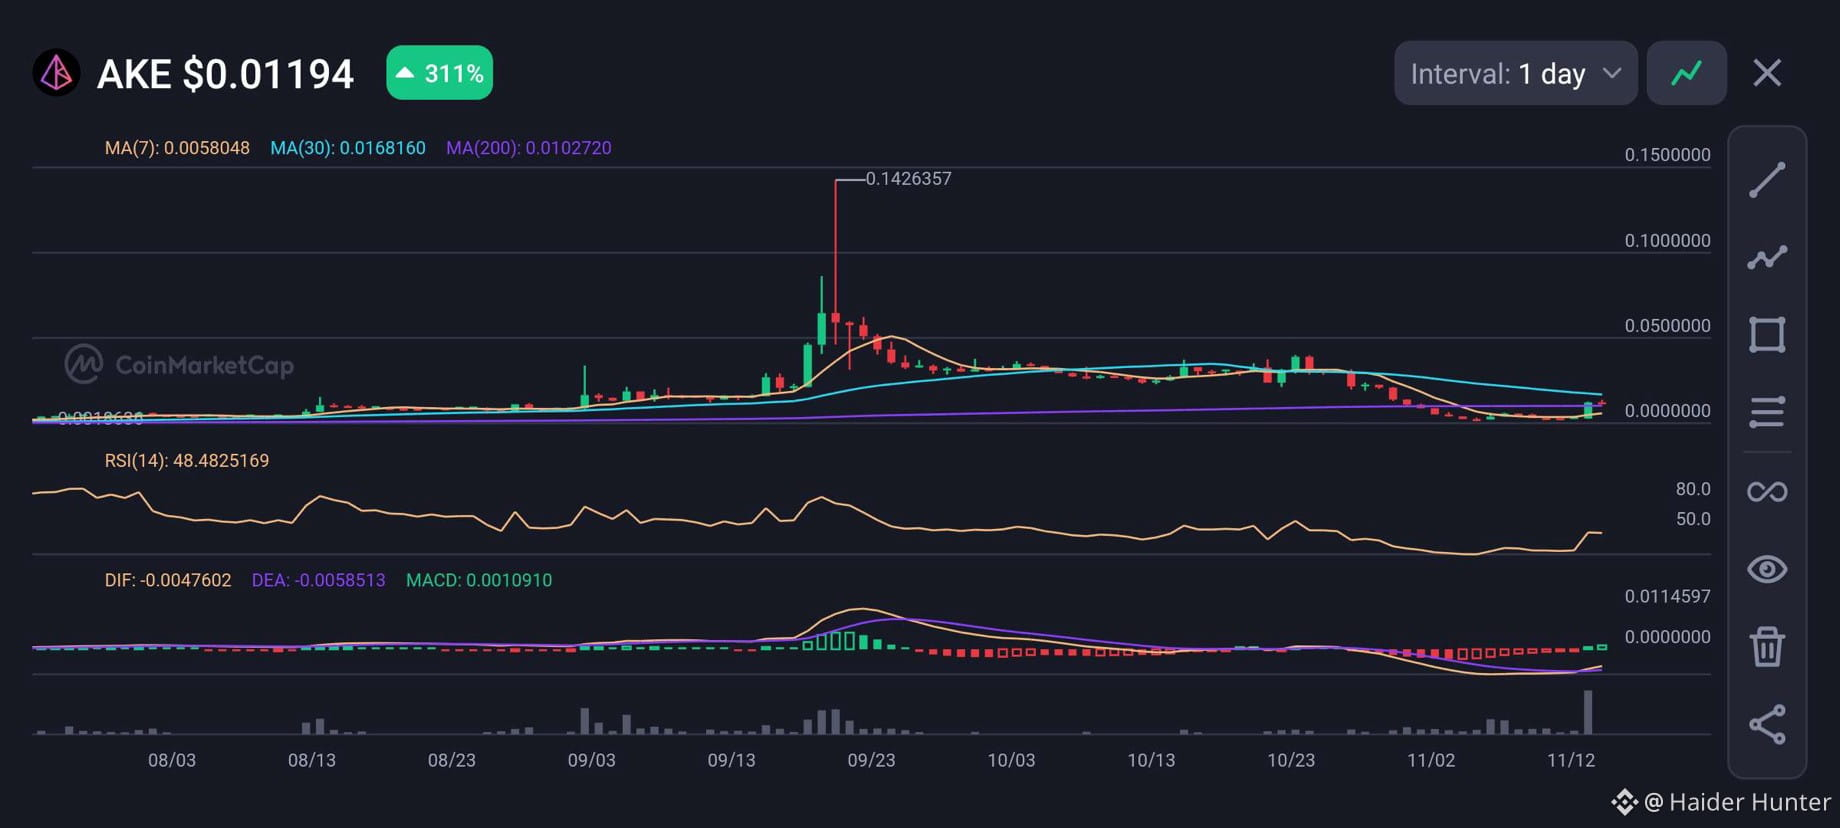
$AKE is currently trading at $0.01194 up 311% in 24 hours following a strong recovery from its $0.001963 support zone. The rally has pushed price above the 200-day moving average at $0.01027 signalling improving momentum.
Price is now above MA(7) at $0.00580 and
MA(200) but remains below MA(30) at $0.01681. The MACD histogram has turned positive at 0.001091 with DIF above DEA confirming a bullish crossover. Meanwhile RSI at 48.48 remains neutral leaving room for further movement.
In my view $AKE is showing signs of a
possible trend reversal after its prolonged consolidation. However sustaining this rally will depend on continued buying pressure.
Support now sits around $0.01027 while resistance stands at $0.01681.
A daily close above this level could strengthen the recove Traders should also watch volume to determine whether the current momentum is sustainable.
DISCLAIMER: This is my personal market analysis not financial advice.
$AKE is currently trading at $0.01194 up 311% in 24 hours following a strong recovery from its $0.001963 support zone. The rally has pushed price above the 200-day moving average at $0.01027 signalling improving momentum.
Price is now above MA(7) at $0.00580 and
MA(200) but remains below MA(30) at $0.01681. The MACD histogram has turned positive at 0.001091 with DIF above DEA confirming a bullish crossover. Meanwhile RSI at 48.48 remains neutral leaving room for further movement.
In my view $AKE is showing signs of a
possible trend reversal after its prolonged consolidation. However sustaining this rally will depend on continued buying pressure.
Support now sits around $0.01027 while resistance stands at $0.01681.
A daily close above this level could strengthen the recove Traders should also watch volume to determine whether the current momentum is sustainable.
DISCLAIMER: This is my personal market analysis not financial advice.
Price is now above MA(7) at $0.00580 and
MA(200) but remains below MA(30) at $0.01681. The MACD histogram has turned positive at 0.001091 with DIF above DEA confirming a bullish crossover. Meanwhile RSI at 48.48 remains neutral leaving room for further movement.
In my view $AKE is showing signs of a
possible trend reversal after its prolonged consolidation. However sustaining this rally will depend on continued buying pressure.
Support now sits around $0.01027 while resistance stands at $0.01681.
A daily close above this level could strengthen the recove Traders should also watch volume to determine whether the current momentum is sustainable.
DISCLAIMER: This is my personal market analysis not financial advice.
2
93
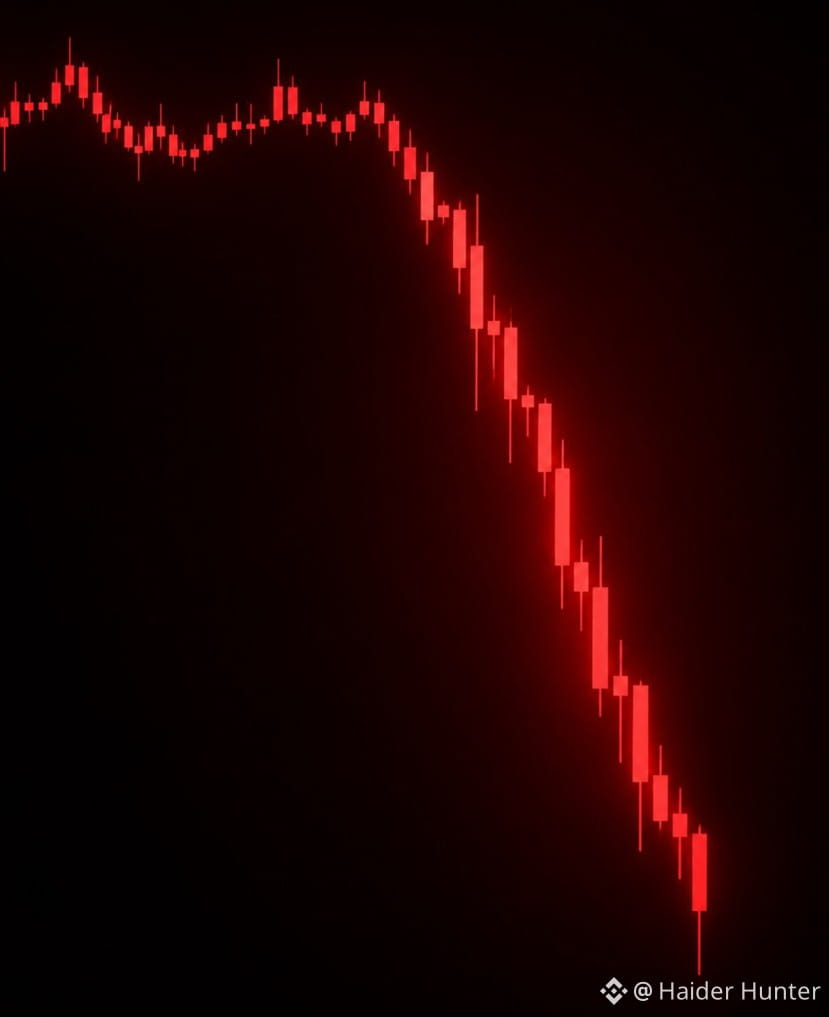
🚀$NEAR IS FACING A BRUTAL SELL-OFF
NEAR dropped nearly 30% in 30 days.
But there's another side
NEAR is bringing quantum-resistant ML-DSA signed accounts to mobile users.
Price struggles but development hasn't stopped.
NEAR holders face a serious test.
🚀$NEAR IS FACING A BRUTAL SELL-OFF
NEAR dropped nearly 30% in 30 days.
But there's another side
NEAR is bringing quantum-resistant ML-DSA signed accounts to mobile users.
Price struggles but development hasn't stopped.
NEAR holders face a serious test.
NEAR dropped nearly 30% in 30 days.
But there's another side
NEAR is bringing quantum-resistant ML-DSA signed accounts to mobile users.
Price struggles but development hasn't stopped.
NEAR holders face a serious test.

2
83
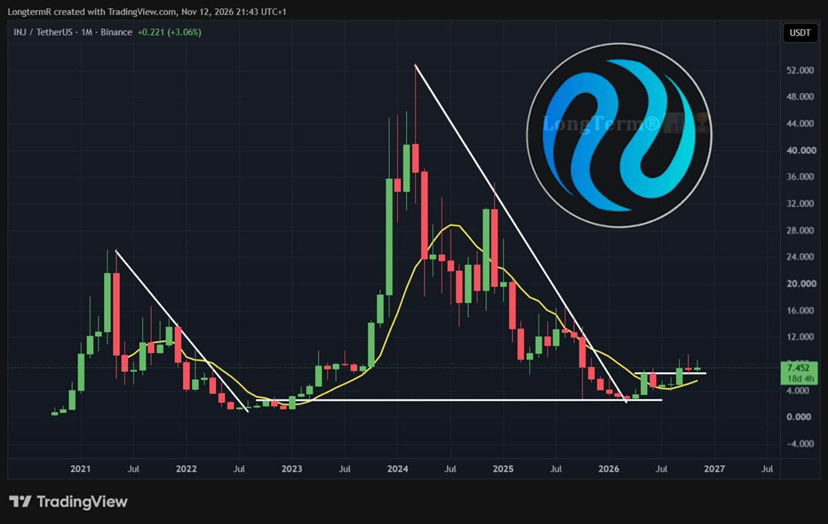
🔥 $INJ IS STANDING STRONG IN A BLEEDING MARKET!
Say what you want but INJ is showing one of the healthiest charts in this market. While others are struggling INJ continues to stand out
Added more during this dip It's currently my biggest position Conviction remains strong.
🔥 $INJ IS STANDING STRONG IN A BLEEDING MARKET!
Say what you want but INJ is showing one of the healthiest charts in this market. While others are struggling INJ continues to stand out
Added more during this dip It's currently my biggest position Conviction remains strong.
Say what you want but INJ is showing one of the healthiest charts in this market. While others are struggling INJ continues to stand out
Added more during this dip It's currently my biggest position Conviction remains strong.
3
172
Log in to explore more content
Join global crypto users on Binance Square
⚡️ Get latest and useful information about crypto.
💬 Trusted by the world’s largest crypto exchange.
👍 Discover real insights from verified creators.
Email / Phone number
Trending Topics
NvidiaBeatsEstimatesWith$130BQ4Outlook
4,976 views
92 Discussing
Nvidia Beats With $115.8 Billion in Revenue, Guides to $130 Billion and Adds $150 Billion Buyback
Binance News
·28 Likes
·34.3k views
AnthropicIPOPriceCouldExceed$80
9,900 views
96 Discussing
CanNvidia’sDataCenterGrowthContinue?
24,564 views
402 Discussing