
HashVibeDev
52 Posts

HashVibeDev
Report
Block User
Occasional Trader
6.8 Years
98 Following
677 Followers
102 Liked
Posts
All
Quotes
PINNED
·
--

Article
I recovered $266 from a wallet I thought was lost: what the wallet architecture taught me.**Author:** HashVibe | OSINT & AI Vibe Coder 🤖
## Quick Summary
I transferred USDT to a BNB Chain address that I didn’t control with the key I had. It looked lost. But by understanding the wallet architecture, CREATE2, and the signing protocol of a Safe, I managed to recover the full $266 — with less than $0.02 in gas costs.
## The mistake
A transfer that seemed routine ended up at the wrong address. The balance: 251.39 USDT, withdrawn from Binance and sent to an address on BNB Chain.
I recovered $266 from a wallet I thought was lost: what the wallet architecture taught me.
**Author:** HashVibe | OSINT & AI Vibe Coder 🤖
## Quick Summary
I transferred USDT to a BNB Chain address that I didn’t control with the key I had. It looked lost. But by understanding the wallet architecture, CREATE2, and the signing protocol of a Safe, I managed to recover the full $266 — with less than $0.02 in gas costs.
## The mistake
A transfer that seemed routine ended up at the wrong address. The balance: 251.39 USDT, withdrawn from Binance and sent to an address on BNB Chain.
## Quick Summary
I transferred USDT to a BNB Chain address that I didn’t control with the key I had. It looked lost. But by understanding the wallet architecture, CREATE2, and the signing protocol of a Safe, I managed to recover the full $266 — with less than $0.02 in gas costs.
## The mistake
A transfer that seemed routine ended up at the wrong address. The balance: 251.39 USDT, withdrawn from Binance and sent to an address on BNB Chain.
5
3
895
·
--
Collect the promise from yesterday, with the three conditions:
1) "Long as long as it holds $84.887" -> it was met. The minimum was $85.267.
2) "Target $87.484" -> it did NOT reach. The maximum was $87.279.
3) "If the OI doesn’t follow, I go to neutral" -> it triggered: OI -3.40% in 24h.
Bias change: NEUTRAL. The promise was public and it’s fully collected.
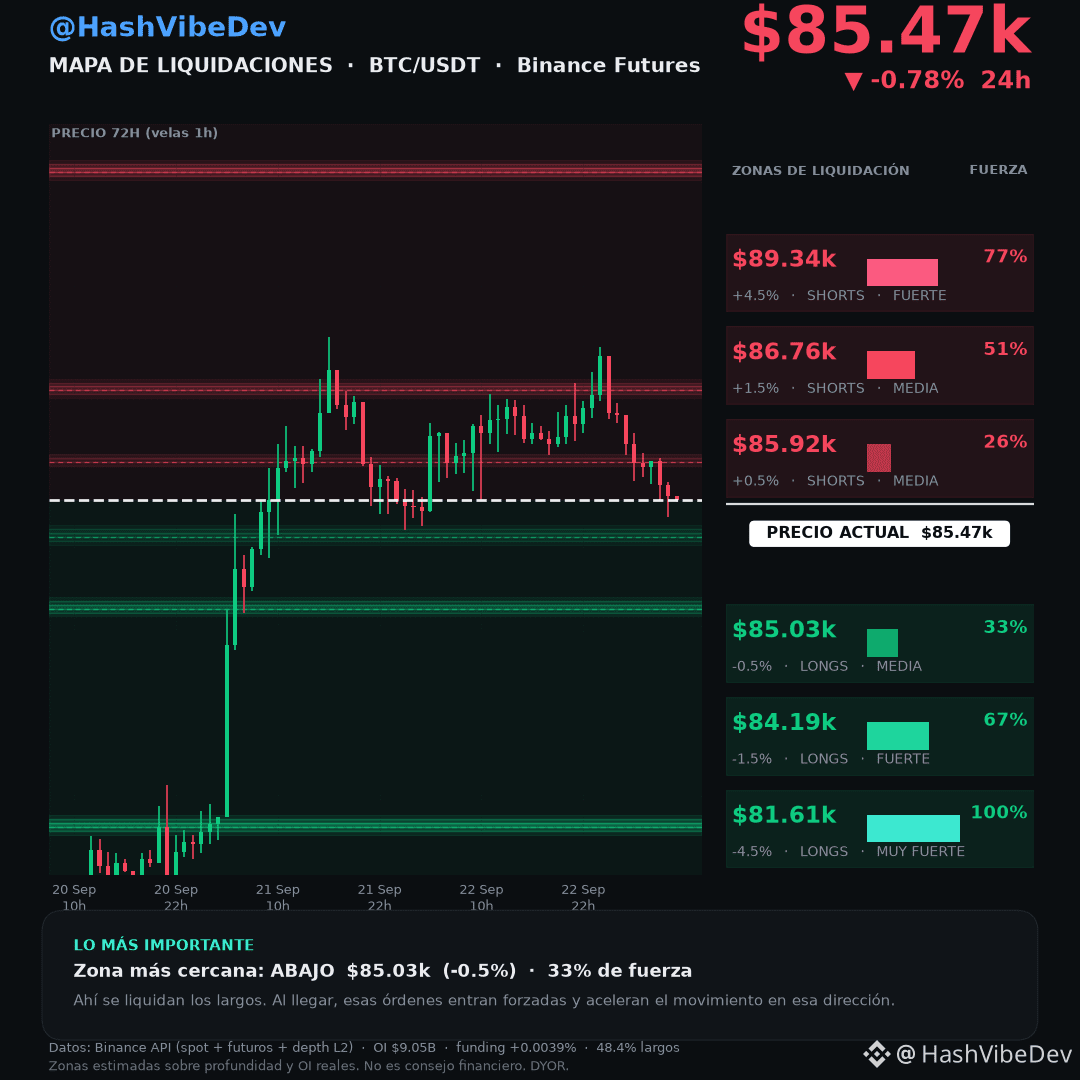
BTC $85.474 (-0.78%). Real 24h range $85.267-$87.279.
FUTURES PANEL
· OI 105,847 BTC ($9.05B) -3.40% 24h
· Funding +0.0039%: almost zero
· Longs/shorts 48.4% / 51.6% (24h 48.5% / 51.5%)
· Top traders, accounts 51.0% / 49.0%
· Top traders, POSITION 65.6% / 34.4% (24h: 68.6%)
· Taker buy/sell 0.86: sell-side flow
The top traders REDUCED their long from 68.6% to 65.6%: the 4-day divergence is starting to ease. When the signal that was supporting my bias weakens, the bias weakens.
Tight between two zones: -0.52% ($85,029) on the downside and +0.52% ($85,919) on the upside.
DOWN - longs get liquidated:
🔻 $85,029 · -0.52% · 33%
🔻 $84,186 · -1.51% · 67%
🔻 $81,610 · -4.52% · 100% (heaviest)
{future}(BTCUSDT)
UP - shorts get liquidated:
🔺 $85,919 · +0.52% · 26%
🔺 $86,762 · +1.51% · 51%
🔺 $89,338 · +4.52% · 77%
My decision: neutral. I go back to a long bias only if two things happen together: OI stops falling and price recovers $86,762. If it loses $84,186, the scenario turns bearish—and I’ll say it too.
Follow me for the next episode of Whale Flow.
#BTC #Binance $BTC
Data: Binance API, 23-09-2026. Estimated zones. Not financial advice. DYOR.
Collect the promise from yesterday, with the three conditions:
1) "Long as long as it holds $84.887" -> it was met. The minimum was $85.267.
2) "Target $87.484" -> it did NOT reach. The maximum was $87.279.
3) "If the OI doesn’t follow, I go to neutral" -> it triggered: OI -3.40% in 24h.
Bias change: NEUTRAL. The promise was public and it’s fully collected.
BTC $85.474 (-0.78%). Real 24h range $85.267-$87.279.
FUTURES PANEL
· OI 105,847 BTC ($9.05B) -3.40% 24h
· Funding +0.0039%: almost zero
· Longs/shorts 48.4% / 51.6% (24h 48.5% / 51.5%)
· Top traders, accounts 51.0% / 49.0%
· Top traders, POSITION 65.6% / 34.4% (24h: 68.6%)
· Taker buy/sell 0.86: sell-side flow
The top traders REDUCED their long from 68.6% to 65.6%: the 4-day divergence is starting to ease. When the signal that was supporting my bias weakens, the bias weakens.
Tight between two zones: -0.52% ($85,029) on the downside and +0.52% ($85,919) on the upside.
DOWN - longs get liquidated:
🔻 $85,029 · -0.52% · 33%
🔻 $84,186 · -1.51% · 67%
🔻 $81,610 · -4.52% · 100% (heaviest)
UP - shorts get liquidated:
🔺 $85,919 · +0.52% · 26%
🔺 $86,762 · +1.51% · 51%
🔺 $89,338 · +4.52% · 77%
My decision: neutral. I go back to a long bias only if two things happen together: OI stops falling and price recovers $86,762. If it loses $84,186, the scenario turns bearish—and I’ll say it too.
Follow me for the next episode of Whale Flow.
#BTC #Binance $BTC
Data: Binance API, 23-09-2026. Estimated zones. Not financial advice. DYOR.
1) "Long as long as it holds $84.887" -> it was met. The minimum was $85.267.
2) "Target $87.484" -> it did NOT reach. The maximum was $87.279.
3) "If the OI doesn’t follow, I go to neutral" -> it triggered: OI -3.40% in 24h.
Bias change: NEUTRAL. The promise was public and it’s fully collected.
BTC $85.474 (-0.78%). Real 24h range $85.267-$87.279.
FUTURES PANEL
· OI 105,847 BTC ($9.05B) -3.40% 24h
· Funding +0.0039%: almost zero
· Longs/shorts 48.4% / 51.6% (24h 48.5% / 51.5%)
· Top traders, accounts 51.0% / 49.0%
· Top traders, POSITION 65.6% / 34.4% (24h: 68.6%)
· Taker buy/sell 0.86: sell-side flow
The top traders REDUCED their long from 68.6% to 65.6%: the 4-day divergence is starting to ease. When the signal that was supporting my bias weakens, the bias weakens.
Tight between two zones: -0.52% ($85,029) on the downside and +0.52% ($85,919) on the upside.
DOWN - longs get liquidated:
🔻 $85,029 · -0.52% · 33%
🔻 $84,186 · -1.51% · 67%
🔻 $81,610 · -4.52% · 100% (heaviest)
UP - shorts get liquidated:
🔺 $85,919 · +0.52% · 26%
🔺 $86,762 · +1.51% · 51%
🔺 $89,338 · +4.52% · 77%
My decision: neutral. I go back to a long bias only if two things happen together: OI stops falling and price recovers $86,762. If it loses $84,186, the scenario turns bearish—and I’ll say it too.
Follow me for the next episode of Whale Flow.
#BTC #Binance $BTC
Data: Binance API, 23-09-2026. Estimated zones. Not financial advice. DYOR.
1.5k
·
--
The target from yesterday was met: I marked $86.272 and the price touched $87.396.
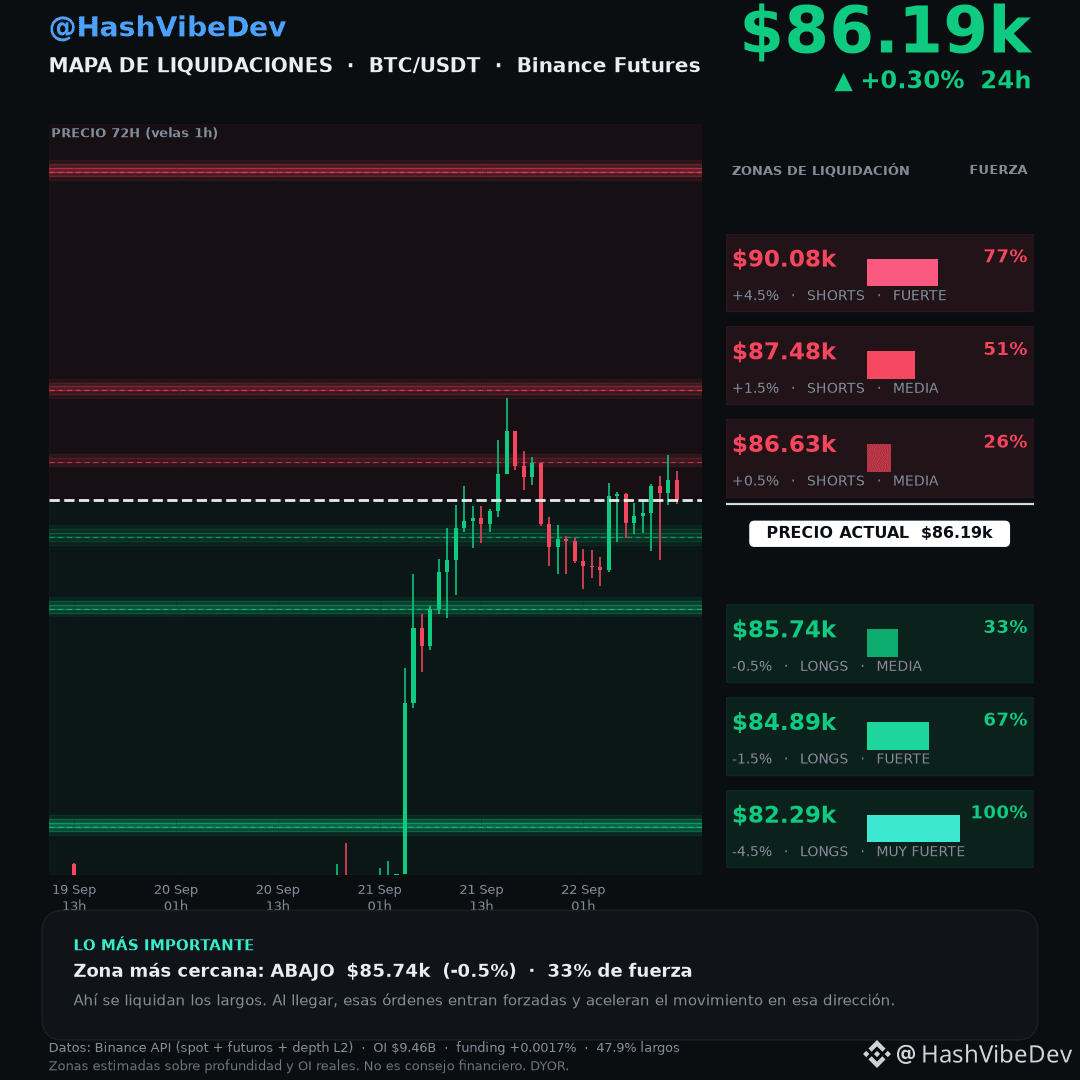
BTC $86.186 (+0.30%). Real 24h range $85.114-$87.396. Stay above my $84.609 line: the long bias is still alive.
FUTURES PANEL
· OI 109,548 BTC ($9.46B) -0.93% 24h
· Funding +0.0017%: almost zero
· Longs/shorts 47.9% / 52.1% (24h 46.9% / 53.1%)
· Top traders, accounts 51.0% / 49.0%
· Top traders, POSITION 68.6% / 31.4%
· Taker buy/sell 0.98 (24h 1.03)
What changed: price rose to $87.396 and OI went DOWN. After the mistake I admitted yesterday, I read it differently: OI falling while price is firm is consolidation, not weakness. But it’s also not fuel to break $87,500 in one shot.
The divergence remains: retail 52.1% short, top traders 68.6% long. Third consecutive day.
DOWN - longs get liquidated:
🔻 $85.737 · -0.52% · 33%
🔻 $84.887 · -1.51% · 67%
🔻 $82.290 · -4.52% · 100% (the heaviest)
UP - shorts get liquidated:
🔺 $86.634 · +0.52% · 26%
🔺 $87.484 · +1.51% · 51%
🔺 $90.082 · +4.52% · 77%
My decision: I stay long as long as $84.887 holds. Target $87.484. But without OI rising that jump is hard: if in 24h OI doesn’t follow, I go neutral even if price holds.
Follow me for the next episode of Whale Flow.
#BTC #Binance $BTC
Data: Binance API, 22-09-2026. Estimated zones. Not financial advice. DYOR.
The target from yesterday was met: I marked $86.272 and the price touched $87.396.
BTC $86.186 (+0.30%). Real 24h range $85.114-$87.396. Stay above my $84.609 line: the long bias is still alive.
FUTURES PANEL
· OI 109,548 BTC ($9.46B) -0.93% 24h
· Funding +0.0017%: almost zero
· Longs/shorts 47.9% / 52.1% (24h 46.9% / 53.1%)
· Top traders, accounts 51.0% / 49.0%
· Top traders, POSITION 68.6% / 31.4%
· Taker buy/sell 0.98 (24h 1.03)
What changed: price rose to $87.396 and OI went DOWN. After the mistake I admitted yesterday, I read it differently: OI falling while price is firm is consolidation, not weakness. But it’s also not fuel to break $87,500 in one shot.
The divergence remains: retail 52.1% short, top traders 68.6% long. Third consecutive day.
DOWN - longs get liquidated:
🔻 $85.737 · -0.52% · 33%
🔻 $84.887 · -1.51% · 67%
🔻 $82.290 · -4.52% · 100% (the heaviest)
UP - shorts get liquidated:
🔺 $86.634 · +0.52% · 26%
🔺 $87.484 · +1.51% · 51%
🔺 $90.082 · +4.52% · 77%
My decision: I stay long as long as $84.887 holds. Target $87.484. But without OI rising that jump is hard: if in 24h OI doesn’t follow, I go neutral even if price holds.
Follow me for the next episode of Whale Flow.
#BTC #Binance $BTC
Data: Binance API, 22-09-2026. Estimated zones. Not financial advice. DYOR.
BTC $86.186 (+0.30%). Real 24h range $85.114-$87.396. Stay above my $84.609 line: the long bias is still alive.
FUTURES PANEL
· OI 109,548 BTC ($9.46B) -0.93% 24h
· Funding +0.0017%: almost zero
· Longs/shorts 47.9% / 52.1% (24h 46.9% / 53.1%)
· Top traders, accounts 51.0% / 49.0%
· Top traders, POSITION 68.6% / 31.4%
· Taker buy/sell 0.98 (24h 1.03)
What changed: price rose to $87.396 and OI went DOWN. After the mistake I admitted yesterday, I read it differently: OI falling while price is firm is consolidation, not weakness. But it’s also not fuel to break $87,500 in one shot.
The divergence remains: retail 52.1% short, top traders 68.6% long. Third consecutive day.
DOWN - longs get liquidated:
🔻 $85.737 · -0.52% · 33%
🔻 $84.887 · -1.51% · 67%
🔻 $82.290 · -4.52% · 100% (the heaviest)
UP - shorts get liquidated:
🔺 $86.634 · +0.52% · 26%
🔺 $87.484 · +1.51% · 51%
🔺 $90.082 · +4.52% · 77%
My decision: I stay long as long as $84.887 holds. Target $87.484. But without OI rising that jump is hard: if in 24h OI doesn’t follow, I go neutral even if price holds.
Follow me for the next episode of Whale Flow.
#BTC #Binance $BTC
Data: Binance API, 22-09-2026. Estimated zones. Not financial advice. DYOR.
1k
·
--
Yesterday I missed two things: the "real ceiling" at $81.695 (it reached $85.474) and the "unleveraged bounce" (the OI rose 3.63%).
I read it wrong: the OI was falling because positions were being closed, not because there were no buyers.
But the conditional I wrote down did happen: "if they confirm the buy and the OI rises, I change my bias". Strategy confirmed 950 BTC at $79.670 and the OI went up.
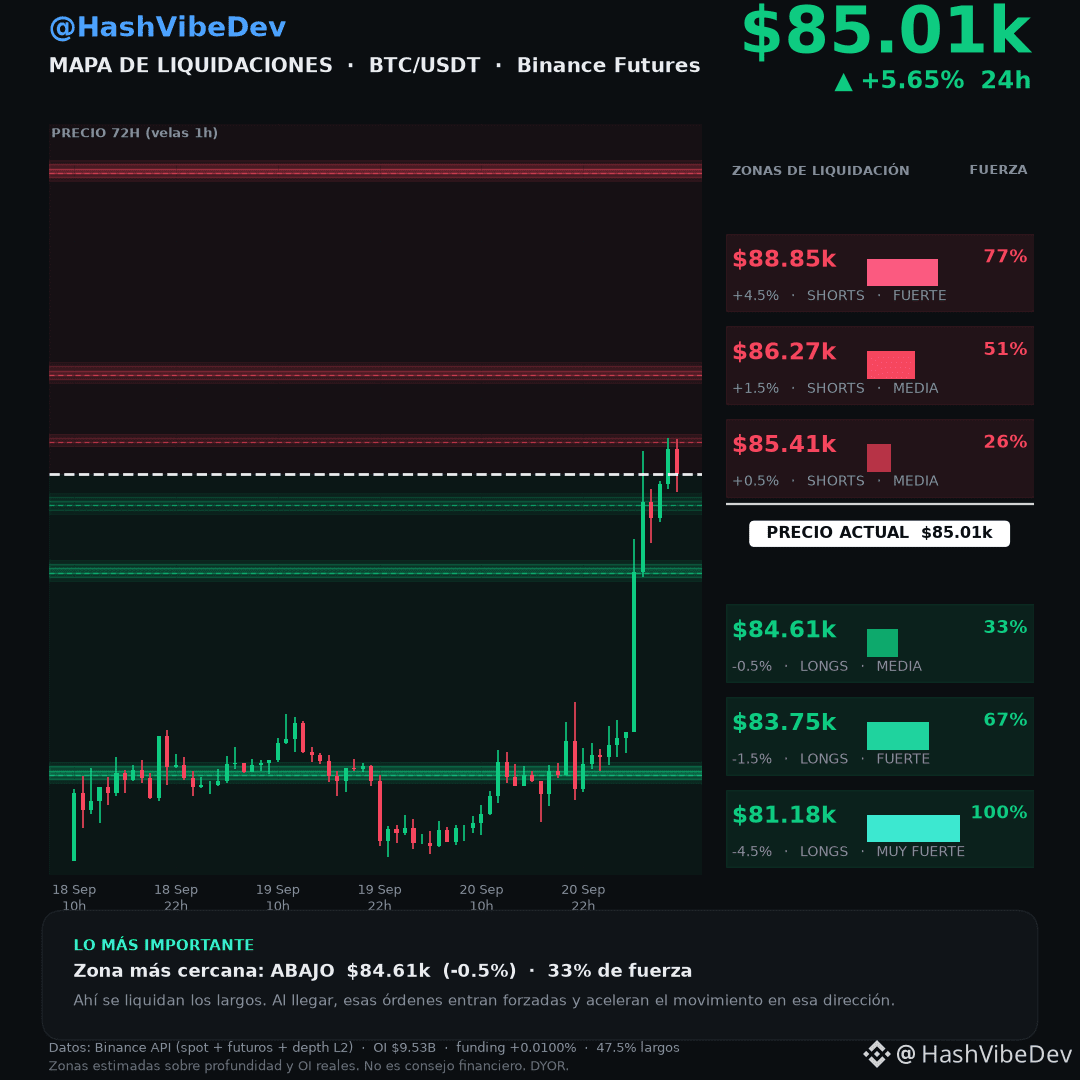
BTC $85.011 (+5.65%). Real 24h range $80.414-$85.474.
FUTURES PANEL
· OI 111,704 BTC ($9.53B) +2.71% 24h
· Funding +0.0100%: neutral after +5.65%, no euphoria
· Longs/shorts 47.5% / 52.5% (24h 49.0% / 51.0%)
· Top traders, accounts 49.4% / 50.6%
· Top traders, POSITION 68.5% / 31.5%
· Taker buy/sell 1.08 (24h 1.42)
Retail got MORE short (52.5%) while price was rising; top traders keep 68.5% long. That divergence was already in my post from yesterday: I saw it and didn’t follow it.
DOWN - longs get liquidated:
🔻 $84.609 · -0.47% · 33%
🔻 $83.751 · -1.48% · 67%
🔻 $81.177 · -4.51% · 100% (the heaviest)
UP - shorts get liquidated:
🔺 $85.414 · +0.47% · 26%
🔺 $86.272 · +1.48% · 51%
🔺 $88.846 · +4.51% · 77%
My decision: long bias while above $84.609 holds. Target $86.272. If it closes below $84.609, the breakout was false and I’ll say so.
Follow me for the next episode of Whale Flow.
#BTC #Binance $BTC
Data: Binance API, 21-09-2026. Estimated zones. Not financial advice. DYOR.
Yesterday I missed two things: the "real ceiling" at $81.695 (it reached $85.474) and the "unleveraged bounce" (the OI rose 3.63%).
I read it wrong: the OI was falling because positions were being closed, not because there were no buyers.
But the conditional I wrote down did happen: "if they confirm the buy and the OI rises, I change my bias". Strategy confirmed 950 BTC at $79.670 and the OI went up.
BTC $85.011 (+5.65%). Real 24h range $80.414-$85.474.
FUTURES PANEL
· OI 111,704 BTC ($9.53B) +2.71% 24h
· Funding +0.0100%: neutral after +5.65%, no euphoria
· Longs/shorts 47.5% / 52.5% (24h 49.0% / 51.0%)
· Top traders, accounts 49.4% / 50.6%
· Top traders, POSITION 68.5% / 31.5%
· Taker buy/sell 1.08 (24h 1.42)
Retail got MORE short (52.5%) while price was rising; top traders keep 68.5% long. That divergence was already in my post from yesterday: I saw it and didn’t follow it.
DOWN - longs get liquidated:
🔻 $84.609 · -0.47% · 33%
🔻 $83.751 · -1.48% · 67%
🔻 $81.177 · -4.51% · 100% (the heaviest)
UP - shorts get liquidated:
🔺 $85.414 · +0.47% · 26%
🔺 $86.272 · +1.48% · 51%
🔺 $88.846 · +4.51% · 77%
My decision: long bias while above $84.609 holds. Target $86.272. If it closes below $84.609, the breakout was false and I’ll say so.
Follow me for the next episode of Whale Flow.
#BTC #Binance $BTC
Data: Binance API, 21-09-2026. Estimated zones. Not financial advice. DYOR.
I read it wrong: the OI was falling because positions were being closed, not because there were no buyers.
But the conditional I wrote down did happen: "if they confirm the buy and the OI rises, I change my bias". Strategy confirmed 950 BTC at $79.670 and the OI went up.
BTC $85.011 (+5.65%). Real 24h range $80.414-$85.474.
FUTURES PANEL
· OI 111,704 BTC ($9.53B) +2.71% 24h
· Funding +0.0100%: neutral after +5.65%, no euphoria
· Longs/shorts 47.5% / 52.5% (24h 49.0% / 51.0%)
· Top traders, accounts 49.4% / 50.6%
· Top traders, POSITION 68.5% / 31.5%
· Taker buy/sell 1.08 (24h 1.42)
Retail got MORE short (52.5%) while price was rising; top traders keep 68.5% long. That divergence was already in my post from yesterday: I saw it and didn’t follow it.
DOWN - longs get liquidated:
🔻 $84.609 · -0.47% · 33%
🔻 $83.751 · -1.48% · 67%
🔻 $81.177 · -4.51% · 100% (the heaviest)
UP - shorts get liquidated:
🔺 $85.414 · +0.47% · 26%
🔺 $86.272 · +1.48% · 51%
🔺 $88.846 · +4.51% · 77%
My decision: long bias while above $84.609 holds. Target $86.272. If it closes below $84.609, the breakout was false and I’ll say so.
Follow me for the next episode of Whale Flow.
#BTC #Binance $BTC
Data: Binance API, 21-09-2026. Estimated zones. Not financial advice. DYOR.
2
3.3k
·
--
Saylor said "a little more orange": he hinted at a Strategy purchase; he didn’t confirm it.
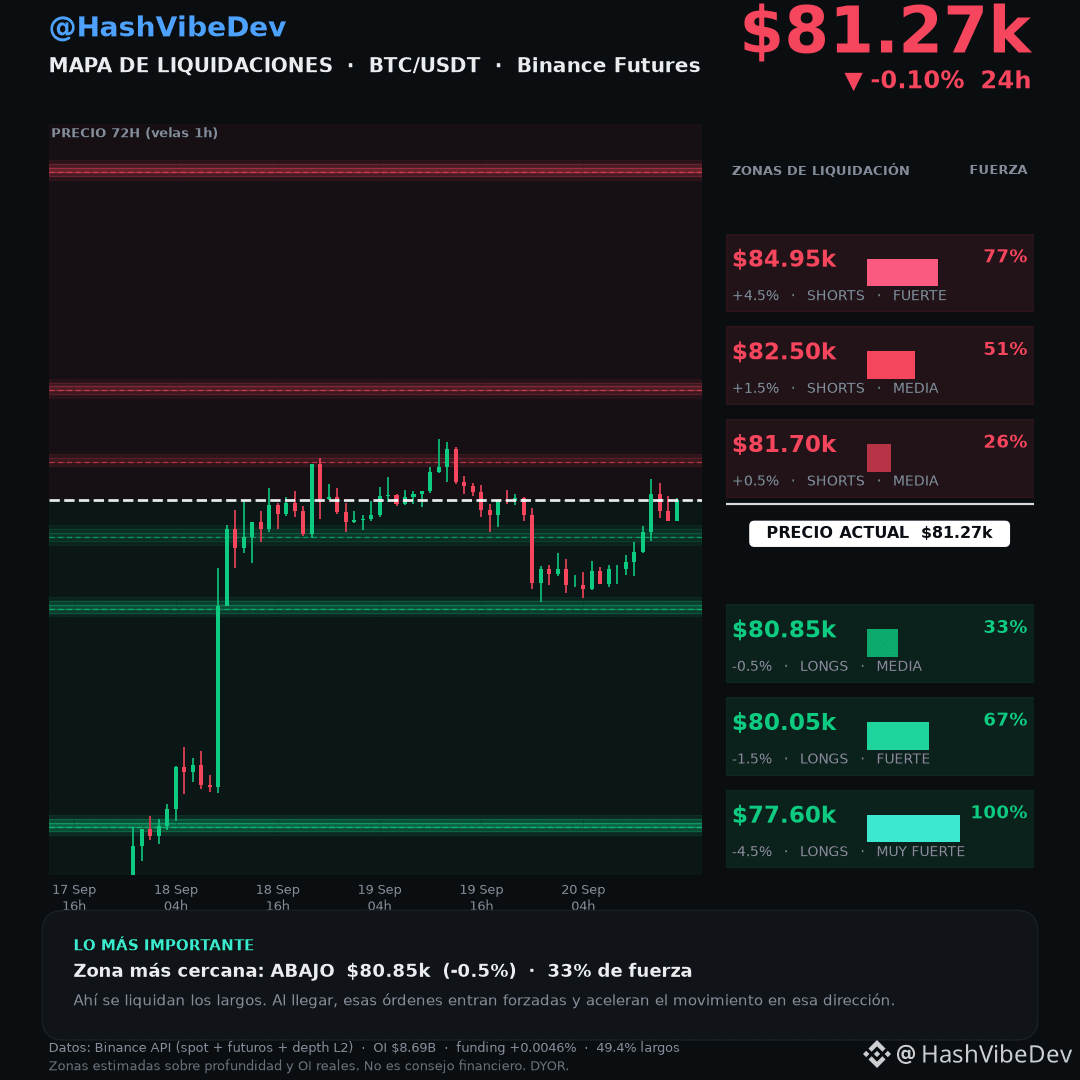
BTC $81,272 (-0.10% in 24h). It regained the $80,619 I considered lost this morning, but the futures data doesn’t support the narrative.
FUTURES PANEL
- Open Interest: 107,290 BTC ($8.69B) → -0.46% over 24 hours. Price is rising and leverage is falling: nobody is paying for this rebound.
- Funding: +0.0046% every 8h. Neutral.
- Taker buy/sell: 0.60 (24h ago: 1.02). Sell-side flow dominates.
- Long/short accounts: 49.4% / 50.6% (24h ago: 48.5% / 51.5%)
- Top traders, accounts: 52.8% / 47.1%
- Top traders, POSITION: 68.0% / 32.0%
Strategy: 845,050 BTC at an average cost of $75,412 — the price is 7.8% above its cost. But the purchase is NOT confirmed: Saylor will signal on Sunday, the SEC confirms on Monday. Today is a hint, not a fact.
Liquidation map, by distance to price:
BELOW - longs get liquidated:
🔻 $80,849 · -0.52% · 33%
🔻 $80,047 · -1.51% · 67%
🔻 $77,598 · -4.52% · 100% (heaviest)
ABOVE - shorts get liquidated:
🔺 $81,695 · +0.52% · 26%
🔺 $82,497 · +1.51% · 51%
🔺 $84,946 · +4.52% · 77%
My decision: I stay neutral. It reclaimed my line, but with OI falling and sell-side flow: a rebound with no leverage behind it. If they confirm the purchase on Monday and OI rises, I’ll shift my bias. For now, $81,695 is the first real ceiling.
Follow me for the next episode of Whale Flow.
#SaylorHintsStrategyBitcoinBuy #BTC $BTC
Data: Binance API (spot + futures + depth L2), 20-09-2026. Estimated zones. Not financial advice. DYOR.
Saylor said "a little more orange": he hinted at a Strategy purchase; he didn’t confirm it.
BTC $81,272 (-0.10% in 24h). It regained the $80,619 I considered lost this morning, but the futures data doesn’t support the narrative.
FUTURES PANEL
- Open Interest: 107,290 BTC ($8.69B) → -0.46% over 24 hours. Price is rising and leverage is falling: nobody is paying for this rebound.
- Funding: +0.0046% every 8h. Neutral.
- Taker buy/sell: 0.60 (24h ago: 1.02). Sell-side flow dominates.
- Long/short accounts: 49.4% / 50.6% (24h ago: 48.5% / 51.5%)
- Top traders, accounts: 52.8% / 47.1%
- Top traders, POSITION: 68.0% / 32.0%
Strategy: 845,050 BTC at an average cost of $75,412 — the price is 7.8% above its cost. But the purchase is NOT confirmed: Saylor will signal on Sunday, the SEC confirms on Monday. Today is a hint, not a fact.
Liquidation map, by distance to price:
BELOW - longs get liquidated:
🔻 $80,849 · -0.52% · 33%
🔻 $80,047 · -1.51% · 67%
🔻 $77,598 · -4.52% · 100% (heaviest)
ABOVE - shorts get liquidated:
🔺 $81,695 · +0.52% · 26%
🔺 $82,497 · +1.51% · 51%
🔺 $84,946 · +4.52% · 77%
My decision: I stay neutral. It reclaimed my line, but with OI falling and sell-side flow: a rebound with no leverage behind it. If they confirm the purchase on Monday and OI rises, I’ll shift my bias. For now, $81,695 is the first real ceiling.
Follow me for the next episode of Whale Flow.
#SaylorHintsStrategyBitcoinBuy #BTC $BTC
Data: Binance API (spot + futures + depth L2), 20-09-2026. Estimated zones. Not financial advice. DYOR.
BTC $81,272 (-0.10% in 24h). It regained the $80,619 I considered lost this morning, but the futures data doesn’t support the narrative.
FUTURES PANEL
- Open Interest: 107,290 BTC ($8.69B) → -0.46% over 24 hours. Price is rising and leverage is falling: nobody is paying for this rebound.
- Funding: +0.0046% every 8h. Neutral.
- Taker buy/sell: 0.60 (24h ago: 1.02). Sell-side flow dominates.
- Long/short accounts: 49.4% / 50.6% (24h ago: 48.5% / 51.5%)
- Top traders, accounts: 52.8% / 47.1%
- Top traders, POSITION: 68.0% / 32.0%
Strategy: 845,050 BTC at an average cost of $75,412 — the price is 7.8% above its cost. But the purchase is NOT confirmed: Saylor will signal on Sunday, the SEC confirms on Monday. Today is a hint, not a fact.
Liquidation map, by distance to price:
BELOW - longs get liquidated:
🔻 $80,849 · -0.52% · 33%
🔻 $80,047 · -1.51% · 67%
🔻 $77,598 · -4.52% · 100% (heaviest)
ABOVE - shorts get liquidated:
🔺 $81,695 · +0.52% · 26%
🔺 $82,497 · +1.51% · 51%
🔺 $84,946 · +4.52% · 77%
My decision: I stay neutral. It reclaimed my line, but with OI falling and sell-side flow: a rebound with no leverage behind it. If they confirm the purchase on Monday and OI rises, I’ll shift my bias. For now, $81,695 is the first real ceiling.
Follow me for the next episode of Whale Flow.
#SaylorHintsStrategyBitcoinBuy #BTC $BTC
Data: Binance API (spot + futures + depth L2), 20-09-2026. Estimated zones. Not financial advice. DYOR.
3
3.6k
·
--
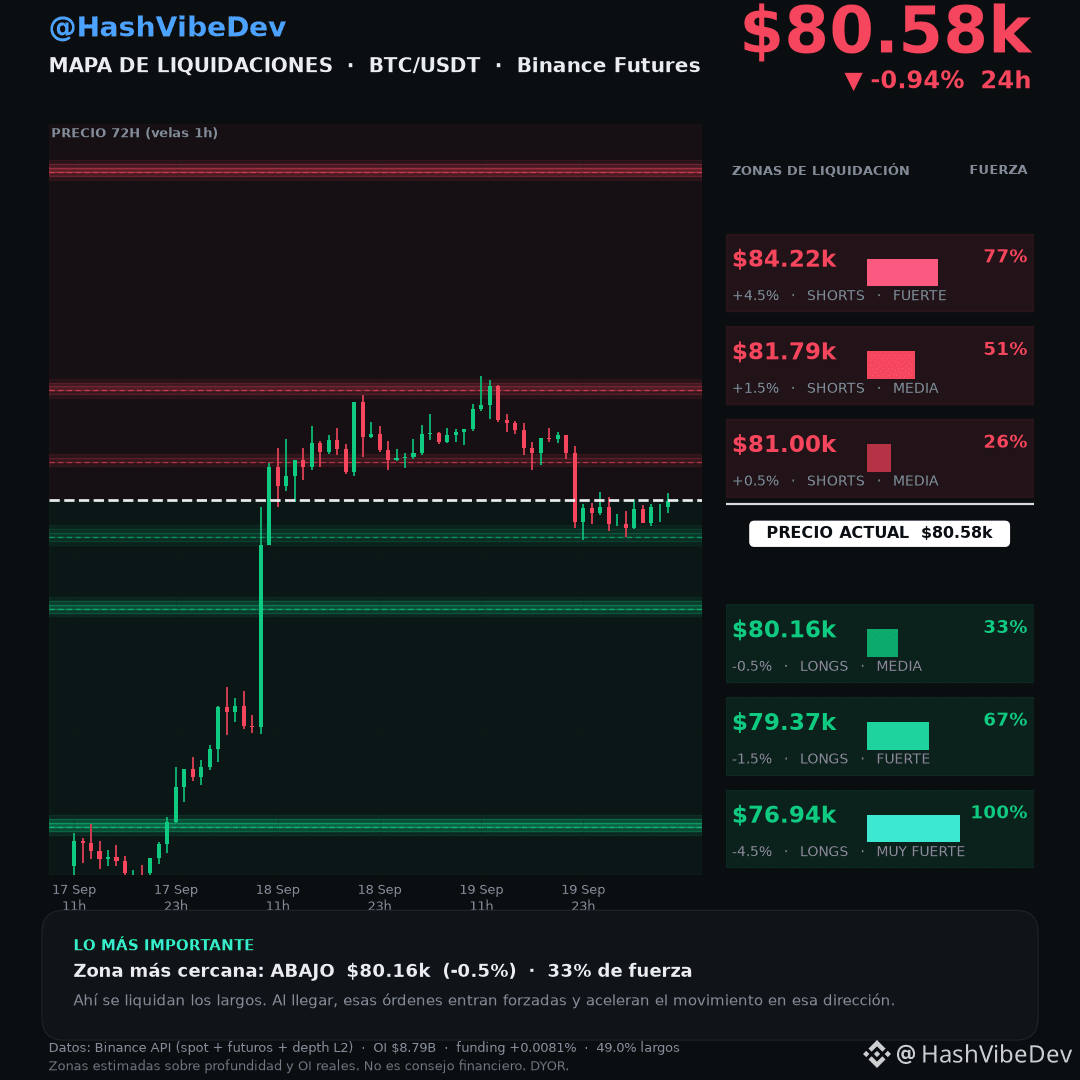
On Friday I put $80.619 as my line and it got lost: the bullish thesis is deactivated.
BTC $80.580 (-0.94% in 24h). 24h Range $80,096-$81,934.
FUTURES PANEL
- Open Interest: 109,102 BTC ($8.79B) -> +0.99% in 24 hours. New positions are entering; it’s not a stampede of exits.
- Funding: +0.0081% every 8h. Practically neutral.
- Long/short accounts: 49.0% / 51.0% (24h ago: 48.7% / 51.3%)
- Top traders, accounts: 52.7% / 47.3%
- Top traders, POSITION: 68.7% / 31.3%
- Taker buy/sell: 1.42 (24h ago: 0.99)
Liquidation map, by distance from the price:
BELOW - longs get liquidated:
🔻 $80.161 · -0.52% · 33%
🔻 $79.366 · -1.51% · 67%
🔻 $76.937 · -4.52% · 100% (heaviest)
ABOVE - shorts get liquidated:
🔺 $80.999 · +0.52% · 26%
🔺 $81.794 · +1.51% · 51%
🔺 $84.223 · +4.52% · 77%
My decision: neutral until it recovers $80.619 with a close. If it loses $80.161 with volume, the next magnet is $79.366 (that’s where 67% of the longs’ “carnage” is). Up above, the wall starts at $80.999 and gets heavy at $81.794.
Follow me for the next episode of Whale Flow.
#BTC #Binance $BTC
Data: Binance API (spot + futures + depth L2), 20-09-2026. Estimated zones. Not financial advice. DYOR.
On Friday I put $80.619 as my line and it got lost: the bullish thesis is deactivated.
BTC $80.580 (-0.94% in 24h). 24h Range $80,096-$81,934.
FUTURES PANEL
- Open Interest: 109,102 BTC ($8.79B) -> +0.99% in 24 hours. New positions are entering; it’s not a stampede of exits.
- Funding: +0.0081% every 8h. Practically neutral.
- Long/short accounts: 49.0% / 51.0% (24h ago: 48.7% / 51.3%)
- Top traders, accounts: 52.7% / 47.3%
- Top traders, POSITION: 68.7% / 31.3%
- Taker buy/sell: 1.42 (24h ago: 0.99)
Liquidation map, by distance from the price:
BELOW - longs get liquidated:
🔻 $80.161 · -0.52% · 33%
🔻 $79.366 · -1.51% · 67%
🔻 $76.937 · -4.52% · 100% (heaviest)
ABOVE - shorts get liquidated:
🔺 $80.999 · +0.52% · 26%
🔺 $81.794 · +1.51% · 51%
🔺 $84.223 · +4.52% · 77%
My decision: neutral until it recovers $80.619 with a close. If it loses $80.161 with volume, the next magnet is $79.366 (that’s where 67% of the longs’ “carnage” is). Up above, the wall starts at $80.999 and gets heavy at $81.794.
Follow me for the next episode of Whale Flow.
#BTC #Binance $BTC
Data: Binance API (spot + futures + depth L2), 20-09-2026. Estimated zones. Not financial advice. DYOR.
BTC $80.580 (-0.94% in 24h). 24h Range $80,096-$81,934.
FUTURES PANEL
- Open Interest: 109,102 BTC ($8.79B) -> +0.99% in 24 hours. New positions are entering; it’s not a stampede of exits.
- Funding: +0.0081% every 8h. Practically neutral.
- Long/short accounts: 49.0% / 51.0% (24h ago: 48.7% / 51.3%)
- Top traders, accounts: 52.7% / 47.3%
- Top traders, POSITION: 68.7% / 31.3%
- Taker buy/sell: 1.42 (24h ago: 0.99)
Liquidation map, by distance from the price:
BELOW - longs get liquidated:
🔻 $80.161 · -0.52% · 33%
🔻 $79.366 · -1.51% · 67%
🔻 $76.937 · -4.52% · 100% (heaviest)
ABOVE - shorts get liquidated:
🔺 $80.999 · +0.52% · 26%
🔺 $81.794 · +1.51% · 51%
🔺 $84.223 · +4.52% · 77%
My decision: neutral until it recovers $80.619 with a close. If it loses $80.161 with volume, the next magnet is $79.366 (that’s where 67% of the longs’ “carnage” is). Up above, the wall starts at $80.999 and gets heavy at $81.794.
Follow me for the next episode of Whale Flow.
#BTC #Binance $BTC
Data: Binance API (spot + futures + depth L2), 20-09-2026. Estimated zones. Not financial advice. DYOR.
2
2.5k
·
--
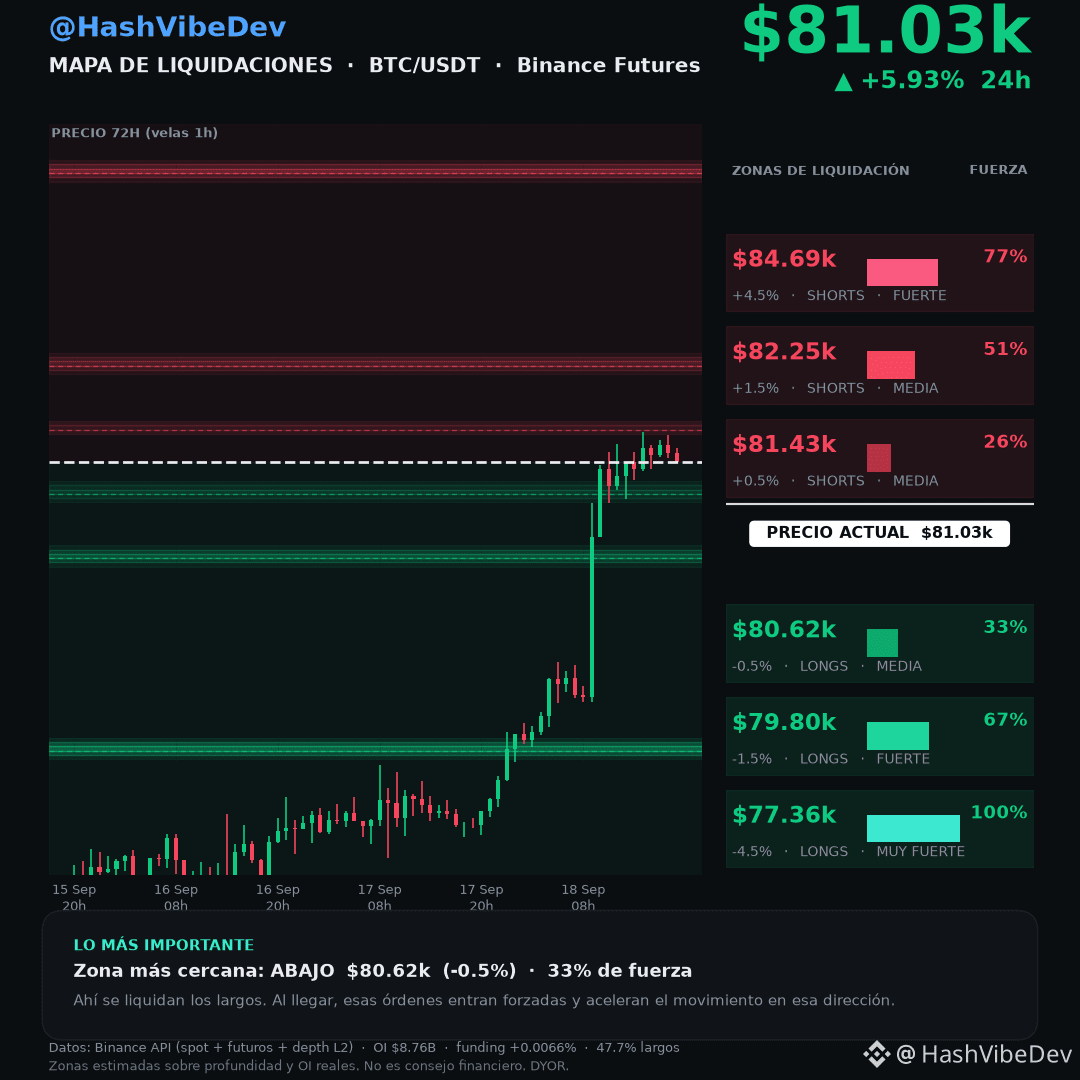
$BTC rompié los $80.000 y 52% of accounts are short right when it rises.
BTC at $81,026 (+5.93% in 24h). This morning I said my bias remained long as long as it held above $77,594. It held— and blew through $80,000. About $250 million was liquidated in short positions in four hours, according to CoinGlass.
The backdrop helped: the Fed had already hiked on Wednesday, the Senate blocked the CLARITY Act, and the 30-year bond hit 5.34%. When the market has already priced in all the bad news, sellers stop showing up. On top of that, the SEC and the CFTC moved forward with their own rules, and a House committee shifted the strategic Bitcoin reserve.
What I’m most interested in: the liquidation map shows a heavy zone above at $82,248, and analysts cite $82,000 as the level that decides it. My $80,619 zone lands on $80,500, which is the cost basis of corporate treasuries. Two different methods pointing to the same prices.
My decision: this is a breakout with fuel, not a dead-cat bounce. As long as I don’t lose $80,619, I stay with a bullish bias, and the real target is $82,248. If it closes below $80,619, I was wrong and I’ll say so.
Follow me for the next episode of Whale Flow.
#BTC $BNB
Data: Binance API + CoinGlass + press from 18-09-2026. Estimated zones. Not financial advice. DYOR.
$BTC rompié los $80.000 y 52% of accounts are short right when it rises.
BTC at $81,026 (+5.93% in 24h). This morning I said my bias remained long as long as it held above $77,594. It held— and blew through $80,000. About $250 million was liquidated in short positions in four hours, according to CoinGlass.
The backdrop helped: the Fed had already hiked on Wednesday, the Senate blocked the CLARITY Act, and the 30-year bond hit 5.34%. When the market has already priced in all the bad news, sellers stop showing up. On top of that, the SEC and the CFTC moved forward with their own rules, and a House committee shifted the strategic Bitcoin reserve.
What I’m most interested in: the liquidation map shows a heavy zone above at $82,248, and analysts cite $82,000 as the level that decides it. My $80,619 zone lands on $80,500, which is the cost basis of corporate treasuries. Two different methods pointing to the same prices.
My decision: this is a breakout with fuel, not a dead-cat bounce. As long as I don’t lose $80,619, I stay with a bullish bias, and the real target is $82,248. If it closes below $80,619, I was wrong and I’ll say so.
Follow me for the next episode of Whale Flow.
#BTC $BNB
Data: Binance API + CoinGlass + press from 18-09-2026. Estimated zones. Not financial advice. DYOR.
BTC at $81,026 (+5.93% in 24h). This morning I said my bias remained long as long as it held above $77,594. It held— and blew through $80,000. About $250 million was liquidated in short positions in four hours, according to CoinGlass.
The backdrop helped: the Fed had already hiked on Wednesday, the Senate blocked the CLARITY Act, and the 30-year bond hit 5.34%. When the market has already priced in all the bad news, sellers stop showing up. On top of that, the SEC and the CFTC moved forward with their own rules, and a House committee shifted the strategic Bitcoin reserve.
What I’m most interested in: the liquidation map shows a heavy zone above at $82,248, and analysts cite $82,000 as the level that decides it. My $80,619 zone lands on $80,500, which is the cost basis of corporate treasuries. Two different methods pointing to the same prices.
My decision: this is a breakout with fuel, not a dead-cat bounce. As long as I don’t lose $80,619, I stay with a bullish bias, and the real target is $82,248. If it closes below $80,619, I was wrong and I’ll say so.
Follow me for the next episode of Whale Flow.
#BTC $BNB
Data: Binance API + CoinGlass + press from 18-09-2026. Estimated zones. Not financial advice. DYOR.
1
923
·
--
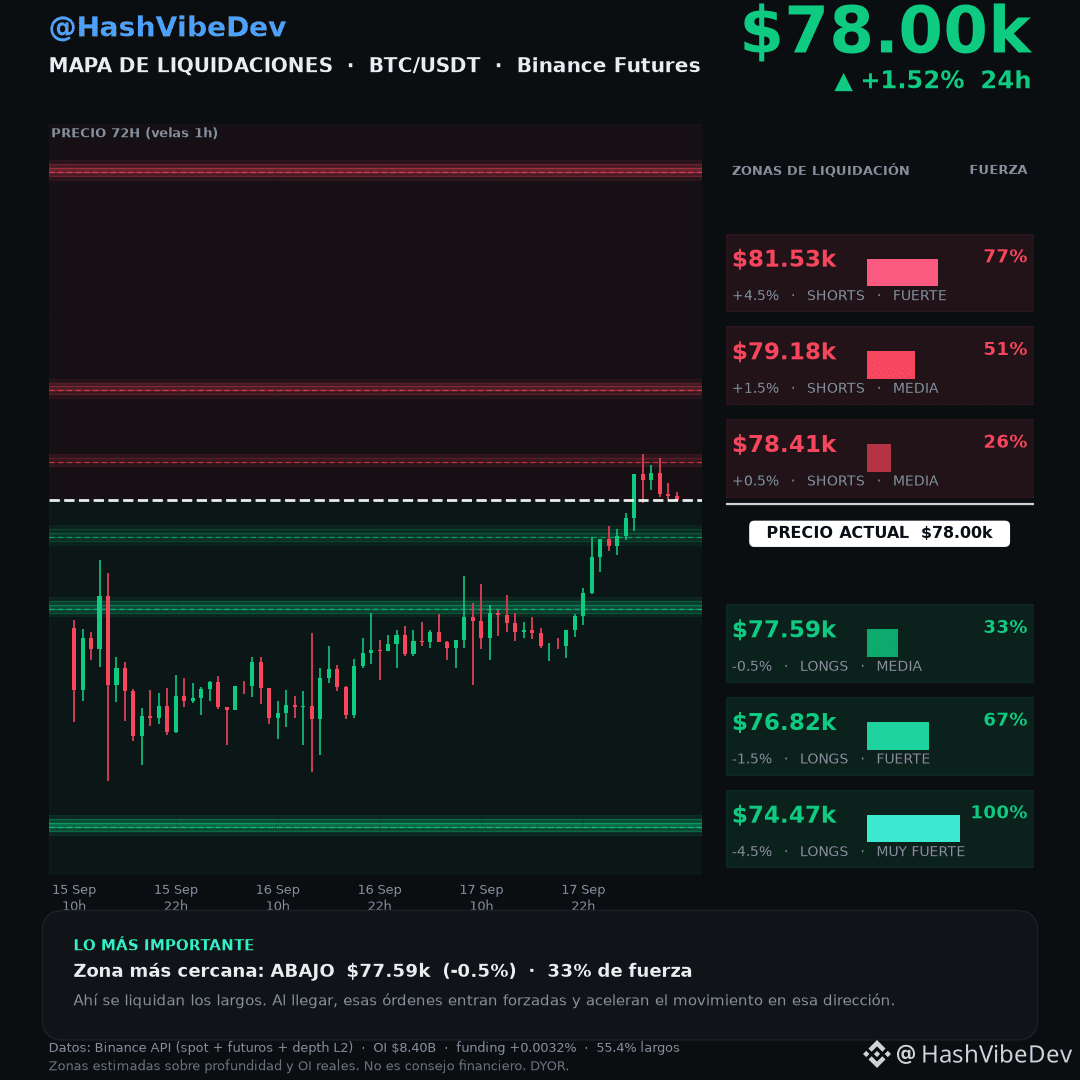
$BTC broke through the two walls that had been holding him back yesterday, and the shorts picked up the tab.
BTC at $78,000 (+1.5% in 24h), high at $78,490: it left behind the $77,057 and $77,792 that yesterday’s chart marked as resistance. It did so against the odds: the Fed raised the rate to 3.75%-4.00% and ETF redemptions returned.
The push came from short-covering, not fresh money: Binance futures Open Interest fell to 107,764 BTC while price rose, taker flow is selling (0.84), and accounts flipped back to short again: 44.3% of the total (41.3% yesterday). The top traders are moving the opposite way, with 69.4% of their position in long.
Liquidation map, by distance from the price:
BELOW — longs get liquidated:
🔻 $77.594 · -0.52% · 33%
🔻 $76.825 · -1.51% · 67%
🔻 $74.474 · -4.52% · 100% (the heaviest)
{future}(BTCUSDT)
ABOVE — shorts get liquidated:
🔺 $78.406 · +0.52% · 26%
🔺 $79.175 · +1.51% · 51%
🔺 $81.526 · +4.52% · 77%
My bias remains long as long as price holds above $77.594; if it loses that zone with volume, I’ll go neutral, and the next reference is $76.825.
Follow me for the next episode of Whale Flow.
#BTC #Bitcoin $BNB
Data: Binance API (spot + futures + depth L2), 18-09-2026. Estimated zones. Not financial advice. DYOR.
$BTC broke through the two walls that had been holding him back yesterday, and the shorts picked up the tab.
BTC at $78,000 (+1.5% in 24h), high at $78,490: it left behind the $77,057 and $77,792 that yesterday’s chart marked as resistance. It did so against the odds: the Fed raised the rate to 3.75%-4.00% and ETF redemptions returned.
The push came from short-covering, not fresh money: Binance futures Open Interest fell to 107,764 BTC while price rose, taker flow is selling (0.84), and accounts flipped back to short again: 44.3% of the total (41.3% yesterday). The top traders are moving the opposite way, with 69.4% of their position in long.
Liquidation map, by distance from the price:
BELOW — longs get liquidated:
🔻 $77.594 · -0.52% · 33%
🔻 $76.825 · -1.51% · 67%
🔻 $74.474 · -4.52% · 100% (the heaviest)
ABOVE — shorts get liquidated:
🔺 $78.406 · +0.52% · 26%
🔺 $79.175 · +1.51% · 51%
🔺 $81.526 · +4.52% · 77%
My bias remains long as long as price holds above $77.594; if it loses that zone with volume, I’ll go neutral, and the next reference is $76.825.
Follow me for the next episode of Whale Flow.
#BTC #Bitcoin $BNB
Data: Binance API (spot + futures + depth L2), 18-09-2026. Estimated zones. Not financial advice. DYOR.
BTC at $78,000 (+1.5% in 24h), high at $78,490: it left behind the $77,057 and $77,792 that yesterday’s chart marked as resistance. It did so against the odds: the Fed raised the rate to 3.75%-4.00% and ETF redemptions returned.
The push came from short-covering, not fresh money: Binance futures Open Interest fell to 107,764 BTC while price rose, taker flow is selling (0.84), and accounts flipped back to short again: 44.3% of the total (41.3% yesterday). The top traders are moving the opposite way, with 69.4% of their position in long.
Liquidation map, by distance from the price:
BELOW — longs get liquidated:
🔻 $77.594 · -0.52% · 33%
🔻 $76.825 · -1.51% · 67%
🔻 $74.474 · -4.52% · 100% (the heaviest)
ABOVE — shorts get liquidated:
🔺 $78.406 · +0.52% · 26%
🔺 $79.175 · +1.51% · 51%
🔺 $81.526 · +4.52% · 77%
My bias remains long as long as price holds above $77.594; if it loses that zone with volume, I’ll go neutral, and the next reference is $76.825.
Follow me for the next episode of Whale Flow.
#BTC #Bitcoin $BNB
Data: Binance API (spot + futures + depth L2), 18-09-2026. Estimated zones. Not financial advice. DYOR.
1
3.9k
·
--
Verified
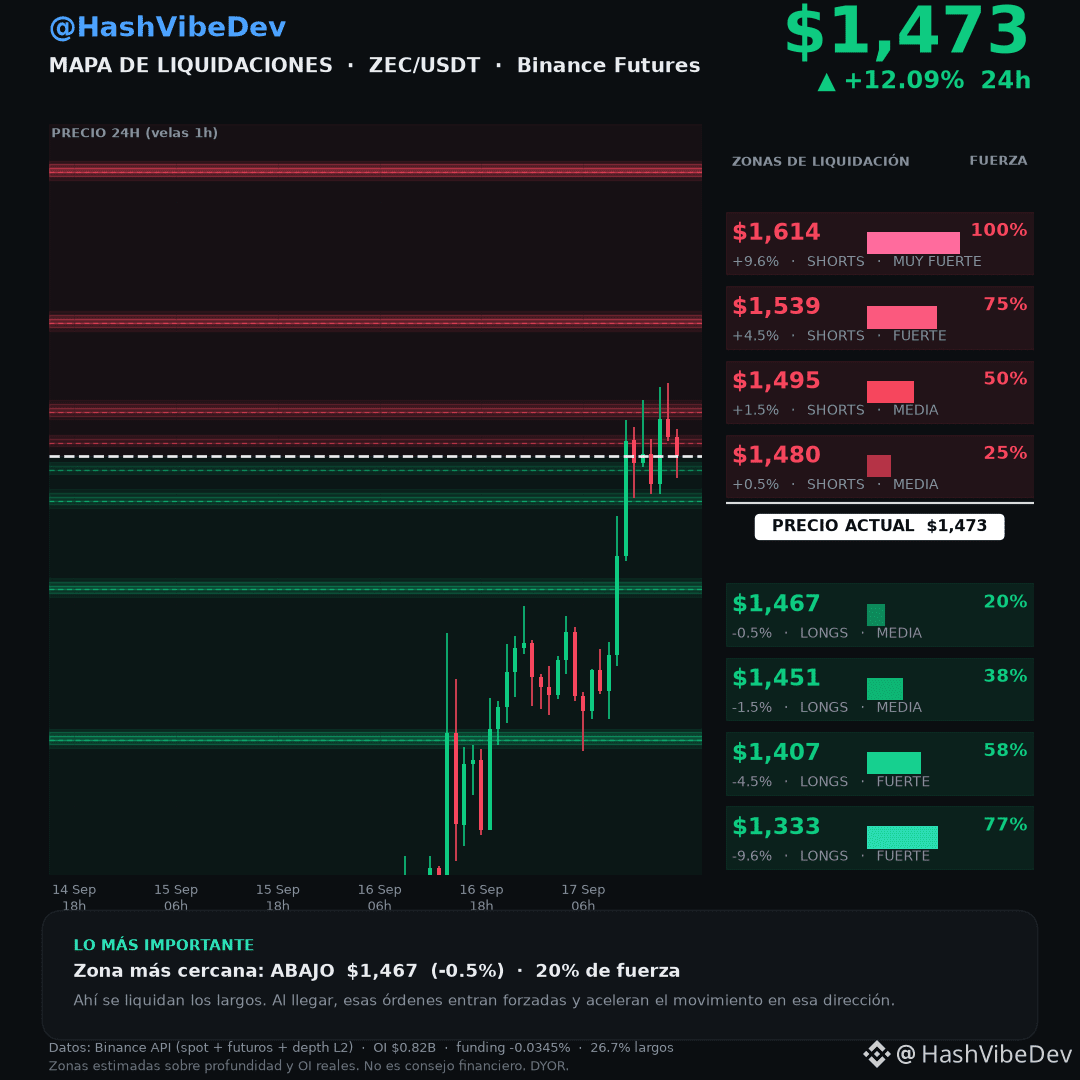
73% of the accounts are under-collateralized at $ZEC y the price rose 12%: they’re paying to be against.
ZEC at $1.473 (+12.09% in 24h, +160% in a month). Three specific catalysts in a week: holders voted NU7 —99.9% in favor of lowering blocks from 75 to 25 seconds while keeping the halving—, Paradigm revealed that it has ZEC and called it "Bitcoin’s private counterpart", and Zcash Labs funded the integration of the shielded pool in Ledger. All of this while the Senate was blocking the CLARITY Act.
Liquidation map, by distance from the price:
BELOW — longs get liquidated:
🔻 $1.466 · -0.45% · 20%
🔻 $1.451 · -1.49% · 38%
🔻 $1.407 · -4.48% · 58%
🔻 $1.332 · -9.55% · 77%
{future}(ZECUSDT)
ABOVE — shorts get liquidated:
🔺 $1.479 · +0.45% · 25%
🔺 $1.495 · +1.49% · 50%
🔺 $1.539 · +4.48% · 75%
🔺 $1.613 · +9.55% · 100% (the heaviest one on the board)
The read: 73.3% of accounts are short and funding is at -0.0345%. The shorts are PAYING to maintain the position while price rises — that’s fuel, not balance. And the heaviest zone of the entire map is above, at $1.613.
A structural detail: a whale withdrew 15,300 ZEC (about US$17.9M) from Binance, OKX, and Kraken during the rally. Less supply on exchanges, same short leverage.
Are you looking for $1.539 or does it flip against the shorts?
Follow me for the next episode of Whale Flow.
#ZEC #Zcash #Binance $ZEC
Data: Binance API + press from 17-09-2026. Estimated zones. Not financial advice. DYOR.
73% of the accounts are under-collateralized at $ZEC y the price rose 12%: they’re paying to be against.
ZEC at $1.473 (+12.09% in 24h, +160% in a month). Three specific catalysts in a week: holders voted NU7 —99.9% in favor of lowering blocks from 75 to 25 seconds while keeping the halving—, Paradigm revealed that it has ZEC and called it "Bitcoin’s private counterpart", and Zcash Labs funded the integration of the shielded pool in Ledger. All of this while the Senate was blocking the CLARITY Act.
Liquidation map, by distance from the price:
BELOW — longs get liquidated:
🔻 $1.466 · -0.45% · 20%
🔻 $1.451 · -1.49% · 38%
🔻 $1.407 · -4.48% · 58%
🔻 $1.332 · -9.55% · 77%
ABOVE — shorts get liquidated:
🔺 $1.479 · +0.45% · 25%
🔺 $1.495 · +1.49% · 50%
🔺 $1.539 · +4.48% · 75%
🔺 $1.613 · +9.55% · 100% (the heaviest one on the board)
The read: 73.3% of accounts are short and funding is at -0.0345%. The shorts are PAYING to maintain the position while price rises — that’s fuel, not balance. And the heaviest zone of the entire map is above, at $1.613.
A structural detail: a whale withdrew 15,300 ZEC (about US$17.9M) from Binance, OKX, and Kraken during the rally. Less supply on exchanges, same short leverage.
Are you looking for $1.539 or does it flip against the shorts?
Follow me for the next episode of Whale Flow.
#ZEC #Zcash #Binance $ZEC
Data: Binance API + press from 17-09-2026. Estimated zones. Not financial advice. DYOR.
ZEC at $1.473 (+12.09% in 24h, +160% in a month). Three specific catalysts in a week: holders voted NU7 —99.9% in favor of lowering blocks from 75 to 25 seconds while keeping the halving—, Paradigm revealed that it has ZEC and called it "Bitcoin’s private counterpart", and Zcash Labs funded the integration of the shielded pool in Ledger. All of this while the Senate was blocking the CLARITY Act.
Liquidation map, by distance from the price:
BELOW — longs get liquidated:
🔻 $1.466 · -0.45% · 20%
🔻 $1.451 · -1.49% · 38%
🔻 $1.407 · -4.48% · 58%
🔻 $1.332 · -9.55% · 77%
ABOVE — shorts get liquidated:
🔺 $1.479 · +0.45% · 25%
🔺 $1.495 · +1.49% · 50%
🔺 $1.539 · +4.48% · 75%
🔺 $1.613 · +9.55% · 100% (the heaviest one on the board)
The read: 73.3% of accounts are short and funding is at -0.0345%. The shorts are PAYING to maintain the position while price rises — that’s fuel, not balance. And the heaviest zone of the entire map is above, at $1.613.
A structural detail: a whale withdrew 15,300 ZEC (about US$17.9M) from Binance, OKX, and Kraken during the rally. Less supply on exchanges, same short leverage.
Are you looking for $1.539 or does it flip against the shorts?
Follow me for the next episode of Whale Flow.
#ZEC #Zcash #Binance $ZEC
Data: Binance API + press from 17-09-2026. Estimated zones. Not financial advice. DYOR.
2
2
1.6k
·
--
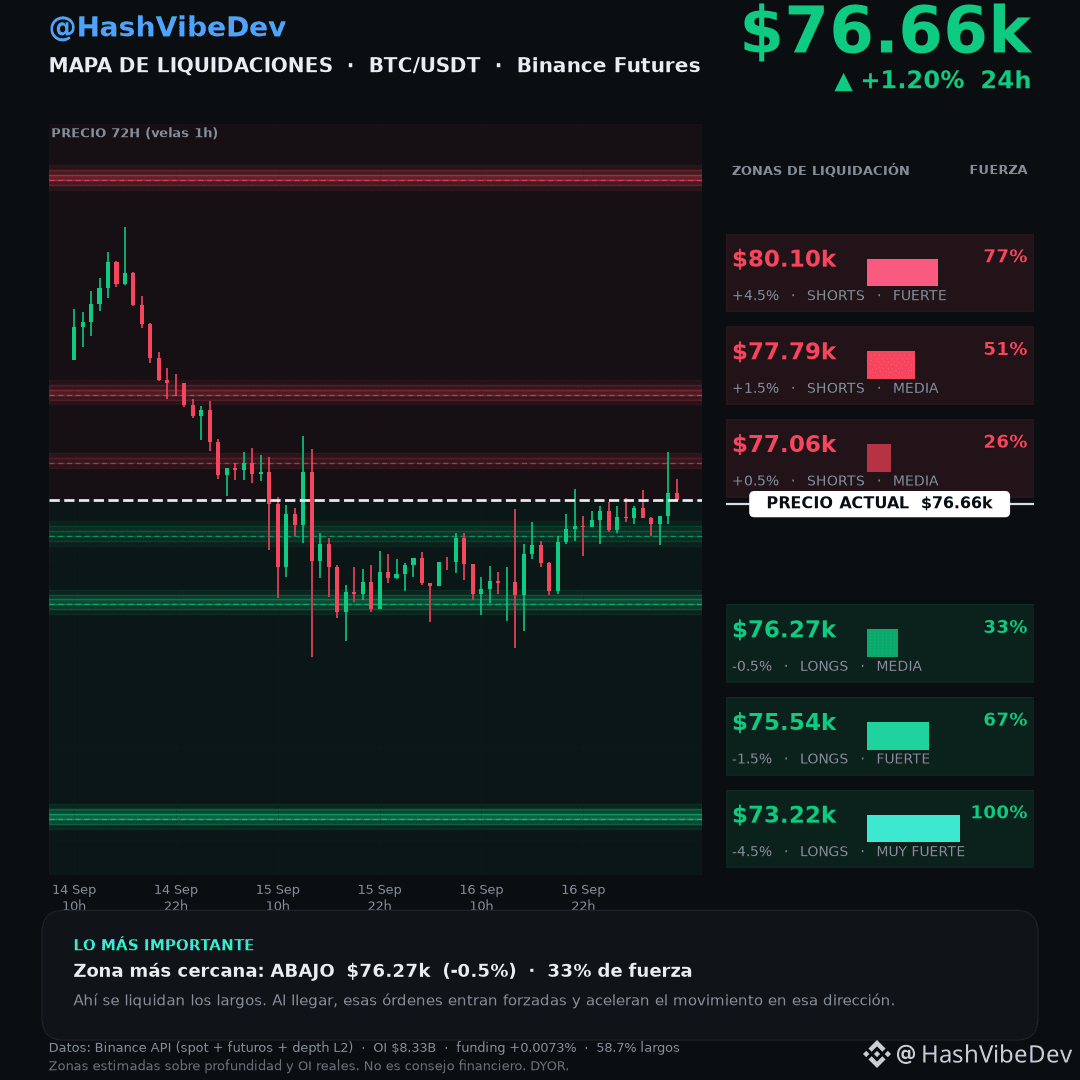
The Fed raised the rate and Bitcoin absorbed it: now it attacks the upper zone.
$BTC en $76,664 (+1.20% in 24h), one day after the FOMC raised 25 bps to 3.75%-4.00% (the first hike since July 2023, with the dot plot calling for one more). The rate was already priced in: the real blow came from elsewhere, with the Senate blocking the CLARITY Act and the largest daily outflow from BTC ETFs since June, US$450.33 million.
Liquidation map, by distance to the price:
BELOW — longs get liquidated:
🔻 $76,270 · -0.51% · 33%
🔻 $75,535 · -1.47% · 67%
🔻 $73,224 · -4.49% · 100% (the heaviest)
{future}(BTCUSDT)
ABOVE — shorts get liquidated:
🔺 $77,057 · +0.51% · 26%
🔺 $77,792 · +1.47% · 51%
🔺 $80,103 · +4.49% · 77%
The read: $77,057 has 26% strength and $77,792 has 51% — the upper zone is lighter than the lower one in the short term. If it clears them, the meat is up there. Down below, $76,270 is the only nearby level, but behind it there’s a wall at -1.5%.
Open interest in Binance futures is at 108,572 BTC, with 58.7% of accounts long. Without losing $76,270, the bias tilts upward.
Does it break $77,057 or does it return to $75,535?
Follow me for the next episode of Whale Flow.
#BTC #Binance $BTC
Sources: Binance API, 17-09-2026. Not financial advice. Do your own research.
The Fed raised the rate and Bitcoin absorbed it: now it attacks the upper zone.
$BTC en $76,664 (+1.20% in 24h), one day after the FOMC raised 25 bps to 3.75%-4.00% (the first hike since July 2023, with the dot plot calling for one more). The rate was already priced in: the real blow came from elsewhere, with the Senate blocking the CLARITY Act and the largest daily outflow from BTC ETFs since June, US$450.33 million.
Liquidation map, by distance to the price:
BELOW — longs get liquidated:
🔻 $76,270 · -0.51% · 33%
🔻 $75,535 · -1.47% · 67%
🔻 $73,224 · -4.49% · 100% (the heaviest)
ABOVE — shorts get liquidated:
🔺 $77,057 · +0.51% · 26%
🔺 $77,792 · +1.47% · 51%
🔺 $80,103 · +4.49% · 77%
The read: $77,057 has 26% strength and $77,792 has 51% — the upper zone is lighter than the lower one in the short term. If it clears them, the meat is up there. Down below, $76,270 is the only nearby level, but behind it there’s a wall at -1.5%.
Open interest in Binance futures is at 108,572 BTC, with 58.7% of accounts long. Without losing $76,270, the bias tilts upward.
Does it break $77,057 or does it return to $75,535?
Follow me for the next episode of Whale Flow.
#BTC #Binance $BTC
Sources: Binance API, 17-09-2026. Not financial advice. Do your own research.
$BTC en $76,664 (+1.20% in 24h), one day after the FOMC raised 25 bps to 3.75%-4.00% (the first hike since July 2023, with the dot plot calling for one more). The rate was already priced in: the real blow came from elsewhere, with the Senate blocking the CLARITY Act and the largest daily outflow from BTC ETFs since June, US$450.33 million.
Liquidation map, by distance to the price:
BELOW — longs get liquidated:
🔻 $76,270 · -0.51% · 33%
🔻 $75,535 · -1.47% · 67%
🔻 $73,224 · -4.49% · 100% (the heaviest)
ABOVE — shorts get liquidated:
🔺 $77,057 · +0.51% · 26%
🔺 $77,792 · +1.47% · 51%
🔺 $80,103 · +4.49% · 77%
The read: $77,057 has 26% strength and $77,792 has 51% — the upper zone is lighter than the lower one in the short term. If it clears them, the meat is up there. Down below, $76,270 is the only nearby level, but behind it there’s a wall at -1.5%.
Open interest in Binance futures is at 108,572 BTC, with 58.7% of accounts long. Without losing $76,270, the bias tilts upward.
Does it break $77,057 or does it return to $75,535?
Follow me for the next episode of Whale Flow.
#BTC #Binance $BTC
Sources: Binance API, 17-09-2026. Not financial advice. Do your own research.
2
2
5.2k
·
--
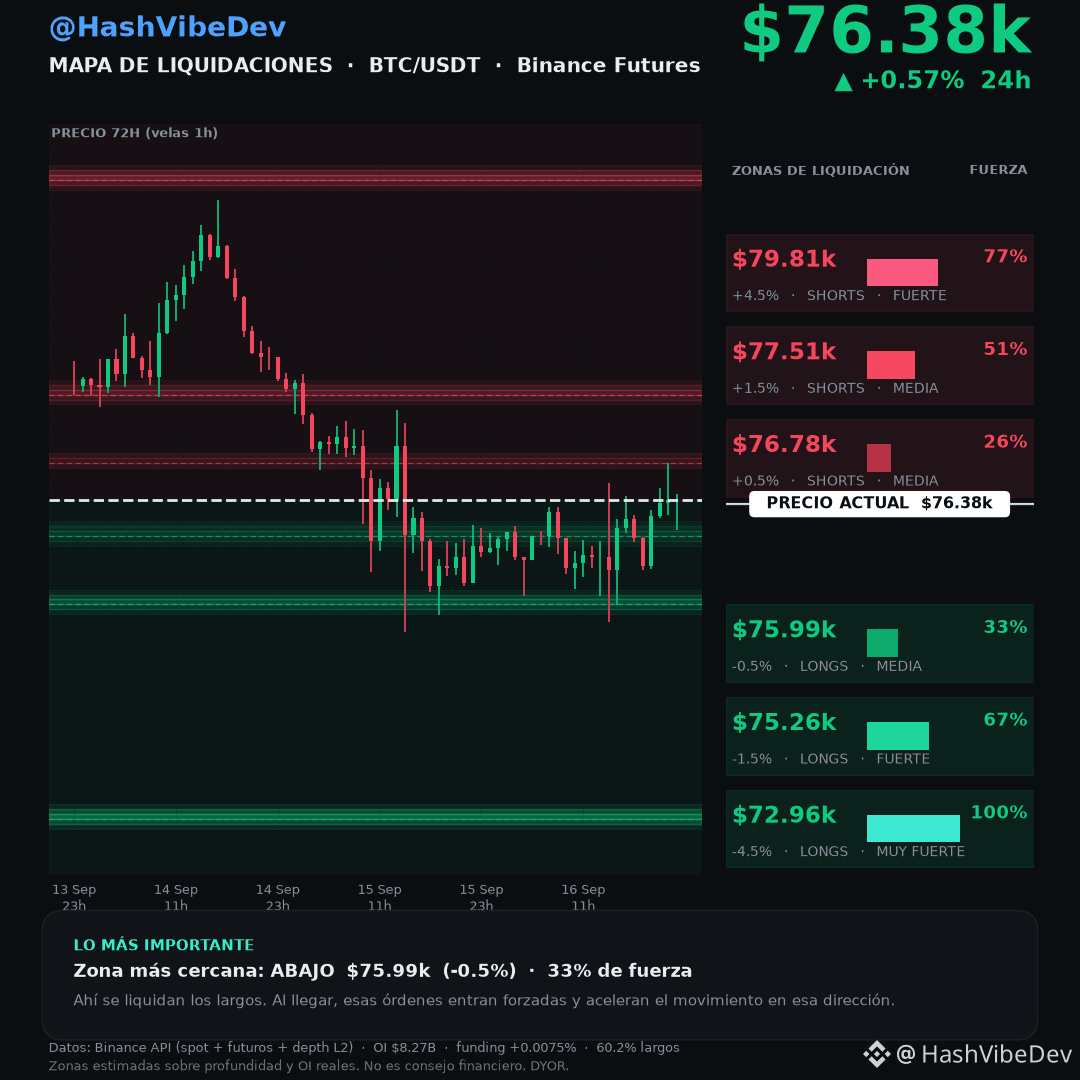
The Fed raised the rate for the first time in three years and $BTC didn’t flinch: it stays at $76,400.
BTC at $76,384 (+0.57% in 24h). The FOMC raised 25 bps to 3.75%-4.00% (first hike since July 2023) and the dot plot is calling for one more. The rate was already priced in: the hit came on Tuesday, with the Senate blocking the CLARITY Act 49-50 and the largest daily outflow from BTC ETFs since June, US$450.33 million.
My plan for the next few hours: I won’t trade until the price picks a zone. The reason is that the liquidation map is split.
DOWN — longs get liquidated:
🔻 $75,991 · -0.51% · 33%
🔻 $75,259 · -1.47% · 67%
🔻 $72,957 · -4.49% · 100% (heaviest)
{future}(BTCUSDT)
UP — shorts get liquidated:
🔺 $76,776 · +0.51% · 26%
🔺 $77,508 · +1.47% · 51%
🔺 $79,810 · +4.49% · 77%
The upper zone is closer and the weakest (26%): if it loses $76,776, the first real magnet is $77,508. Down below, $75,991 is the only nearby one, but behind it there’s a wall at -1.5%. Neither gives me an entry with a good risk-reward ratio, so I’m waiting.
And leverage didn’t drop: Binance futures OI rose to 107,972 BTC with 60.3% of accounts long. That’s fuel. Without reclaiming $77,508, the bias stays bearish.
How are you going to trade?
#FedRateWatch #BTC #Binance $BTC
Data: Binance API, 16-09-2026. Estimated zones based on real OI and order book depth. Not financial advice. DYOR.
The Fed raised the rate for the first time in three years and $BTC didn’t flinch: it stays at $76,400.
BTC at $76,384 (+0.57% in 24h). The FOMC raised 25 bps to 3.75%-4.00% (first hike since July 2023) and the dot plot is calling for one more. The rate was already priced in: the hit came on Tuesday, with the Senate blocking the CLARITY Act 49-50 and the largest daily outflow from BTC ETFs since June, US$450.33 million.
My plan for the next few hours: I won’t trade until the price picks a zone. The reason is that the liquidation map is split.
DOWN — longs get liquidated:
🔻 $75,991 · -0.51% · 33%
🔻 $75,259 · -1.47% · 67%
🔻 $72,957 · -4.49% · 100% (heaviest)
UP — shorts get liquidated:
🔺 $76,776 · +0.51% · 26%
🔺 $77,508 · +1.47% · 51%
🔺 $79,810 · +4.49% · 77%
The upper zone is closer and the weakest (26%): if it loses $76,776, the first real magnet is $77,508. Down below, $75,991 is the only nearby one, but behind it there’s a wall at -1.5%. Neither gives me an entry with a good risk-reward ratio, so I’m waiting.
And leverage didn’t drop: Binance futures OI rose to 107,972 BTC with 60.3% of accounts long. That’s fuel. Without reclaiming $77,508, the bias stays bearish.
How are you going to trade?
#FedRateWatch #BTC #Binance $BTC
Data: Binance API, 16-09-2026. Estimated zones based on real OI and order book depth. Not financial advice. DYOR.
BTC at $76,384 (+0.57% in 24h). The FOMC raised 25 bps to 3.75%-4.00% (first hike since July 2023) and the dot plot is calling for one more. The rate was already priced in: the hit came on Tuesday, with the Senate blocking the CLARITY Act 49-50 and the largest daily outflow from BTC ETFs since June, US$450.33 million.
My plan for the next few hours: I won’t trade until the price picks a zone. The reason is that the liquidation map is split.
DOWN — longs get liquidated:
🔻 $75,991 · -0.51% · 33%
🔻 $75,259 · -1.47% · 67%
🔻 $72,957 · -4.49% · 100% (heaviest)
UP — shorts get liquidated:
🔺 $76,776 · +0.51% · 26%
🔺 $77,508 · +1.47% · 51%
🔺 $79,810 · +4.49% · 77%
The upper zone is closer and the weakest (26%): if it loses $76,776, the first real magnet is $77,508. Down below, $75,991 is the only nearby one, but behind it there’s a wall at -1.5%. Neither gives me an entry with a good risk-reward ratio, so I’m waiting.
And leverage didn’t drop: Binance futures OI rose to 107,972 BTC with 60.3% of accounts long. That’s fuel. Without reclaiming $77,508, the bias stays bearish.
How are you going to trade?
#FedRateWatch #BTC #Binance $BTC
Data: Binance API, 16-09-2026. Estimated zones based on real OI and order book depth. Not financial advice. DYOR.
192
·
--
Verified
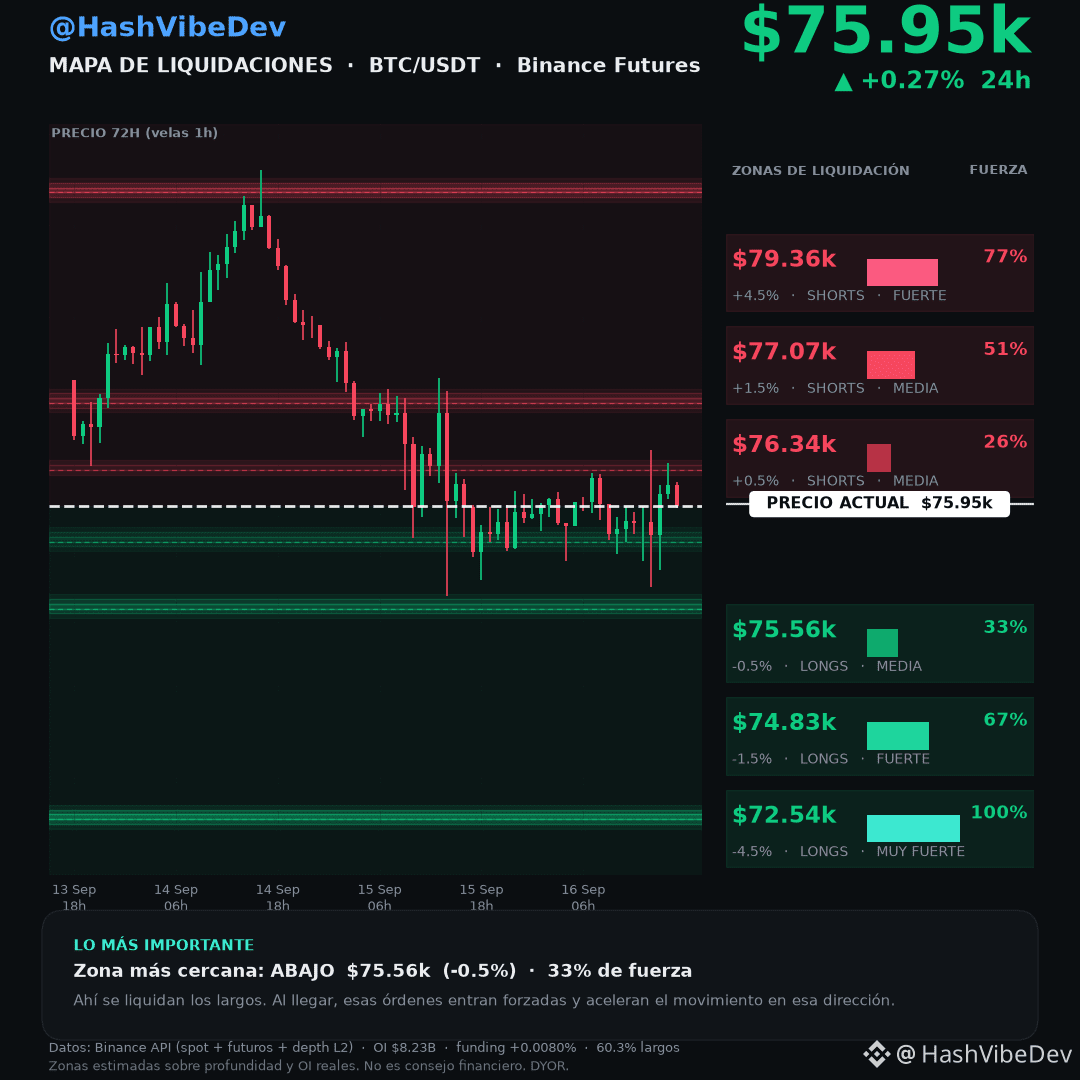
$BTC The Fed raised the rate for the first time in three years and Bitcoin didn’t move at all.
BTC at $75,952 (+0.27% in 24h). The FOMC raised 25 bps to 3.75%-4.00%—the first hike since July 2023—and the dot plot is signaling another one. The rate was already priced in: the move hit Tuesday, with the Senate blocking the CLARITY Act 49-50 and the largest daily outflow from BTC ETFs since June, at $450.33 million.
Liquidation map, by distance from the price:
BELOW—longs are liquidated:
🔻 $75,562 · -0.51% · 33%
🔻 $74,833 · -1.47% · 67%
🔻 $72,544 · -4.49% · 100% (the heaviest)
{future}(BTCUSDT)
ABOVE—shorts are liquidated:
🔺 $76,342 · +0.51% · 26%
🔺 $77,070 · +1.47% · 51%
🔺 $79,359 · +4.49% · 77%
The read: price got trapped between $76,342 and $75,562, and Binance futures OI rose to 107,972 BTC with 60.3% long accounts—the leverage didn’t drop. Without reclaiming $77,070, the bias remains bearish.
And a whale already moved: 866 BTC exchanged for 26,924 ETH (US$64.57M) hours before the Senate vote.
Does it hold $75,562 or does it seek $72,544? I’ll read your take 👇
Follow me for the next episode of Whale Flow.
#BTC #Bitcoin $BTC
Data: Binance API + CoinDesk/Lookonchain, 16-09-2026. Not financial advice. DYOR.
$BTC The Fed raised the rate for the first time in three years and Bitcoin didn’t move at all.
BTC at $75,952 (+0.27% in 24h). The FOMC raised 25 bps to 3.75%-4.00%—the first hike since July 2023—and the dot plot is signaling another one. The rate was already priced in: the move hit Tuesday, with the Senate blocking the CLARITY Act 49-50 and the largest daily outflow from BTC ETFs since June, at $450.33 million.
Liquidation map, by distance from the price:
BELOW—longs are liquidated:
🔻 $75,562 · -0.51% · 33%
🔻 $74,833 · -1.47% · 67%
🔻 $72,544 · -4.49% · 100% (the heaviest)
ABOVE—shorts are liquidated:
🔺 $76,342 · +0.51% · 26%
🔺 $77,070 · +1.47% · 51%
🔺 $79,359 · +4.49% · 77%
The read: price got trapped between $76,342 and $75,562, and Binance futures OI rose to 107,972 BTC with 60.3% long accounts—the leverage didn’t drop. Without reclaiming $77,070, the bias remains bearish.
And a whale already moved: 866 BTC exchanged for 26,924 ETH (US$64.57M) hours before the Senate vote.
Does it hold $75,562 or does it seek $72,544? I’ll read your take 👇
Follow me for the next episode of Whale Flow.
#BTC #Bitcoin $BTC
Data: Binance API + CoinDesk/Lookonchain, 16-09-2026. Not financial advice. DYOR.
BTC at $75,952 (+0.27% in 24h). The FOMC raised 25 bps to 3.75%-4.00%—the first hike since July 2023—and the dot plot is signaling another one. The rate was already priced in: the move hit Tuesday, with the Senate blocking the CLARITY Act 49-50 and the largest daily outflow from BTC ETFs since June, at $450.33 million.
Liquidation map, by distance from the price:
BELOW—longs are liquidated:
🔻 $75,562 · -0.51% · 33%
🔻 $74,833 · -1.47% · 67%
🔻 $72,544 · -4.49% · 100% (the heaviest)
ABOVE—shorts are liquidated:
🔺 $76,342 · +0.51% · 26%
🔺 $77,070 · +1.47% · 51%
🔺 $79,359 · +4.49% · 77%
The read: price got trapped between $76,342 and $75,562, and Binance futures OI rose to 107,972 BTC with 60.3% long accounts—the leverage didn’t drop. Without reclaiming $77,070, the bias remains bearish.
And a whale already moved: 866 BTC exchanged for 26,924 ETH (US$64.57M) hours before the Senate vote.
Does it hold $75,562 or does it seek $72,544? I’ll read your take 👇
Follow me for the next episode of Whale Flow.
#BTC #Bitcoin $BTC
Data: Binance API + CoinDesk/Lookonchain, 16-09-2026. Not financial advice. DYOR.
3
4k
·
--
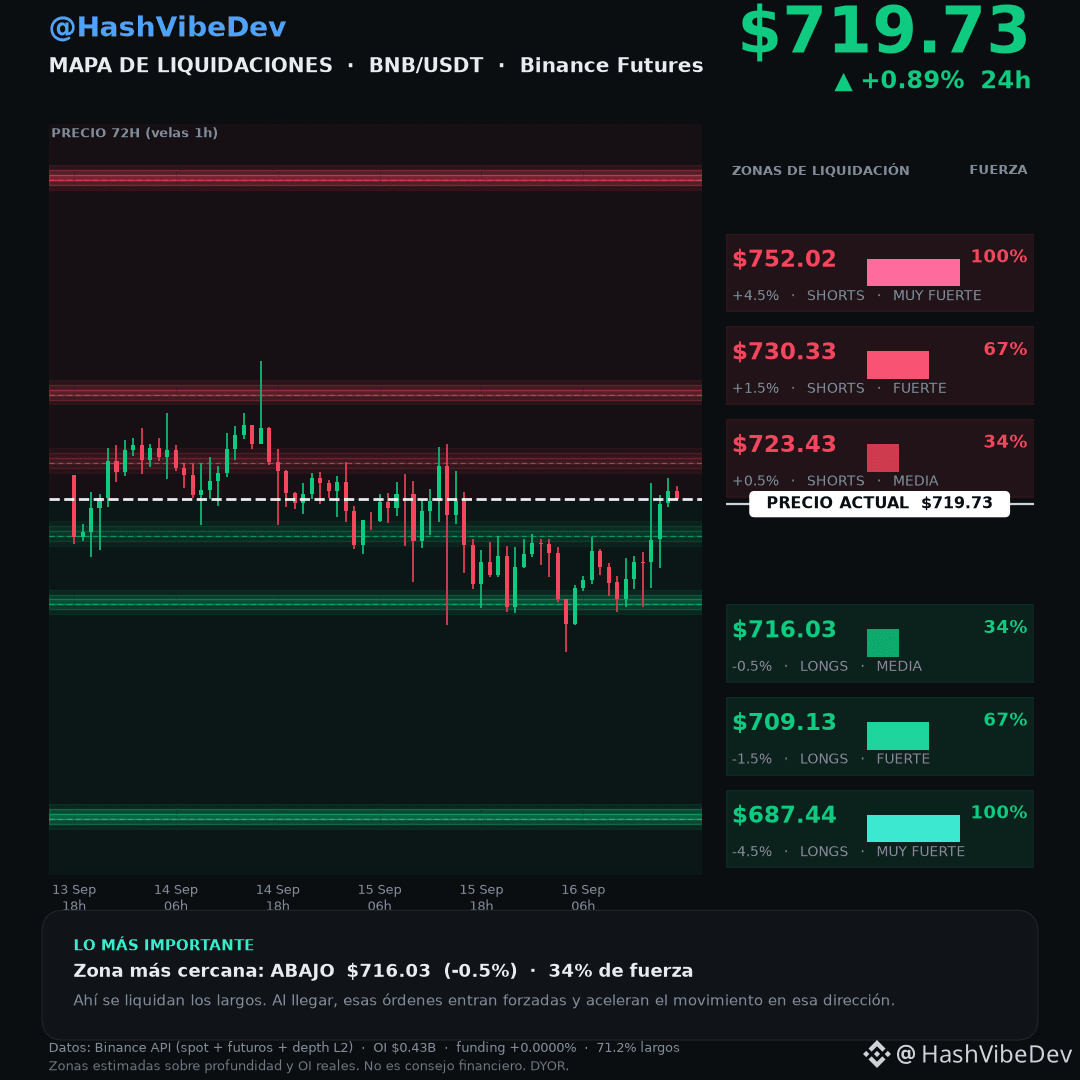
$BNB rebounds after the Fed hike, but the liquidation map remained symmetrical.
📉 BNB at $719.73 (+0.89% in 24h). The Fed raised 25 bps to 3.75%-4.00% (first hike since July 2023, with a dot plot calling for one more) and the market didn’t react. The week’s blow came on Tuesday: the Senate blocked the CLARITY Act.
Liquidation map, by distance to price:
BELOW - longs get liquidated:
🔻 $716.03 · -0.51% · 34% of strength
🔻 $709.13 · -1.47% · 67%
🔻 $687.44 · -4.49% · 100% (heaviest)
{future}(BNBUSDT)
ABOVE - shorts get liquidated:
🔺 $723.43 · +0.51% · 34%
🔺 $730.33 · +1.47% · 67%
🔺 $752.02 · +4.49% · 100%
The map came out almost mirrored because funding is at zero: nobody pays for being long or for being short—the “meat” gets split evenly and price has no clear magnet. The first weighted level is at -1.5% ($709.13, 67%).
And a BNB-specific risk: on BNB Chain it’s used as collateral, so a drop to $709 can trigger cascading liquidations.
Does it break one way or the other?
Follow me for the next episode of Whale Flow.
#BNB #Binance $BNB
Data: Binance API (spot + futures + L2) + press from 16-09-2026. Estimated zones. Not financial advice. DYOR.
$BNB rebounds after the Fed hike, but the liquidation map remained symmetrical.
📉 BNB at $719.73 (+0.89% in 24h). The Fed raised 25 bps to 3.75%-4.00% (first hike since July 2023, with a dot plot calling for one more) and the market didn’t react. The week’s blow came on Tuesday: the Senate blocked the CLARITY Act.
Liquidation map, by distance to price:
BELOW - longs get liquidated:
🔻 $716.03 · -0.51% · 34% of strength
🔻 $709.13 · -1.47% · 67%
🔻 $687.44 · -4.49% · 100% (heaviest)
ABOVE - shorts get liquidated:
🔺 $723.43 · +0.51% · 34%
🔺 $730.33 · +1.47% · 67%
🔺 $752.02 · +4.49% · 100%
The map came out almost mirrored because funding is at zero: nobody pays for being long or for being short—the “meat” gets split evenly and price has no clear magnet. The first weighted level is at -1.5% ($709.13, 67%).
And a BNB-specific risk: on BNB Chain it’s used as collateral, so a drop to $709 can trigger cascading liquidations.
Does it break one way or the other?
Follow me for the next episode of Whale Flow.
#BNB #Binance $BNB
Data: Binance API (spot + futures + L2) + press from 16-09-2026. Estimated zones. Not financial advice. DYOR.
📉 BNB at $719.73 (+0.89% in 24h). The Fed raised 25 bps to 3.75%-4.00% (first hike since July 2023, with a dot plot calling for one more) and the market didn’t react. The week’s blow came on Tuesday: the Senate blocked the CLARITY Act.
Liquidation map, by distance to price:
BELOW - longs get liquidated:
🔻 $716.03 · -0.51% · 34% of strength
🔻 $709.13 · -1.47% · 67%
🔻 $687.44 · -4.49% · 100% (heaviest)
ABOVE - shorts get liquidated:
🔺 $723.43 · +0.51% · 34%
🔺 $730.33 · +1.47% · 67%
🔺 $752.02 · +4.49% · 100%
The map came out almost mirrored because funding is at zero: nobody pays for being long or for being short—the “meat” gets split evenly and price has no clear magnet. The first weighted level is at -1.5% ($709.13, 67%).
And a BNB-specific risk: on BNB Chain it’s used as collateral, so a drop to $709 can trigger cascading liquidations.
Does it break one way or the other?
Follow me for the next episode of Whale Flow.
#BNB #Binance $BNB
Data: Binance API (spot + futures + L2) + press from 16-09-2026. Estimated zones. Not financial advice. DYOR.
196
·
--
$BNB cae for two hits: the regulatory slowdown in the U.S. and the Fed.
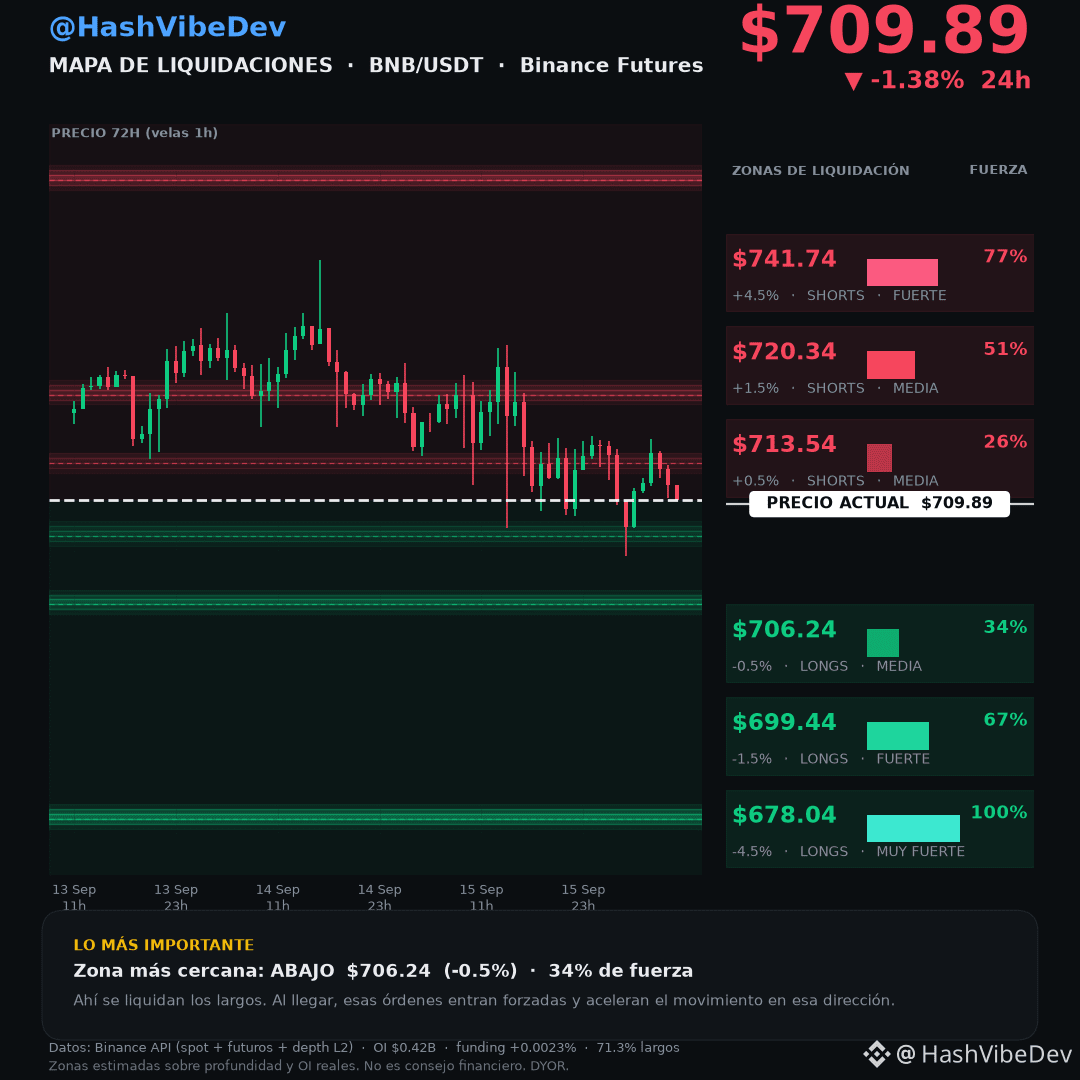
📉 BNB at $709.89 (-1.38% in 24h; near -3.7% in 7 days). The Senate failed to move forward with the CLARITY Act (49-50, needed 60) and today it also sets the Fed at 14:00 ET. BNB couldn’t hold $750-770, and the unwinding of leveraged longs brought it to this point.
The liquidation map, ordered by distance from the price:
BELOW — longs are liquidated:
🔻 $706.24 · -0.51% · 34% of force
🔻 $699.44 · -1.47% · 67%
🔻 $678.04 · -4.49% · 100% (heaviest on the board)
{future}(BNBUSDT)
ABOVE — shorts are liquidated:
🔺 $713.54 · +0.51% · 26%
🔺 $720.34 · +1.47% · 51%
🔺 $741.74 · +4.49% · 77%
The closest zone is below and weak ($706.24, 34%); right behind it is a strong one at -1.5%. And BNB has a risk BTC doesn’t: on BNB Chain, it’s used as collateral to borrow, so a drop to $699 can trigger automatic liquidations.
71.3% of accounts are long. Does it hold $706 or breaks?
Follow me for the next episode of Whale Flow.
#BNB #Binance $BNB
Data: Binance API (spot + futures + L2) + press from 16-09-2026. Estimated zones on OI and real depth. Not financial advice. DYOR.
$BNB cae for two hits: the regulatory slowdown in the U.S. and the Fed.
📉 BNB at $709.89 (-1.38% in 24h; near -3.7% in 7 days). The Senate failed to move forward with the CLARITY Act (49-50, needed 60) and today it also sets the Fed at 14:00 ET. BNB couldn’t hold $750-770, and the unwinding of leveraged longs brought it to this point.
The liquidation map, ordered by distance from the price:
BELOW — longs are liquidated:
🔻 $706.24 · -0.51% · 34% of force
🔻 $699.44 · -1.47% · 67%
🔻 $678.04 · -4.49% · 100% (heaviest on the board)
ABOVE — shorts are liquidated:
🔺 $713.54 · +0.51% · 26%
🔺 $720.34 · +1.47% · 51%
🔺 $741.74 · +4.49% · 77%
The closest zone is below and weak ($706.24, 34%); right behind it is a strong one at -1.5%. And BNB has a risk BTC doesn’t: on BNB Chain, it’s used as collateral to borrow, so a drop to $699 can trigger automatic liquidations.
71.3% of accounts are long. Does it hold $706 or breaks?
Follow me for the next episode of Whale Flow.
#BNB #Binance $BNB
Data: Binance API (spot + futures + L2) + press from 16-09-2026. Estimated zones on OI and real depth. Not financial advice. DYOR.
📉 BNB at $709.89 (-1.38% in 24h; near -3.7% in 7 days). The Senate failed to move forward with the CLARITY Act (49-50, needed 60) and today it also sets the Fed at 14:00 ET. BNB couldn’t hold $750-770, and the unwinding of leveraged longs brought it to this point.
The liquidation map, ordered by distance from the price:
BELOW — longs are liquidated:
🔻 $706.24 · -0.51% · 34% of force
🔻 $699.44 · -1.47% · 67%
🔻 $678.04 · -4.49% · 100% (heaviest on the board)
ABOVE — shorts are liquidated:
🔺 $713.54 · +0.51% · 26%
🔺 $720.34 · +1.47% · 51%
🔺 $741.74 · +4.49% · 77%
The closest zone is below and weak ($706.24, 34%); right behind it is a strong one at -1.5%. And BNB has a risk BTC doesn’t: on BNB Chain, it’s used as collateral to borrow, so a drop to $699 can trigger automatic liquidations.
71.3% of accounts are long. Does it hold $706 or breaks?
Follow me for the next episode of Whale Flow.
#BNB #Binance $BNB
Data: Binance API (spot + futures + L2) + press from 16-09-2026. Estimated zones on OI and real depth. Not financial advice. DYOR.
2
2
156
·
--
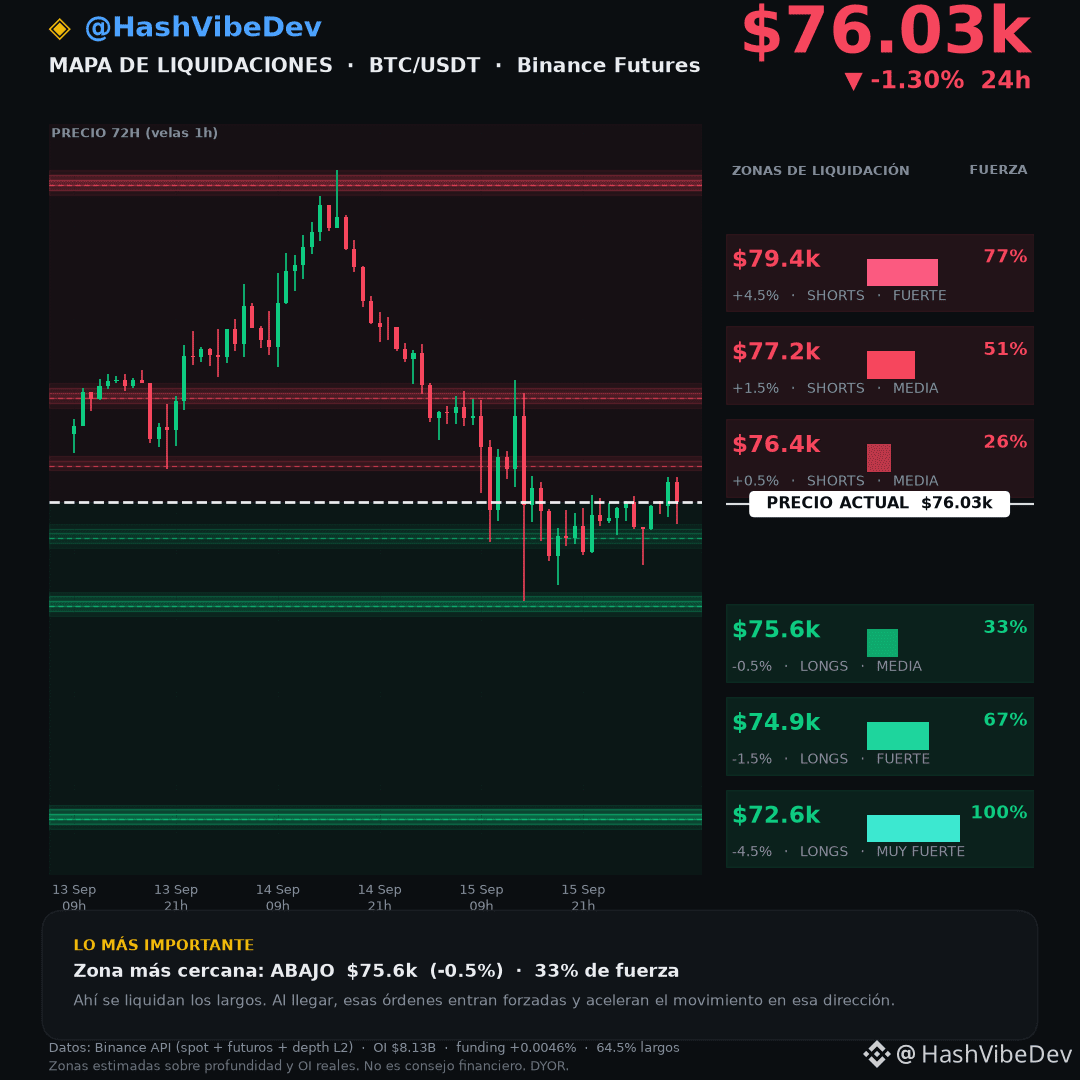
🟠 Bitcoin reaches the Fed with the heaviest liquidation zone, at -4.5% from the price.
📉 BTC at $76,032 (-1.30% in 24h). Today the Fed decides at 14:00 ET: the market is pricing in between 86% and 92% probability of a 25 bp hike to 3.75%-4.00%, the first since 2023. But the rate is already in the price. What moves the market is the dot plot.
The liquidation map, ordered by distance from the price:
BELOW — longs are liquidated:
🔻 $75,641 · -0.51% · 33% of strength
🔻 $74,912 · -1.47% · 67%
🔻 $72,621 · -4.49% · 100% (the heaviest on the board)
{future}(BTCUSDT)
ABOVE — shorts are liquidated:
🔺 $76,423 · +0.51% · 26%
🔺 $77,152 · +1.47% · 51%
🔺 $79,443 · +4.49% · 77%
The takeaway: the zone that matters is at -4.5%, not nearby. If BTC loses $75,641 and then $74,912, the path to $72,621 opens up and forced selling accelerates the drop. The weakest resistance on the map is $76,423 (26%).
Does the dot plot confirm a single hike or open a cycle? I’m listening 👇
Follow me for the next episode of Whale Flow.
#BTC #Bitcoin $BTC
Data: Binance API (spot + futures + L2) as of 16-09-2026 09:55 UTC-4. Estimated zones based on OI and real depth. Not financial advice. DYOR.
🟠 Bitcoin reaches the Fed with the heaviest liquidation zone, at -4.5% from the price.
📉 BTC at $76,032 (-1.30% in 24h). Today the Fed decides at 14:00 ET: the market is pricing in between 86% and 92% probability of a 25 bp hike to 3.75%-4.00%, the first since 2023. But the rate is already in the price. What moves the market is the dot plot.
The liquidation map, ordered by distance from the price:
BELOW — longs are liquidated:
🔻 $75,641 · -0.51% · 33% of strength
🔻 $74,912 · -1.47% · 67%
🔻 $72,621 · -4.49% · 100% (the heaviest on the board)
ABOVE — shorts are liquidated:
🔺 $76,423 · +0.51% · 26%
🔺 $77,152 · +1.47% · 51%
🔺 $79,443 · +4.49% · 77%
The takeaway: the zone that matters is at -4.5%, not nearby. If BTC loses $75,641 and then $74,912, the path to $72,621 opens up and forced selling accelerates the drop. The weakest resistance on the map is $76,423 (26%).
Does the dot plot confirm a single hike or open a cycle? I’m listening 👇
Follow me for the next episode of Whale Flow.
#BTC #Bitcoin $BTC
Data: Binance API (spot + futures + L2) as of 16-09-2026 09:55 UTC-4. Estimated zones based on OI and real depth. Not financial advice. DYOR.
📉 BTC at $76,032 (-1.30% in 24h). Today the Fed decides at 14:00 ET: the market is pricing in between 86% and 92% probability of a 25 bp hike to 3.75%-4.00%, the first since 2023. But the rate is already in the price. What moves the market is the dot plot.
The liquidation map, ordered by distance from the price:
BELOW — longs are liquidated:
🔻 $75,641 · -0.51% · 33% of strength
🔻 $74,912 · -1.47% · 67%
🔻 $72,621 · -4.49% · 100% (the heaviest on the board)
ABOVE — shorts are liquidated:
🔺 $76,423 · +0.51% · 26%
🔺 $77,152 · +1.47% · 51%
🔺 $79,443 · +4.49% · 77%
The takeaway: the zone that matters is at -4.5%, not nearby. If BTC loses $75,641 and then $74,912, the path to $72,621 opens up and forced selling accelerates the drop. The weakest resistance on the map is $76,423 (26%).
Does the dot plot confirm a single hike or open a cycle? I’m listening 👇
Follow me for the next episode of Whale Flow.
#BTC #Bitcoin $BTC
Data: Binance API (spot + futures + L2) as of 16-09-2026 09:55 UTC-4. Estimated zones based on OI and real depth. Not financial advice. DYOR.
2
455
·
--
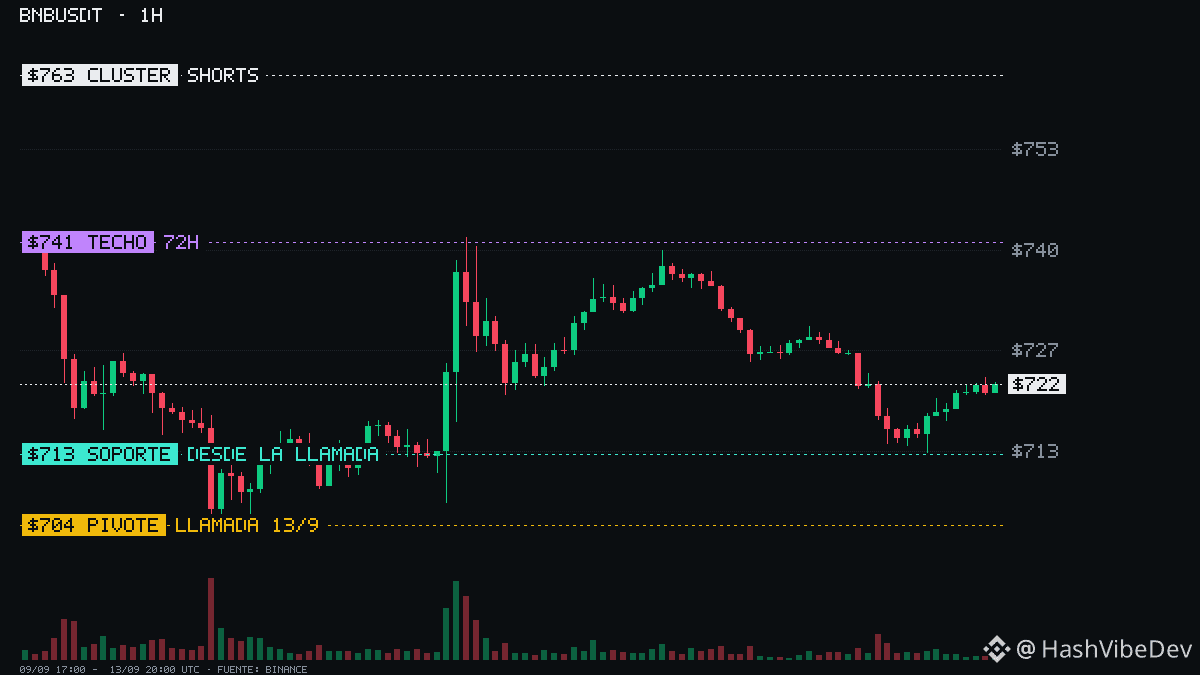
We marked $703.6 as the pivot in $BNB. Since then: ZERO candles below the level, it hasn’t even touched it again. +2.2% and the taker has already switched sides.
{future}(BNBUSDT)
• Price $722 — lowest since the call: $713.1, support remains intact
• Taker: from 0.95 (selling dominated) to 1.29 (buying dominates)
• The crowd: 71.3% still long, and with funding at 0.00% holding the position remains cost-free
Honest with the data: the bounce comes with volume at 0.8x the average, still no conviction.
The map: below $713 holds; if it breaks, the return is straight to $703.6. Above $741 is the 72h ceiling and behind it waits the shorts cluster at $763, with $130M in accumulated liquidations.
Will it push to $763 or will it stall at $741?
NFA/DYOR · Data: Binance Futures API
$BNB
We marked $703.6 as the pivot in $BNB. Since then: ZERO candles below the level, it hasn’t even touched it again. +2.2% and the taker has already switched sides.
• Price $722 — lowest since the call: $713.1, support remains intact
• Taker: from 0.95 (selling dominated) to 1.29 (buying dominates)
• The crowd: 71.3% still long, and with funding at 0.00% holding the position remains cost-free
Honest with the data: the bounce comes with volume at 0.8x the average, still no conviction.
The map: below $713 holds; if it breaks, the return is straight to $703.6. Above $741 is the 72h ceiling and behind it waits the shorts cluster at $763, with $130M in accumulated liquidations.
Will it push to $763 or will it stall at $741?
NFA/DYOR · Data: Binance Futures API
$BNB
• Price $722 — lowest since the call: $713.1, support remains intact
• Taker: from 0.95 (selling dominated) to 1.29 (buying dominates)
• The crowd: 71.3% still long, and with funding at 0.00% holding the position remains cost-free
Honest with the data: the bounce comes with volume at 0.8x the average, still no conviction.
The map: below $713 holds; if it breaks, the return is straight to $703.6. Above $741 is the 72h ceiling and behind it waits the shorts cluster at $763, with $130M in accumulated liquidations.
Will it push to $763 or will it stall at $741?
NFA/DYOR · Data: Binance Futures API
$BNB
332
·
--
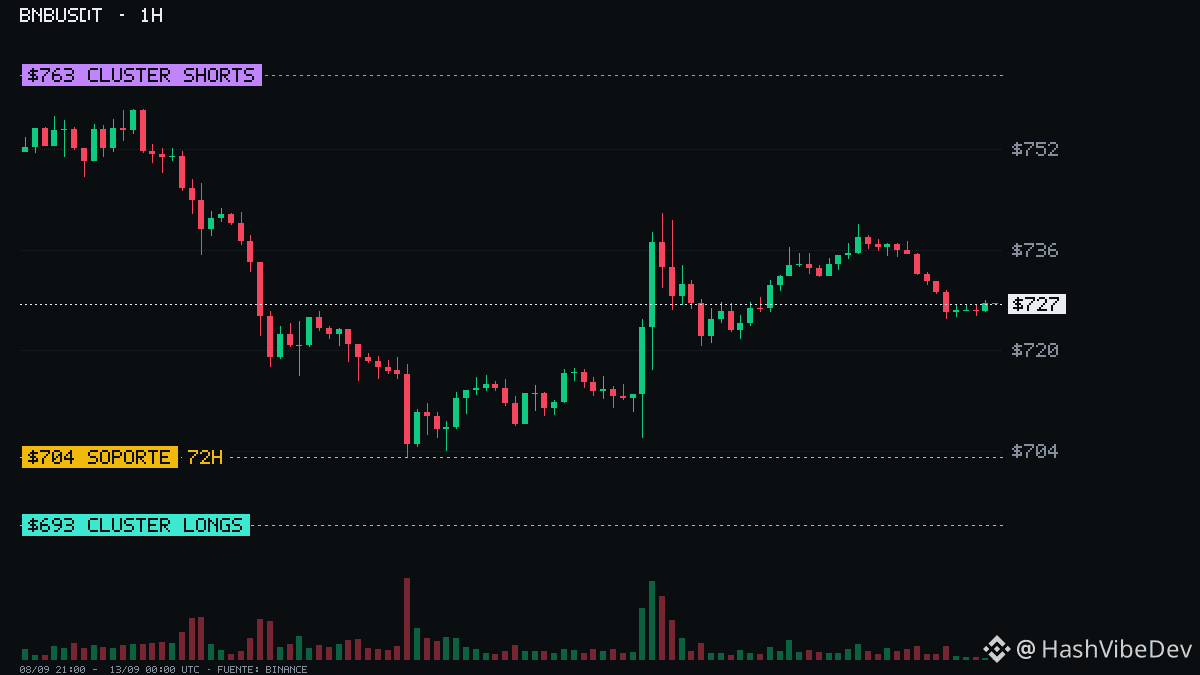
$BNB cae -4.5% and 72% of the accounts remain long: the crowd ended up on the opposite side at the 72-hour minimum.
{future}(BNBUSDT)
• Price $706.8, 0.5% above the 72h low ($703.6), a zone that has already held twice
• Accounts: 72.4% long (L/S 2.62) · top traders 71.5% long — extreme positioning
• Funding: 0.00% exact. No one is paying a premium to be long despite the crowd
• OI $430M (-5.5% in 24h): leverage is being unwound
The map: if $703.6 breaks, there are $67M in longs liquidatable with clusters around $693 and $687. Above, the fuel is bigger: $130M in shorts liquidatable, with a cluster at $763.
For 72% to be long at the floor of the range with neutral funding is the strangest setup on the board today. Bounce from $703 or a breakdown?
NFA/DYOR · Data: Binance Futures API
$BNB
$BNB cae -4.5% and 72% of the accounts remain long: the crowd ended up on the opposite side at the 72-hour minimum.
• Price $706.8, 0.5% above the 72h low ($703.6), a zone that has already held twice
• Accounts: 72.4% long (L/S 2.62) · top traders 71.5% long — extreme positioning
• Funding: 0.00% exact. No one is paying a premium to be long despite the crowd
• OI $430M (-5.5% in 24h): leverage is being unwound
The map: if $703.6 breaks, there are $67M in longs liquidatable with clusters around $693 and $687. Above, the fuel is bigger: $130M in shorts liquidatable, with a cluster at $763.
For 72% to be long at the floor of the range with neutral funding is the strangest setup on the board today. Bounce from $703 or a breakdown?
NFA/DYOR · Data: Binance Futures API
$BNB
• Price $706.8, 0.5% above the 72h low ($703.6), a zone that has already held twice
• Accounts: 72.4% long (L/S 2.62) · top traders 71.5% long — extreme positioning
• Funding: 0.00% exact. No one is paying a premium to be long despite the crowd
• OI $430M (-5.5% in 24h): leverage is being unwound
The map: if $703.6 breaks, there are $67M in longs liquidatable with clusters around $693 and $687. Above, the fuel is bigger: $130M in shorts liquidatable, with a cluster at $763.
For 72% to be long at the floor of the range with neutral funding is the strangest setup on the board today. Bounce from $703 or a breakdown?
NFA/DYOR · Data: Binance Futures API
$BNB
163
·
--
🟠 Bitcoin dipped below $80K, was rejected, and now the entire market is watching today’s CPI. Tension is at its peak.
📊 BTC is around $77,300 (+0.2% 24h) after hitting $79,890 earlier—its fourth rejection in the $80K area in weeks. Meanwhile, Bitcoin ETFs recorded their biggest daily inflow since January.
What’s at stake:
📈 Institutional flow: record ETF inflows show big money is still buying the dip.
⚔️ Positioning: retail traders and top long traders at elevated levels—the board is crowded right where price stalls.
🌡️ Funding: green and uncapped—missing the catalyst to force a squeeze in a clear direction.
🔀 ETH divergence: while BTC stalls at $80K, ETH prints 72.6% taker buys. Rotation to Ethereum or a top signal?
The map:
🔻 Support: $76.0K (short-term 20-day SMA), and the $74.5K–$75K area converges as a demand wall.
🔺 Resistance: $79.9K–$80K, the last gateway before all-time highs.
Today’s CPI (8:30 ET) and the Fed meeting (Sept 15–16) determine whether this institutional push breaks $80K or if price cools off again. ETFs are buying, but the board is full—something has to give.
Does $80K break on CPI, or do we return to the support zone? I’m listening 👇
#BTC $BTC #BinanceSquare #BitcoinETFs #CPI
Data: Binance Futures API. Not financial advice. DYOR.
{future}(BTCUSDT)
🟠 Bitcoin dipped below $80K, was rejected, and now the entire market is watching today’s CPI. Tension is at its peak.
📊 BTC is around $77,300 (+0.2% 24h) after hitting $79,890 earlier—its fourth rejection in the $80K area in weeks. Meanwhile, Bitcoin ETFs recorded their biggest daily inflow since January.
What’s at stake:
📈 Institutional flow: record ETF inflows show big money is still buying the dip.
⚔️ Positioning: retail traders and top long traders at elevated levels—the board is crowded right where price stalls.
🌡️ Funding: green and uncapped—missing the catalyst to force a squeeze in a clear direction.
🔀 ETH divergence: while BTC stalls at $80K, ETH prints 72.6% taker buys. Rotation to Ethereum or a top signal?
The map:
🔻 Support: $76.0K (short-term 20-day SMA), and the $74.5K–$75K area converges as a demand wall.
🔺 Resistance: $79.9K–$80K, the last gateway before all-time highs.
Today’s CPI (8:30 ET) and the Fed meeting (Sept 15–16) determine whether this institutional push breaks $80K or if price cools off again. ETFs are buying, but the board is full—something has to give.
Does $80K break on CPI, or do we return to the support zone? I’m listening 👇
#BTC $BTC #BinanceSquare #BitcoinETFs #CPI
Data: Binance Futures API. Not financial advice. DYOR.
📊 BTC is around $77,300 (+0.2% 24h) after hitting $79,890 earlier—its fourth rejection in the $80K area in weeks. Meanwhile, Bitcoin ETFs recorded their biggest daily inflow since January.
What’s at stake:
📈 Institutional flow: record ETF inflows show big money is still buying the dip.
⚔️ Positioning: retail traders and top long traders at elevated levels—the board is crowded right where price stalls.
🌡️ Funding: green and uncapped—missing the catalyst to force a squeeze in a clear direction.
🔀 ETH divergence: while BTC stalls at $80K, ETH prints 72.6% taker buys. Rotation to Ethereum or a top signal?
The map:
🔻 Support: $76.0K (short-term 20-day SMA), and the $74.5K–$75K area converges as a demand wall.
🔺 Resistance: $79.9K–$80K, the last gateway before all-time highs.
Today’s CPI (8:30 ET) and the Fed meeting (Sept 15–16) determine whether this institutional push breaks $80K or if price cools off again. ETFs are buying, but the board is full—something has to give.
Does $80K break on CPI, or do we return to the support zone? I’m listening 👇
#BTC $BTC #BinanceSquare #BitcoinETFs #CPI
Data: Binance Futures API. Not financial advice. DYOR.

14
·
--
🟡 $BNB rejected from $770 and longs pile up: 72% of the board bets against the market.
📉 Price at $712 (−1.3% in 24h), after correcting −5% from the high. Daily range: $703 – $726.
What makes your skin crawl:
⚔️ Crowd: 72.6% long. Top traders: 71.4% long. The whole board is bought — so who’s left to keep buying?
📊 OI steady at $433M, no new growth — leverage isn’t entering, but the one that’s already there isn’t leaving.
🌡️ Funding: 0.00%. Neither longs nor shorts pay. The market is stalled, with no fuel for a squeeze in any direction.
🔴 Taker ratio below 1: aggressive sellers dominate. Someone is distributing while the crowd buys.
The map:
🔻 Key support: $712 (SMA-20), below $704 → $689.
🔺 Resistance at $745, and above $763 → $772 (prior rejection zone).
If $712 breaks, a chained liquidation could be fast. For the rally to continue, we need $745 with volume and a rotation of the taker ratio toward buys.
Are the longs overcrowded or is there quiet institutional accumulation? I’m listening 👇
Follow me for the next episode of Whale Flow.
#BNB $BNB #Binance #Crypto
DYOR. Data: Binance Futures API.
{future}(BNBUSDT)
🟡 $BNB rejected from $770 and longs pile up: 72% of the board bets against the market.
📉 Price at $712 (−1.3% in 24h), after correcting −5% from the high. Daily range: $703 – $726.
What makes your skin crawl:
⚔️ Crowd: 72.6% long. Top traders: 71.4% long. The whole board is bought — so who’s left to keep buying?
📊 OI steady at $433M, no new growth — leverage isn’t entering, but the one that’s already there isn’t leaving.
🌡️ Funding: 0.00%. Neither longs nor shorts pay. The market is stalled, with no fuel for a squeeze in any direction.
🔴 Taker ratio below 1: aggressive sellers dominate. Someone is distributing while the crowd buys.
The map:
🔻 Key support: $712 (SMA-20), below $704 → $689.
🔺 Resistance at $745, and above $763 → $772 (prior rejection zone).
If $712 breaks, a chained liquidation could be fast. For the rally to continue, we need $745 with volume and a rotation of the taker ratio toward buys.
Are the longs overcrowded or is there quiet institutional accumulation? I’m listening 👇
Follow me for the next episode of Whale Flow.
#BNB $BNB #Binance #Crypto
DYOR. Data: Binance Futures API.
📉 Price at $712 (−1.3% in 24h), after correcting −5% from the high. Daily range: $703 – $726.
What makes your skin crawl:
⚔️ Crowd: 72.6% long. Top traders: 71.4% long. The whole board is bought — so who’s left to keep buying?
📊 OI steady at $433M, no new growth — leverage isn’t entering, but the one that’s already there isn’t leaving.
🌡️ Funding: 0.00%. Neither longs nor shorts pay. The market is stalled, with no fuel for a squeeze in any direction.
🔴 Taker ratio below 1: aggressive sellers dominate. Someone is distributing while the crowd buys.
The map:
🔻 Key support: $712 (SMA-20), below $704 → $689.
🔺 Resistance at $745, and above $763 → $772 (prior rejection zone).
If $712 breaks, a chained liquidation could be fast. For the rally to continue, we need $745 with volume and a rotation of the taker ratio toward buys.
Are the longs overcrowded or is there quiet institutional accumulation? I’m listening 👇
Follow me for the next episode of Whale Flow.
#BNB $BNB #Binance #Crypto
DYOR. Data: Binance Futures API.

3
·
--
$ZEC On 9/9 I marked $1.250 as resistance. The 18 1h candles that came after: NONE closed above that level. The highest close was $1.247 — $2.86 short. The wick high was $1.256, just 0.5% higher.
It wasn’t luck. It was reading where the leveraged money is.
Afterward, the full map played out: $1.220 gave way, and during the crash hour the volume was 4.6x the prior average while Open Interest was losing $29M. Price went to $1.154 (-5.3%), right where the cluster analysis concentrated liquidatable longs.
The key: I didn’t predict the direction. I identified the leverage, the walls, and which side of the market was saturated. When you know where the fuel is, the move stops surprising you.
This is "Whale Flow": hard data from Binance Futures, no smoke—levels published before the market touched them.
If you want to read the market with data instead of opinions, follow me. The next one is already being built.
NFA/DYOR · Data: Binance Futures API
$ZEC
{future}(ZECUSDT)
$ZEC On 9/9 I marked $1.250 as resistance. The 18 1h candles that came after: NONE closed above that level. The highest close was $1.247 — $2.86 short. The wick high was $1.256, just 0.5% higher.
It wasn’t luck. It was reading where the leveraged money is.
Afterward, the full map played out: $1.220 gave way, and during the crash hour the volume was 4.6x the prior average while Open Interest was losing $29M. Price went to $1.154 (-5.3%), right where the cluster analysis concentrated liquidatable longs.
The key: I didn’t predict the direction. I identified the leverage, the walls, and which side of the market was saturated. When you know where the fuel is, the move stops surprising you.
This is "Whale Flow": hard data from Binance Futures, no smoke—levels published before the market touched them.
If you want to read the market with data instead of opinions, follow me. The next one is already being built.
NFA/DYOR · Data: Binance Futures API
$ZEC
It wasn’t luck. It was reading where the leveraged money is.
Afterward, the full map played out: $1.220 gave way, and during the crash hour the volume was 4.6x the prior average while Open Interest was losing $29M. Price went to $1.154 (-5.3%), right where the cluster analysis concentrated liquidatable longs.
The key: I didn’t predict the direction. I identified the leverage, the walls, and which side of the market was saturated. When you know where the fuel is, the move stops surprising you.
This is "Whale Flow": hard data from Binance Futures, no smoke—levels published before the market touched them.
If you want to read the market with data instead of opinions, follow me. The next one is already being built.
NFA/DYOR · Data: Binance Futures API
$ZEC

2
4
1.8k
Log in to explore more content
Join global crypto users on Binance Square
⚡️ Get latest and useful information about crypto.
💬 Trusted by the world’s largest crypto exchange.
👍 Discover real insights from verified creators.
Email / Phone number
Trending Topics
AIStocksWhatNext
743,961 views
5,689 Discussing
Share & Win Traffic Reward in our Trending Hashtag Campaign
✨Topic: What Other Investment Opportunities Remain as AI Stocks Keep Rising?
👉How to Join:
Publish a short post or article with hashtag #AIStocksWhatNext
Share whether you’re bullish or bearish, and post your AI stock holdings or trade — using the trade widget may improve your eligibility.
You can also strengthen your post by sharing data or charts, and avoiding AI-generated images.
✍️Create content based on the below angles:
- Nvidia says chip sales will double next year, and top AI companies keep hitting record revenue, the compute spend behind it is just as staggering. Is AI demand really taking off? And how long can it last? AI stocks are up across the board. Is this a real breakout, or just a short-term bounce?
- Industry leaders are calling to slow down AI development, while Trump plans to build an “AI Force”, claiming AI could account for 25% of U.S. GDP in the future. Whose side are you on? Will state-level backing be a long-term win for AI stocks?
- Are you buying AI stocks? Share your AI-related trade/holdings with our trade sharing widget.
⏰Campaign Period:
- 2026-09-22 7:00 - 2026-09-24 4:00 UTC
🎁Reward:
- Qualified posts that comply with the above guidelines and contain more than 100 words will be reviewed and may receive a random traffic boost of 500 to 3,000 views. You will receive a notification from your feed secretary if your post is selected.
- Get a chance to have your article featured on Binance Square Official
Need ideas for your post? Visit the topic page #AIStocksWhatNext or the Square Guide on How to Post for Better Reach.
Binance Square Official
·545 Likes
·1.5M views
BitcoinRejectedAt$87,300Twice
0 views
0 Discussing
BCHJumps28%OnCMEFuturesListing
148 views
103 Discussing