
Haris Chhipa
152 Posts

Haris Chhipa
Report
Block User
Open Trade
Occasional Trader
5.7 Years
19 Following
23 Followers
79 Liked
Posts
Portfolio
·
--
🚀 SOLANA (SOL) IS SHOWING SIGNS OF A BULLISH RECOVERY! 📈
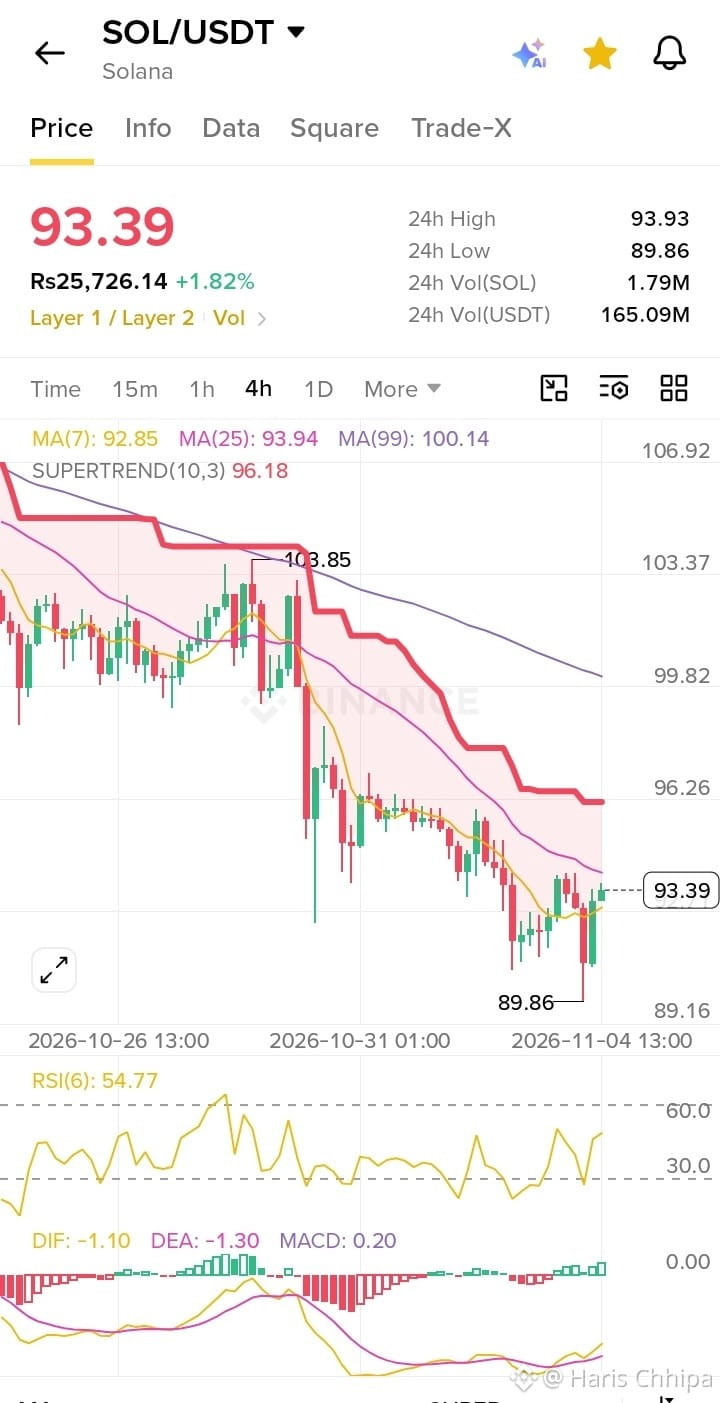
Solana is currently trading around $93.39, up 1.82% in the last 24 hours.
After dropping to $89.86, SOL is showing renewed buying momentum. Technical indicators are giving some encouraging signals:
📊 What the Chart Says:
- RSI (54.77): Buyers are gaining strength.
- MACD: Bullish momentum is developing.
- MA(7): Price is trading above short-term support.
- Supertrend: Still bearish at $96.18.
🎯 My Next 24-Hour Prediction:
- Bullish Target 1: $95.00
- Bullish Target 2: $96.18
- Major Resistance: $100.14
- Support: $92.85
- Critical Support: $89.86
🔥 My Strategy: A confirmed breakout above $93.94 could open the door for further upside. However, losing $92.85 could bring selling pressure back.
⚠️ The bigger trend is still bearish until SOL breaks above its key resistance levels.
What's your prediction?
🚀 $100 coming soon, or will SOL revisit $90 first? Drop your prediction in the comments! 👇
#SOL #Solana #SOLUSDT #Crypto #Binance #CryptoTrading #TechnicalAnalysis #MACD #BullishRecovery #Altcoins $SOL
🚀 SOLANA (SOL) IS SHOWING SIGNS OF A BULLISH RECOVERY! 📈
Solana is currently trading around $93.39, up 1.82% in the last 24 hours.
After dropping to $89.86, SOL is showing renewed buying momentum. Technical indicators are giving some encouraging signals:
📊 What the Chart Says:
- RSI (54.77): Buyers are gaining strength.
- MACD: Bullish momentum is developing.
- MA(7): Price is trading above short-term support.
- Supertrend: Still bearish at $96.18.
🎯 My Next 24-Hour Prediction:
- Bullish Target 1: $95.00
- Bullish Target 2: $96.18
- Major Resistance: $100.14
- Support: $92.85
- Critical Support: $89.86
🔥 My Strategy: A confirmed breakout above $93.94 could open the door for further upside. However, losing $92.85 could bring selling pressure back.
⚠️ The bigger trend is still bearish until SOL breaks above its key resistance levels.
What's your prediction?
🚀 $100 coming soon, or will SOL revisit $90 first? Drop your prediction in the comments! 👇
#SOL #Solana #SOLUSDT #Crypto #Binance #CryptoTrading #TechnicalAnalysis #MACD #BullishRecovery #Altcoins $SOL
Solana is currently trading around $93.39, up 1.82% in the last 24 hours.
After dropping to $89.86, SOL is showing renewed buying momentum. Technical indicators are giving some encouraging signals:
📊 What the Chart Says:
- RSI (54.77): Buyers are gaining strength.
- MACD: Bullish momentum is developing.
- MA(7): Price is trading above short-term support.
- Supertrend: Still bearish at $96.18.
🎯 My Next 24-Hour Prediction:
- Bullish Target 1: $95.00
- Bullish Target 2: $96.18
- Major Resistance: $100.14
- Support: $92.85
- Critical Support: $89.86
🔥 My Strategy: A confirmed breakout above $93.94 could open the door for further upside. However, losing $92.85 could bring selling pressure back.
⚠️ The bigger trend is still bearish until SOL breaks above its key resistance levels.
What's your prediction?
🚀 $100 coming soon, or will SOL revisit $90 first? Drop your prediction in the comments! 👇
#SOL #Solana #SOLUSDT #Crypto #Binance #CryptoTrading #TechnicalAnalysis #MACD #BullishRecovery #Altcoins $SOL
49
·
--
#USOctoberNFP-AreRateCutsStillPossible 🇺🇸 US October NFP: Are Federal Reserve Rate Cuts Still Possible?
The US labor market is becoming one of the biggest drivers of global financial markets. Investors are now watching October Nonfarm Payrolls (NFP) closely to understand the Federal Reserve's next move.
📊 Latest Economic Picture:
September NFP: Only +29K jobs.
Unemployment Rate: 4.2%.
Average Hourly Earnings: +0.1% monthly.
October NFP report is scheduled for November 6, 2026.
🔥 What Could Happen Next?
🟢 Scenario 1 – Weak NFP: If job growth disappoints and unemployment rises, expectations of future Fed rate cuts could increase. This may support Bitcoin, Ethereum, and Gold.
🔴 Scenario 2 – Strong NFP: Stronger employment data could strengthen the US Dollar and Treasury yields, putting pressure on BTC, altcoins, and Gold.
⚠️ My Market Outlook: Rate cuts are still possible, but they are not guaranteed. Recent labor-market resilience and inflation risks make the Fed's next decision complicated.
🎯 My Prediction: Expect volatility around the NFP release. Watch BTC support and resistance levels before entering any trade. Avoid emotional trading and wait for confirmation.
💬 YOUR TURN!
What do you expect? 1️⃣ Fed Rate Cuts – Bullish for Crypto 🚀 2️⃣ No Rate Cuts – Bearish for Crypto 📉 3️⃣ Unexpected NFP Surprise – Massive Volatility ⚡
Share your prediction below!
#USNFP #NonFarmPayrolls #FederalReserve #RateCuts #Bitcoin #BTC #Ethereum #CryptoMarket #Gold #USD #Binance #MarketAnalysis #TradingSignals
#USOctoberNFP-AreRateCutsStillPossible 🇺🇸 US October NFP: Are Federal Reserve Rate Cuts Still Possible?
The US labor market is becoming one of the biggest drivers of global financial markets. Investors are now watching October Nonfarm Payrolls (NFP) closely to understand the Federal Reserve's next move.
📊 Latest Economic Picture:
September NFP: Only +29K jobs.
Unemployment Rate: 4.2%.
Average Hourly Earnings: +0.1% monthly.
October NFP report is scheduled for November 6, 2026.
🔥 What Could Happen Next?
🟢 Scenario 1 – Weak NFP: If job growth disappoints and unemployment rises, expectations of future Fed rate cuts could increase. This may support Bitcoin, Ethereum, and Gold.
🔴 Scenario 2 – Strong NFP: Stronger employment data could strengthen the US Dollar and Treasury yields, putting pressure on BTC, altcoins, and Gold.
⚠️ My Market Outlook: Rate cuts are still possible, but they are not guaranteed. Recent labor-market resilience and inflation risks make the Fed's next decision complicated.
🎯 My Prediction: Expect volatility around the NFP release. Watch BTC support and resistance levels before entering any trade. Avoid emotional trading and wait for confirmation.
💬 YOUR TURN!
What do you expect? 1️⃣ Fed Rate Cuts – Bullish for Crypto 🚀 2️⃣ No Rate Cuts – Bearish for Crypto 📉 3️⃣ Unexpected NFP Surprise – Massive Volatility ⚡
Share your prediction below!
#USNFP #NonFarmPayrolls #FederalReserve #RateCuts #Bitcoin #BTC #Ethereum #CryptoMarket #Gold #USD #Binance #MarketAnalysis #TradingSignals
The US labor market is becoming one of the biggest drivers of global financial markets. Investors are now watching October Nonfarm Payrolls (NFP) closely to understand the Federal Reserve's next move.
📊 Latest Economic Picture:
September NFP: Only +29K jobs.
Unemployment Rate: 4.2%.
Average Hourly Earnings: +0.1% monthly.
October NFP report is scheduled for November 6, 2026.
🔥 What Could Happen Next?
🟢 Scenario 1 – Weak NFP: If job growth disappoints and unemployment rises, expectations of future Fed rate cuts could increase. This may support Bitcoin, Ethereum, and Gold.
🔴 Scenario 2 – Strong NFP: Stronger employment data could strengthen the US Dollar and Treasury yields, putting pressure on BTC, altcoins, and Gold.
⚠️ My Market Outlook: Rate cuts are still possible, but they are not guaranteed. Recent labor-market resilience and inflation risks make the Fed's next decision complicated.
🎯 My Prediction: Expect volatility around the NFP release. Watch BTC support and resistance levels before entering any trade. Avoid emotional trading and wait for confirmation.
💬 YOUR TURN!
What do you expect? 1️⃣ Fed Rate Cuts – Bullish for Crypto 🚀 2️⃣ No Rate Cuts – Bearish for Crypto 📉 3️⃣ Unexpected NFP Surprise – Massive Volatility ⚡
Share your prediction below!
#USNFP #NonFarmPayrolls #FederalReserve #RateCuts #Bitcoin #BTC #Ethereum #CryptoMarket #Gold #USD #Binance #MarketAnalysis #TradingSignals
37
·
--
🚀 GOLD JUST EXPLODED! 🔥 IS $4,035 THE NEXT TARGET?
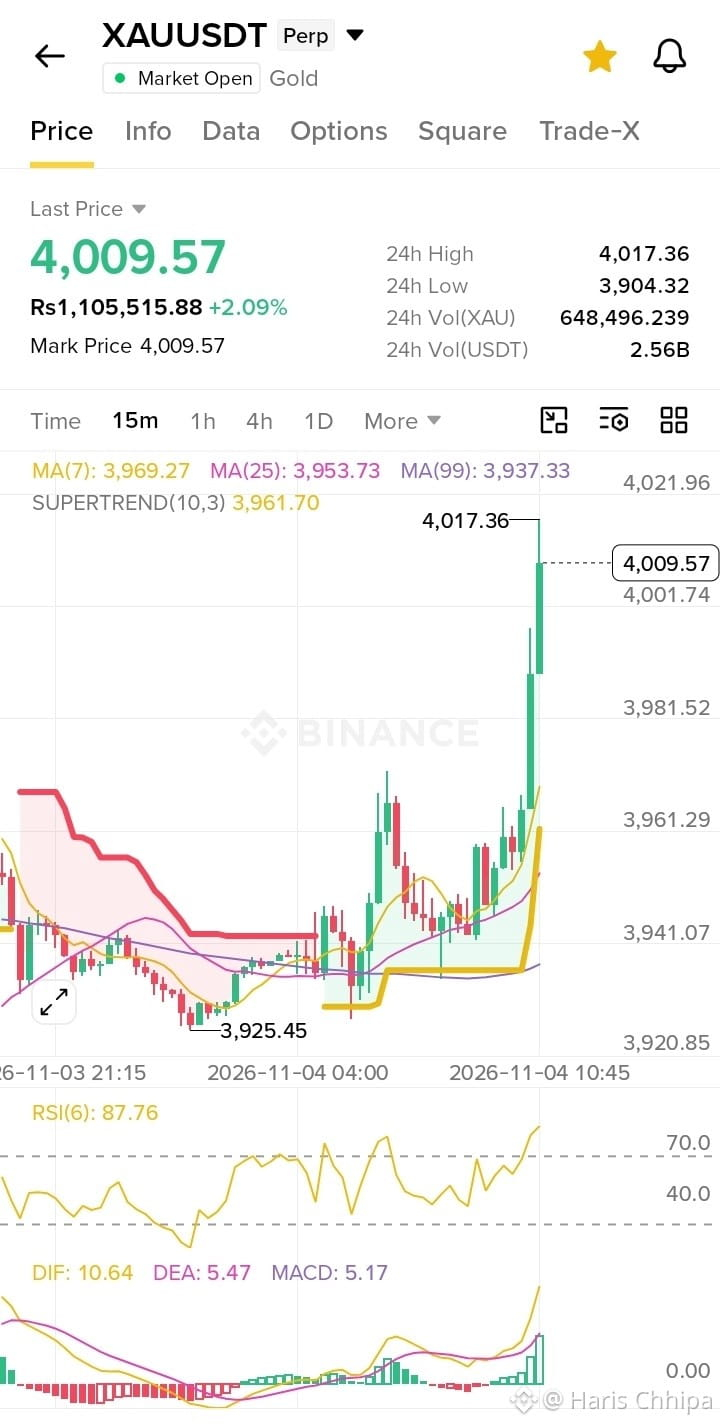
Gold (XAUUSDT) has delivered a powerful bullish breakout on the 15-minute chart!
📊 Why is Gold bullish?
🟢 Supertrend has turned GREEN at $3,961.70.
📈 MACD is strongly bullish:
- DIF: 10.64
- DEA: 5.47
- Histogram: +5.17
🔥 RSI: 87.76 – Extremely strong buying momentum, although a short-term correction is possible.
💪 Gold is trading above MA7, MA25 and MA99, confirming strong short-term bullish momentum.
🎯 MY NEXT 1-HOUR PRICE PREDICTION:
- $4,017 – Immediate resistance
- $4,022 – Next bullish target
- $4,035 – Potential breakout target
⚠️ Important Support Levels:
- $4,001
- $3,981
- $3,969
If Gold breaks above $4,017 and holds, another bullish move could follow.
However, RSI is overbought, so a temporary pullback is also possible.
🔥 WHAT'S YOUR PREDICTION?
Will GOLD reach $4,035 in the next hour, or will sellers take control?
👇 COMMENT YOUR TARGET!
#Gold #XAUUSDT #GoldTrading #GoldPrediction #BullishBreakout #TechnicalAnalysis #MACD #RSI #Supertrend #BinanceSquare #TradingSignals #CryptoAndGold $XAUT
🚀 GOLD JUST EXPLODED! 🔥 IS $4,035 THE NEXT TARGET?
Gold (XAUUSDT) has delivered a powerful bullish breakout on the 15-minute chart!
📊 Why is Gold bullish?
🟢 Supertrend has turned GREEN at $3,961.70.
📈 MACD is strongly bullish:
- DIF: 10.64
- DEA: 5.47
- Histogram: +5.17
🔥 RSI: 87.76 – Extremely strong buying momentum, although a short-term correction is possible.
💪 Gold is trading above MA7, MA25 and MA99, confirming strong short-term bullish momentum.
🎯 MY NEXT 1-HOUR PRICE PREDICTION:
- $4,017 – Immediate resistance
- $4,022 – Next bullish target
- $4,035 – Potential breakout target
⚠️ Important Support Levels:
- $4,001
- $3,981
- $3,969
If Gold breaks above $4,017 and holds, another bullish move could follow.
However, RSI is overbought, so a temporary pullback is also possible.
🔥 WHAT'S YOUR PREDICTION?
Will GOLD reach $4,035 in the next hour, or will sellers take control?
👇 COMMENT YOUR TARGET!
#Gold #XAUUSDT #GoldTrading #GoldPrediction #BullishBreakout #TechnicalAnalysis #MACD #RSI #Supertrend #BinanceSquare #TradingSignals #CryptoAndGold $XAUT
Gold (XAUUSDT) has delivered a powerful bullish breakout on the 15-minute chart!
📊 Why is Gold bullish?
🟢 Supertrend has turned GREEN at $3,961.70.
📈 MACD is strongly bullish:
- DIF: 10.64
- DEA: 5.47
- Histogram: +5.17
🔥 RSI: 87.76 – Extremely strong buying momentum, although a short-term correction is possible.
💪 Gold is trading above MA7, MA25 and MA99, confirming strong short-term bullish momentum.
🎯 MY NEXT 1-HOUR PRICE PREDICTION:
- $4,017 – Immediate resistance
- $4,022 – Next bullish target
- $4,035 – Potential breakout target
⚠️ Important Support Levels:
- $4,001
- $3,981
- $3,969
If Gold breaks above $4,017 and holds, another bullish move could follow.
However, RSI is overbought, so a temporary pullback is also possible.
🔥 WHAT'S YOUR PREDICTION?
Will GOLD reach $4,035 in the next hour, or will sellers take control?
👇 COMMENT YOUR TARGET!
#Gold #XAUUSDT #GoldTrading #GoldPrediction #BullishBreakout #TechnicalAnalysis #MACD #RSI #Supertrend #BinanceSquare #TradingSignals #CryptoAndGold $XAUT
412
·
--
🚀 BITCOIN IS SHOWING BULLISH SIGNS! IS $80,000 NEXT? 🟢
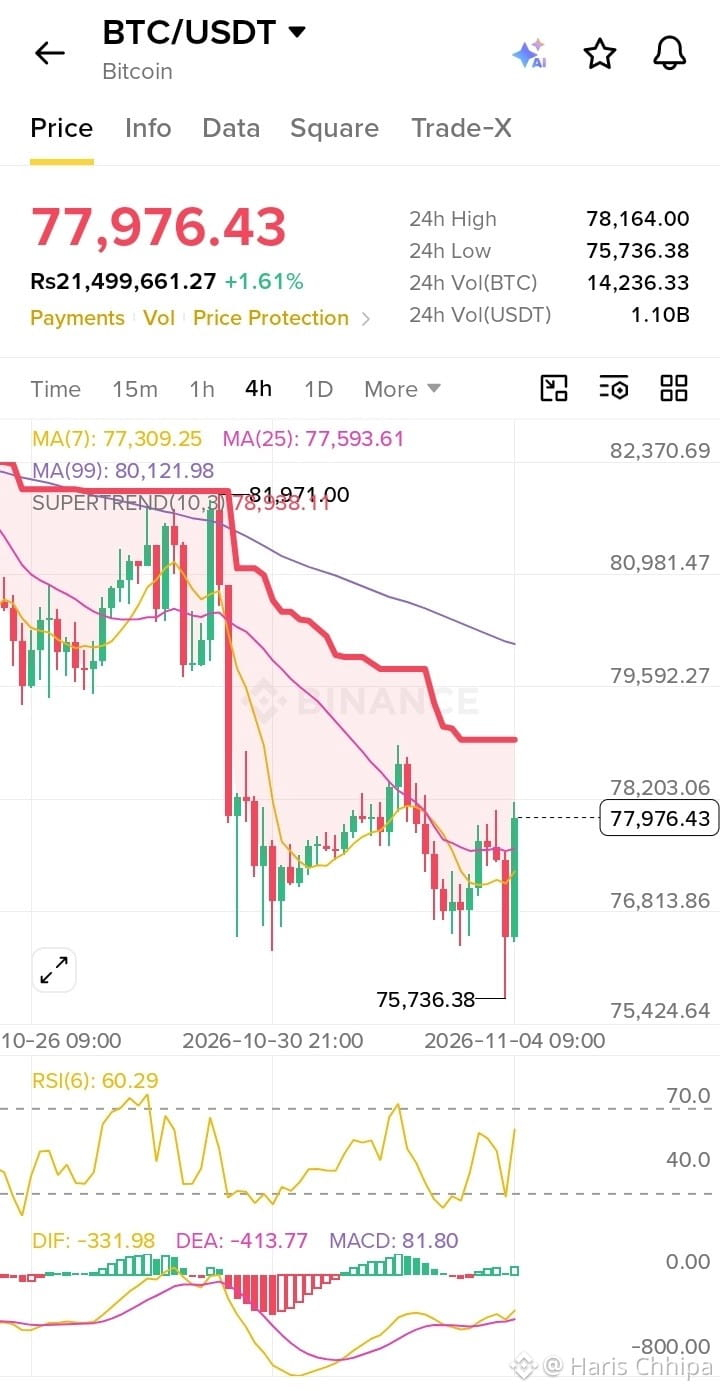
Bitcoin is making an interesting recovery on the 4H chart!
Here's why I'm watching BTC closely:
📈 RSI: 60.29 – Buyers are gaining strength.
📊 MACD: +81.80 Histogram – Bullish momentum is building.
🔥 Moving Averages: BTC is trading above MA7 ($77,309) and MA25 ($77,593).
💪 Strong Bounce: BTC recovered from $75,736 and is approaching the $78,000 resistance zone.
🎯 My BTC Price Targets:
- $78,164 – Immediate resistance
- $78,938 – Next target
- $80,122 – Major resistance
- $82,000 – Potential upside target if bullish momentum continues.
⚠️ Important: BTC needs a strong 4H candle close above $78,164 to confirm further upside. The red Supertrend still signals caution.
🔥 What's your prediction?
Will Bitcoin break $80,000 or reject and return to $76,000?
👇 Share your thoughts in the comments!
#Bitcoin #BTC #BTCUSDT #CryptoMarket #BitcoinPrediction #Bullish #MACD #RSI #BinanceSquare #CryptoTrading #BTCAnalysis #CryptoSignals $BTC
🚀 BITCOIN IS SHOWING BULLISH SIGNS! IS $80,000 NEXT? 🟢
Bitcoin is making an interesting recovery on the 4H chart!
Here's why I'm watching BTC closely:
📈 RSI: 60.29 – Buyers are gaining strength.
📊 MACD: +81.80 Histogram – Bullish momentum is building.
🔥 Moving Averages: BTC is trading above MA7 ($77,309) and MA25 ($77,593).
💪 Strong Bounce: BTC recovered from $75,736 and is approaching the $78,000 resistance zone.
🎯 My BTC Price Targets:
- $78,164 – Immediate resistance
- $78,938 – Next target
- $80,122 – Major resistance
- $82,000 – Potential upside target if bullish momentum continues.
⚠️ Important: BTC needs a strong 4H candle close above $78,164 to confirm further upside. The red Supertrend still signals caution.
🔥 What's your prediction?
Will Bitcoin break $80,000 or reject and return to $76,000?
👇 Share your thoughts in the comments!
#Bitcoin #BTC #BTCUSDT #CryptoMarket #BitcoinPrediction #Bullish #MACD #RSI #BinanceSquare #CryptoTrading #BTCAnalysis #CryptoSignals $BTC
Bitcoin is making an interesting recovery on the 4H chart!
Here's why I'm watching BTC closely:
📈 RSI: 60.29 – Buyers are gaining strength.
📊 MACD: +81.80 Histogram – Bullish momentum is building.
🔥 Moving Averages: BTC is trading above MA7 ($77,309) and MA25 ($77,593).
💪 Strong Bounce: BTC recovered from $75,736 and is approaching the $78,000 resistance zone.
🎯 My BTC Price Targets:
- $78,164 – Immediate resistance
- $78,938 – Next target
- $80,122 – Major resistance
- $82,000 – Potential upside target if bullish momentum continues.
⚠️ Important: BTC needs a strong 4H candle close above $78,164 to confirm further upside. The red Supertrend still signals caution.
🔥 What's your prediction?
Will Bitcoin break $80,000 or reject and return to $76,000?
👇 Share your thoughts in the comments!
#Bitcoin #BTC #BTCUSDT #CryptoMarket #BitcoinPrediction #Bullish #MACD #RSI #BinanceSquare #CryptoTrading #BTCAnalysis #CryptoSignals $BTC
76
·
--
$XAUT 🚀 GOLD (XAUUSDT): Is $4,000 the Next Target? 🔥
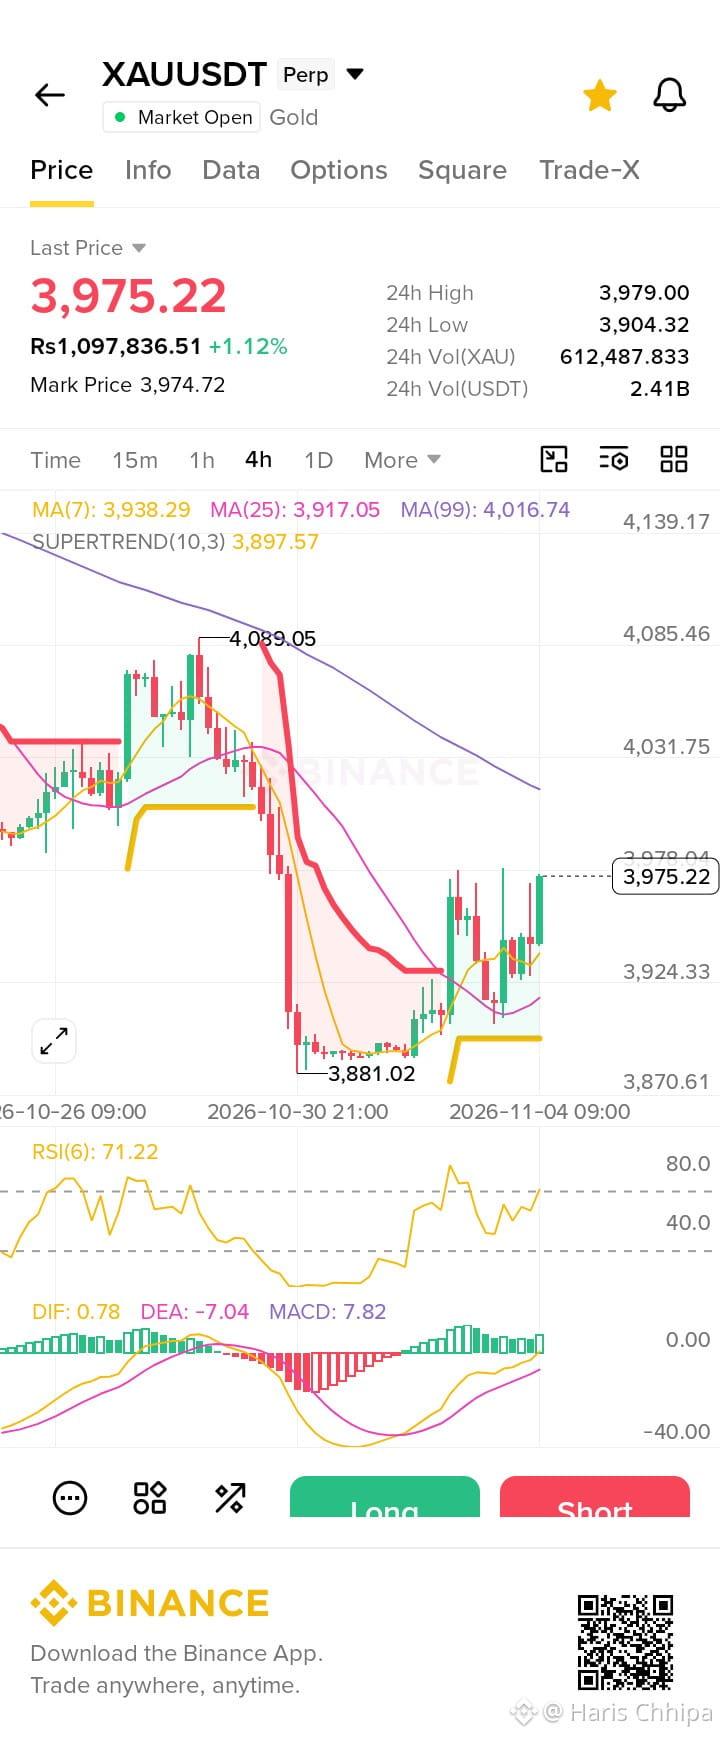
Gold is showing impressive bullish recovery on the 4H chart after bouncing from the $3,881 support zone.
📊 Technical Highlights:
🟢 Current Price: $3,975.22
🟢 MA 7: $3,938.29
🟢 MA 25: $3,917.05
🟢 MACD: Bullish momentum
🟢 Supertrend: Bullish at $3,897.57
⚠️ RSI: 71.22 – Overbought territory
🎯 My Next 24-Hour Prediction:
Bullish targets:
- $3,985
- $4,000
- $4,016–$4,031
Important support:
- $3,950
- $3,924
- $3,897
🔥 My View: Gold has a bullish short-term structure, but RSI suggests buyers should be careful. A confirmed breakout above $3,985 could open the door towards $4,000 and beyond.
💬 What do you think?
Will GOLD break $4,000 in the next 24 hours, or will sellers push it back below $3,950?
👇 Share your prediction!
#GOLD #XAUUSDT #GoldTrading #Binance #TechnicalAnalysis #MACD $XAUT #Supertrend #CryptoTrading #TradingSignals #GoldPrediction
$XAUT 🚀 GOLD (XAUUSDT): Is $4,000 the Next Target? 🔥
Gold is showing impressive bullish recovery on the 4H chart after bouncing from the $3,881 support zone.
📊 Technical Highlights:
🟢 Current Price: $3,975.22
🟢 MA 7: $3,938.29
🟢 MA 25: $3,917.05
🟢 MACD: Bullish momentum
🟢 Supertrend: Bullish at $3,897.57
⚠️ RSI: 71.22 – Overbought territory
🎯 My Next 24-Hour Prediction:
Bullish targets:
- $3,985
- $4,000
- $4,016–$4,031
Important support:
- $3,950
- $3,924
- $3,897
🔥 My View: Gold has a bullish short-term structure, but RSI suggests buyers should be careful. A confirmed breakout above $3,985 could open the door towards $4,000 and beyond.
💬 What do you think?
Will GOLD break $4,000 in the next 24 hours, or will sellers push it back below $3,950?
👇 Share your prediction!
#GOLD #XAUUSDT #GoldTrading #Binance #TechnicalAnalysis #MACD $XAUT #Supertrend #CryptoTrading #TradingSignals #GoldPrediction
Gold is showing impressive bullish recovery on the 4H chart after bouncing from the $3,881 support zone.
📊 Technical Highlights:
🟢 Current Price: $3,975.22
🟢 MA 7: $3,938.29
🟢 MA 25: $3,917.05
🟢 MACD: Bullish momentum
🟢 Supertrend: Bullish at $3,897.57
⚠️ RSI: 71.22 – Overbought territory
🎯 My Next 24-Hour Prediction:
Bullish targets:
- $3,985
- $4,000
- $4,016–$4,031
Important support:
- $3,950
- $3,924
- $3,897
🔥 My View: Gold has a bullish short-term structure, but RSI suggests buyers should be careful. A confirmed breakout above $3,985 could open the door towards $4,000 and beyond.
💬 What do you think?
Will GOLD break $4,000 in the next 24 hours, or will sellers push it back below $3,950?
👇 Share your prediction!
#GOLD #XAUUSDT #GoldTrading #Binance #TechnicalAnalysis #MACD $XAUT #Supertrend #CryptoTrading #TradingSignals #GoldPrediction
435

·
--
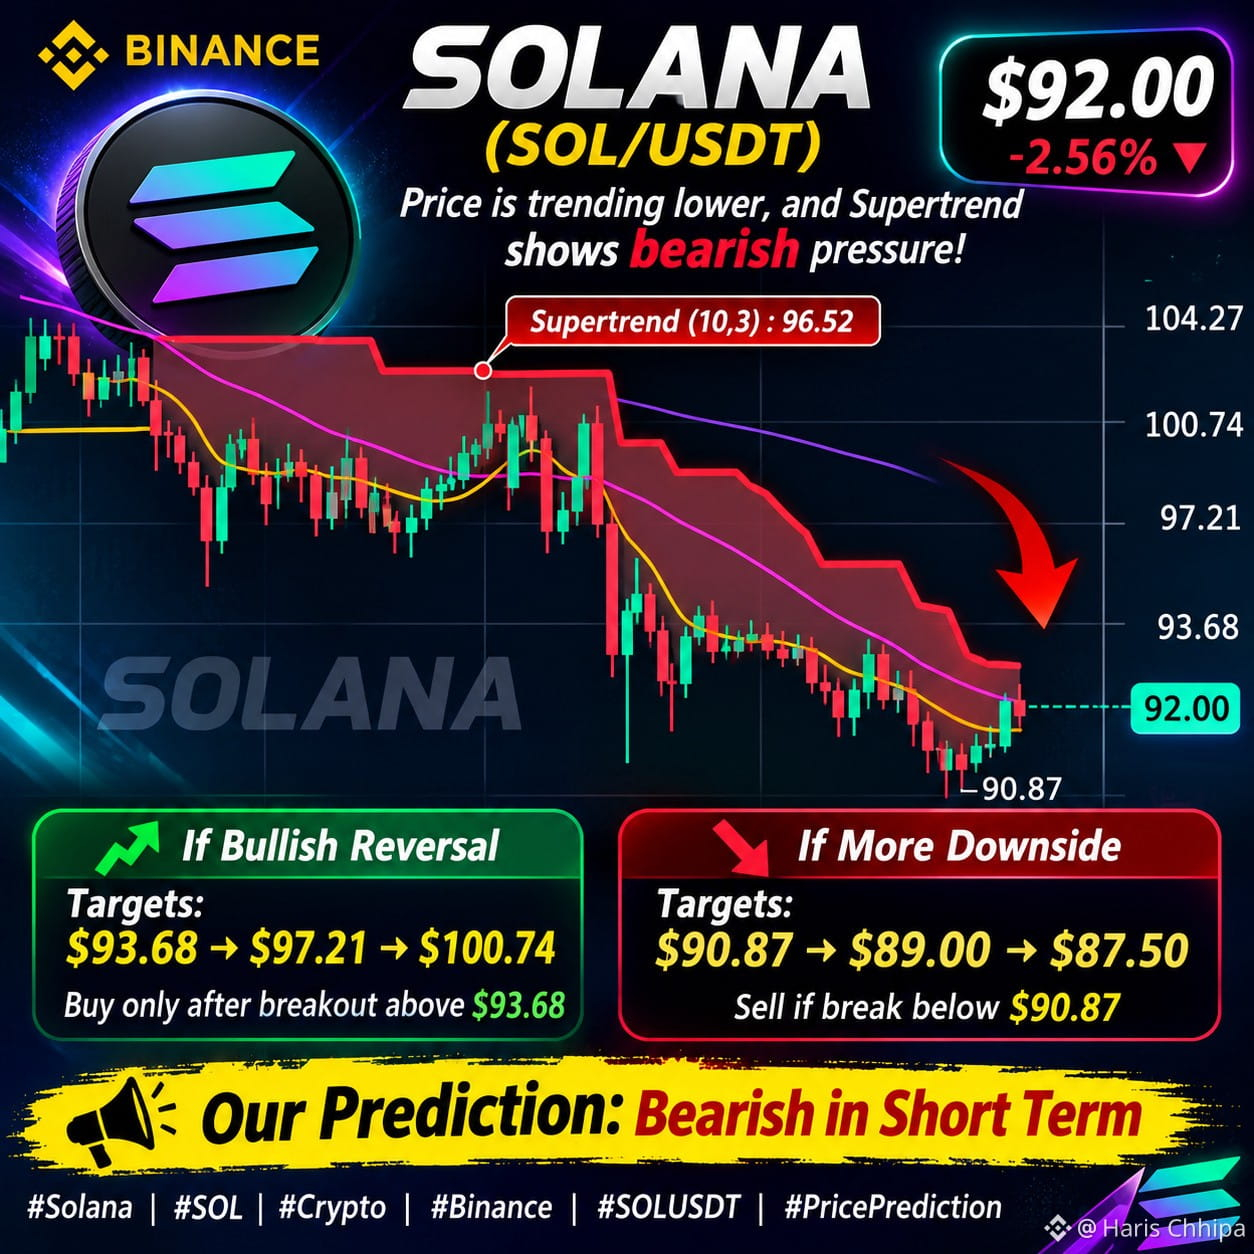
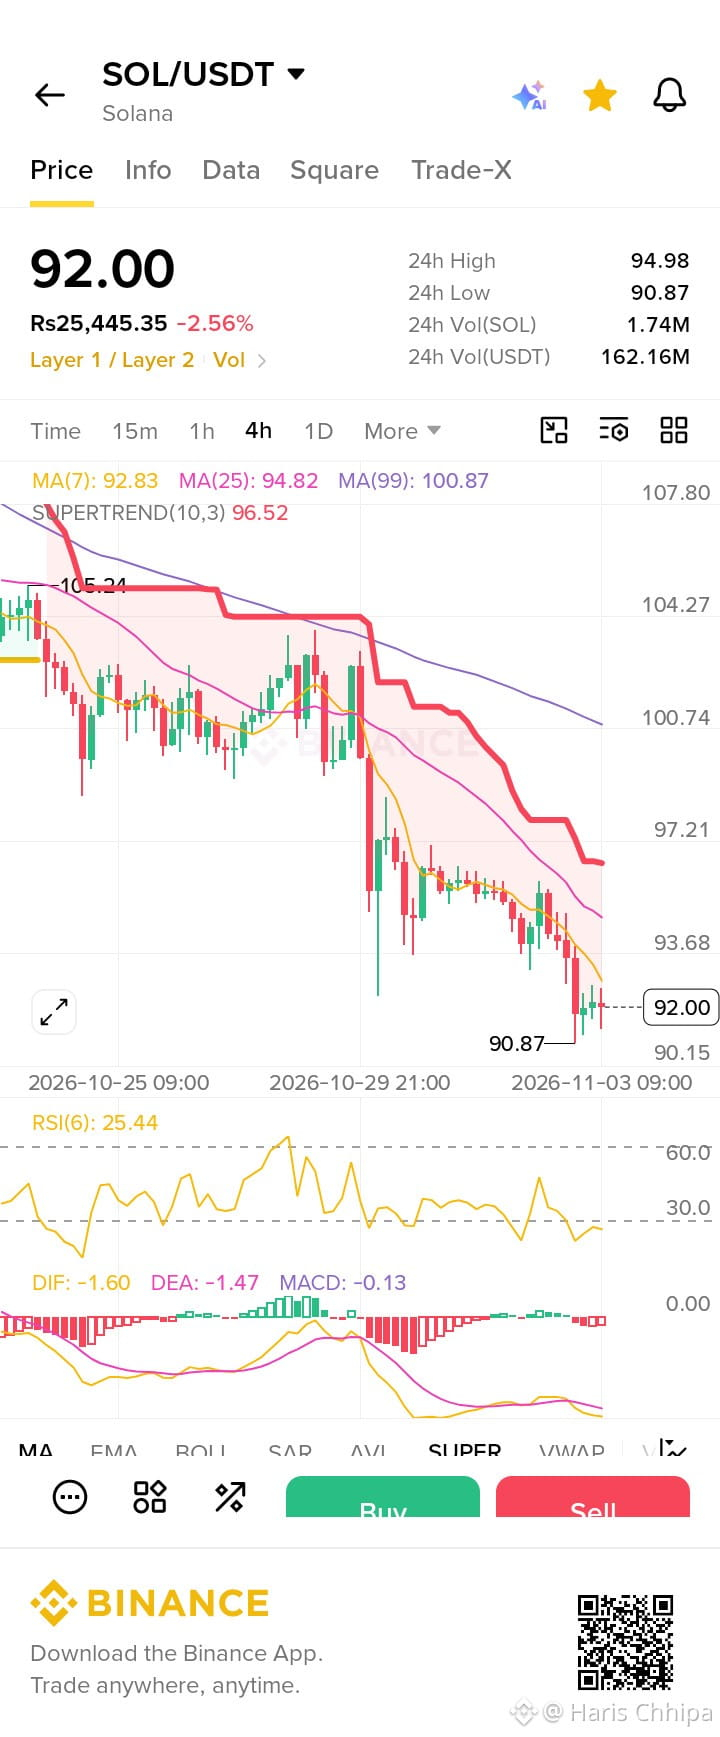
🚨 SOLANA (SOL) PRICE ALERT! 📉 Is SOL Preparing for Another Drop or a Powerful Reversal?
Solana is currently trading around $92.00, down approximately 2.56%.
Looking at the 4H chart, SOL is showing bearish pressure:
🔴 Supertrend: $96.52 – bearish signal
📉 MA(7): $92.83
📉 MA(25): $94.82
📉 MA(99): $100.87
⚠️ RSI(6): 25.44 – oversold territory
🎯 Key Price Levels:
🔻 Support: $90.87
🔻 If support breaks: $89 – $87.50
🚀 Bullish recovery targets:
- $93.68
- $97.21
- $100.74
My Prediction: SOL remains bearish in the short term. However, an oversold RSI could trigger a temporary bounce. A confirmed breakout above $93.68 would be the first positive sign.
🔥 What do you think?
Will SOL drop below $90 or recover towards $100?
👇 Comment your prediction: BUY 🟢 or SELL 🔴?
#Solana #SOL #SOLUSDT #Binance #Crypto #CryptoTrading #Altcoins #PricePrediction #TechnicalAnalysis #Supertrend #Bitcoin #CryptoMarket $SOL
🚨 SOLANA (SOL) PRICE ALERT! 📉 Is SOL Preparing for Another Drop or a Powerful Reversal?
Solana is currently trading around $92.00, down approximately 2.56%.
Looking at the 4H chart, SOL is showing bearish pressure:
🔴 Supertrend: $96.52 – bearish signal
📉 MA(7): $92.83
📉 MA(25): $94.82
📉 MA(99): $100.87
⚠️ RSI(6): 25.44 – oversold territory
🎯 Key Price Levels:
🔻 Support: $90.87
🔻 If support breaks: $89 – $87.50
🚀 Bullish recovery targets:
- $93.68
- $97.21
- $100.74
My Prediction: SOL remains bearish in the short term. However, an oversold RSI could trigger a temporary bounce. A confirmed breakout above $93.68 would be the first positive sign.
🔥 What do you think?
Will SOL drop below $90 or recover towards $100?
👇 Comment your prediction: BUY 🟢 or SELL 🔴?
#Solana #SOL #SOLUSDT #Binance #Crypto #CryptoTrading #Altcoins #PricePrediction #TechnicalAnalysis #Supertrend #Bitcoin #CryptoMarket $SOL
Solana is currently trading around $92.00, down approximately 2.56%.
Looking at the 4H chart, SOL is showing bearish pressure:
🔴 Supertrend: $96.52 – bearish signal
📉 MA(7): $92.83
📉 MA(25): $94.82
📉 MA(99): $100.87
⚠️ RSI(6): 25.44 – oversold territory
🎯 Key Price Levels:
🔻 Support: $90.87
🔻 If support breaks: $89 – $87.50
🚀 Bullish recovery targets:
- $93.68
- $97.21
- $100.74
My Prediction: SOL remains bearish in the short term. However, an oversold RSI could trigger a temporary bounce. A confirmed breakout above $93.68 would be the first positive sign.
🔥 What do you think?
Will SOL drop below $90 or recover towards $100?
👇 Comment your prediction: BUY 🟢 or SELL 🔴?
#Solana #SOL #SOLUSDT #Binance #Crypto #CryptoTrading #Altcoins #PricePrediction #TechnicalAnalysis #Supertrend #Bitcoin #CryptoMarket $SOL
78
·
--
### 🟡 GOLD (XAUUSDT) – Supertrend Prediction
Based on your Binance screenshot, the 4-hour chart is showing a possible bullish recovery, but Gold has not yet confirmed a complete trend reversal.
$3,931.34
Price at the time of your screenshot
### 1\. Supertrend indicator analysis
* Supertrend (10,3): 3,897.57
* Current price: 3,931.34
* Price is above Supertrend.
* This gives a bullish short-term signal.
* Supertrend support is around 3,897–3,900.
If the 4H candle closes above the Supertrend, bullish momentum remains supported.
### 2\. Important technical indicators
| Indicator | Value | Signal |
| --------- | -------- | ---------------- |
| MA(7) | 3,937.42 | Slightly bearish |
| MA(25) | 3,913.71 | Bullish |
| MA(99) | 4,030.33 | Bearish |
| RSI(6) | 51.86 | Neutral |
| MACD | +9.47 | Bullish momentum |
3\. Important price targets
| Level | Price |
| -------------- | ------ |
| Resistance 1 | $3,950 |
| Resistance 2 | $3,977 |
| Resistance 3 | $4,000 |
| Support 1 | $3,913 |
| Support 2 | $3,897 |
| Strong support | $3,870 |
4. Next 6–24 hours prediction
Bullish scenario
If price breaks $3,950
* Target 1: $3,977
* Target 2: $4,000
* Target 3: $4,030
Bearish scenario
If price breaks below $3,913
* Target 1: $3,897
* Target 2: $3,880
* Target 3: $3,870
5. Buy or Sell?
My technical preference:
* BUY: Only after a confirmed 4H breakout above $3,950.
* SELL: If price breaks below $3,913 and confirms weakness.
* Avoid chasing trades around $3,930 without confirmation.
Recent market coverage also highlights volatility around US midterm elections, oil prices and Federal Reserve rate expectations. These factors could influence Gold's next move. Mitrade +1
My final prediction
Bullish recovery, but not a confirmed reversal
Supertrend is supporting buyers, while MA99 remains overhead resistance. I would watch $3,950 very closely.
Risk management: Don't enter with high leverage. Keep a stop-loss and wait for candle confirmation.
$XAUT
### 🟡 GOLD (XAUUSDT) – Supertrend Prediction
Based on your Binance screenshot, the 4-hour chart is showing a possible bullish recovery, but Gold has not yet confirmed a complete trend reversal.
$3,931.34
Price at the time of your screenshot
### 1\. Supertrend indicator analysis
* Supertrend (10,3): 3,897.57
* Current price: 3,931.34
* Price is above Supertrend.
* This gives a bullish short-term signal.
* Supertrend support is around 3,897–3,900.
If the 4H candle closes above the Supertrend, bullish momentum remains supported.
### 2\. Important technical indicators
| Indicator | Value | Signal |
| --------- | -------- | ---------------- |
| MA(7) | 3,937.42 | Slightly bearish |
| MA(25) | 3,913.71 | Bullish |
| MA(99) | 4,030.33 | Bearish |
| RSI(6) | 51.86 | Neutral |
| MACD | +9.47 | Bullish momentum |
3\. Important price targets
| Level | Price |
| -------------- | ------ |
| Resistance 1 | $3,950 |
| Resistance 2 | $3,977 |
| Resistance 3 | $4,000 |
| Support 1 | $3,913 |
| Support 2 | $3,897 |
| Strong support | $3,870 |
4. Next 6–24 hours prediction
Bullish scenario
If price breaks $3,950
* Target 1: $3,977
* Target 2: $4,000
* Target 3: $4,030
Bearish scenario
If price breaks below $3,913
* Target 1: $3,897
* Target 2: $3,880
* Target 3: $3,870
5. Buy or Sell?
My technical preference:
* BUY: Only after a confirmed 4H breakout above $3,950.
* SELL: If price breaks below $3,913 and confirms weakness.
* Avoid chasing trades around $3,930 without confirmation.
Recent market coverage also highlights volatility around US midterm elections, oil prices and Federal Reserve rate expectations. These factors could influence Gold's next move. Mitrade +1
My final prediction
Bullish recovery, but not a confirmed reversal
Supertrend is supporting buyers, while MA99 remains overhead resistance. I would watch $3,950 very closely.
Risk management: Don't enter with high leverage. Keep a stop-loss and wait for candle confirmation.
$XAUT
Based on your Binance screenshot, the 4-hour chart is showing a possible bullish recovery, but Gold has not yet confirmed a complete trend reversal.
$3,931.34
Price at the time of your screenshot
### 1\. Supertrend indicator analysis
* Supertrend (10,3): 3,897.57
* Current price: 3,931.34
* Price is above Supertrend.
* This gives a bullish short-term signal.
* Supertrend support is around 3,897–3,900.
If the 4H candle closes above the Supertrend, bullish momentum remains supported.
### 2\. Important technical indicators
| Indicator | Value | Signal |
| --------- | -------- | ---------------- |
| MA(7) | 3,937.42 | Slightly bearish |
| MA(25) | 3,913.71 | Bullish |
| MA(99) | 4,030.33 | Bearish |
| RSI(6) | 51.86 | Neutral |
| MACD | +9.47 | Bullish momentum |
3\. Important price targets
| Level | Price |
| -------------- | ------ |
| Resistance 1 | $3,950 |
| Resistance 2 | $3,977 |
| Resistance 3 | $4,000 |
| Support 1 | $3,913 |
| Support 2 | $3,897 |
| Strong support | $3,870 |
4. Next 6–24 hours prediction
Bullish scenario
If price breaks $3,950
* Target 1: $3,977
* Target 2: $4,000
* Target 3: $4,030
Bearish scenario
If price breaks below $3,913
* Target 1: $3,897
* Target 2: $3,880
* Target 3: $3,870
5. Buy or Sell?
My technical preference:
* BUY: Only after a confirmed 4H breakout above $3,950.
* SELL: If price breaks below $3,913 and confirms weakness.
* Avoid chasing trades around $3,930 without confirmation.
Recent market coverage also highlights volatility around US midterm elections, oil prices and Federal Reserve rate expectations. These factors could influence Gold's next move. Mitrade +1
My final prediction
Bullish recovery, but not a confirmed reversal
Supertrend is supporting buyers, while MA99 remains overhead resistance. I would watch $3,950 very closely.
Risk management: Don't enter with high leverage. Keep a stop-loss and wait for candle confirmation.
$XAUT
185
·
--
147
·
--
143
·
--
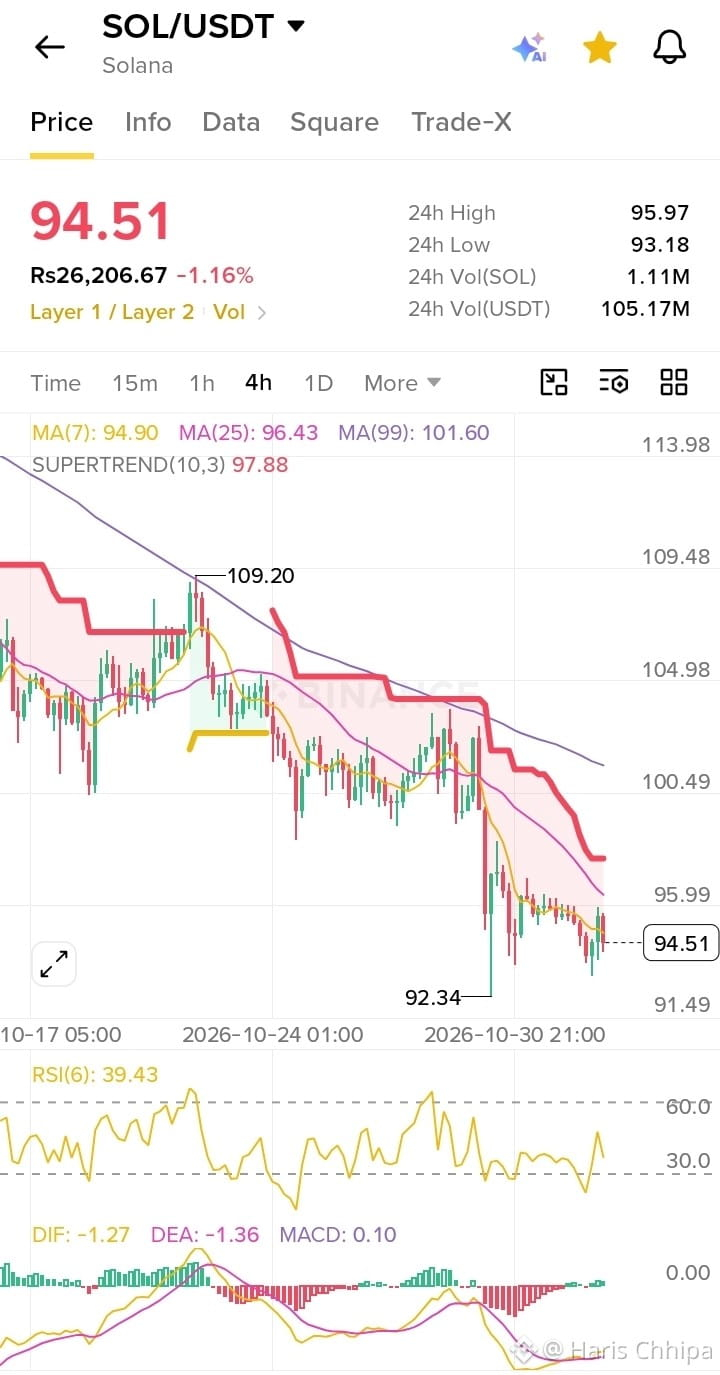
🚀 SOLANA (SOL): IS A BIG RECOVERY COMING? 🔥
Solana is currently facing an important market battle!
While short-term selling pressure and ETF outflows are creating uncertainty, institutional adoption continues to bring positive developments.
📊 Market Watch:
- Current Price: Around $94
- Key Support: $92–$93
- First Resistance: $96–$97
- Next Target: $100–$102 (if bullish momentum returns)
🐂 Bullish Scenario: If SOL breaks above $97 with strong volume, we could see a move toward $100–$102.
🐻 Bearish Scenario: If SOL loses $92, further downside toward $87–$88 becomes possible.
🔥 My Question to the Community:
What do you think?
1️⃣ SOL will recover to $100 soon?
2️⃣ SOL will drop below $90?
3️⃣ Is this a good accumulation opportunity?
👇 Share your prediction in the comments!
#Solana #SOL #Crypto #Binance #BinanceSquare #Altcoins #CryptoTrading #Bitcoin #Bullish #Bearish #CryptoNews #Web3 #DeFi #TradingSignals
🚀 SOLANA (SOL): IS A BIG RECOVERY COMING? 🔥
Solana is currently facing an important market battle!
While short-term selling pressure and ETF outflows are creating uncertainty, institutional adoption continues to bring positive developments.
📊 Market Watch:
- Current Price: Around $94
- Key Support: $92–$93
- First Resistance: $96–$97
- Next Target: $100–$102 (if bullish momentum returns)
🐂 Bullish Scenario: If SOL breaks above $97 with strong volume, we could see a move toward $100–$102.
🐻 Bearish Scenario: If SOL loses $92, further downside toward $87–$88 becomes possible.
🔥 My Question to the Community:
What do you think?
1️⃣ SOL will recover to $100 soon?
2️⃣ SOL will drop below $90?
3️⃣ Is this a good accumulation opportunity?
👇 Share your prediction in the comments!
#Solana #SOL #Crypto #Binance #BinanceSquare #Altcoins #CryptoTrading #Bitcoin #Bullish #Bearish #CryptoNews #Web3 #DeFi #TradingSignals
Solana is currently facing an important market battle!
While short-term selling pressure and ETF outflows are creating uncertainty, institutional adoption continues to bring positive developments.
📊 Market Watch:
- Current Price: Around $94
- Key Support: $92–$93
- First Resistance: $96–$97
- Next Target: $100–$102 (if bullish momentum returns)
🐂 Bullish Scenario: If SOL breaks above $97 with strong volume, we could see a move toward $100–$102.
🐻 Bearish Scenario: If SOL loses $92, further downside toward $87–$88 becomes possible.
🔥 My Question to the Community:
What do you think?
1️⃣ SOL will recover to $100 soon?
2️⃣ SOL will drop below $90?
3️⃣ Is this a good accumulation opportunity?
👇 Share your prediction in the comments!
#Solana #SOL #Crypto #Binance #BinanceSquare #Altcoins #CryptoTrading #Bitcoin #Bullish #Bearish #CryptoNews #Web3 #DeFi #TradingSignals
61
·
--
🚀 **New to Crypto Trading? Start Here.**
Most beginners lose money for one reason: they trade without a plan. Here is a simple 5-step starter plan 👇
1️⃣ **Learn the basics first.** Candlesticks, support and resistance, and trend direction.
2️⃣ **Keep it simple.** Use only 2 or 3 indicators, like EMA, RSI, and Supertrend.
3️⃣ **Practice before real money.** Use the Binance Testnet or demo mode.
4️⃣ **Always use a stop-loss.** Risk only 1 to 2% of your capital per trade.
5️⃣ **Avoid leverage at the start.** Stick to Spot trading until you gain experience.
📌 Pro tip: Use the 1H or 4H timeframe. Very short timeframes give too many fake signals.
Remember, there are no guaranteed profits in trading. Smart risk management beats luck every time. 💡
What's your biggest challenge as a beginner trader? Tell me in the comments 👇
*Not financial advice. Always DYOR.*
#Binance #BinanceSquare #CryptoTrading #CryptoForBeginners #TradingTips #Bitcoin #BNB #RiskManagement #DYOR
🚀 **New to Crypto Trading? Start Here.**
Most beginners lose money for one reason: they trade without a plan. Here is a simple 5-step starter plan 👇
1️⃣ **Learn the basics first.** Candlesticks, support and resistance, and trend direction.
2️⃣ **Keep it simple.** Use only 2 or 3 indicators, like EMA, RSI, and Supertrend.
3️⃣ **Practice before real money.** Use the Binance Testnet or demo mode.
4️⃣ **Always use a stop-loss.** Risk only 1 to 2% of your capital per trade.
5️⃣ **Avoid leverage at the start.** Stick to Spot trading until you gain experience.
📌 Pro tip: Use the 1H or 4H timeframe. Very short timeframes give too many fake signals.
Remember, there are no guaranteed profits in trading. Smart risk management beats luck every time. 💡
What's your biggest challenge as a beginner trader? Tell me in the comments 👇
*Not financial advice. Always DYOR.*
#Binance #BinanceSquare #CryptoTrading #CryptoForBeginners #TradingTips #Bitcoin #BNB #RiskManagement #DYOR
Most beginners lose money for one reason: they trade without a plan. Here is a simple 5-step starter plan 👇
1️⃣ **Learn the basics first.** Candlesticks, support and resistance, and trend direction.
2️⃣ **Keep it simple.** Use only 2 or 3 indicators, like EMA, RSI, and Supertrend.
3️⃣ **Practice before real money.** Use the Binance Testnet or demo mode.
4️⃣ **Always use a stop-loss.** Risk only 1 to 2% of your capital per trade.
5️⃣ **Avoid leverage at the start.** Stick to Spot trading until you gain experience.
📌 Pro tip: Use the 1H or 4H timeframe. Very short timeframes give too many fake signals.
Remember, there are no guaranteed profits in trading. Smart risk management beats luck every time. 💡
What's your biggest challenge as a beginner trader? Tell me in the comments 👇
*Not financial advice. Always DYOR.*
#Binance #BinanceSquare #CryptoTrading #CryptoForBeginners #TradingTips #Bitcoin #BNB #RiskManagement #DYOR
43
·
--
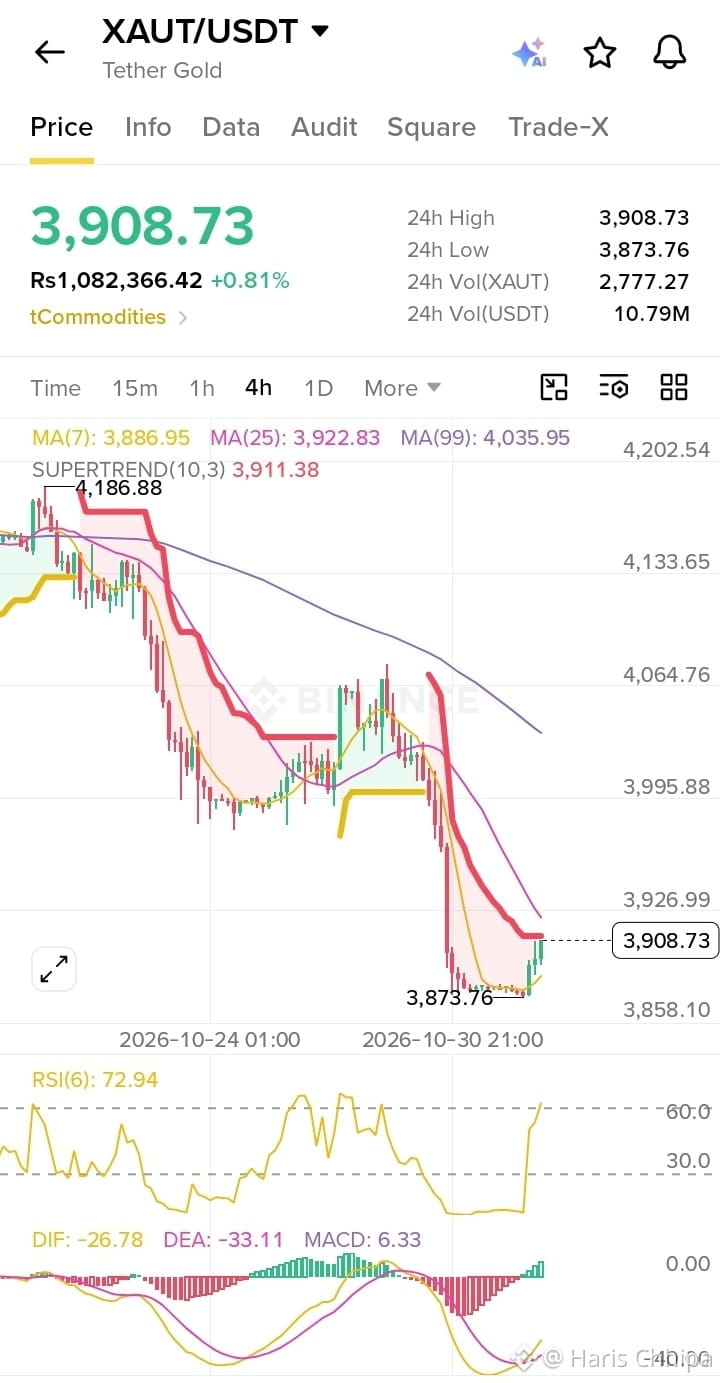
🚨 GOLD (XAUT/USDT) UPDATE: BIG RECOVERY OR ANOTHER SELL-OFF? 📊🔥
Gold is currently trading around $3,908.73, recovering after a sharp decline towards $3,873.76.
Let's analyze the 4H chart!
📈 Bullish Signals:
- MACD histogram has turned positive (+6.33).
- Price has recovered above MA(7).
- Buyers are showing renewed momentum.
⚠️ Bearish Signals:
- Price remains below MA(25) and MA(99).
- Supertrend is still bearish.
- RSI is around 72.94, indicating overbought conditions.
🎯 Key Levels to Watch:
Resistance: $3,923 → $3,995
Support: $3,887 → $3,873 → $3,858
🔥 My Prediction:
If Gold breaks above $3,923 and holds, we could see a bullish recovery towards $3,995.
However, rejection around resistance could trigger another correction towards $3,873.
💬 YOUR TURN!
What do you think happens next?
🟢 BUY – Gold goes towards $3,995?
🔴 SELL – Gold drops towards $3,873?
Or will Gold surprise everyone with another big move?
Share your prediction in the comments! 👇
#XAUT #GOLD #GoldTrading #BinanceSquare #CryptoTrading #TechnicalAnalysis #MACD #RSI #TradingSignals #MarketUpdate $XAUT
🚨 GOLD (XAUT/USDT) UPDATE: BIG RECOVERY OR ANOTHER SELL-OFF? 📊🔥
Gold is currently trading around $3,908.73, recovering after a sharp decline towards $3,873.76.
Let's analyze the 4H chart!
📈 Bullish Signals:
- MACD histogram has turned positive (+6.33).
- Price has recovered above MA(7).
- Buyers are showing renewed momentum.
⚠️ Bearish Signals:
- Price remains below MA(25) and MA(99).
- Supertrend is still bearish.
- RSI is around 72.94, indicating overbought conditions.
🎯 Key Levels to Watch:
Resistance: $3,923 → $3,995
Support: $3,887 → $3,873 → $3,858
🔥 My Prediction:
If Gold breaks above $3,923 and holds, we could see a bullish recovery towards $3,995.
However, rejection around resistance could trigger another correction towards $3,873.
💬 YOUR TURN!
What do you think happens next?
🟢 BUY – Gold goes towards $3,995?
🔴 SELL – Gold drops towards $3,873?
Or will Gold surprise everyone with another big move?
Share your prediction in the comments! 👇
#XAUT #GOLD #GoldTrading #BinanceSquare #CryptoTrading #TechnicalAnalysis #MACD #RSI #TradingSignals #MarketUpdate $XAUT
Gold is currently trading around $3,908.73, recovering after a sharp decline towards $3,873.76.
Let's analyze the 4H chart!
📈 Bullish Signals:
- MACD histogram has turned positive (+6.33).
- Price has recovered above MA(7).
- Buyers are showing renewed momentum.
⚠️ Bearish Signals:
- Price remains below MA(25) and MA(99).
- Supertrend is still bearish.
- RSI is around 72.94, indicating overbought conditions.
🎯 Key Levels to Watch:
Resistance: $3,923 → $3,995
Support: $3,887 → $3,873 → $3,858
🔥 My Prediction:
If Gold breaks above $3,923 and holds, we could see a bullish recovery towards $3,995.
However, rejection around resistance could trigger another correction towards $3,873.
💬 YOUR TURN!
What do you think happens next?
🟢 BUY – Gold goes towards $3,995?
🔴 SELL – Gold drops towards $3,873?
Or will Gold surprise everyone with another big move?
Share your prediction in the comments! 👇
#XAUT #GOLD #GoldTrading #BinanceSquare #CryptoTrading #TechnicalAnalysis #MACD #RSI #TradingSignals #MarketUpdate $XAUT
196
·
--
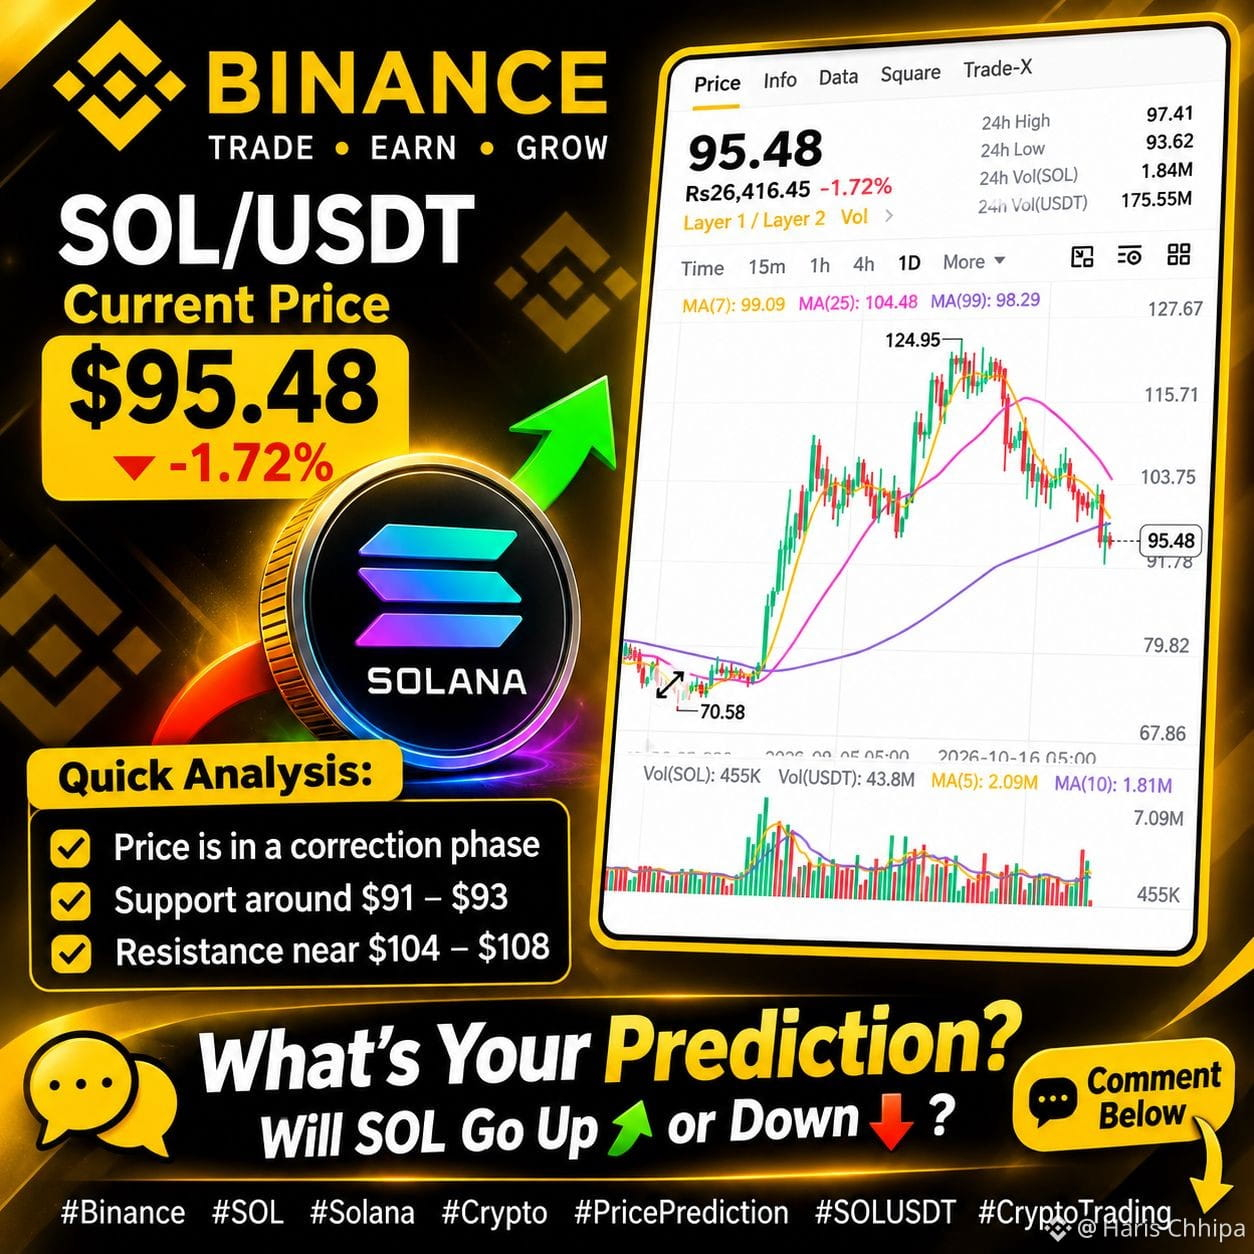
🚨 GOLD (XAUUSDT): BIG SELL-OFF! IS ANOTHER DROP COMING?
Gold is facing serious selling pressure after a sharp market correction.
📊 Technical Analysis:
- Current price: Around $3,893
- RSI(6): 20.49 – Oversold
- MA(7): $3,977
- MA(25): $4,086
- MA(99): $4,266
🔴 Bearish Scenario:
If Gold breaks below $3,881, the next possible targets are:
- $3,850
- $3,820
- $3,800
🟢 Bullish Scenario:
If buyers defend support and Gold reclaims $3,950, we could see a recovery towards $3,977 and potentially $4,000.
⚠️ My Market View:
Short-term trend remains bearish, but oversold RSI increases the possibility of a temporary bounce. Confirmation is essential before entering a trade.
🔥 COMMUNITY QUESTION:
What do you think happens next?
1️⃣ BUY – Gold will recover 📈
2️⃣ SELL – Gold will crash further 📉
3️⃣ WAIT – More confirmation needed
💬 Share your price prediction in the comments!
#Gold #XAUUSDT #GoldTrading #Binance #CryptoTrading #TechnicalAnalysis #RSI #TradingSignals #MarketUpdate #BullishOrBearish
🚨 GOLD (XAUUSDT): BIG SELL-OFF! IS ANOTHER DROP COMING?
Gold is facing serious selling pressure after a sharp market correction.
📊 Technical Analysis:
- Current price: Around $3,893
- RSI(6): 20.49 – Oversold
- MA(7): $3,977
- MA(25): $4,086
- MA(99): $4,266
🔴 Bearish Scenario:
If Gold breaks below $3,881, the next possible targets are:
- $3,850
- $3,820
- $3,800
🟢 Bullish Scenario:
If buyers defend support and Gold reclaims $3,950, we could see a recovery towards $3,977 and potentially $4,000.
⚠️ My Market View:
Short-term trend remains bearish, but oversold RSI increases the possibility of a temporary bounce. Confirmation is essential before entering a trade.
🔥 COMMUNITY QUESTION:
What do you think happens next?
1️⃣ BUY – Gold will recover 📈
2️⃣ SELL – Gold will crash further 📉
3️⃣ WAIT – More confirmation needed
💬 Share your price prediction in the comments!
#Gold #XAUUSDT #GoldTrading #Binance #CryptoTrading #TechnicalAnalysis #RSI #TradingSignals #MarketUpdate #BullishOrBearish
Gold is facing serious selling pressure after a sharp market correction.
📊 Technical Analysis:
- Current price: Around $3,893
- RSI(6): 20.49 – Oversold
- MA(7): $3,977
- MA(25): $4,086
- MA(99): $4,266
🔴 Bearish Scenario:
If Gold breaks below $3,881, the next possible targets are:
- $3,850
- $3,820
- $3,800
🟢 Bullish Scenario:
If buyers defend support and Gold reclaims $3,950, we could see a recovery towards $3,977 and potentially $4,000.
⚠️ My Market View:
Short-term trend remains bearish, but oversold RSI increases the possibility of a temporary bounce. Confirmation is essential before entering a trade.
🔥 COMMUNITY QUESTION:
What do you think happens next?
1️⃣ BUY – Gold will recover 📈
2️⃣ SELL – Gold will crash further 📉
3️⃣ WAIT – More confirmation needed
💬 Share your price prediction in the comments!
#Gold #XAUUSDT #GoldTrading #Binance #CryptoTrading #TechnicalAnalysis #RSI #TradingSignals #MarketUpdate #BullishOrBearish
136
·
--
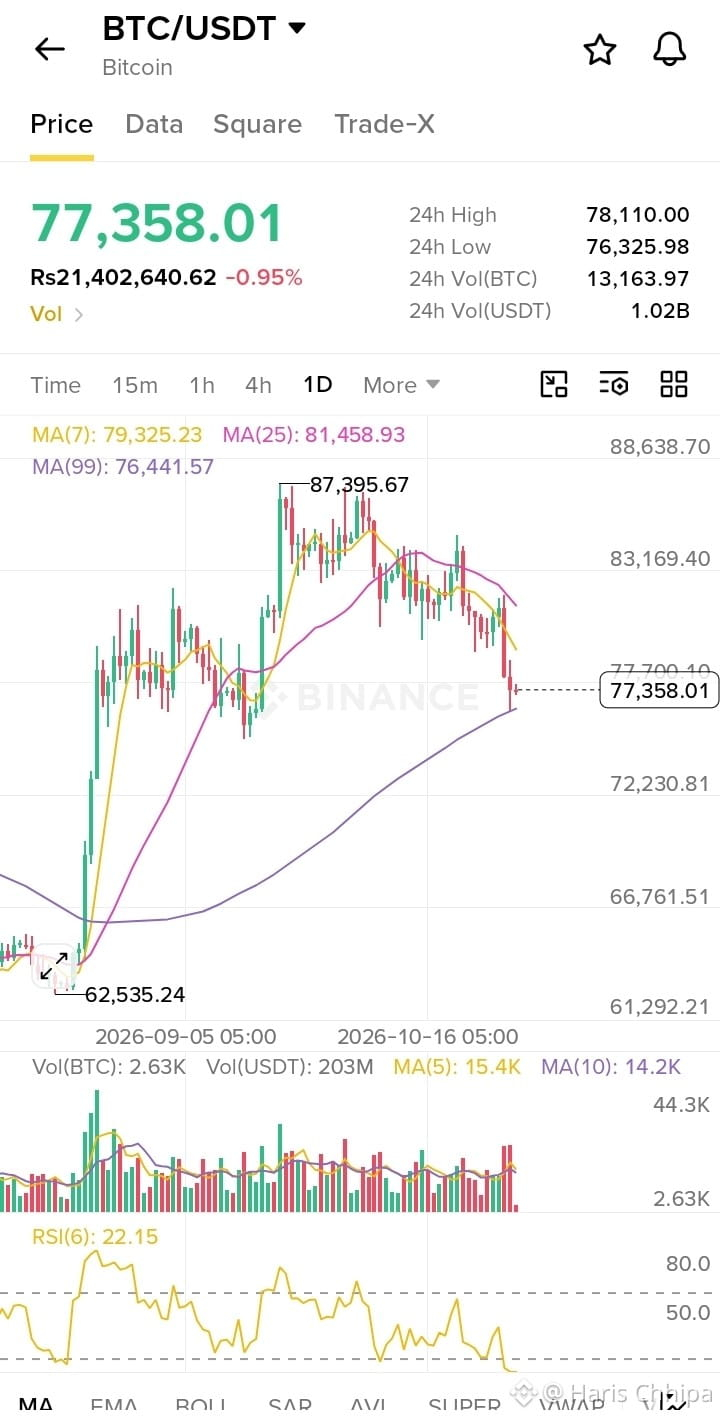
Btc🚨 BREAKING: MASSIVE $6.3 BILLION BINANCE HACK!
The crypto market has been shaken by one of the biggest financial heists in history.
Approximately 18,270 BTC worth $1.4 billion was reportedly stolen from Binance as part of a massive security breach.
Bitcoin dropped toward $76,368 before recovering above $77,000.
What's next for Bitcoin?
🔴 Bearish zone: $74,000–$76,000
🟢 Recovery target: $79,000–$80,000
🔥 Bullish confirmation: Sustained breakout above $80,000.
The coming 24 hours could be extremely important for the crypto market.
Is this a buying opportunity or the beginning of another major correction?
Share your BTC prediction below! 👇
#Bitcoin #BTC #Binance #CryptoNews #BitcoinPrediction #CryptoMarket #BTCUSDT #Blockchain #CryptoTrading
#BTC走势分析 $BTC
Btc🚨 BREAKING: MASSIVE $6.3 BILLION BINANCE HACK!
The crypto market has been shaken by one of the biggest financial heists in history.
Approximately 18,270 BTC worth $1.4 billion was reportedly stolen from Binance as part of a massive security breach.
Bitcoin dropped toward $76,368 before recovering above $77,000.
What's next for Bitcoin?
🔴 Bearish zone: $74,000–$76,000
🟢 Recovery target: $79,000–$80,000
🔥 Bullish confirmation: Sustained breakout above $80,000.
The coming 24 hours could be extremely important for the crypto market.
Is this a buying opportunity or the beginning of another major correction?
Share your BTC prediction below! 👇
#Bitcoin #BTC #Binance #CryptoNews #BitcoinPrediction #CryptoMarket #BTCUSDT #Blockchain #CryptoTrading
#BTC走势分析 $BTC
The crypto market has been shaken by one of the biggest financial heists in history.
Approximately 18,270 BTC worth $1.4 billion was reportedly stolen from Binance as part of a massive security breach.
Bitcoin dropped toward $76,368 before recovering above $77,000.
What's next for Bitcoin?
🔴 Bearish zone: $74,000–$76,000
🟢 Recovery target: $79,000–$80,000
🔥 Bullish confirmation: Sustained breakout above $80,000.
The coming 24 hours could be extremely important for the crypto market.
Is this a buying opportunity or the beginning of another major correction?
Share your BTC prediction below! 👇
#Bitcoin #BTC #Binance #CryptoNews #BitcoinPrediction #CryptoMarket #BTCUSDT #Blockchain #CryptoTrading
#BTC走势分析 $BTC
9
·
--
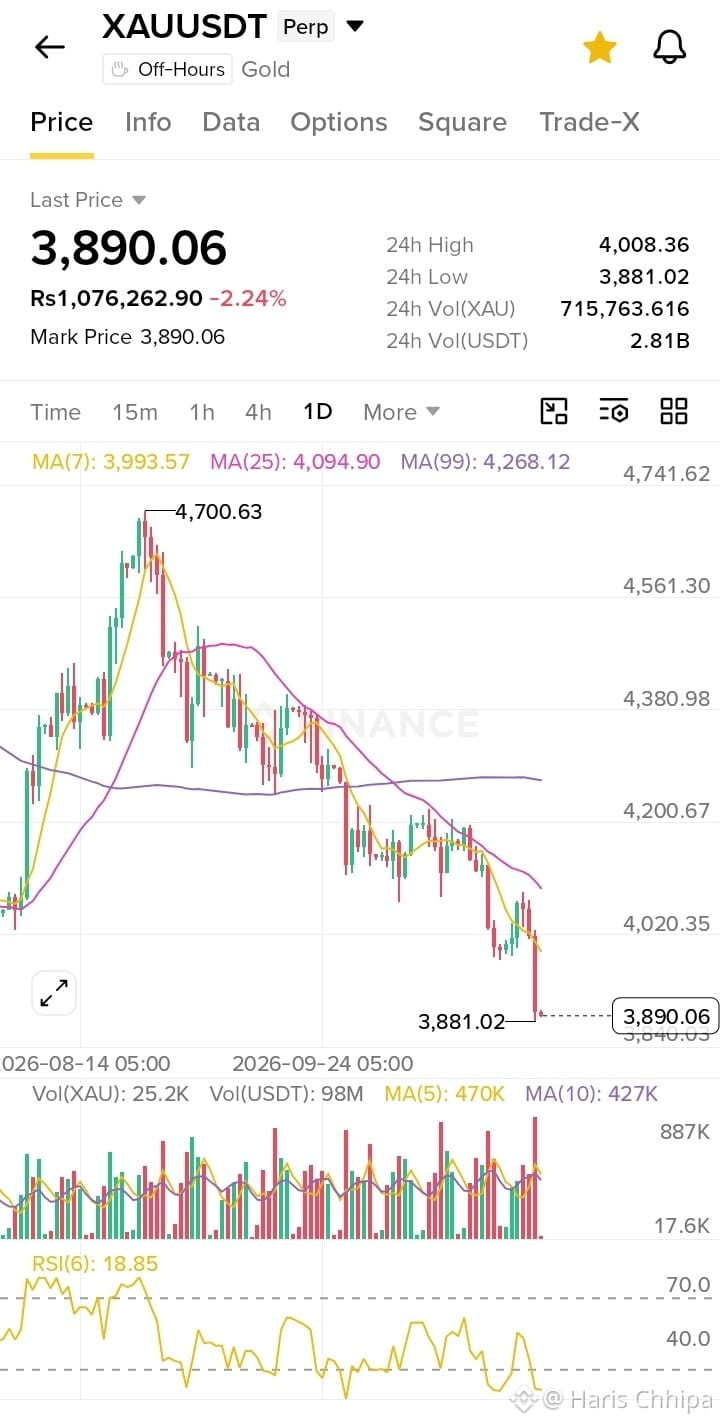
### XAUUSDT Gold – Next 6 Hours Prediction
Based on your latest Binance chart (October 31, 2026), Gold is showing strong selling pressure, but a short-term recovery bounce is possible.
### $3,890.06
-2.24% (24-hour change)
### 1\. Technical Analysis
| Indicator | Current value | Signal |
| --------- | ------------- | -------------- |
| MA(7) | 3,993.57 | Bearish |
| MA(25) | 4,094.90 | Bearish |
| MA(99) | 4,268.12 | Strong bearish |
| RSI(6) | 18.85 | Oversold |
| 24h Low | 3,881.02 | Key support |
What the indicators suggest:
* Price is below all three moving averages.
* RSI at 18.85 indicates extremely oversold conditions.
* Strong selling pressure is visible in the latest candle.
* A temporary bullish bounce could happen if support holds.
### 2\. Next 6-Hour Price Prediction
### $3,920–$3,950
Possible recovery target
Resistance levels
* $3,920
* $3,950
* $3,993
Support levels
* $3,881
* $3,860
* $3,830
My expectation: Bearish to sideways, with a possible short-term relief bounce.
### 3\. Trading Scenarios
Scenario A – Bullish bounce
Conditional
If gold holds above $3,881 and recovers $3,900, it could move towards $3,920–$3,950.
Scenario B – Further downside
Bearish
If gold breaks below $3,881 with strong selling volume, the next targets could be $3,860 and $3,830.
### 4\. Final Prediction
My 6-hour outlook
* Primary bias: Bearish.
* Short-term possibility: Oversold recovery.
* Important level: $3,881.
* Bullish confirmation: Recovery above $3,920.
* Bearish confirmation: Breakdown below $3,881.
#GOLD #XAUUSD $XAUT
### XAUUSDT Gold – Next 6 Hours Prediction
Based on your latest Binance chart (October 31, 2026), Gold is showing strong selling pressure, but a short-term recovery bounce is possible.
### $3,890.06
-2.24% (24-hour change)
### 1\. Technical Analysis
| Indicator | Current value | Signal |
| --------- | ------------- | -------------- |
| MA(7) | 3,993.57 | Bearish |
| MA(25) | 4,094.90 | Bearish |
| MA(99) | 4,268.12 | Strong bearish |
| RSI(6) | 18.85 | Oversold |
| 24h Low | 3,881.02 | Key support |
What the indicators suggest:
* Price is below all three moving averages.
* RSI at 18.85 indicates extremely oversold conditions.
* Strong selling pressure is visible in the latest candle.
* A temporary bullish bounce could happen if support holds.
### 2\. Next 6-Hour Price Prediction
### $3,920–$3,950
Possible recovery target
Resistance levels
* $3,920
* $3,950
* $3,993
Support levels
* $3,881
* $3,860
* $3,830
My expectation: Bearish to sideways, with a possible short-term relief bounce.
### 3\. Trading Scenarios
Scenario A – Bullish bounce
Conditional
If gold holds above $3,881 and recovers $3,900, it could move towards $3,920–$3,950.
Scenario B – Further downside
Bearish
If gold breaks below $3,881 with strong selling volume, the next targets could be $3,860 and $3,830.
### 4\. Final Prediction
My 6-hour outlook
* Primary bias: Bearish.
* Short-term possibility: Oversold recovery.
* Important level: $3,881.
* Bullish confirmation: Recovery above $3,920.
* Bearish confirmation: Breakdown below $3,881.
#GOLD #XAUUSD $XAUT
Based on your latest Binance chart (October 31, 2026), Gold is showing strong selling pressure, but a short-term recovery bounce is possible.
### $3,890.06
-2.24% (24-hour change)
### 1\. Technical Analysis
| Indicator | Current value | Signal |
| --------- | ------------- | -------------- |
| MA(7) | 3,993.57 | Bearish |
| MA(25) | 4,094.90 | Bearish |
| MA(99) | 4,268.12 | Strong bearish |
| RSI(6) | 18.85 | Oversold |
| 24h Low | 3,881.02 | Key support |
What the indicators suggest:
* Price is below all three moving averages.
* RSI at 18.85 indicates extremely oversold conditions.
* Strong selling pressure is visible in the latest candle.
* A temporary bullish bounce could happen if support holds.
### 2\. Next 6-Hour Price Prediction
### $3,920–$3,950
Possible recovery target
Resistance levels
* $3,920
* $3,950
* $3,993
Support levels
* $3,881
* $3,860
* $3,830
My expectation: Bearish to sideways, with a possible short-term relief bounce.
### 3\. Trading Scenarios
Scenario A – Bullish bounce
Conditional
If gold holds above $3,881 and recovers $3,900, it could move towards $3,920–$3,950.
Scenario B – Further downside
Bearish
If gold breaks below $3,881 with strong selling volume, the next targets could be $3,860 and $3,830.
### 4\. Final Prediction
My 6-hour outlook
* Primary bias: Bearish.
* Short-term possibility: Oversold recovery.
* Important level: $3,881.
* Bullish confirmation: Recovery above $3,920.
* Bearish confirmation: Breakdown below $3,881.
#GOLD #XAUUSD $XAUT
281
·
--
Pair and interval
SOL/USDT spot, 4-hour interval, based on 29 completed candles. The one still-forming 4-hour candle was excluded.
Observable direction
Downward over the completed window: the first candle opened at 100.73 USDT, while the latest completed candle closed at 96.26 USDT.
Change: −4.47 USDT
Percentage change: −4.44%
High and low range
Across the 29 completed 4-hour candles:
Highest high: 103.85 USDT
Lowest low: 92.34 USDT
Total range: 11.51 USDT
The latest completed close at 96.26 USDT is 3.92 USDT above the low, placing it about 34.1% up from the bottom of the range and in the lower portion of the window.
Momentum and volume context
The recent move has become less volatile than the sharp selloff beforehand:
The last 5 completed candles averaged roughly 0.85 USDT in absolute open-to-close movement.
The preceding 5 candles averaged roughly 2.22 USDT, so candle-body movement narrowed after the decline.
Volume also cooled:
Last 5 candles: about 355,928 SOL average volume and 34.08 million USDT average turnover.
Previous 5 candles: about 895,465 SOL and 87.10 million USDT average turnover.
The earlier group included the largest activity spike, with one completed 4-hour candle recording about 2.03 million SOL of volume and 196.77 million USDT of turnover. The latest candles show quieter, mixed movement rather than the same intensity.
Caveats
This is a 4-hour, 30-candle window, so it covers only a short market period and may not represent the broader trend. The in-progress candle was excluded, and raw completed candles describe past price action but do not establish a reliable future prediction or a buy/sell signal.
Pair and interval
SOL/USDT spot, 4-hour interval, based on 29 completed candles. The one still-forming 4-hour candle was excluded.
Observable direction
Downward over the completed window: the first candle opened at 100.73 USDT, while the latest completed candle closed at 96.26 USDT.
Change: −4.47 USDT
Percentage change: −4.44%
High and low range
Across the 29 completed 4-hour candles:
Highest high: 103.85 USDT
Lowest low: 92.34 USDT
Total range: 11.51 USDT
The latest completed close at 96.26 USDT is 3.92 USDT above the low, placing it about 34.1% up from the bottom of the range and in the lower portion of the window.
Momentum and volume context
The recent move has become less volatile than the sharp selloff beforehand:
The last 5 completed candles averaged roughly 0.85 USDT in absolute open-to-close movement.
The preceding 5 candles averaged roughly 2.22 USDT, so candle-body movement narrowed after the decline.
Volume also cooled:
Last 5 candles: about 355,928 SOL average volume and 34.08 million USDT average turnover.
Previous 5 candles: about 895,465 SOL and 87.10 million USDT average turnover.
The earlier group included the largest activity spike, with one completed 4-hour candle recording about 2.03 million SOL of volume and 196.77 million USDT of turnover. The latest candles show quieter, mixed movement rather than the same intensity.
Caveats
This is a 4-hour, 30-candle window, so it covers only a short market period and may not represent the broader trend. The in-progress candle was excluded, and raw completed candles describe past price action but do not establish a reliable future prediction or a buy/sell signal.
SOL/USDT spot, 4-hour interval, based on 29 completed candles. The one still-forming 4-hour candle was excluded.
Observable direction
Downward over the completed window: the first candle opened at 100.73 USDT, while the latest completed candle closed at 96.26 USDT.
Change: −4.47 USDT
Percentage change: −4.44%
High and low range
Across the 29 completed 4-hour candles:
Highest high: 103.85 USDT
Lowest low: 92.34 USDT
Total range: 11.51 USDT
The latest completed close at 96.26 USDT is 3.92 USDT above the low, placing it about 34.1% up from the bottom of the range and in the lower portion of the window.
Momentum and volume context
The recent move has become less volatile than the sharp selloff beforehand:
The last 5 completed candles averaged roughly 0.85 USDT in absolute open-to-close movement.
The preceding 5 candles averaged roughly 2.22 USDT, so candle-body movement narrowed after the decline.
Volume also cooled:
Last 5 candles: about 355,928 SOL average volume and 34.08 million USDT average turnover.
Previous 5 candles: about 895,465 SOL and 87.10 million USDT average turnover.
The earlier group included the largest activity spike, with one completed 4-hour candle recording about 2.03 million SOL of volume and 196.77 million USDT of turnover. The latest candles show quieter, mixed movement rather than the same intensity.
Caveats
This is a 4-hour, 30-candle window, so it covers only a short market period and may not represent the broader trend. The in-progress candle was excluded, and raw completed candles describe past price action but do not establish a reliable future prediction or a buy/sell signal.
59
Log in to explore more content
Join global crypto users on Binance Square
⚡️ Get latest and useful information about crypto.
💬 Trusted by the world’s largest crypto exchange.
👍 Discover real insights from verified creators.
Email / Phone number
Trending Topics
USMidterms-WhatAreMarketsExpecting?
89,828 views
791 Discussing
Democratic Congressional Sweep Shakes Trump Trades in AI Stocks and Crypto
Binance News
·13 Likes
·5k views
USOctoberNFP-AreRateCutsStillPossible
248,888 views
1,948 Discussing
AMDBeatsExpectations-AINarrativeContinues
21,724 views
302 Discussing