
Halit Buğra
138 Posts

Halit Buğra
Report
Block User
A legend trader
5 Following
15.3K+ Followers
3.8K+ Liked
Posts
·
--
THE FED DECISION IS HOURS AWAY, AND GLOBAL MARKETS ARE ALREADY BRACING FOR A MAJOR VOLATILITY EVENT.
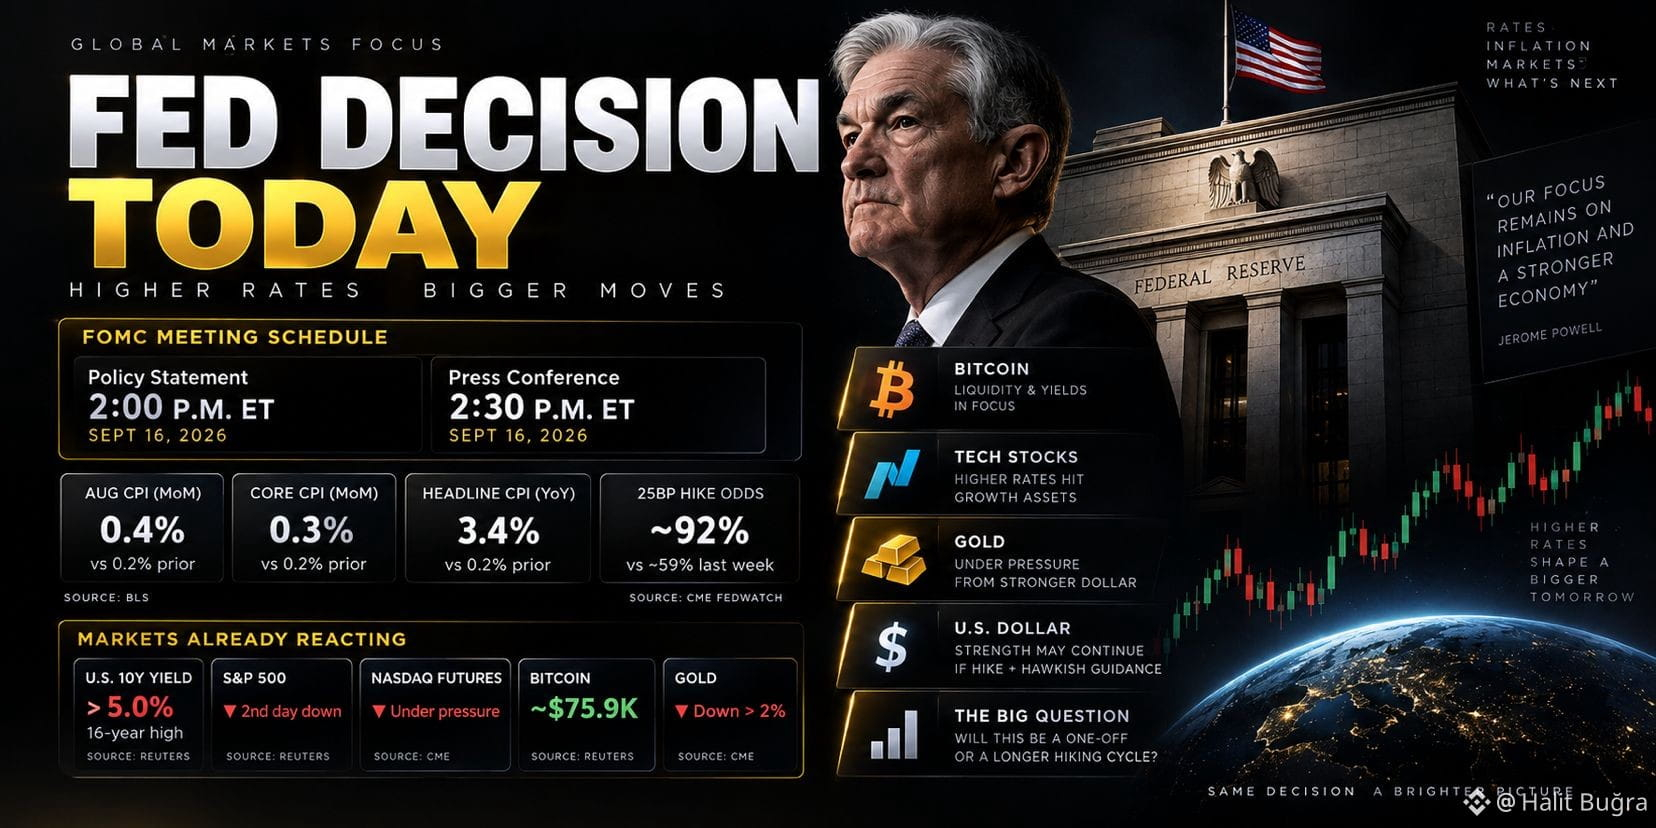
The September FOMC meeting concludes today, September 16. The policy statement is scheduled for 2:00 p.m. ET, followed by the Fed press conference at 2:30 p.m. ET.
Inflation has put the Fed back under pressure. Official BLS data shows headline CPI increased 0.4% month-over-month in August and 3.4% year-over-year. Core CPI, excluding food and energy, rose 0.3% for the month.
Market expectations have shifted aggressively. CME FedWatch pricing showed roughly a 92% implied probability of a 25-basis-point hike ahead of today’s decision, up sharply from around 59% one week earlier.
The pressure is already visible across markets. The U.S. 10-year Treasury yield briefly crossed 5% on Tuesday, while Wall Street fell for a second consecutive session. Bitcoin was trading around $75.9K during Wednesday’s Asian session.
For BTC, the immediate battle could come down to liquidity and yields. A hike combined with hawkish guidance could keep yields and the dollar elevated, creating another headwind for risk assets. A hike accompanied by softer guidance on additional increases could produce a very different reaction.
Tech stocks face a similar setup. Higher rates raise discount rates on future earnings, making long-duration growth assets particularly sensitive to the Fed’s message. Nasdaq futures had already been under pressure as Treasury yields climbed.
Gold is another market to watch closely. Recent dollar strength and rising rate expectations have pressured precious metals; CME reported gold and several other metals falling more than 2% as markets repriced toward a September hike.
The 25bp decision itself may not be the biggest surprise anymore. With markets heavily pricing it in, the real volatility trigger could be what the Fed signals about October, December and the possibility of a longer hiking cycle.
For my setup, I would avoid treating the first BTC move.
Today isn’t only about whether rates rise.
It’s about what comes next.
#FedRateWatch .
THE FED DECISION IS HOURS AWAY, AND GLOBAL MARKETS ARE ALREADY BRACING FOR A MAJOR VOLATILITY EVENT.
The September FOMC meeting concludes today, September 16. The policy statement is scheduled for 2:00 p.m. ET, followed by the Fed press conference at 2:30 p.m. ET.
Inflation has put the Fed back under pressure. Official BLS data shows headline CPI increased 0.4% month-over-month in August and 3.4% year-over-year. Core CPI, excluding food and energy, rose 0.3% for the month.
Market expectations have shifted aggressively. CME FedWatch pricing showed roughly a 92% implied probability of a 25-basis-point hike ahead of today’s decision, up sharply from around 59% one week earlier.
The pressure is already visible across markets. The U.S. 10-year Treasury yield briefly crossed 5% on Tuesday, while Wall Street fell for a second consecutive session. Bitcoin was trading around $75.9K during Wednesday’s Asian session.
For BTC, the immediate battle could come down to liquidity and yields. A hike combined with hawkish guidance could keep yields and the dollar elevated, creating another headwind for risk assets. A hike accompanied by softer guidance on additional increases could produce a very different reaction.
Tech stocks face a similar setup. Higher rates raise discount rates on future earnings, making long-duration growth assets particularly sensitive to the Fed’s message. Nasdaq futures had already been under pressure as Treasury yields climbed.
Gold is another market to watch closely. Recent dollar strength and rising rate expectations have pressured precious metals; CME reported gold and several other metals falling more than 2% as markets repriced toward a September hike.
The 25bp decision itself may not be the biggest surprise anymore. With markets heavily pricing it in, the real volatility trigger could be what the Fed signals about October, December and the possibility of a longer hiking cycle.
For my setup, I would avoid treating the first BTC move.
Today isn’t only about whether rates rise.
It’s about what comes next.
#FedRateWatch .
The September FOMC meeting concludes today, September 16. The policy statement is scheduled for 2:00 p.m. ET, followed by the Fed press conference at 2:30 p.m. ET.
Inflation has put the Fed back under pressure. Official BLS data shows headline CPI increased 0.4% month-over-month in August and 3.4% year-over-year. Core CPI, excluding food and energy, rose 0.3% for the month.
Market expectations have shifted aggressively. CME FedWatch pricing showed roughly a 92% implied probability of a 25-basis-point hike ahead of today’s decision, up sharply from around 59% one week earlier.
The pressure is already visible across markets. The U.S. 10-year Treasury yield briefly crossed 5% on Tuesday, while Wall Street fell for a second consecutive session. Bitcoin was trading around $75.9K during Wednesday’s Asian session.
For BTC, the immediate battle could come down to liquidity and yields. A hike combined with hawkish guidance could keep yields and the dollar elevated, creating another headwind for risk assets. A hike accompanied by softer guidance on additional increases could produce a very different reaction.
Tech stocks face a similar setup. Higher rates raise discount rates on future earnings, making long-duration growth assets particularly sensitive to the Fed’s message. Nasdaq futures had already been under pressure as Treasury yields climbed.
Gold is another market to watch closely. Recent dollar strength and rising rate expectations have pressured precious metals; CME reported gold and several other metals falling more than 2% as markets repriced toward a September hike.
The 25bp decision itself may not be the biggest surprise anymore. With markets heavily pricing it in, the real volatility trigger could be what the Fed signals about October, December and the possibility of a longer hiking cycle.
For my setup, I would avoid treating the first BTC move.
Today isn’t only about whether rates rise.
It’s about what comes next.
#FedRateWatch .
7
7
236
·
--
𝗦𝗢𝗠𝗘𝗢𝗡𝗘 𝗝𝗨𝗦𝗧 𝗢𝗣𝗘𝗡𝗘𝗗 𝗔 𝗠𝗔𝗦𝗦𝗜𝗩𝗘 $𝟳𝟯 𝗠𝗜𝗟𝗟𝗜𝗢𝗡 𝗦𝗛𝗢𝗥𝗧 𝗢𝗡 $𝗕𝗧𝗖 𝗔𝗡𝗗 $𝗘𝗧𝗛.
And the timing is impossible to ignore.
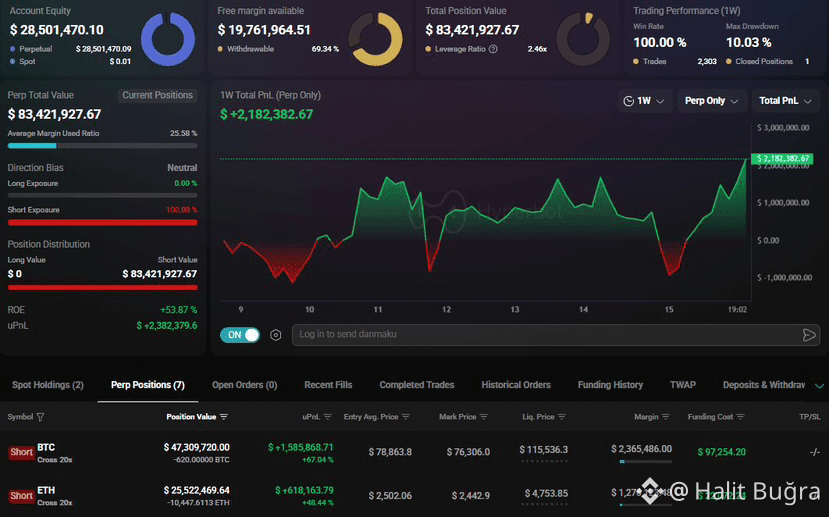
Ahead of today’s CLARITY vote, one trader is sitting on roughly $47.3M worth of BTC shorts and another $25.5M in ETH shorts.
That puts the combined position at nearly $73M, with the account heavily positioned toward the downside.
The screenshot shows a BTC short worth approximately $47.3M, entered around $78,864, alongside an ETH short worth approximately $25.5M, entered around $2,502.
The account currently shows around $28.5M in equity and more than $83M in total position value.
Even more interesting, the trader’s 1-week perp PnL is already around +$2.18M, with both the displayed BTC and ETH positions sitting firmly in profit.
Positions of this size around a major regulatory event are bound to attract attention. It could be a hedge against existing exposure or simply a high-conviction bearish trade.
Either way, nearly $73M positioned against $BTC and $ETH ahead of the CLARITY vote makes this a trade worth watching closely.
NFA. DYOR. This is for informational purposes only and not financial advice.
𝗦𝗢𝗠𝗘𝗢𝗡𝗘 𝗝𝗨𝗦𝗧 𝗢𝗣𝗘𝗡𝗘𝗗 𝗔 𝗠𝗔𝗦𝗦𝗜𝗩𝗘 $𝟳𝟯 𝗠𝗜𝗟𝗟𝗜𝗢𝗡 𝗦𝗛𝗢𝗥𝗧 𝗢𝗡 $𝗕𝗧𝗖 𝗔𝗡𝗗 $𝗘𝗧𝗛.
And the timing is impossible to ignore.
Ahead of today’s CLARITY vote, one trader is sitting on roughly $47.3M worth of BTC shorts and another $25.5M in ETH shorts.
That puts the combined position at nearly $73M, with the account heavily positioned toward the downside.
The screenshot shows a BTC short worth approximately $47.3M, entered around $78,864, alongside an ETH short worth approximately $25.5M, entered around $2,502.
The account currently shows around $28.5M in equity and more than $83M in total position value.
Even more interesting, the trader’s 1-week perp PnL is already around +$2.18M, with both the displayed BTC and ETH positions sitting firmly in profit.
Positions of this size around a major regulatory event are bound to attract attention. It could be a hedge against existing exposure or simply a high-conviction bearish trade.
Either way, nearly $73M positioned against $BTC and $ETH ahead of the CLARITY vote makes this a trade worth watching closely.
NFA. DYOR. This is for informational purposes only and not financial advice.
And the timing is impossible to ignore.
Ahead of today’s CLARITY vote, one trader is sitting on roughly $47.3M worth of BTC shorts and another $25.5M in ETH shorts.
That puts the combined position at nearly $73M, with the account heavily positioned toward the downside.
The screenshot shows a BTC short worth approximately $47.3M, entered around $78,864, alongside an ETH short worth approximately $25.5M, entered around $2,502.
The account currently shows around $28.5M in equity and more than $83M in total position value.
Even more interesting, the trader’s 1-week perp PnL is already around +$2.18M, with both the displayed BTC and ETH positions sitting firmly in profit.
Positions of this size around a major regulatory event are bound to attract attention. It could be a hedge against existing exposure or simply a high-conviction bearish trade.
Either way, nearly $73M positioned against $BTC and $ETH ahead of the CLARITY vote makes this a trade worth watching closely.
NFA. DYOR. This is for informational purposes only and not financial advice.
8
8
405
·
--
Disputed
MASSIVE SELL-OFF HITS WALL STREET AS $595 BILLION IS WIPED OUT OF U.S. STOCKS AT THE OPEN.
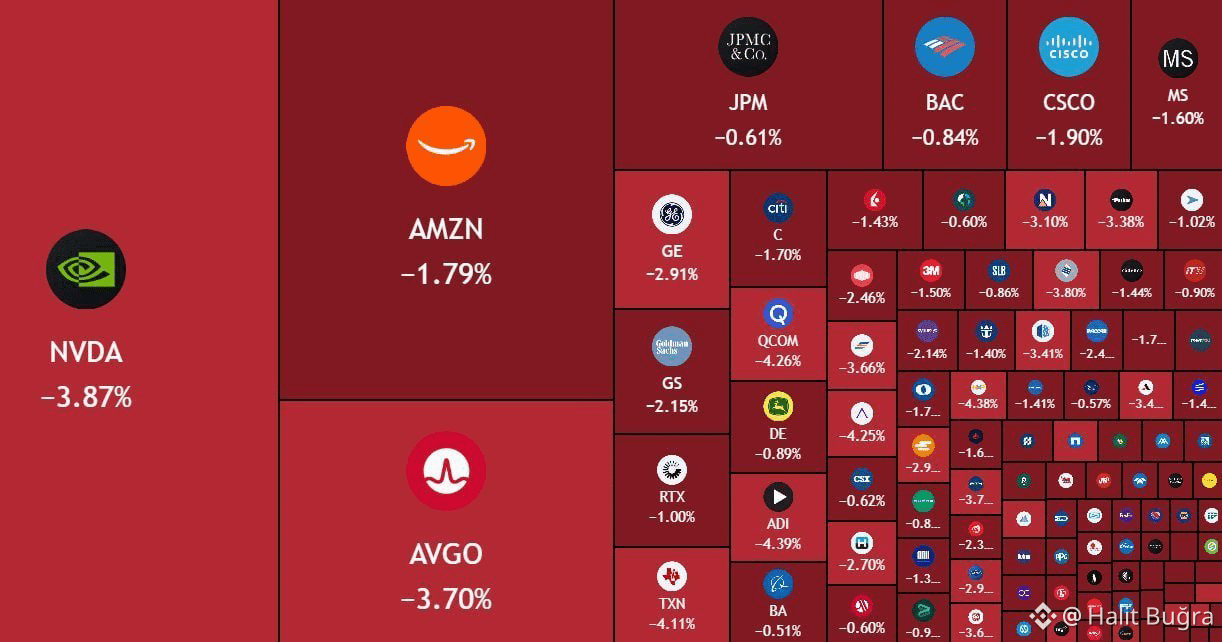
Selling pressure came in fast, putting the market on the defensive from the opening bell.
Investors are pulling back from risk as uncertainty pushes traders to reassess their positions across major U.S. stocks.
A move of this size can quickly spill into other markets, with crypto, bonds, commodities, and the dollar potentially reacting to the shift in sentiment.
Volatility is heating up, and attention now turns to whether buyers can absorb the pressure or sellers remain in control.
The next move could set the tone for the broader market…
MASSIVE SELL-OFF HITS WALL STREET AS $595 BILLION IS WIPED OUT OF U.S. STOCKS AT THE OPEN.
Selling pressure came in fast, putting the market on the defensive from the opening bell.
Investors are pulling back from risk as uncertainty pushes traders to reassess their positions across major U.S. stocks.
A move of this size can quickly spill into other markets, with crypto, bonds, commodities, and the dollar potentially reacting to the shift in sentiment.
Volatility is heating up, and attention now turns to whether buyers can absorb the pressure or sellers remain in control.
The next move could set the tone for the broader market…
Selling pressure came in fast, putting the market on the defensive from the opening bell.
Investors are pulling back from risk as uncertainty pushes traders to reassess their positions across major U.S. stocks.
A move of this size can quickly spill into other markets, with crypto, bonds, commodities, and the dollar potentially reacting to the shift in sentiment.
Volatility is heating up, and attention now turns to whether buyers can absorb the pressure or sellers remain in control.
The next move could set the tone for the broader market…
8
9
708
·
--
HUGE BITCOIN SELL WALLS ARE FORMING RIGHT NOW!
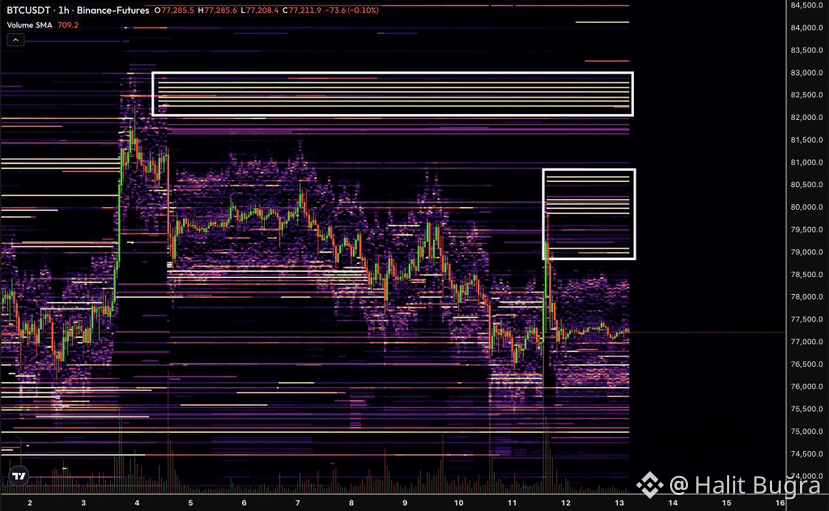
Massive sell orders are stacking up above the current price, creating a serious liquidity barrier for $BTC
These walls can temporarily cap upside momentum as buyers need significant volume to absorb the available supply.
If Bitcoin keeps pushing into these levels and the sell walls start getting absorbed, it could signal strong demand and potentially trigger an aggressive breakout.
But if buyers fail to absorb the supply, rejection could send BTC back toward lower liquidity and support zones.
The next move is all about liquidity.
SELL WALLS GET ABSORBED → BULLS TAKE CONTROL
SELL WALLS HOLD → REJECTION RISK INCREASES
Bitcoin is approaching a critical battle zone.
Watch the order flow closely — volatility could explode once one side gives way.
HUGE BITCOIN SELL WALLS ARE FORMING RIGHT NOW!
Massive sell orders are stacking up above the current price, creating a serious liquidity barrier for $BTC
These walls can temporarily cap upside momentum as buyers need significant volume to absorb the available supply.
If Bitcoin keeps pushing into these levels and the sell walls start getting absorbed, it could signal strong demand and potentially trigger an aggressive breakout.
But if buyers fail to absorb the supply, rejection could send BTC back toward lower liquidity and support zones.
The next move is all about liquidity.
SELL WALLS GET ABSORBED → BULLS TAKE CONTROL
SELL WALLS HOLD → REJECTION RISK INCREASES
Bitcoin is approaching a critical battle zone.
Watch the order flow closely — volatility could explode once one side gives way.
Massive sell orders are stacking up above the current price, creating a serious liquidity barrier for $BTC
These walls can temporarily cap upside momentum as buyers need significant volume to absorb the available supply.
If Bitcoin keeps pushing into these levels and the sell walls start getting absorbed, it could signal strong demand and potentially trigger an aggressive breakout.
But if buyers fail to absorb the supply, rejection could send BTC back toward lower liquidity and support zones.
The next move is all about liquidity.
SELL WALLS GET ABSORBED → BULLS TAKE CONTROL
SELL WALLS HOLD → REJECTION RISK INCREASES
Bitcoin is approaching a critical battle zone.
Watch the order flow closely — volatility could explode once one side gives way.
9
9
1.9k
·
--
𝗕𝗜𝗧𝗖𝗢𝗜𝗡’𝗦 𝗖𝗔𝗧𝗖𝗛-𝗨𝗣 𝗥𝗔𝗟𝗟𝗬 𝗖𝗢𝗨𝗟𝗗 𝗕𝗘 𝗜𝗡𝗦𝗔𝗡𝗘.
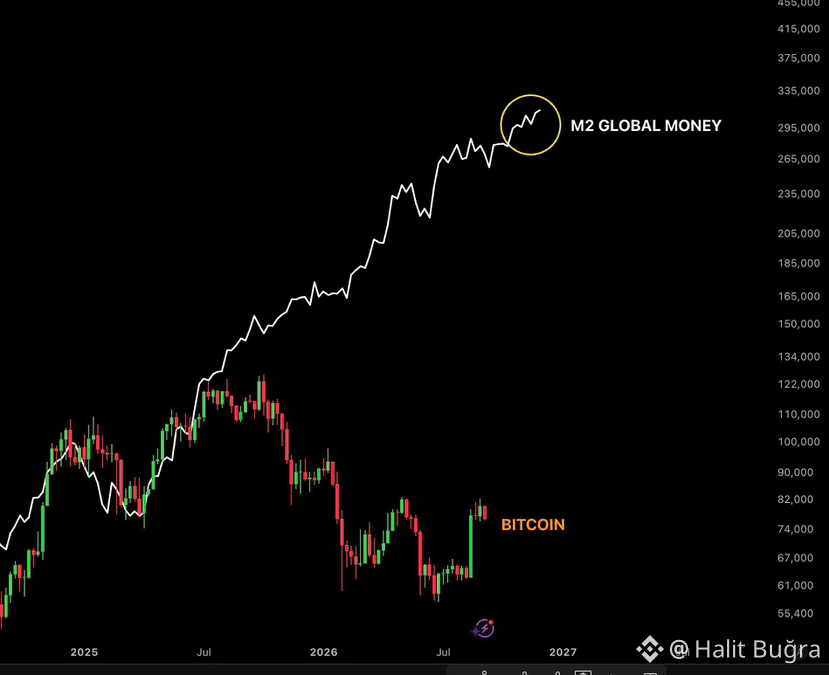
Global M2 money supply is pushing toward fresh highs, while Bitcoin is still trading far below the trajectory shown by global liquidity.
That divergence is getting hard to ignore.
Historically, expanding global liquidity has been a powerful tailwind for risk assets, including Bitcoin. But liquidity and BTC don’t move in perfect lockstep, and timing can vary significantly.
If Bitcoin begins closing this gap while M2 keeps expanding, the catch-up move could become explosive.
Liquidity is already moving.
Now the big question is whether Bitcoin follows.
𝗕𝗜𝗧𝗖𝗢𝗜𝗡’𝗦 𝗖𝗔𝗧𝗖𝗛-𝗨𝗣 𝗥𝗔𝗟𝗟𝗬 𝗖𝗢𝗨𝗟𝗗 𝗕𝗘 𝗜𝗡𝗦𝗔𝗡𝗘.
Global M2 money supply is pushing toward fresh highs, while Bitcoin is still trading far below the trajectory shown by global liquidity.
That divergence is getting hard to ignore.
Historically, expanding global liquidity has been a powerful tailwind for risk assets, including Bitcoin. But liquidity and BTC don’t move in perfect lockstep, and timing can vary significantly.
If Bitcoin begins closing this gap while M2 keeps expanding, the catch-up move could become explosive.
Liquidity is already moving.
Now the big question is whether Bitcoin follows.
Global M2 money supply is pushing toward fresh highs, while Bitcoin is still trading far below the trajectory shown by global liquidity.
That divergence is getting hard to ignore.
Historically, expanding global liquidity has been a powerful tailwind for risk assets, including Bitcoin. But liquidity and BTC don’t move in perfect lockstep, and timing can vary significantly.
If Bitcoin begins closing this gap while M2 keeps expanding, the catch-up move could become explosive.
Liquidity is already moving.
Now the big question is whether Bitcoin follows.
8
18
4.3k
·
--
U.S. INFLATION IS BACK IN FOCUS, PUTTING THE FED, BITCOIN, STOCKS, BONDS AND THE DOLLAR ON HIGH ALERT.
August headline CPI rose 0.4% month-over-month and 3.4% year-over-year, while core CPI increased 0.3% monthly and 2.4% annually.
Energy remains a key pressure point, with gasoline prices rising sharply during August. Persistent energy costs could keep inflation elevated and complicate the Federal Reserve’s path toward its 2% inflation target.
Now the market’s attention shifts directly to the Fed.
Sticky inflation could strengthen expectations for tighter monetary policy, pushing Treasury yields and the U.S. dollar higher while creating pressure on liquidity-sensitive assets such as Bitcoin, altcoins and equities.
The key chain to watch:
CPI → Fed → Treasury Yields → Dollar → Liquidity → Bitcoin & Crypto
The headline number is only part of the story. Watch Fed expectations, yields and the dollar closely — they could determine whether the next major crypto move is bullish or bearish.
#CPIWatch .
U.S. INFLATION IS BACK IN FOCUS, PUTTING THE FED, BITCOIN, STOCKS, BONDS AND THE DOLLAR ON HIGH ALERT.
August headline CPI rose 0.4% month-over-month and 3.4% year-over-year, while core CPI increased 0.3% monthly and 2.4% annually.
Energy remains a key pressure point, with gasoline prices rising sharply during August. Persistent energy costs could keep inflation elevated and complicate the Federal Reserve’s path toward its 2% inflation target.
Now the market’s attention shifts directly to the Fed.
Sticky inflation could strengthen expectations for tighter monetary policy, pushing Treasury yields and the U.S. dollar higher while creating pressure on liquidity-sensitive assets such as Bitcoin, altcoins and equities.
The key chain to watch:
CPI → Fed → Treasury Yields → Dollar → Liquidity → Bitcoin & Crypto
The headline number is only part of the story. Watch Fed expectations, yields and the dollar closely — they could determine whether the next major crypto move is bullish or bearish.
#CPIWatch .
August headline CPI rose 0.4% month-over-month and 3.4% year-over-year, while core CPI increased 0.3% monthly and 2.4% annually.
Energy remains a key pressure point, with gasoline prices rising sharply during August. Persistent energy costs could keep inflation elevated and complicate the Federal Reserve’s path toward its 2% inflation target.
Now the market’s attention shifts directly to the Fed.
Sticky inflation could strengthen expectations for tighter monetary policy, pushing Treasury yields and the U.S. dollar higher while creating pressure on liquidity-sensitive assets such as Bitcoin, altcoins and equities.
The key chain to watch:
CPI → Fed → Treasury Yields → Dollar → Liquidity → Bitcoin & Crypto
The headline number is only part of the story. Watch Fed expectations, yields and the dollar closely — they could determine whether the next major crypto move is bullish or bearish.
#CPIWatch .

8
11
551
·
--
Partly True
MASSIVE SELL-OFF HITS WALL STREET AT THE OPEN.
$500 billion was erased from the US stock market as investors reacted aggressively to shifting Fed expectations.
Fed rate hike odds have now surged to 74%, raising fresh concerns about tighter financial conditions and liquidity.
Higher rates → tighter liquidity
Tighter liquidity → pressure on valuations
Pressure on valuations → capital moves toward safety
The reaction was immediate, with roughly $500 billion disappearing from US stocks at the opening bell.
Now the focus shifts to whether buyers step in to absorb the pressure or sellers push the market even lower.
Volatility is heating up fast.
MASSIVE SELL-OFF HITS WALL STREET AT THE OPEN.
$500 billion was erased from the US stock market as investors reacted aggressively to shifting Fed expectations.
Fed rate hike odds have now surged to 74%, raising fresh concerns about tighter financial conditions and liquidity.
Higher rates → tighter liquidity
Tighter liquidity → pressure on valuations
Pressure on valuations → capital moves toward safety
The reaction was immediate, with roughly $500 billion disappearing from US stocks at the opening bell.
Now the focus shifts to whether buyers step in to absorb the pressure or sellers push the market even lower.
Volatility is heating up fast.
$500 billion was erased from the US stock market as investors reacted aggressively to shifting Fed expectations.
Fed rate hike odds have now surged to 74%, raising fresh concerns about tighter financial conditions and liquidity.
Higher rates → tighter liquidity
Tighter liquidity → pressure on valuations
Pressure on valuations → capital moves toward safety
The reaction was immediate, with roughly $500 billion disappearing from US stocks at the opening bell.
Now the focus shifts to whether buyers step in to absorb the pressure or sellers push the market even lower.
Volatility is heating up fast.

9
9
3.6k
·
--
Partly True
BREAKING: A MASSIVE SHOCK JUST HIT THE PRECIOUS METALS MARKET.
$545 BILLION WIPED FROM GOLD AND SILVER IN JUST 25 MINUTES.
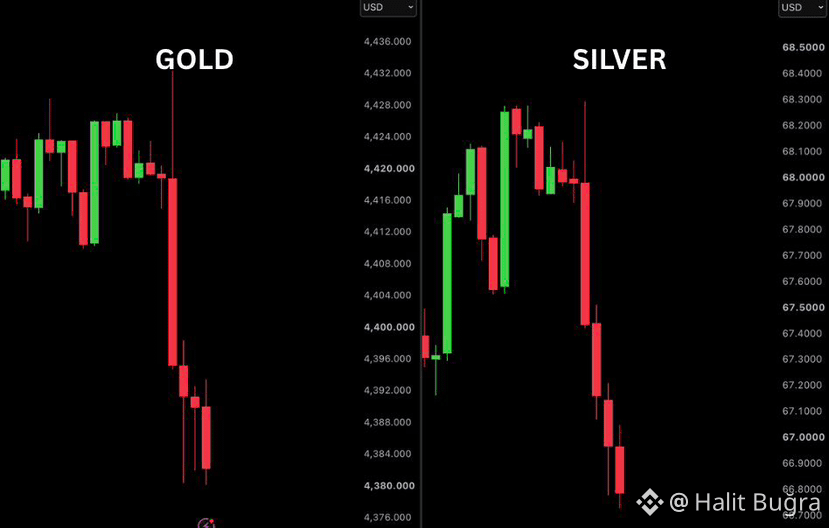
Gold suffered a sudden breakdown, with heavy selling pressure driving price sharply lower from the $4,420 region toward $4,380.
Silver followed with an even more aggressive move, sliding from around $68 to below $67 as sellers took control.
This wasn’t a slow correction. The speed and size of the move show how quickly market sentiment can flip when major positions begin unwinding.
Now all eyes are on the next reaction.
Will buyers aggressively defend these lower levels, or is another wave of selling about to hit Gold and Silver?
BREAKING: A MASSIVE SHOCK JUST HIT THE PRECIOUS METALS MARKET.
$545 BILLION WIPED FROM GOLD AND SILVER IN JUST 25 MINUTES.
Gold suffered a sudden breakdown, with heavy selling pressure driving price sharply lower from the $4,420 region toward $4,380.
Silver followed with an even more aggressive move, sliding from around $68 to below $67 as sellers took control.
This wasn’t a slow correction. The speed and size of the move show how quickly market sentiment can flip when major positions begin unwinding.
Now all eyes are on the next reaction.
Will buyers aggressively defend these lower levels, or is another wave of selling about to hit Gold and Silver?
$545 BILLION WIPED FROM GOLD AND SILVER IN JUST 25 MINUTES.
Gold suffered a sudden breakdown, with heavy selling pressure driving price sharply lower from the $4,420 region toward $4,380.
Silver followed with an even more aggressive move, sliding from around $68 to below $67 as sellers took control.
This wasn’t a slow correction. The speed and size of the move show how quickly market sentiment can flip when major positions begin unwinding.
Now all eyes are on the next reaction.
Will buyers aggressively defend these lower levels, or is another wave of selling about to hit Gold and Silver?
8
9
550
·
--
$SOL IS STARTING TO LOOK SERIOUSLY BULLISH.
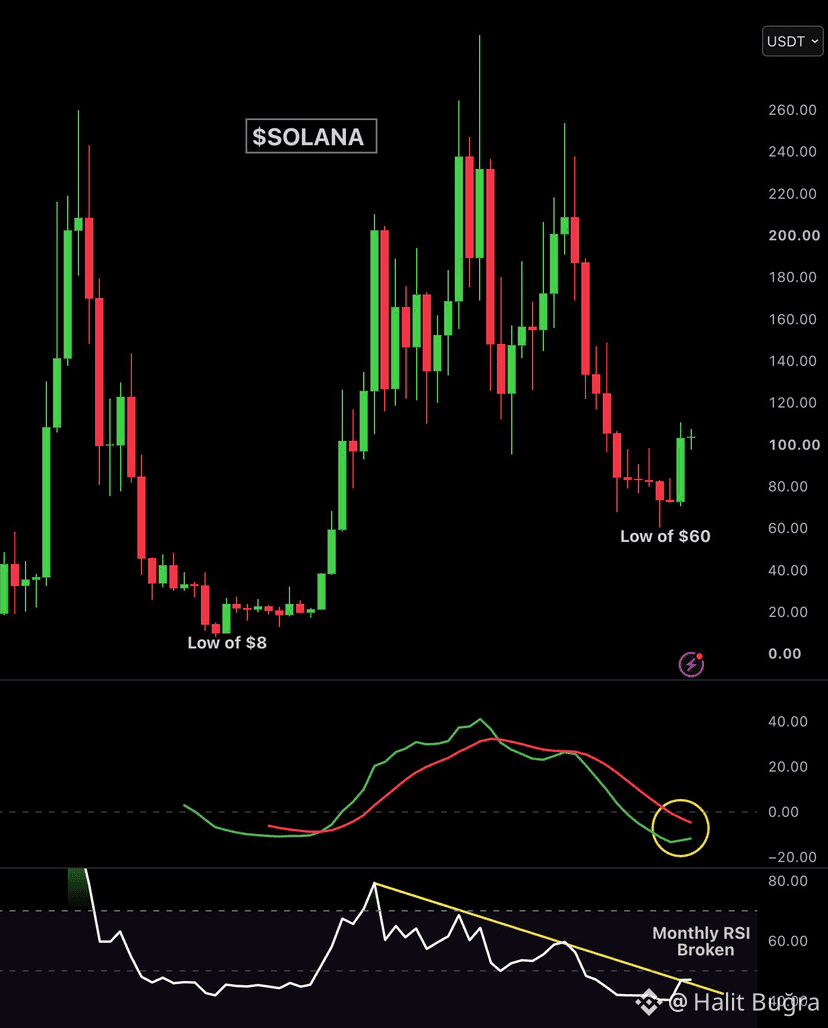
After 10 straight months without a green monthly close, SOL has finally flipped the script and printed one.
The monthly MACD is now getting close to a bullish crossover, while the monthly RSI has broken above a 2-year downtrend.
These are higher-timeframe signals, and when they start aligning together, the bigger picture becomes hard to ignore.
If momentum continues and SOL holds this shift in structure, this could be the early stage of a much larger bullish reversal.
The next few monthly candles could tell us everything.
Is $SOL waking up for its next major run?
$SOL IS STARTING TO LOOK SERIOUSLY BULLISH.
After 10 straight months without a green monthly close, SOL has finally flipped the script and printed one.
The monthly MACD is now getting close to a bullish crossover, while the monthly RSI has broken above a 2-year downtrend.
These are higher-timeframe signals, and when they start aligning together, the bigger picture becomes hard to ignore.
If momentum continues and SOL holds this shift in structure, this could be the early stage of a much larger bullish reversal.
The next few monthly candles could tell us everything.
Is $SOL waking up for its next major run?
After 10 straight months without a green monthly close, SOL has finally flipped the script and printed one.
The monthly MACD is now getting close to a bullish crossover, while the monthly RSI has broken above a 2-year downtrend.
These are higher-timeframe signals, and when they start aligning together, the bigger picture becomes hard to ignore.
If momentum continues and SOL holds this shift in structure, this could be the early stage of a much larger bullish reversal.
The next few monthly candles could tell us everything.
Is $SOL waking up for its next major run?
8
8
522
·
--
🚨 𝗚𝗔𝗥𝗥𝗘𝗧𝗧 𝗝𝗜𝗡 𝗜𝗦 𝗡𝗢𝗪 𝗗𝗢𝗪𝗡 𝗢𝗩𝗘𝗥 $𝟮𝟰 𝗠𝗜𝗟𝗟𝗜𝗢𝗡 𝗢𝗡 𝗛𝗜𝗦 𝗠𝗔𝗦𝗦𝗜𝗩𝗘 𝗭𝗘𝗖 𝗦𝗛𝗢𝗥𝗧.
Instead of cutting the position, he’s doubling down.
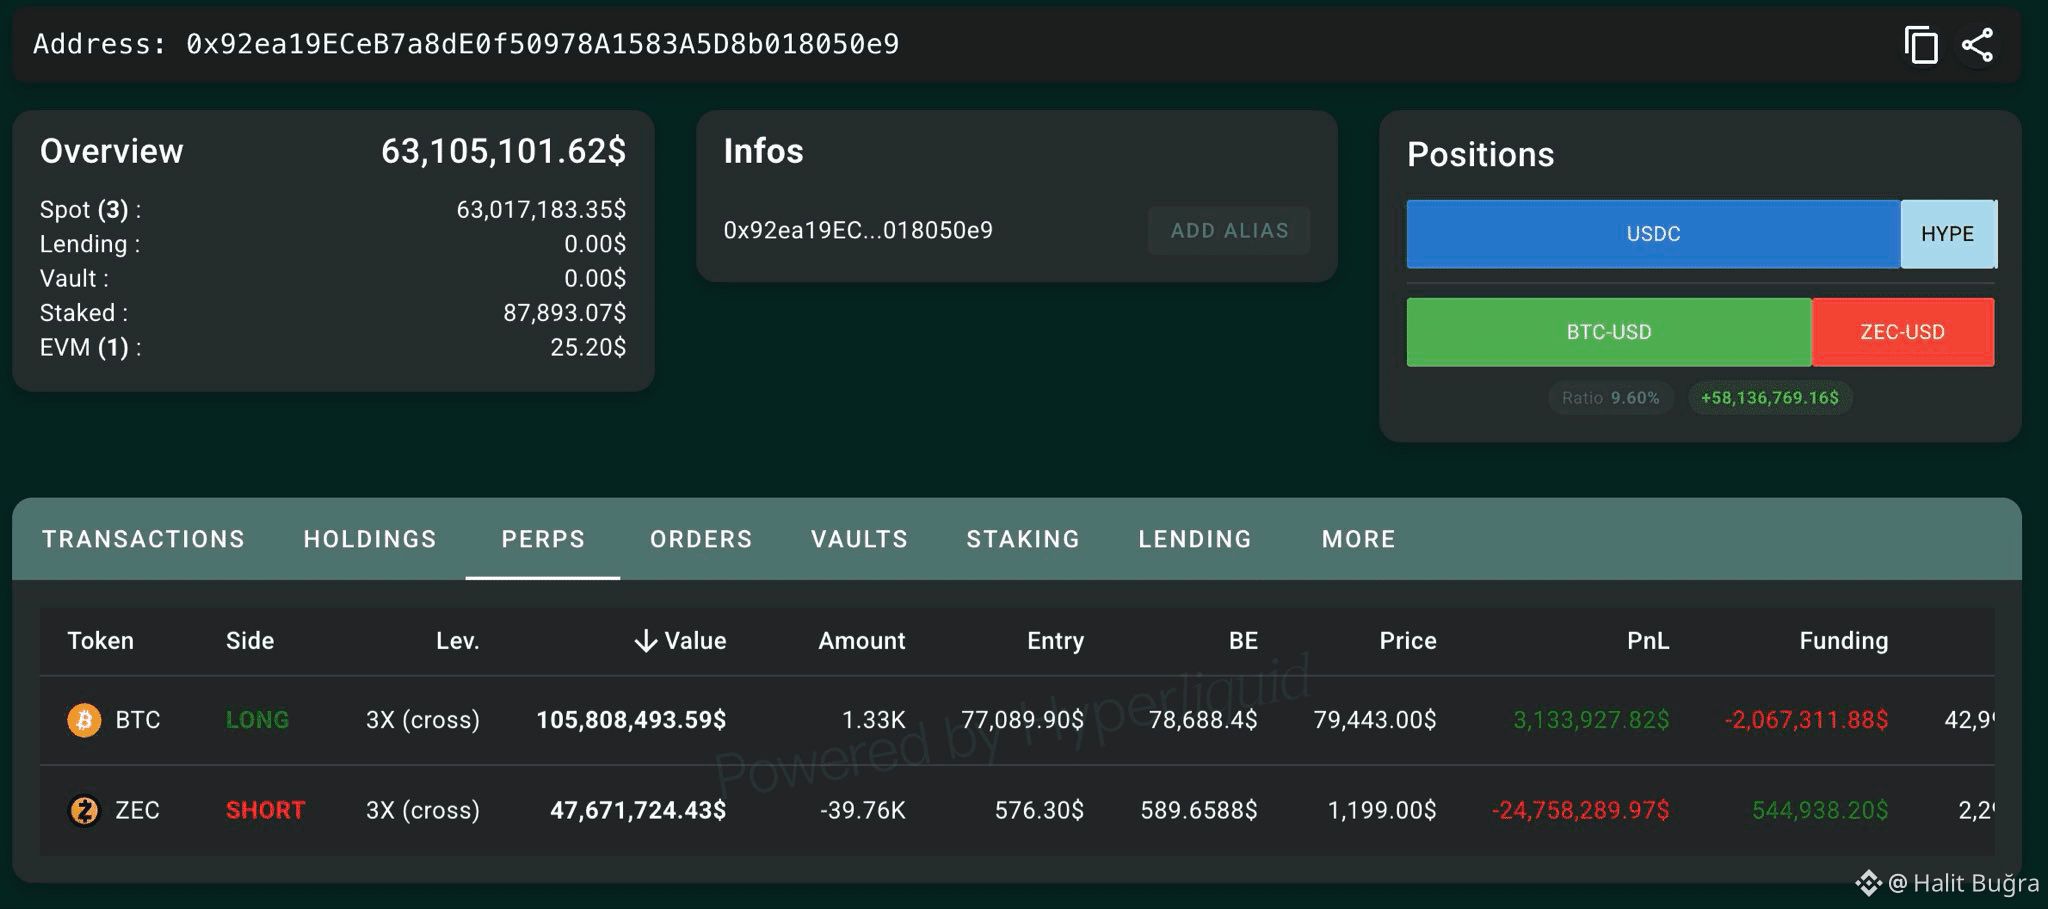
Jin reportedly added another $8.4M to the trade, bringing his total $ZEC short exposure to roughly $47M.
According to the position shown, his average entry sits near $576, while $ZEC is trading around $1,199 — leaving the position with approximately $24.76M in unrealized losses.
His liquidation level is reportedly around $2,292, meaning the trade still has room before forced liquidation, but the size of the drawdown is already enormous.
What makes this even crazier is the history.
Back in June, Jin reportedly made $11.24M shorting Zcash.
Now he’s back on the same side of the trade — except this time ZEC has moved violently against him, wiping out more than twice that previous profit on paper.
And he still hasn’t closed.
$47M short. $24M+ underwater. Still adding.
This is quickly becoming one of the wildest $ZEC whale positions to watch on-chain. 👀
🚨 𝗚𝗔𝗥𝗥𝗘𝗧𝗧 𝗝𝗜𝗡 𝗜𝗦 𝗡𝗢𝗪 𝗗𝗢𝗪𝗡 𝗢𝗩𝗘𝗥 $𝟮𝟰 𝗠𝗜𝗟𝗟𝗜𝗢𝗡 𝗢𝗡 𝗛𝗜𝗦 𝗠𝗔𝗦𝗦𝗜𝗩𝗘 𝗭𝗘𝗖 𝗦𝗛𝗢𝗥𝗧.
Instead of cutting the position, he’s doubling down.
Jin reportedly added another $8.4M to the trade, bringing his total $ZEC short exposure to roughly $47M.
According to the position shown, his average entry sits near $576, while $ZEC is trading around $1,199 — leaving the position with approximately $24.76M in unrealized losses.
His liquidation level is reportedly around $2,292, meaning the trade still has room before forced liquidation, but the size of the drawdown is already enormous.
What makes this even crazier is the history.
Back in June, Jin reportedly made $11.24M shorting Zcash.
Now he’s back on the same side of the trade — except this time ZEC has moved violently against him, wiping out more than twice that previous profit on paper.
And he still hasn’t closed.
$47M short. $24M+ underwater. Still adding.
This is quickly becoming one of the wildest $ZEC whale positions to watch on-chain. 👀
Instead of cutting the position, he’s doubling down.
Jin reportedly added another $8.4M to the trade, bringing his total $ZEC short exposure to roughly $47M.
According to the position shown, his average entry sits near $576, while $ZEC is trading around $1,199 — leaving the position with approximately $24.76M in unrealized losses.
His liquidation level is reportedly around $2,292, meaning the trade still has room before forced liquidation, but the size of the drawdown is already enormous.
What makes this even crazier is the history.
Back in June, Jin reportedly made $11.24M shorting Zcash.
Now he’s back on the same side of the trade — except this time ZEC has moved violently against him, wiping out more than twice that previous profit on paper.
And he still hasn’t closed.
$47M short. $24M+ underwater. Still adding.
This is quickly becoming one of the wildest $ZEC whale positions to watch on-chain. 👀
9
7
343
·
--
RED PACKET IS LIVE!
I’m sharing a RED PACKET with my community.
Want to grab your share?
How to participate:
1. Follow me
2. Comment “YES” below
3. Repost this post
4. Stay active and keep notifications ON
That’s it.
Don’t just scroll past — join in before you miss your chance.
Who’s ready?
COMMENT “YES” NOW!
LET’S GO!
RED PACKET IS LIVE!
I’m sharing a RED PACKET with my community.
Want to grab your share?
How to participate:
1. Follow me
2. Comment “YES” below
3. Repost this post
4. Stay active and keep notifications ON
That’s it.
Don’t just scroll past — join in before you miss your chance.
Who’s ready?
COMMENT “YES” NOW!
LET’S GO!
I’m sharing a RED PACKET with my community.
Want to grab your share?
How to participate:
1. Follow me
2. Comment “YES” below
3. Repost this post
4. Stay active and keep notifications ON
That’s it.
Don’t just scroll past — join in before you miss your chance.
Who’s ready?
COMMENT “YES” NOW!
LET’S GO!
1.1k
4
56
1.1k
·
--
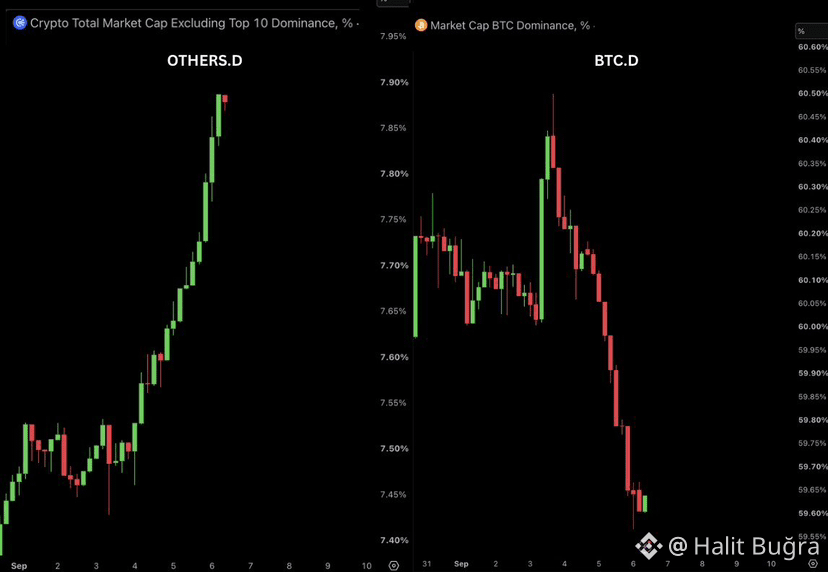
BITCOIN DOMINANCE IS DUMPING — ALTCOIN DOMINANCE IS PUMPING.
This is exactly the kind of market shift altcoin traders have been waiting for.
When BTC dominance starts losing strength, it can signal that capital is rotating away from Bitcoin and flowing deeper into the altcoin market.
If this trend continues, stronger alts could start outperforming $BTC and we may see momentum spread across multiple sectors.
The key now is continuation.
Falling BTC dominance + rising ALT dominance could create the conditions for a much stronger altcoin phase.
Keep your eyes on the charts.
The rotation may just be getting started.
BITCOIN DOMINANCE IS DUMPING — ALTCOIN DOMINANCE IS PUMPING.
This is exactly the kind of market shift altcoin traders have been waiting for.
When BTC dominance starts losing strength, it can signal that capital is rotating away from Bitcoin and flowing deeper into the altcoin market.
If this trend continues, stronger alts could start outperforming $BTC and we may see momentum spread across multiple sectors.
The key now is continuation.
Falling BTC dominance + rising ALT dominance could create the conditions for a much stronger altcoin phase.
Keep your eyes on the charts.
The rotation may just be getting started.
This is exactly the kind of market shift altcoin traders have been waiting for.
When BTC dominance starts losing strength, it can signal that capital is rotating away from Bitcoin and flowing deeper into the altcoin market.
If this trend continues, stronger alts could start outperforming $BTC and we may see momentum spread across multiple sectors.
The key now is continuation.
Falling BTC dominance + rising ALT dominance could create the conditions for a much stronger altcoin phase.
Keep your eyes on the charts.
The rotation may just be getting started.
7
9
1.4k
·
--
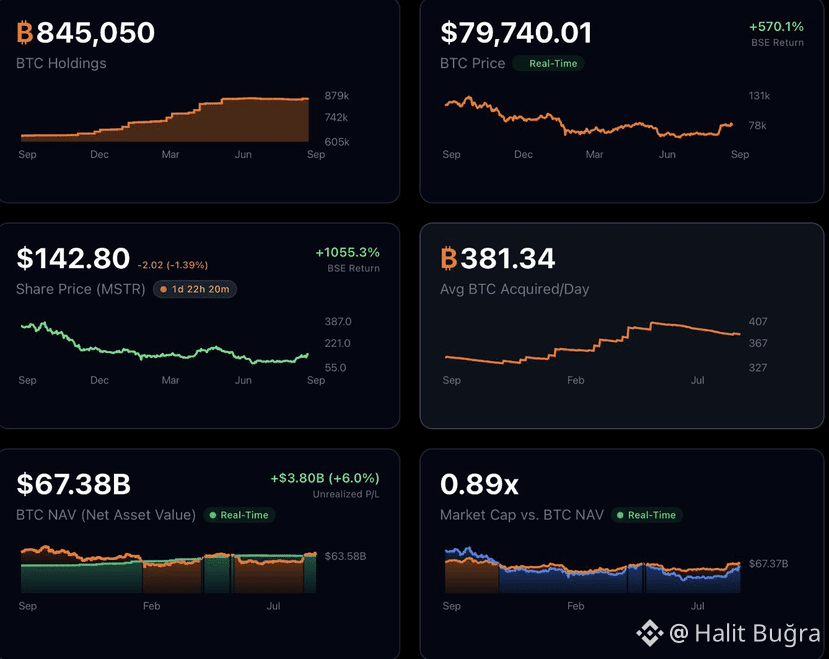
𝗕𝗥𝗘𝗔𝗞𝗜𝗡𝗚: 𝗠𝗜𝗖𝗛𝗔𝗘𝗟 𝗦𝗔𝗬𝗟𝗢𝗥’𝗦 𝗦𝗧𝗥𝗔𝗧𝗘𝗚𝗬 𝗜𝗦 𝗡𝗢𝗪 𝗦𝗜𝗧𝗧𝗜𝗡𝗚 𝗢𝗡 𝗔 𝗠𝗔𝗦𝗦𝗜𝗩𝗘 $𝟯.𝟴 𝗕𝗜𝗟𝗟𝗜𝗢𝗡 𝗜𝗡 𝗨𝗡𝗥𝗘𝗔𝗟𝗜𝗭𝗘𝗗 𝗚𝗔𝗜𝗡𝗦 𝗢𝗡 𝗜𝗧𝗦 $𝗕𝗧𝗖 𝗣𝗢𝗦𝗜𝗧𝗜𝗢𝗡.
Strategy’s aggressive Bitcoin bet is once again showing just how powerful its long-term accumulation strategy can become when $BTC moves higher.
Michael Saylor has spent years positioning Bitcoin as a core treasury asset, repeatedly adding BTC through different market cycles instead of treating it as a short-term trade.
Now, billions in unrealized gains highlight the scale of that conviction.
The gains remain “unrealized,” meaning they exist on paper and can rise or fall with Bitcoin’s price. But the numbers show why Strategy has become one of the biggest institutional symbols of Bitcoin adoption.
Saylor didn’t just talk about Bitcoin.
He built an entire corporate strategy around it.
𝗕𝗥𝗘𝗔𝗞𝗜𝗡𝗚: 𝗠𝗜𝗖𝗛𝗔𝗘𝗟 𝗦𝗔𝗬𝗟𝗢𝗥’𝗦 𝗦𝗧𝗥𝗔𝗧𝗘𝗚𝗬 𝗜𝗦 𝗡𝗢𝗪 𝗦𝗜𝗧𝗧𝗜𝗡𝗚 𝗢𝗡 𝗔 𝗠𝗔𝗦𝗦𝗜𝗩𝗘 $𝟯.𝟴 𝗕𝗜𝗟𝗟𝗜𝗢𝗡 𝗜𝗡 𝗨𝗡𝗥𝗘𝗔𝗟𝗜𝗭𝗘𝗗 𝗚𝗔𝗜𝗡𝗦 𝗢𝗡 𝗜𝗧𝗦 $𝗕𝗧𝗖 𝗣𝗢𝗦𝗜𝗧𝗜𝗢𝗡.
Strategy’s aggressive Bitcoin bet is once again showing just how powerful its long-term accumulation strategy can become when $BTC moves higher.
Michael Saylor has spent years positioning Bitcoin as a core treasury asset, repeatedly adding BTC through different market cycles instead of treating it as a short-term trade.
Now, billions in unrealized gains highlight the scale of that conviction.
The gains remain “unrealized,” meaning they exist on paper and can rise or fall with Bitcoin’s price. But the numbers show why Strategy has become one of the biggest institutional symbols of Bitcoin adoption.
Saylor didn’t just talk about Bitcoin.
He built an entire corporate strategy around it.
Strategy’s aggressive Bitcoin bet is once again showing just how powerful its long-term accumulation strategy can become when $BTC moves higher.
Michael Saylor has spent years positioning Bitcoin as a core treasury asset, repeatedly adding BTC through different market cycles instead of treating it as a short-term trade.
Now, billions in unrealized gains highlight the scale of that conviction.
The gains remain “unrealized,” meaning they exist on paper and can rise or fall with Bitcoin’s price. But the numbers show why Strategy has become one of the biggest institutional symbols of Bitcoin adoption.
Saylor didn’t just talk about Bitcoin.
He built an entire corporate strategy around it.
7
9
599
·
--
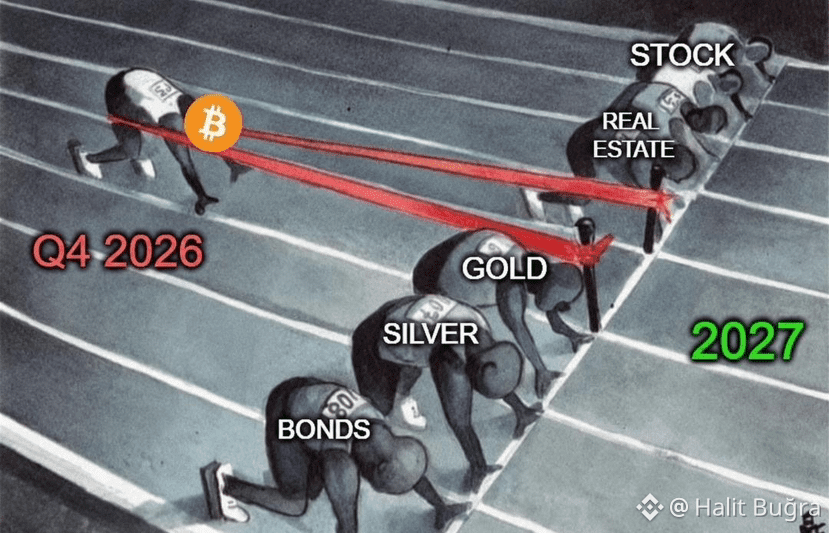
BULL MARKET 2027 COULD CHANGE THE RACE COMPLETELY.
Bitcoin appears ready to break away from the pack while stocks, real estate, gold, silver, and bonds fight to keep pace.
The message behind this image is clear: traditional assets may have their moments, but Bitcoin could enter 2027 carrying much stronger momentum.
If capital starts rotating toward risk assets and crypto liquidity expands, Bitcoin could become one of the biggest stories of the next market cycle.
Nothing moves in a straight line, though. Corrections, volatility, macro conditions, and investor sentiment can quickly reshape the race.
2027 could be a year worth watching closely.
DYOR…
BULL MARKET 2027 COULD CHANGE THE RACE COMPLETELY.
Bitcoin appears ready to break away from the pack while stocks, real estate, gold, silver, and bonds fight to keep pace.
The message behind this image is clear: traditional assets may have their moments, but Bitcoin could enter 2027 carrying much stronger momentum.
If capital starts rotating toward risk assets and crypto liquidity expands, Bitcoin could become one of the biggest stories of the next market cycle.
Nothing moves in a straight line, though. Corrections, volatility, macro conditions, and investor sentiment can quickly reshape the race.
2027 could be a year worth watching closely.
DYOR…
Bitcoin appears ready to break away from the pack while stocks, real estate, gold, silver, and bonds fight to keep pace.
The message behind this image is clear: traditional assets may have their moments, but Bitcoin could enter 2027 carrying much stronger momentum.
If capital starts rotating toward risk assets and crypto liquidity expands, Bitcoin could become one of the biggest stories of the next market cycle.
Nothing moves in a straight line, though. Corrections, volatility, macro conditions, and investor sentiment can quickly reshape the race.
2027 could be a year worth watching closely.
DYOR…
2
317
·
--
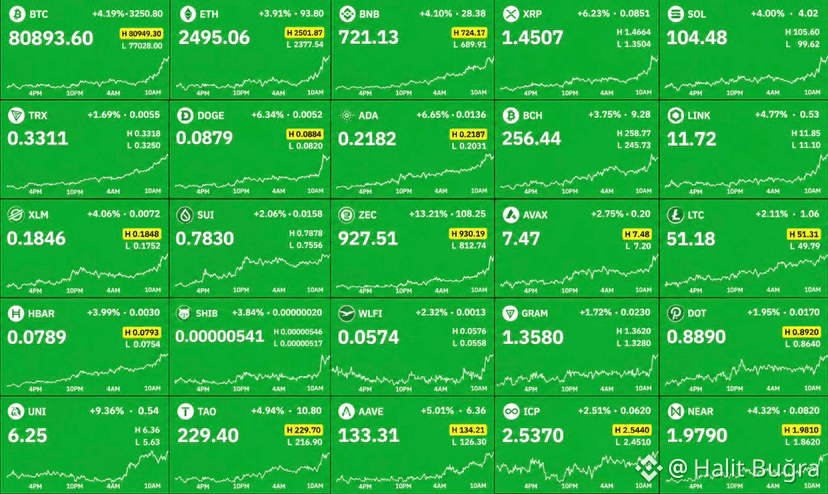
🚨 BREAKING: $125 BILLION FLOODS INTO THE CRYPTO MARKET AS BITCOIN SMASHES THROUGH $81,000!
The crypto market just witnessed a powerful wave of fresh capital, with roughly $125,000,000,000 added to total market value as Bitcoin surged to $81K.
The rapid move caught leveraged traders on the wrong side of the market, triggering another aggressive short squeeze.
In just 60 minutes, more than $150 MILLION worth of leveraged positions were liquidated, adding even more fuel to the volatility.
And Bitcoin isn’t moving alone.
Ethereum, BNB, XRP, Solana, Dogecoin, Cardano and several other major altcoins are flashing green as buying pressure spreads across the broader market.
When shorts are forced to close, they have to buy back into the market — which can accelerate an already fast rally and create a cascade of liquidations.
BTC reclaiming $81K + billions flowing back into crypto + heavy short liquidations = momentum is heating up fast.
Now the big question:
Is this just another short squeeze… or the beginning of a much bigger crypto breakout? 👀🔥
🚨 BREAKING: $125 BILLION FLOODS INTO THE CRYPTO MARKET AS BITCOIN SMASHES THROUGH $81,000!
The crypto market just witnessed a powerful wave of fresh capital, with roughly $125,000,000,000 added to total market value as Bitcoin surged to $81K.
The rapid move caught leveraged traders on the wrong side of the market, triggering another aggressive short squeeze.
In just 60 minutes, more than $150 MILLION worth of leveraged positions were liquidated, adding even more fuel to the volatility.
And Bitcoin isn’t moving alone.
Ethereum, BNB, XRP, Solana, Dogecoin, Cardano and several other major altcoins are flashing green as buying pressure spreads across the broader market.
When shorts are forced to close, they have to buy back into the market — which can accelerate an already fast rally and create a cascade of liquidations.
BTC reclaiming $81K + billions flowing back into crypto + heavy short liquidations = momentum is heating up fast.
Now the big question:
Is this just another short squeeze… or the beginning of a much bigger crypto breakout? 👀🔥
The crypto market just witnessed a powerful wave of fresh capital, with roughly $125,000,000,000 added to total market value as Bitcoin surged to $81K.
The rapid move caught leveraged traders on the wrong side of the market, triggering another aggressive short squeeze.
In just 60 minutes, more than $150 MILLION worth of leveraged positions were liquidated, adding even more fuel to the volatility.
And Bitcoin isn’t moving alone.
Ethereum, BNB, XRP, Solana, Dogecoin, Cardano and several other major altcoins are flashing green as buying pressure spreads across the broader market.
When shorts are forced to close, they have to buy back into the market — which can accelerate an already fast rally and create a cascade of liquidations.
BTC reclaiming $81K + billions flowing back into crypto + heavy short liquidations = momentum is heating up fast.
Now the big question:
Is this just another short squeeze… or the beginning of a much bigger crypto breakout? 👀🔥
9
11
772
·
--
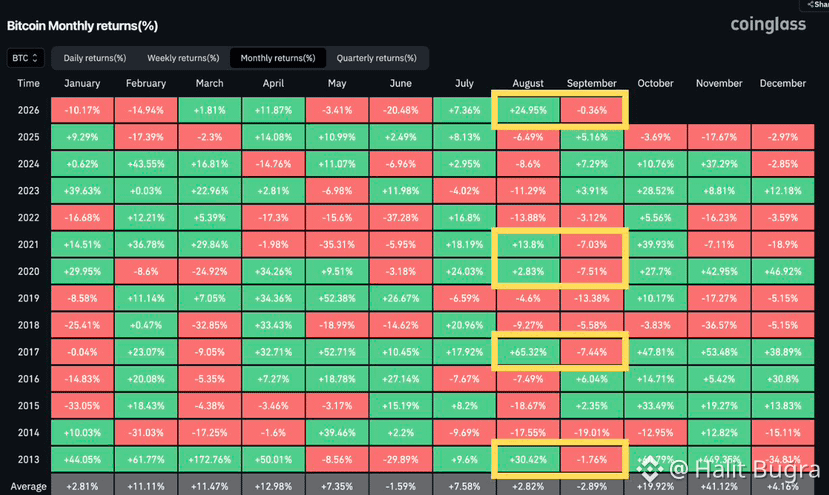
BITCOIN IS ENTERING SEPTEMBER WITH HISTORY WORKING AGAINST IT.
Every time Bitcoin has managed to close August in the green, September has historically had a strong tendency to reverse the momentum and finish in the red.
That makes the current setup especially interesting.
August strength suggests buyers were willing to absorb selling pressure, but September has long carried a reputation as one of Bitcoin’s more difficult months.
Now the market faces another test.
If $BTC follows the historical pattern, August’s bullish close could turn into a September pullback, with traders potentially taking profits and liquidity getting tested below current levels.
But if Bitcoin breaks the pattern and closes September green, the signal could be much more important.
It would show that current demand is strong enough to overcome a seasonal trend traders have been watching for years — potentially strengthening the case for continued momentum into Q4.
History favors caution.
The market is trying to rewrite history.
Will September punish Bitcoin bulls again, or is this finally the year BTC breaks the cycle?
BITCOIN IS ENTERING SEPTEMBER WITH HISTORY WORKING AGAINST IT.
Every time Bitcoin has managed to close August in the green, September has historically had a strong tendency to reverse the momentum and finish in the red.
That makes the current setup especially interesting.
August strength suggests buyers were willing to absorb selling pressure, but September has long carried a reputation as one of Bitcoin’s more difficult months.
Now the market faces another test.
If $BTC follows the historical pattern, August’s bullish close could turn into a September pullback, with traders potentially taking profits and liquidity getting tested below current levels.
But if Bitcoin breaks the pattern and closes September green, the signal could be much more important.
It would show that current demand is strong enough to overcome a seasonal trend traders have been watching for years — potentially strengthening the case for continued momentum into Q4.
History favors caution.
The market is trying to rewrite history.
Will September punish Bitcoin bulls again, or is this finally the year BTC breaks the cycle?
Every time Bitcoin has managed to close August in the green, September has historically had a strong tendency to reverse the momentum and finish in the red.
That makes the current setup especially interesting.
August strength suggests buyers were willing to absorb selling pressure, but September has long carried a reputation as one of Bitcoin’s more difficult months.
Now the market faces another test.
If $BTC follows the historical pattern, August’s bullish close could turn into a September pullback, with traders potentially taking profits and liquidity getting tested below current levels.
But if Bitcoin breaks the pattern and closes September green, the signal could be much more important.
It would show that current demand is strong enough to overcome a seasonal trend traders have been watching for years — potentially strengthening the case for continued momentum into Q4.
History favors caution.
The market is trying to rewrite history.
Will September punish Bitcoin bulls again, or is this finally the year BTC breaks the cycle?
9
10
206
·
--
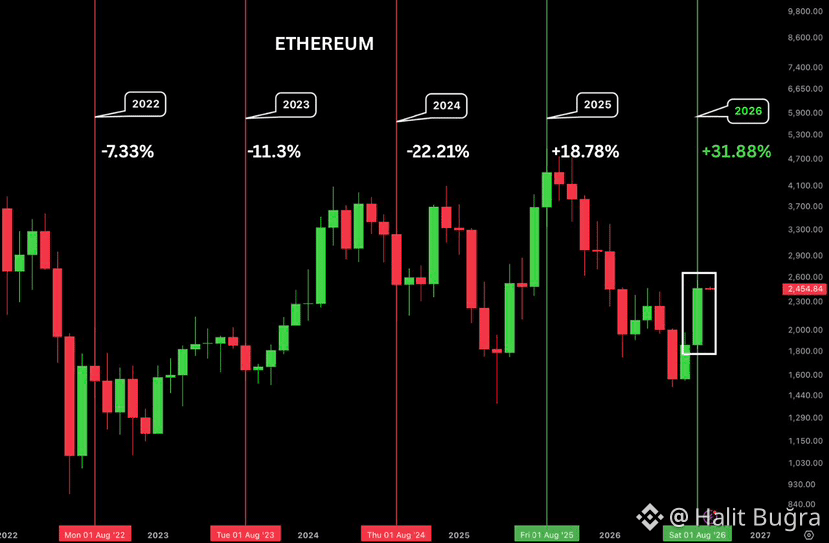
ETHEREUM JUST PULLED OFF ITS STRONGEST AUGUST IN 4 YEARS.
August has usually been a rough month for ETH.
2022: -7.33%
2023: -11.30%
2024: -22.21%
2025: +18.78%
But 2026 completely changed the picture.
ETH closed August +31.88%, marking a huge shift from the weakness we saw in previous years.
What stands out isn’t just the number — it’s the change in momentum. After spending months under pressure, buyers stepped in aggressively and turned August into a breakout month.
Now comes the important part.
Can ETH carry this strength into September, or was August the big move everyone was waiting for?
Either way, +31.88% in a single month is hard to ignore.
$ETH is showing real strength again. 👀
ETHEREUM JUST PULLED OFF ITS STRONGEST AUGUST IN 4 YEARS.
August has usually been a rough month for ETH.
2022: -7.33%
2023: -11.30%
2024: -22.21%
2025: +18.78%
But 2026 completely changed the picture.
ETH closed August +31.88%, marking a huge shift from the weakness we saw in previous years.
What stands out isn’t just the number — it’s the change in momentum. After spending months under pressure, buyers stepped in aggressively and turned August into a breakout month.
Now comes the important part.
Can ETH carry this strength into September, or was August the big move everyone was waiting for?
Either way, +31.88% in a single month is hard to ignore.
$ETH is showing real strength again. 👀
August has usually been a rough month for ETH.
2022: -7.33%
2023: -11.30%
2024: -22.21%
2025: +18.78%
But 2026 completely changed the picture.
ETH closed August +31.88%, marking a huge shift from the weakness we saw in previous years.
What stands out isn’t just the number — it’s the change in momentum. After spending months under pressure, buyers stepped in aggressively and turned August into a breakout month.
Now comes the important part.
Can ETH carry this strength into September, or was August the big move everyone was waiting for?
Either way, +31.88% in a single month is hard to ignore.
$ETH is showing real strength again. 👀
9
12
365
·
--
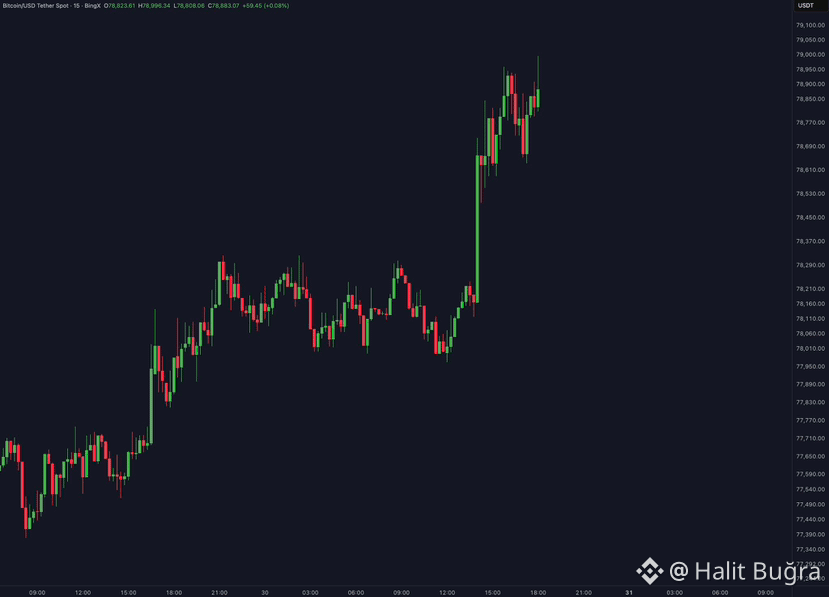
BITCOIN JUST HIT $79,000. 💥
BTC is showing serious strength as momentum continues to build across the market.
The $79K zone is now a key level to watch. Holding above it could open the door toward $80K and potentially trigger another wave of market momentum.
Volatility is rising, traders are watching closely, and the next few moves could define Bitcoin’s short-term direction.
All eyes on BTC. 👀🔥
BITCOIN JUST HIT $79,000. 💥
BTC is showing serious strength as momentum continues to build across the market.
The $79K zone is now a key level to watch. Holding above it could open the door toward $80K and potentially trigger another wave of market momentum.
Volatility is rising, traders are watching closely, and the next few moves could define Bitcoin’s short-term direction.
All eyes on BTC. 👀🔥
BTC is showing serious strength as momentum continues to build across the market.
The $79K zone is now a key level to watch. Holding above it could open the door toward $80K and potentially trigger another wave of market momentum.
Volatility is rising, traders are watching closely, and the next few moves could define Bitcoin’s short-term direction.
All eyes on BTC. 👀🔥
7
8
406
·
--
SOMEONE IS ABOUT TO LOSE EVERYTHING?
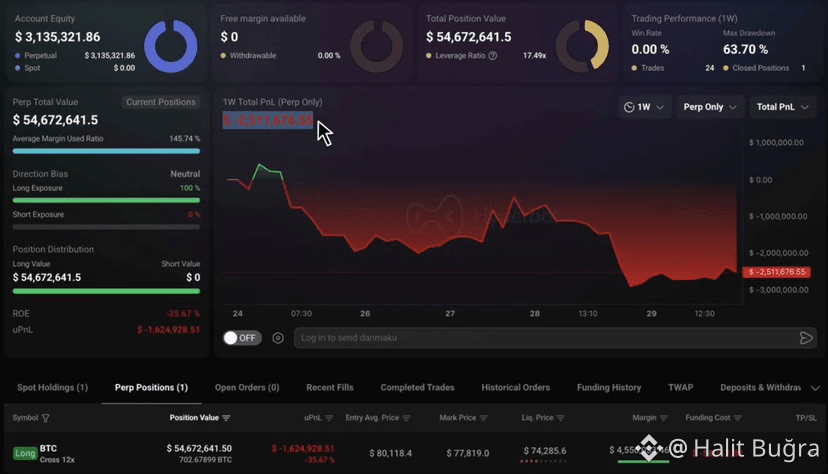
A massive $54.73 MILLION Bitcoin long position is now under serious pressure.
Entry price: $80,118
The position is already sitting on an unrealized loss of roughly $1.56 MILLION.
The critical number is $74,286 — the reported liquidation level.
If Bitcoin keeps dropping toward that zone, this trade could turn into a brutal liquidation event.
With this much capital on the line, every move matters now.
One position. Tens of millions exposed. A liquidation level getting dangerously close.
Bitcoin volatility could make the next move extremely interesting.
SOMEONE IS ABOUT TO LOSE EVERYTHING?
A massive $54.73 MILLION Bitcoin long position is now under serious pressure.
Entry price: $80,118
The position is already sitting on an unrealized loss of roughly $1.56 MILLION.
The critical number is $74,286 — the reported liquidation level.
If Bitcoin keeps dropping toward that zone, this trade could turn into a brutal liquidation event.
With this much capital on the line, every move matters now.
One position. Tens of millions exposed. A liquidation level getting dangerously close.
Bitcoin volatility could make the next move extremely interesting.
A massive $54.73 MILLION Bitcoin long position is now under serious pressure.
Entry price: $80,118
The position is already sitting on an unrealized loss of roughly $1.56 MILLION.
The critical number is $74,286 — the reported liquidation level.
If Bitcoin keeps dropping toward that zone, this trade could turn into a brutal liquidation event.
With this much capital on the line, every move matters now.
One position. Tens of millions exposed. A liquidation level getting dangerously close.
Bitcoin volatility could make the next move extremely interesting.
7
9
340
·
--
Partly True
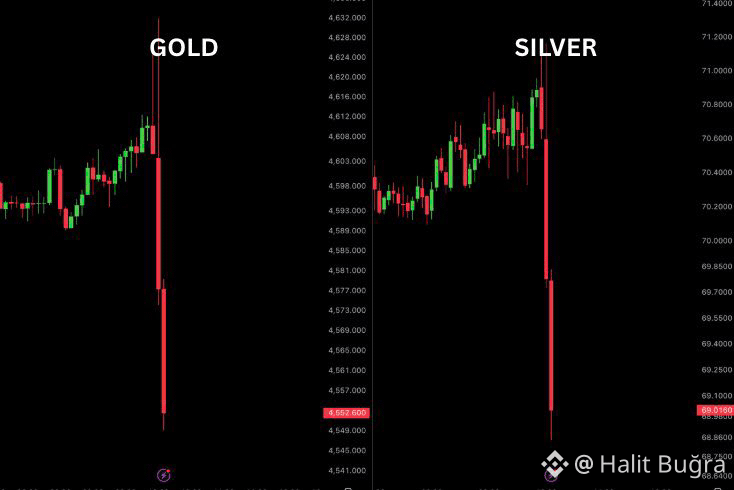
GOLD AND SILVER JUST SAW A MASSIVE DUMP.
$670 billion reportedly wiped out in just 7 minutes.
Selling pressure hit both precious metals aggressively, creating a huge liquidity flush.
Gold and silver are normally considered defensive assets, so a move this sharp deserves attention.
If buyers absorb the sell-off quickly, we could see a strong recovery.
But if key support levels break, another wave of selling could follow.
Watch the dollar, bonds, and equities closely.
Volatility is rising fast…
GOLD AND SILVER JUST SAW A MASSIVE DUMP.
$670 billion reportedly wiped out in just 7 minutes.
Selling pressure hit both precious metals aggressively, creating a huge liquidity flush.
Gold and silver are normally considered defensive assets, so a move this sharp deserves attention.
If buyers absorb the sell-off quickly, we could see a strong recovery.
But if key support levels break, another wave of selling could follow.
Watch the dollar, bonds, and equities closely.
Volatility is rising fast…
$670 billion reportedly wiped out in just 7 minutes.
Selling pressure hit both precious metals aggressively, creating a huge liquidity flush.
Gold and silver are normally considered defensive assets, so a move this sharp deserves attention.
If buyers absorb the sell-off quickly, we could see a strong recovery.
But if key support levels break, another wave of selling could follow.
Watch the dollar, bonds, and equities closely.
Volatility is rising fast…
7
8
938
Log in to explore more content
Join global crypto users on Binance Square
⚡️ Get latest and useful information about crypto.
💬 Trusted by the world’s largest crypto exchange.
👍 Discover real insights from verified creators.
Email / Phone number
Trending Topics
OstiumLoanDisputeHearingSetInNYFederalCourt
24 views
10 Discussing
#OstiumLoanDisputeHearingSetInNYFederalCourt
🚨 BREAKING: Ostium $15M Loan Dispute Hits NY Court TODAY
New York federal court is hearing a $15M loan case against on-chain perp exchange Ostium.
Plaintiffs want assets frozen + forced arbitration after Ostium lost $23.75M in a July hack.
Defendants include the Foundation, Labs, and CEO Kaledora Kiernan-Linn.
This double blow — a $23.75M hack plus a $15M loan fight — shows how quickly $DEFI platforms can face real legal pressure. Lenders are getting aggressive. Security and clear structures are no longer optional if projects want to survive these storms.
Will Ostium make it through? Drop your take 👇
#Ostium #CryptoNews #DeFi #BinanceSquare
$DEFI
A_K Crypto
·0 Likes
·2 views
SKPoliceRefer18PolymarketUsersToProsecutors
1,290 views
91 Discussing
FedSEPProjects2026RateAt4.1%
3,573 views
147 Discussing