
goldenbit
316 Posts

goldenbit
Report
Block User
Разбираю движения цены, объём и фандинг на Binance. Показываю, что подтверждает сценарий и что его отменит. Здесь важен контекст, а не громкие прогнозы.
0 Following
32 Followers
49 Liked
Posts
All
Quotes
·
--
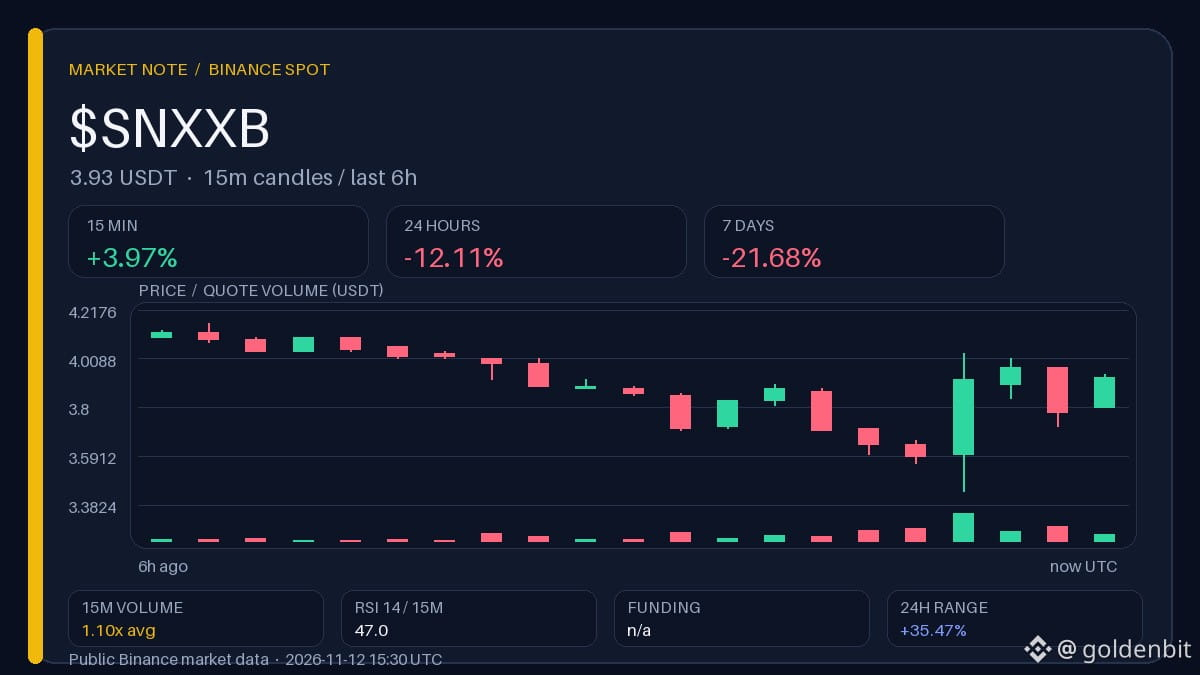
$SNXXB: down on the day, but up over the last 15 minutes
A brief bounce amid a daily loss isn’t a reversal yet—it’s a test of whether it has legs. Up 3.97% over 15 minutes on volume just ×1.1 the usual level, while the 24-hour change remains −12.11% and the weekly change −21.68%.
• $SNXXB: −12.11% in 24h · +3.97% in 15m · funding n/a
• $ERA: +15.37% in 24h · +2.15% in 15m · funding −0.108%
• $NVDAB: −5.54% in 24h · +1.86% in 15m · funding n/a
What to watch next: 15-minute volume—does it rise along with the price, or does the bounce remain thin?
What would need to change in volume for the bounce to stop looking technical?
Binance data, snapshot at 15:30 UTC. The author may receive a reward through Binance Square Write to Earn.
$SNXXB : down on the day, but up over the last 15 minutes
A brief bounce amid a daily loss isn’t a reversal yet—it’s a test of whether it has legs. Up 3.97% over 15 minutes on volume just ×1.1 the usual level, while the 24-hour change remains −12.11% and the weekly change −21.68%.
• $SNXXB : −12.11% in 24h · +3.97% in 15m · funding n/a
• $ERA : +15.37% in 24h · +2.15% in 15m · funding −0.108%
• $NVDAB : −5.54% in 24h · +1.86% in 15m · funding n/a
What to watch next: 15-minute volume—does it rise along with the price, or does the bounce remain thin?
What would need to change in volume for the bounce to stop looking technical?
Binance data, snapshot at 15:30 UTC. The author may receive a reward through Binance Square Write to Earn.
A brief bounce amid a daily loss isn’t a reversal yet—it’s a test of whether it has legs. Up 3.97% over 15 minutes on volume just ×1.1 the usual level, while the 24-hour change remains −12.11% and the weekly change −21.68%.
• $SNXXB : −12.11% in 24h · +3.97% in 15m · funding n/a
• $ERA : +15.37% in 24h · +2.15% in 15m · funding −0.108%
• $NVDAB : −5.54% in 24h · +1.86% in 15m · funding n/a
What to watch next: 15-minute volume—does it rise along with the price, or does the bounce remain thin?
What would need to change in volume for the bounce to stop looking technical?
Binance data, snapshot at 15:30 UTC. The author may receive a reward through Binance Square Write to Earn.
2
·
--
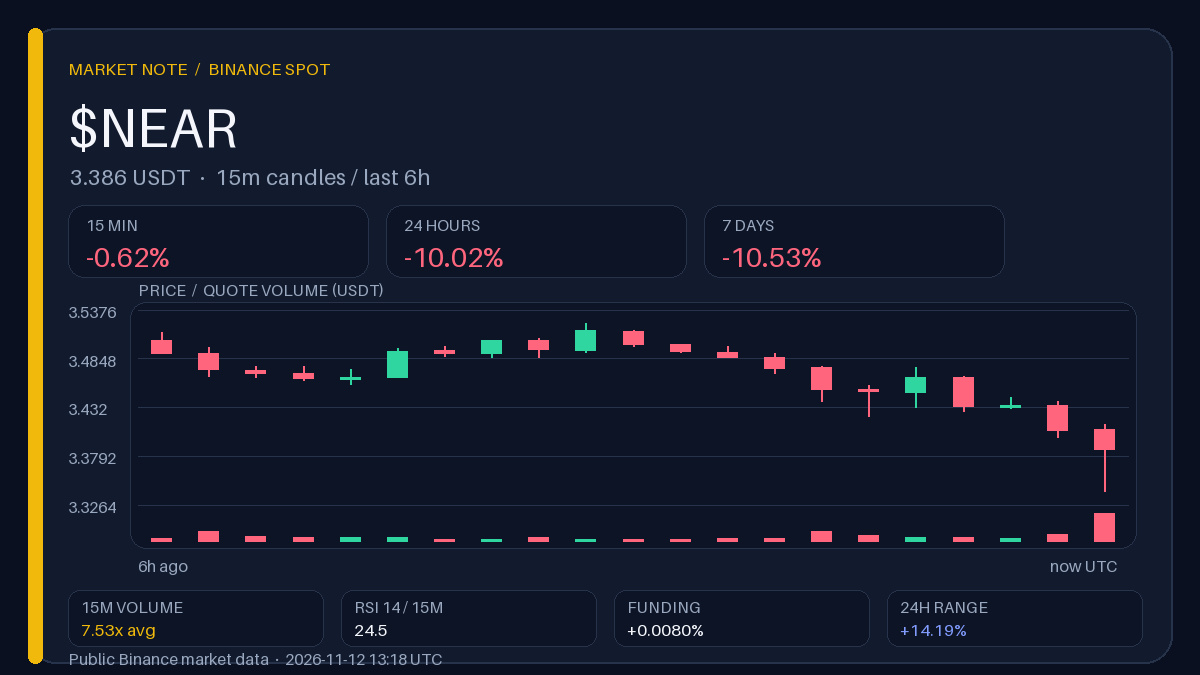
$NEAR: volume ×7.53 on the 15-minute chart, but buyers aren’t rushing in
The volume spike came during a decline, not a rebound—the momentum is still working against the price, not in its favor. Down 10.02% over 24 hours and 10.53% over the week: the brief volume spike didn’t reverse the downtrend, but only intensified its pace.
Observation range · 5 h
Above 3.5230: A hold above the upper boundary of the local range would call the current hypothesis of selling pressure into question.
Below 3.3410: A return to the lower boundary while volume remains elevated would confirm that the spike was a continuation of the decline, not a reversal.
These are historical levels; a single wick does not confirm a scenario.
If volume remains elevated while the price stops making new lows, what would that say about the balance between sellers and buyers?
Data from Binance, snapshot at 13:18 UTC. The author may receive rewards through Binance Square Write to Earn.
$NEAR : volume ×7.53 on the 15-minute chart, but buyers aren’t rushing in
The volume spike came during a decline, not a rebound—the momentum is still working against the price, not in its favor. Down 10.02% over 24 hours and 10.53% over the week: the brief volume spike didn’t reverse the downtrend, but only intensified its pace.
Observation range · 5 h
Above 3.5230: A hold above the upper boundary of the local range would call the current hypothesis of selling pressure into question.
Below 3.3410: A return to the lower boundary while volume remains elevated would confirm that the spike was a continuation of the decline, not a reversal.
These are historical levels; a single wick does not confirm a scenario.
If volume remains elevated while the price stops making new lows, what would that say about the balance between sellers and buyers?
Data from Binance, snapshot at 13:18 UTC. The author may receive rewards through Binance Square Write to Earn.
The volume spike came during a decline, not a rebound—the momentum is still working against the price, not in its favor. Down 10.02% over 24 hours and 10.53% over the week: the brief volume spike didn’t reverse the downtrend, but only intensified its pace.
Observation range · 5 h
Above 3.5230: A hold above the upper boundary of the local range would call the current hypothesis of selling pressure into question.
Below 3.3410: A return to the lower boundary while volume remains elevated would confirm that the spike was a continuation of the decline, not a reversal.
These are historical levels; a single wick does not confirm a scenario.
If volume remains elevated while the price stops making new lows, what would that say about the balance between sellers and buyers?
Data from Binance, snapshot at 13:18 UTC. The author may receive rewards through Binance Square Write to Earn.
5
·
--
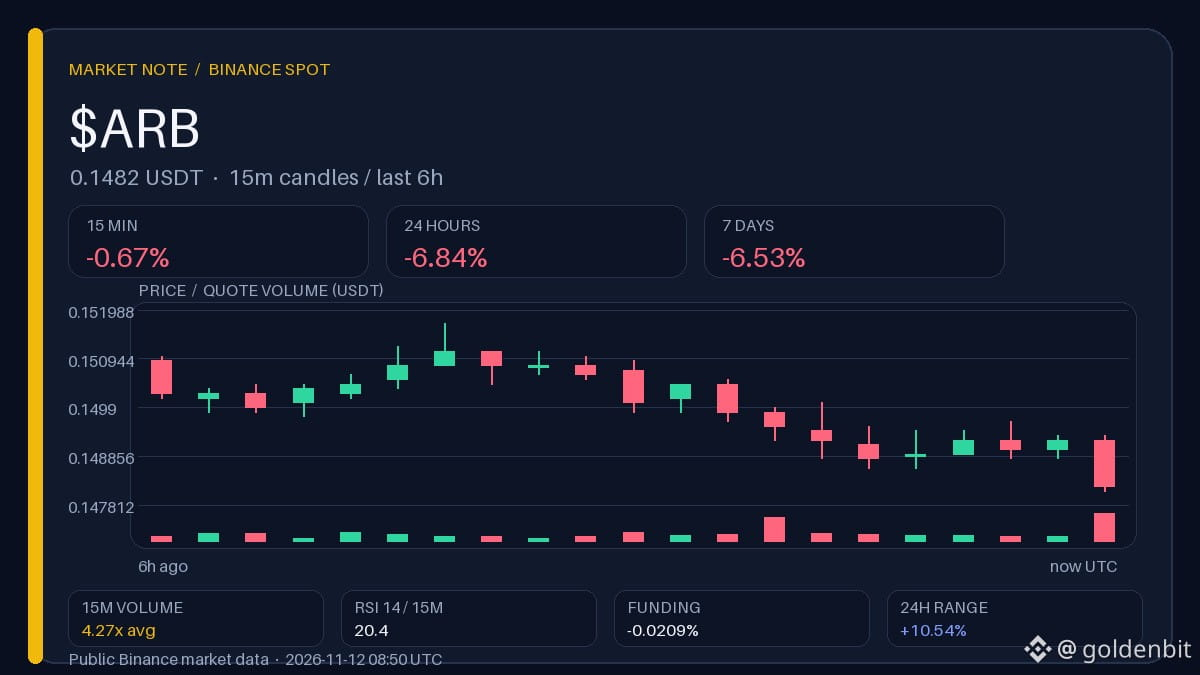
$ARB: Volume ×4.27 on the way down — buyers haven’t shown up yet
The volume spike at the lower end of the range is working against the price for now, not in its favor. Over 15 minutes, price −0.67%; over 24 hours, −6.84%; RSI 20.4. Volume rose, but buyers have not taken control of the move.
Observation range · 5 h
Above 0.151700: A hold above the upper boundary of the local range would weaken the interpretation of the spike as selling pressure.
Below 0.148100: A move back below the lower boundary would confirm that volume is accompanying the decline, not a reversal.
Historical levels; a single wick does not confirm the scenario.
↩️ Previous “Contrast Radar” edition recap (11.11 01:05 UTC): ARB 0.161500 → 0.160500 USDT (−0.62% over 12 h), funding −0.007% → 0.000%.
What would need to change in price and funding for the volume spike to stop reading as a continuation of the decline?
Binance data, snapshot at 08:50 UTC. The author may receive rewards through Binance Square Write to Earn.
$ARB : Volume ×4.27 on the way down — buyers haven’t shown up yet
The volume spike at the lower end of the range is working against the price for now, not in its favor. Over 15 minutes, price −0.67%; over 24 hours, −6.84%; RSI 20.4. Volume rose, but buyers have not taken control of the move.
Observation range · 5 h
Above 0.151700: A hold above the upper boundary of the local range would weaken the interpretation of the spike as selling pressure.
Below 0.148100: A move back below the lower boundary would confirm that volume is accompanying the decline, not a reversal.
Historical levels; a single wick does not confirm the scenario.
↩️ Previous “Contrast Radar” edition recap (11.11 01:05 UTC): ARB 0.161500 → 0.160500 USDT (−0.62% over 12 h), funding −0.007% → 0.000%.
What would need to change in price and funding for the volume spike to stop reading as a continuation of the decline?
Binance data, snapshot at 08:50 UTC. The author may receive rewards through Binance Square Write to Earn.
The volume spike at the lower end of the range is working against the price for now, not in its favor. Over 15 minutes, price −0.67%; over 24 hours, −6.84%; RSI 20.4. Volume rose, but buyers have not taken control of the move.
Observation range · 5 h
Above 0.151700: A hold above the upper boundary of the local range would weaken the interpretation of the spike as selling pressure.
Below 0.148100: A move back below the lower boundary would confirm that volume is accompanying the decline, not a reversal.
Historical levels; a single wick does not confirm the scenario.
↩️ Previous “Contrast Radar” edition recap (11.11 01:05 UTC): ARB 0.161500 → 0.160500 USDT (−0.62% over 12 h), funding −0.007% → 0.000%.
What would need to change in price and funding for the volume spike to stop reading as a continuation of the decline?
Binance data, snapshot at 08:50 UTC. The author may receive rewards through Binance Square Write to Earn.
·
--
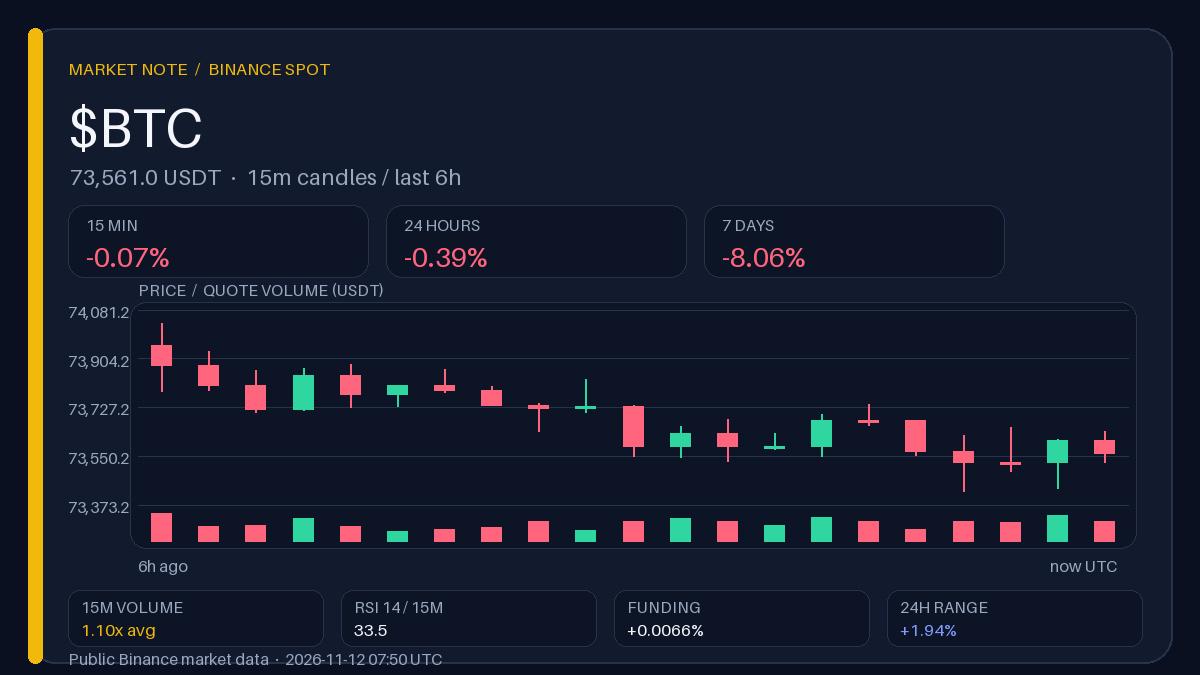
$BTC: Weekly decline and Canaan’s plans to sell coins — one fact, two interpretations
The public news about a miner possibly selling bitcoin can be read in two ways, and the market has yet to choose between them. Over 7 days, the price fell 8.06%, but the 24-hour change was only −0.39% with 15-minute volume at ×1.1: the reaction is restrained, not confirmed.
Observation range · 5 h
Above 74 032,33: A move above the upper boundary of the local range would weaken the case for selling pressure from the miner.
Below 73 422,00: A return to the lower boundary on rising volume would strengthen the case that the market is pricing in additional supply.
These are historical levels; a single wick does not confirm a scenario.
🗞 News: CoinDesk.
↩️ Recap of the previous “News and Numbers” edition (11.11 16:36 UTC): BTC 74 317,79 → 73 727,00 USDT (−0.79% over 12 h), funding +0.006% → +0.008%.
What will distinguish these interpretations: an acceleration in ETF outflows, or a return in price to the upper boundary of the local range?
Binance data, snapshot at 07:50 UTC. The author may receive rewards through Binance Square Write to Earn.
$BTC : Weekly decline and Canaan’s plans to sell coins — one fact, two interpretations
The public news about a miner possibly selling bitcoin can be read in two ways, and the market has yet to choose between them. Over 7 days, the price fell 8.06%, but the 24-hour change was only −0.39% with 15-minute volume at ×1.1: the reaction is restrained, not confirmed.
Observation range · 5 h
Above 74 032,33: A move above the upper boundary of the local range would weaken the case for selling pressure from the miner.
Below 73 422,00: A return to the lower boundary on rising volume would strengthen the case that the market is pricing in additional supply.
These are historical levels; a single wick does not confirm a scenario.
🗞 News: CoinDesk.
↩️ Recap of the previous “News and Numbers” edition (11.11 16:36 UTC): BTC 74 317,79 → 73 727,00 USDT (−0.79% over 12 h), funding +0.006% → +0.008%.
What will distinguish these interpretations: an acceleration in ETF outflows, or a return in price to the upper boundary of the local range?
Binance data, snapshot at 07:50 UTC. The author may receive rewards through Binance Square Write to Earn.
The public news about a miner possibly selling bitcoin can be read in two ways, and the market has yet to choose between them. Over 7 days, the price fell 8.06%, but the 24-hour change was only −0.39% with 15-minute volume at ×1.1: the reaction is restrained, not confirmed.
Observation range · 5 h
Above 74 032,33: A move above the upper boundary of the local range would weaken the case for selling pressure from the miner.
Below 73 422,00: A return to the lower boundary on rising volume would strengthen the case that the market is pricing in additional supply.
These are historical levels; a single wick does not confirm a scenario.
🗞 News: CoinDesk.
↩️ Recap of the previous “News and Numbers” edition (11.11 16:36 UTC): BTC 74 317,79 → 73 727,00 USDT (−0.79% over 12 h), funding +0.006% → +0.008%.
What will distinguish these interpretations: an acceleration in ETF outflows, or a return in price to the upper boundary of the local range?
Binance data, snapshot at 07:50 UTC. The author may receive rewards through Binance Square Write to Earn.
·
--
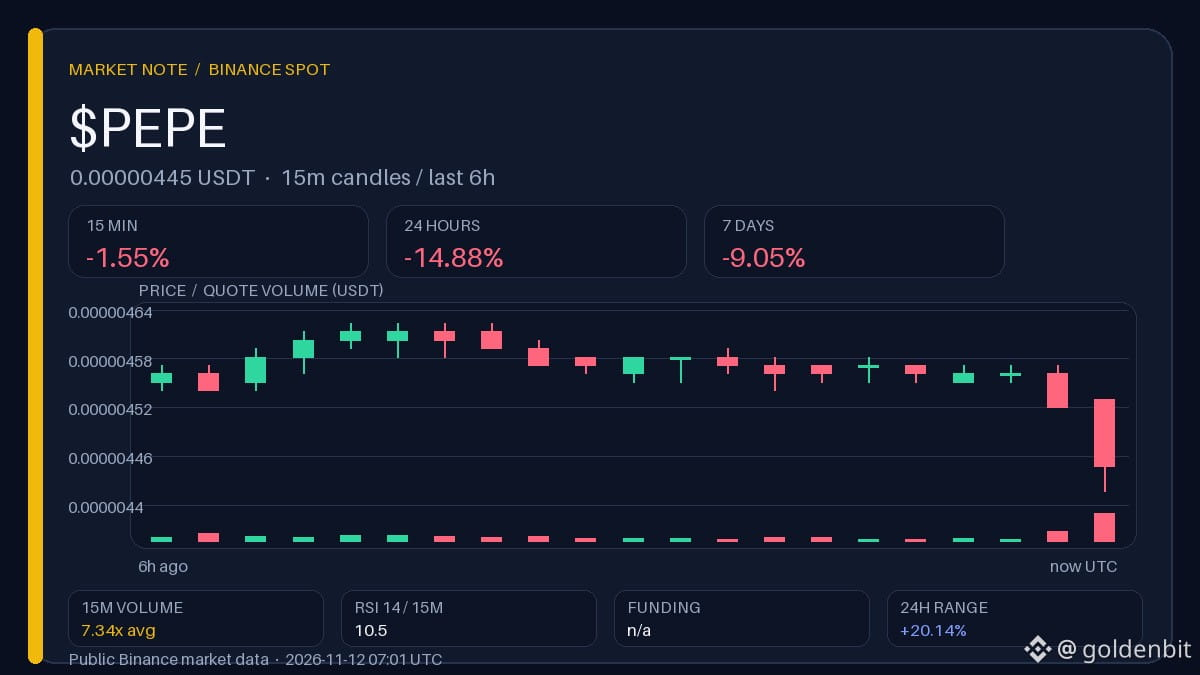
$PEPE: Volume ×7.34 clashes with price near the lower bound
A volume spike during a decline allows for two interpretations — seller capitulation or continued pressure; the price has yet to choose a side. Over 15 minutes, volume is 7.34 times the average, but the price is down 1.55%, while the daily change is −14.88% — there’s volume, but no rebound.
Observation range · 5 h
Above 0.000005: A hold above the range’s upper bound on volume would support the seller capitulation thesis.
Below 0.000004: A move back below the lower bound with fresh volume would strengthen the case for continued pressure.
Historical levels; a single wick does not confirm a scenario.
↩️ Recap of the previous “Volume Radar” issue (Nov 11, 09:16 UTC): PEPE 0.000005 → 0.000005 USDT (−6.00% over 12 h).
What would need to change in the relationship between volume and price for the spike to stop looking like a continuation of the sell-off?
Binance data, snapshot at 07:01 UTC. The author may receive a reward through Binance Square Write to Earn.
$PEPE : Volume ×7.34 clashes with price near the lower bound
A volume spike during a decline allows for two interpretations — seller capitulation or continued pressure; the price has yet to choose a side. Over 15 minutes, volume is 7.34 times the average, but the price is down 1.55%, while the daily change is −14.88% — there’s volume, but no rebound.
Observation range · 5 h
Above 0.000005: A hold above the range’s upper bound on volume would support the seller capitulation thesis.
Below 0.000004: A move back below the lower bound with fresh volume would strengthen the case for continued pressure.
Historical levels; a single wick does not confirm a scenario.
↩️ Recap of the previous “Volume Radar” issue (Nov 11, 09:16 UTC): PEPE 0.000005 → 0.000005 USDT (−6.00% over 12 h).
What would need to change in the relationship between volume and price for the spike to stop looking like a continuation of the sell-off?
Binance data, snapshot at 07:01 UTC. The author may receive a reward through Binance Square Write to Earn.
A volume spike during a decline allows for two interpretations — seller capitulation or continued pressure; the price has yet to choose a side. Over 15 minutes, volume is 7.34 times the average, but the price is down 1.55%, while the daily change is −14.88% — there’s volume, but no rebound.
Observation range · 5 h
Above 0.000005: A hold above the range’s upper bound on volume would support the seller capitulation thesis.
Below 0.000004: A move back below the lower bound with fresh volume would strengthen the case for continued pressure.
Historical levels; a single wick does not confirm a scenario.
↩️ Recap of the previous “Volume Radar” issue (Nov 11, 09:16 UTC): PEPE 0.000005 → 0.000005 USDT (−6.00% over 12 h).
What would need to change in the relationship between volume and price for the spike to stop looking like a continuation of the sell-off?
Binance data, snapshot at 07:01 UTC. The author may receive a reward through Binance Square Write to Earn.
3
·
--
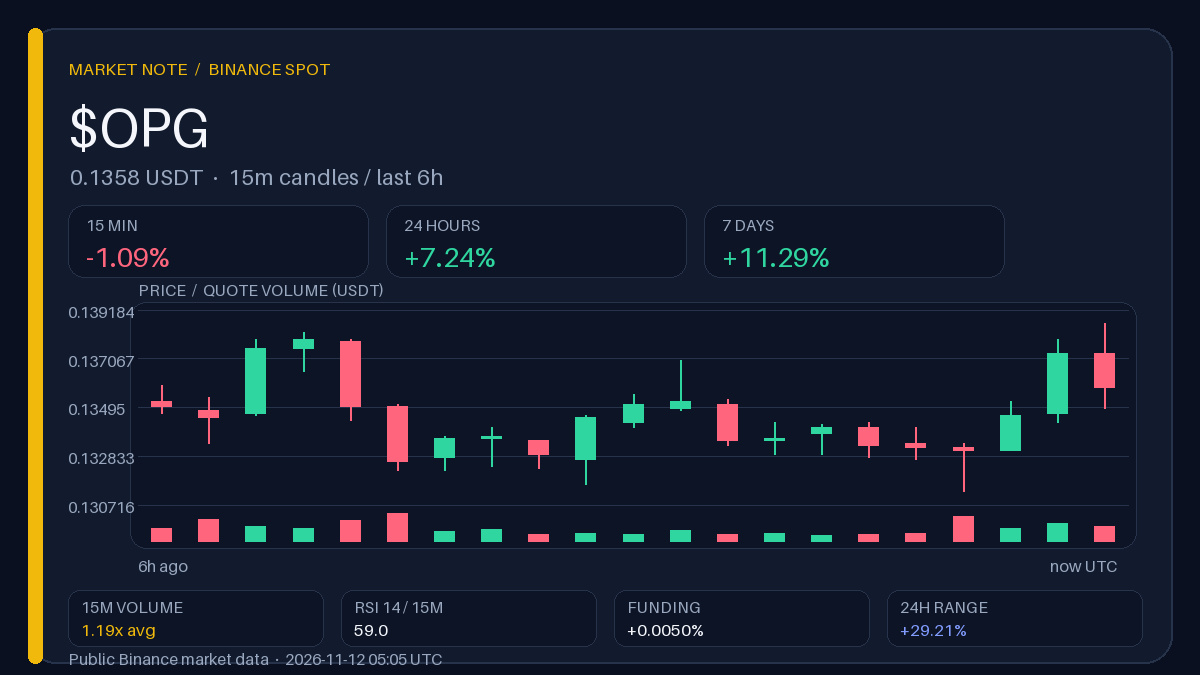
$OPG: up over 24 hours, but the last 15 minutes are telling a different story
The daily gain looks more convincing than the volume confirms: a brief pullback is not a reversal yet, but it is not noise by default either. 15-minute volume is just ×1.19 of normal—at this level of participation, a 1.09% drop looks more like a pause than a change in direction; funding at +0.005% hints at a moderate long bias.
Observation range · 5 h
Above 0.138600: A hold above the upper boundary of the local range would support the case for the daily momentum continuing.
Below 0.131300: A return to the lower boundary of the range would call the sustainability of the 24-hour gain into question.
These are historical levels; a single wick does not confirm a scenario.
What would need to change in volume for the pullback to stop looking like a pause in the uptrend?
Binance data, snapshot at 05:05 UTC. The author may receive rewards through Binance Square Write to Earn.
$OPG : up over 24 hours, but the last 15 minutes are telling a different story
The daily gain looks more convincing than the volume confirms: a brief pullback is not a reversal yet, but it is not noise by default either. 15-minute volume is just ×1.19 of normal—at this level of participation, a 1.09% drop looks more like a pause than a change in direction; funding at +0.005% hints at a moderate long bias.
Observation range · 5 h
Above 0.138600: A hold above the upper boundary of the local range would support the case for the daily momentum continuing.
Below 0.131300: A return to the lower boundary of the range would call the sustainability of the 24-hour gain into question.
These are historical levels; a single wick does not confirm a scenario.
What would need to change in volume for the pullback to stop looking like a pause in the uptrend?
Binance data, snapshot at 05:05 UTC. The author may receive rewards through Binance Square Write to Earn.
The daily gain looks more convincing than the volume confirms: a brief pullback is not a reversal yet, but it is not noise by default either. 15-minute volume is just ×1.19 of normal—at this level of participation, a 1.09% drop looks more like a pause than a change in direction; funding at +0.005% hints at a moderate long bias.
Observation range · 5 h
Above 0.138600: A hold above the upper boundary of the local range would support the case for the daily momentum continuing.
Below 0.131300: A return to the lower boundary of the range would call the sustainability of the 24-hour gain into question.
These are historical levels; a single wick does not confirm a scenario.
What would need to change in volume for the pullback to stop looking like a pause in the uptrend?
Binance data, snapshot at 05:05 UTC. The author may receive rewards through Binance Square Write to Earn.
·
--
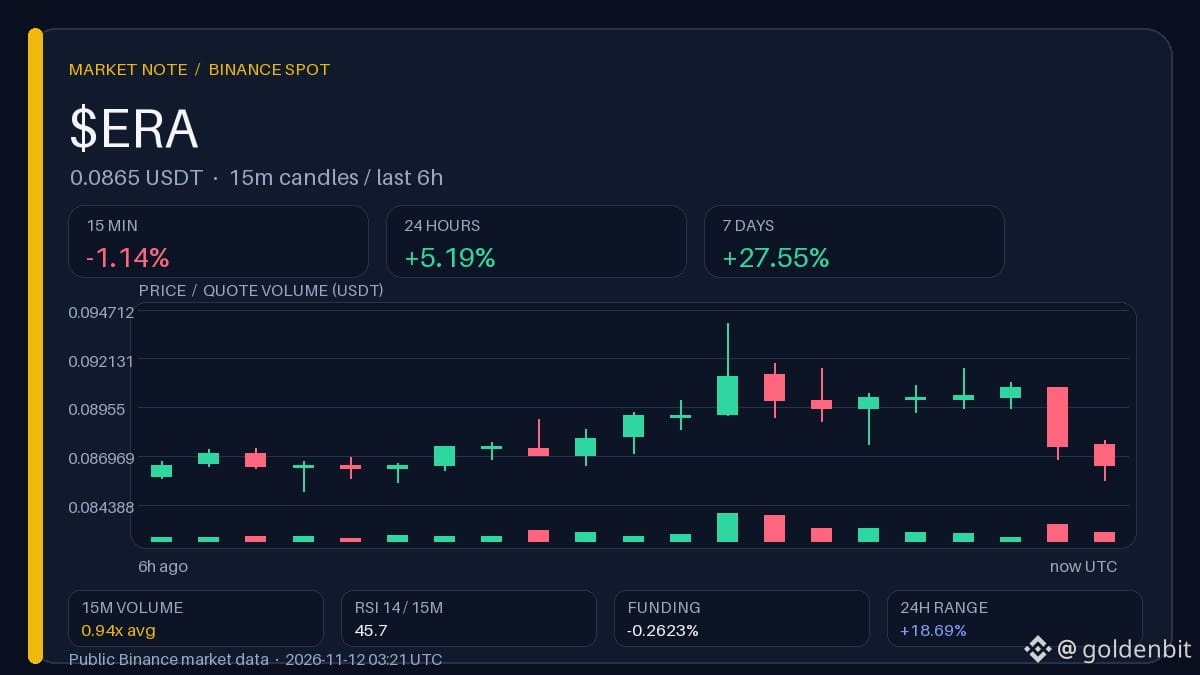
$ERA: weekly gains hold, but the minute no longer agrees
The short-term impulse and weekly trend are moving in different directions, and for now the longer trend looks stronger. The price gained 5.19% in 24 hours and 27.55% over the week, but the 15-minute change of −1.14% alongside funding at −0.2623% signals a positioning imbalance, not proof of a reversal.
Observation range · 5 h
Above 0.094000: Holding above the local range’s upper boundary would support the view that the weekly trend is stronger than the short-term pullback.
Below 0.085100: A return to the range’s lower boundary would test the hypothesis that the minute timeframe is now outweighing the weekly impulse.
These are historical levels; a single wick does not confirm a scenario.
What would need to change in funding for the short-term pullback to stop looking like noise within the weekly rise?
Binance data, snapshot at 03:21 UTC. The author may receive rewards through Binance Square Write to Earn.
$ERA : weekly gains hold, but the minute no longer agrees
The short-term impulse and weekly trend are moving in different directions, and for now the longer trend looks stronger. The price gained 5.19% in 24 hours and 27.55% over the week, but the 15-minute change of −1.14% alongside funding at −0.2623% signals a positioning imbalance, not proof of a reversal.
Observation range · 5 h
Above 0.094000: Holding above the local range’s upper boundary would support the view that the weekly trend is stronger than the short-term pullback.
Below 0.085100: A return to the range’s lower boundary would test the hypothesis that the minute timeframe is now outweighing the weekly impulse.
These are historical levels; a single wick does not confirm a scenario.
What would need to change in funding for the short-term pullback to stop looking like noise within the weekly rise?
Binance data, snapshot at 03:21 UTC. The author may receive rewards through Binance Square Write to Earn.
The short-term impulse and weekly trend are moving in different directions, and for now the longer trend looks stronger. The price gained 5.19% in 24 hours and 27.55% over the week, but the 15-minute change of −1.14% alongside funding at −0.2623% signals a positioning imbalance, not proof of a reversal.
Observation range · 5 h
Above 0.094000: Holding above the local range’s upper boundary would support the view that the weekly trend is stronger than the short-term pullback.
Below 0.085100: A return to the range’s lower boundary would test the hypothesis that the minute timeframe is now outweighing the weekly impulse.
These are historical levels; a single wick does not confirm a scenario.
What would need to change in funding for the short-term pullback to stop looking like noise within the weekly rise?
Binance data, snapshot at 03:21 UTC. The author may receive rewards through Binance Square Write to Earn.
29
·
--
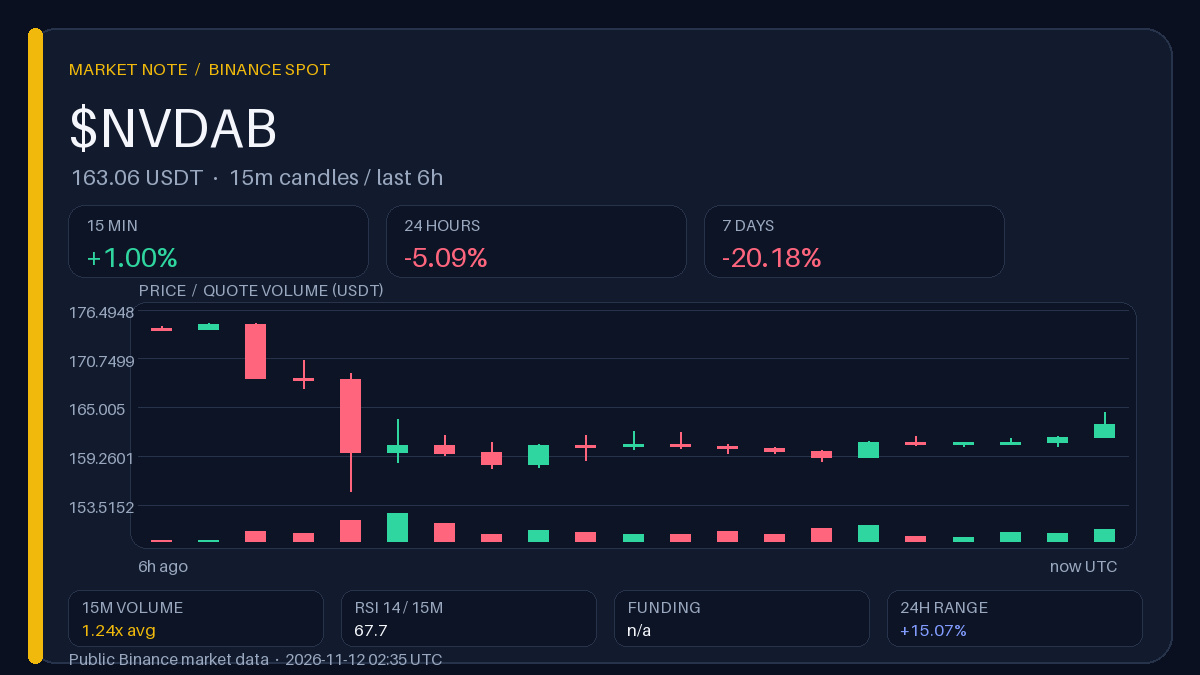
$NVDAB bouncing, but the week hasn't turned around yet
The 15-minute gain looks more like a bounce within a down week than a change in direction. Down 5.09% over 24 hours and 20.18% over the week; the 15-minute rise is happening on volume of just ×1.24 the average—a weak confirmation.
Observation range · 5 h
Above 174.91: Holding above the upper boundary of the local range would weaken the case for a simple downward bounce.
Below 155.10: A return to the lower boundary would support interpreting the move as a pullback within the week's decline.
Historical levels; a single wick does not confirm a scenario.
What would need to change in volume for the bounce to stop being just a pause in the decline?
Binance data, snapshot at 02:35 UTC. The author may receive rewards through Binance Square Write to Earn.
$NVDAB bouncing, but the week hasn't turned around yet
The 15-minute gain looks more like a bounce within a down week than a change in direction. Down 5.09% over 24 hours and 20.18% over the week; the 15-minute rise is happening on volume of just ×1.24 the average—a weak confirmation.
Observation range · 5 h
Above 174.91: Holding above the upper boundary of the local range would weaken the case for a simple downward bounce.
Below 155.10: A return to the lower boundary would support interpreting the move as a pullback within the week's decline.
Historical levels; a single wick does not confirm a scenario.
What would need to change in volume for the bounce to stop being just a pause in the decline?
Binance data, snapshot at 02:35 UTC. The author may receive rewards through Binance Square Write to Earn.
The 15-minute gain looks more like a bounce within a down week than a change in direction. Down 5.09% over 24 hours and 20.18% over the week; the 15-minute rise is happening on volume of just ×1.24 the average—a weak confirmation.
Observation range · 5 h
Above 174.91: Holding above the upper boundary of the local range would weaken the case for a simple downward bounce.
Below 155.10: A return to the lower boundary would support interpreting the move as a pullback within the week's decline.
Historical levels; a single wick does not confirm a scenario.
What would need to change in volume for the bounce to stop being just a pause in the decline?
Binance data, snapshot at 02:35 UTC. The author may receive rewards through Binance Square Write to Earn.
31
·
--
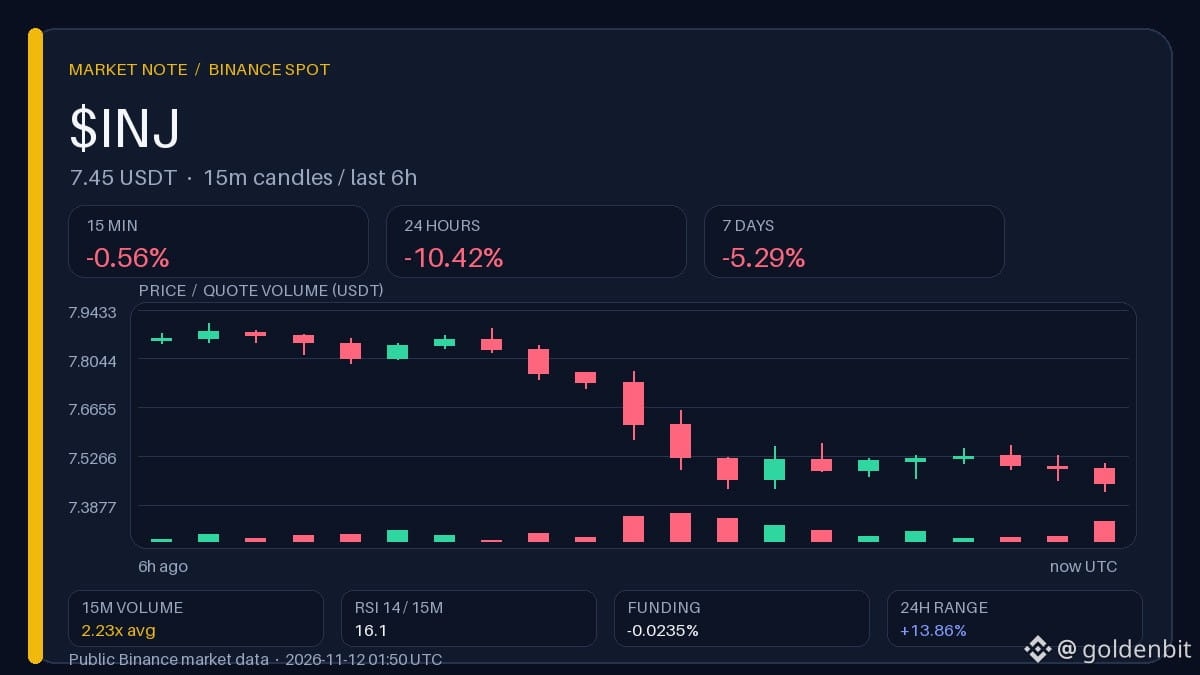
$INJ At the lower boundary: volume ×2.23 versus funding −0.0235%
Price is pinned near the bottom of the local range, but negative funding and rising volume do not provide a clear picture of market positioning. Funding at −0.0235% indicates a moderate bias toward shorts, not an extreme one; an RSI of 16.1 on the 15-minute chart indicates oversold conditions, but not a reversal.
Observation range · 5 h
Above 7.9050: A close above the range’s upper boundary would call the hypothesis of selling pressure into question.
Below 7.4260: A return to the lower boundary with funding at its current level would raise the question of whether the downward momentum has run its course.
These are historical levels; a single wick does not confirm a scenario.
If price returns to the range’s upper boundary, will funding remain negative, or will the imbalance begin to ease?
Binance data, snapshot at 01:50 UTC. The author may receive rewards through Binance Square Write to Earn.
$INJ At the lower boundary: volume ×2.23 versus funding −0.0235%
Price is pinned near the bottom of the local range, but negative funding and rising volume do not provide a clear picture of market positioning. Funding at −0.0235% indicates a moderate bias toward shorts, not an extreme one; an RSI of 16.1 on the 15-minute chart indicates oversold conditions, but not a reversal.
Observation range · 5 h
Above 7.9050: A close above the range’s upper boundary would call the hypothesis of selling pressure into question.
Below 7.4260: A return to the lower boundary with funding at its current level would raise the question of whether the downward momentum has run its course.
These are historical levels; a single wick does not confirm a scenario.
If price returns to the range’s upper boundary, will funding remain negative, or will the imbalance begin to ease?
Binance data, snapshot at 01:50 UTC. The author may receive rewards through Binance Square Write to Earn.
Price is pinned near the bottom of the local range, but negative funding and rising volume do not provide a clear picture of market positioning. Funding at −0.0235% indicates a moderate bias toward shorts, not an extreme one; an RSI of 16.1 on the 15-minute chart indicates oversold conditions, but not a reversal.
Observation range · 5 h
Above 7.9050: A close above the range’s upper boundary would call the hypothesis of selling pressure into question.
Below 7.4260: A return to the lower boundary with funding at its current level would raise the question of whether the downward momentum has run its course.
These are historical levels; a single wick does not confirm a scenario.
If price returns to the range’s upper boundary, will funding remain negative, or will the imbalance begin to ease?
Binance data, snapshot at 01:50 UTC. The author may receive rewards through Binance Square Write to Earn.
44
·
--
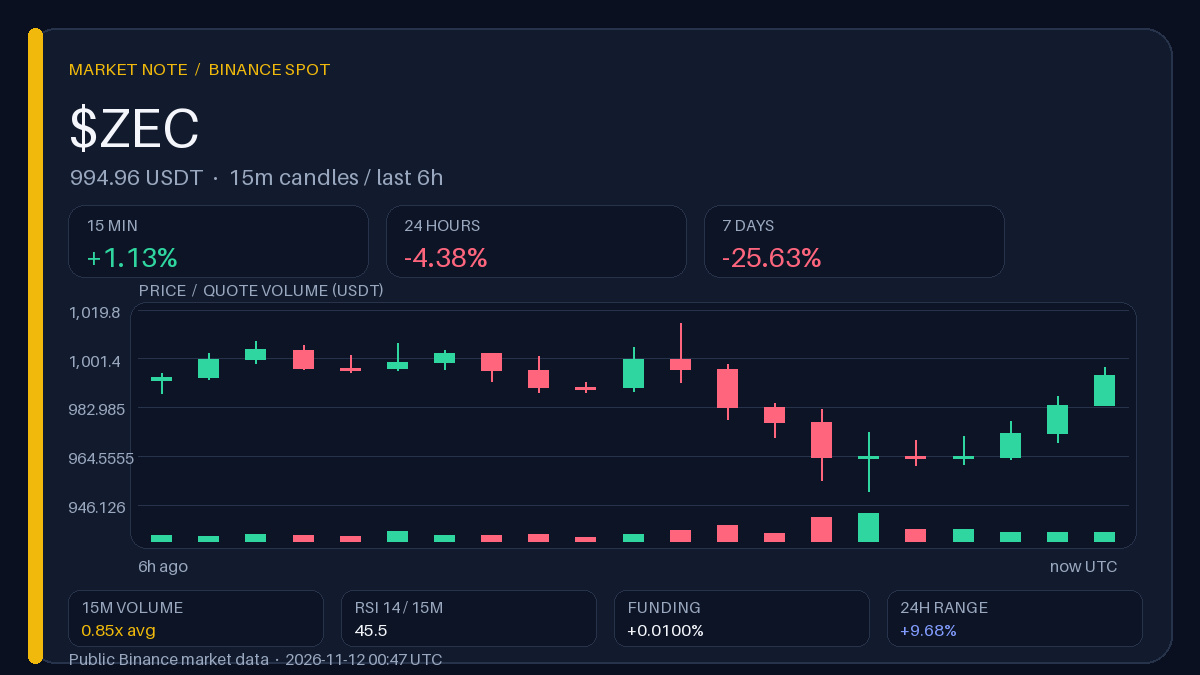
$ZEC bounces on thin volume — the weekly loss tells a different story
A gain on the 15-minute chart on below-average volume looks more like a pause in the decline than a change in direction. Over 24 hours, the price is still down 4.38%, and over the week it is down 25.63%; the bounce is taking place with a volume_ratio_15m of 0.85, meaning participation has not expanded.
Observation range · 5 h
Above 1,014.76: A hold above the local upper boundary, accompanied by expanding volume, would weaken the case for a simple pullback within a downtrend.
Below 951.21: A return to the range’s lower boundary would confirm that the brief gain was noise against the weekly trend.
Levels are historical; a single wick does not confirm a scenario.
↩️ Recap of the previous “Contrast Radar” edition (11.11 02:36 UTC): ZEC 1,021.78 → 985.20 USDT (−3.58% over 12 h), funding +0.010% → +0.005%.
What would need to change in volume for the bounce to stop looking like a technical pause?
Binance data, snapshot at 00:47 UTC. The author may receive rewards through Binance Square Write to Earn.
$ZEC bounces on thin volume — the weekly loss tells a different story
A gain on the 15-minute chart on below-average volume looks more like a pause in the decline than a change in direction. Over 24 hours, the price is still down 4.38%, and over the week it is down 25.63%; the bounce is taking place with a volume_ratio_15m of 0.85, meaning participation has not expanded.
Observation range · 5 h
Above 1,014.76: A hold above the local upper boundary, accompanied by expanding volume, would weaken the case for a simple pullback within a downtrend.
Below 951.21: A return to the range’s lower boundary would confirm that the brief gain was noise against the weekly trend.
Levels are historical; a single wick does not confirm a scenario.
↩️ Recap of the previous “Contrast Radar” edition (11.11 02:36 UTC): ZEC 1,021.78 → 985.20 USDT (−3.58% over 12 h), funding +0.010% → +0.005%.
What would need to change in volume for the bounce to stop looking like a technical pause?
Binance data, snapshot at 00:47 UTC. The author may receive rewards through Binance Square Write to Earn.
A gain on the 15-minute chart on below-average volume looks more like a pause in the decline than a change in direction. Over 24 hours, the price is still down 4.38%, and over the week it is down 25.63%; the bounce is taking place with a volume_ratio_15m of 0.85, meaning participation has not expanded.
Observation range · 5 h
Above 1,014.76: A hold above the local upper boundary, accompanied by expanding volume, would weaken the case for a simple pullback within a downtrend.
Below 951.21: A return to the range’s lower boundary would confirm that the brief gain was noise against the weekly trend.
Levels are historical; a single wick does not confirm a scenario.
↩️ Recap of the previous “Contrast Radar” edition (11.11 02:36 UTC): ZEC 1,021.78 → 985.20 USDT (−3.58% over 12 h), funding +0.010% → +0.005%.
What would need to change in volume for the bounce to stop looking like a technical pause?
Binance data, snapshot at 00:47 UTC. The author may receive rewards through Binance Square Write to Earn.
65
·
--
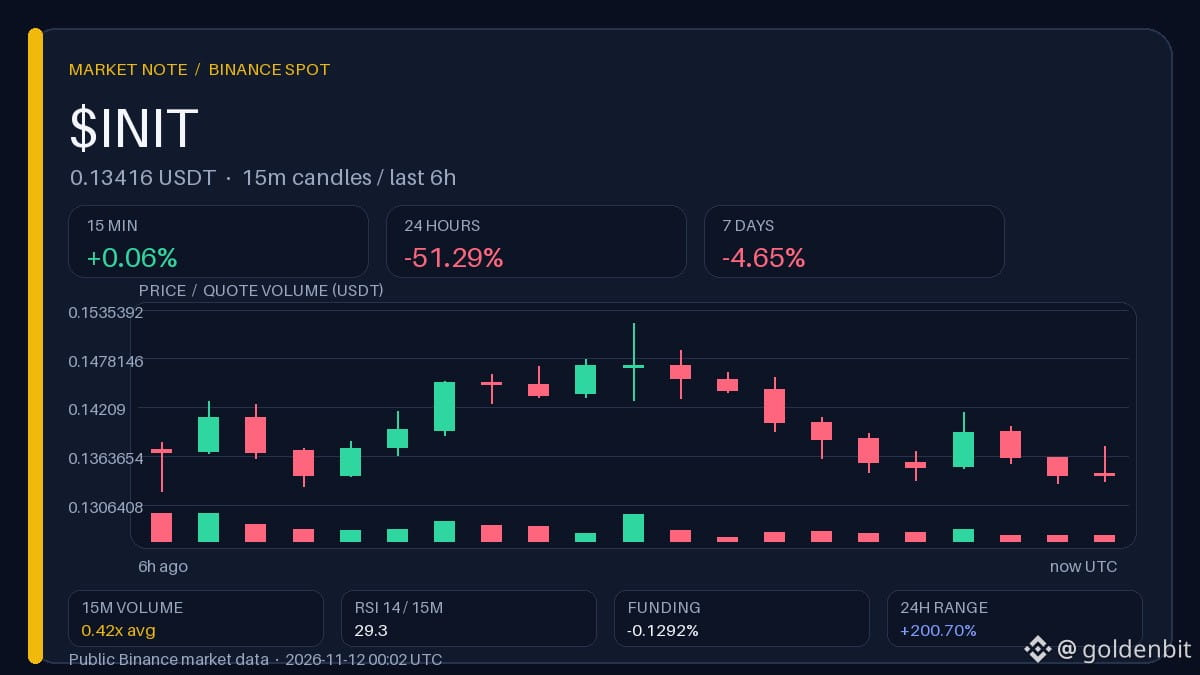
$INIT: price near the lower bound, while funding is still −0.1292%
After a 51.29% crash in 24 hours, the market has not cleared the imbalance: funding remains negative, even though the price is no longer falling. Over 15 minutes, price is up +0.06% on volume at 0.42 of average — no bounce, but no sign of pressure on the bottom of the range either; RSI at 29.3 confirms oversold conditions, not a reversal.
Range to watch · 5 h
Above 0.151960: Holding above the upper boundary of the local range would weaken the hypothesis that the downward imbalance is persisting.
Below 0.132220: A return to the lower boundary with funding still negative would leave the imbalance hypothesis unchanged.
These are historical levels; a lone wick does not confirm a scenario.
↩️ Recap of the previous “Funding Radar” edition (11.11 00:02 UTC): INIT 0.274840 → 0.184680 USDT (−32.80% in 12 h), funding −1.704% → −0.438%.
What would need to change in funding for the current interpretation of the positions imbalance to stop holding?
Binance data, snapshot at 00:02 UTC. The author may receive a reward through Binance Square Write to Earn.
$INIT : price near the lower bound, while funding is still −0.1292%
After a 51.29% crash in 24 hours, the market has not cleared the imbalance: funding remains negative, even though the price is no longer falling. Over 15 minutes, price is up +0.06% on volume at 0.42 of average — no bounce, but no sign of pressure on the bottom of the range either; RSI at 29.3 confirms oversold conditions, not a reversal.
Range to watch · 5 h
Above 0.151960: Holding above the upper boundary of the local range would weaken the hypothesis that the downward imbalance is persisting.
Below 0.132220: A return to the lower boundary with funding still negative would leave the imbalance hypothesis unchanged.
These are historical levels; a lone wick does not confirm a scenario.
↩️ Recap of the previous “Funding Radar” edition (11.11 00:02 UTC): INIT 0.274840 → 0.184680 USDT (−32.80% in 12 h), funding −1.704% → −0.438%.
What would need to change in funding for the current interpretation of the positions imbalance to stop holding?
Binance data, snapshot at 00:02 UTC. The author may receive a reward through Binance Square Write to Earn.
After a 51.29% crash in 24 hours, the market has not cleared the imbalance: funding remains negative, even though the price is no longer falling. Over 15 minutes, price is up +0.06% on volume at 0.42 of average — no bounce, but no sign of pressure on the bottom of the range either; RSI at 29.3 confirms oversold conditions, not a reversal.
Range to watch · 5 h
Above 0.151960: Holding above the upper boundary of the local range would weaken the hypothesis that the downward imbalance is persisting.
Below 0.132220: A return to the lower boundary with funding still negative would leave the imbalance hypothesis unchanged.
These are historical levels; a lone wick does not confirm a scenario.
↩️ Recap of the previous “Funding Radar” edition (11.11 00:02 UTC): INIT 0.274840 → 0.184680 USDT (−32.80% in 12 h), funding −1.704% → −0.438%.
What would need to change in funding for the current interpretation of the positions imbalance to stop holding?
Binance data, snapshot at 00:02 UTC. The author may receive a reward through Binance Square Write to Earn.
82
·
--
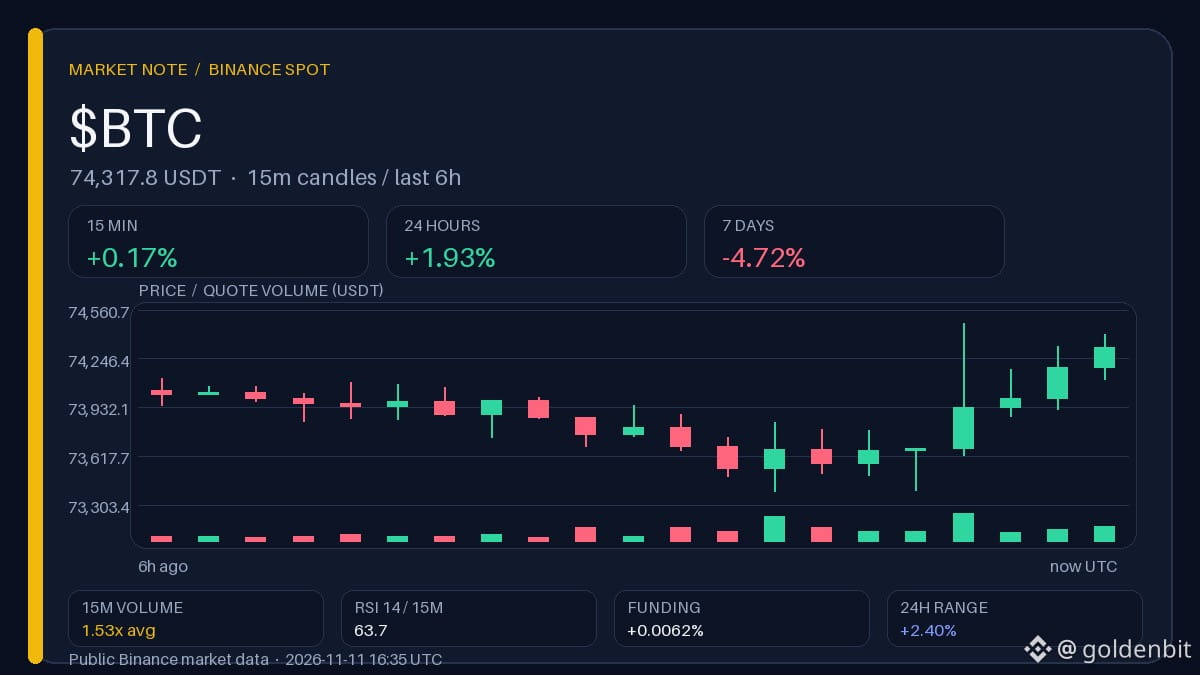
$BTC holds near the top of a narrow range, but the week is still in the red
A brief impulse and rising volume do not erase the weekly pullback: the market has yet to confirm a reversal. Trading is near the upper boundary of the local range, with volume 1.53 times above average, while the price has lost 4.72% over 7 days.
Observation range · 5 h
Above 74 474,00: Holding above the range’s upper boundary would strengthen the case that the brief impulse is turning into a recovery.
Below 73 390,13: A return to the lower boundary would refocus attention on weekly weakness and call the strength of the rebound into question.
These are historical levels; a single wick does not confirm a scenario.
🗞 News: Cointelegraph.
↩️ Previous “News and Numbers” edition recap (10.11 10:50 UTC): BTC 74 189,99 → 73 806,00 USDT (−0,52% over 12 h), funding +0,009% → +0,007%.
What would need to change in volume for the weekly decline to stop outweighing the brief impulse?
Binance data, snapshot at 16:35 UTC. The author may receive rewards through Binance Square Write to Earn.
$BTC holds near the top of a narrow range, but the week is still in the red
A brief impulse and rising volume do not erase the weekly pullback: the market has yet to confirm a reversal. Trading is near the upper boundary of the local range, with volume 1.53 times above average, while the price has lost 4.72% over 7 days.
Observation range · 5 h
Above 74 474,00: Holding above the range’s upper boundary would strengthen the case that the brief impulse is turning into a recovery.
Below 73 390,13: A return to the lower boundary would refocus attention on weekly weakness and call the strength of the rebound into question.
These are historical levels; a single wick does not confirm a scenario.
🗞 News: Cointelegraph.
↩️ Previous “News and Numbers” edition recap (10.11 10:50 UTC): BTC 74 189,99 → 73 806,00 USDT (−0,52% over 12 h), funding +0,009% → +0,007%.
What would need to change in volume for the weekly decline to stop outweighing the brief impulse?
Binance data, snapshot at 16:35 UTC. The author may receive rewards through Binance Square Write to Earn.
A brief impulse and rising volume do not erase the weekly pullback: the market has yet to confirm a reversal. Trading is near the upper boundary of the local range, with volume 1.53 times above average, while the price has lost 4.72% over 7 days.
Observation range · 5 h
Above 74 474,00: Holding above the range’s upper boundary would strengthen the case that the brief impulse is turning into a recovery.
Below 73 390,13: A return to the lower boundary would refocus attention on weekly weakness and call the strength of the rebound into question.
These are historical levels; a single wick does not confirm a scenario.
🗞 News: Cointelegraph.
↩️ Previous “News and Numbers” edition recap (10.11 10:50 UTC): BTC 74 189,99 → 73 806,00 USDT (−0,52% over 12 h), funding +0,009% → +0,007%.
What would need to change in volume for the weekly decline to stop outweighing the brief impulse?
Binance data, snapshot at 16:35 UTC. The author may receive rewards through Binance Square Write to Earn.
5
·
--
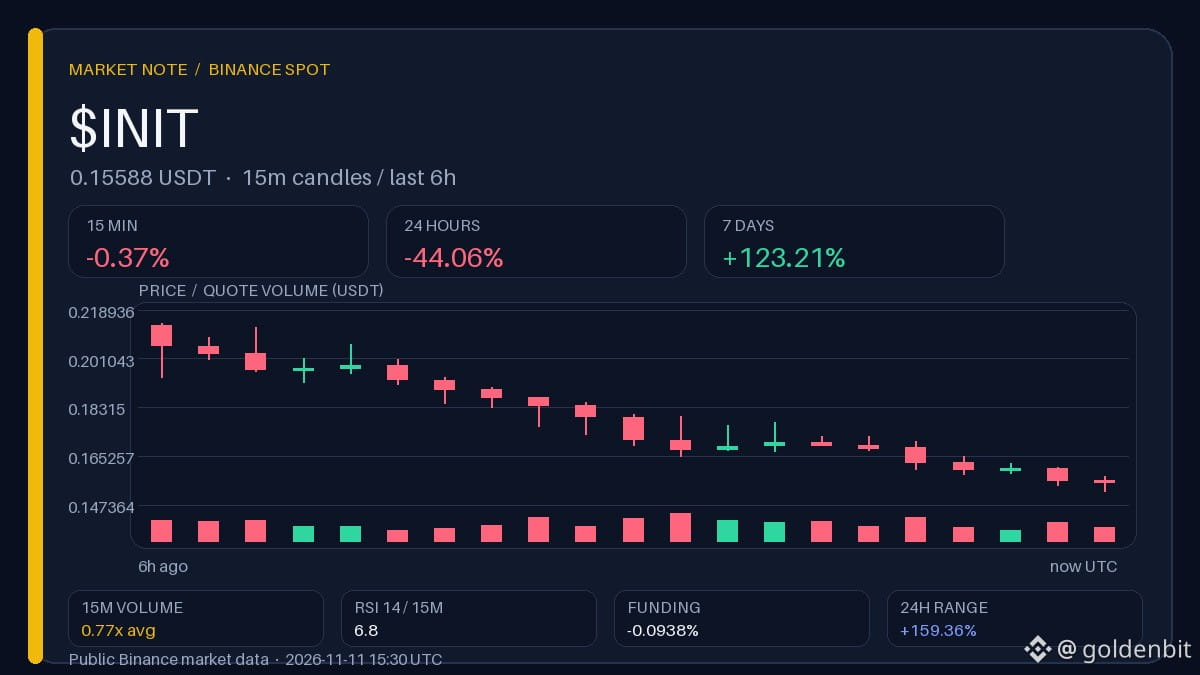
$INIT: RSI 6.8 after a 44% crash — sell-off or thin market
The weekly gain of 123.21% was almost erased by the daily drop, and volume confirms neither side. Funding remains negative at −0.0938%, while 15-minute volume is 0.77 of the average: downward pressure is building without an influx of participants.
• $INIT: −44.06% in 24 h · −0.37% in 15 min · funding −0.094%
• $ZEC: −15.56% in 24 h · −0.46% in 15 min · funding +0.005%
• $SNDKB: +12.26% in 24 h · +2.00% in 15 min · funding n/a
Watch next: Will volume return to average as price tries to hold above the daily low?
↩️ Recap of the previous “Funding Radar” issue (11.11 00:02 UTC): INIT 0.274840 → 0.184680 USDT (−32.80% in 12 h), funding −1.704% → −0.438%.
What would need to change in volume for the weekly gain to stop looking like a random spike?
Binance data, snapshot at 15:30 UTC. The author may receive rewards through Binance Square Write to Earn.
$INIT : RSI 6.8 after a 44% crash — sell-off or thin market
The weekly gain of 123.21% was almost erased by the daily drop, and volume confirms neither side. Funding remains negative at −0.0938%, while 15-minute volume is 0.77 of the average: downward pressure is building without an influx of participants.
• $INIT : −44.06% in 24 h · −0.37% in 15 min · funding −0.094%
• $ZEC : −15.56% in 24 h · −0.46% in 15 min · funding +0.005%
• $SNDKB : +12.26% in 24 h · +2.00% in 15 min · funding n/a
Watch next: Will volume return to average as price tries to hold above the daily low?
↩️ Recap of the previous “Funding Radar” issue (11.11 00:02 UTC): INIT 0.274840 → 0.184680 USDT (−32.80% in 12 h), funding −1.704% → −0.438%.
What would need to change in volume for the weekly gain to stop looking like a random spike?
Binance data, snapshot at 15:30 UTC. The author may receive rewards through Binance Square Write to Earn.
The weekly gain of 123.21% was almost erased by the daily drop, and volume confirms neither side. Funding remains negative at −0.0938%, while 15-minute volume is 0.77 of the average: downward pressure is building without an influx of participants.
• $INIT : −44.06% in 24 h · −0.37% in 15 min · funding −0.094%
• $ZEC : −15.56% in 24 h · −0.46% in 15 min · funding +0.005%
• $SNDKB : +12.26% in 24 h · +2.00% in 15 min · funding n/a
Watch next: Will volume return to average as price tries to hold above the daily low?
↩️ Recap of the previous “Funding Radar” issue (11.11 00:02 UTC): INIT 0.274840 → 0.184680 USDT (−32.80% in 12 h), funding −1.704% → −0.438%.
What would need to change in volume for the weekly gain to stop looking like a random spike?
Binance data, snapshot at 15:30 UTC. The author may receive rewards through Binance Square Write to Earn.
22
·
--
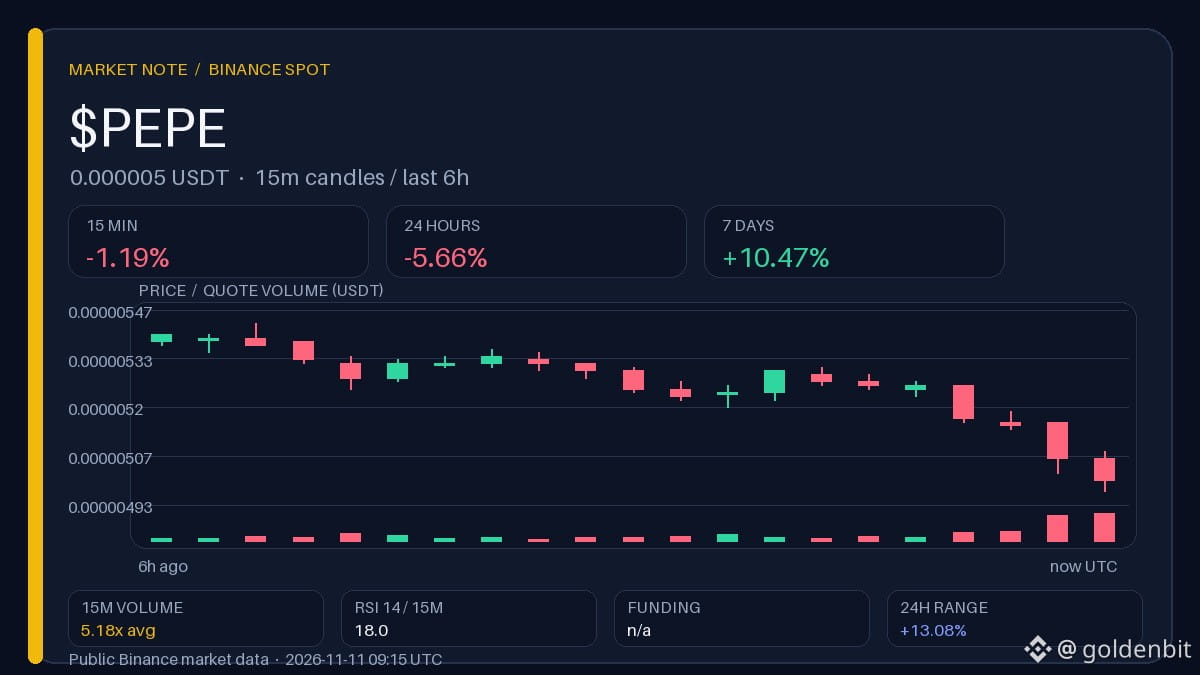
$PEPE At the lower end of the range: volume has risen, but buyers aren't rushing in
A volume spike on the 15-minute chart, with the price near the lower end of the range, is more likely a test of demand than a confirmed reversal. The 15-minute RSI 14 is 18, while the 24-hour change is −5.66%: volume is up, but the price has yet to respond with a rise.
Observation range · 5 h
Above 0.000005: A hold above the upper boundary of the range would support the case for a shift in short-term momentum.
Below 0.000005: A move back below the lower boundary would strengthen the interpretation of the spike as continued selling pressure.
Levels are historical; a single wick does not confirm a scenario.
What would need to change in the price for the volume spike to stop looking like selling pressure?
Data from Binance, snapshot at 09:15 UTC. The author may receive rewards through Binance Square Write to Earn.
$PEPE At the lower end of the range: volume has risen, but buyers aren't rushing in
A volume spike on the 15-minute chart, with the price near the lower end of the range, is more likely a test of demand than a confirmed reversal. The 15-minute RSI 14 is 18, while the 24-hour change is −5.66%: volume is up, but the price has yet to respond with a rise.
Observation range · 5 h
Above 0.000005: A hold above the upper boundary of the range would support the case for a shift in short-term momentum.
Below 0.000005: A move back below the lower boundary would strengthen the interpretation of the spike as continued selling pressure.
Levels are historical; a single wick does not confirm a scenario.
What would need to change in the price for the volume spike to stop looking like selling pressure?
Data from Binance, snapshot at 09:15 UTC. The author may receive rewards through Binance Square Write to Earn.
A volume spike on the 15-minute chart, with the price near the lower end of the range, is more likely a test of demand than a confirmed reversal. The 15-minute RSI 14 is 18, while the 24-hour change is −5.66%: volume is up, but the price has yet to respond with a rise.
Observation range · 5 h
Above 0.000005: A hold above the upper boundary of the range would support the case for a shift in short-term momentum.
Below 0.000005: A move back below the lower boundary would strengthen the interpretation of the spike as continued selling pressure.
Levels are historical; a single wick does not confirm a scenario.
What would need to change in the price for the volume spike to stop looking like selling pressure?
Data from Binance, snapshot at 09:15 UTC. The author may receive rewards through Binance Square Write to Earn.
2
·
--
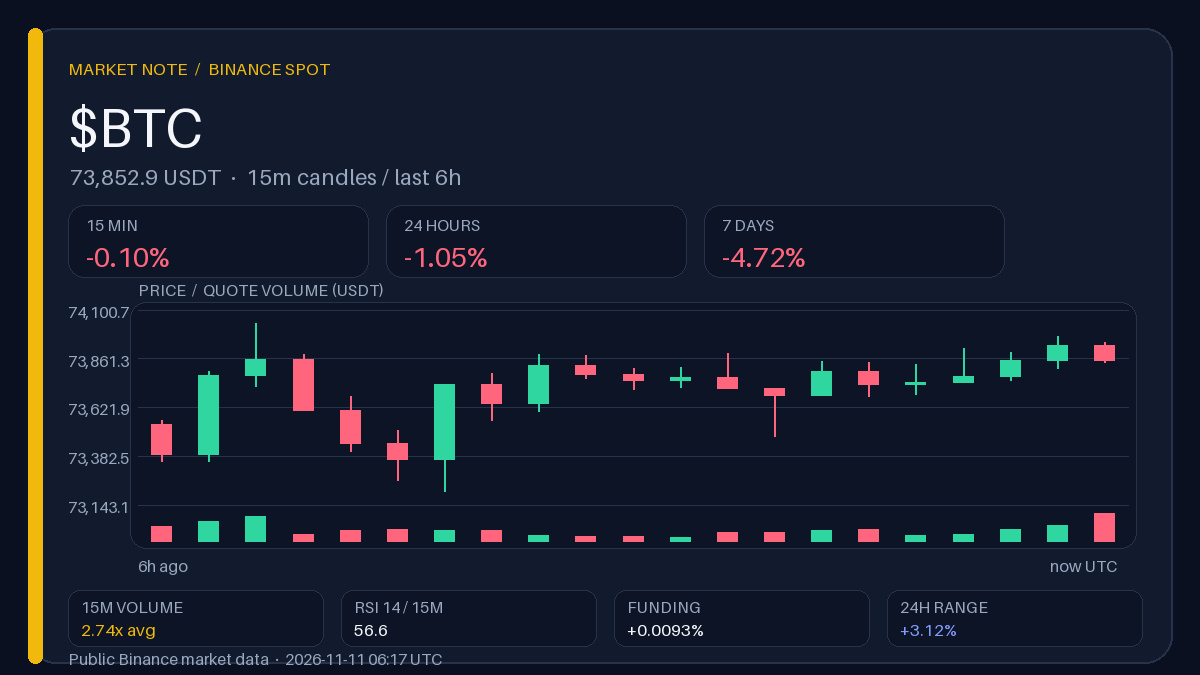
$BTC: volume rose 2.74x, but momentum is running up against a weekly loss
The 15-minute volume spike does not yet erase the seven-day decline, so the question is whether this is accumulation or distribution. The price barely changed over 15 minutes (−0.1%), while losing 4.72% over the week — volume is outpacing the move, but not setting its direction.
Observation range · 5 h
Above 74 034,64: Holding above the upper boundary of the local range while volume remains elevated would support the accumulation thesis.
Below 73 209,12: Falling back below the lower boundary of the local range with the same volume would strengthen the distribution thesis.
These are historical levels; a single wick does not confirm a scenario.
↩️ Recap of the previous “News and Numbers” edition (10.11 10:50 UTC): BTC 74 189,99 → 73 806,00 USDT (−0.52% in 12 h), funding +0.009% → +0.007%.
What would need to change in the relationship between volume and price for the spike to stop looking like noise?
Binance data, snapshot at 06:17 UTC. The author may receive a reward through Binance Square Write to Earn.
$BTC : volume rose 2.74x, but momentum is running up against a weekly loss
The 15-minute volume spike does not yet erase the seven-day decline, so the question is whether this is accumulation or distribution. The price barely changed over 15 minutes (−0.1%), while losing 4.72% over the week — volume is outpacing the move, but not setting its direction.
Observation range · 5 h
Above 74 034,64: Holding above the upper boundary of the local range while volume remains elevated would support the accumulation thesis.
Below 73 209,12: Falling back below the lower boundary of the local range with the same volume would strengthen the distribution thesis.
These are historical levels; a single wick does not confirm a scenario.
↩️ Recap of the previous “News and Numbers” edition (10.11 10:50 UTC): BTC 74 189,99 → 73 806,00 USDT (−0.52% in 12 h), funding +0.009% → +0.007%.
What would need to change in the relationship between volume and price for the spike to stop looking like noise?
Binance data, snapshot at 06:17 UTC. The author may receive a reward through Binance Square Write to Earn.
The 15-minute volume spike does not yet erase the seven-day decline, so the question is whether this is accumulation or distribution. The price barely changed over 15 minutes (−0.1%), while losing 4.72% over the week — volume is outpacing the move, but not setting its direction.
Observation range · 5 h
Above 74 034,64: Holding above the upper boundary of the local range while volume remains elevated would support the accumulation thesis.
Below 73 209,12: Falling back below the lower boundary of the local range with the same volume would strengthen the distribution thesis.
These are historical levels; a single wick does not confirm a scenario.
↩️ Recap of the previous “News and Numbers” edition (10.11 10:50 UTC): BTC 74 189,99 → 73 806,00 USDT (−0.52% in 12 h), funding +0.009% → +0.007%.
What would need to change in the relationship between volume and price for the spike to stop looking like noise?
Binance data, snapshot at 06:17 UTC. The author may receive a reward through Binance Square Write to Earn.
2
·
--
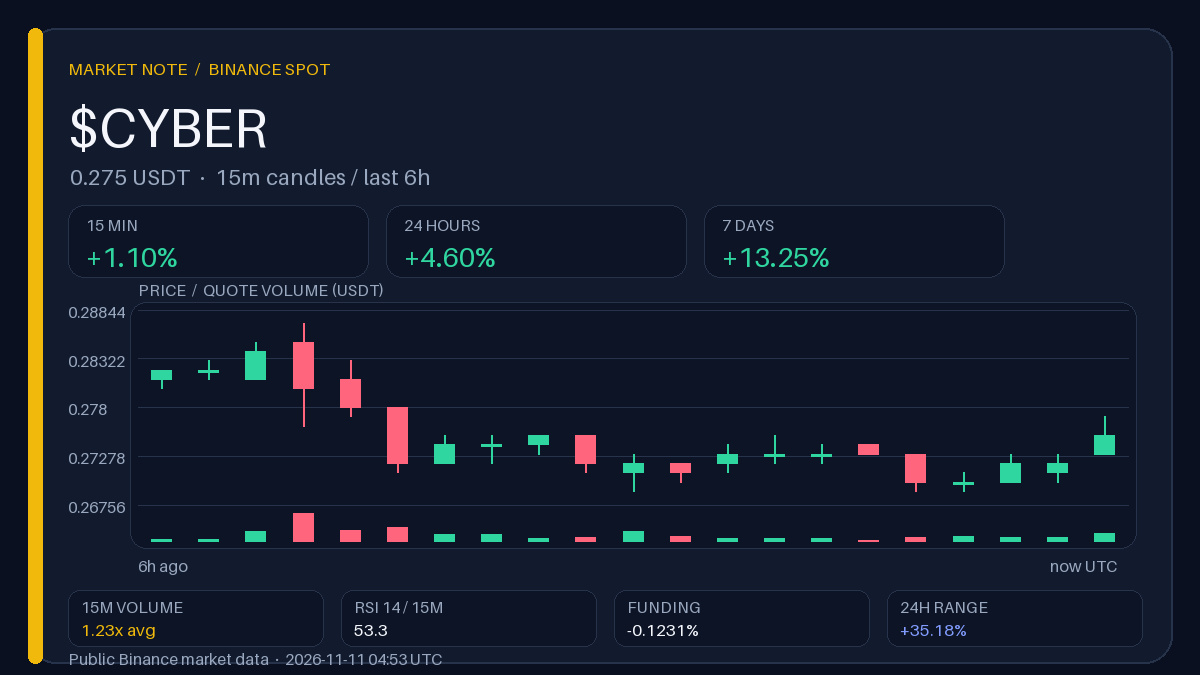
$CYBER Rises for a third session, but funding at −0.1231% tells a different story
A weekly gain alongside negative funding signals a positioning imbalance, not confirmed demand. The price is holding in the upper part of the local range, while shorts continue to pay longs; this is a hedging hypothesis, not a proven imbalance.
Observation range · 5 h
Above 0.287000: A move above the upper boundary of the local range, accompanied by easing funding, would support the case for genuine demand.
Below 0.269000: A return to the lower boundary of the local range with funding still negative would weaken the case for an imbalance in short positions.
These are historical levels; a single wick does not confirm the scenario.
Will funding become less negative if the price holds the upper boundary of the local range?
Binance data, snapshot at 04:53 UTC. The author may receive rewards through Binance Square Write to Earn.
$CYBER Rises for a third session, but funding at −0.1231% tells a different story
A weekly gain alongside negative funding signals a positioning imbalance, not confirmed demand. The price is holding in the upper part of the local range, while shorts continue to pay longs; this is a hedging hypothesis, not a proven imbalance.
Observation range · 5 h
Above 0.287000: A move above the upper boundary of the local range, accompanied by easing funding, would support the case for genuine demand.
Below 0.269000: A return to the lower boundary of the local range with funding still negative would weaken the case for an imbalance in short positions.
These are historical levels; a single wick does not confirm the scenario.
Will funding become less negative if the price holds the upper boundary of the local range?
Binance data, snapshot at 04:53 UTC. The author may receive rewards through Binance Square Write to Earn.
A weekly gain alongside negative funding signals a positioning imbalance, not confirmed demand. The price is holding in the upper part of the local range, while shorts continue to pay longs; this is a hedging hypothesis, not a proven imbalance.
Observation range · 5 h
Above 0.287000: A move above the upper boundary of the local range, accompanied by easing funding, would support the case for genuine demand.
Below 0.269000: A return to the lower boundary of the local range with funding still negative would weaken the case for an imbalance in short positions.
These are historical levels; a single wick does not confirm the scenario.
Will funding become less negative if the price holds the upper boundary of the local range?
Binance data, snapshot at 04:53 UTC. The author may receive rewards through Binance Square Write to Earn.
5
·
--
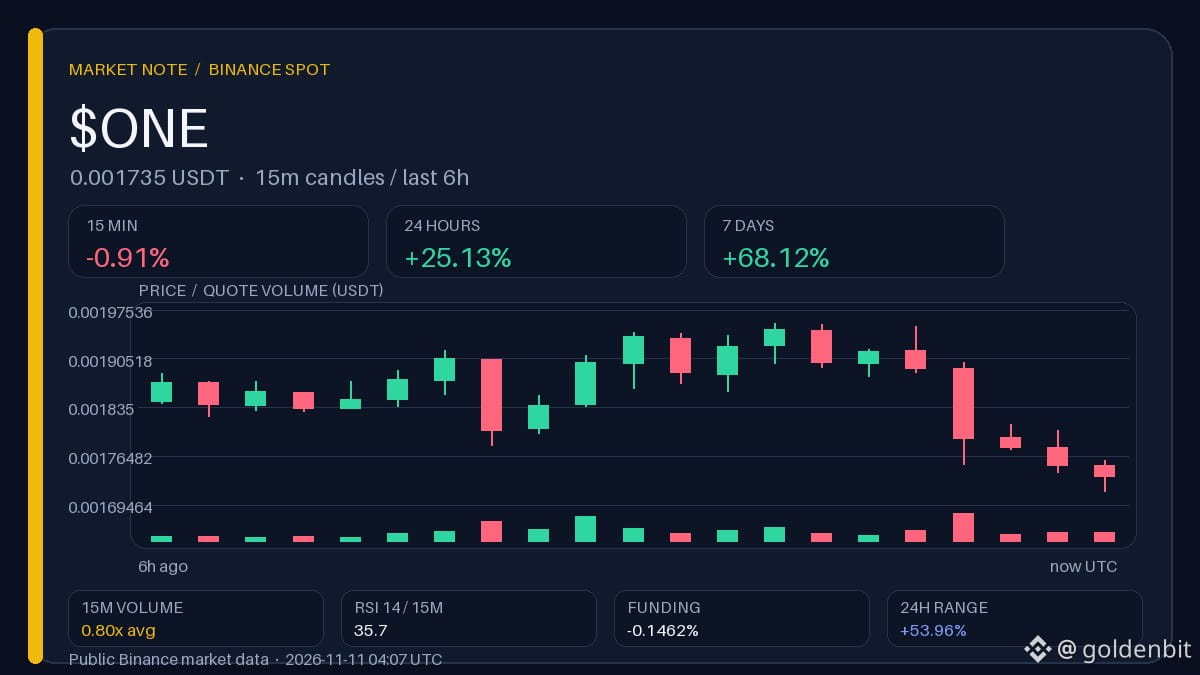
$ONE rose over the week, but volume didn't follow price
Growth of 68.12% over the week is holding on thin volume, while price has already pulled back to the lower part of the local range. 15-minute volume is 0.8 of average, while funding is −0.1462%: there is a short bias, but no confirmation from buyers.
Monitoring range · 5 h
Above 0.001956: A close above the upper bound of the range would strengthen the case that the weekly rise is continuing.
Below 0.001714: A move back below the lower bound of the range would weaken the case for the weekly rise continuing.
Historical levels; a single wick does not confirm the scenario.
↩️ Recap of the previous issue, “News and Numbers” (10.11 09:17 UTC): ONE 0.001800 → 0.001815 USDT (+0.83% in 12 h), funding −0.373% → −0.090%.
What would need to change in volume for the weekly rise to stop looking stretched?
Binance data, snapshot at 04:07 UTC. The author may receive a reward through Binance Square Write to Earn.
$ONE rose over the week, but volume didn't follow price
Growth of 68.12% over the week is holding on thin volume, while price has already pulled back to the lower part of the local range. 15-minute volume is 0.8 of average, while funding is −0.1462%: there is a short bias, but no confirmation from buyers.
Monitoring range · 5 h
Above 0.001956: A close above the upper bound of the range would strengthen the case that the weekly rise is continuing.
Below 0.001714: A move back below the lower bound of the range would weaken the case for the weekly rise continuing.
Historical levels; a single wick does not confirm the scenario.
↩️ Recap of the previous issue, “News and Numbers” (10.11 09:17 UTC): ONE 0.001800 → 0.001815 USDT (+0.83% in 12 h), funding −0.373% → −0.090%.
What would need to change in volume for the weekly rise to stop looking stretched?
Binance data, snapshot at 04:07 UTC. The author may receive a reward through Binance Square Write to Earn.
Growth of 68.12% over the week is holding on thin volume, while price has already pulled back to the lower part of the local range. 15-minute volume is 0.8 of average, while funding is −0.1462%: there is a short bias, but no confirmation from buyers.
Monitoring range · 5 h
Above 0.001956: A close above the upper bound of the range would strengthen the case that the weekly rise is continuing.
Below 0.001714: A move back below the lower bound of the range would weaken the case for the weekly rise continuing.
Historical levels; a single wick does not confirm the scenario.
↩️ Recap of the previous issue, “News and Numbers” (10.11 09:17 UTC): ONE 0.001800 → 0.001815 USDT (+0.83% in 12 h), funding −0.373% → −0.090%.
What would need to change in volume for the weekly rise to stop looking stretched?
Binance data, snapshot at 04:07 UTC. The author may receive a reward through Binance Square Write to Earn.
4
·
--
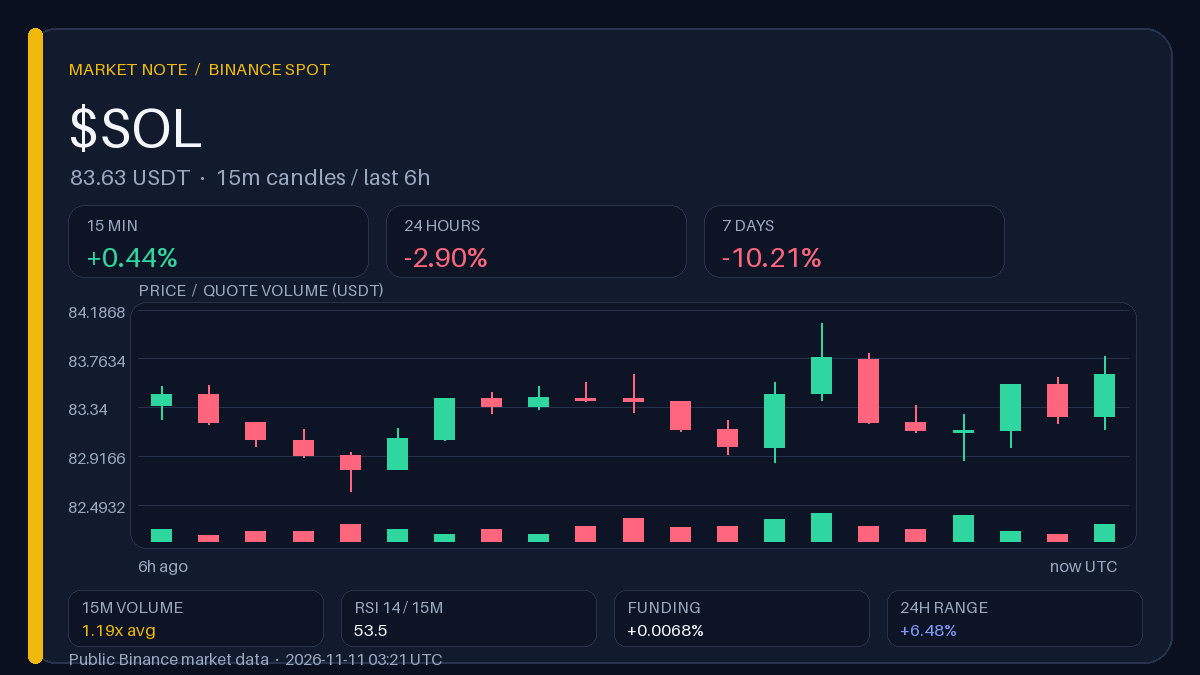
$SOL: a 15-minute gain doesn't erase the weekly loss
A brief bounce amid positive funding points more to overcrowded longs than to a trend reversal. Funding is +0.0068% — longs are paying, even though the price is down −2.9% over 24 hours and −10.21% for the week; 15-minute volume is only 1.19 times the baseline.
Observation range · 5 h
Above 84,0700: Holding above the local range's upper boundary as funding weakens would cast doubt on the overcrowded-longs thesis.
Below 82,6100: A return to the lower boundary while funding remains positive would strengthen the case for pressure on long positions.
These are historical levels; a single wick does not confirm a scenario.
↩️ Recap of the previous edition, “News and Numbers” (09.11 07:19 UTC): SOL 85,3700 → 86,5300 USDT (+1,36% in 12 h), funding −0,008% → +0,009%.
What would need to change in funding for the bounce to stop looking like mere noise?
Binance data, snapshot at 03:21 UTC. The author may receive rewards through Binance Square Write to Earn.
$SOL : a 15-minute gain doesn't erase the weekly loss
A brief bounce amid positive funding points more to overcrowded longs than to a trend reversal. Funding is +0.0068% — longs are paying, even though the price is down −2.9% over 24 hours and −10.21% for the week; 15-minute volume is only 1.19 times the baseline.
Observation range · 5 h
Above 84,0700: Holding above the local range's upper boundary as funding weakens would cast doubt on the overcrowded-longs thesis.
Below 82,6100: A return to the lower boundary while funding remains positive would strengthen the case for pressure on long positions.
These are historical levels; a single wick does not confirm a scenario.
↩️ Recap of the previous edition, “News and Numbers” (09.11 07:19 UTC): SOL 85,3700 → 86,5300 USDT (+1,36% in 12 h), funding −0,008% → +0,009%.
What would need to change in funding for the bounce to stop looking like mere noise?
Binance data, snapshot at 03:21 UTC. The author may receive rewards through Binance Square Write to Earn.
A brief bounce amid positive funding points more to overcrowded longs than to a trend reversal. Funding is +0.0068% — longs are paying, even though the price is down −2.9% over 24 hours and −10.21% for the week; 15-minute volume is only 1.19 times the baseline.
Observation range · 5 h
Above 84,0700: Holding above the local range's upper boundary as funding weakens would cast doubt on the overcrowded-longs thesis.
Below 82,6100: A return to the lower boundary while funding remains positive would strengthen the case for pressure on long positions.
These are historical levels; a single wick does not confirm a scenario.
↩️ Recap of the previous edition, “News and Numbers” (09.11 07:19 UTC): SOL 85,3700 → 86,5300 USDT (+1,36% in 12 h), funding −0,008% → +0,009%.
What would need to change in funding for the bounce to stop looking like mere noise?
Binance data, snapshot at 03:21 UTC. The author may receive rewards through Binance Square Write to Earn.
37
·
--
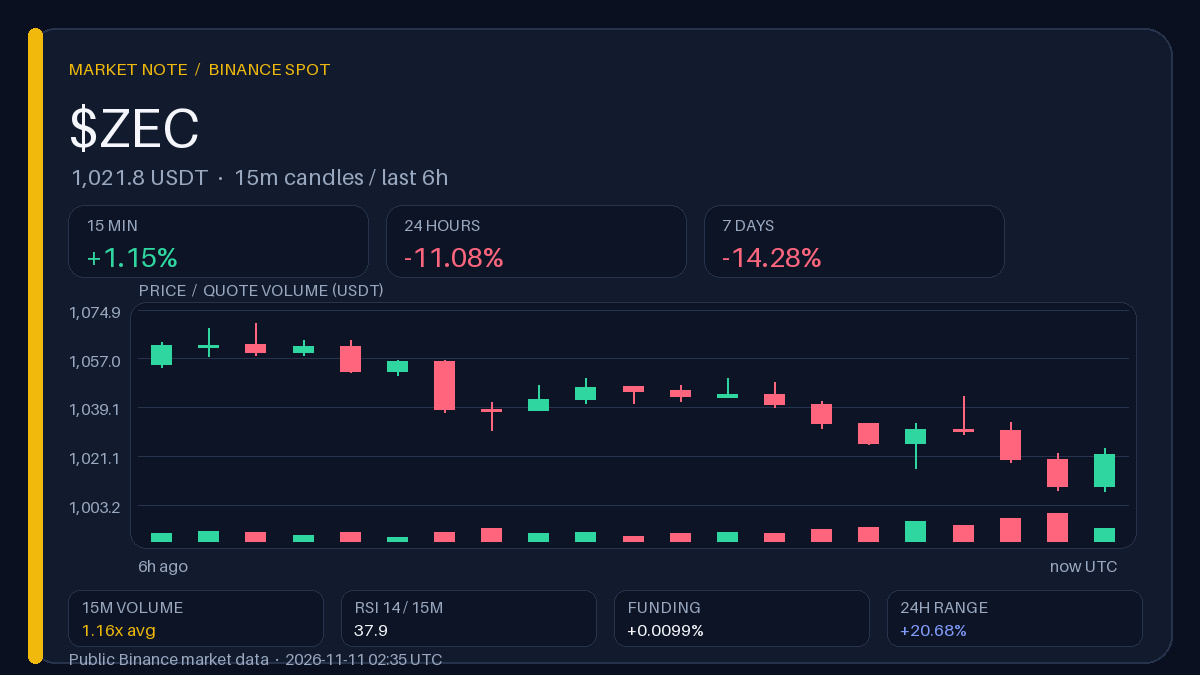
$ZEC: A 15-minute bounce doesn’t negate weekly weakness
The brief uptick looks more like a bounce within a decline than the start of a reversal: the price is lower over both the past day and the past week. Funding remains positive as the price falls—this doesn’t confirm a shift in sentiment, and 15-minute volume is only 1.16 times above average.
Observation range · 5 h
Above 1,070.00: Holding above the upper boundary of the local range would weaken the case for a bounce within a decline.
Below 1,008.14: A return to the lower boundary would strengthen the interpretation of the brief uptick as noise amid a weak trend.
Historical levels; a single wick does not confirm a scenario.
↩️ Recap of the previous “Volume Radar” issue (10.11 08:31 UTC): ZEC 1,141.11 → 1,037.01 USDT (−9.12% in 12 h), funding +0.005% → +0.001%.
What would need to change in funding for the brief rise to stop looking like just a bounce?
Binance data, snapshot at 02:35 UTC. The author may receive rewards through Binance Square Write to Earn.
$ZEC : A 15-minute bounce doesn’t negate weekly weakness
The brief uptick looks more like a bounce within a decline than the start of a reversal: the price is lower over both the past day and the past week. Funding remains positive as the price falls—this doesn’t confirm a shift in sentiment, and 15-minute volume is only 1.16 times above average.
Observation range · 5 h
Above 1,070.00: Holding above the upper boundary of the local range would weaken the case for a bounce within a decline.
Below 1,008.14: A return to the lower boundary would strengthen the interpretation of the brief uptick as noise amid a weak trend.
Historical levels; a single wick does not confirm a scenario.
↩️ Recap of the previous “Volume Radar” issue (10.11 08:31 UTC): ZEC 1,141.11 → 1,037.01 USDT (−9.12% in 12 h), funding +0.005% → +0.001%.
What would need to change in funding for the brief rise to stop looking like just a bounce?
Binance data, snapshot at 02:35 UTC. The author may receive rewards through Binance Square Write to Earn.
The brief uptick looks more like a bounce within a decline than the start of a reversal: the price is lower over both the past day and the past week. Funding remains positive as the price falls—this doesn’t confirm a shift in sentiment, and 15-minute volume is only 1.16 times above average.
Observation range · 5 h
Above 1,070.00: Holding above the upper boundary of the local range would weaken the case for a bounce within a decline.
Below 1,008.14: A return to the lower boundary would strengthen the interpretation of the brief uptick as noise amid a weak trend.
Historical levels; a single wick does not confirm a scenario.
↩️ Recap of the previous “Volume Radar” issue (10.11 08:31 UTC): ZEC 1,141.11 → 1,037.01 USDT (−9.12% in 12 h), funding +0.005% → +0.001%.
What would need to change in funding for the brief rise to stop looking like just a bounce?
Binance data, snapshot at 02:35 UTC. The author may receive rewards through Binance Square Write to Earn.
31
·
--
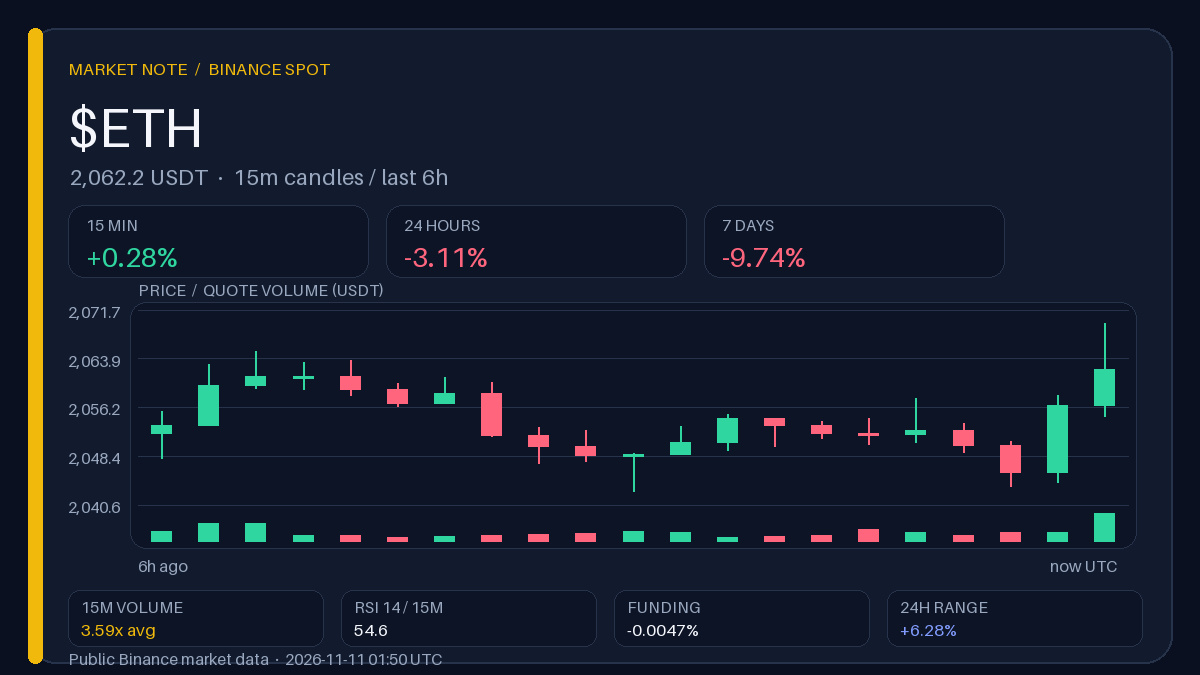
$ETH: volume is 3.59 times above average, but the week is still in the red
The short-term volume spike has yet to offset the weekly decline—the momentum and trend are moving in opposite directions. The price gained 0.28% over 15 minutes but lost 9.74% over the week; funding at −0.0047% shows no signs of overheating in longs.
Observation range · 5 h
Above 2 069,53: A hold above the upper boundary of the range, with volume sustained, would strengthen the case for a shift in short-term momentum.
Below 2 042,77: A return to the lower boundary would refocus attention on the weekly trend and weaken the case for a reversal.
These are historical levels; a single wick does not confirm a scenario.
↩️ Previous “Volume Radar” issue recap (09.11 09:15 UTC): ETH 2 123,20 → 2 129,49 USDT (+0,30% over 12 h), funding −0,003% → +0,010%.
Will the price hold near the upper part of the local range if volume returns to average?
Binance data, snapshot at 01:50 UTC. The author may receive rewards through Binance Square Write to Earn.
$ETH : volume is 3.59 times above average, but the week is still in the red
The short-term volume spike has yet to offset the weekly decline—the momentum and trend are moving in opposite directions. The price gained 0.28% over 15 minutes but lost 9.74% over the week; funding at −0.0047% shows no signs of overheating in longs.
Observation range · 5 h
Above 2 069,53: A hold above the upper boundary of the range, with volume sustained, would strengthen the case for a shift in short-term momentum.
Below 2 042,77: A return to the lower boundary would refocus attention on the weekly trend and weaken the case for a reversal.
These are historical levels; a single wick does not confirm a scenario.
↩️ Previous “Volume Radar” issue recap (09.11 09:15 UTC): ETH 2 123,20 → 2 129,49 USDT (+0,30% over 12 h), funding −0,003% → +0,010%.
Will the price hold near the upper part of the local range if volume returns to average?
Binance data, snapshot at 01:50 UTC. The author may receive rewards through Binance Square Write to Earn.
The short-term volume spike has yet to offset the weekly decline—the momentum and trend are moving in opposite directions. The price gained 0.28% over 15 minutes but lost 9.74% over the week; funding at −0.0047% shows no signs of overheating in longs.
Observation range · 5 h
Above 2 069,53: A hold above the upper boundary of the range, with volume sustained, would strengthen the case for a shift in short-term momentum.
Below 2 042,77: A return to the lower boundary would refocus attention on the weekly trend and weaken the case for a reversal.
These are historical levels; a single wick does not confirm a scenario.
↩️ Previous “Volume Radar” issue recap (09.11 09:15 UTC): ETH 2 123,20 → 2 129,49 USDT (+0,30% over 12 h), funding −0,003% → +0,010%.
Will the price hold near the upper part of the local range if volume returns to average?
Binance data, snapshot at 01:50 UTC. The author may receive rewards through Binance Square Write to Earn.
44
Log in to explore more content
Join global crypto users on Binance Square
⚡️ Get latest and useful information about crypto.
💬 Trusted by the world’s largest crypto exchange.
👍 Discover real insights from verified creators.
Email / Phone number
Trending Topics
HuangExitNvidiaStrategyInFocus
9,394 views
355 Discussing
STOCKS | Nvidia’s Jensen Huang Resigns, Colette Kress Named as Interim CEO
Binance News
·8 Likes
·10.8k views
AnthropicRejectsIPODelayValuationinQuestion
569,724 views
4,731 Discussing
BitMineReports$6.3BNetLossForFiscal2026
1,856 views
74 Discussing