

Crypto Trader 17
Crypto Trader Market Watcher Sharing setups market moves & insights 👀 Tracking opportunities early DYOR . NFA
Open Trade
Frequent Trader
1.8 Years
146 Following
4.6K+ Followers
61.5K+ Liked
Posts
Portfolio
All
Quotes
Videos


ZENITH ZORO
·
--
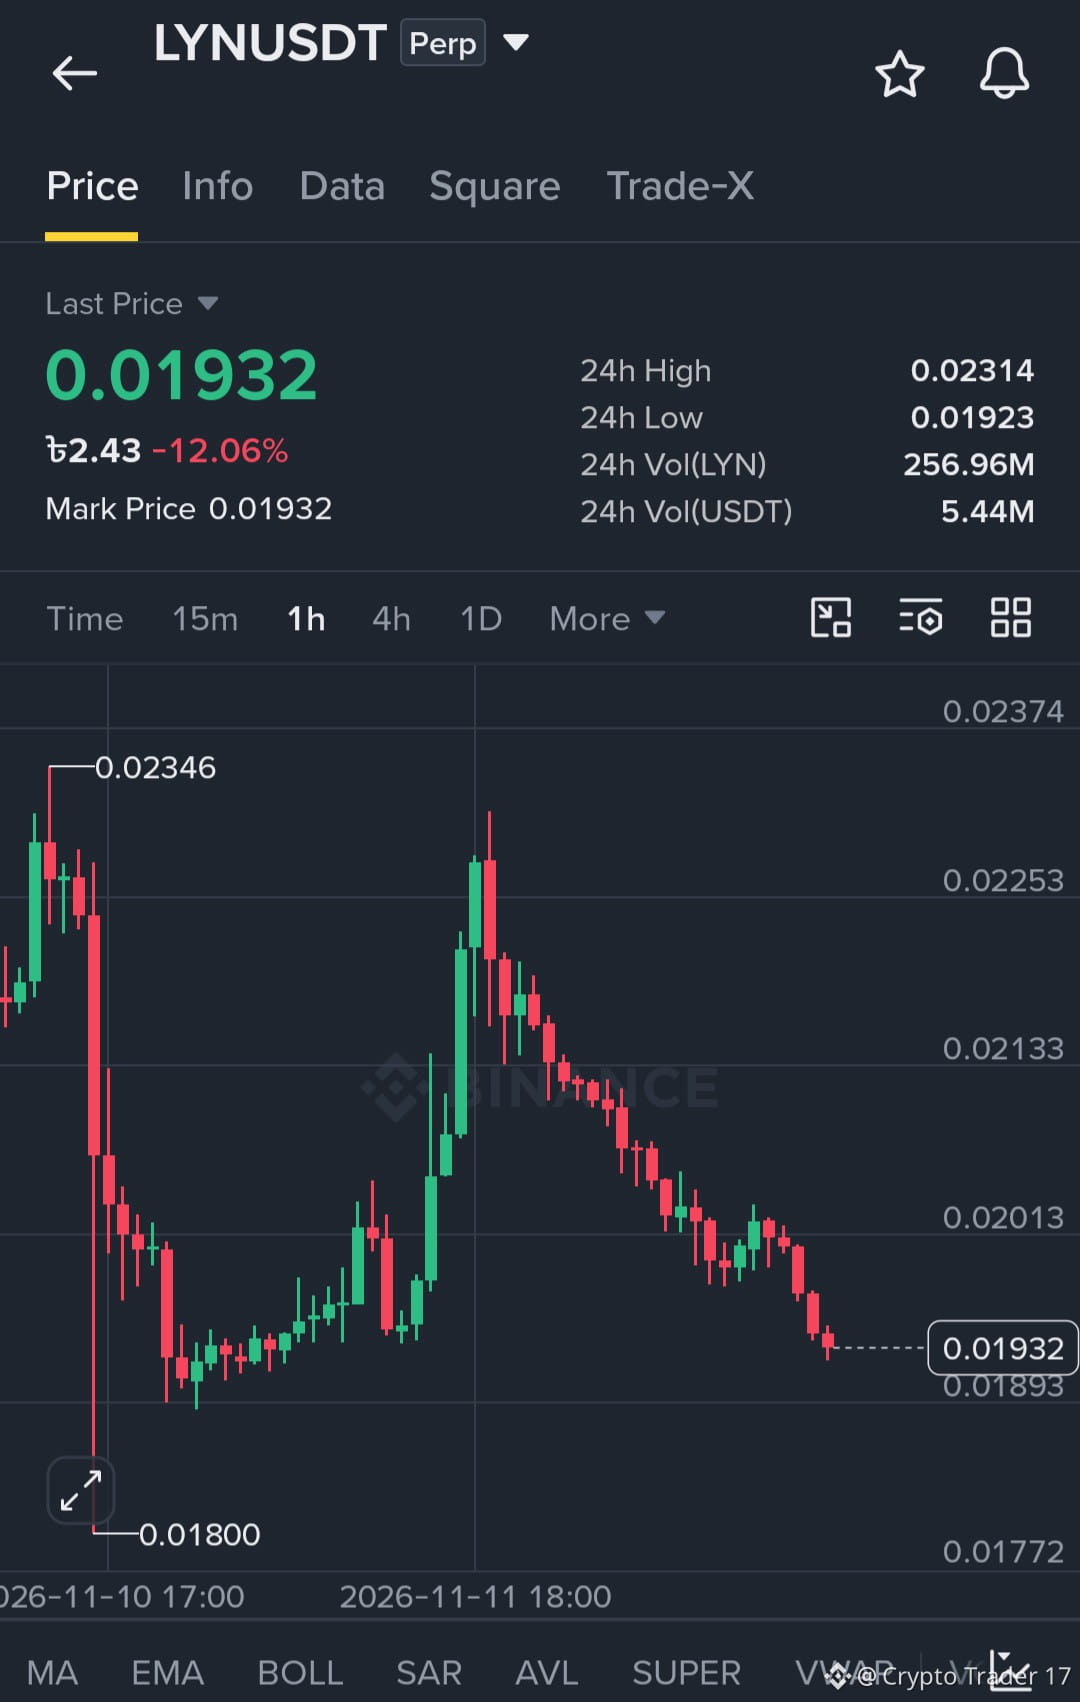
$LYN downside in focus next level 0.01876
Enter short: 0.01953
SL: 0.02004
TP1: 0.01876 | TP2: 0.01825 | TP3: 0.01749
Sellers have broken support at 0.01965, with stronger trading activity supporting the decline.
Enter short: 0.01953
SL: 0.02004
TP1: 0.01876 | TP2: 0.01825 | TP3: 0.01749
Sellers have broken support at 0.01965, with stronger trading activity supporting the decline.




Amr_faras 2024
·
--
#INIT
Opportunity or trap?
Technical analysis and indicators
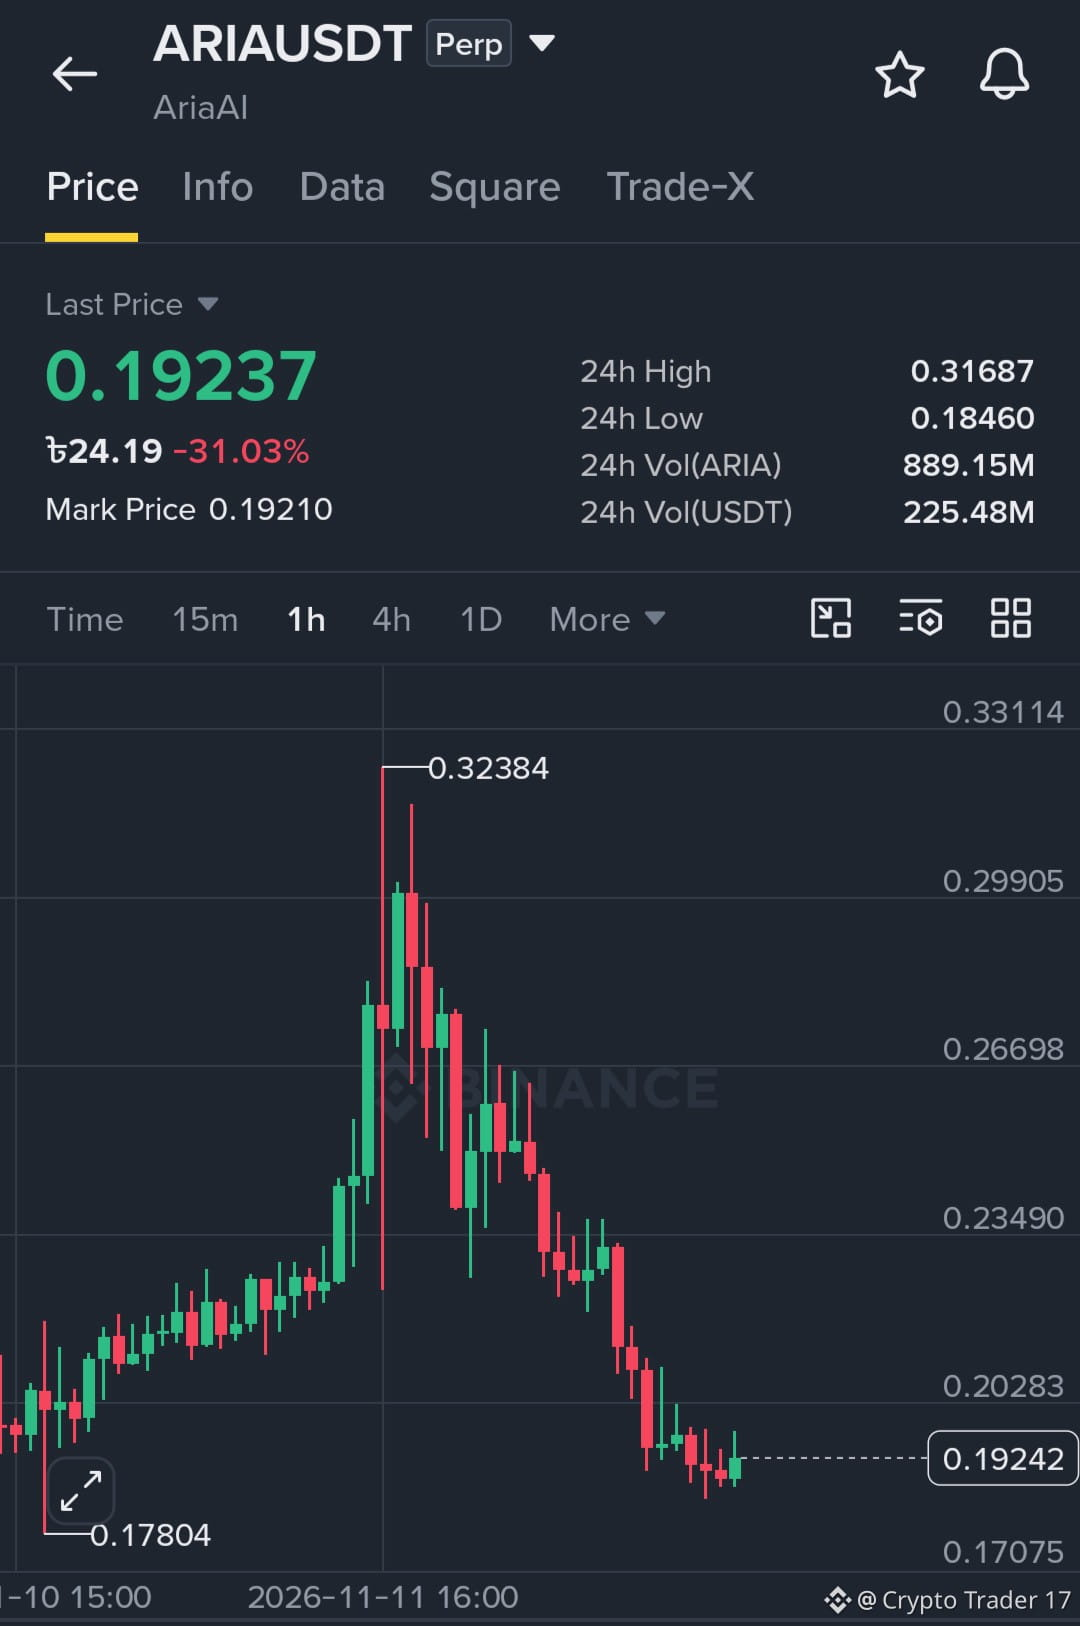
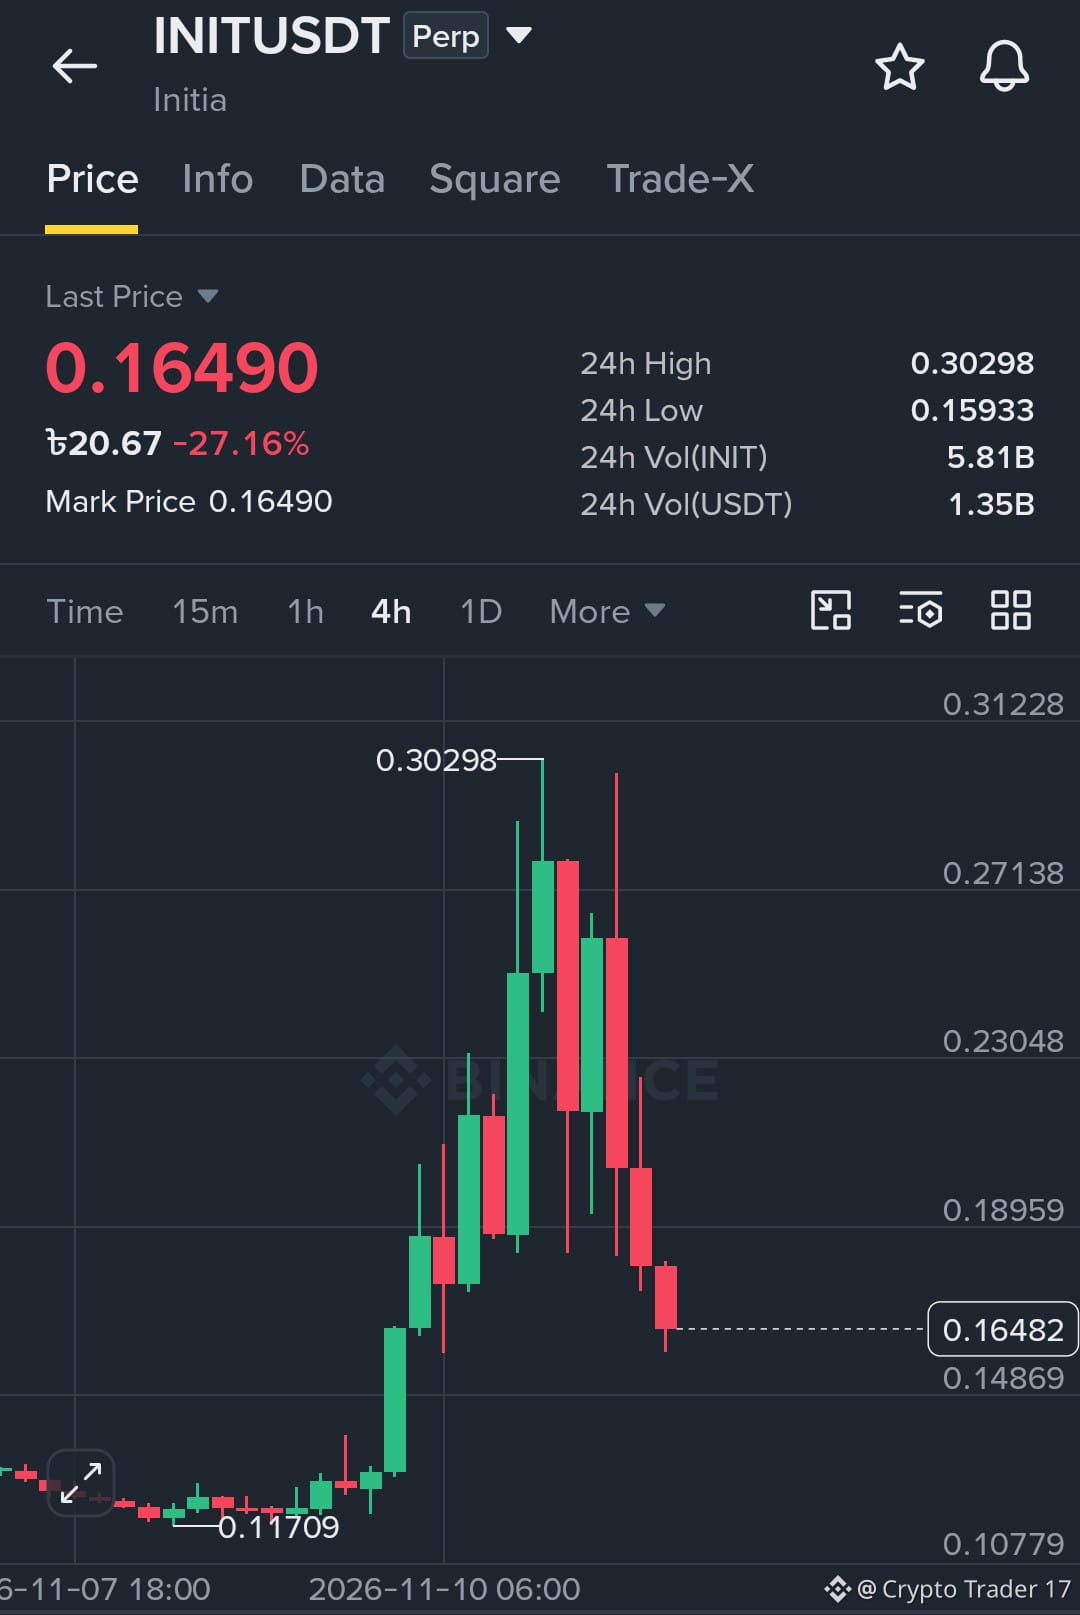
• Price action and candlesticks: The price began declining from a local high of 0.32398 and has continued on a downward path. It is currently trading near the 24-hour low (0.16515) within a narrow range, suggesting an attempt to form a short-term support base.
• Moving averages (EMA): The averages are clearly aligned in a bearish formation, supporting the continuation of the broader downtrend. The price is below EMA(7) at 0.17151, below EMA(25) at 0.19748, and below EMA(99) at 0.23425.
• KDJ indicator: The indicator lines are deep in oversold territory (K: 12.24, D: 11.89, and J: 12.94). These very low levels usually indicate weakening selling momentum and the possibility of an upward corrective bounce.
• MACD indicator: The indicator values remain negative (DIF at -0.02082 and DEA at -0.02155), but the DIF line crossing above DEA and the appearance of very small green histogram bars (MACD: 0.00072) reflect an initial weakening in downward momentum.
Opportunity or trap?
Technical analysis and indicators
• Price action and candlesticks: The price began declining from a local high of 0.32398 and has continued on a downward path. It is currently trading near the 24-hour low (0.16515) within a narrow range, suggesting an attempt to form a short-term support base.
• Moving averages (EMA): The averages are clearly aligned in a bearish formation, supporting the continuation of the broader downtrend. The price is below EMA(7) at 0.17151, below EMA(25) at 0.19748, and below EMA(99) at 0.23425.
• KDJ indicator: The indicator lines are deep in oversold territory (K: 12.24, D: 11.89, and J: 12.94). These very low levels usually indicate weakening selling momentum and the possibility of an upward corrective bounce.
• MACD indicator: The indicator values remain negative (DIF at -0.02082 and DEA at -0.02155), but the DIF line crossing above DEA and the appearance of very small green histogram bars (MACD: 0.00072) reflect an initial weakening in downward momentum.
Log in to explore more content