
D O G A R
3.4k Posts

D O G A R
Report
Block User
Just a crypto trader 🤟
Open Trade

ENA Holder
High-Frequency Trader
3 Years
11 Following
141 Followers
1.7K+ Liked
Posts
Portfolio
All
Quotes
Videos
·
--

Article
Dear Market, Please Wake Up: When Are We Getting Our Ultimate Bitcoin Bull Run Back? 🚀🔥🐂$BNB
Look at this image—a majestic black bull charging fiercely up an endless green mountain, with a trader sprinting toward the top of absolute financial freedom. Every single one of us entered the crypto space dreaming of this exact chart. We stared at the red candles, weathered the endless months of sideways torture, and held onto our spot bags through every dip because we believed in the macro vision of Bitcoin shattering records.
Yet, lately, reality feels like the complete opposite. Instead of charging bulls and unstoppable green waves, our portfolios have been bleeding day after day. We check our balances, watch macro uncertainty drag $BTC down into frustrating ranges, and feel that quiet exhaustion creeping in. Hope starts fading when every bounce gets sold off and every breakout turns into a trap.
Dear market, we are tired of the pain. We are tired of watching our hard-earned gains evaporate while we wait for momentum to return. It is time to let the bulls take over completely. We want the green candles back, we want the short squeezes to obliterate the bears, and we want BTC to spark the massive, life-changing rally that brings joy back to every retail wallet.
$ETH
The bull is ready to charge. Market, please... pump! 🚀💚
Who is ready to see Bitcoin unleash the ultimate green breakout and prove the bears wrong? Drop a massive 🚀 or 🐂 in the comments if you are still holding on for the glory days! 👇
Dear Market, Please Wake Up: When Are We Getting Our Ultimate Bitcoin Bull Run Back? 🚀🔥
🐂$BNB
Look at this image—a majestic black bull charging fiercely up an endless green mountain, with a trader sprinting toward the top of absolute financial freedom. Every single one of us entered the crypto space dreaming of this exact chart. We stared at the red candles, weathered the endless months of sideways torture, and held onto our spot bags through every dip because we believed in the macro vision of Bitcoin shattering records.
Yet, lately, reality feels like the complete opposite. Instead of charging bulls and unstoppable green waves, our portfolios have been bleeding day after day. We check our balances, watch macro uncertainty drag $BTC down into frustrating ranges, and feel that quiet exhaustion creeping in. Hope starts fading when every bounce gets sold off and every breakout turns into a trap.
Dear market, we are tired of the pain. We are tired of watching our hard-earned gains evaporate while we wait for momentum to return. It is time to let the bulls take over completely. We want the green candles back, we want the short squeezes to obliterate the bears, and we want BTC to spark the massive, life-changing rally that brings joy back to every retail wallet.
$ETH
The bull is ready to charge. Market, please... pump! 🚀💚
Who is ready to see Bitcoin unleash the ultimate green breakout and prove the bears wrong? Drop a massive 🚀 or 🐂 in the comments if you are still holding on for the glory days! 👇
Look at this image—a majestic black bull charging fiercely up an endless green mountain, with a trader sprinting toward the top of absolute financial freedom. Every single one of us entered the crypto space dreaming of this exact chart. We stared at the red candles, weathered the endless months of sideways torture, and held onto our spot bags through every dip because we believed in the macro vision of Bitcoin shattering records.
Yet, lately, reality feels like the complete opposite. Instead of charging bulls and unstoppable green waves, our portfolios have been bleeding day after day. We check our balances, watch macro uncertainty drag $BTC down into frustrating ranges, and feel that quiet exhaustion creeping in. Hope starts fading when every bounce gets sold off and every breakout turns into a trap.
Dear market, we are tired of the pain. We are tired of watching our hard-earned gains evaporate while we wait for momentum to return. It is time to let the bulls take over completely. We want the green candles back, we want the short squeezes to obliterate the bears, and we want BTC to spark the massive, life-changing rally that brings joy back to every retail wallet.
$ETH
The bull is ready to charge. Market, please... pump! 🚀💚
Who is ready to see Bitcoin unleash the ultimate green breakout and prove the bears wrong? Drop a massive 🚀 or 🐂 in the comments if you are still holding on for the glory days! 👇
29
·
--
Bearish
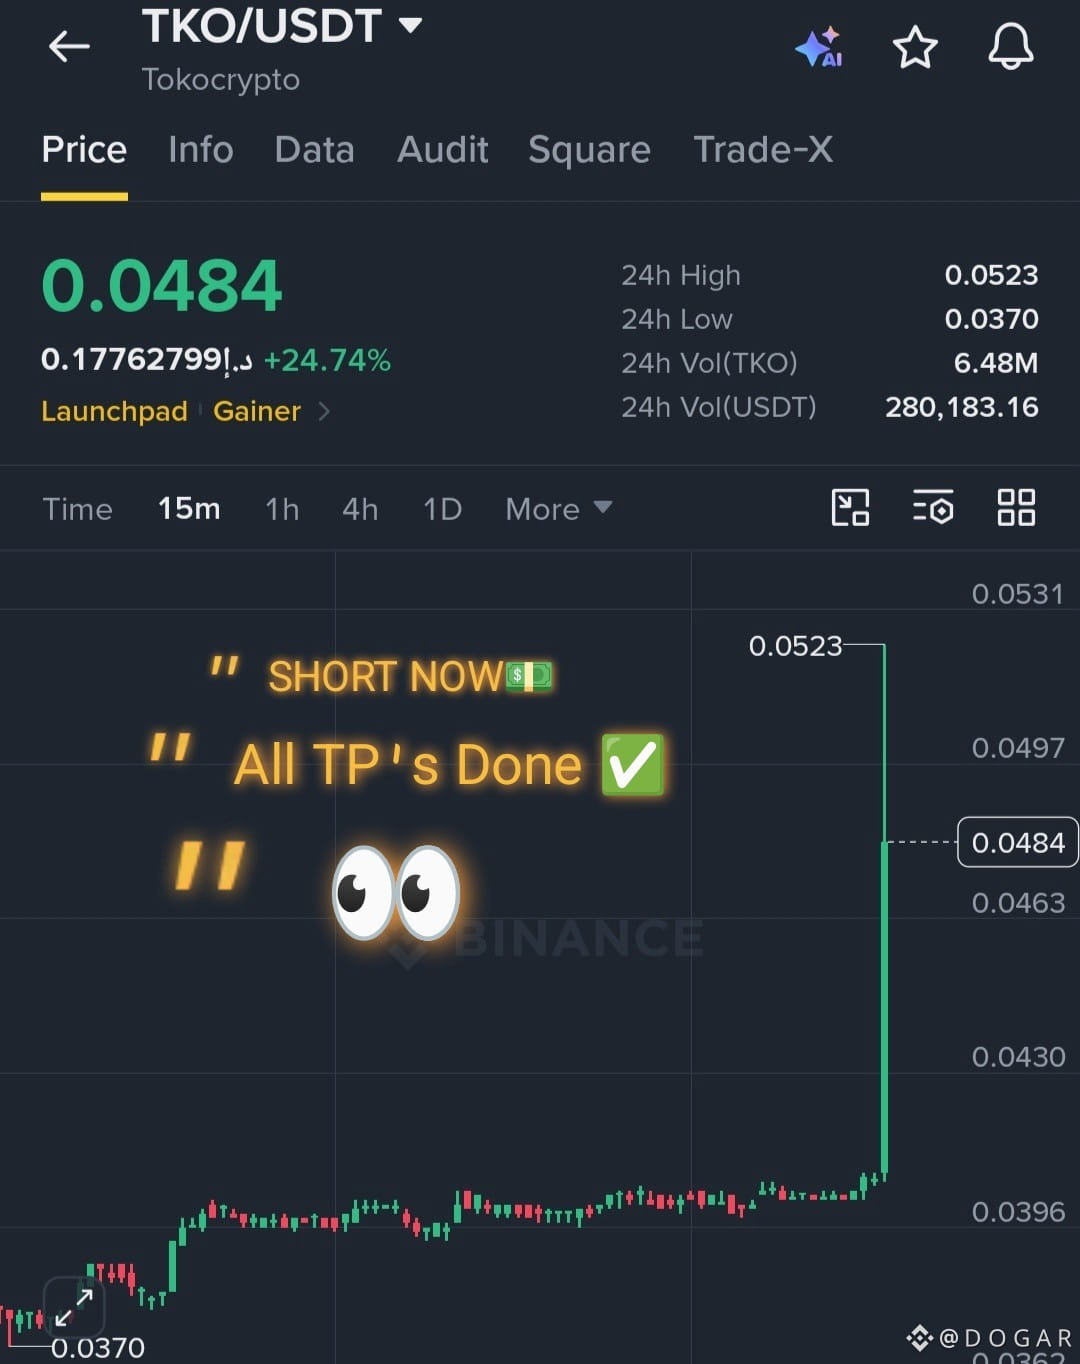
✅ Entry Zone: ~$0.0480 – $0.0490 🎯
✅ TP1 ($0.0450): SMASHED! 🎯
✅ TP2 ($0.0420): SMASHED! 🎯
✅ Final Target — TP3 ($0.0398): WIPED OUT! 🎯📉
When a low-cap spike runs out of volume, mean reversion is ruthless. Patience, clean levels, and strict discipline always win in the end. Make sure you lock in those profits and protect your capital!
$TKO
{spot}(TKOUSDT)
#CryptoSelloffTriggersMultipleWhaleLiquidations
✅ Entry Zone: ~$0.0480 – $0.0490 🎯
✅ TP1 ($0.0450): SMASHED! 🎯
✅ TP2 ($0.0420): SMASHED! 🎯
✅ Final Target — TP3 ($0.0398): WIPED OUT! 🎯📉
When a low-cap spike runs out of volume, mean reversion is ruthless. Patience, clean levels, and strict discipline always win in the end. Make sure you lock in those profits and protect your capital!
$TKO
#CryptoSelloffTriggersMultipleWhaleLiquidations
✅ TP1 ($0.0450): SMASHED! 🎯
✅ TP2 ($0.0420): SMASHED! 🎯
✅ Final Target — TP3 ($0.0398): WIPED OUT! 🎯📉
When a low-cap spike runs out of volume, mean reversion is ruthless. Patience, clean levels, and strict discipline always win in the end. Make sure you lock in those profits and protect your capital!
$TKO
#CryptoSelloffTriggersMultipleWhaleLiquidations
4
1
71
·
--
Bearish
🚨 Brutal Upper Wick Rejection! Is $TKO Ready to Rewind This Entire Spike? 📉💸
Sellers just slammed the door on the vertical pump — here is the exact short setup. ⚡
$TKO
{spot}(TKOUSDT)
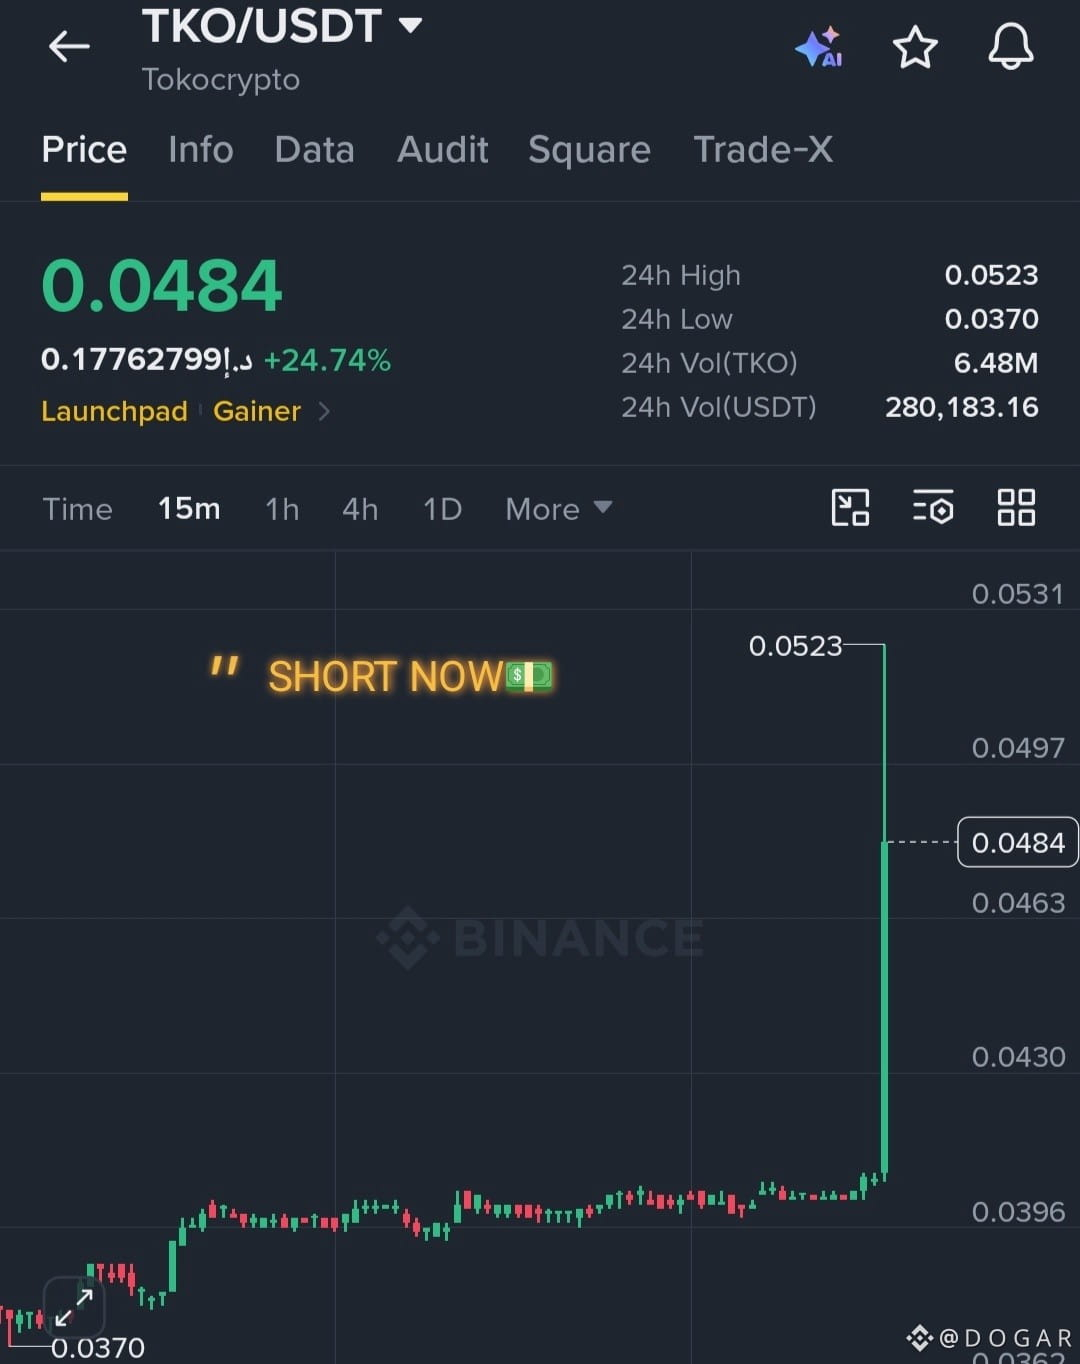
Looking at the $TKO/USDT (Tokocrypto) 15-minute chart, price spiked vertically up to a $0.0523 24-hour high (+24.74% 24h) before leaving a massive rejection wick and pulling back to $0.0484. With relatively thin volume (6.48M TKO / $280.18K USDT) fueling an overextended god-candle from the $0.0370 base, aggressive profit-taking is kicking in, setting up a sharp mean-reversion drop.
📊 24h: +24.74% | Vol: $280.18K
Trade Plan:
Short Entry: Current market zone (~$0.0480 – $0.0490) 🔴
Stop Loss: $0.0530 🛑
TP1: $0.0450 🎯
TP2: $0.0420 🎯
Final Target (TP3): $0.0398 🎯📉
⚖️ Risk:Reward (TP2) — ~1:1.45
Trigger: Immediate entry or on a confirmed 15m candle close below the $0.0480 level.
Risk Note: Low-cap Launchpad gainers with sudden vertical spikes can experience violent secondary liquidity wicks. Keep leverage low, secure partial profits at each target, and respect your stop-loss!
Are you shorting this $TKO rejection wick or staying on the sidelines? Drop your targets below! 👇
🚨 Brutal Upper Wick Rejection! Is $TKO Ready to Rewind This Entire Spike? 📉💸
Sellers just slammed the door on the vertical pump — here is the exact short setup. ⚡
$TKO
Looking at the $TKO /USDT (Tokocrypto) 15-minute chart, price spiked vertically up to a $0.0523 24-hour high (+24.74% 24h) before leaving a massive rejection wick and pulling back to $0.0484. With relatively thin volume (6.48M TKO / $280.18K USDT) fueling an overextended god-candle from the $0.0370 base, aggressive profit-taking is kicking in, setting up a sharp mean-reversion drop.
📊 24h: +24.74% | Vol: $280.18K
Trade Plan:
Short Entry: Current market zone (~$0.0480 – $0.0490) 🔴
Stop Loss: $0.0530 🛑
TP1: $0.0450 🎯
TP2: $0.0420 🎯
Final Target (TP3): $0.0398 🎯📉
⚖️ Risk:Reward (TP2) — ~1:1.45
Trigger: Immediate entry or on a confirmed 15m candle close below the $0.0480 level.
Risk Note: Low-cap Launchpad gainers with sudden vertical spikes can experience violent secondary liquidity wicks. Keep leverage low, secure partial profits at each target, and respect your stop-loss!
Are you shorting this $TKO rejection wick or staying on the sidelines? Drop your targets below! 👇
Sellers just slammed the door on the vertical pump — here is the exact short setup. ⚡
$TKO
Looking at the $TKO /USDT (Tokocrypto) 15-minute chart, price spiked vertically up to a $0.0523 24-hour high (+24.74% 24h) before leaving a massive rejection wick and pulling back to $0.0484. With relatively thin volume (6.48M TKO / $280.18K USDT) fueling an overextended god-candle from the $0.0370 base, aggressive profit-taking is kicking in, setting up a sharp mean-reversion drop.
📊 24h: +24.74% | Vol: $280.18K
Trade Plan:
Short Entry: Current market zone (~$0.0480 – $0.0490) 🔴
Stop Loss: $0.0530 🛑
TP1: $0.0450 🎯
TP2: $0.0420 🎯
Final Target (TP3): $0.0398 🎯📉
⚖️ Risk:Reward (TP2) — ~1:1.45
Trigger: Immediate entry or on a confirmed 15m candle close below the $0.0480 level.
Risk Note: Low-cap Launchpad gainers with sudden vertical spikes can experience violent secondary liquidity wicks. Keep leverage low, secure partial profits at each target, and respect your stop-loss!
Are you shorting this $TKO rejection wick or staying on the sidelines? Drop your targets below! 👇
3
1
40
·
--
Bullish
🚀 The Pump is On! Is $AUDIO Ready to Explode Past $0.0165? 🟢💸
Bulls just fired up an absolute powerhouse breakout — blink and you'll miss the rocket launch! ⚡
$AUDIO
{spot}(AUDIOUSDT)
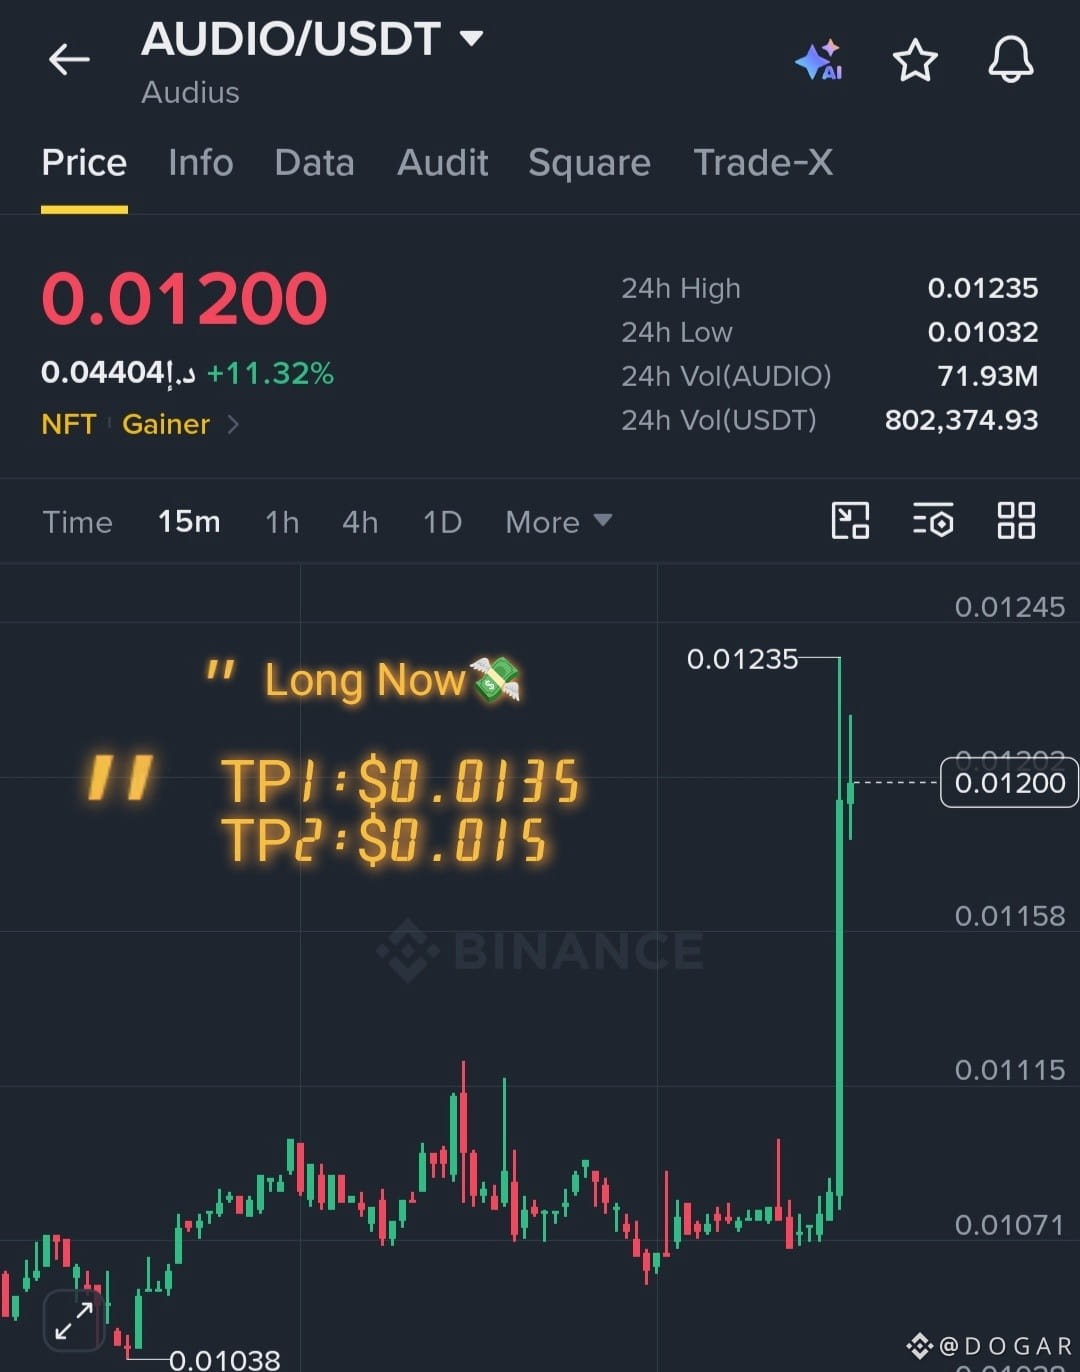
Looking at the $AUDIO/USDT 15-minute chart, price has surged +11.32% to $0.01200, ripping upward from its $0.01032 24-hour low and pressing right against the $0.01235 resistance ceiling. Backed by solid volume (71.93M AUDIO / $802.37K USDT) and unstoppable green momentum, this breakout is screaming continuation.
Trade Plan:
DCA Entry Zones: Entry 1: $0.0110 | Entry 2: $0.0103 🟢
Stop Loss: $0.0097 🛑
TP1: $0.0135 🎯
TP2: $0.0150 🎯
Final Target (TP3): $0.0165 🎯🚀
⚖️ Risk:Reward (TP2) — ~1:2.1
Trigger: Scale into entries on pullbacks or on a confirmed 15m candle close breaking above the $0.01235 high.
Risk Note: Momentum breakouts bring volatility and sharp retest wicks. Lock in partial profits at each target, trail your stops, and manage your leverage tightly!
Which target are you locking in first on $AUDIO? Drop it below! 👇
🚀 The Pump is On! Is $AUDIO Ready to Explode Past $0.0165? 🟢💸
Bulls just fired up an absolute powerhouse breakout — blink and you'll miss the rocket launch! ⚡
$AUDIO
Looking at the $AUDIO /USDT 15-minute chart, price has surged +11.32% to $0.01200, ripping upward from its $0.01032 24-hour low and pressing right against the $0.01235 resistance ceiling. Backed by solid volume (71.93M AUDIO / $802.37K USDT) and unstoppable green momentum, this breakout is screaming continuation.
Trade Plan:
DCA Entry Zones: Entry 1: $0.0110 | Entry 2: $0.0103 🟢
Stop Loss: $0.0097 🛑
TP1: $0.0135 🎯
TP2: $0.0150 🎯
Final Target (TP3): $0.0165 🎯🚀
⚖️ Risk:Reward (TP2) — ~1:2.1
Trigger: Scale into entries on pullbacks or on a confirmed 15m candle close breaking above the $0.01235 high.
Risk Note: Momentum breakouts bring volatility and sharp retest wicks. Lock in partial profits at each target, trail your stops, and manage your leverage tightly!
Which target are you locking in first on $AUDIO ? Drop it below! 👇
Bulls just fired up an absolute powerhouse breakout — blink and you'll miss the rocket launch! ⚡
$AUDIO
Looking at the $AUDIO /USDT 15-minute chart, price has surged +11.32% to $0.01200, ripping upward from its $0.01032 24-hour low and pressing right against the $0.01235 resistance ceiling. Backed by solid volume (71.93M AUDIO / $802.37K USDT) and unstoppable green momentum, this breakout is screaming continuation.
Trade Plan:
DCA Entry Zones: Entry 1: $0.0110 | Entry 2: $0.0103 🟢
Stop Loss: $0.0097 🛑
TP1: $0.0135 🎯
TP2: $0.0150 🎯
Final Target (TP3): $0.0165 🎯🚀
⚖️ Risk:Reward (TP2) — ~1:2.1
Trigger: Scale into entries on pullbacks or on a confirmed 15m candle close breaking above the $0.01235 high.
Risk Note: Momentum breakouts bring volatility and sharp retest wicks. Lock in partial profits at each target, trail your stops, and manage your leverage tightly!
Which target are you locking in first on $AUDIO ? Drop it below! 👇
6
1
39
·
--
Bullish
🚀 The Monster God-Candle is Here! Is $RARE Ready to Explode Past $0.0165? 🟢💸
Bulls just shattered the ceiling with an absolute powerhouse breakout — blink and you'll miss the rocket launch! ⚡
$RARE
{future}(RAREUSDT)
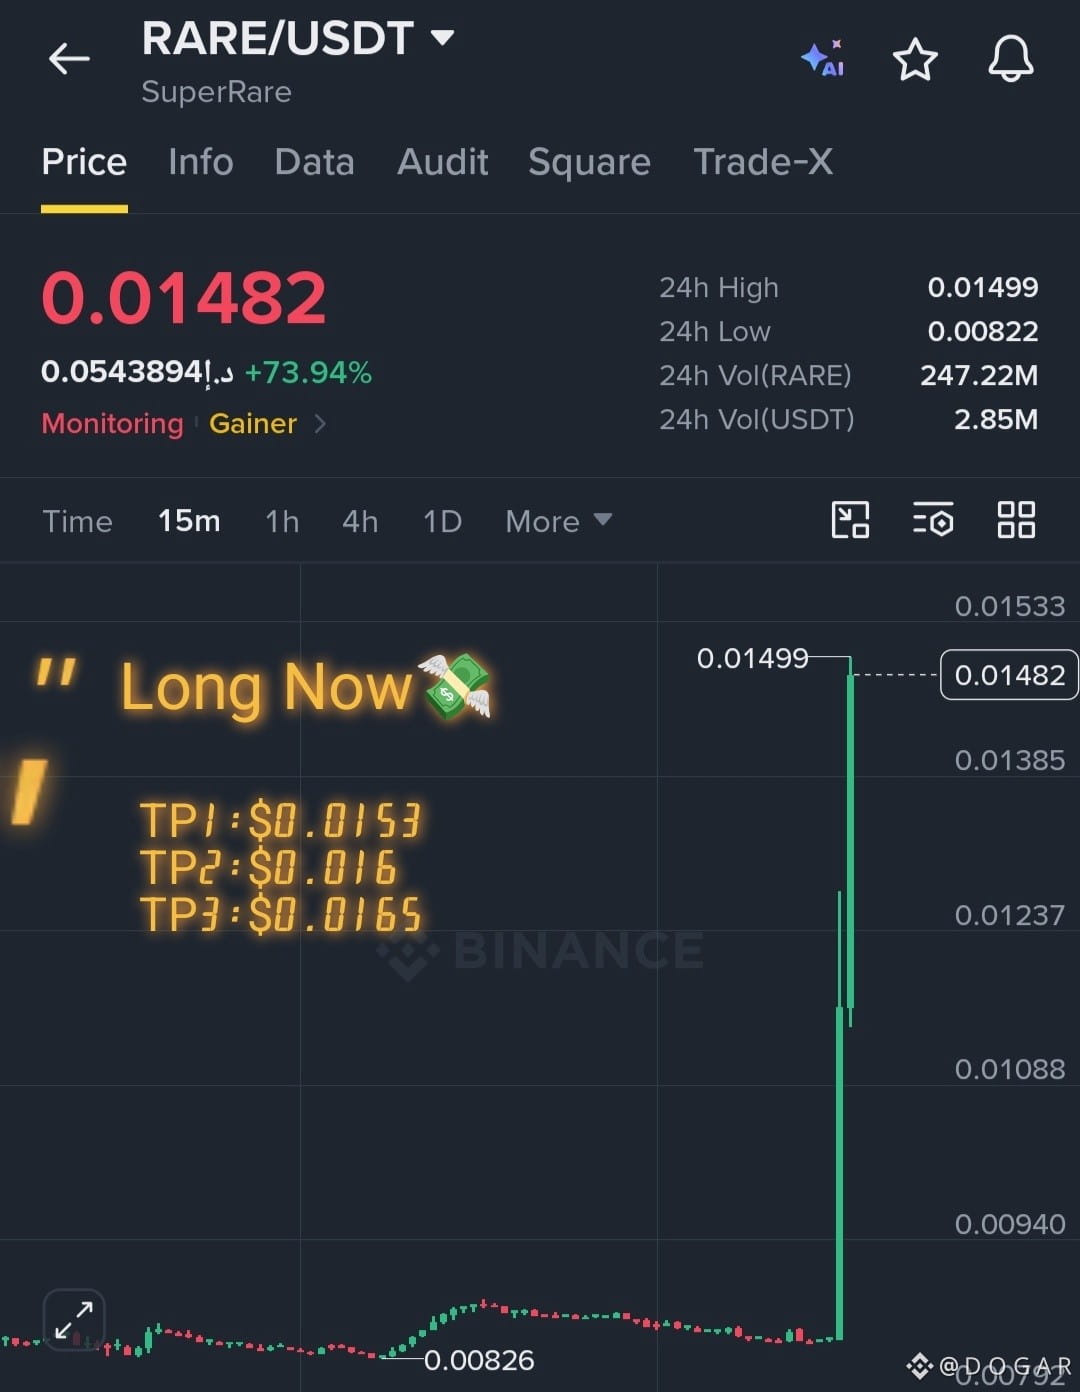
Looking at the $RARE/USDT 15-minute chart, price has gone parabolic, skyrocketing +73.94% to $0.01482, ripping violently from its $0.00822 24-hour low and pressing right against the $0.01499 resistance ceiling. Backed by massive volume (247.22M RARE / $2.85M USDT) and pure unstoppable green momentum, this breakout is screaming continuation.
📊 24h: +73.94% | Vol: $2.85M
Trade Plan:
Long Entry: Current market zone (~$0.0105 – $0.0119) 🟢
Stop Loss: $0.0135 🛑
TP1: $0.0153 🎯
TP2: $0.0160 🎯
Final Target (TP3): $0.0165 🎯🚀
⚖️ Risk:Reward (TP2) — ~1:1.8
Trigger: Immediate entry or on a confirmed 15m candle close breaking above the $0.01499 high.
Risk Note: Parabolic +73% breakouts bring extreme volatility and sharp retest wicks. Lock in partial profits at each target, trail your stops, and manage your leverage tightly!
Which target are you locking in first on $RARE? Drop it below! 👇
🚀 The Monster God-Candle is Here! Is $RARE Ready to Explode Past $0.0165? 🟢💸
Bulls just shattered the ceiling with an absolute powerhouse breakout — blink and you'll miss the rocket launch! ⚡
$RARE
Looking at the $RARE /USDT 15-minute chart, price has gone parabolic, skyrocketing +73.94% to $0.01482, ripping violently from its $0.00822 24-hour low and pressing right against the $0.01499 resistance ceiling. Backed by massive volume (247.22M RARE / $2.85M USDT) and pure unstoppable green momentum, this breakout is screaming continuation.
📊 24h: +73.94% | Vol: $2.85M
Trade Plan:
Long Entry: Current market zone (~$0.0105 – $0.0119) 🟢
Stop Loss: $0.0135 🛑
TP1: $0.0153 🎯
TP2: $0.0160 🎯
Final Target (TP3): $0.0165 🎯🚀
⚖️ Risk:Reward (TP2) — ~1:1.8
Trigger: Immediate entry or on a confirmed 15m candle close breaking above the $0.01499 high.
Risk Note: Parabolic +73% breakouts bring extreme volatility and sharp retest wicks. Lock in partial profits at each target, trail your stops, and manage your leverage tightly!
Which target are you locking in first on $RARE ? Drop it below! 👇
Bulls just shattered the ceiling with an absolute powerhouse breakout — blink and you'll miss the rocket launch! ⚡
$RARE
Looking at the $RARE /USDT 15-minute chart, price has gone parabolic, skyrocketing +73.94% to $0.01482, ripping violently from its $0.00822 24-hour low and pressing right against the $0.01499 resistance ceiling. Backed by massive volume (247.22M RARE / $2.85M USDT) and pure unstoppable green momentum, this breakout is screaming continuation.
📊 24h: +73.94% | Vol: $2.85M
Trade Plan:
Long Entry: Current market zone (~$0.0105 – $0.0119) 🟢
Stop Loss: $0.0135 🛑
TP1: $0.0153 🎯
TP2: $0.0160 🎯
Final Target (TP3): $0.0165 🎯🚀
⚖️ Risk:Reward (TP2) — ~1:1.8
Trigger: Immediate entry or on a confirmed 15m candle close breaking above the $0.01499 high.
Risk Note: Parabolic +73% breakouts bring extreme volatility and sharp retest wicks. Lock in partial profits at each target, trail your stops, and manage your leverage tightly!
Which target are you locking in first on $RARE ? Drop it below! 👇
10
1
708
·
--

Article
The Crypto Rollercoaster: Why BTC, ETH, and BNB Are Bleeding Red! 📉⚡Crypto charts are screaming red, leaving portfolios bruised and traders scrambling for answers. Why are Bitcoin (BTC), Ethereum (ETH), and Binance Coin (BNB) experiencing such brutal instability right now?
$BNB
The chaos isn't random—it's driven by three massive macro forces:
Hot Inflation & Hawkish Fed Fears: Stubborn consumer price data has crushed hopes for immediate rate cuts, spiking Treasury yields and strengthening the U.S. dollar. When safer government bonds pay close to 5%, risk-off capital flees yieldless assets like crypto.
Bleeding Spot ETF Outflows: Institutional demand has cooled dramatically, with billions rushing out of spot exchange-traded funds over consecutive trading sessions.
Leverage Liquidations: Overconfident long positions have triggered cascading liquidations, turning routine technical corrections into violent market crashes.
Macro pressure and liquidations dictate the short-term noise, but patience and strict risk management always separate the survivors from the liquidated. Stay sharp out there! 🛡️$ETH $BTC
The Crypto Rollercoaster: Why BTC, ETH, and BNB Are Bleeding Red! 📉⚡
Crypto charts are screaming red, leaving portfolios bruised and traders scrambling for answers. Why are Bitcoin (BTC), Ethereum (ETH), and Binance Coin (BNB) experiencing such brutal instability right now?
$BNB
The chaos isn't random—it's driven by three massive macro forces:
Hot Inflation & Hawkish Fed Fears: Stubborn consumer price data has crushed hopes for immediate rate cuts, spiking Treasury yields and strengthening the U.S. dollar. When safer government bonds pay close to 5%, risk-off capital flees yieldless assets like crypto.
Bleeding Spot ETF Outflows: Institutional demand has cooled dramatically, with billions rushing out of spot exchange-traded funds over consecutive trading sessions.
Leverage Liquidations: Overconfident long positions have triggered cascading liquidations, turning routine technical corrections into violent market crashes.
Macro pressure and liquidations dictate the short-term noise, but patience and strict risk management always separate the survivors from the liquidated. Stay sharp out there! 🛡️$ETH $BTC
$BNB
The chaos isn't random—it's driven by three massive macro forces:
Hot Inflation & Hawkish Fed Fears: Stubborn consumer price data has crushed hopes for immediate rate cuts, spiking Treasury yields and strengthening the U.S. dollar. When safer government bonds pay close to 5%, risk-off capital flees yieldless assets like crypto.
Bleeding Spot ETF Outflows: Institutional demand has cooled dramatically, with billions rushing out of spot exchange-traded funds over consecutive trading sessions.
Leverage Liquidations: Overconfident long positions have triggered cascading liquidations, turning routine technical corrections into violent market crashes.
Macro pressure and liquidations dictate the short-term noise, but patience and strict risk management always separate the survivors from the liquidated. Stay sharp out there! 🛡️$ETH $BTC
5
1
212
·
--
Bearish
🚨 The Party is Over! Is $BARD Ready for a Massive Bearish Breakdown? 📉💸
$BARD
{future}(BARDUSDT)
Bulls are completely exhausted as heavy selling pressure takes over — here is the exact short setup. ⚡
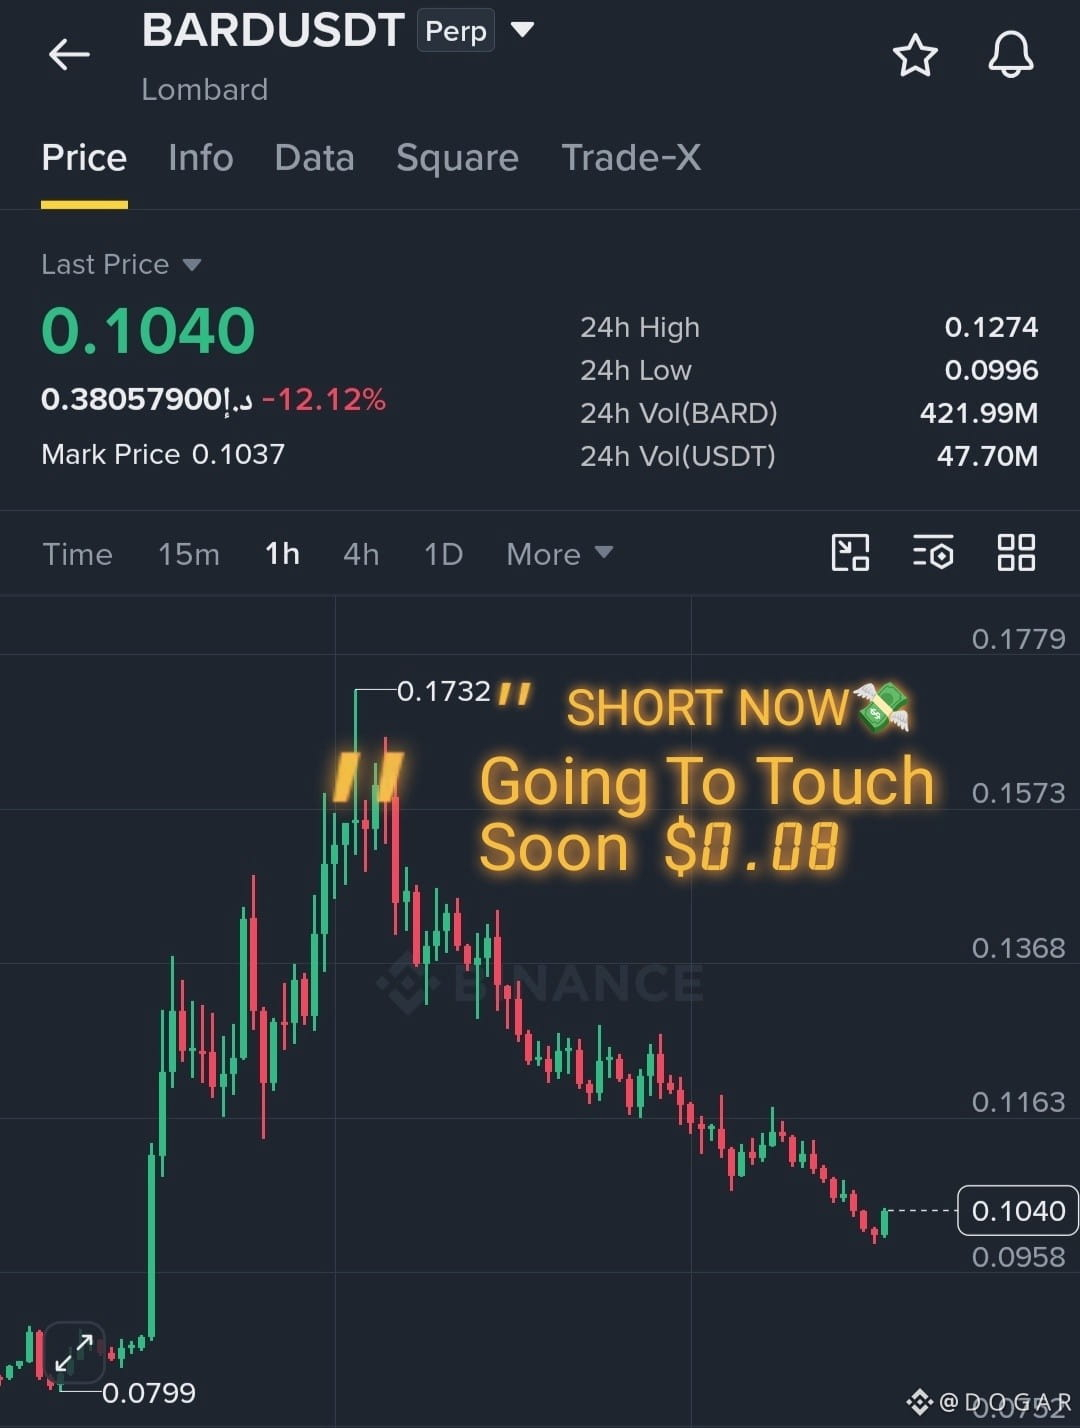
Looking at the $BARD/USDT Perpetual 1-hour chart, price has slipped -12.12% down to $0.1040, bleeding steadily after a sharp rejection from its $0.1732 swing high and testing near the $0.0996 24-hour low. With massive volume (421.99M BARD / $47.70M USDT) and a clear descending market structure forming lower highs, sellers are primed to drag this down to deeper support levels.
📊 24h: -12.12% | Vol: $47.70M
Trade Plan:
Short Entry Zone: $0.1060 – $0.1080 🔴
Stop Loss (SL): $0.1130 🛑
TP1: $0.0970 🎯
TP2: $0.0900 🎯
Final Target (TP3): $0.0870 🎯📉
⚖️ Risk:Reward (TP2) — ~1:2.4
Trigger: Immediate entry within the zone or on a confirmed continuation breakdown below local support.
Risk Note: Bearish breakdown setups on volatile perpetuals can experience sharp counter-trend bounce wicks. Manage your leverage tightly, secure partial profits as targets drop, and stick strictly to your stop-loss!
Are you shorting this $BARD drop or expecting a bounce? Drop your targets below! 👇
🚨 The Party is Over! Is $BARD Ready for a Massive Bearish Breakdown? 📉💸
$BARD
Bulls are completely exhausted as heavy selling pressure takes over — here is the exact short setup. ⚡
Looking at the $BARD /USDT Perpetual 1-hour chart, price has slipped -12.12% down to $0.1040, bleeding steadily after a sharp rejection from its $0.1732 swing high and testing near the $0.0996 24-hour low. With massive volume (421.99M BARD / $47.70M USDT) and a clear descending market structure forming lower highs, sellers are primed to drag this down to deeper support levels.
📊 24h: -12.12% | Vol: $47.70M
Trade Plan:
Short Entry Zone: $0.1060 – $0.1080 🔴
Stop Loss (SL): $0.1130 🛑
TP1: $0.0970 🎯
TP2: $0.0900 🎯
Final Target (TP3): $0.0870 🎯📉
⚖️ Risk:Reward (TP2) — ~1:2.4
Trigger: Immediate entry within the zone or on a confirmed continuation breakdown below local support.
Risk Note: Bearish breakdown setups on volatile perpetuals can experience sharp counter-trend bounce wicks. Manage your leverage tightly, secure partial profits as targets drop, and stick strictly to your stop-loss!
Are you shorting this $BARD drop or expecting a bounce? Drop your targets below! 👇
$BARD
Bulls are completely exhausted as heavy selling pressure takes over — here is the exact short setup. ⚡
Looking at the $BARD /USDT Perpetual 1-hour chart, price has slipped -12.12% down to $0.1040, bleeding steadily after a sharp rejection from its $0.1732 swing high and testing near the $0.0996 24-hour low. With massive volume (421.99M BARD / $47.70M USDT) and a clear descending market structure forming lower highs, sellers are primed to drag this down to deeper support levels.
📊 24h: -12.12% | Vol: $47.70M
Trade Plan:
Short Entry Zone: $0.1060 – $0.1080 🔴
Stop Loss (SL): $0.1130 🛑
TP1: $0.0970 🎯
TP2: $0.0900 🎯
Final Target (TP3): $0.0870 🎯📉
⚖️ Risk:Reward (TP2) — ~1:2.4
Trigger: Immediate entry within the zone or on a confirmed continuation breakdown below local support.
Risk Note: Bearish breakdown setups on volatile perpetuals can experience sharp counter-trend bounce wicks. Manage your leverage tightly, secure partial profits as targets drop, and stick strictly to your stop-loss!
Are you shorting this $BARD drop or expecting a bounce? Drop your targets below! 👇
4
2
170
·
--
Bullish
🚀 Explosive Parabolic Surge! Is $GLMR Ready to Smash Resistance and Push Toward $0.00835? 🟢💸
Buyers have just unleashed an absolute monster god-candle — here is the exact long setup. ⚡
$GLMR
{spot}(GLMRUSDT)
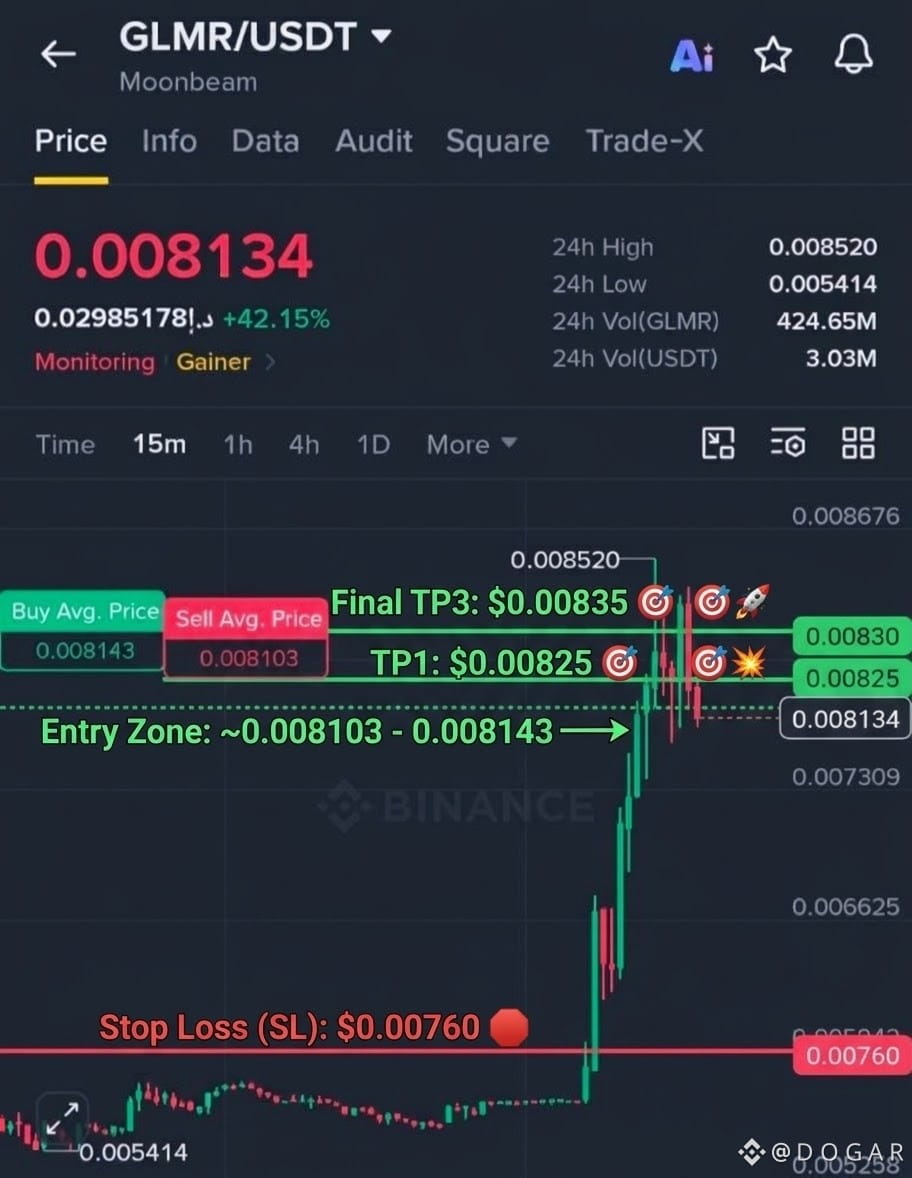
Looking at the $GLMR/USDT 15-minute chart, price has rocketed +42.15% to $0.008134, ripping violently upward from its $0.005414 24-hour low and testing the $0.008520 24-hour resistance high. Backed by massive volume (424.65M GLMR / $3.03M USDT) and relentless green momentum, bulls are firmly in control for a continuation push.
📊 24h: +42.15% | Vol: $3.03M
Trade Plan:
Long Entry: Current market zone (~$0.00800 – $0.00815) 🟢
Stop Loss: $0.00760 🛑
TP1: $0.00825 🎯
TP2: $0.00830 🎯
Final Target (TP3): $0.00835 🎯🚀 (As requested!)
⚖️ Risk:Reward (TP2) — ~1:1.6
Trigger: Immediate entry or on a confirmed 15m candle close above the $0.008520 resistance high.
Risk Note: Parabolic +42% moves carry explosive volatility and sharp retest wicks. Keep leverage moderate, lock in partial profits at each target, and stick strictly to your stop-loss!
Which target are you eyeing first on $GLMR? Drop it below! 👇
🚀 Explosive Parabolic Surge! Is $GLMR Ready to Smash Resistance and Push Toward $0.00835? 🟢💸
Buyers have just unleashed an absolute monster god-candle — here is the exact long setup. ⚡
$GLMR
Looking at the $GLMR /USDT 15-minute chart, price has rocketed +42.15% to $0.008134, ripping violently upward from its $0.005414 24-hour low and testing the $0.008520 24-hour resistance high. Backed by massive volume (424.65M GLMR / $3.03M USDT) and relentless green momentum, bulls are firmly in control for a continuation push.
📊 24h: +42.15% | Vol: $3.03M
Trade Plan:
Long Entry: Current market zone (~$0.00800 – $0.00815) 🟢
Stop Loss: $0.00760 🛑
TP1: $0.00825 🎯
TP2: $0.00830 🎯
Final Target (TP3): $0.00835 🎯🚀 (As requested!)
⚖️ Risk:Reward (TP2) — ~1:1.6
Trigger: Immediate entry or on a confirmed 15m candle close above the $0.008520 resistance high.
Risk Note: Parabolic +42% moves carry explosive volatility and sharp retest wicks. Keep leverage moderate, lock in partial profits at each target, and stick strictly to your stop-loss!
Which target are you eyeing first on $GLMR ? Drop it below! 👇
Buyers have just unleashed an absolute monster god-candle — here is the exact long setup. ⚡
$GLMR
Looking at the $GLMR /USDT 15-minute chart, price has rocketed +42.15% to $0.008134, ripping violently upward from its $0.005414 24-hour low and testing the $0.008520 24-hour resistance high. Backed by massive volume (424.65M GLMR / $3.03M USDT) and relentless green momentum, bulls are firmly in control for a continuation push.
📊 24h: +42.15% | Vol: $3.03M
Trade Plan:
Long Entry: Current market zone (~$0.00800 – $0.00815) 🟢
Stop Loss: $0.00760 🛑
TP1: $0.00825 🎯
TP2: $0.00830 🎯
Final Target (TP3): $0.00835 🎯🚀 (As requested!)
⚖️ Risk:Reward (TP2) — ~1:1.6
Trigger: Immediate entry or on a confirmed 15m candle close above the $0.008520 resistance high.
Risk Note: Parabolic +42% moves carry explosive volatility and sharp retest wicks. Keep leverage moderate, lock in partial profits at each target, and stick strictly to your stop-loss!
Which target are you eyeing first on $GLMR ? Drop it below! 👇
5
1
278
·
--
Bullish
🚀 Clean V-Shape Reversal! Is $ORCA Ready to Smash $1.310 After Sweeping Support? 🟢💸
Buyers have stepped in with serious conviction — here is the exact long setup. ⚡
$ORCA
{future}(ORCAUSDT)
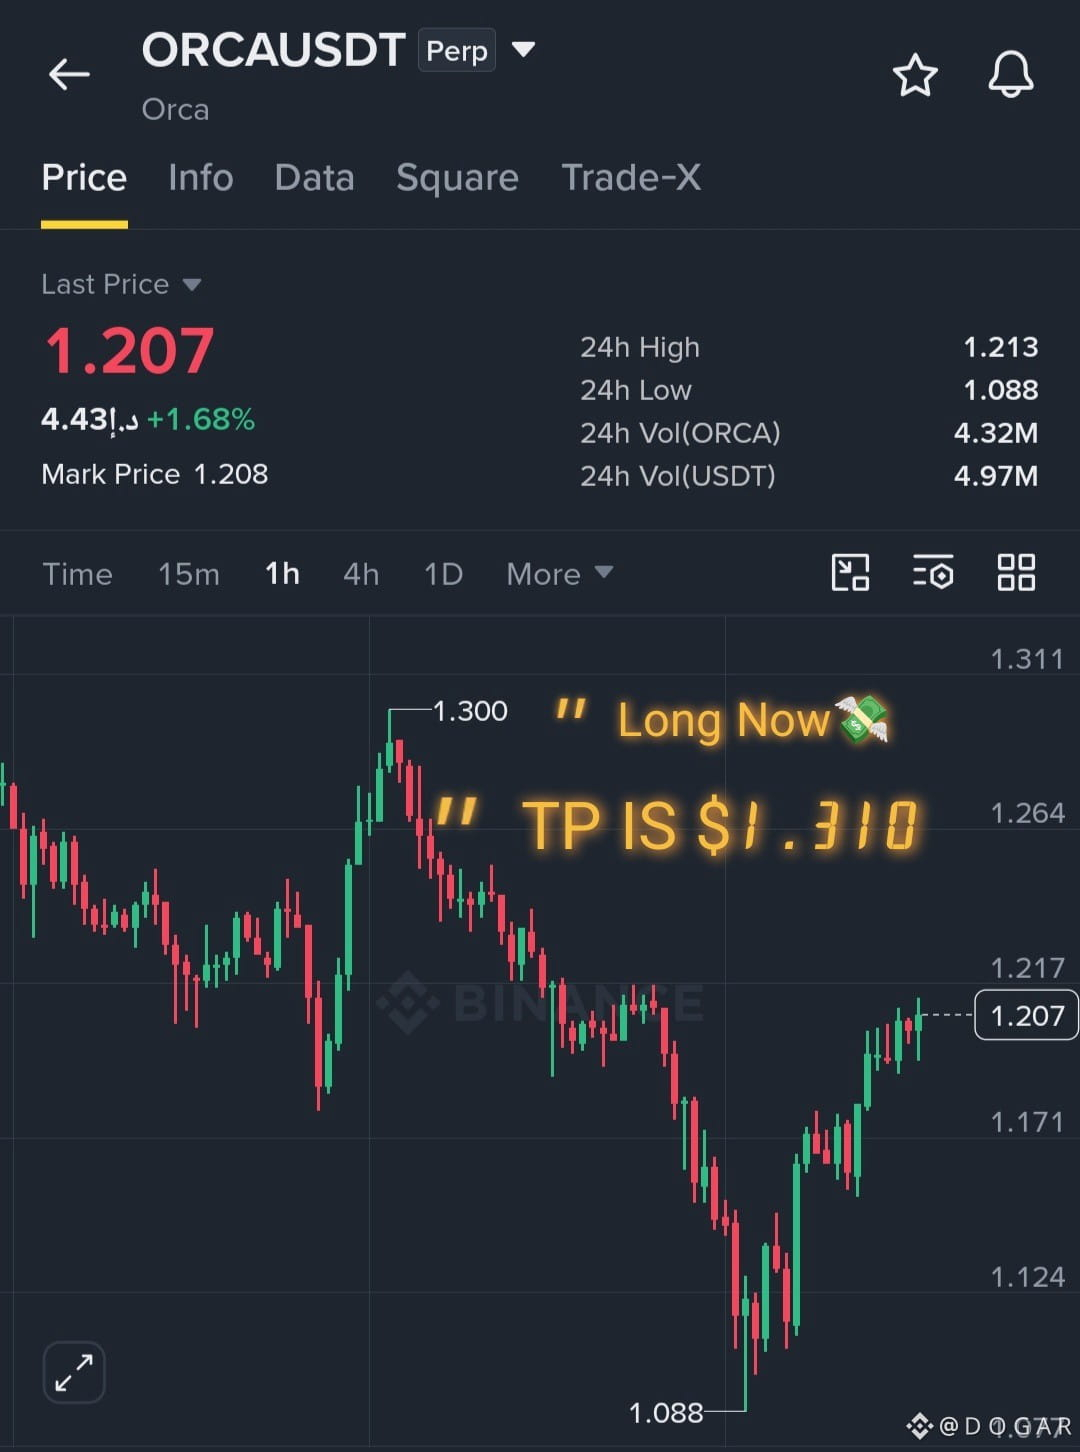
Looking at the $ORCA/USDT Perpetual 1-hour chart, price has staged a textbook recovery after sweeping liquidity down at the $1.088 24-hour low, climbing back to $1.207 (+1.68%) and pressing right against its $1.213 24-hour high. Backed by solid volume (4.32M ORCA / $4.97M USDT) and bullish structure building toward the recent $1.300 swing peak, momentum favors an upside continuation breakout.
📊 24h: +1.68% | Vol: $4.97M
Trade Plan:
Long Entry: Current market zone (~$1.200 – $1.210) 🟢
Stop Loss: $1.150 🛑
TP1: $1.245 🎯
TP2: $1.280 🎯
Final Target (TP3): $1.310 🎯🚀 (As marked on chart!)
⚖️ Risk:Reward (TP3) — ~1:1.8
Trigger: Immediate entry or on a confirmed 1h candle close above the $1.213 local resistance high.
Risk Note: Solana DeFi perpetuals can experience sharp liquidity sweeps near local resistance levels. Manage your leverage tightly, secure partial profits at each target, and respect your stop-loss!
Which target on $ORCA are you aiming for first? Drop it below! 👇
🚀 Clean V-Shape Reversal! Is $ORCA Ready to Smash $1.310 After Sweeping Support? 🟢💸
Buyers have stepped in with serious conviction — here is the exact long setup. ⚡
$ORCA
Looking at the $ORCA /USDT Perpetual 1-hour chart, price has staged a textbook recovery after sweeping liquidity down at the $1.088 24-hour low, climbing back to $1.207 (+1.68%) and pressing right against its $1.213 24-hour high. Backed by solid volume (4.32M ORCA / $4.97M USDT) and bullish structure building toward the recent $1.300 swing peak, momentum favors an upside continuation breakout.
📊 24h: +1.68% | Vol: $4.97M
Trade Plan:
Long Entry: Current market zone (~$1.200 – $1.210) 🟢
Stop Loss: $1.150 🛑
TP1: $1.245 🎯
TP2: $1.280 🎯
Final Target (TP3): $1.310 🎯🚀 (As marked on chart!)
⚖️ Risk:Reward (TP3) — ~1:1.8
Trigger: Immediate entry or on a confirmed 1h candle close above the $1.213 local resistance high.
Risk Note: Solana DeFi perpetuals can experience sharp liquidity sweeps near local resistance levels. Manage your leverage tightly, secure partial profits at each target, and respect your stop-loss!
Which target on $ORCA are you aiming for first? Drop it below! 👇
Buyers have stepped in with serious conviction — here is the exact long setup. ⚡
$ORCA
Looking at the $ORCA /USDT Perpetual 1-hour chart, price has staged a textbook recovery after sweeping liquidity down at the $1.088 24-hour low, climbing back to $1.207 (+1.68%) and pressing right against its $1.213 24-hour high. Backed by solid volume (4.32M ORCA / $4.97M USDT) and bullish structure building toward the recent $1.300 swing peak, momentum favors an upside continuation breakout.
📊 24h: +1.68% | Vol: $4.97M
Trade Plan:
Long Entry: Current market zone (~$1.200 – $1.210) 🟢
Stop Loss: $1.150 🛑
TP1: $1.245 🎯
TP2: $1.280 🎯
Final Target (TP3): $1.310 🎯🚀 (As marked on chart!)
⚖️ Risk:Reward (TP3) — ~1:1.8
Trigger: Immediate entry or on a confirmed 1h candle close above the $1.213 local resistance high.
Risk Note: Solana DeFi perpetuals can experience sharp liquidity sweeps near local resistance levels. Manage your leverage tightly, secure partial profits at each target, and respect your stop-loss!
Which target on $ORCA are you aiming for first? Drop it below! 👇
4
1
89
·
--
Bullish
🚀 Clean Staircase Breakout! Is $FF Ready to Smash Resistance and Push Past $0.105? 🟢💸
Buyers are stepping up with steady momentum — here is the exact long setup. ⚡
$FF
{future}(FFUSDT)
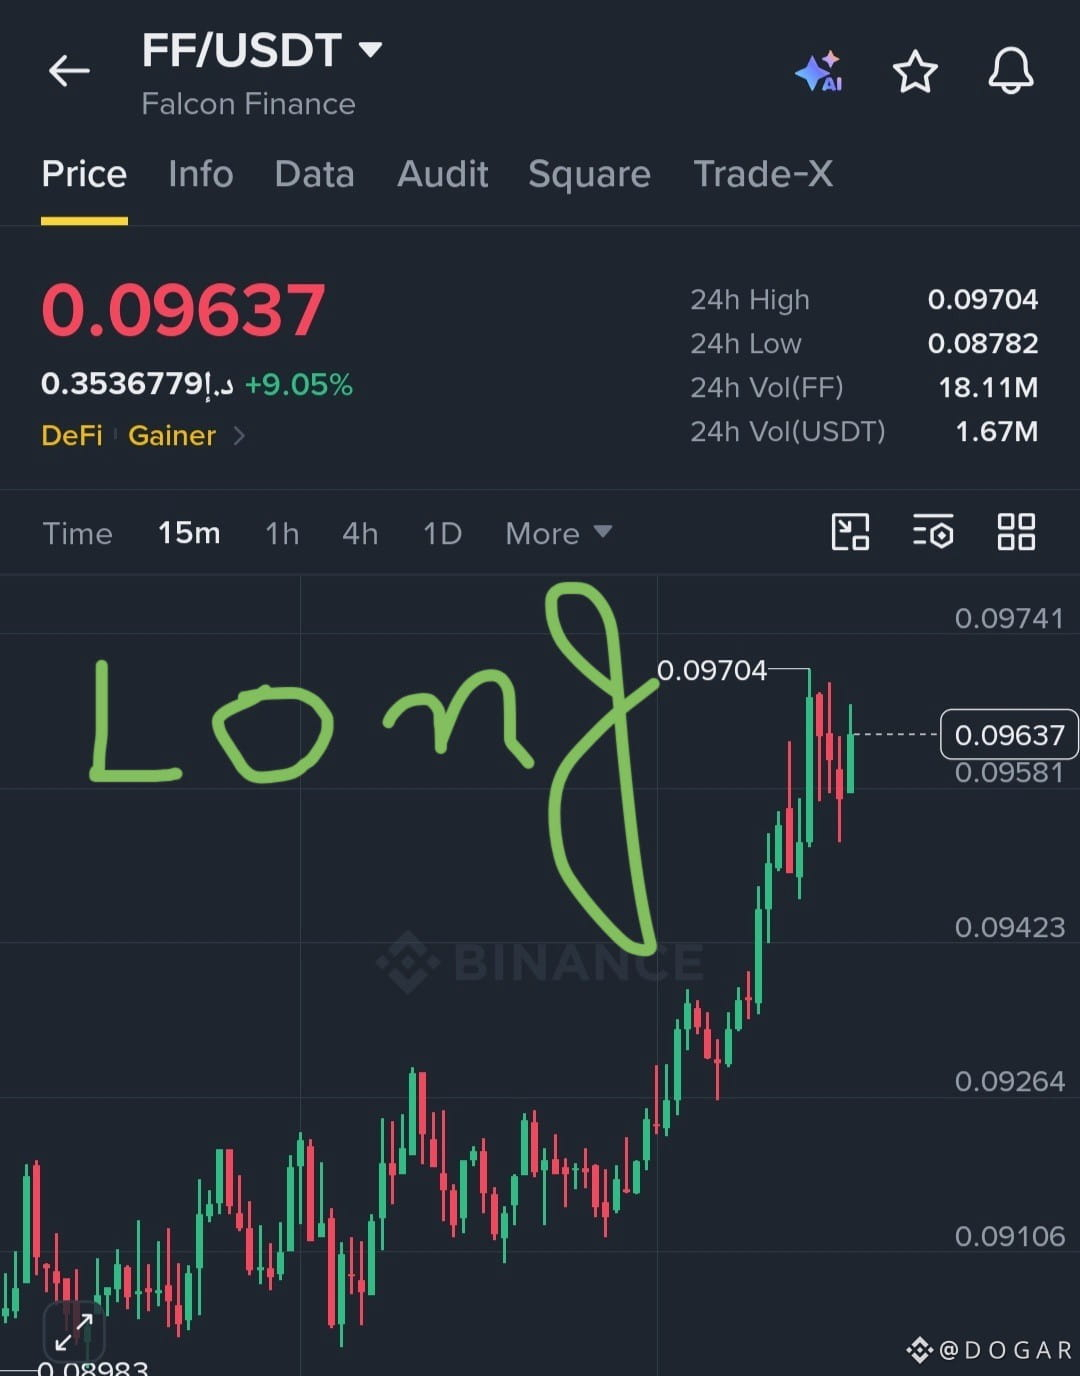
Looking at the $FF/USDT (Falcon Finance) 15-minute chart, price has climbed +9.05% to $0.09637, bouncing cleanly off its $0.08782 24-hour low and pressing right below the $0.09704 24-hour high. With solid volume (18.11M FF / $1.67M USDT) and a textbook series of higher lows holding support, DeFi bulls are positioning for an upside continuation breakout.
📊 24h: +9.05% | Vol: $1.67M
Trade Plan:
Long Entry: Current market zone (~$0.0955 – $0.0965) 🟢
Stop Loss: $0.0925 🛑
TP1: $0.0990 🎯
TP2: $0.1025 🎯
Final Target (TP3): $0.1060+ 🎯🚀
⚖️ Risk:Reward (TP2) — ~1:1.75
Trigger: Immediate entry or on a confirmed 15m candle close above the $0.09704 resistance high.
Risk Note: DeFi gainers near 24h highs can face brief liquidity sweeps before breaking out. Keep leverage moderate, lock in partial profits at each target, and stick strictly to your stop-loss!
Which target are you eyeing first on $FF? Drop it below! 👇
🚀 Clean Staircase Breakout! Is $FF Ready to Smash Resistance and Push Past $0.105? 🟢💸
Buyers are stepping up with steady momentum — here is the exact long setup. ⚡
$FF
Looking at the $FF /USDT (Falcon Finance) 15-minute chart, price has climbed +9.05% to $0.09637, bouncing cleanly off its $0.08782 24-hour low and pressing right below the $0.09704 24-hour high. With solid volume (18.11M FF / $1.67M USDT) and a textbook series of higher lows holding support, DeFi bulls are positioning for an upside continuation breakout.
📊 24h: +9.05% | Vol: $1.67M
Trade Plan:
Long Entry: Current market zone (~$0.0955 – $0.0965) 🟢
Stop Loss: $0.0925 🛑
TP1: $0.0990 🎯
TP2: $0.1025 🎯
Final Target (TP3): $0.1060+ 🎯🚀
⚖️ Risk:Reward (TP2) — ~1:1.75
Trigger: Immediate entry or on a confirmed 15m candle close above the $0.09704 resistance high.
Risk Note: DeFi gainers near 24h highs can face brief liquidity sweeps before breaking out. Keep leverage moderate, lock in partial profits at each target, and stick strictly to your stop-loss!
Which target are you eyeing first on $FF ? Drop it below! 👇
Buyers are stepping up with steady momentum — here is the exact long setup. ⚡
$FF
Looking at the $FF /USDT (Falcon Finance) 15-minute chart, price has climbed +9.05% to $0.09637, bouncing cleanly off its $0.08782 24-hour low and pressing right below the $0.09704 24-hour high. With solid volume (18.11M FF / $1.67M USDT) and a textbook series of higher lows holding support, DeFi bulls are positioning for an upside continuation breakout.
📊 24h: +9.05% | Vol: $1.67M
Trade Plan:
Long Entry: Current market zone (~$0.0955 – $0.0965) 🟢
Stop Loss: $0.0925 🛑
TP1: $0.0990 🎯
TP2: $0.1025 🎯
Final Target (TP3): $0.1060+ 🎯🚀
⚖️ Risk:Reward (TP2) — ~1:1.75
Trigger: Immediate entry or on a confirmed 15m candle close above the $0.09704 resistance high.
Risk Note: DeFi gainers near 24h highs can face brief liquidity sweeps before breaking out. Keep leverage moderate, lock in partial profits at each target, and stick strictly to your stop-loss!
Which target are you eyeing first on $FF ? Drop it below! 👇
4
1
112
·
--
Bullish
🚀 Vertical God-Candle Breakout! Is $JCT Ready to Rocket Toward $0.0040? 🟢💸
Buyers just unleashed massive momentum on the chart — here is the exact long setup. ⚡
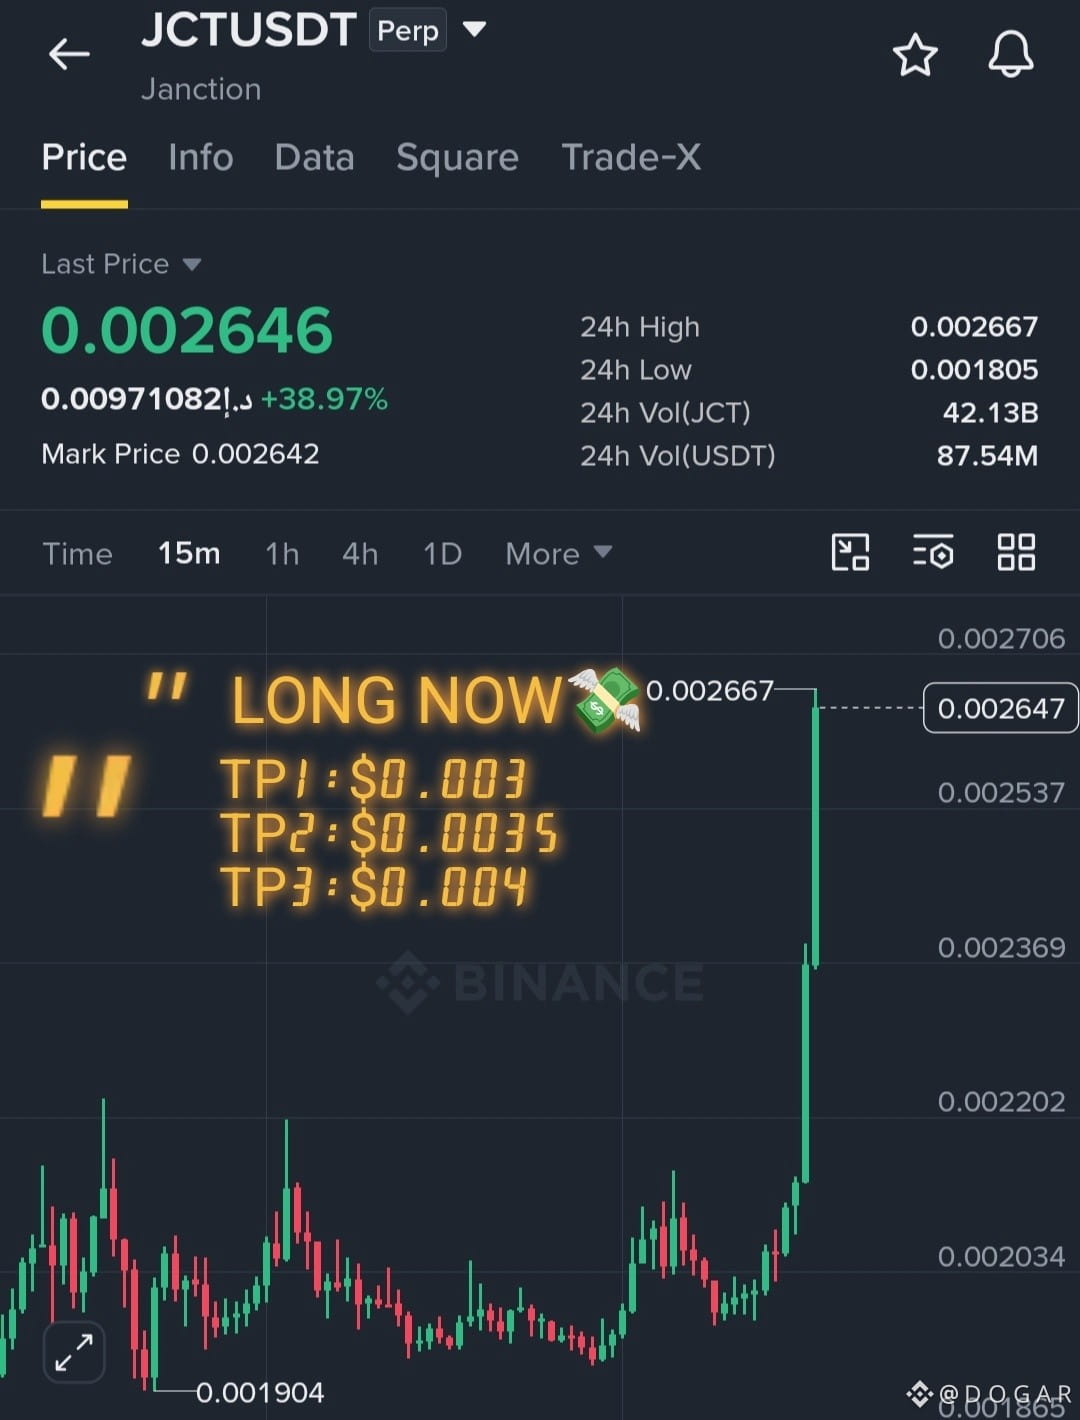
Looking at the $JCT/USDT (Janction) Perpetual 15-minute chart, price has exploded +38.97% to $0.002646, bouncing hard off the $0.001805 24-hour low and pressing right against the $0.002667 24-hour high. Backed by huge volume (42.13B JCT / $87.54M USDT) and a massive vertical breakout candle, bulls are firmly in the driver's seat for a continuation push toward major psychological resistance levels.
📊 24h: +38.97% | Vol: $87.54M
$JCT
{future}(JCTUSDT)
Trade Plan:
Long Entry: Current market zone (~$0.00260 – $0.00265) 🟢
Stop Loss: $0.00235 🛑
TP1: $0.00310 🎯
TP2: $0.0035 🎯
Final Target (TP3): $0.0040 🎯🚀
⚖️ Risk:Reward (TP2) — ~1:3.1
Trigger: Immediate entry or on a confirmed 15m candle hold above the $0.002667 resistance high.
Risk Note: Parabolic +38% perpetual breakouts carry extreme volatility and sharp retest wicks. Keep leverage low, secure partial profits at each target, and stick strictly to your stop-loss!
Which target on $JCT are you aiming for first? Drop it below! 👇
🚀 Vertical God-Candle Breakout! Is $JCT Ready to Rocket Toward $0.0040? 🟢💸
Buyers just unleashed massive momentum on the chart — here is the exact long setup. ⚡
Looking at the $JCT /USDT (Janction) Perpetual 15-minute chart, price has exploded +38.97% to $0.002646, bouncing hard off the $0.001805 24-hour low and pressing right against the $0.002667 24-hour high. Backed by huge volume (42.13B JCT / $87.54M USDT) and a massive vertical breakout candle, bulls are firmly in the driver's seat for a continuation push toward major psychological resistance levels.
📊 24h: +38.97% | Vol: $87.54M
$JCT
Trade Plan:
Long Entry: Current market zone (~$0.00260 – $0.00265) 🟢
Stop Loss: $0.00235 🛑
TP1: $0.00310 🎯
TP2: $0.0035 🎯
Final Target (TP3): $0.0040 🎯🚀
⚖️ Risk:Reward (TP2) — ~1:3.1
Trigger: Immediate entry or on a confirmed 15m candle hold above the $0.002667 resistance high.
Risk Note: Parabolic +38% perpetual breakouts carry extreme volatility and sharp retest wicks. Keep leverage low, secure partial profits at each target, and stick strictly to your stop-loss!
Which target on $JCT are you aiming for first? Drop it below! 👇
Buyers just unleashed massive momentum on the chart — here is the exact long setup. ⚡
Looking at the $JCT /USDT (Janction) Perpetual 15-minute chart, price has exploded +38.97% to $0.002646, bouncing hard off the $0.001805 24-hour low and pressing right against the $0.002667 24-hour high. Backed by huge volume (42.13B JCT / $87.54M USDT) and a massive vertical breakout candle, bulls are firmly in the driver's seat for a continuation push toward major psychological resistance levels.
📊 24h: +38.97% | Vol: $87.54M
$JCT
Trade Plan:
Long Entry: Current market zone (~$0.00260 – $0.00265) 🟢
Stop Loss: $0.00235 🛑
TP1: $0.00310 🎯
TP2: $0.0035 🎯
Final Target (TP3): $0.0040 🎯🚀
⚖️ Risk:Reward (TP2) — ~1:3.1
Trigger: Immediate entry or on a confirmed 15m candle hold above the $0.002667 resistance high.
Risk Note: Parabolic +38% perpetual breakouts carry extreme volatility and sharp retest wicks. Keep leverage low, secure partial profits at each target, and stick strictly to your stop-loss!
Which target on $JCT are you aiming for first? Drop it below! 👇
8
1
604
·
--
Bearish
🚨 Exhaustion at the Resistance Ceiling! Is $WLFI Ready to Face a Heavy Short-Side Rejection? 📉💸
Sellers are stepping in right at the highs — here is the exact short setup. ⚡
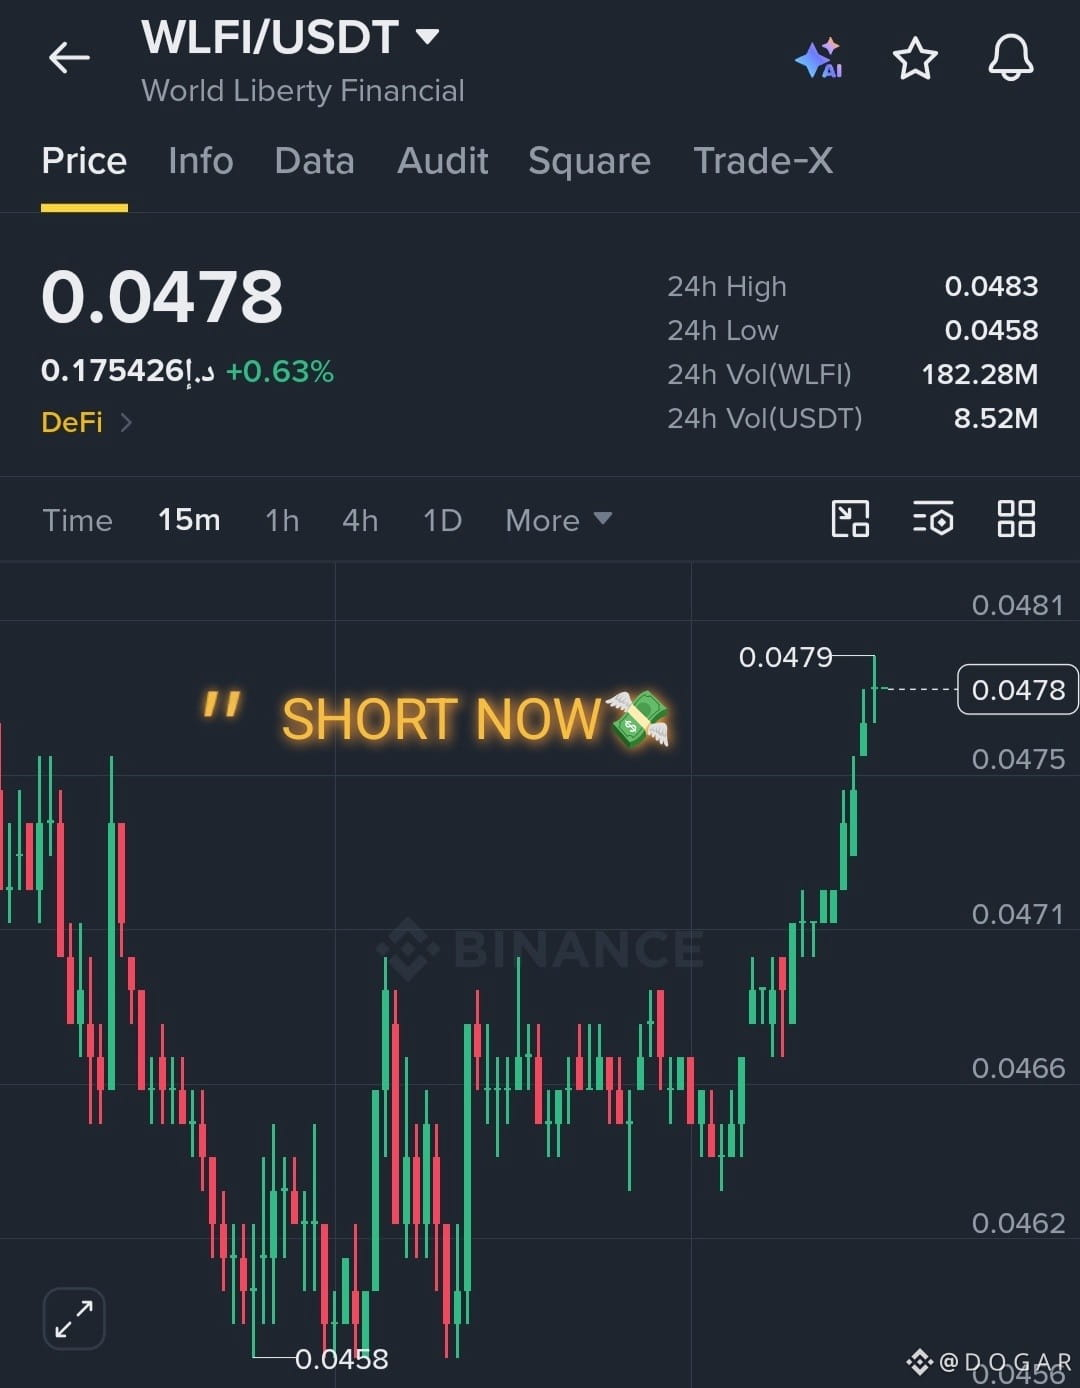
Looking at the $WLFI/USDT 15-minute chart, price has pushed up to $0.0478, testing resistance near the $0.0483 24-hour high while showing signs of slowing momentum. With solid volume (182.28M WLFI / $8.52M USDT) flowing through the order books and upper wicks hinting at a potential local top, bullish strength is starting to fade fast, making a sharp rollover toward lower support increasingly likely.
$WLFI
{future}(WLFIUSDT)
Trade Plan:
Short Entry: Current market zone (~$0.0475 – $0.0480) 🔴
Stop Loss: $0.0488 🛑
TP1: $0.0468 🎯
TP2: $0.0462 🎯
Final Target (TP3): $0.0455 🎯📉
⚠️ Risk Note: Shorting near recent highs carries fast counter-trend volatility. Manage your leverage tightly, secure partial profits as targets drop, and stick strictly to your stop-loss!
Are you shorting this $WLFI push or waiting for confirmation? Drop your targets below! 👇
🚨 Exhaustion at the Resistance Ceiling! Is $WLFI Ready to Face a Heavy Short-Side Rejection? 📉💸
Sellers are stepping in right at the highs — here is the exact short setup. ⚡
Looking at the $WLFI /USDT 15-minute chart, price has pushed up to $0.0478, testing resistance near the $0.0483 24-hour high while showing signs of slowing momentum. With solid volume (182.28M WLFI / $8.52M USDT) flowing through the order books and upper wicks hinting at a potential local top, bullish strength is starting to fade fast, making a sharp rollover toward lower support increasingly likely.
$WLFI
Trade Plan:
Short Entry: Current market zone (~$0.0475 – $0.0480) 🔴
Stop Loss: $0.0488 🛑
TP1: $0.0468 🎯
TP2: $0.0462 🎯
Final Target (TP3): $0.0455 🎯📉
⚠️ Risk Note: Shorting near recent highs carries fast counter-trend volatility. Manage your leverage tightly, secure partial profits as targets drop, and stick strictly to your stop-loss!
Are you shorting this $WLFI push or waiting for confirmation? Drop your targets below! 👇
Sellers are stepping in right at the highs — here is the exact short setup. ⚡
Looking at the $WLFI /USDT 15-minute chart, price has pushed up to $0.0478, testing resistance near the $0.0483 24-hour high while showing signs of slowing momentum. With solid volume (182.28M WLFI / $8.52M USDT) flowing through the order books and upper wicks hinting at a potential local top, bullish strength is starting to fade fast, making a sharp rollover toward lower support increasingly likely.
$WLFI
Trade Plan:
Short Entry: Current market zone (~$0.0475 – $0.0480) 🔴
Stop Loss: $0.0488 🛑
TP1: $0.0468 🎯
TP2: $0.0462 🎯
Final Target (TP3): $0.0455 🎯📉
⚠️ Risk Note: Shorting near recent highs carries fast counter-trend volatility. Manage your leverage tightly, secure partial profits as targets drop, and stick strictly to your stop-loss!
Are you shorting this $WLFI push or waiting for confirmation? Drop your targets below! 👇
4
1
224
·
--
Bullish
🚀 Explosive Breakout Momentum! Is $TAC Ready to Smash Resistance and Push Past $0.00145? 🟢💸
Buyers are charging straight through resistance — here is the exact long setup. ⚡
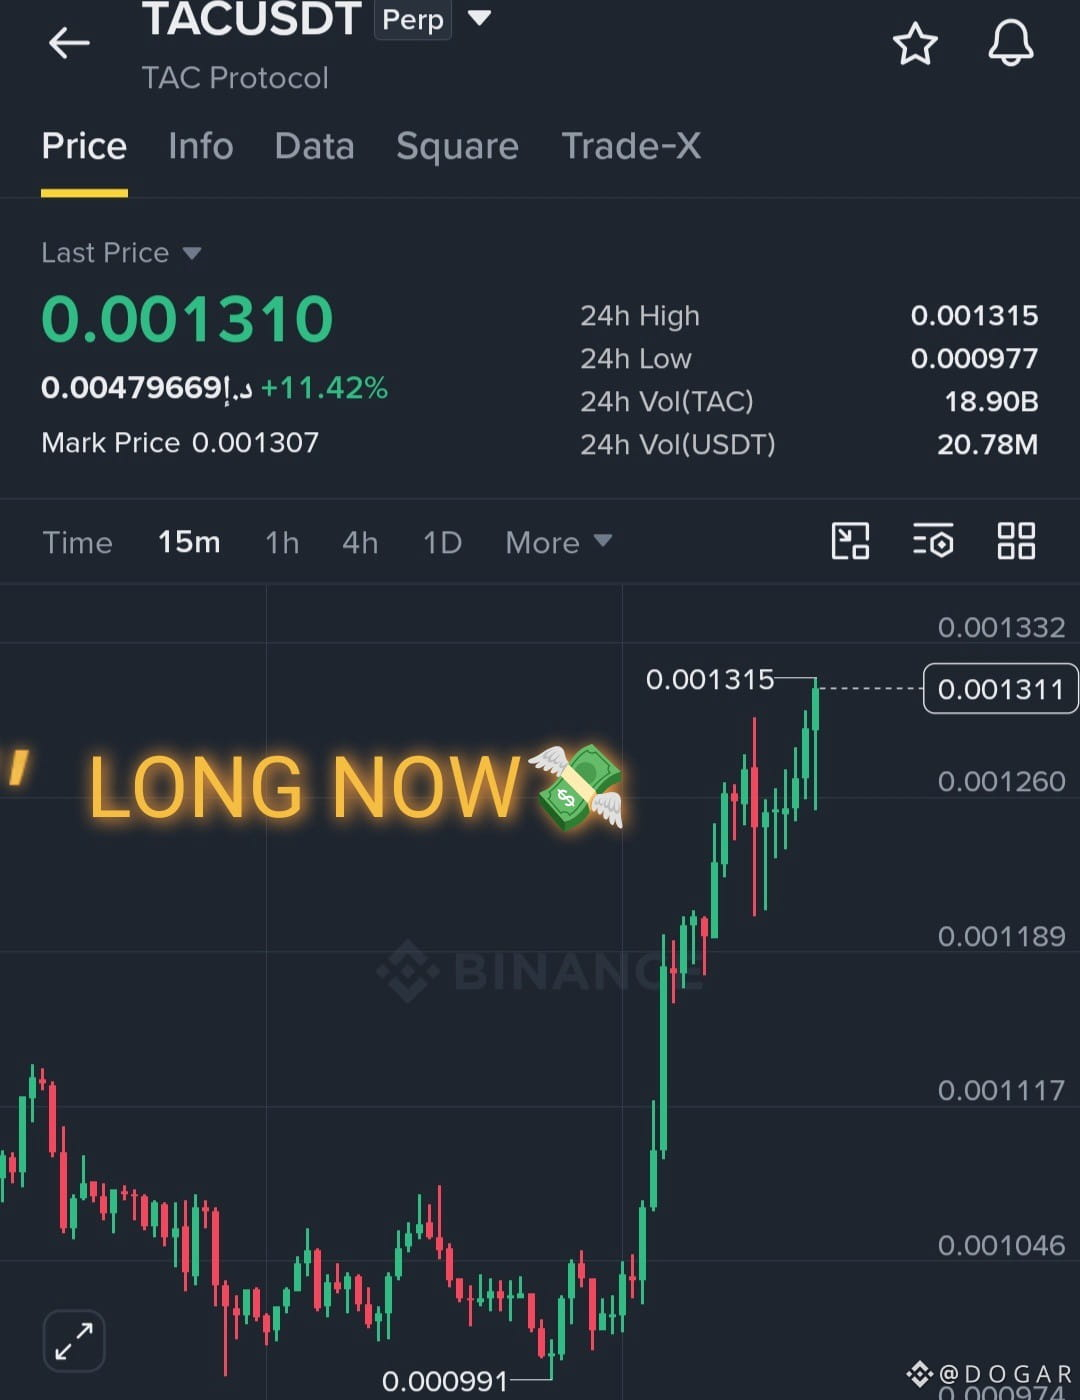
Looking at the $TAC/USDT Perpetual 15-minute chart, price has surged +11.42% to $0.001310, recovering strongly from its $0.000977 24-hour low and testing the $0.001315 24-hour high. Backed by massive volume (18.90B TAC / $20.78M USDT) and a clean staircase of higher lows, bullish momentum is firmly in control for a breakout continuation.
$TAC
{future}(TACUSDT)
📊 24h: +11.42% | Vol: $20.78M
Trade Plan:
Long Entry: Current market zone (~$0.001295 – $0.001315) 🟢
Stop Loss: $0.001230 🛑
TP1: $0.001360 🎯
TP2: $0.001420 🎯
Final Target (TP3): $0.001500+ 🎯🚀
⚖️ Risk:Reward (TP2) — ~1:1.5
Trigger: Immediate entry or on a confirmed 15m candle close above the $0.001315 resistance high.
Risk Note: High-volume perpetual breakouts move fast and can trigger sharp pullback wicks near recent highs. Keep leverage moderate, lock in partial profits at each target, and respect your stop-loss!
Which target are you eyeing first on $TAC? Drop it below! 👇
🚀 Explosive Breakout Momentum! Is $TAC Ready to Smash Resistance and Push Past $0.00145? 🟢💸
Buyers are charging straight through resistance — here is the exact long setup. ⚡
Looking at the $TAC /USDT Perpetual 15-minute chart, price has surged +11.42% to $0.001310, recovering strongly from its $0.000977 24-hour low and testing the $0.001315 24-hour high. Backed by massive volume (18.90B TAC / $20.78M USDT) and a clean staircase of higher lows, bullish momentum is firmly in control for a breakout continuation.
$TAC
📊 24h: +11.42% | Vol: $20.78M
Trade Plan:
Long Entry: Current market zone (~$0.001295 – $0.001315) 🟢
Stop Loss: $0.001230 🛑
TP1: $0.001360 🎯
TP2: $0.001420 🎯
Final Target (TP3): $0.001500+ 🎯🚀
⚖️ Risk:Reward (TP2) — ~1:1.5
Trigger: Immediate entry or on a confirmed 15m candle close above the $0.001315 resistance high.
Risk Note: High-volume perpetual breakouts move fast and can trigger sharp pullback wicks near recent highs. Keep leverage moderate, lock in partial profits at each target, and respect your stop-loss!
Which target are you eyeing first on $TAC ? Drop it below! 👇
Buyers are charging straight through resistance — here is the exact long setup. ⚡
Looking at the $TAC /USDT Perpetual 15-minute chart, price has surged +11.42% to $0.001310, recovering strongly from its $0.000977 24-hour low and testing the $0.001315 24-hour high. Backed by massive volume (18.90B TAC / $20.78M USDT) and a clean staircase of higher lows, bullish momentum is firmly in control for a breakout continuation.
$TAC
📊 24h: +11.42% | Vol: $20.78M
Trade Plan:
Long Entry: Current market zone (~$0.001295 – $0.001315) 🟢
Stop Loss: $0.001230 🛑
TP1: $0.001360 🎯
TP2: $0.001420 🎯
Final Target (TP3): $0.001500+ 🎯🚀
⚖️ Risk:Reward (TP2) — ~1:1.5
Trigger: Immediate entry or on a confirmed 15m candle close above the $0.001315 resistance high.
Risk Note: High-volume perpetual breakouts move fast and can trigger sharp pullback wicks near recent highs. Keep leverage moderate, lock in partial profits at each target, and respect your stop-loss!
Which target are you eyeing first on $TAC ? Drop it below! 👇
5
1
273
·
--
Bullish
🚨 Brutal Reality Check on Leverage! Why a 5% Move Can Wipe Out 78% of Your Position 📉💸
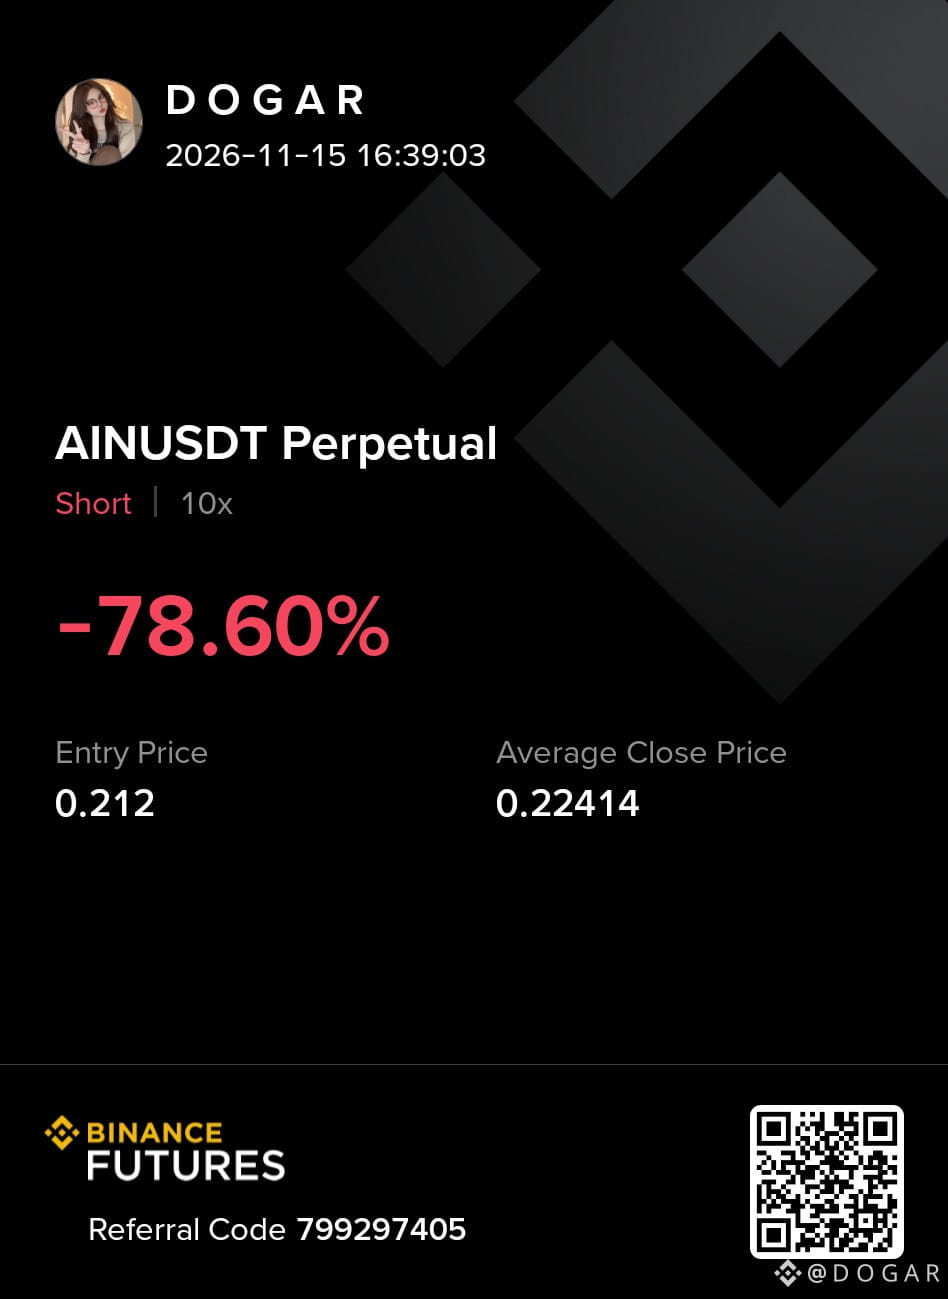
Taking a -78.60% hit on $AINUSDT Perpetual (10x Short) hurts—and every futures trader knows that exact sickening feeling. Here is the real lesson behind this red card:
On a 1x spot trade, price moving from 0.212 to 0.22414 is just a minor +5.7% bounce. On 10x leverage, that small wiggle multiplies tenfold—draining nearly 80% of your margin before the chart even gets room to breathe.
The Golden Rule of Leverage:
High leverage shrinks your margin for error to almost zero.
Always use a hard stop-loss (2%–3% max price move) on volatile perpetuals so one liquidity sweep never wrecks your account.
Protect your capital first—survive today to catch tomorrow’s breakout! 💪📊
What’s your max leverage rule? Drop it below! 👇
$AIN
{future}(AINUSDT)
🚨 Brutal Reality Check on Leverage! Why a 5% Move Can Wipe Out 78% of Your Position 📉💸
Taking a -78.60% hit on $AINUSDT Perpetual (10x Short) hurts—and every futures trader knows that exact sickening feeling. Here is the real lesson behind this red card:
On a 1x spot trade, price moving from 0.212 to 0.22414 is just a minor +5.7% bounce. On 10x leverage, that small wiggle multiplies tenfold—draining nearly 80% of your margin before the chart even gets room to breathe.
The Golden Rule of Leverage:
High leverage shrinks your margin for error to almost zero.
Always use a hard stop-loss (2%–3% max price move) on volatile perpetuals so one liquidity sweep never wrecks your account.
Protect your capital first—survive today to catch tomorrow’s breakout! 💪📊
What’s your max leverage rule? Drop it below! 👇
$AIN
Taking a -78.60% hit on $AINUSDT Perpetual (10x Short) hurts—and every futures trader knows that exact sickening feeling. Here is the real lesson behind this red card:
On a 1x spot trade, price moving from 0.212 to 0.22414 is just a minor +5.7% bounce. On 10x leverage, that small wiggle multiplies tenfold—draining nearly 80% of your margin before the chart even gets room to breathe.
The Golden Rule of Leverage:
High leverage shrinks your margin for error to almost zero.
Always use a hard stop-loss (2%–3% max price move) on volatile perpetuals so one liquidity sweep never wrecks your account.
Protect your capital first—survive today to catch tomorrow’s breakout! 💪📊
What’s your max leverage rule? Drop it below! 👇
$AIN
4
1
189
·
--
Bullish
🚀 Momentum Breakout! Is $GNS Ready to Smash Resistance and Rally Higher? 🟢💸
Buyers are stepping in aggressively — here's the setup. ⚡
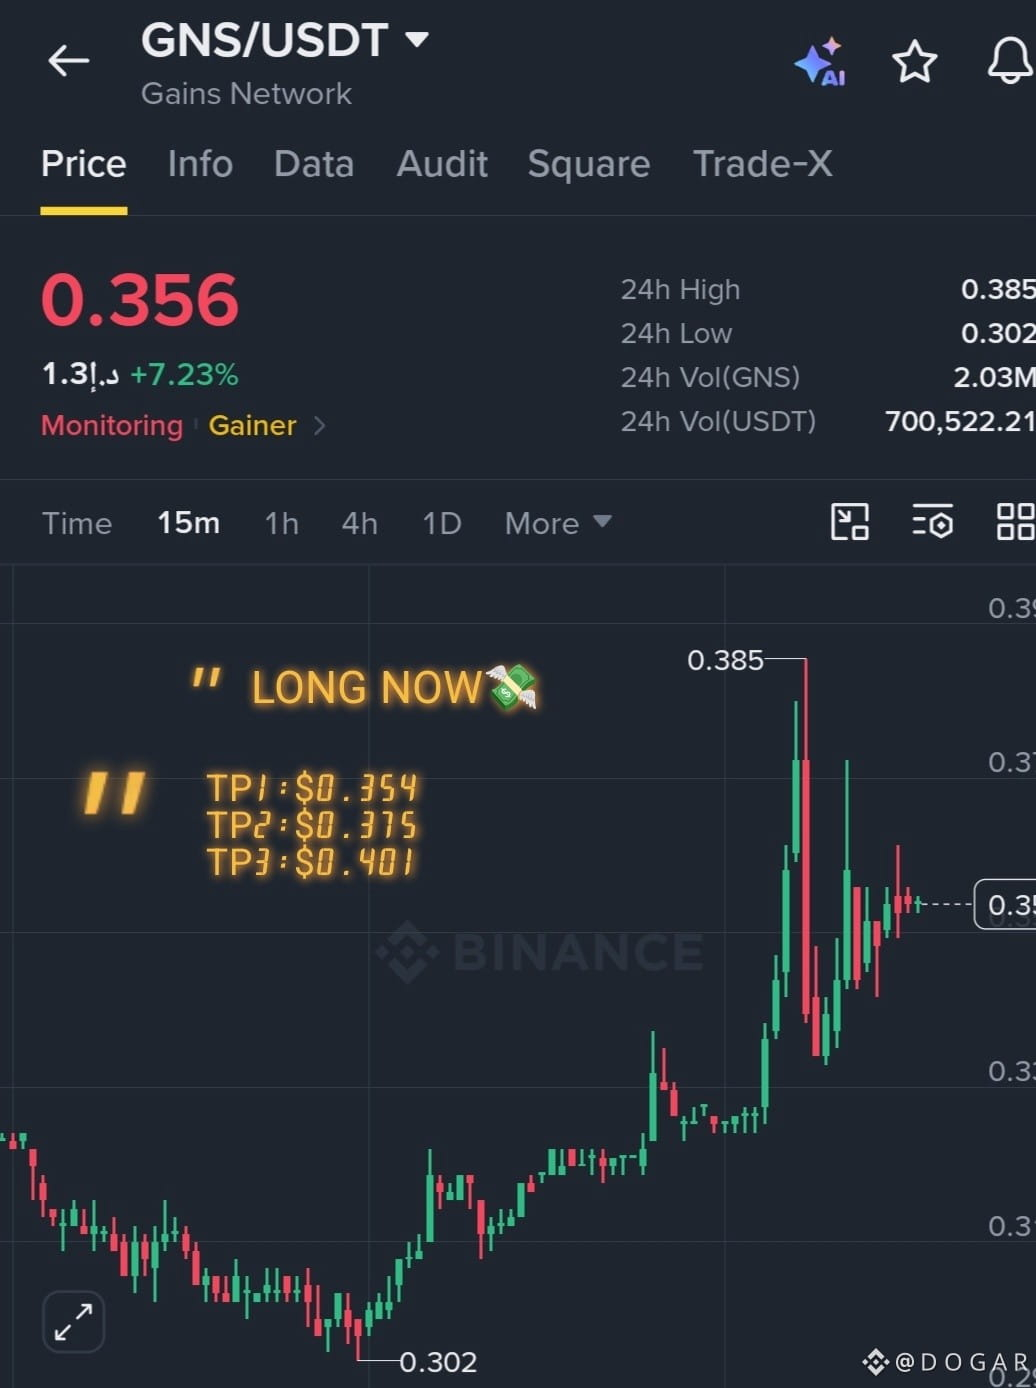
After sweeping liquidity down to the $0.302 24-hour low, Gains Network ($GNS) has staged a sharp recovery on the 15-minute chart, surging +7.23% to $0.356 (tapping a $0.385 24h high) on solid volume (2.03M GNS / $700,522 USDT). With strong green candles pressing toward overhead resistance, bullish momentum is building for a continuation move!
📊 24h: +7.23% | Vol: $700.5K
$GNS
{spot}(GNSUSDT)
Trade Plan:
Long Entry: Current market zone (~$0.350 – $0.358) 🟢
Stop Loss: $0.325 🛑
TP1: $0.354 🎯
TP2: $0.375 🎯
Final Target (TP3): $0.401 🎯🚀
⚖️ Risk:Reward (TP2) — ~1:1.45
Trigger: Immediate entry or on a confirmed 15m candle close above the immediate resistance zone.
Risk Note: $GNS carries the "Monitoring" tag on Binance, meaning elevated volatility and sudden swings are possible. Manage your leverage carefully, lock in partial profits along the way, and stick strictly to your stop-loss!
Which target are you eyeing first? 👇
🚀 Momentum Breakout! Is $GNS Ready to Smash Resistance and Rally Higher? 🟢💸
Buyers are stepping in aggressively — here's the setup. ⚡
After sweeping liquidity down to the $0.302 24-hour low, Gains Network ($GNS ) has staged a sharp recovery on the 15-minute chart, surging +7.23% to $0.356 (tapping a $0.385 24h high) on solid volume (2.03M GNS / $700,522 USDT). With strong green candles pressing toward overhead resistance, bullish momentum is building for a continuation move!
📊 24h: +7.23% | Vol: $700.5K
$GNS
Trade Plan:
Long Entry: Current market zone (~$0.350 – $0.358) 🟢
Stop Loss: $0.325 🛑
TP1: $0.354 🎯
TP2: $0.375 🎯
Final Target (TP3): $0.401 🎯🚀
⚖️ Risk:Reward (TP2) — ~1:1.45
Trigger: Immediate entry or on a confirmed 15m candle close above the immediate resistance zone.
Risk Note: $GNS carries the "Monitoring" tag on Binance, meaning elevated volatility and sudden swings are possible. Manage your leverage carefully, lock in partial profits along the way, and stick strictly to your stop-loss!
Which target are you eyeing first? 👇
Buyers are stepping in aggressively — here's the setup. ⚡
After sweeping liquidity down to the $0.302 24-hour low, Gains Network ($GNS ) has staged a sharp recovery on the 15-minute chart, surging +7.23% to $0.356 (tapping a $0.385 24h high) on solid volume (2.03M GNS / $700,522 USDT). With strong green candles pressing toward overhead resistance, bullish momentum is building for a continuation move!
📊 24h: +7.23% | Vol: $700.5K
$GNS
Trade Plan:
Long Entry: Current market zone (~$0.350 – $0.358) 🟢
Stop Loss: $0.325 🛑
TP1: $0.354 🎯
TP2: $0.375 🎯
Final Target (TP3): $0.401 🎯🚀
⚖️ Risk:Reward (TP2) — ~1:1.45
Trigger: Immediate entry or on a confirmed 15m candle close above the immediate resistance zone.
Risk Note: $GNS carries the "Monitoring" tag on Binance, meaning elevated volatility and sudden swings are possible. Manage your leverage carefully, lock in partial profits along the way, and stick strictly to your stop-loss!
Which target are you eyeing first? 👇

Best Wishes!
From D O G A R
3
2
39
·
--
Bearish
🚨 Brutal Bearish Crash! Is $SOPH Heading Straight to the Graveyard? 📉💸
Sellers are in total command as the market capitulates — here's the exact setup.
$SOPH
{future}(SOPHUSDT)
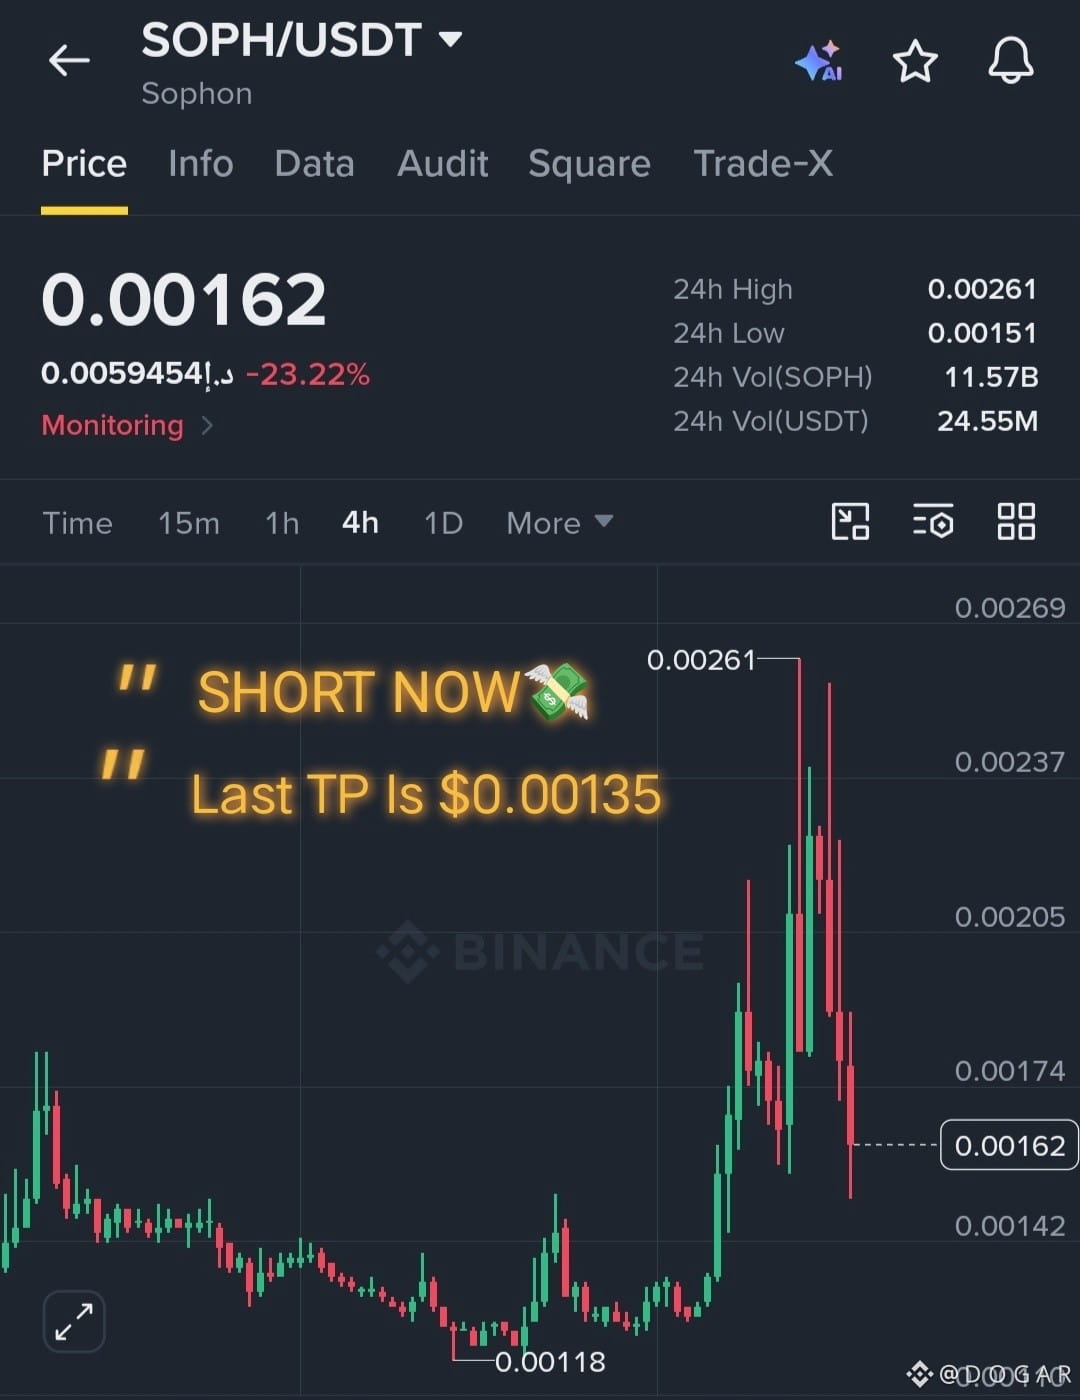
Looking at the $SOPH/USDT 4-hour chart, price has collapsed -23.22% down to $0.00162, bleeding heavily after a brutal rejection from the $0.00261 peak. With massive volume (11.57B SOPH / $24.55M USDT) flushing out weak bids and lower highs dominating the structure, downside momentum is accelerating rapidly toward our final target.
Trade Plan:
Short Entry: Current market zone (~$0.00160 – $0.00165) 🔴
Stop Loss: $0.00185 🛑
TP1: $0.00150 🎯
TP2: $0.00142 🎯
Final Target (TP3): $0.00135 🎯📉 (As shown on chart!)
⚠️ Risk Note: Low-cap high-volume tokens experiencing heavy sell pressure can exhibit extreme volatility and flash wicks. Manage your leverage tightly, lock in partial profits as targets drop, and stick strictly to your stop-loss!
Are you shorting this $SOPH crash or watching from the sidelines? Drop your targets below! 👇
🚨 Brutal Bearish Crash! Is $SOPH Heading Straight to the Graveyard? 📉💸
Sellers are in total command as the market capitulates — here's the exact setup.
$SOPH
Looking at the $SOPH /USDT 4-hour chart, price has collapsed -23.22% down to $0.00162, bleeding heavily after a brutal rejection from the $0.00261 peak. With massive volume (11.57B SOPH / $24.55M USDT) flushing out weak bids and lower highs dominating the structure, downside momentum is accelerating rapidly toward our final target.
Trade Plan:
Short Entry: Current market zone (~$0.00160 – $0.00165) 🔴
Stop Loss: $0.00185 🛑
TP1: $0.00150 🎯
TP2: $0.00142 🎯
Final Target (TP3): $0.00135 🎯📉 (As shown on chart!)
⚠️ Risk Note: Low-cap high-volume tokens experiencing heavy sell pressure can exhibit extreme volatility and flash wicks. Manage your leverage tightly, lock in partial profits as targets drop, and stick strictly to your stop-loss!
Are you shorting this $SOPH crash or watching from the sidelines? Drop your targets below! 👇
Sellers are in total command as the market capitulates — here's the exact setup.
$SOPH
Looking at the $SOPH /USDT 4-hour chart, price has collapsed -23.22% down to $0.00162, bleeding heavily after a brutal rejection from the $0.00261 peak. With massive volume (11.57B SOPH / $24.55M USDT) flushing out weak bids and lower highs dominating the structure, downside momentum is accelerating rapidly toward our final target.
Trade Plan:
Short Entry: Current market zone (~$0.00160 – $0.00165) 🔴
Stop Loss: $0.00185 🛑
TP1: $0.00150 🎯
TP2: $0.00142 🎯
Final Target (TP3): $0.00135 🎯📉 (As shown on chart!)
⚠️ Risk Note: Low-cap high-volume tokens experiencing heavy sell pressure can exhibit extreme volatility and flash wicks. Manage your leverage tightly, lock in partial profits as targets drop, and stick strictly to your stop-loss!
Are you shorting this $SOPH crash or watching from the sidelines? Drop your targets below! 👇
6
1
547
·
--
💔 Dear Crypto Market, We Are Tired of Bleeding… Just Give Us One Candle Like This! 🕯️📉
Every single morning feels like the exact same heartbreak. You wake up, check your screen with a tiny spark of hope, and watch your hard-earned portfolio bleed lower day after day.
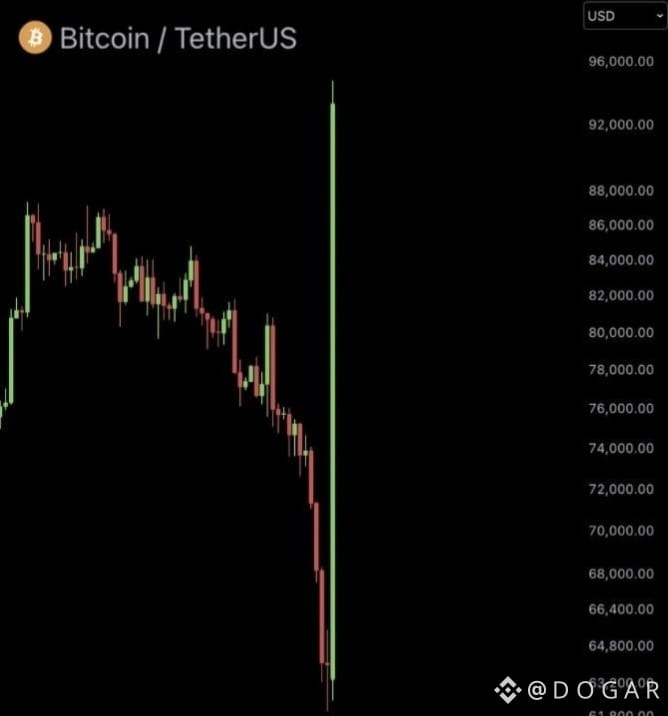
Red candle after red candle, BTC has dragged the entire market down from the $86,000+ highs straight into the $63,000 – $65,000 trenches—erasing months of patience, draining confidence, and testing the limits of every retail trader still holding on. At this point, it feels like hope is fading faster than green candles appear.
We don’t even ask for perfection anymore. We just want one single moment like this chart—one massive, unstoppable green God candle launching BTC straight back from $63,200 to $94,000+ in a heartbeat, wiping out all the pain, liquidating the bears, and bringing our portfolios back to life! 🚀💚
Until that day comes, we keep surviving the storm, holding onto our last ounce of faith.
Who else is exhausted from watching their portfolio bleed red every single day? Drop a 💔 or 🚀 in the comments if you are still holding strong! 👇
$SOL $BTC $ETH
💔 Dear Crypto Market, We Are Tired of Bleeding… Just Give Us One Candle Like This! 🕯️📉
Every single morning feels like the exact same heartbreak. You wake up, check your screen with a tiny spark of hope, and watch your hard-earned portfolio bleed lower day after day.
Red candle after red candle, BTC has dragged the entire market down from the $86,000+ highs straight into the $63,000 – $65,000 trenches—erasing months of patience, draining confidence, and testing the limits of every retail trader still holding on. At this point, it feels like hope is fading faster than green candles appear.
We don’t even ask for perfection anymore. We just want one single moment like this chart—one massive, unstoppable green God candle launching BTC straight back from $63,200 to $94,000+ in a heartbeat, wiping out all the pain, liquidating the bears, and bringing our portfolios back to life! 🚀💚
Until that day comes, we keep surviving the storm, holding onto our last ounce of faith.
Who else is exhausted from watching their portfolio bleed red every single day? Drop a 💔 or 🚀 in the comments if you are still holding strong! 👇
$SOL $BTC $ETH
Every single morning feels like the exact same heartbreak. You wake up, check your screen with a tiny spark of hope, and watch your hard-earned portfolio bleed lower day after day.
Red candle after red candle, BTC has dragged the entire market down from the $86,000+ highs straight into the $63,000 – $65,000 trenches—erasing months of patience, draining confidence, and testing the limits of every retail trader still holding on. At this point, it feels like hope is fading faster than green candles appear.
We don’t even ask for perfection anymore. We just want one single moment like this chart—one massive, unstoppable green God candle launching BTC straight back from $63,200 to $94,000+ in a heartbeat, wiping out all the pain, liquidating the bears, and bringing our portfolios back to life! 🚀💚
Until that day comes, we keep surviving the storm, holding onto our last ounce of faith.
Who else is exhausted from watching their portfolio bleed red every single day? Drop a 💔 or 🚀 in the comments if you are still holding strong! 👇
$SOL $BTC $ETH
6
2
834
·
--
Bullish
🚨 Parabolic Resistance Rejection! Is $MEGA Ready to Roll Over Back to Support? 📉💸
Sellers are stepping in right at the highs—here is the exact breakdown setup. ⚡
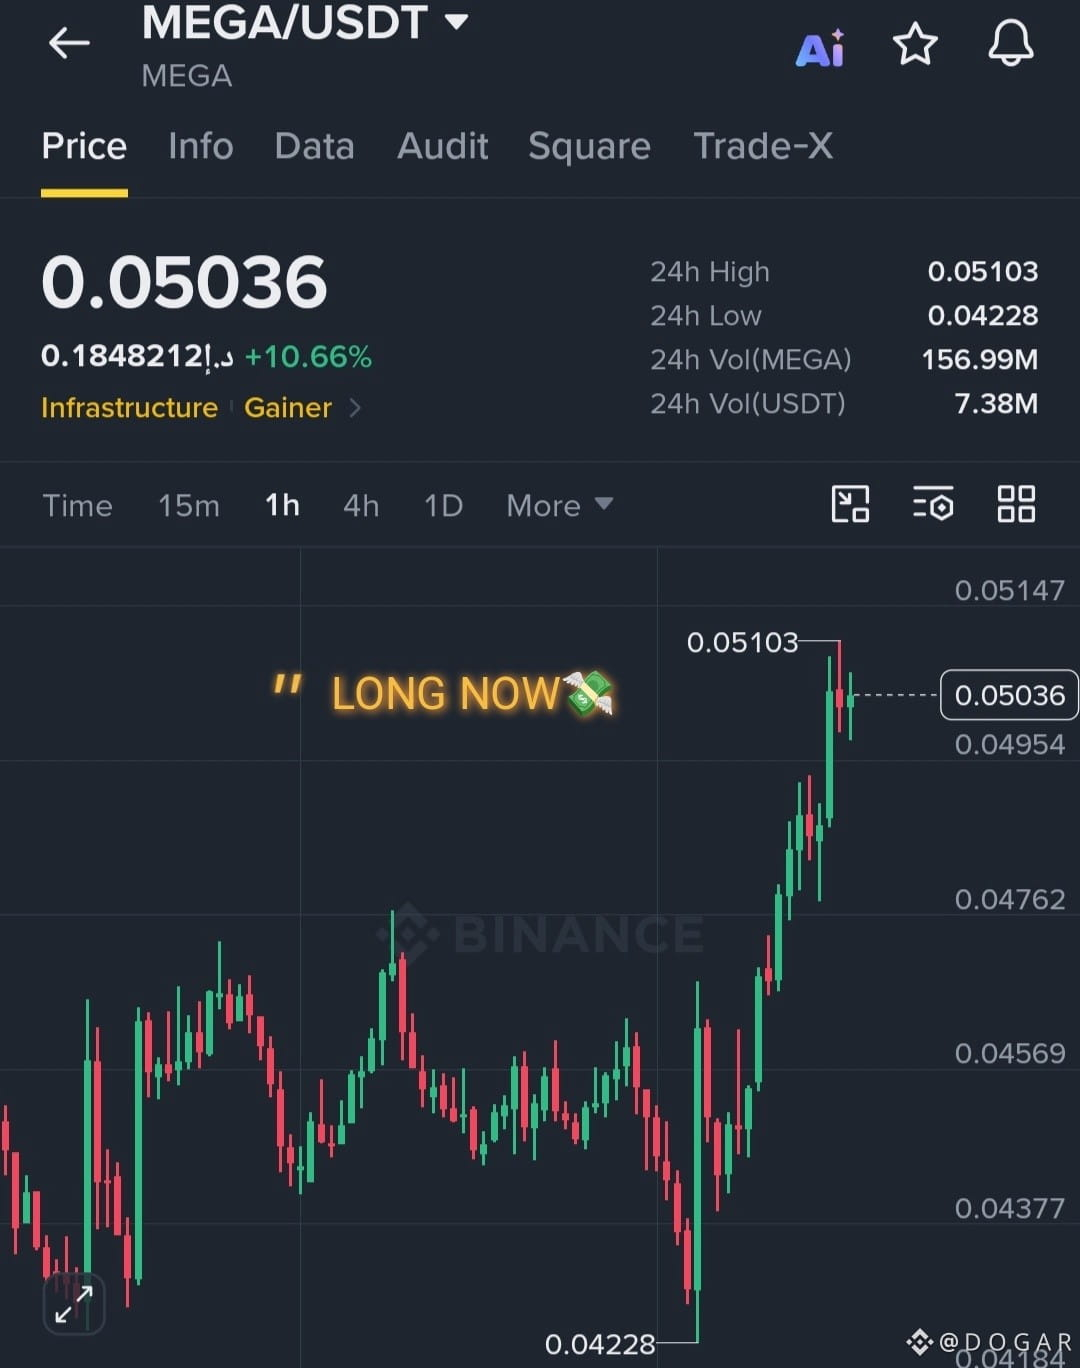
Looking at the $MEGA/USDT 1-hour chart, price has rallied +10.66% to $0.05036, testing the $0.05103 24-hour resistance high while struggling to maintain upside momentum. With heavy volume (156.99M MEGA / $7.38M USDT) and upper wicks showing clear rejection candles, buying pressure is starting to fade quickly, making a pullback increasingly probable.
$MEGA
{future}(MEGAUSDT)
Trade Plan:
Short Entry: Current market zone (~$0.0498 – $0.0504) 🔴
Stop Loss: $0.0528 🛑
TP1: $0.0475 🎯
TP2: $0.0445 🎯
Final Target (TP3): $0.0415 🎯📉
⚠️ Risk Note: High-momentum breakout tokens can trap early shorts if fakeout wicks occur. Manage your leverage tightly, secure partial profits as targets drop, and stick strictly to your stop-loss!
Are you shorting this $MEGA rejection or expecting further upside? Drop your targets below! 👇
🚨 Parabolic Resistance Rejection! Is $MEGA Ready to Roll Over Back to Support? 📉💸
Sellers are stepping in right at the highs—here is the exact breakdown setup. ⚡
Looking at the $MEGA /USDT 1-hour chart, price has rallied +10.66% to $0.05036, testing the $0.05103 24-hour resistance high while struggling to maintain upside momentum. With heavy volume (156.99M MEGA / $7.38M USDT) and upper wicks showing clear rejection candles, buying pressure is starting to fade quickly, making a pullback increasingly probable.
$MEGA
Trade Plan:
Short Entry: Current market zone (~$0.0498 – $0.0504) 🔴
Stop Loss: $0.0528 🛑
TP1: $0.0475 🎯
TP2: $0.0445 🎯
Final Target (TP3): $0.0415 🎯📉
⚠️ Risk Note: High-momentum breakout tokens can trap early shorts if fakeout wicks occur. Manage your leverage tightly, secure partial profits as targets drop, and stick strictly to your stop-loss!
Are you shorting this $MEGA rejection or expecting further upside? Drop your targets below! 👇
Sellers are stepping in right at the highs—here is the exact breakdown setup. ⚡
Looking at the $MEGA /USDT 1-hour chart, price has rallied +10.66% to $0.05036, testing the $0.05103 24-hour resistance high while struggling to maintain upside momentum. With heavy volume (156.99M MEGA / $7.38M USDT) and upper wicks showing clear rejection candles, buying pressure is starting to fade quickly, making a pullback increasingly probable.
$MEGA
Trade Plan:
Short Entry: Current market zone (~$0.0498 – $0.0504) 🔴
Stop Loss: $0.0528 🛑
TP1: $0.0475 🎯
TP2: $0.0445 🎯
Final Target (TP3): $0.0415 🎯📉
⚠️ Risk Note: High-momentum breakout tokens can trap early shorts if fakeout wicks occur. Manage your leverage tightly, secure partial profits as targets drop, and stick strictly to your stop-loss!
Are you shorting this $MEGA rejection or expecting further upside? Drop your targets below! 👇
5
1
265
·
--
Bullish
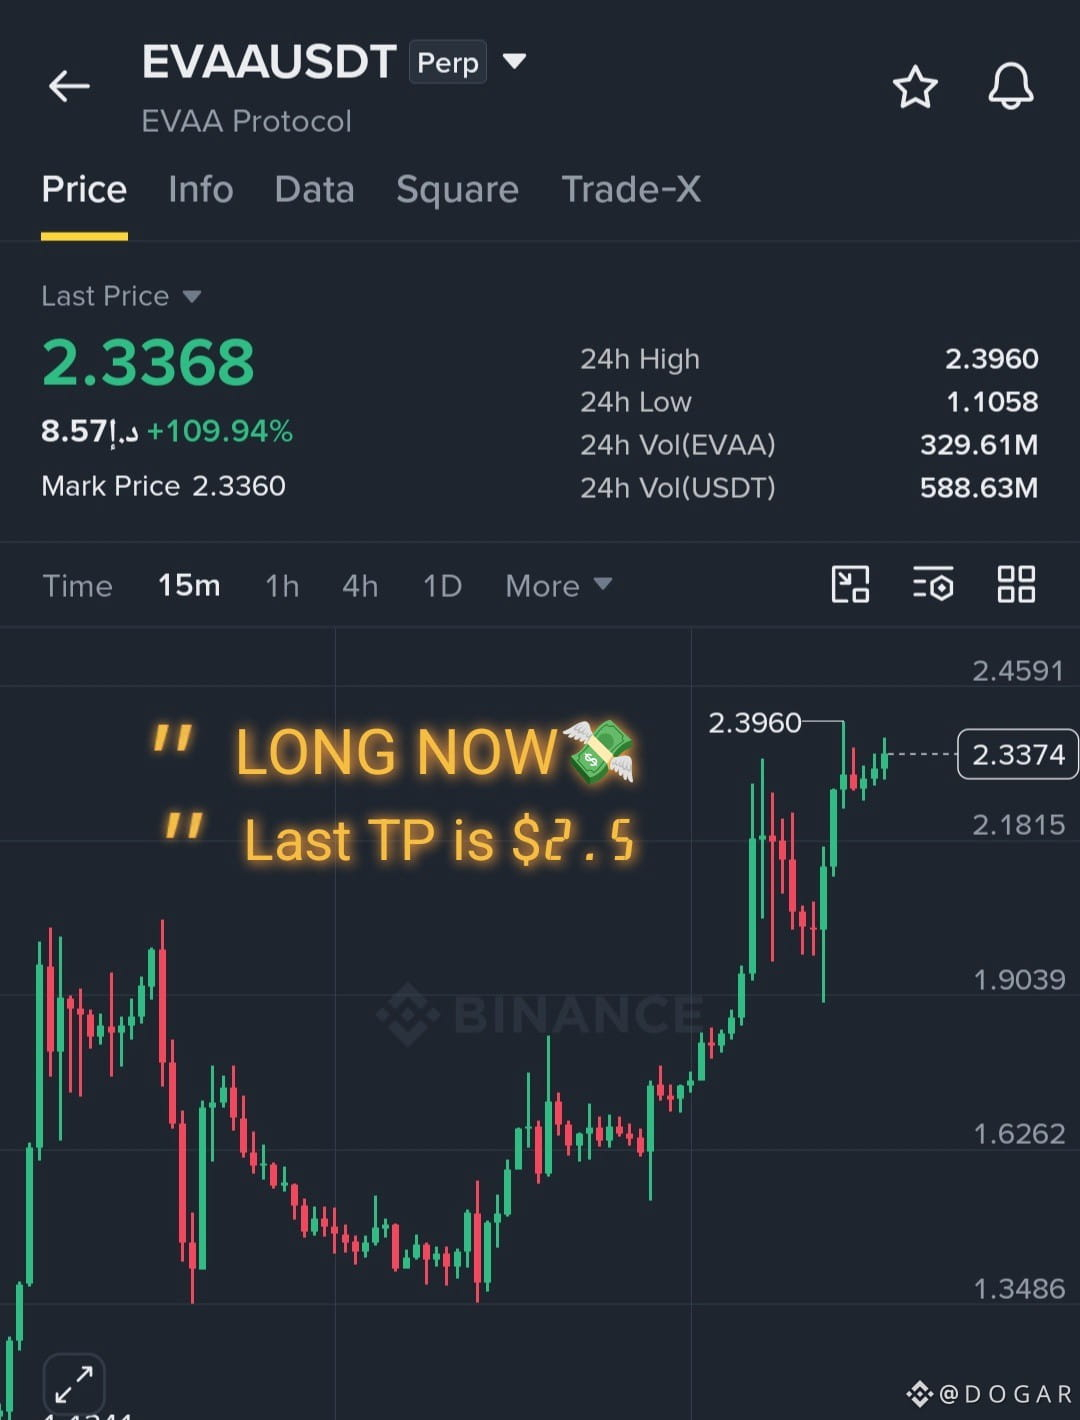
🚀 Parabolic Surge! Is $EVAA Ready to Shatter Resistance and Charge Past $2.50? 🟢💸
Buyers are taking absolute control of the market — here is the setup. ⚡
$EVAA
{future}(EVAAUSDT)
After a massive V-shaped recovery off the $1.1058 24-hour low, EVAA Protocol ($EVAA) has exploded upward on the 15-minute chart, surging +109.94% to $2.3368 (touching a $2.3960 24h high) on heavy volume (329.61M EVAA / $588.63M USDT)! With aggressive green candles breaking structure and high momentum pushing toward the top, bulls are primed for a continuation run.
📊 24h: +109.94% | Vol: $588.63M
Trade Plan:
Long Entry: Current market zone (~$2.30 – $2.35) 🟢
Stop Loss: $2.05 🛑
TP1: $2.45 🎯
TP2: $2.65 🎯
Final Target (TP3): $2.90+ 🎯🚀
⚖️ Risk:Reward (TP2) — ~1:1.60
Trigger: Immediate entry or on a confirmed breakout above the $2.3960 resistance high.
Risk Note: Extreme high-gainer tokens carry intense volatility and potential pullback wicks. Manage your leverage tightly, secure partial profits at each target, and stick strictly to your stop-loss!
Which target are you eyeing first? 👇
🚀 Parabolic Surge! Is $EVAA Ready to Shatter Resistance and Charge Past $2.50? 🟢💸
Buyers are taking absolute control of the market — here is the setup. ⚡
$EVAA
After a massive V-shaped recovery off the $1.1058 24-hour low, EVAA Protocol ($EVAA ) has exploded upward on the 15-minute chart, surging +109.94% to $2.3368 (touching a $2.3960 24h high) on heavy volume (329.61M EVAA / $588.63M USDT)! With aggressive green candles breaking structure and high momentum pushing toward the top, bulls are primed for a continuation run.
📊 24h: +109.94% | Vol: $588.63M
Trade Plan:
Long Entry: Current market zone (~$2.30 – $2.35) 🟢
Stop Loss: $2.05 🛑
TP1: $2.45 🎯
TP2: $2.65 🎯
Final Target (TP3): $2.90+ 🎯🚀
⚖️ Risk:Reward (TP2) — ~1:1.60
Trigger: Immediate entry or on a confirmed breakout above the $2.3960 resistance high.
Risk Note: Extreme high-gainer tokens carry intense volatility and potential pullback wicks. Manage your leverage tightly, secure partial profits at each target, and stick strictly to your stop-loss!
Which target are you eyeing first? 👇
Buyers are taking absolute control of the market — here is the setup. ⚡
$EVAA
After a massive V-shaped recovery off the $1.1058 24-hour low, EVAA Protocol ($EVAA ) has exploded upward on the 15-minute chart, surging +109.94% to $2.3368 (touching a $2.3960 24h high) on heavy volume (329.61M EVAA / $588.63M USDT)! With aggressive green candles breaking structure and high momentum pushing toward the top, bulls are primed for a continuation run.
📊 24h: +109.94% | Vol: $588.63M
Trade Plan:
Long Entry: Current market zone (~$2.30 – $2.35) 🟢
Stop Loss: $2.05 🛑
TP1: $2.45 🎯
TP2: $2.65 🎯
Final Target (TP3): $2.90+ 🎯🚀
⚖️ Risk:Reward (TP2) — ~1:1.60
Trigger: Immediate entry or on a confirmed breakout above the $2.3960 resistance high.
Risk Note: Extreme high-gainer tokens carry intense volatility and potential pullback wicks. Manage your leverage tightly, secure partial profits at each target, and stick strictly to your stop-loss!
Which target are you eyeing first? 👇
4
1
474
·
--
Verified

Article
🚀 Billions in Volume, 50% Buyback & Burn: Is Now the Smartest Time to Start DCA-ing $PUMP? 💎🔥$PUMP
When a platform prints massive on-chain revenue while its native token trades at a deep discount, smart money starts paying close attention. Pump.fun ($PUMP), the undisputed powerhouse behind Solana’s meme-coin and token-launch economy, has crossed over $105 billion in cumulative DEX volume and generated hundreds of millions in protocol fees.
Even better for long-term accumulators, Pump.fun allocates 50% of protocol revenue directly toward buying back and permanently burning $PUMP—having already removed over 177 billion tokens (17.7% of total supply) from circulation.
Why Start Your $PUMP DCA Plan Now:
Discounted Accumulation Zone: Trading around $0.0029—well below its $0.0040 sale price—gives patient investors a high-upside entry zone.
Relentless Deflationary Pressure: Daily protocol buybacks create continuous organic demand.
Smart DCA Execution: Instead of going all-in at once, split your capital into 3–4 tranches—starting a base allocation right now (~$0.0028–$0.0030), saving dry powder for deeper dips (~$0.0020–$0.0023), and holding for macro recovery targets at $0.0045+ and $0.0060+.
⚠️ Risk Note: Monthly team/investor token unlocks and meme-market cycles bring sharp volatility. Stick to disciplined position sizing!
Are you starting a $PUMP DCA bag now or waiting for lower prices? Drop your targets below! 👇
🚀 Billions in Volume, 50% Buyback & Burn: Is Now the Smartest Time to Start DCA-ing $PUMP? 💎🔥
$PUMP
When a platform prints massive on-chain revenue while its native token trades at a deep discount, smart money starts paying close attention. Pump.fun ($PUMP ), the undisputed powerhouse behind Solana’s meme-coin and token-launch economy, has crossed over $105 billion in cumulative DEX volume and generated hundreds of millions in protocol fees.
Even better for long-term accumulators, Pump.fun allocates 50% of protocol revenue directly toward buying back and permanently burning $PUMP —having already removed over 177 billion tokens (17.7% of total supply) from circulation.
Why Start Your $PUMP DCA Plan Now:
Discounted Accumulation Zone: Trading around $0.0029—well below its $0.0040 sale price—gives patient investors a high-upside entry zone.
Relentless Deflationary Pressure: Daily protocol buybacks create continuous organic demand.
Smart DCA Execution: Instead of going all-in at once, split your capital into 3–4 tranches—starting a base allocation right now (~$0.0028–$0.0030), saving dry powder for deeper dips (~$0.0020–$0.0023), and holding for macro recovery targets at $0.0045+ and $0.0060+.
⚠️ Risk Note: Monthly team/investor token unlocks and meme-market cycles bring sharp volatility. Stick to disciplined position sizing!
Are you starting a $PUMP DCA bag now or waiting for lower prices? Drop your targets below! 👇
When a platform prints massive on-chain revenue while its native token trades at a deep discount, smart money starts paying close attention. Pump.fun ($PUMP ), the undisputed powerhouse behind Solana’s meme-coin and token-launch economy, has crossed over $105 billion in cumulative DEX volume and generated hundreds of millions in protocol fees.
Even better for long-term accumulators, Pump.fun allocates 50% of protocol revenue directly toward buying back and permanently burning $PUMP —having already removed over 177 billion tokens (17.7% of total supply) from circulation.
Why Start Your $PUMP DCA Plan Now:
Discounted Accumulation Zone: Trading around $0.0029—well below its $0.0040 sale price—gives patient investors a high-upside entry zone.
Relentless Deflationary Pressure: Daily protocol buybacks create continuous organic demand.
Smart DCA Execution: Instead of going all-in at once, split your capital into 3–4 tranches—starting a base allocation right now (~$0.0028–$0.0030), saving dry powder for deeper dips (~$0.0020–$0.0023), and holding for macro recovery targets at $0.0045+ and $0.0060+.
⚠️ Risk Note: Monthly team/investor token unlocks and meme-market cycles bring sharp volatility. Stick to disciplined position sizing!
Are you starting a $PUMP DCA bag now or waiting for lower prices? Drop your targets below! 👇
3
1
222
Log in to explore more content
Join global crypto users on Binance Square
⚡️ Get latest and useful information about crypto.
💬 Trusted by the world’s largest crypto exchange.
👍 Discover real insights from verified creators.
Email / Phone number
Trending Topics
CryptoSelloffTriggersMultipleWhaleLiquidations
165,944 views
1,709 Discussing
Crypto Liquidations Top $2B in 24 Hours as 329,000 Traders Are Wiped Out
Binance News
·39 Likes
·51.3k views
USSpotXRPETFsSeeLargestWeeklyOutflowIn8Months
150,333 views
1,508 Discussing
WillFOMCMinutesReinforceRateHikeExpectations?
43,008 views
705 Discussing