

Huutruong
10k Posts

Huutruong
Report
Block User
💰 Theo dõi Crypto | Tìm kiếm cơ hội mỗi ngày
Open Trade
Occasional Trader
5.4 Years
3.6K+ Following
2.4K+ Followers
841 Liked
Posts
Portfolio
All
Quotes
Videos
Live
·
--
Bullish
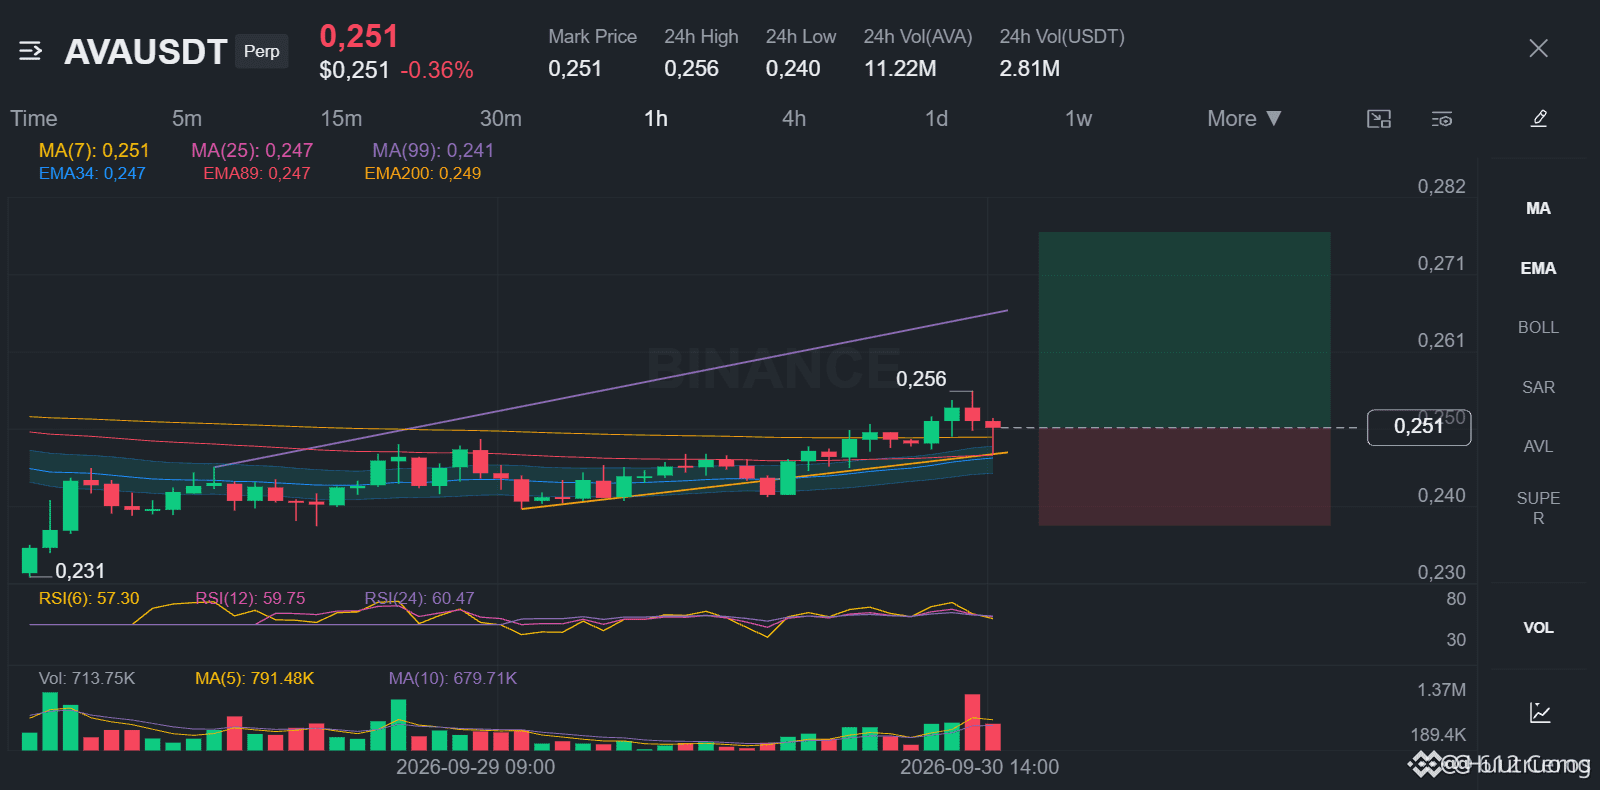
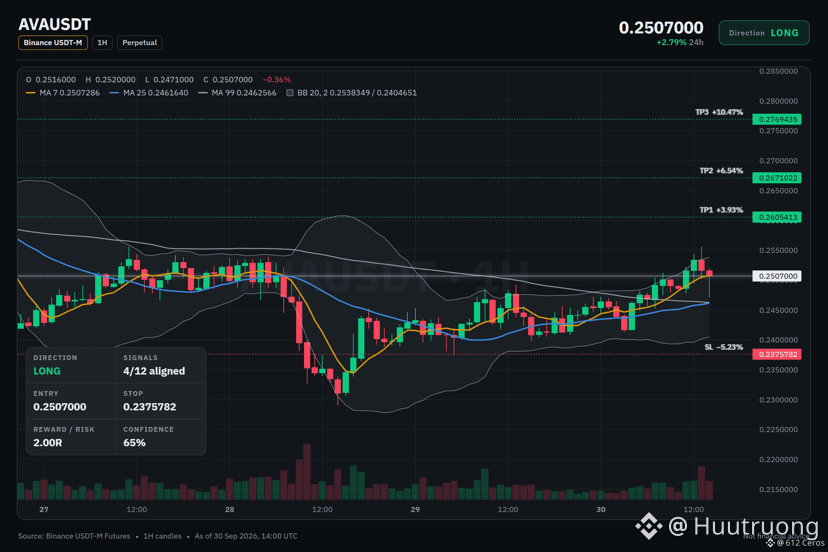
$AVA is sending a clear LONG signal on the 1H timeframe 👀
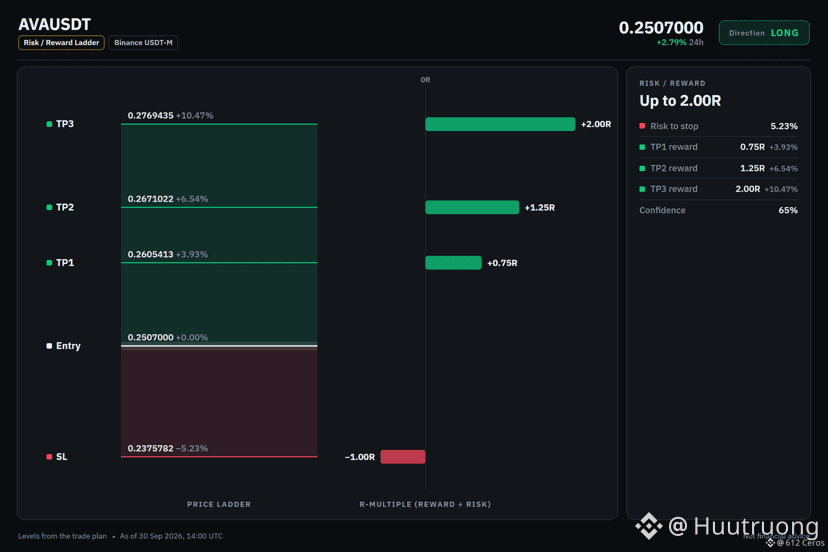
🟢 Entry: 0.2502–0.2512
🎯 TP: 0.2605 / 0.2671 / 0.2769
🛑 SL: 0.2376
4H still keeps a bullish EMA, 1H RSI is 58.4, and AVA is stronger than BTC by +3.59%.
⚠️ But only 4/12 signals are in agreement, 8 signals are still undecided → prioritize light volume.
If you haven’t entered yet, where will you place your Entry? 👇
{spot}(AVAUSDT)
$AVA is sending a clear LONG signal on the 1H timeframe 👀
🟢 Entry: 0.2502–0.2512
🎯 TP: 0.2605 / 0.2671 / 0.2769
🛑 SL: 0.2376
4H still keeps a bullish EMA, 1H RSI is 58.4, and AVA is stronger than BTC by +3.59%.
⚠️ But only 4/12 signals are in agreement, 8 signals are still undecided → prioritize light volume.
If you haven’t entered yet, where will you place your Entry? 👇
🟢 Entry: 0.2502–0.2512
🎯 TP: 0.2605 / 0.2671 / 0.2769
🛑 SL: 0.2376
4H still keeps a bullish EMA, 1H RSI is 58.4, and AVA is stronger than BTC by +3.59%.
⚠️ But only 4/12 signals are in agreement, 8 signals are still undecided → prioritize light volume.
If you haven’t entered yet, where will you place your Entry? 👇
14
·
--
Bullish
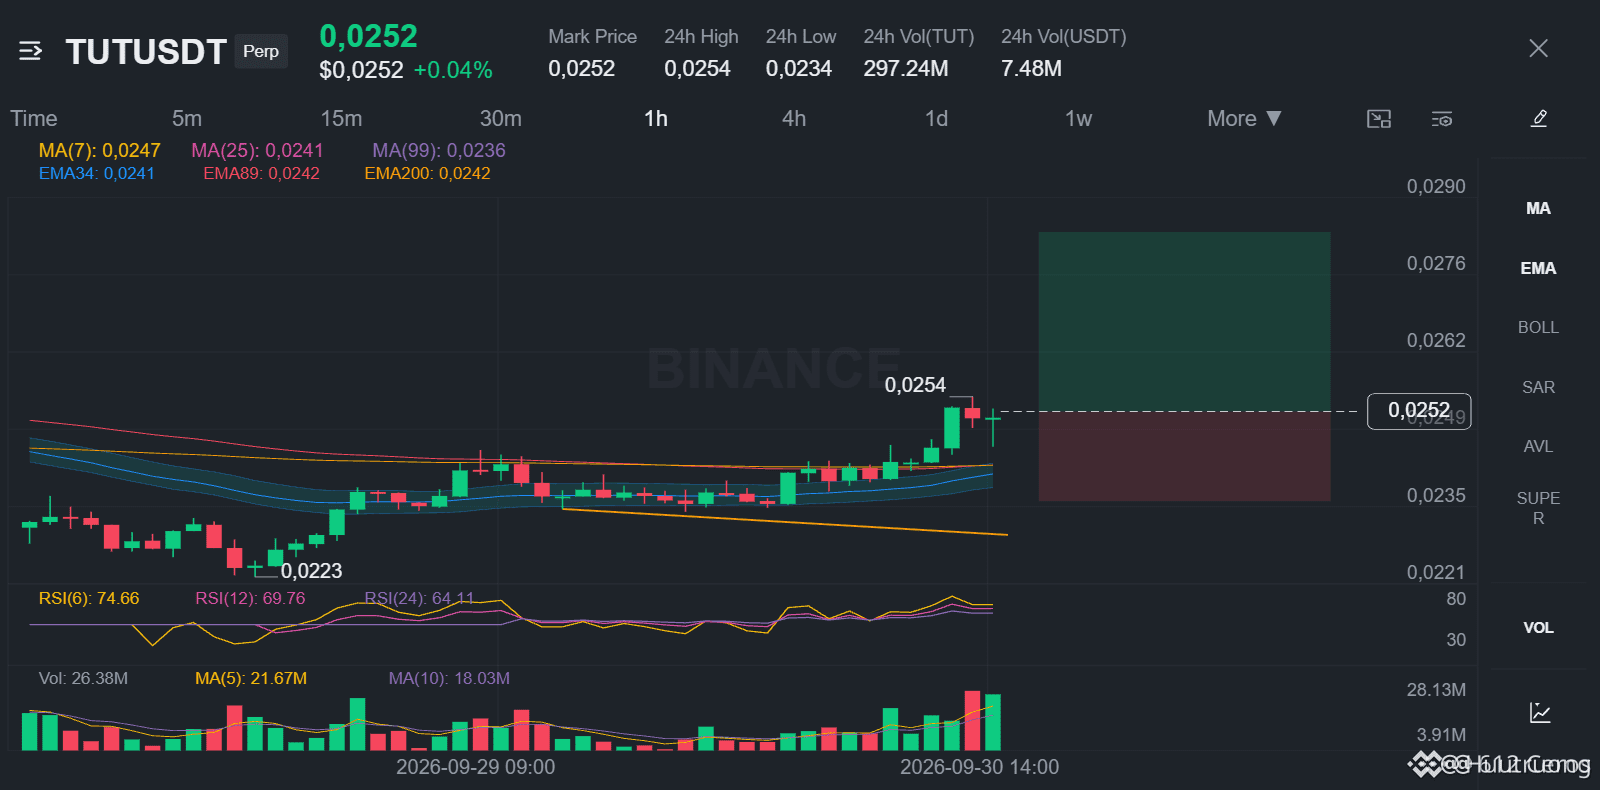
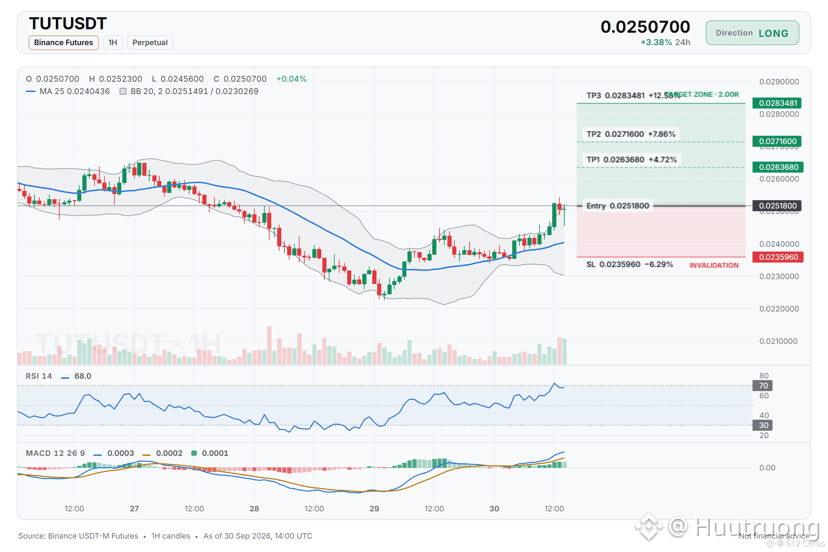
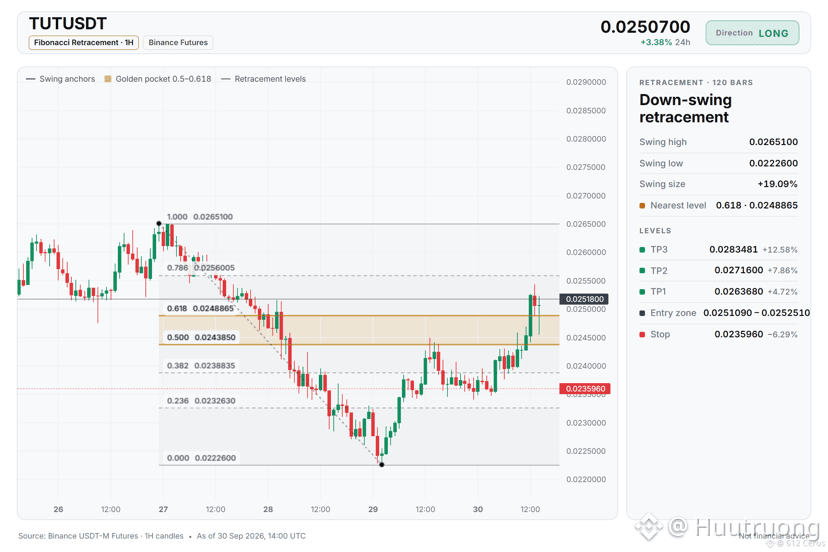
$TUT are you preparing to break the range daily? 👀
🟢 LONG: 0.02511–0.02525
🎯 TP: 0.02637 / 0.02716 / 0.02835
🛑 SL: 0.02360
1H is bullish, DI+ > DI− and RSI 15M 64.45 indicate the buyers are holding the momentum.
⚠️ But 7/12 signals still haven’t made a decision → no breakout confirmation yet, so don’t chase the price.
Do you think TUT will break the range or continue to trade sideways? 👇
{spot}(TUTUSDT)
$TUT are you preparing to break the range daily? 👀
🟢 LONG: 0.02511–0.02525
🎯 TP: 0.02637 / 0.02716 / 0.02835
🛑 SL: 0.02360
1H is bullish, DI+ > DI− and RSI 15M 64.45 indicate the buyers are holding the momentum.
⚠️ But 7/12 signals still haven’t made a decision → no breakout confirmation yet, so don’t chase the price.
Do you think TUT will break the range or continue to trade sideways? 👇
🟢 LONG: 0.02511–0.02525
🎯 TP: 0.02637 / 0.02716 / 0.02835
🛑 SL: 0.02360
1H is bullish, DI+ > DI− and RSI 15M 64.45 indicate the buyers are holding the momentum.
⚠️ But 7/12 signals still haven’t made a decision → no breakout confirmation yet, so don’t chase the price.
Do you think TUT will break the range or continue to trade sideways? 👇
20
·
--
Bullish
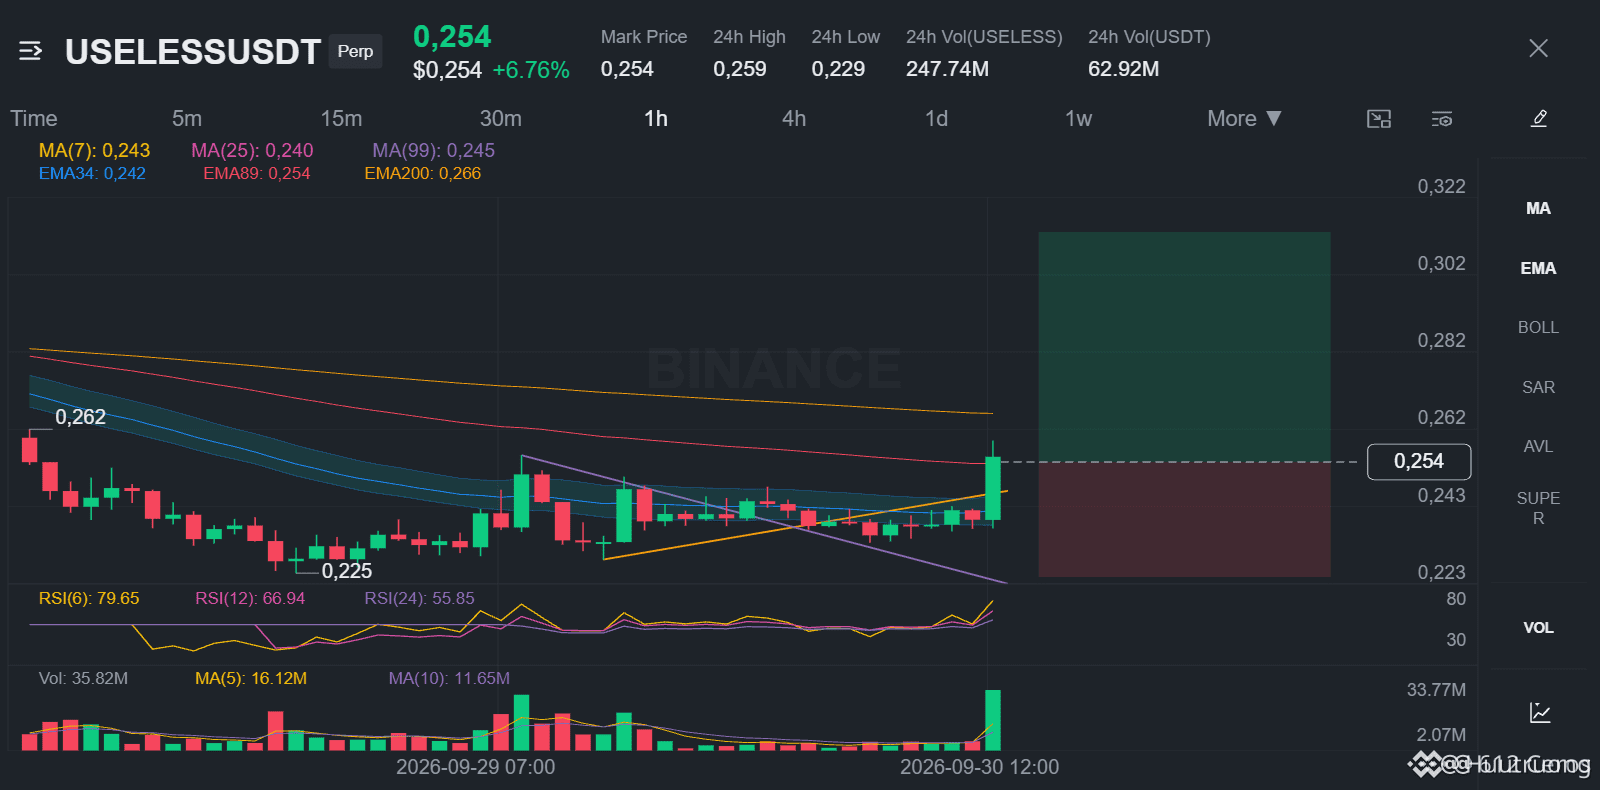
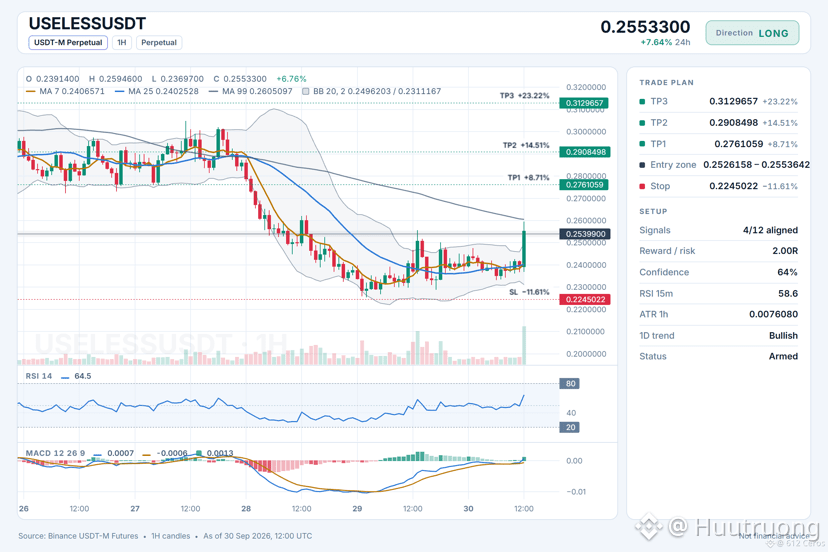
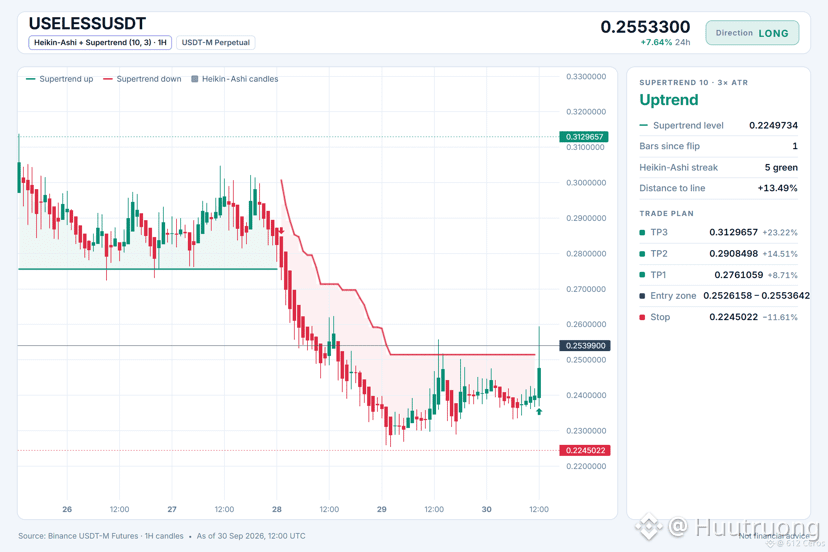
$USELESS is in an uptrend recovery, but has it moved too far beyond the average level? 👀
🟢 LONG: 0.2526–0.2554
🎯 TP: 0.2761 / 0.2908 / 0.3130
🛑 SL: 0.2245
D1 is still bullish, but the 4H RSI at 38.6 indicates the sell-side has not disappeared yet. The setup has only 4/12 signals in agreement → so keep position size small.
📌 Where will you set TP1 or TP2?
{future}(USELESSUSDT)
$USELESS is in an uptrend recovery, but has it moved too far beyond the average level? 👀
🟢 LONG: 0.2526–0.2554
🎯 TP: 0.2761 / 0.2908 / 0.3130
🛑 SL: 0.2245
D1 is still bullish, but the 4H RSI at 38.6 indicates the sell-side has not disappeared yet. The setup has only 4/12 signals in agreement → so keep position size small.
📌 Where will you set TP1 or TP2?
🟢 LONG: 0.2526–0.2554
🎯 TP: 0.2761 / 0.2908 / 0.3130
🛑 SL: 0.2245
D1 is still bullish, but the 4H RSI at 38.6 indicates the sell-side has not disappeared yet. The setup has only 4/12 signals in agreement → so keep position size small.
📌 Where will you set TP1 or TP2?
30
·
--
Bearish
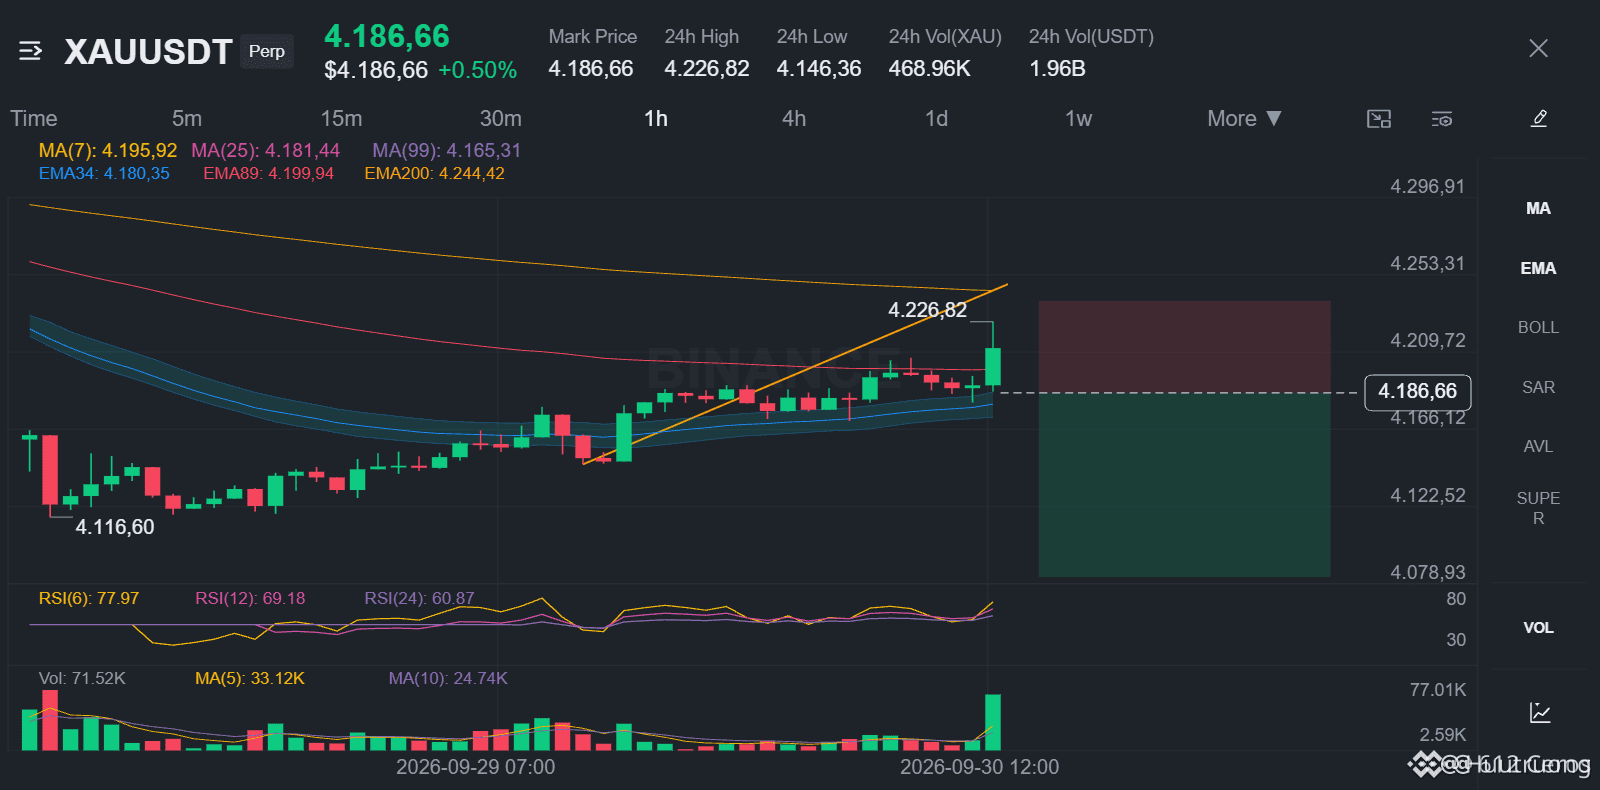
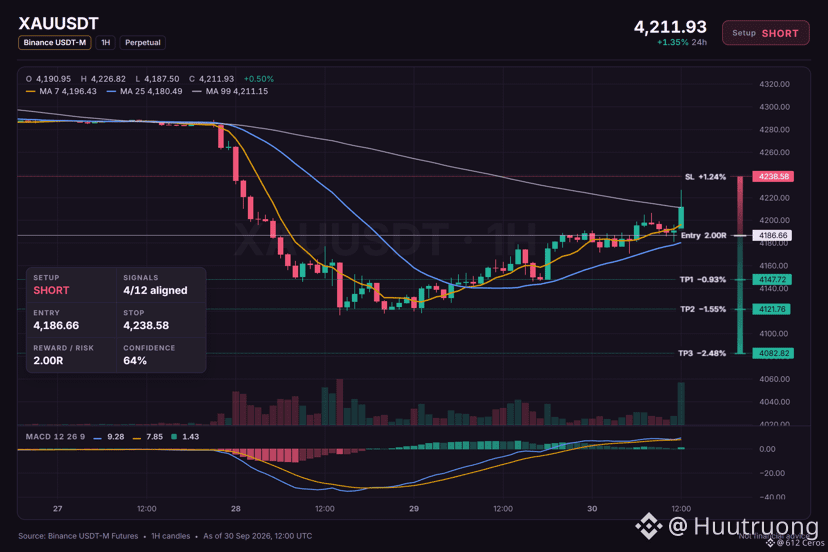
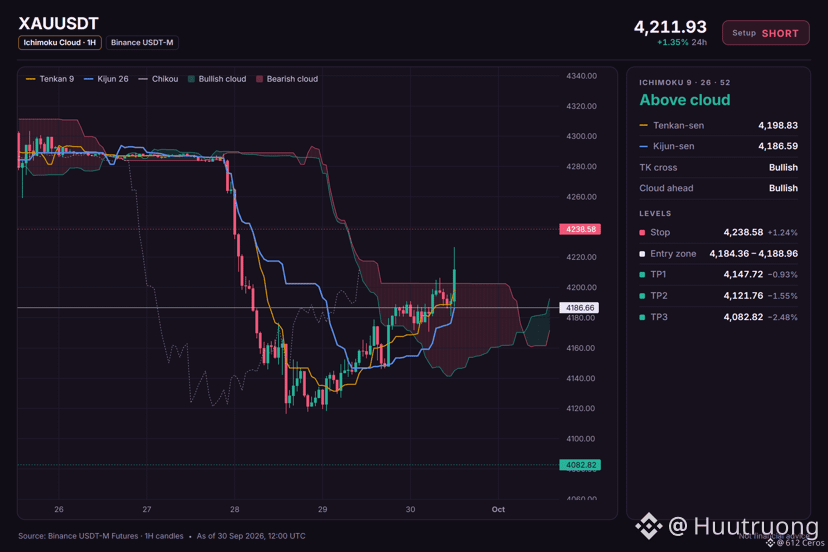
🔴 SHORT $XAUT /USDT — bearish bias
📍 Entry: 4184.36–4188.96
🎯 TP: 4147.72 / 4121.76 / 4082.82
🛑 SL: 4238.58
D1 + 4H are both currently in a downtrend; RSI 4H 44.0 supports the sellers. But RSI 1H 67.5 shows the buyers still have strength → the setup leans SHORT, so reduce position size.
⚠️ Don’t chase price. Wait for the correct entry zone.
Where will you set the invalidation above 4238.58? 👇
{spot}(XAUTUSDT)
🔴 SHORT $XAUT /USDT — bearish bias
📍 Entry: 4184.36–4188.96
🎯 TP: 4147.72 / 4121.76 / 4082.82
🛑 SL: 4238.58
D1 + 4H are both currently in a downtrend; RSI 4H 44.0 supports the sellers. But RSI 1H 67.5 shows the buyers still have strength → the setup leans SHORT, so reduce position size.
⚠️ Don’t chase price. Wait for the correct entry zone.
Where will you set the invalidation above 4238.58? 👇
📍 Entry: 4184.36–4188.96
🎯 TP: 4147.72 / 4121.76 / 4082.82
🛑 SL: 4238.58
D1 + 4H are both currently in a downtrend; RSI 4H 44.0 supports the sellers. But RSI 1H 67.5 shows the buyers still have strength → the setup leans SHORT, so reduce position size.
⚠️ Don’t chase price. Wait for the correct entry zone.
Where will you set the invalidation above 4238.58? 👇
20
·
--
Bullish
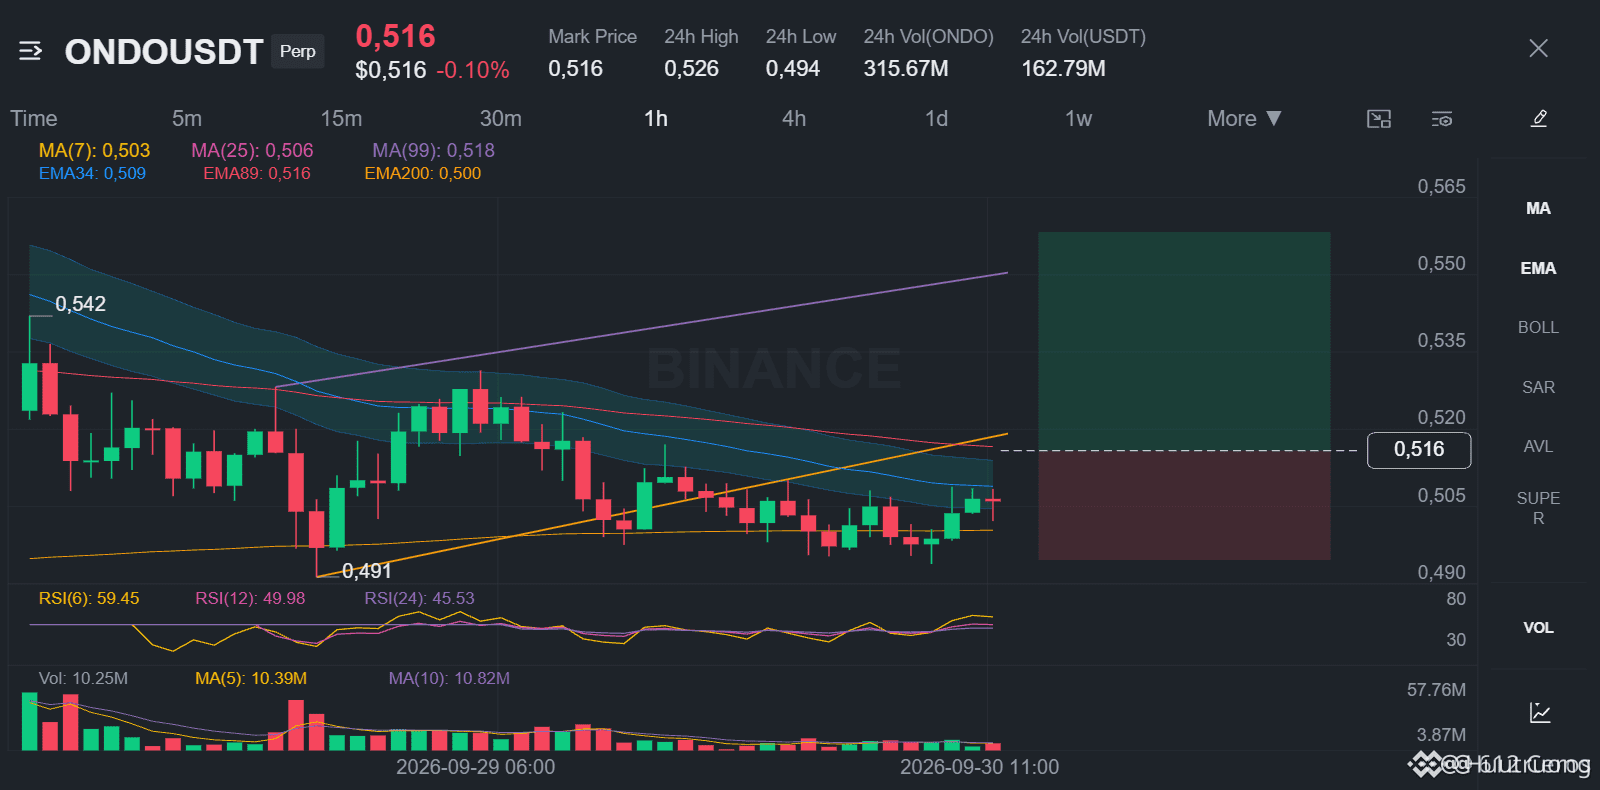
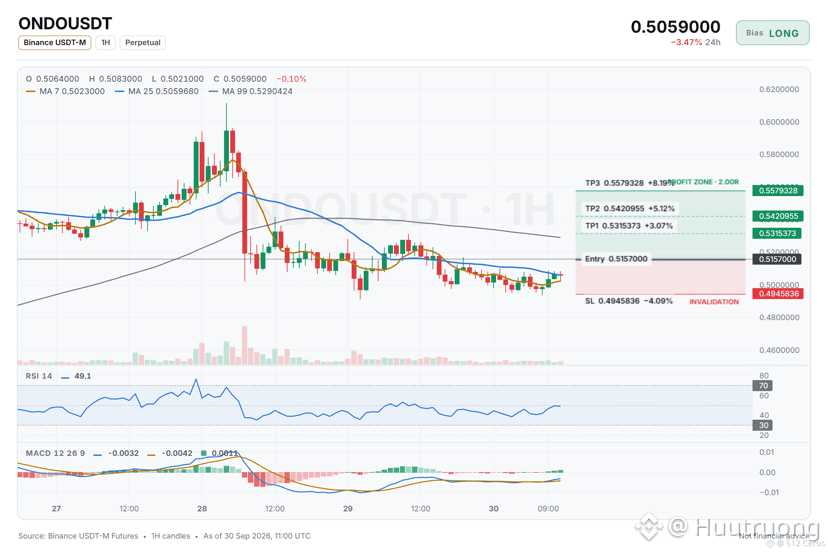
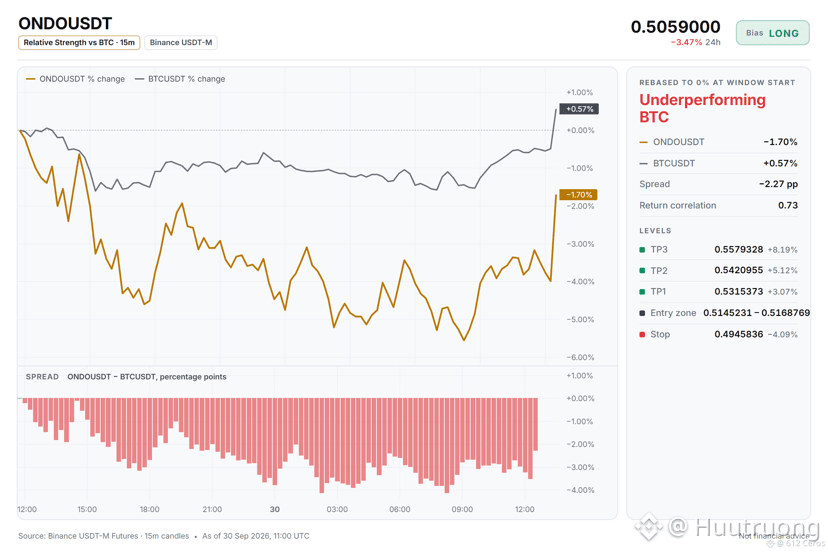
$ONDO is being closely watched for SHORT by many traders when the price rises 👀
🟢 LONG 0.5145–0.5169
🎯 TP: 0.5315 / 0.5421 / 0.5579
🛑 SL: 0.4946
D1 + 4H + 1H are all currently holding an uptrend structure. RSI 15M 68.46 → strong buying pressure, but also be cautious of a pullback.
{spot}(ONDOUSDT)
$ONDO is being closely watched for SHORT by many traders when the price rises 👀
🟢 LONG 0.5145–0.5169
🎯 TP: 0.5315 / 0.5421 / 0.5579
🛑 SL: 0.4946
D1 + 4H + 1H are all currently holding an uptrend structure. RSI 15M 68.46 → strong buying pressure, but also be cautious of a pullback.
🟢 LONG 0.5145–0.5169
🎯 TP: 0.5315 / 0.5421 / 0.5579
🛑 SL: 0.4946
D1 + 4H + 1H are all currently holding an uptrend structure. RSI 15M 68.46 → strong buying pressure, but also be cautious of a pullback.
42
·
--
Bullish
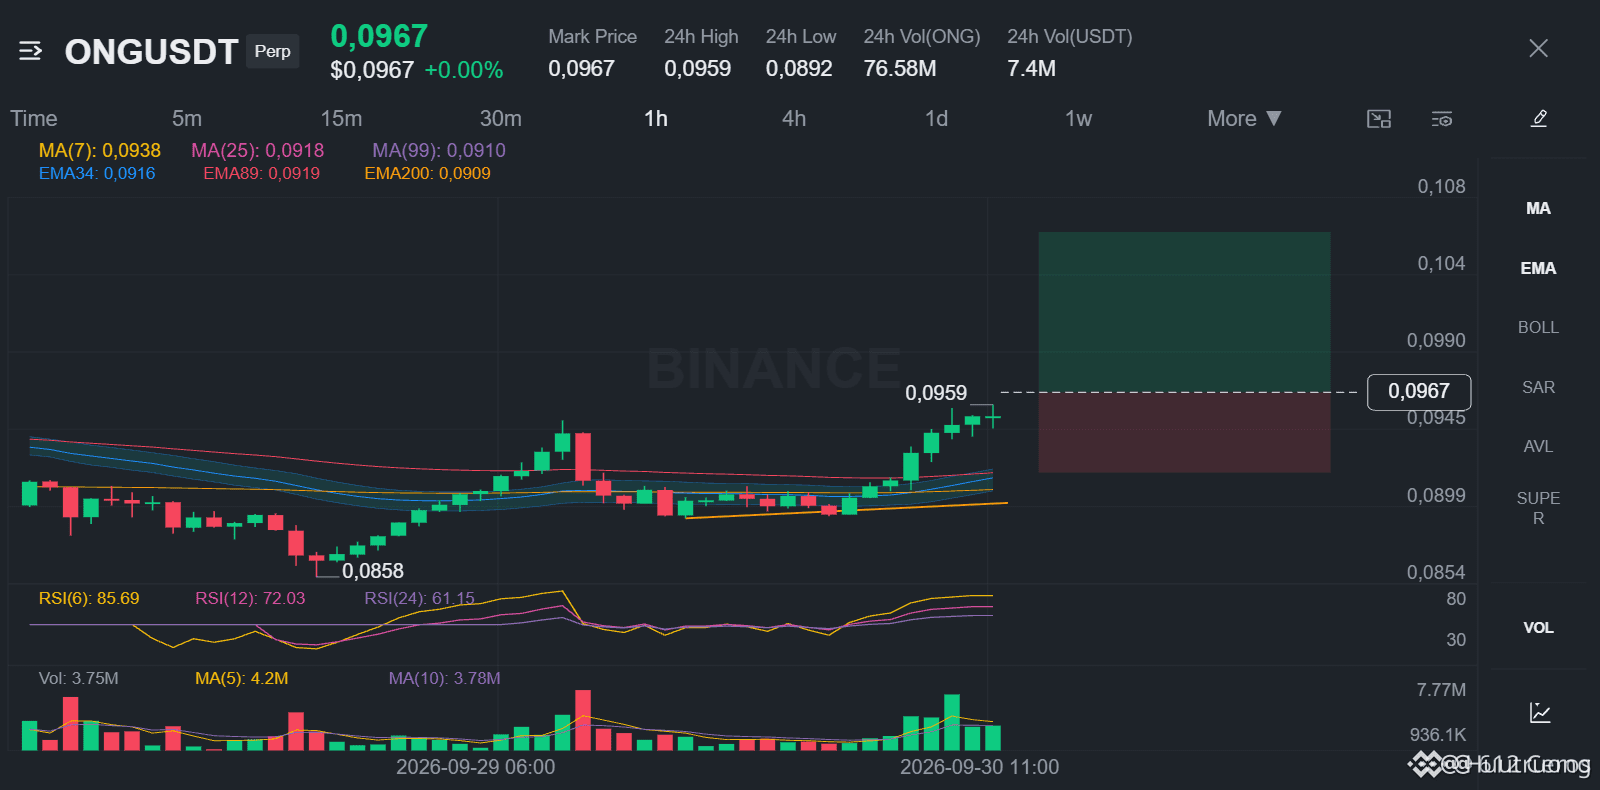
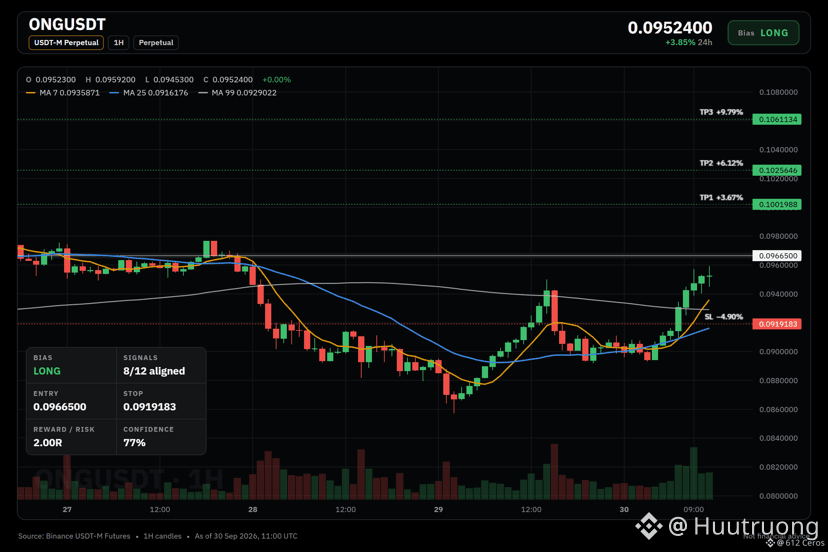
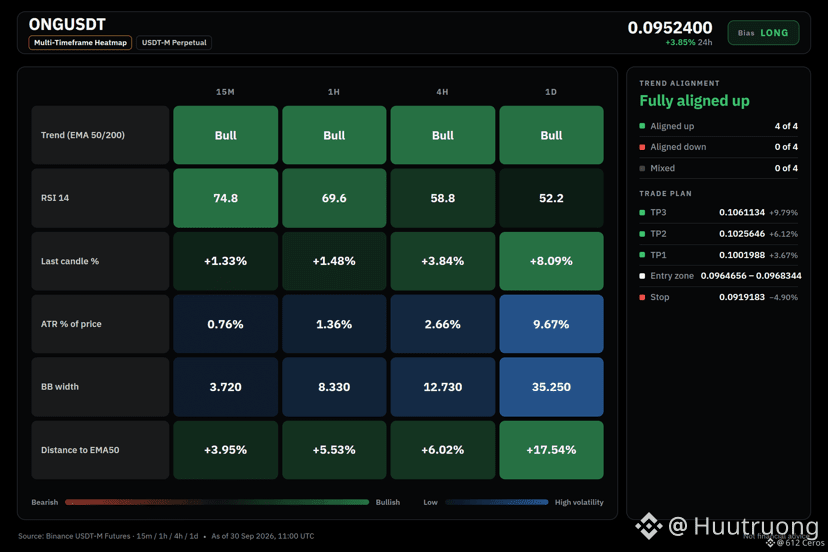
$ONG is rising strongly, but it is currently +3.9 ATR away from the 1H EMA50 → quite far from the average level, so a pullback is likely.
🟢 LONG: 0.09647–0.09683
🎯 TP: 0.10020 / 0.10256 / 0.10611
🛑 SL: 0.09192
{spot}(ONGUSDT)
$ONG is rising strongly, but it is currently +3.9 ATR away from the 1H EMA50 → quite far from the average level, so a pullback is likely.
🟢 LONG: 0.09647–0.09683
🎯 TP: 0.10020 / 0.10256 / 0.10611
🛑 SL: 0.09192
🟢 LONG: 0.09647–0.09683
🎯 TP: 0.10020 / 0.10256 / 0.10611
🛑 SL: 0.09192
48
·
--

Article
See translation
Binance đã hủy niêm yết bao nhiêu token trong 3 quý của năm 2026?Binance đã hủy niêm yết 42 token spot và 28 hợp đồng phái sinh trong 3 quý đầu năm 2026, trong bối cảnh thị trường tiền số bước vào giai đoạn khó khăn và nhiều dự án chịu áp lực về thanh khoản, doanh thu thực từ giao thức.
Trong bối cảnh thị trường tiền số bước vào giai đoạn khó khăn, Binance đang tăng tần suất rà soát và hủy niêm yết các tài sản trên nền tảng. Trong 3 quý đầu năm 2026, sàn giao dịch này đã loại 42 token giao ngay (spot) và 28 hợp đồng giao dịch phát sinh, trong đó nhóm tài sản có vốn hóa pha loãng (FDV) thấp chiếm tỷ trọng đáng kể.
Số liệu thống kê cho thấy Binance đã hủy niêm yết 42 token trên thị trường spot trong năm 2026, vượt tổng số token spot bị loại trong tất cả các năm trước. Cùng với đó, sàn giao dịch cũng hủy niêm yết 28 hợp đồng phái sinh.
Tần suất các đợt hủy niêm yết cũng tăng mạnh so với năm trước. Trung bình cứ 28 ngày, Binance lại công bố một đợt hủy niêm yết, trong khi con số này của năm 2025 là 52 ngày. Điều này cho thấy hoạt động rà soát các tài sản được giao dịch trên sàn đang diễn ra thường xuyên hơn.
Động thái này diễn ra trong bối cảnh thị trường tiền số bước vào giai đoạn phân hóa mạnh. Sau những chu kỳ tăng trưởng, một lượng lớn dự án được đưa ra thị trường với kỳ vọng thu hút người dùng, thanh khoản và dòng tiền đầu tư. Tuy nhiên, khi điều kiện thị trường trở nên kém thuận lợi, khả năng duy trì hoạt động của các dự án cũng chịu nhiều sức ép
Một trong những vấn đề được thị trường quan tâm là khả năng tạo ra doanh thu thực từ giao thức. Trong giai đoạn thị trường tăng trưởng, nhiều dự án có thể thu hút người dùng nhờ các chương trình khuyến khích, phần thưởng token hoặc dòng vốn đầu cơ. Tuy nhiên, khi thanh khoản suy giảm và hoạt động đầu cơ hạ nhiệt, những mô hình không tạo ra dòng tiền bền vững từ hoạt động thực tế có thể gặp khó khăn trong việc duy trì hệ sinh thái.
Điều này đặc biệt đáng chú ý đối với các token có quy mô vốn hóa và FDV thấp. Theo số liệu thống kê, 49% token trên giao dịch giao ngay bị Binance hủy niêm yết trong năm nay có FDV dưới 10 triệu USD. Trong khi đó, chưa ghi nhận trường hợp nào thuộc nhóm token có FDV trên 100 triệu USD bị Binance loại khỏi thị trường spot.
FDV phản ánh mức định giá giả định của dự án nếu toàn bộ lượng token được phát hành ra thị trường. Với các dự án có FDV thấp, thanh khoản và quy mô thị trường thường hạn chế hơn, khiến giá token dễ chịu tác động khi dòng tiền rút khỏi các tài sản rủi ro.
Tuy nhiên, FDV không phải yếu tố duy nhất quyết định việc một token có bị hủy niêm yết hay không. Binance thường xuyên đánh giá nhiều yếu tố liên quan đến tài sản và thị trường giao dịch. Vì vậy, việc một token có FDV thấp xuất hiện trong danh sách bị hủy không đồng nghĩa quy mô FDV là nguyên nhân trực tiếp dẫn đến quyết định này.
Sự khác biệt giữa thị trường giao ngay và phái sinh, cũng cho thấy cách các tài sản mới được đưa lên sàn có thể đối mặt với rủi ro khác nhau. Trong số 28 hợp đồng phái sinh bị hủy niêm yết trong năm 2026, có tới 23 hợp đồng liên quan đến các token mới được Binance niêm yết từ năm 2025.
Trong khi đó, các token spot bị loại khỏi sàn thường đã được giao dịch trong nhiều năm. Điều này cho thấy một dự án từng duy trì được vị trí trên thị trường trong thời gian dài vẫn có thể bị đưa vào diện rà soát khi điều kiện thị trường, thanh khoản hoặc hoạt động giao dịch thay đổi.
Nguồn gốc niêm yết của các token cũng là một điểm đáng chú ý. Khoảng 26% token spot bị hủy niêm yết từng được giới thiệu thông qua Binance Launchpool hoặc Launchpad. Đối với thị trường futures, 63% token bị hủy từng xuất hiện trên Binance Alpha.
Binance Alpha là nền tảng giới thiệu các dự án và token mới trong hệ sinh thái Binance. Việc một tỷ lệ lớn token futures từng xuất hiện trên nền tảng này bị hủy niêm yết cho thấy vòng đời của các tài sản mới trên thị trường phái sinh có thể tương đối ngắn, đặc biệt khi thanh khoản và nhu cầu giao dịch không duy trì được kỳ vọng ban đầu.
Trong bối cảnh thị trường bước vào giai đoạn được ví như “mùa đông tiền số”, áp lực đối với các dự án ngày càng lớn. Khi dòng tiền đầu cơ suy giảm, khả năng tạo ra giá trị và doanh thu thực từ giao thức trở thành yếu tố quan trọng hơn đối với khả năng tồn tại lâu dài.
Những dự án phụ thuộc quá nhiều vào việc phát hành token, khuyến khích thanh khoản hoặc dòng vốn mới có thể gặp khó khi thị trường không còn thuận lợi. Ngược lại, các giao thức có hoạt động sử dụng thực tế và nguồn doanh thu ổn định có nhiều cơ sở hơn để duy trì hoạt động ngay cả khi giá token biến động.
Việc Binance liên tục rà soát và hủy niêm yết tài sản vì thế không chỉ phản ánh sự thay đổi trong danh mục giao dịch của một sàn lớn, mà còn cho thấy quá trình sàng lọc đang diễn ra trong toàn bộ thị trường. Khi thanh khoản trở nên khan hiếm và nhà đầu tư thận trọng hơn, khoảng cách giữa những dự án có hoạt động kinh tế thực và những dự án chủ yếu dựa vào kỳ vọng thị trường có xu hướng ngày càng rõ rệt.
Binance đã hủy niêm yết bao nhiêu token trong 3 quý của năm 2026?
Binance đã hủy niêm yết 42 token spot và 28 hợp đồng phái sinh trong 3 quý đầu năm 2026, trong bối cảnh thị trường tiền số bước vào giai đoạn khó khăn và nhiều dự án chịu áp lực về thanh khoản, doanh thu thực từ giao thức.
Trong bối cảnh thị trường tiền số bước vào giai đoạn khó khăn, Binance đang tăng tần suất rà soát và hủy niêm yết các tài sản trên nền tảng. Trong 3 quý đầu năm 2026, sàn giao dịch này đã loại 42 token giao ngay (spot) và 28 hợp đồng giao dịch phát sinh, trong đó nhóm tài sản có vốn hóa pha loãng (FDV) thấp chiếm tỷ trọng đáng kể.
Số liệu thống kê cho thấy Binance đã hủy niêm yết 42 token trên thị trường spot trong năm 2026, vượt tổng số token spot bị loại trong tất cả các năm trước. Cùng với đó, sàn giao dịch cũng hủy niêm yết 28 hợp đồng phái sinh.
Tần suất các đợt hủy niêm yết cũng tăng mạnh so với năm trước. Trung bình cứ 28 ngày, Binance lại công bố một đợt hủy niêm yết, trong khi con số này của năm 2025 là 52 ngày. Điều này cho thấy hoạt động rà soát các tài sản được giao dịch trên sàn đang diễn ra thường xuyên hơn.
Động thái này diễn ra trong bối cảnh thị trường tiền số bước vào giai đoạn phân hóa mạnh. Sau những chu kỳ tăng trưởng, một lượng lớn dự án được đưa ra thị trường với kỳ vọng thu hút người dùng, thanh khoản và dòng tiền đầu tư. Tuy nhiên, khi điều kiện thị trường trở nên kém thuận lợi, khả năng duy trì hoạt động của các dự án cũng chịu nhiều sức ép
Một trong những vấn đề được thị trường quan tâm là khả năng tạo ra doanh thu thực từ giao thức. Trong giai đoạn thị trường tăng trưởng, nhiều dự án có thể thu hút người dùng nhờ các chương trình khuyến khích, phần thưởng token hoặc dòng vốn đầu cơ. Tuy nhiên, khi thanh khoản suy giảm và hoạt động đầu cơ hạ nhiệt, những mô hình không tạo ra dòng tiền bền vững từ hoạt động thực tế có thể gặp khó khăn trong việc duy trì hệ sinh thái.
Điều này đặc biệt đáng chú ý đối với các token có quy mô vốn hóa và FDV thấp. Theo số liệu thống kê, 49% token trên giao dịch giao ngay bị Binance hủy niêm yết trong năm nay có FDV dưới 10 triệu USD. Trong khi đó, chưa ghi nhận trường hợp nào thuộc nhóm token có FDV trên 100 triệu USD bị Binance loại khỏi thị trường spot.
FDV phản ánh mức định giá giả định của dự án nếu toàn bộ lượng token được phát hành ra thị trường. Với các dự án có FDV thấp, thanh khoản và quy mô thị trường thường hạn chế hơn, khiến giá token dễ chịu tác động khi dòng tiền rút khỏi các tài sản rủi ro.
Tuy nhiên, FDV không phải yếu tố duy nhất quyết định việc một token có bị hủy niêm yết hay không. Binance thường xuyên đánh giá nhiều yếu tố liên quan đến tài sản và thị trường giao dịch. Vì vậy, việc một token có FDV thấp xuất hiện trong danh sách bị hủy không đồng nghĩa quy mô FDV là nguyên nhân trực tiếp dẫn đến quyết định này.
Sự khác biệt giữa thị trường giao ngay và phái sinh, cũng cho thấy cách các tài sản mới được đưa lên sàn có thể đối mặt với rủi ro khác nhau. Trong số 28 hợp đồng phái sinh bị hủy niêm yết trong năm 2026, có tới 23 hợp đồng liên quan đến các token mới được Binance niêm yết từ năm 2025.
Trong khi đó, các token spot bị loại khỏi sàn thường đã được giao dịch trong nhiều năm. Điều này cho thấy một dự án từng duy trì được vị trí trên thị trường trong thời gian dài vẫn có thể bị đưa vào diện rà soát khi điều kiện thị trường, thanh khoản hoặc hoạt động giao dịch thay đổi.
Nguồn gốc niêm yết của các token cũng là một điểm đáng chú ý. Khoảng 26% token spot bị hủy niêm yết từng được giới thiệu thông qua Binance Launchpool hoặc Launchpad. Đối với thị trường futures, 63% token bị hủy từng xuất hiện trên Binance Alpha.
Binance Alpha là nền tảng giới thiệu các dự án và token mới trong hệ sinh thái Binance. Việc một tỷ lệ lớn token futures từng xuất hiện trên nền tảng này bị hủy niêm yết cho thấy vòng đời của các tài sản mới trên thị trường phái sinh có thể tương đối ngắn, đặc biệt khi thanh khoản và nhu cầu giao dịch không duy trì được kỳ vọng ban đầu.
Trong bối cảnh thị trường bước vào giai đoạn được ví như “mùa đông tiền số”, áp lực đối với các dự án ngày càng lớn. Khi dòng tiền đầu cơ suy giảm, khả năng tạo ra giá trị và doanh thu thực từ giao thức trở thành yếu tố quan trọng hơn đối với khả năng tồn tại lâu dài.
Những dự án phụ thuộc quá nhiều vào việc phát hành token, khuyến khích thanh khoản hoặc dòng vốn mới có thể gặp khó khi thị trường không còn thuận lợi. Ngược lại, các giao thức có hoạt động sử dụng thực tế và nguồn doanh thu ổn định có nhiều cơ sở hơn để duy trì hoạt động ngay cả khi giá token biến động.
Việc Binance liên tục rà soát và hủy niêm yết tài sản vì thế không chỉ phản ánh sự thay đổi trong danh mục giao dịch của một sàn lớn, mà còn cho thấy quá trình sàng lọc đang diễn ra trong toàn bộ thị trường. Khi thanh khoản trở nên khan hiếm và nhà đầu tư thận trọng hơn, khoảng cách giữa những dự án có hoạt động kinh tế thực và những dự án chủ yếu dựa vào kỳ vọng thị trường có xu hướng ngày càng rõ rệt.
Trong bối cảnh thị trường tiền số bước vào giai đoạn khó khăn, Binance đang tăng tần suất rà soát và hủy niêm yết các tài sản trên nền tảng. Trong 3 quý đầu năm 2026, sàn giao dịch này đã loại 42 token giao ngay (spot) và 28 hợp đồng giao dịch phát sinh, trong đó nhóm tài sản có vốn hóa pha loãng (FDV) thấp chiếm tỷ trọng đáng kể.
Số liệu thống kê cho thấy Binance đã hủy niêm yết 42 token trên thị trường spot trong năm 2026, vượt tổng số token spot bị loại trong tất cả các năm trước. Cùng với đó, sàn giao dịch cũng hủy niêm yết 28 hợp đồng phái sinh.
Tần suất các đợt hủy niêm yết cũng tăng mạnh so với năm trước. Trung bình cứ 28 ngày, Binance lại công bố một đợt hủy niêm yết, trong khi con số này của năm 2025 là 52 ngày. Điều này cho thấy hoạt động rà soát các tài sản được giao dịch trên sàn đang diễn ra thường xuyên hơn.
Động thái này diễn ra trong bối cảnh thị trường tiền số bước vào giai đoạn phân hóa mạnh. Sau những chu kỳ tăng trưởng, một lượng lớn dự án được đưa ra thị trường với kỳ vọng thu hút người dùng, thanh khoản và dòng tiền đầu tư. Tuy nhiên, khi điều kiện thị trường trở nên kém thuận lợi, khả năng duy trì hoạt động của các dự án cũng chịu nhiều sức ép
Một trong những vấn đề được thị trường quan tâm là khả năng tạo ra doanh thu thực từ giao thức. Trong giai đoạn thị trường tăng trưởng, nhiều dự án có thể thu hút người dùng nhờ các chương trình khuyến khích, phần thưởng token hoặc dòng vốn đầu cơ. Tuy nhiên, khi thanh khoản suy giảm và hoạt động đầu cơ hạ nhiệt, những mô hình không tạo ra dòng tiền bền vững từ hoạt động thực tế có thể gặp khó khăn trong việc duy trì hệ sinh thái.
Điều này đặc biệt đáng chú ý đối với các token có quy mô vốn hóa và FDV thấp. Theo số liệu thống kê, 49% token trên giao dịch giao ngay bị Binance hủy niêm yết trong năm nay có FDV dưới 10 triệu USD. Trong khi đó, chưa ghi nhận trường hợp nào thuộc nhóm token có FDV trên 100 triệu USD bị Binance loại khỏi thị trường spot.
FDV phản ánh mức định giá giả định của dự án nếu toàn bộ lượng token được phát hành ra thị trường. Với các dự án có FDV thấp, thanh khoản và quy mô thị trường thường hạn chế hơn, khiến giá token dễ chịu tác động khi dòng tiền rút khỏi các tài sản rủi ro.
Tuy nhiên, FDV không phải yếu tố duy nhất quyết định việc một token có bị hủy niêm yết hay không. Binance thường xuyên đánh giá nhiều yếu tố liên quan đến tài sản và thị trường giao dịch. Vì vậy, việc một token có FDV thấp xuất hiện trong danh sách bị hủy không đồng nghĩa quy mô FDV là nguyên nhân trực tiếp dẫn đến quyết định này.
Sự khác biệt giữa thị trường giao ngay và phái sinh, cũng cho thấy cách các tài sản mới được đưa lên sàn có thể đối mặt với rủi ro khác nhau. Trong số 28 hợp đồng phái sinh bị hủy niêm yết trong năm 2026, có tới 23 hợp đồng liên quan đến các token mới được Binance niêm yết từ năm 2025.
Trong khi đó, các token spot bị loại khỏi sàn thường đã được giao dịch trong nhiều năm. Điều này cho thấy một dự án từng duy trì được vị trí trên thị trường trong thời gian dài vẫn có thể bị đưa vào diện rà soát khi điều kiện thị trường, thanh khoản hoặc hoạt động giao dịch thay đổi.
Nguồn gốc niêm yết của các token cũng là một điểm đáng chú ý. Khoảng 26% token spot bị hủy niêm yết từng được giới thiệu thông qua Binance Launchpool hoặc Launchpad. Đối với thị trường futures, 63% token bị hủy từng xuất hiện trên Binance Alpha.
Binance Alpha là nền tảng giới thiệu các dự án và token mới trong hệ sinh thái Binance. Việc một tỷ lệ lớn token futures từng xuất hiện trên nền tảng này bị hủy niêm yết cho thấy vòng đời của các tài sản mới trên thị trường phái sinh có thể tương đối ngắn, đặc biệt khi thanh khoản và nhu cầu giao dịch không duy trì được kỳ vọng ban đầu.
Trong bối cảnh thị trường bước vào giai đoạn được ví như “mùa đông tiền số”, áp lực đối với các dự án ngày càng lớn. Khi dòng tiền đầu cơ suy giảm, khả năng tạo ra giá trị và doanh thu thực từ giao thức trở thành yếu tố quan trọng hơn đối với khả năng tồn tại lâu dài.
Những dự án phụ thuộc quá nhiều vào việc phát hành token, khuyến khích thanh khoản hoặc dòng vốn mới có thể gặp khó khi thị trường không còn thuận lợi. Ngược lại, các giao thức có hoạt động sử dụng thực tế và nguồn doanh thu ổn định có nhiều cơ sở hơn để duy trì hoạt động ngay cả khi giá token biến động.
Việc Binance liên tục rà soát và hủy niêm yết tài sản vì thế không chỉ phản ánh sự thay đổi trong danh mục giao dịch của một sàn lớn, mà còn cho thấy quá trình sàng lọc đang diễn ra trong toàn bộ thị trường. Khi thanh khoản trở nên khan hiếm và nhà đầu tư thận trọng hơn, khoảng cách giữa những dự án có hoạt động kinh tế thực và những dự án chủ yếu dựa vào kỳ vọng thị trường có xu hướng ngày càng rõ rệt.
20
·
--
Bullish
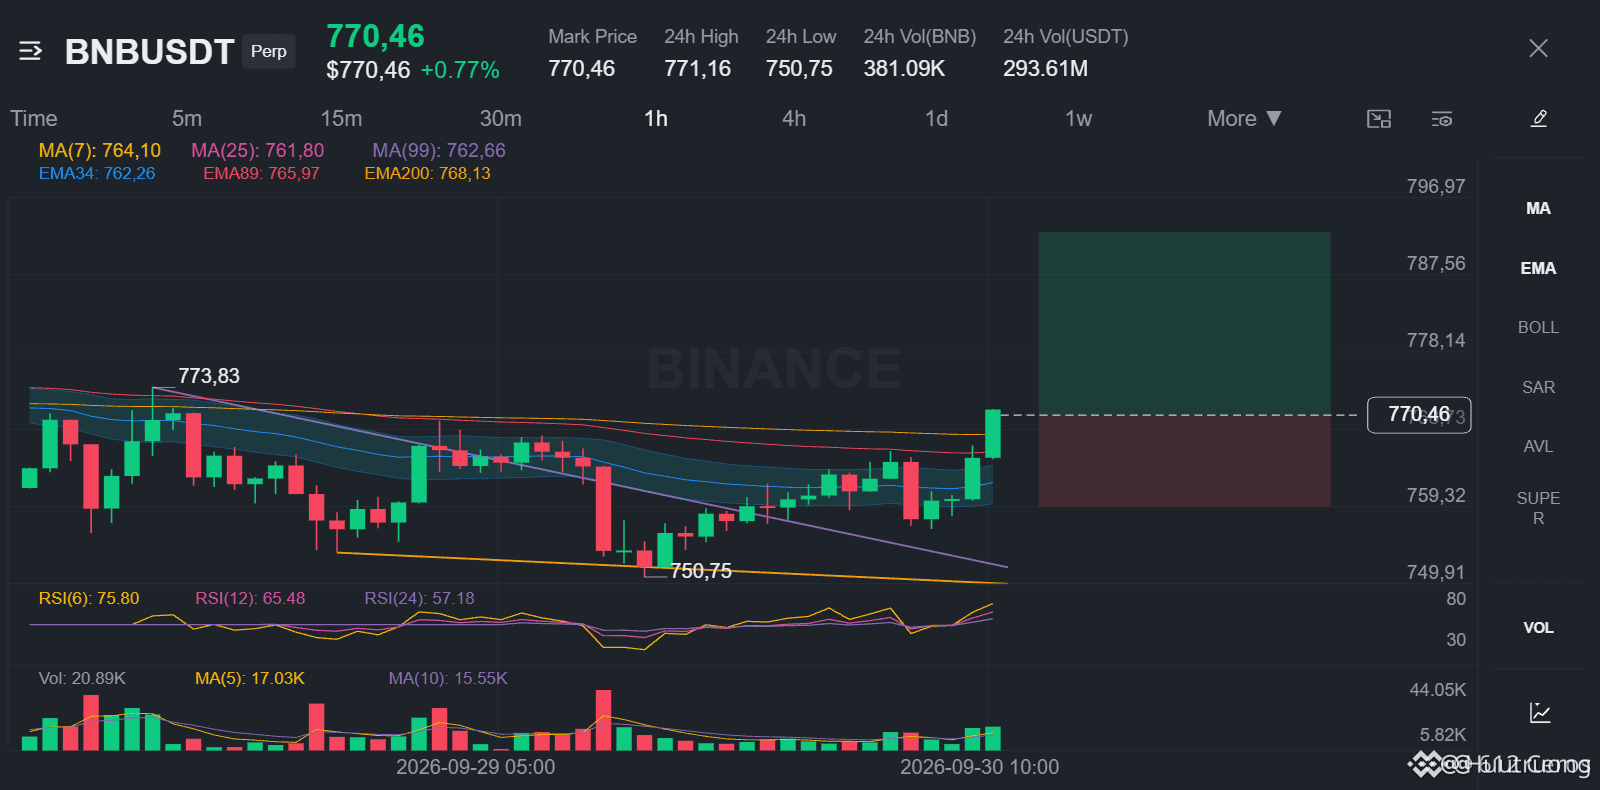
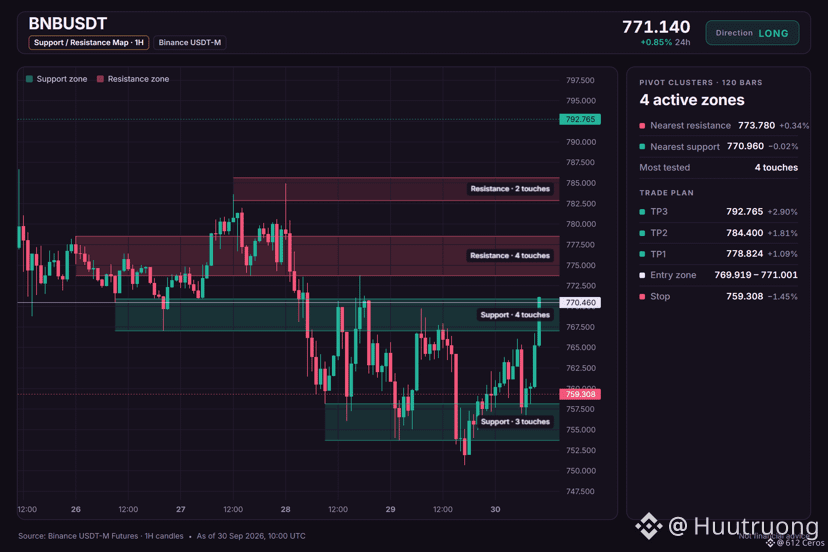
BNB is holding its ground as the daily trend shifts to bullish.
🟢 LONG $BNB /USDT: expected price to GO UP
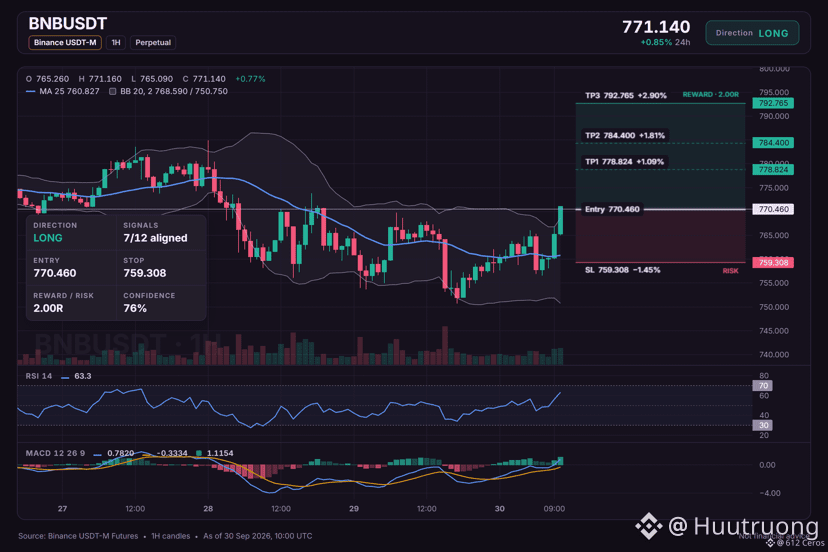
Bias: LONG · Strong · 7/12 signals in agreement, 1 against, 4 undecided
📍 Entry: 769.919 – 771.001 · limit order within the zone, don’t chase price
🎯 TP1: 778.824 (+1.1%) · take about half, then move SL to the entry price
🎯 TP2: 784.400 (+1.8%) · take most of the remaining position
🎯 TP3: 792.765 (+2.9%) · final target
🛑 SL: 759.308 (-1.4%) · close everything, never move it further away
⚖️ Profit/Loss ratio: 0.75R / 1.25R / 2R at TP1 / TP2 / TP3
Only TP1 pays less than the cost of the stop-loss order cut, so the SL is moved to the entry after that.
⏳ Timing: The 15m timeframe momentum is aligned. Skip this if TP1 prints before you get filled.
Why LONG? Technical conclusion: STRONG LONG, 7/12 signals aligned, 1 against, 4 undecided.
✅ Daily trend: price > EMA50 > EMA200, bullish stack → overall trend is upward
✅ 4h trend: price > EMA50 > EMA200, bullish stack → upward swing trend
✅ Trend strength (ADX/DI, 15m): ADX 28.8 with buyers controlling (DI+ 32.0 vs DI− 10.9) → buyers are driving the upswing
✅ BTC backdrop: BTC is bullish and the correlation is 0.77 → BTC is rising and this coin tends to follow
⚠️ 4h RSI: 43.5, downward momentum (below 45) → sellers still have momentum
🟢 Bullish scenario:
From the entry zone 769.919-771.001, BNB should push to TP1 778.824, then TP2 784.400. 1h RSI (63.3, above 55) shows the buyers have momentum for this move.
{spot}(BNBUSDT)
BNB is holding its ground as the daily trend shifts to bullish.
🟢 LONG $BNB /USDT: expected price to GO UP
Bias: LONG · Strong · 7/12 signals in agreement, 1 against, 4 undecided
📍 Entry: 769.919 – 771.001 · limit order within the zone, don’t chase price
🎯 TP1: 778.824 (+1.1%) · take about half, then move SL to the entry price
🎯 TP2: 784.400 (+1.8%) · take most of the remaining position
🎯 TP3: 792.765 (+2.9%) · final target
🛑 SL: 759.308 (-1.4%) · close everything, never move it further away
⚖️ Profit/Loss ratio: 0.75R / 1.25R / 2R at TP1 / TP2 / TP3
Only TP1 pays less than the cost of the stop-loss order cut, so the SL is moved to the entry after that.
⏳ Timing: The 15m timeframe momentum is aligned. Skip this if TP1 prints before you get filled.
Why LONG? Technical conclusion: STRONG LONG, 7/12 signals aligned, 1 against, 4 undecided.
✅ Daily trend: price > EMA50 > EMA200, bullish stack → overall trend is upward
✅ 4h trend: price > EMA50 > EMA200, bullish stack → upward swing trend
✅ Trend strength (ADX/DI, 15m): ADX 28.8 with buyers controlling (DI+ 32.0 vs DI− 10.9) → buyers are driving the upswing
✅ BTC backdrop: BTC is bullish and the correlation is 0.77 → BTC is rising and this coin tends to follow
⚠️ 4h RSI: 43.5, downward momentum (below 45) → sellers still have momentum
🟢 Bullish scenario:
From the entry zone 769.919-771.001, BNB should push to TP1 778.824, then TP2 784.400. 1h RSI (63.3, above 55) shows the buyers have momentum for this move.
🟢 LONG $BNB /USDT: expected price to GO UP
Bias: LONG · Strong · 7/12 signals in agreement, 1 against, 4 undecided
📍 Entry: 769.919 – 771.001 · limit order within the zone, don’t chase price
🎯 TP1: 778.824 (+1.1%) · take about half, then move SL to the entry price
🎯 TP2: 784.400 (+1.8%) · take most of the remaining position
🎯 TP3: 792.765 (+2.9%) · final target
🛑 SL: 759.308 (-1.4%) · close everything, never move it further away
⚖️ Profit/Loss ratio: 0.75R / 1.25R / 2R at TP1 / TP2 / TP3
Only TP1 pays less than the cost of the stop-loss order cut, so the SL is moved to the entry after that.
⏳ Timing: The 15m timeframe momentum is aligned. Skip this if TP1 prints before you get filled.
Why LONG? Technical conclusion: STRONG LONG, 7/12 signals aligned, 1 against, 4 undecided.
✅ Daily trend: price > EMA50 > EMA200, bullish stack → overall trend is upward
✅ 4h trend: price > EMA50 > EMA200, bullish stack → upward swing trend
✅ Trend strength (ADX/DI, 15m): ADX 28.8 with buyers controlling (DI+ 32.0 vs DI− 10.9) → buyers are driving the upswing
✅ BTC backdrop: BTC is bullish and the correlation is 0.77 → BTC is rising and this coin tends to follow
⚠️ 4h RSI: 43.5, downward momentum (below 45) → sellers still have momentum
🟢 Bullish scenario:
From the entry zone 769.919-771.001, BNB should push to TP1 778.824, then TP2 784.400. 1h RSI (63.3, above 55) shows the buyers have momentum for this move.
6
·
--
Bullish
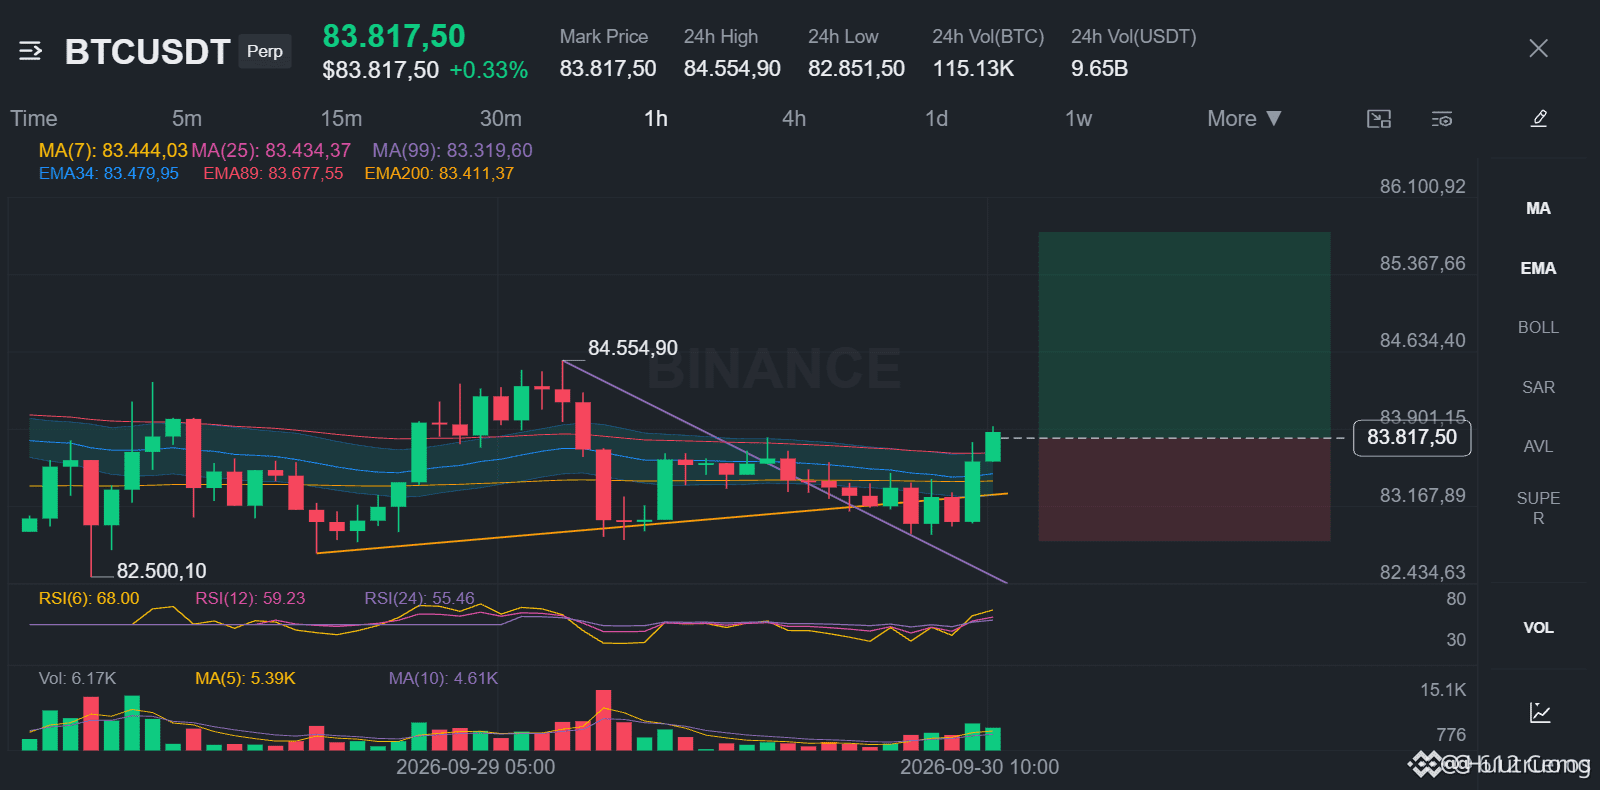
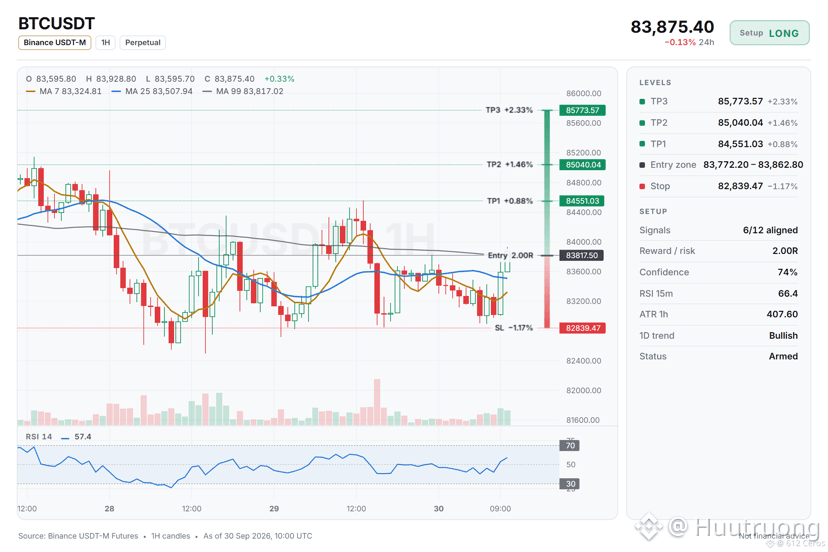
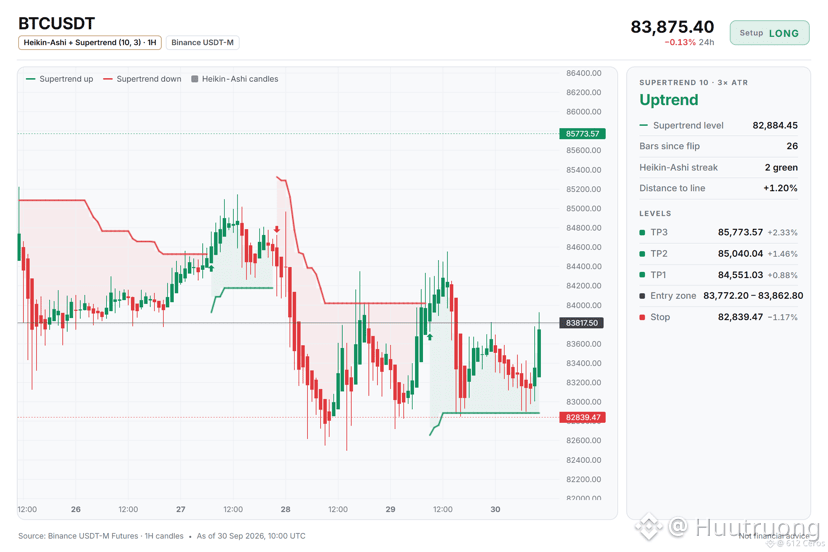
🟢 LONG $BTC /USDT: price prediction will INCREASE
Bias: LONG · Strong · 6/12 signals in agreement, 1 counter, 5 hesitant
📍 Entry: 83772.20 – 83862.80 · limit order within the range, don’t chase
🎯 TP1: 84551.03 (+0.9%) · close about half, then move SL to the entry price
🎯 TP2: 85040.04 (+1.5%) · close most of the remaining position
🎯 TP3: 85773.57 (+2.3%) · final target
🛑 SL: 82839.47 (-1.2%) · close the entire position; never move the SL farther
⚖️ Profit/Risk ratio: 0.75R / 1.25R / 2R at TP1 / TP2 / TP3
TP1 alone returns less than the stop’s cost, so the stop is moved to entry afterward.
⏳ Timing: the 15m timeframe momentum is aligned. Ignore the setup if TP1 prints before your order gets filled.
BTC is running an uptrend chain across 3 timeframes
Why LONG? Technical conclusion: STRONG LONG, 6/12 signals aligned, 1 counter, 5 hesitant.
Supporting factors (6):
• Daily trend: price > EMA50 > EMA200, bullish stack → overall trend is up
• 4h trend: price > EMA50 > EMA200, bullish stack → swing trend is rising
• 1h trend: price > EMA50 > EMA200, bullish stack → short-term trend is up
What to watch:
• Extreme RSI within the range: RSI z-score +2.55 within a range, “fade-the-high” risk → range top; sellers often start to intervene
Daily, 4h, and 1h trends all lean bullish with price above EMA50 and EMA200, and the 1h trend shows buyers controlling with ADX 24.1 and DI+ 32.1 vs DI− 17.2.
Your decision:
Where would you place your SL below the entry low at 83772.20?
The chart has all the levels 👇
{spot}(BTCUSDT)
🟢 LONG $BTC /USDT: price prediction will INCREASE
Bias: LONG · Strong · 6/12 signals in agreement, 1 counter, 5 hesitant
📍 Entry: 83772.20 – 83862.80 · limit order within the range, don’t chase
🎯 TP1: 84551.03 (+0.9%) · close about half, then move SL to the entry price
🎯 TP2: 85040.04 (+1.5%) · close most of the remaining position
🎯 TP3: 85773.57 (+2.3%) · final target
🛑 SL: 82839.47 (-1.2%) · close the entire position; never move the SL farther
⚖️ Profit/Risk ratio: 0.75R / 1.25R / 2R at TP1 / TP2 / TP3
TP1 alone returns less than the stop’s cost, so the stop is moved to entry afterward.
⏳ Timing: the 15m timeframe momentum is aligned. Ignore the setup if TP1 prints before your order gets filled.
BTC is running an uptrend chain across 3 timeframes
Why LONG? Technical conclusion: STRONG LONG, 6/12 signals aligned, 1 counter, 5 hesitant.
Supporting factors (6):
• Daily trend: price > EMA50 > EMA200, bullish stack → overall trend is up
• 4h trend: price > EMA50 > EMA200, bullish stack → swing trend is rising
• 1h trend: price > EMA50 > EMA200, bullish stack → short-term trend is up
What to watch:
• Extreme RSI within the range: RSI z-score +2.55 within a range, “fade-the-high” risk → range top; sellers often start to intervene
Daily, 4h, and 1h trends all lean bullish with price above EMA50 and EMA200, and the 1h trend shows buyers controlling with ADX 24.1 and DI+ 32.1 vs DI− 17.2.
Your decision:
Where would you place your SL below the entry low at 83772.20?
The chart has all the levels 👇
Bias: LONG · Strong · 6/12 signals in agreement, 1 counter, 5 hesitant
📍 Entry: 83772.20 – 83862.80 · limit order within the range, don’t chase
🎯 TP1: 84551.03 (+0.9%) · close about half, then move SL to the entry price
🎯 TP2: 85040.04 (+1.5%) · close most of the remaining position
🎯 TP3: 85773.57 (+2.3%) · final target
🛑 SL: 82839.47 (-1.2%) · close the entire position; never move the SL farther
⚖️ Profit/Risk ratio: 0.75R / 1.25R / 2R at TP1 / TP2 / TP3
TP1 alone returns less than the stop’s cost, so the stop is moved to entry afterward.
⏳ Timing: the 15m timeframe momentum is aligned. Ignore the setup if TP1 prints before your order gets filled.
BTC is running an uptrend chain across 3 timeframes
Why LONG? Technical conclusion: STRONG LONG, 6/12 signals aligned, 1 counter, 5 hesitant.
Supporting factors (6):
• Daily trend: price > EMA50 > EMA200, bullish stack → overall trend is up
• 4h trend: price > EMA50 > EMA200, bullish stack → swing trend is rising
• 1h trend: price > EMA50 > EMA200, bullish stack → short-term trend is up
What to watch:
• Extreme RSI within the range: RSI z-score +2.55 within a range, “fade-the-high” risk → range top; sellers often start to intervene
Daily, 4h, and 1h trends all lean bullish with price above EMA50 and EMA200, and the 1h trend shows buyers controlling with ADX 24.1 and DI+ 32.1 vs DI− 17.2.
Your decision:
Where would you place your SL below the entry low at 83772.20?
The chart has all the levels 👇
19
·
--
Bearish
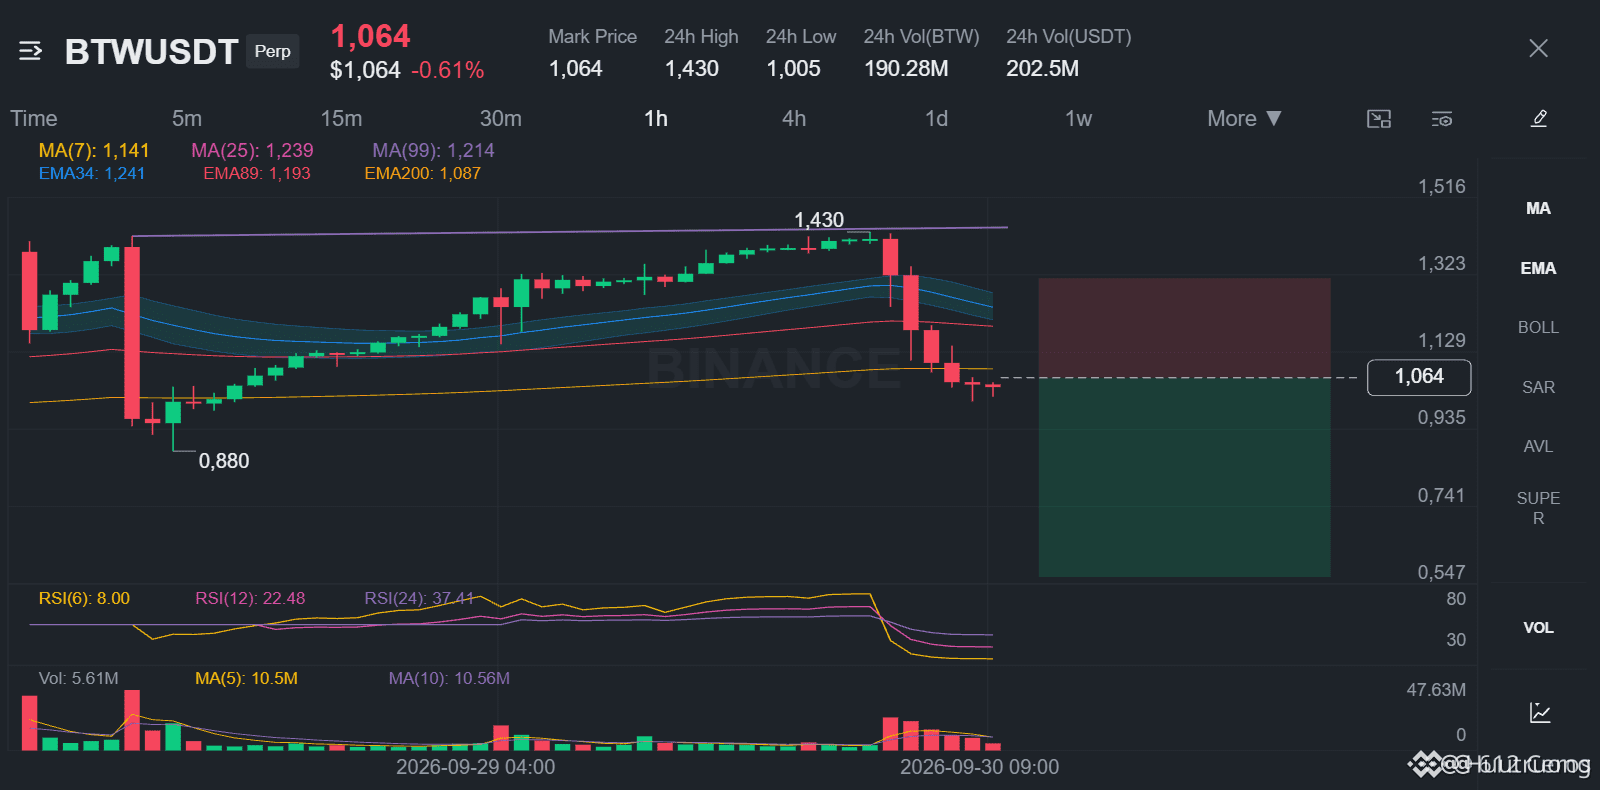
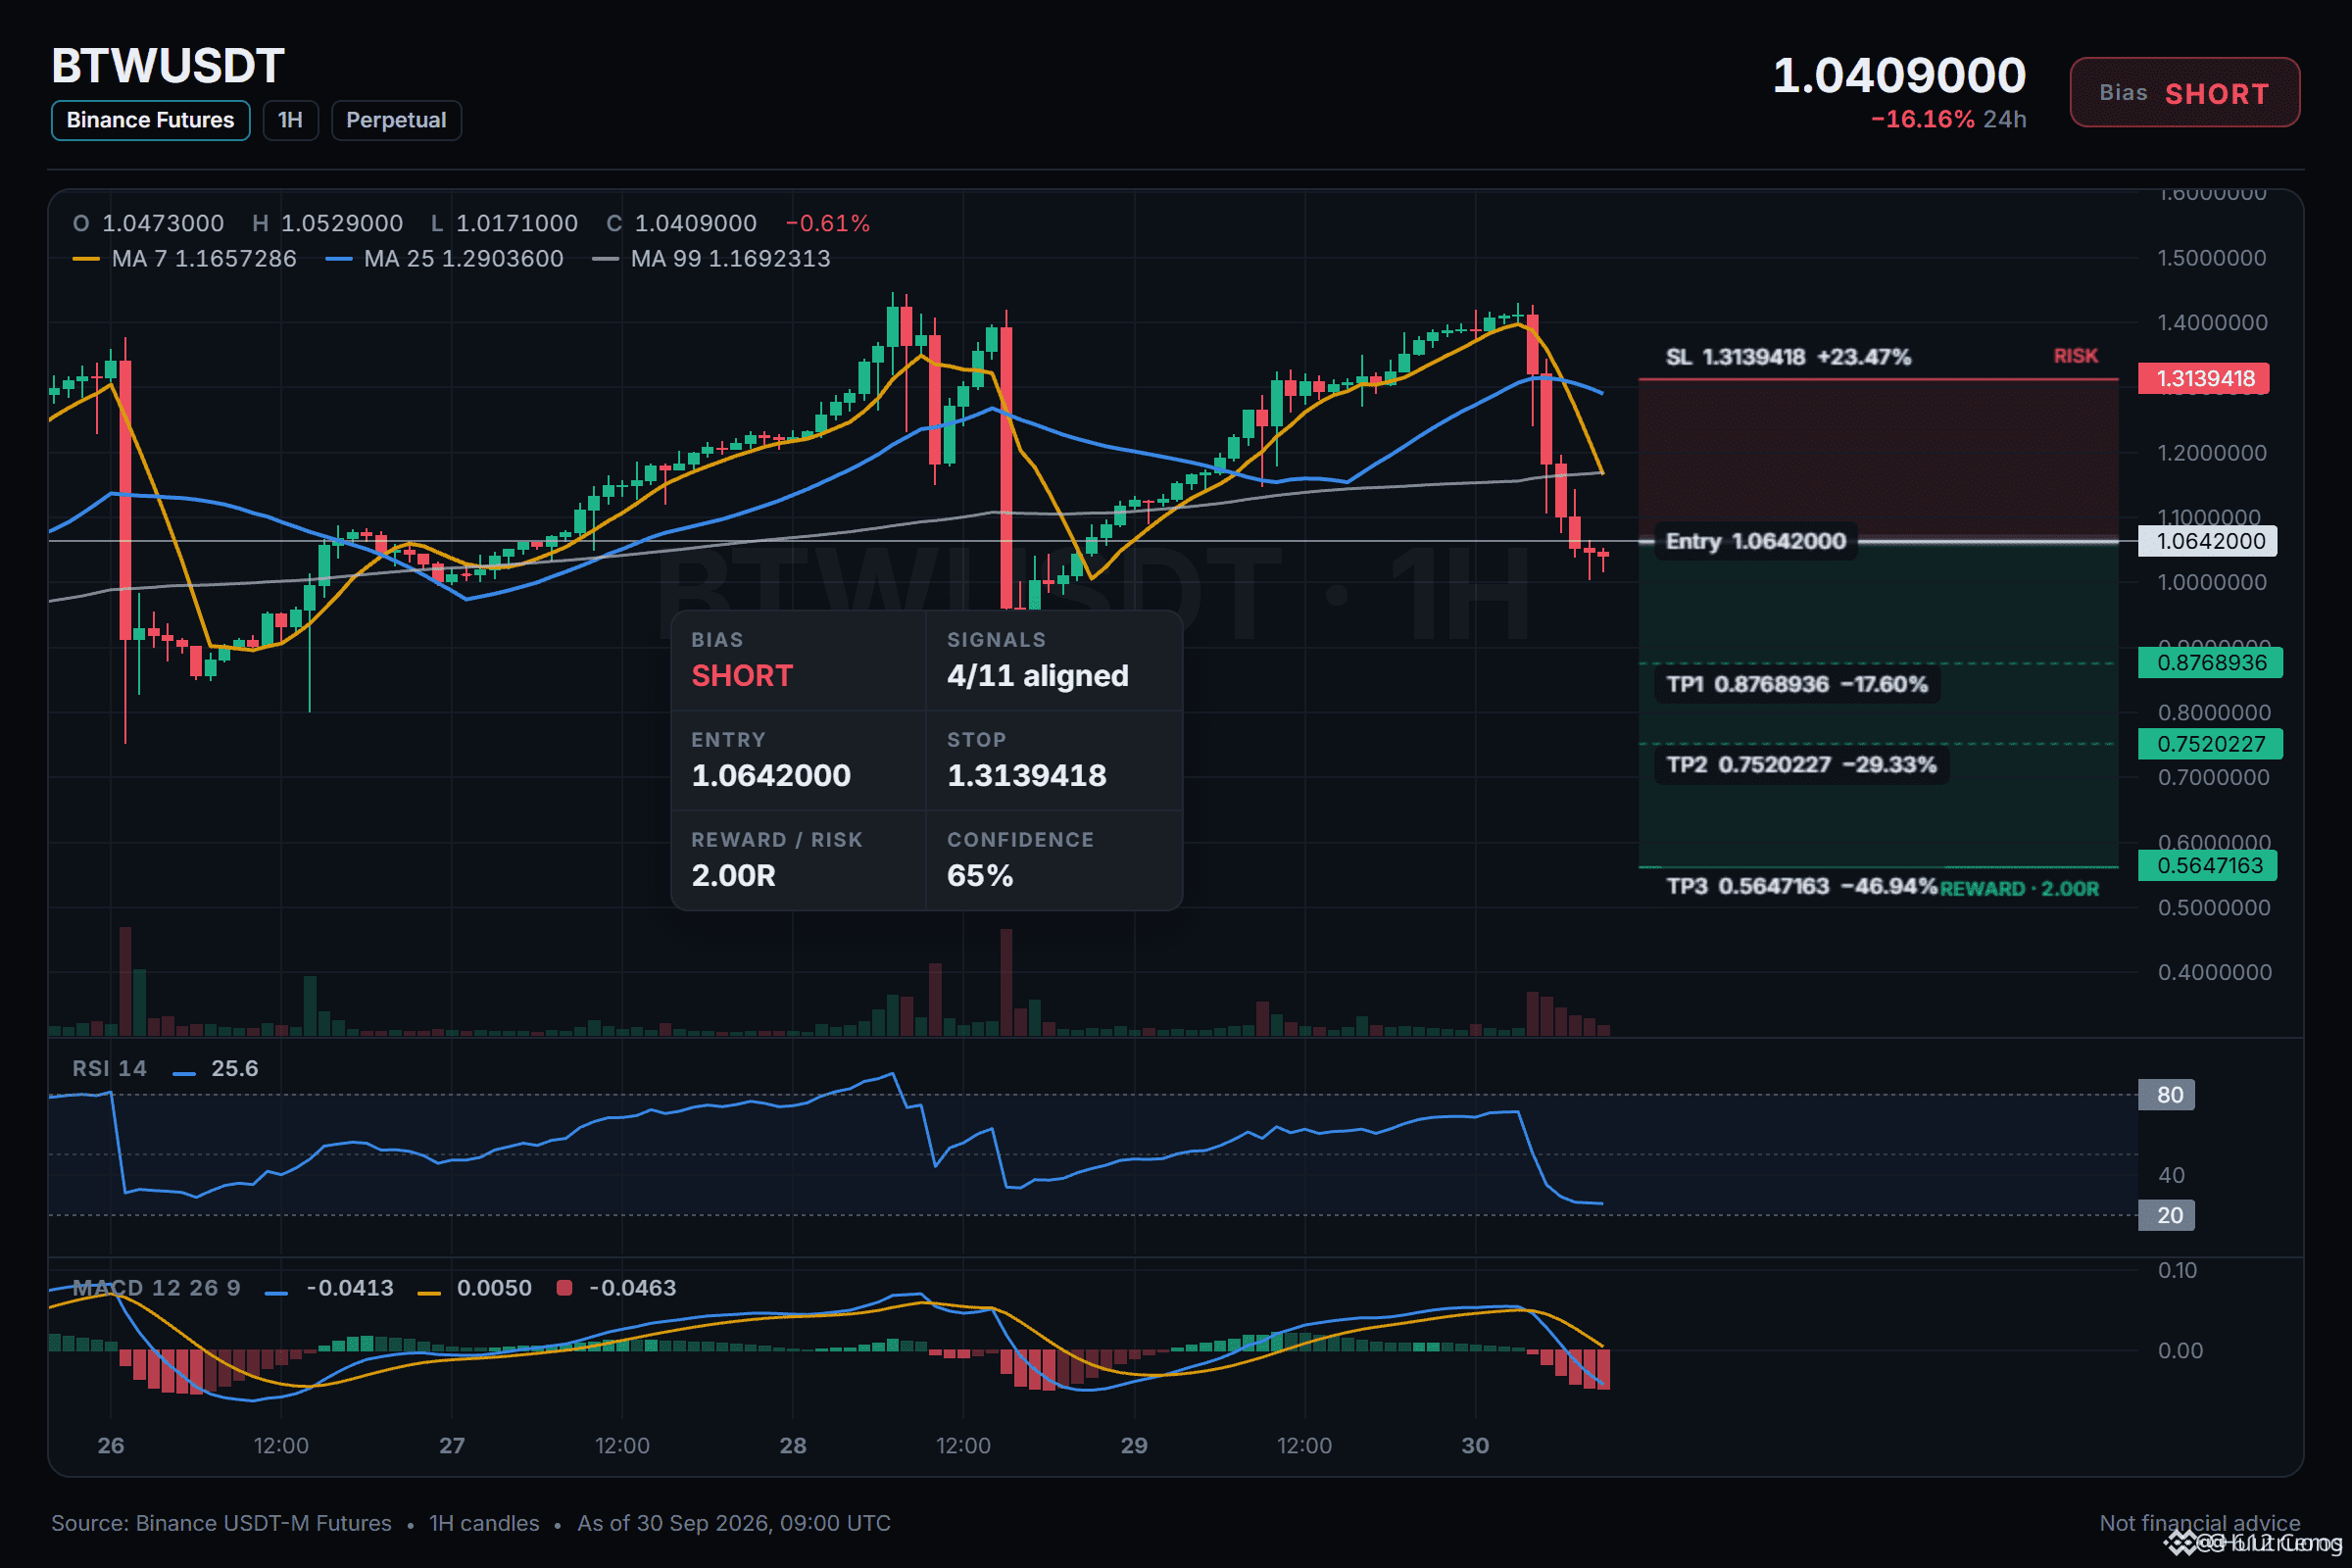
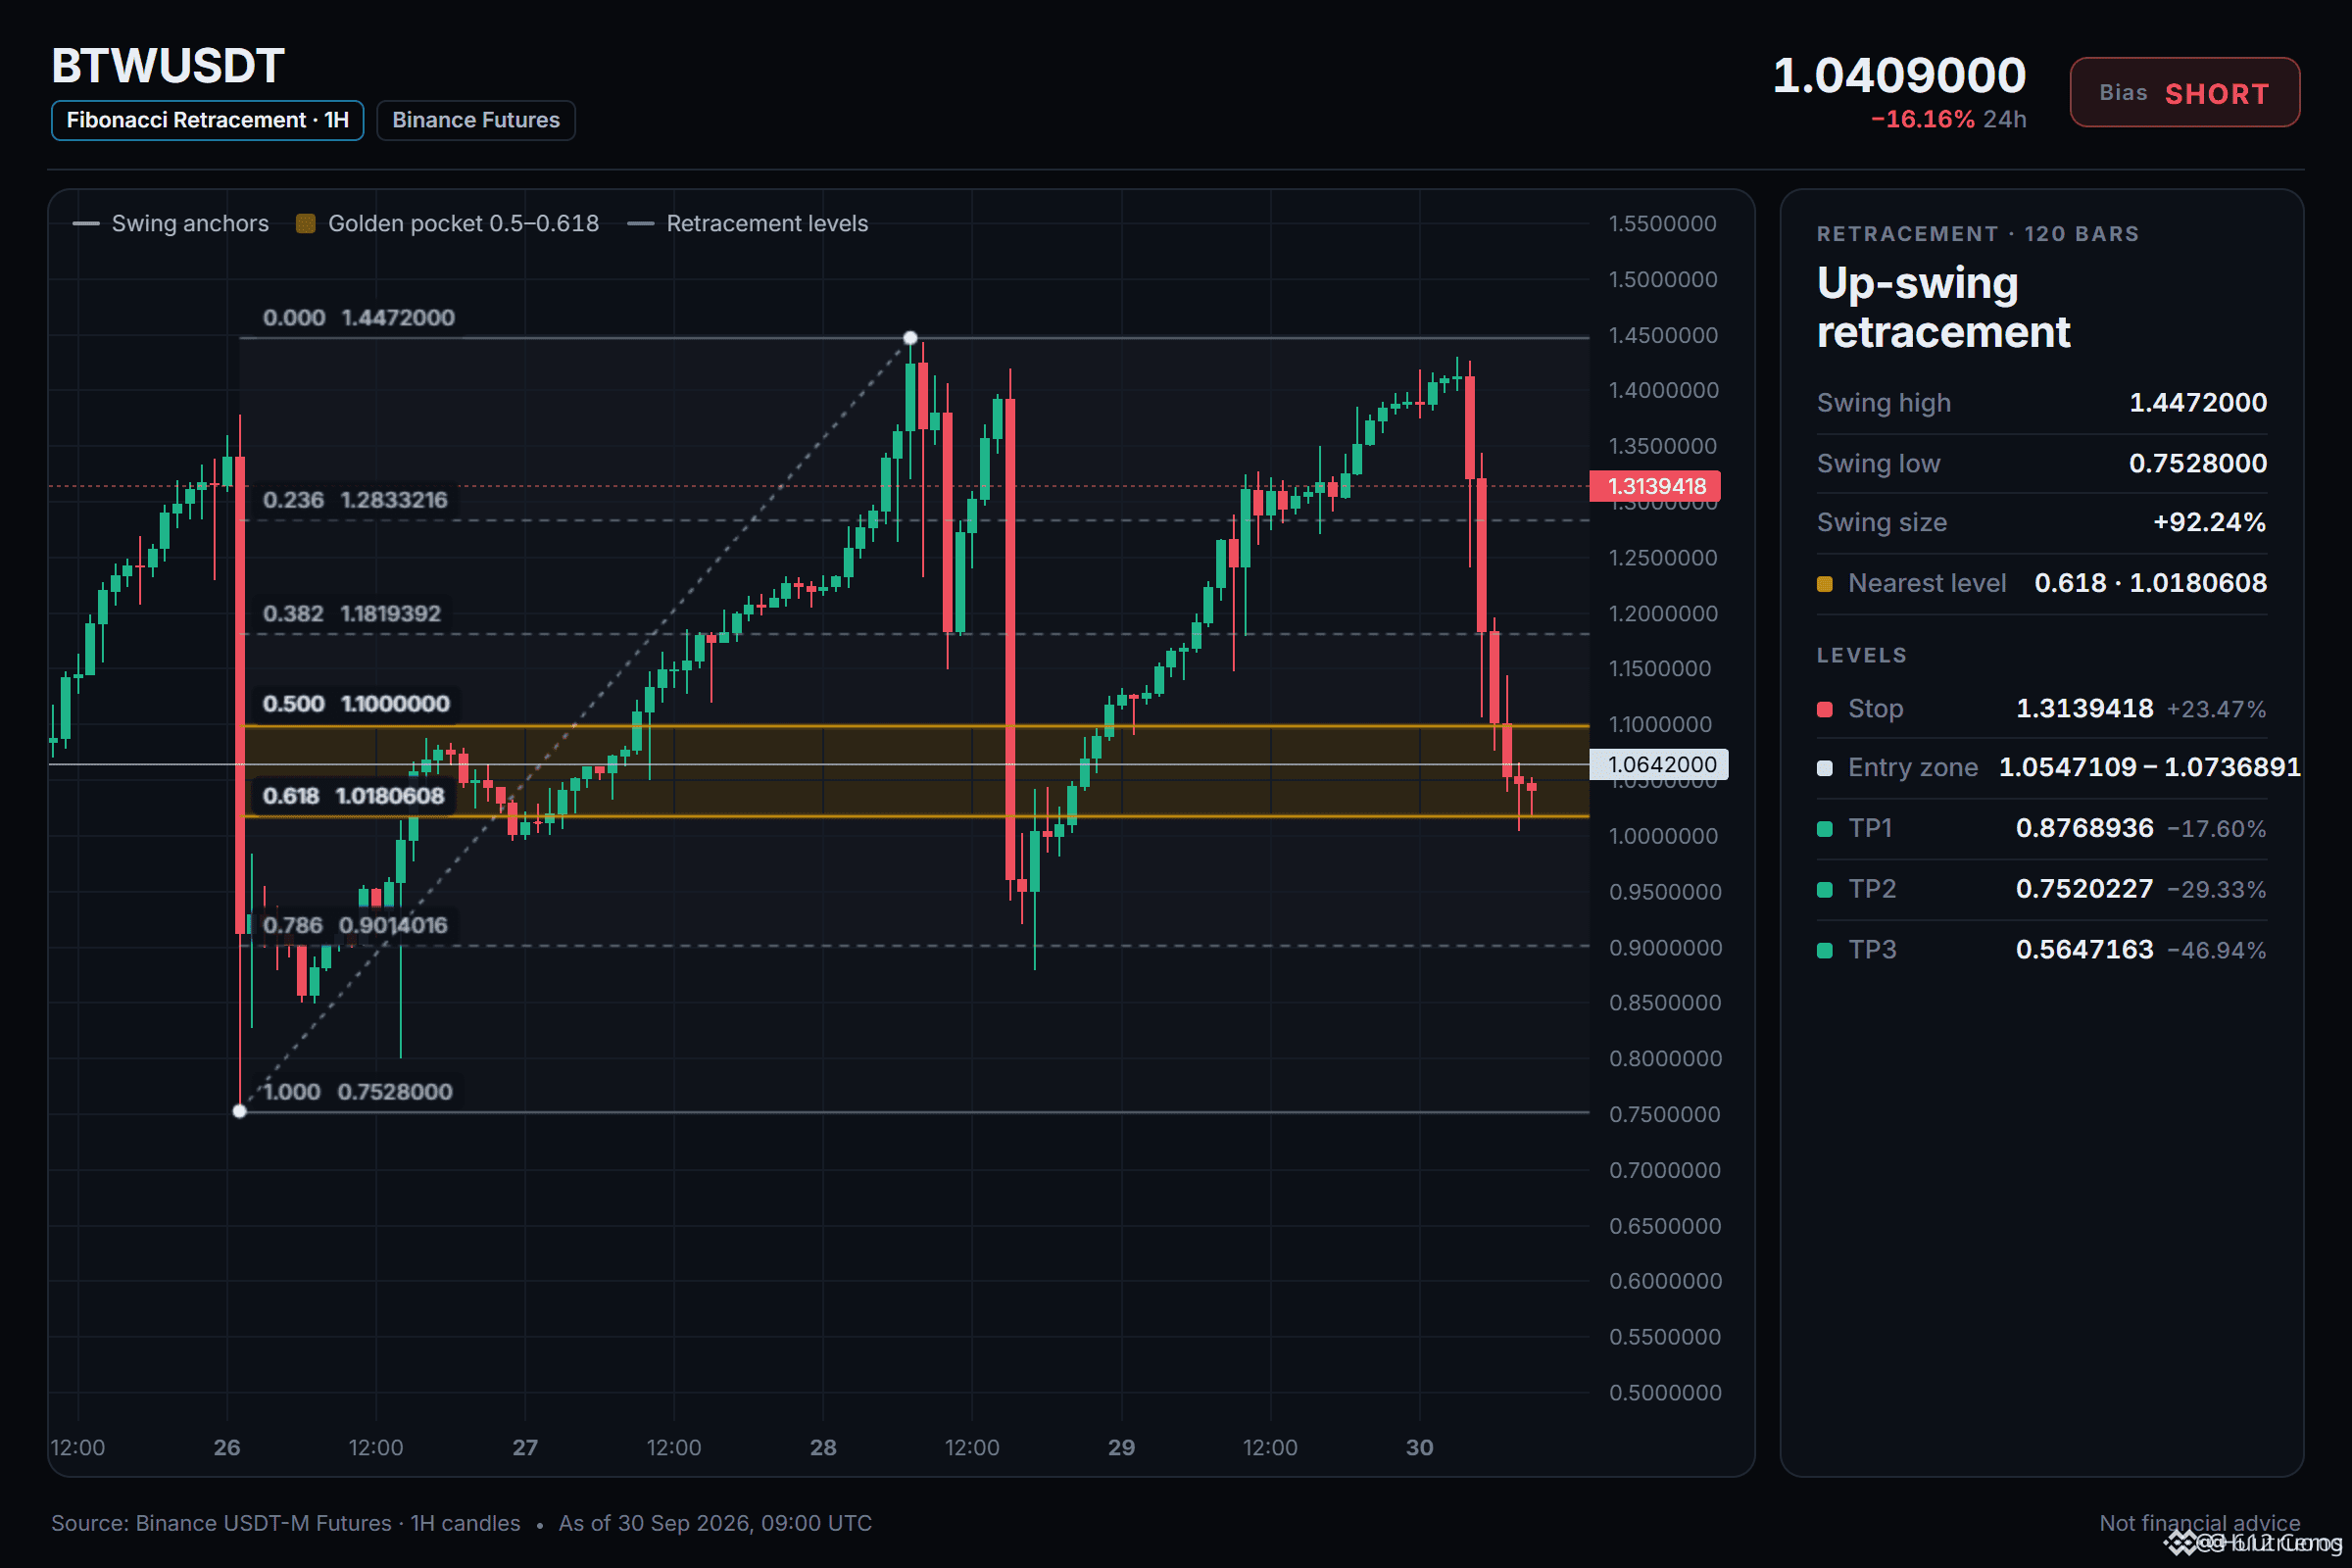
By the way: the seller has the advantage even though the market is swinging within an uncomfortable range.
🔴 SHORT $BTW /USDT: expecting the price to GO DOWN
Bias: SHORT · Leaning · 4/11 signals in agreement, 0 against, 7 undecided
📍 Entry: 1.0547109 – 1.0736891 · place limit orders in the zone, don’t chase
🎯 TP1: 0.8768936 (-17.6%) · take about half profit, then move SL to the exact entry
🎯 TP2: 0.7520227 (-29.3%) · take most of the remaining position
🎯 TP3: 0.5647163 (-46.9%) · final target
🛑 SL: 1.3139418 (+23.5%) · close the entire position; don’t move the SL any further
⚖️ Reward vs risk: 0.75R / 1.25R / 2R at TP1 / TP2 / TP3
TP1 alone pays less than the stop cost, so the stop is moved to entry afterward.
⏳ Timing: the 15m momentum is in agreement. Skip if TP1 triggers before you can get filled.
⚠️ Only Leaning: 7/11 signals are still undecided. Keep position size light.
Why SHORT?
Technical conclusion: LEANING SHORT, 4/11 signals in agreement, 0 against, 7 undecided.
✅ Trend strength (ADX/DI, 15m): ADX 46.0 with sellers controlling (DI+ 18.2 vs DI− 29.0) → sellers are leading the momentum
✅ RSI 4h: 44.7, downward momentum (below 45) → sellers have momentum
✅ RSI 1h: 25.6, downward momentum (below 45) → sellers have momentum
Why right now?
BTW it’s currently within a daily range, but the 1h trend (mode: trend, ADX 46.0, DI+ 18.2 vs DI− 29.0) shows sellers are leading. RSI 1h at 25.6 and RSI 4h at 44.7 confirm the bearish momentum. Relative strength vs BTC is -16.40%, weaker than BTC. The entry zone 1.0547109–1.0736891 is for this SHORT setup; TP1 0.8768936, TP2 0.7520227. Confidence leans toward medium; invalidation at 1.3139418.
By the way: the seller has the advantage even though the market is swinging within an uncomfortable range.
🔴 SHORT $BTW /USDT: expecting the price to GO DOWN
Bias: SHORT · Leaning · 4/11 signals in agreement, 0 against, 7 undecided
📍 Entry: 1.0547109 – 1.0736891 · place limit orders in the zone, don’t chase
🎯 TP1: 0.8768936 (-17.6%) · take about half profit, then move SL to the exact entry
🎯 TP2: 0.7520227 (-29.3%) · take most of the remaining position
🎯 TP3: 0.5647163 (-46.9%) · final target
🛑 SL: 1.3139418 (+23.5%) · close the entire position; don’t move the SL any further
⚖️ Reward vs risk: 0.75R / 1.25R / 2R at TP1 / TP2 / TP3
TP1 alone pays less than the stop cost, so the stop is moved to entry afterward.
⏳ Timing: the 15m momentum is in agreement. Skip if TP1 triggers before you can get filled.
⚠️ Only Leaning: 7/11 signals are still undecided. Keep position size light.
Why SHORT?
Technical conclusion: LEANING SHORT, 4/11 signals in agreement, 0 against, 7 undecided.
✅ Trend strength (ADX/DI, 15m): ADX 46.0 with sellers controlling (DI+ 18.2 vs DI− 29.0) → sellers are leading the momentum
✅ RSI 4h: 44.7, downward momentum (below 45) → sellers have momentum
✅ RSI 1h: 25.6, downward momentum (below 45) → sellers have momentum
Why right now?
BTW it’s currently within a daily range, but the 1h trend (mode: trend, ADX 46.0, DI+ 18.2 vs DI− 29.0) shows sellers are leading. RSI 1h at 25.6 and RSI 4h at 44.7 confirm the bearish momentum. Relative strength vs BTC is -16.40%, weaker than BTC. The entry zone 1.0547109–1.0736891 is for this SHORT setup; TP1 0.8768936, TP2 0.7520227. Confidence leans toward medium; invalidation at 1.3139418.
🔴 SHORT $BTW /USDT: expecting the price to GO DOWN
Bias: SHORT · Leaning · 4/11 signals in agreement, 0 against, 7 undecided
📍 Entry: 1.0547109 – 1.0736891 · place limit orders in the zone, don’t chase
🎯 TP1: 0.8768936 (-17.6%) · take about half profit, then move SL to the exact entry
🎯 TP2: 0.7520227 (-29.3%) · take most of the remaining position
🎯 TP3: 0.5647163 (-46.9%) · final target
🛑 SL: 1.3139418 (+23.5%) · close the entire position; don’t move the SL any further
⚖️ Reward vs risk: 0.75R / 1.25R / 2R at TP1 / TP2 / TP3
TP1 alone pays less than the stop cost, so the stop is moved to entry afterward.
⏳ Timing: the 15m momentum is in agreement. Skip if TP1 triggers before you can get filled.
⚠️ Only Leaning: 7/11 signals are still undecided. Keep position size light.
Why SHORT?
Technical conclusion: LEANING SHORT, 4/11 signals in agreement, 0 against, 7 undecided.
✅ Trend strength (ADX/DI, 15m): ADX 46.0 with sellers controlling (DI+ 18.2 vs DI− 29.0) → sellers are leading the momentum
✅ RSI 4h: 44.7, downward momentum (below 45) → sellers have momentum
✅ RSI 1h: 25.6, downward momentum (below 45) → sellers have momentum
Why right now?
BTW it’s currently within a daily range, but the 1h trend (mode: trend, ADX 46.0, DI+ 18.2 vs DI− 29.0) shows sellers are leading. RSI 1h at 25.6 and RSI 4h at 44.7 confirm the bearish momentum. Relative strength vs BTC is -16.40%, weaker than BTC. The entry zone 1.0547109–1.0736891 is for this SHORT setup; TP1 0.8768936, TP2 0.7520227. Confidence leans toward medium; invalidation at 1.3139418.
35
·
--
Bullish
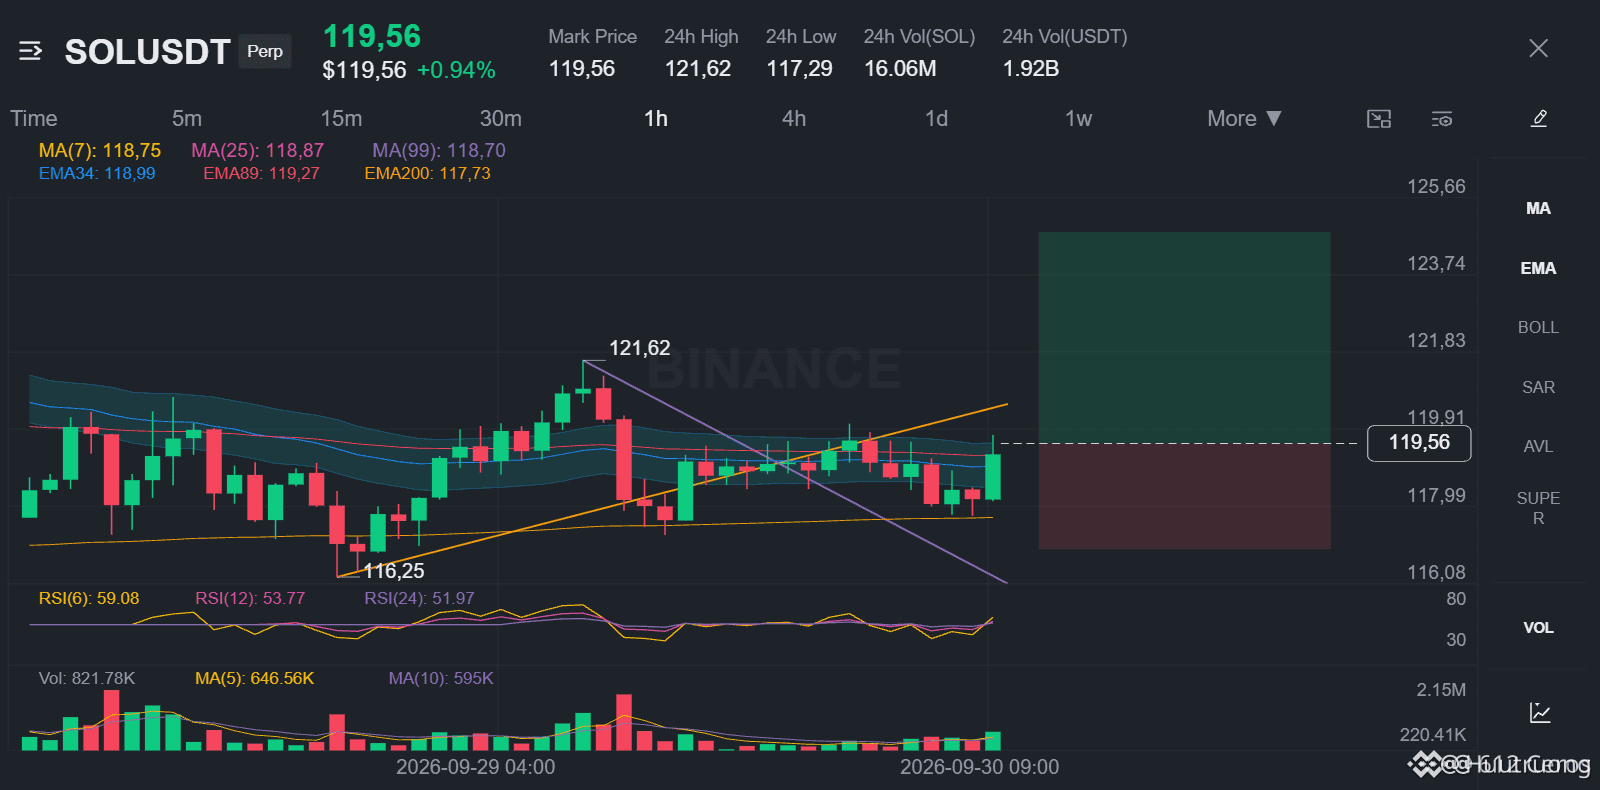
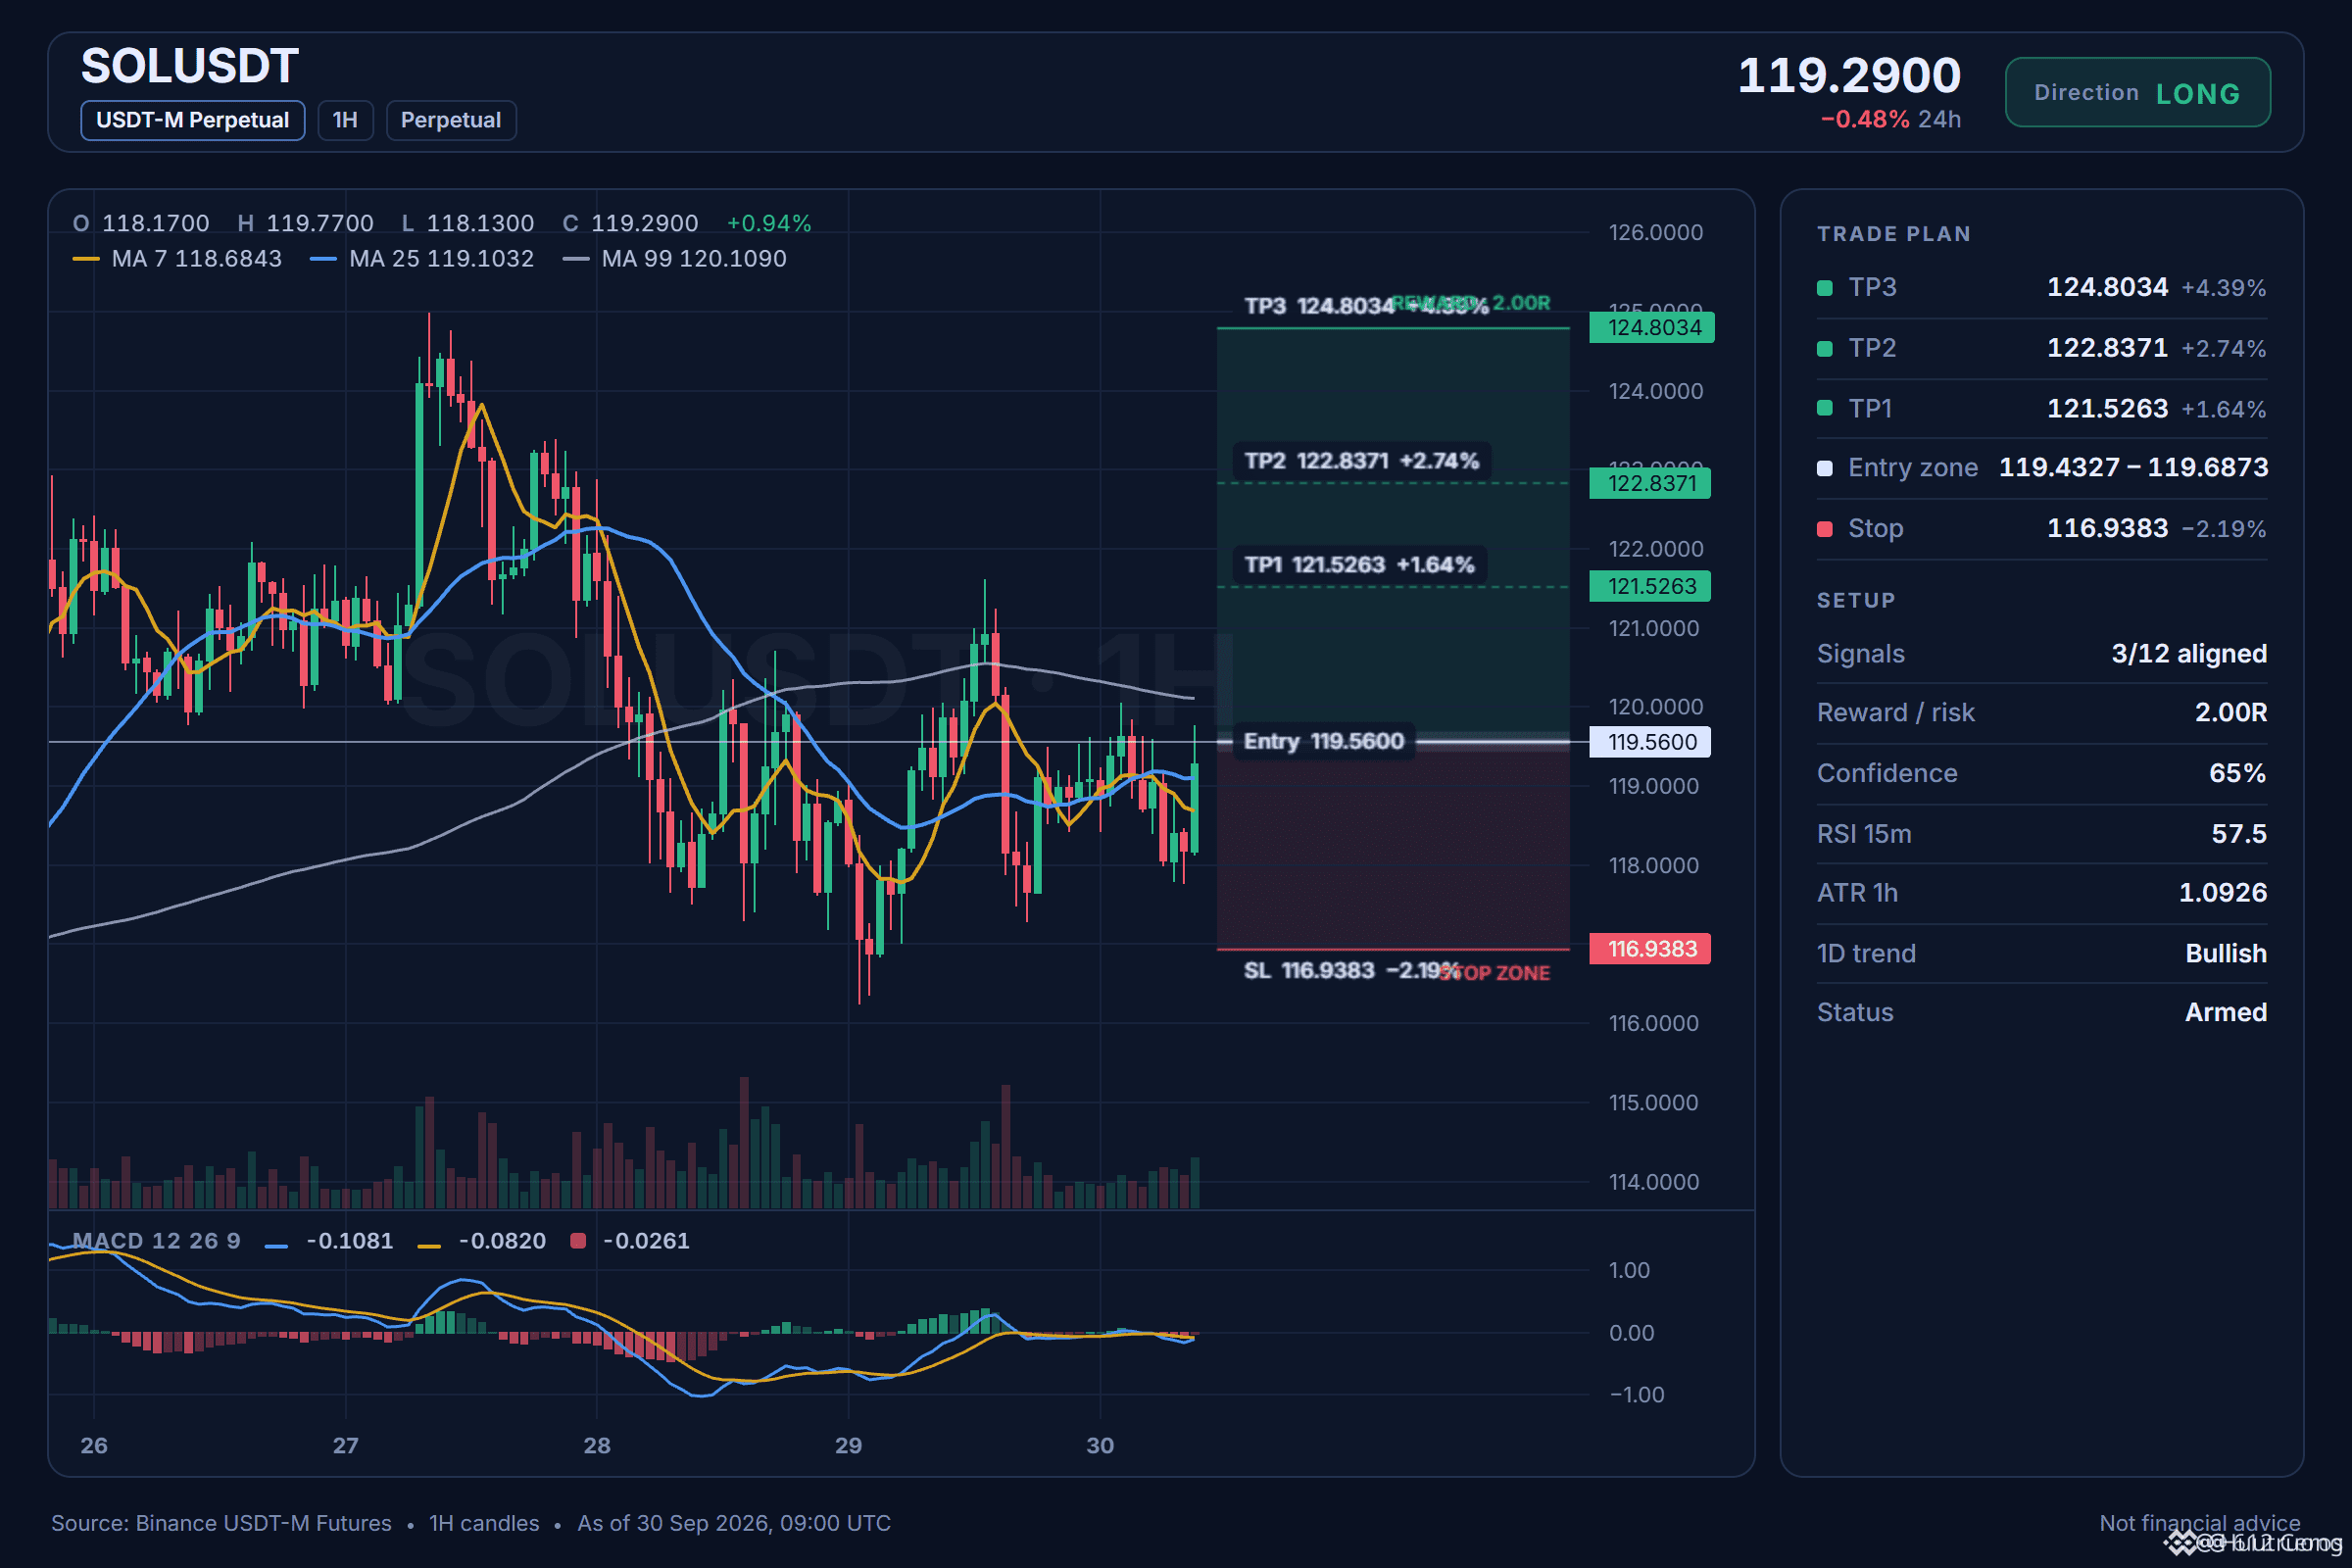
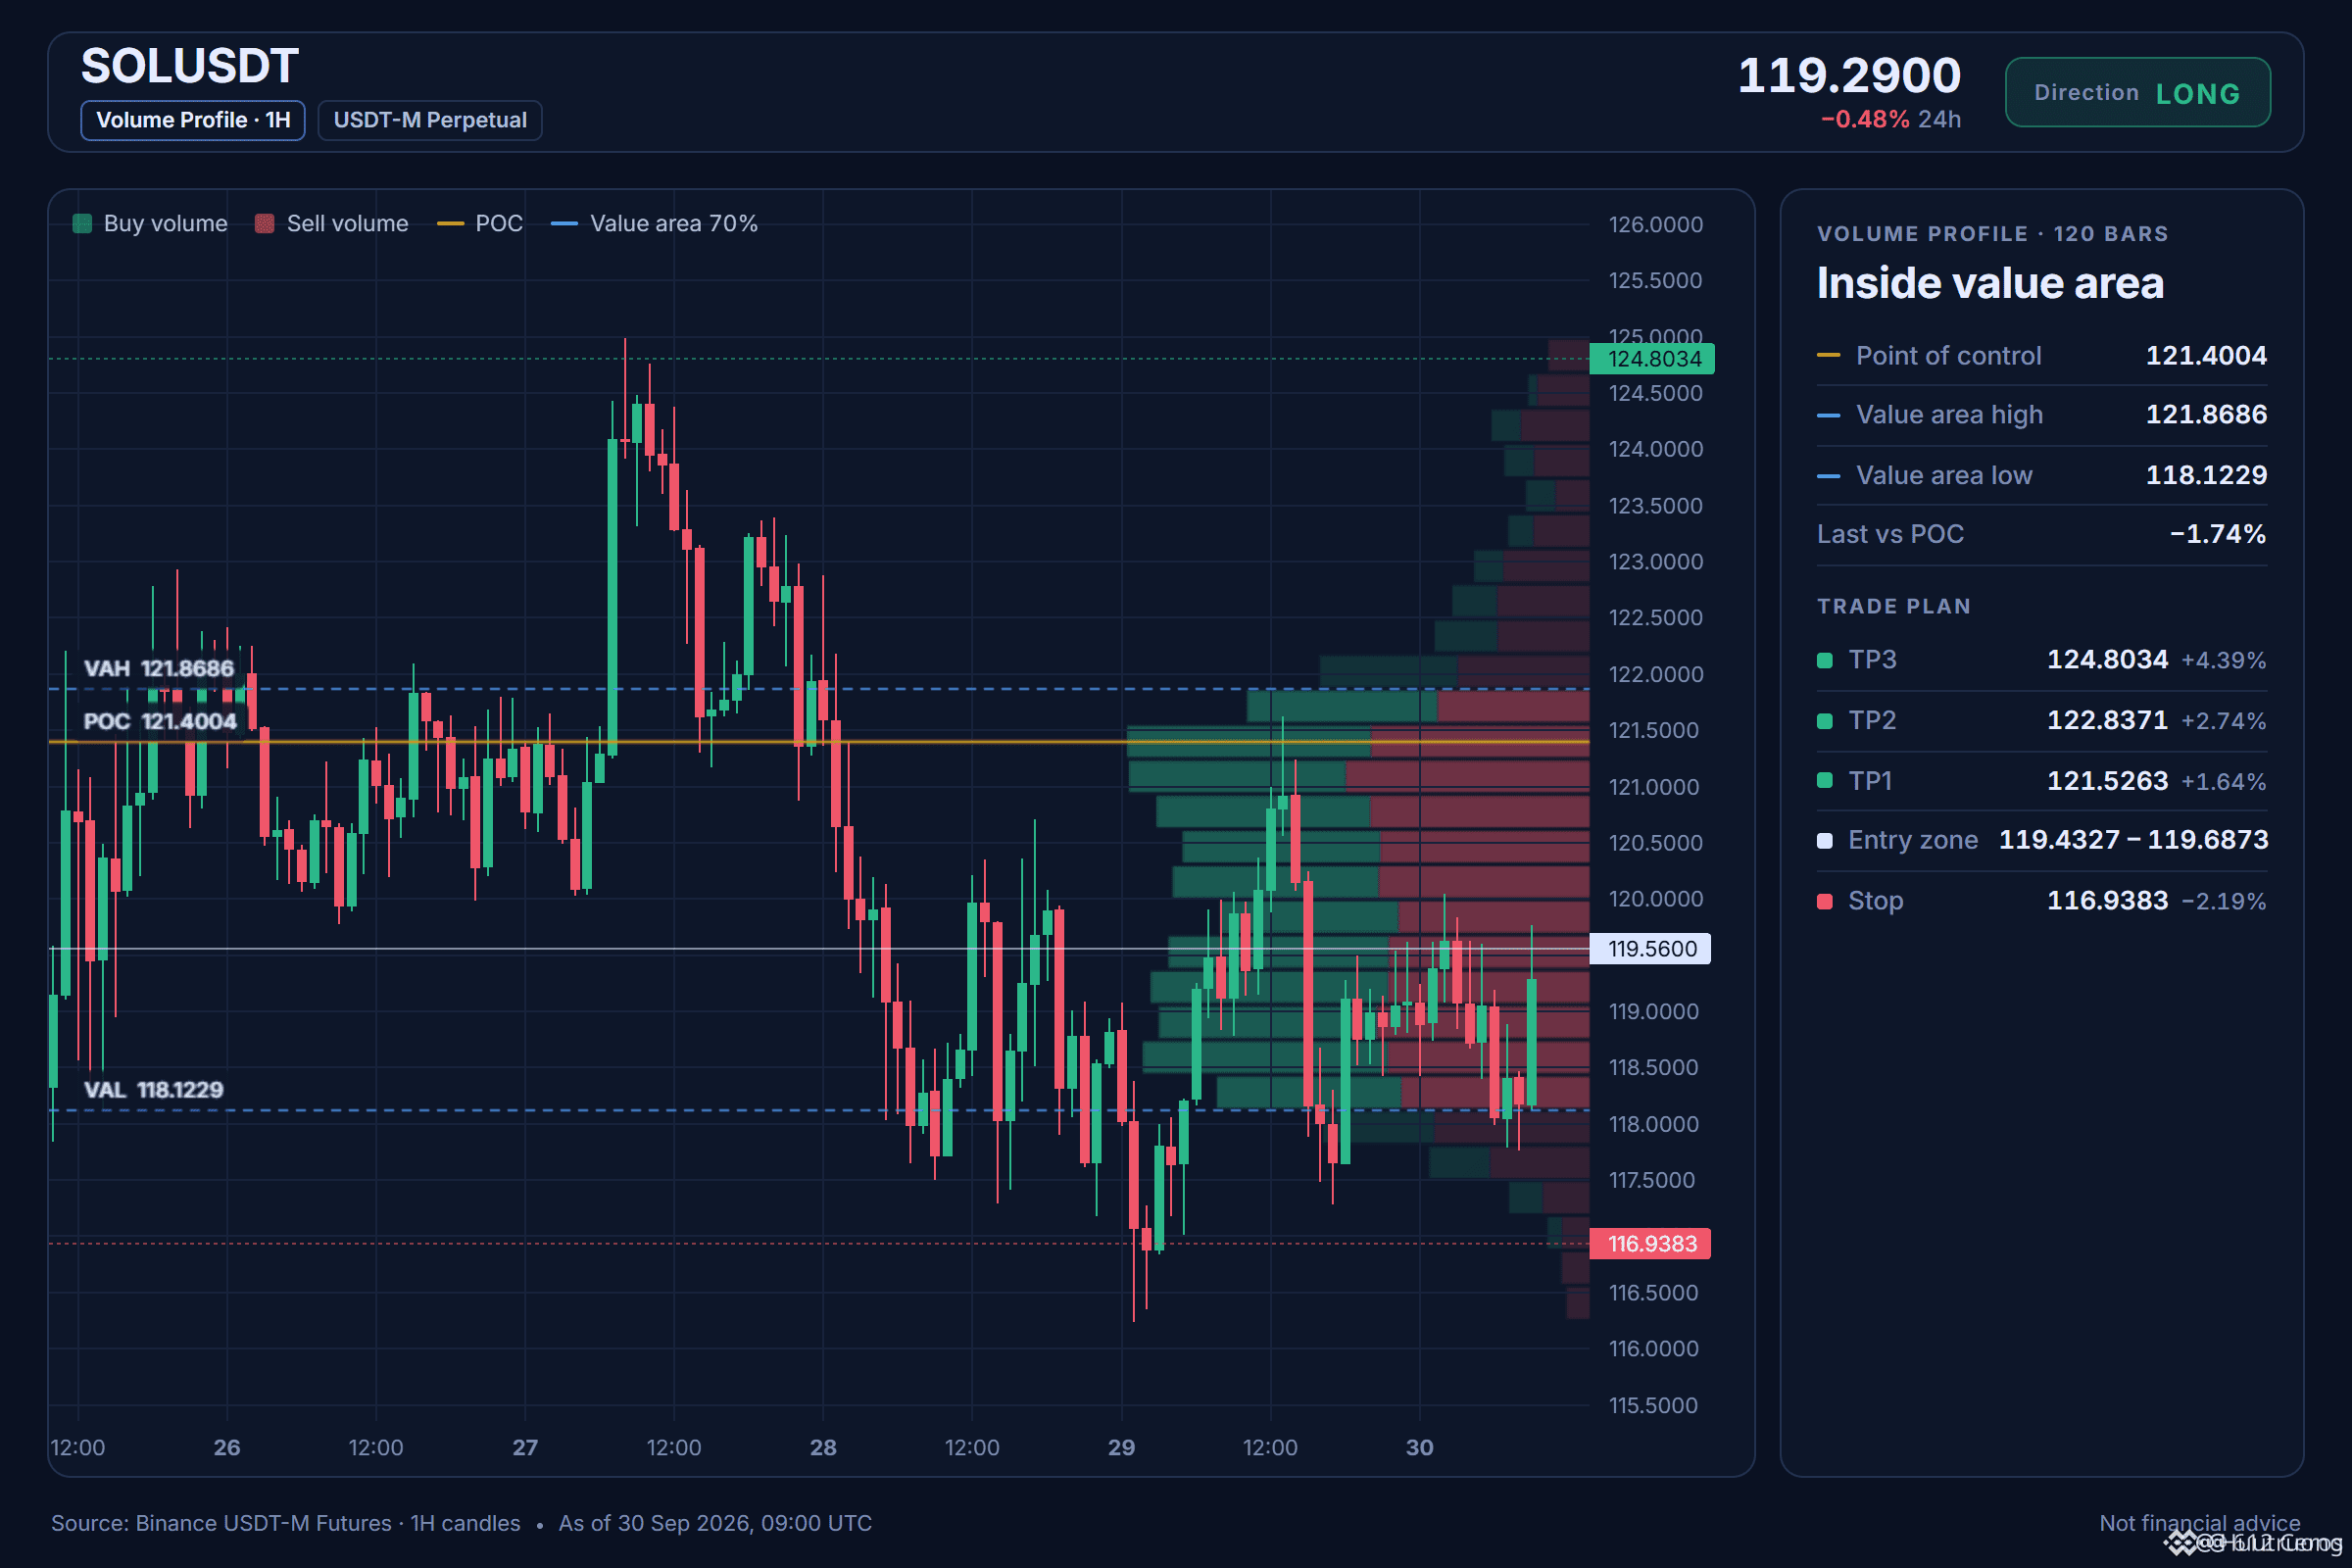
SOL rises across all timeframes with average reliability
🟢 LONG $SOL /USDT: expect the price to INCREASE
Bias: LONG · Leaning · 3/12 signals in agreement, 0 against, 9 undecided
📍 Entry: 119.4327 – 119.6873 · limit order within the range, don’t chase the price
🎯 TP1: 121.5263 (+1.6%) · take about half off, then move SL to the entry level
🎯 TP2: 122.8371 (+2.7%) · take most of the remaining position off
🎯 TP3: 124.8034 (+4.4%) · final target
🛑 SL: 116.9383 (-2.2%) · close everything—never move it further away
⚖️ Profit vs. risk: 0.75R / 1.25R / 2R at TP1 / TP2 / TP3
TP1 alone pays less than the cost of the stop order, so the SL will be moved to the entry point afterward.
⏳ Timing: 15m timeframe momentum has aligned. Skip the trade if TP1 prints before you get filled.
⚠️ Slightly tilted to LONG: 9/12 signals are still undecided. Keep position size small.
Why LONG? Technical conclusion: LEANING TOWARD LONG, 3/12 signals in agreement, 0 against, 9 undecided.
✅ Daily trend: price > EMA50 > EMA200, EMA stacking in an upward direction → the long-term trend is INCREASING
✅ 4h trend: price > EMA50 > EMA200, EMA stacking in an upward direction → the swing trend is INCREASING
✅ 1h trend: price > EMA50 > EMA200, EMA stacking in an upward direction → the short-term trend is INCREASING
My take on today
I’m monitoring it and want to see it hold steady in the trend-based support zone on the daily before I decide to enter. The 1h chart price is at 119.5600, the daily trend is up, and the 4h setup is also rising, so the probability slightly favors a long order. I’ll be wrong if the price breaks below 116.9383—this is my SL and invalidation level.
SOL rises across all timeframes with average reliability
🟢 LONG $SOL /USDT: expect the price to INCREASE
Bias: LONG · Leaning · 3/12 signals in agreement, 0 against, 9 undecided
📍 Entry: 119.4327 – 119.6873 · limit order within the range, don’t chase the price
🎯 TP1: 121.5263 (+1.6%) · take about half off, then move SL to the entry level
🎯 TP2: 122.8371 (+2.7%) · take most of the remaining position off
🎯 TP3: 124.8034 (+4.4%) · final target
🛑 SL: 116.9383 (-2.2%) · close everything—never move it further away
⚖️ Profit vs. risk: 0.75R / 1.25R / 2R at TP1 / TP2 / TP3
TP1 alone pays less than the cost of the stop order, so the SL will be moved to the entry point afterward.
⏳ Timing: 15m timeframe momentum has aligned. Skip the trade if TP1 prints before you get filled.
⚠️ Slightly tilted to LONG: 9/12 signals are still undecided. Keep position size small.
Why LONG? Technical conclusion: LEANING TOWARD LONG, 3/12 signals in agreement, 0 against, 9 undecided.
✅ Daily trend: price > EMA50 > EMA200, EMA stacking in an upward direction → the long-term trend is INCREASING
✅ 4h trend: price > EMA50 > EMA200, EMA stacking in an upward direction → the swing trend is INCREASING
✅ 1h trend: price > EMA50 > EMA200, EMA stacking in an upward direction → the short-term trend is INCREASING
My take on today
I’m monitoring it and want to see it hold steady in the trend-based support zone on the daily before I decide to enter. The 1h chart price is at 119.5600, the daily trend is up, and the 4h setup is also rising, so the probability slightly favors a long order. I’ll be wrong if the price breaks below 116.9383—this is my SL and invalidation level.
🟢 LONG $SOL /USDT: expect the price to INCREASE
Bias: LONG · Leaning · 3/12 signals in agreement, 0 against, 9 undecided
📍 Entry: 119.4327 – 119.6873 · limit order within the range, don’t chase the price
🎯 TP1: 121.5263 (+1.6%) · take about half off, then move SL to the entry level
🎯 TP2: 122.8371 (+2.7%) · take most of the remaining position off
🎯 TP3: 124.8034 (+4.4%) · final target
🛑 SL: 116.9383 (-2.2%) · close everything—never move it further away
⚖️ Profit vs. risk: 0.75R / 1.25R / 2R at TP1 / TP2 / TP3
TP1 alone pays less than the cost of the stop order, so the SL will be moved to the entry point afterward.
⏳ Timing: 15m timeframe momentum has aligned. Skip the trade if TP1 prints before you get filled.
⚠️ Slightly tilted to LONG: 9/12 signals are still undecided. Keep position size small.
Why LONG? Technical conclusion: LEANING TOWARD LONG, 3/12 signals in agreement, 0 against, 9 undecided.
✅ Daily trend: price > EMA50 > EMA200, EMA stacking in an upward direction → the long-term trend is INCREASING
✅ 4h trend: price > EMA50 > EMA200, EMA stacking in an upward direction → the swing trend is INCREASING
✅ 1h trend: price > EMA50 > EMA200, EMA stacking in an upward direction → the short-term trend is INCREASING
My take on today
I’m monitoring it and want to see it hold steady in the trend-based support zone on the daily before I decide to enter. The 1h chart price is at 119.5600, the daily trend is up, and the 4h setup is also rising, so the probability slightly favors a long order. I’ll be wrong if the price breaks below 116.9383—this is my SL and invalidation level.
27
·
--
Bullish
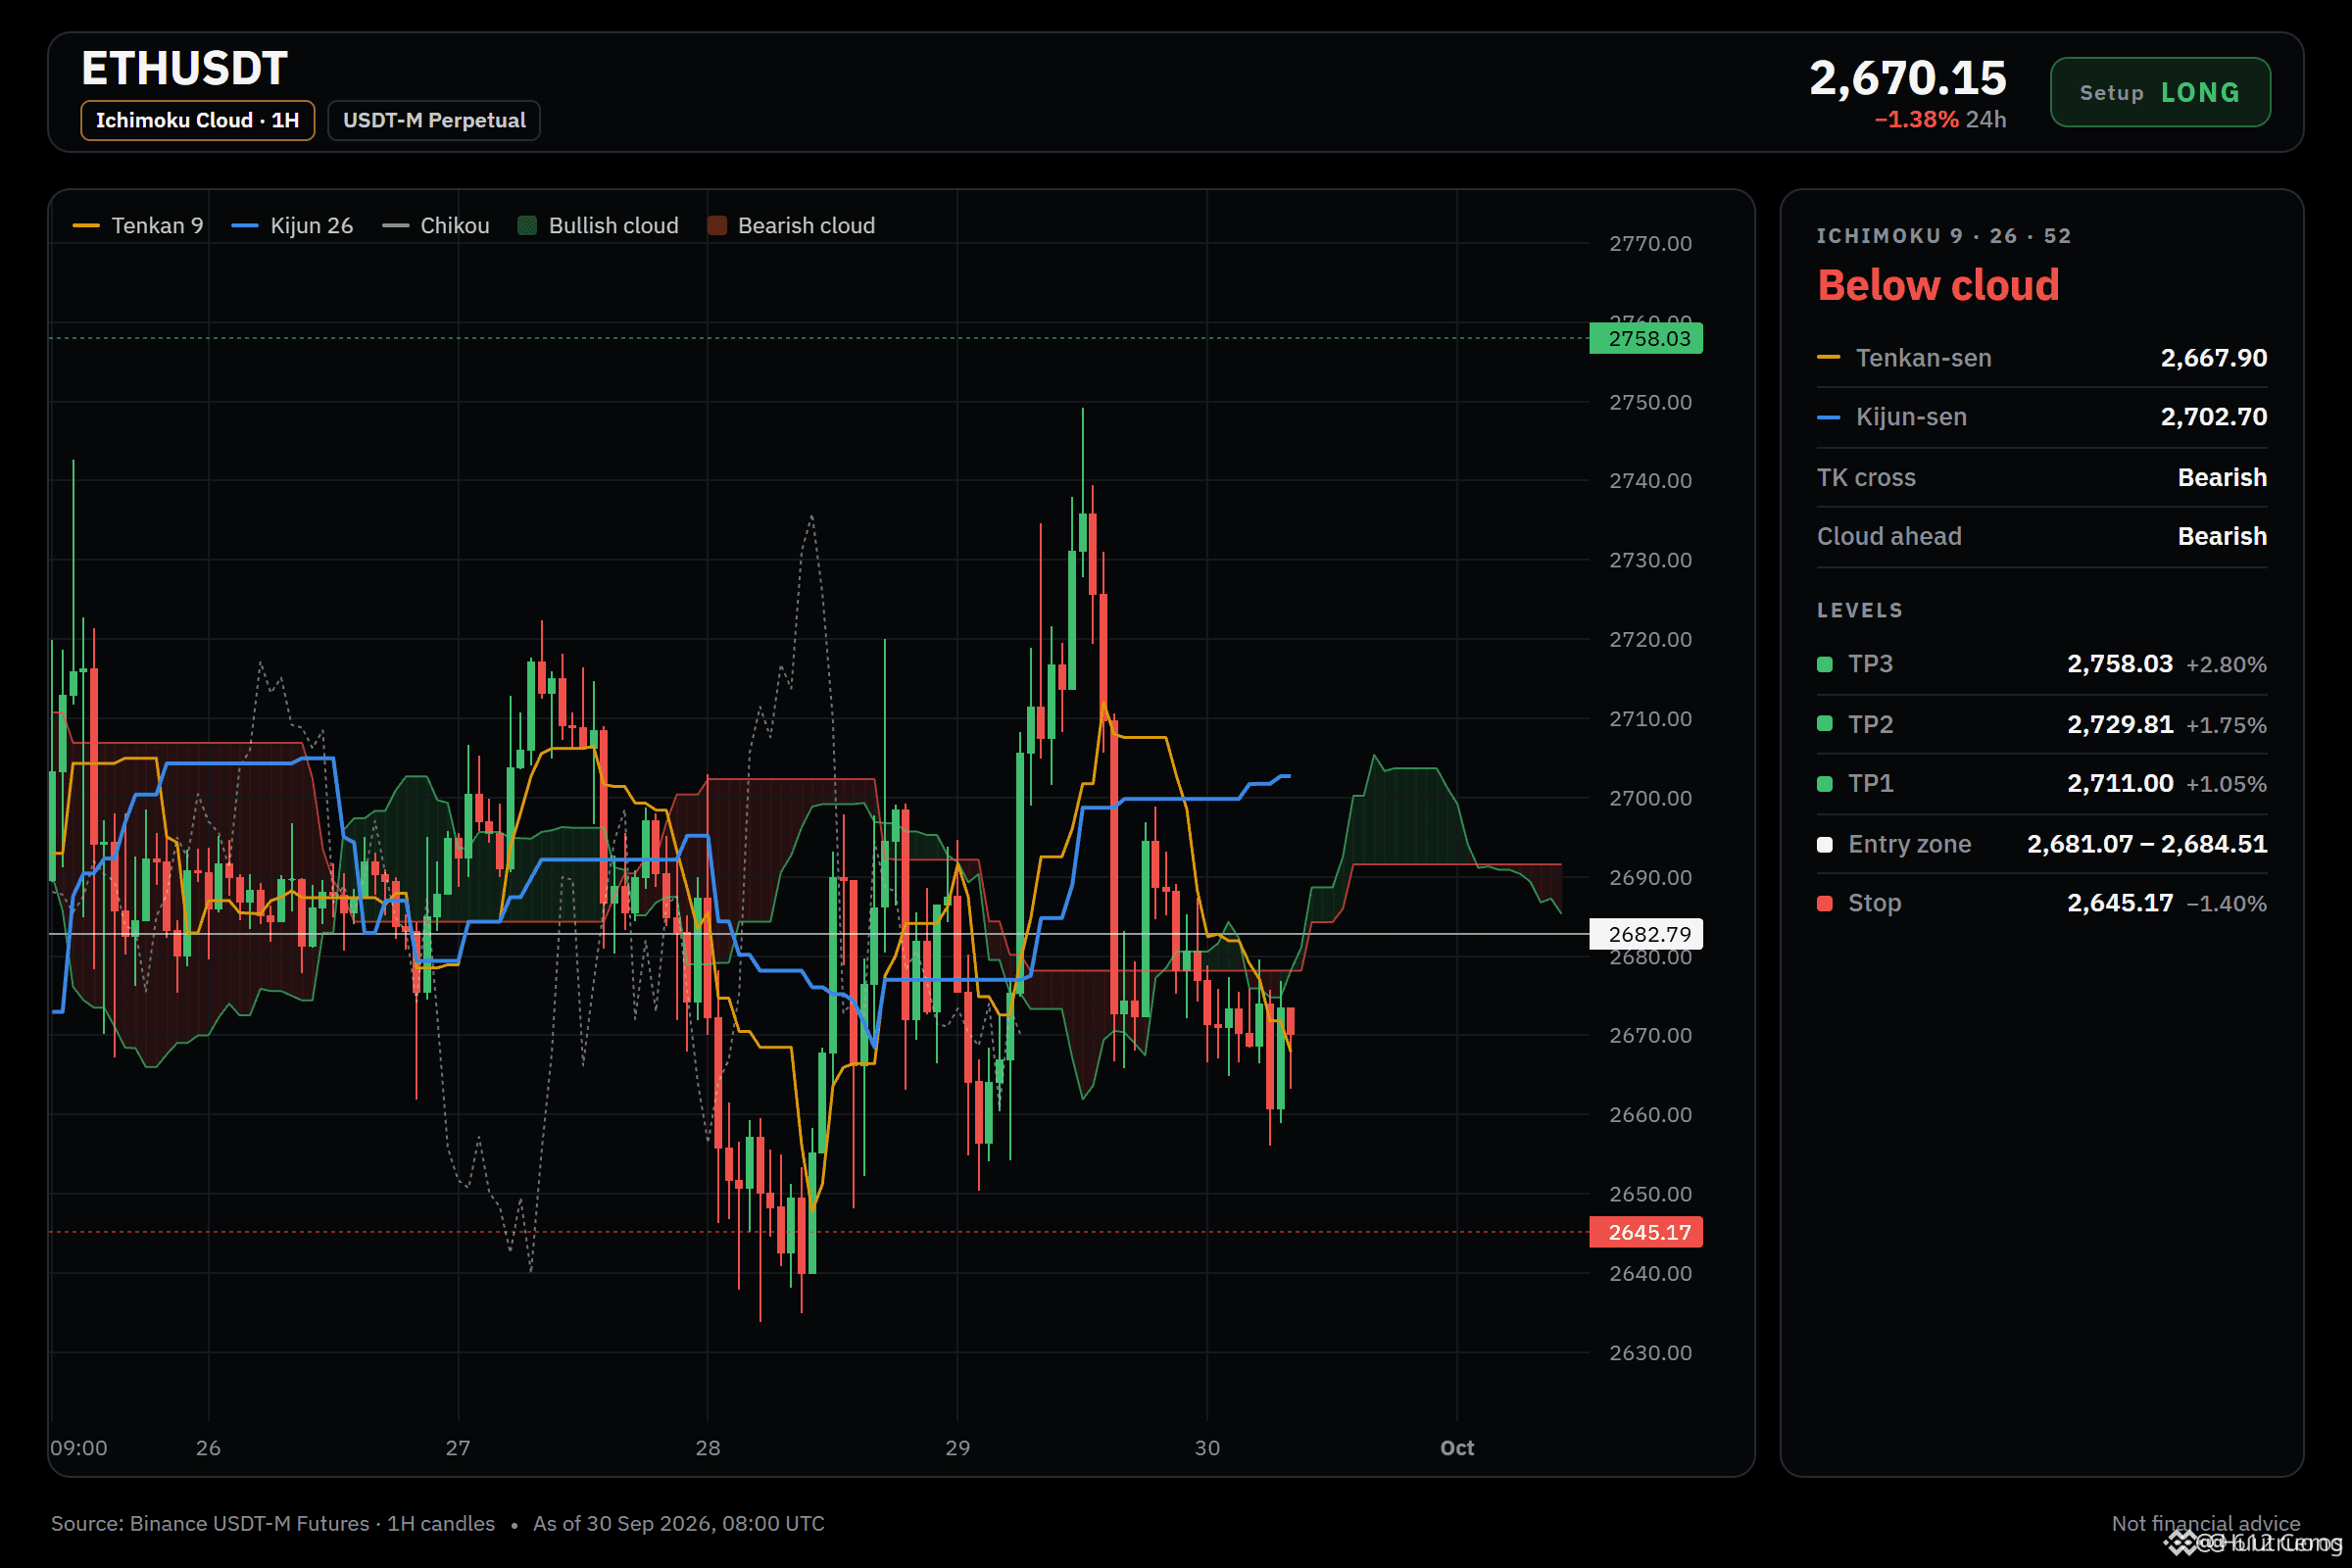
ETH is about to break through
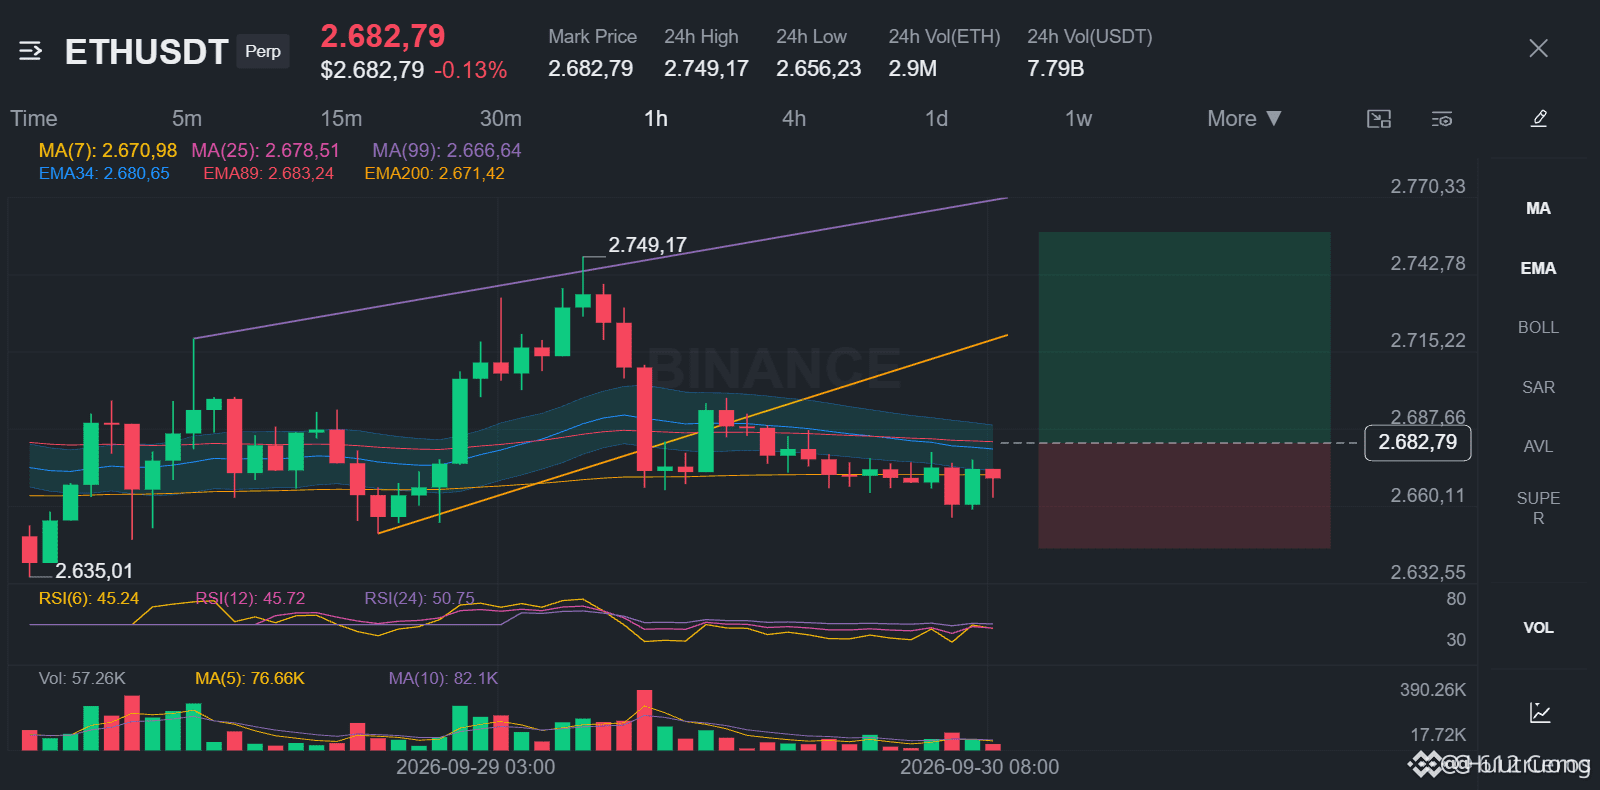
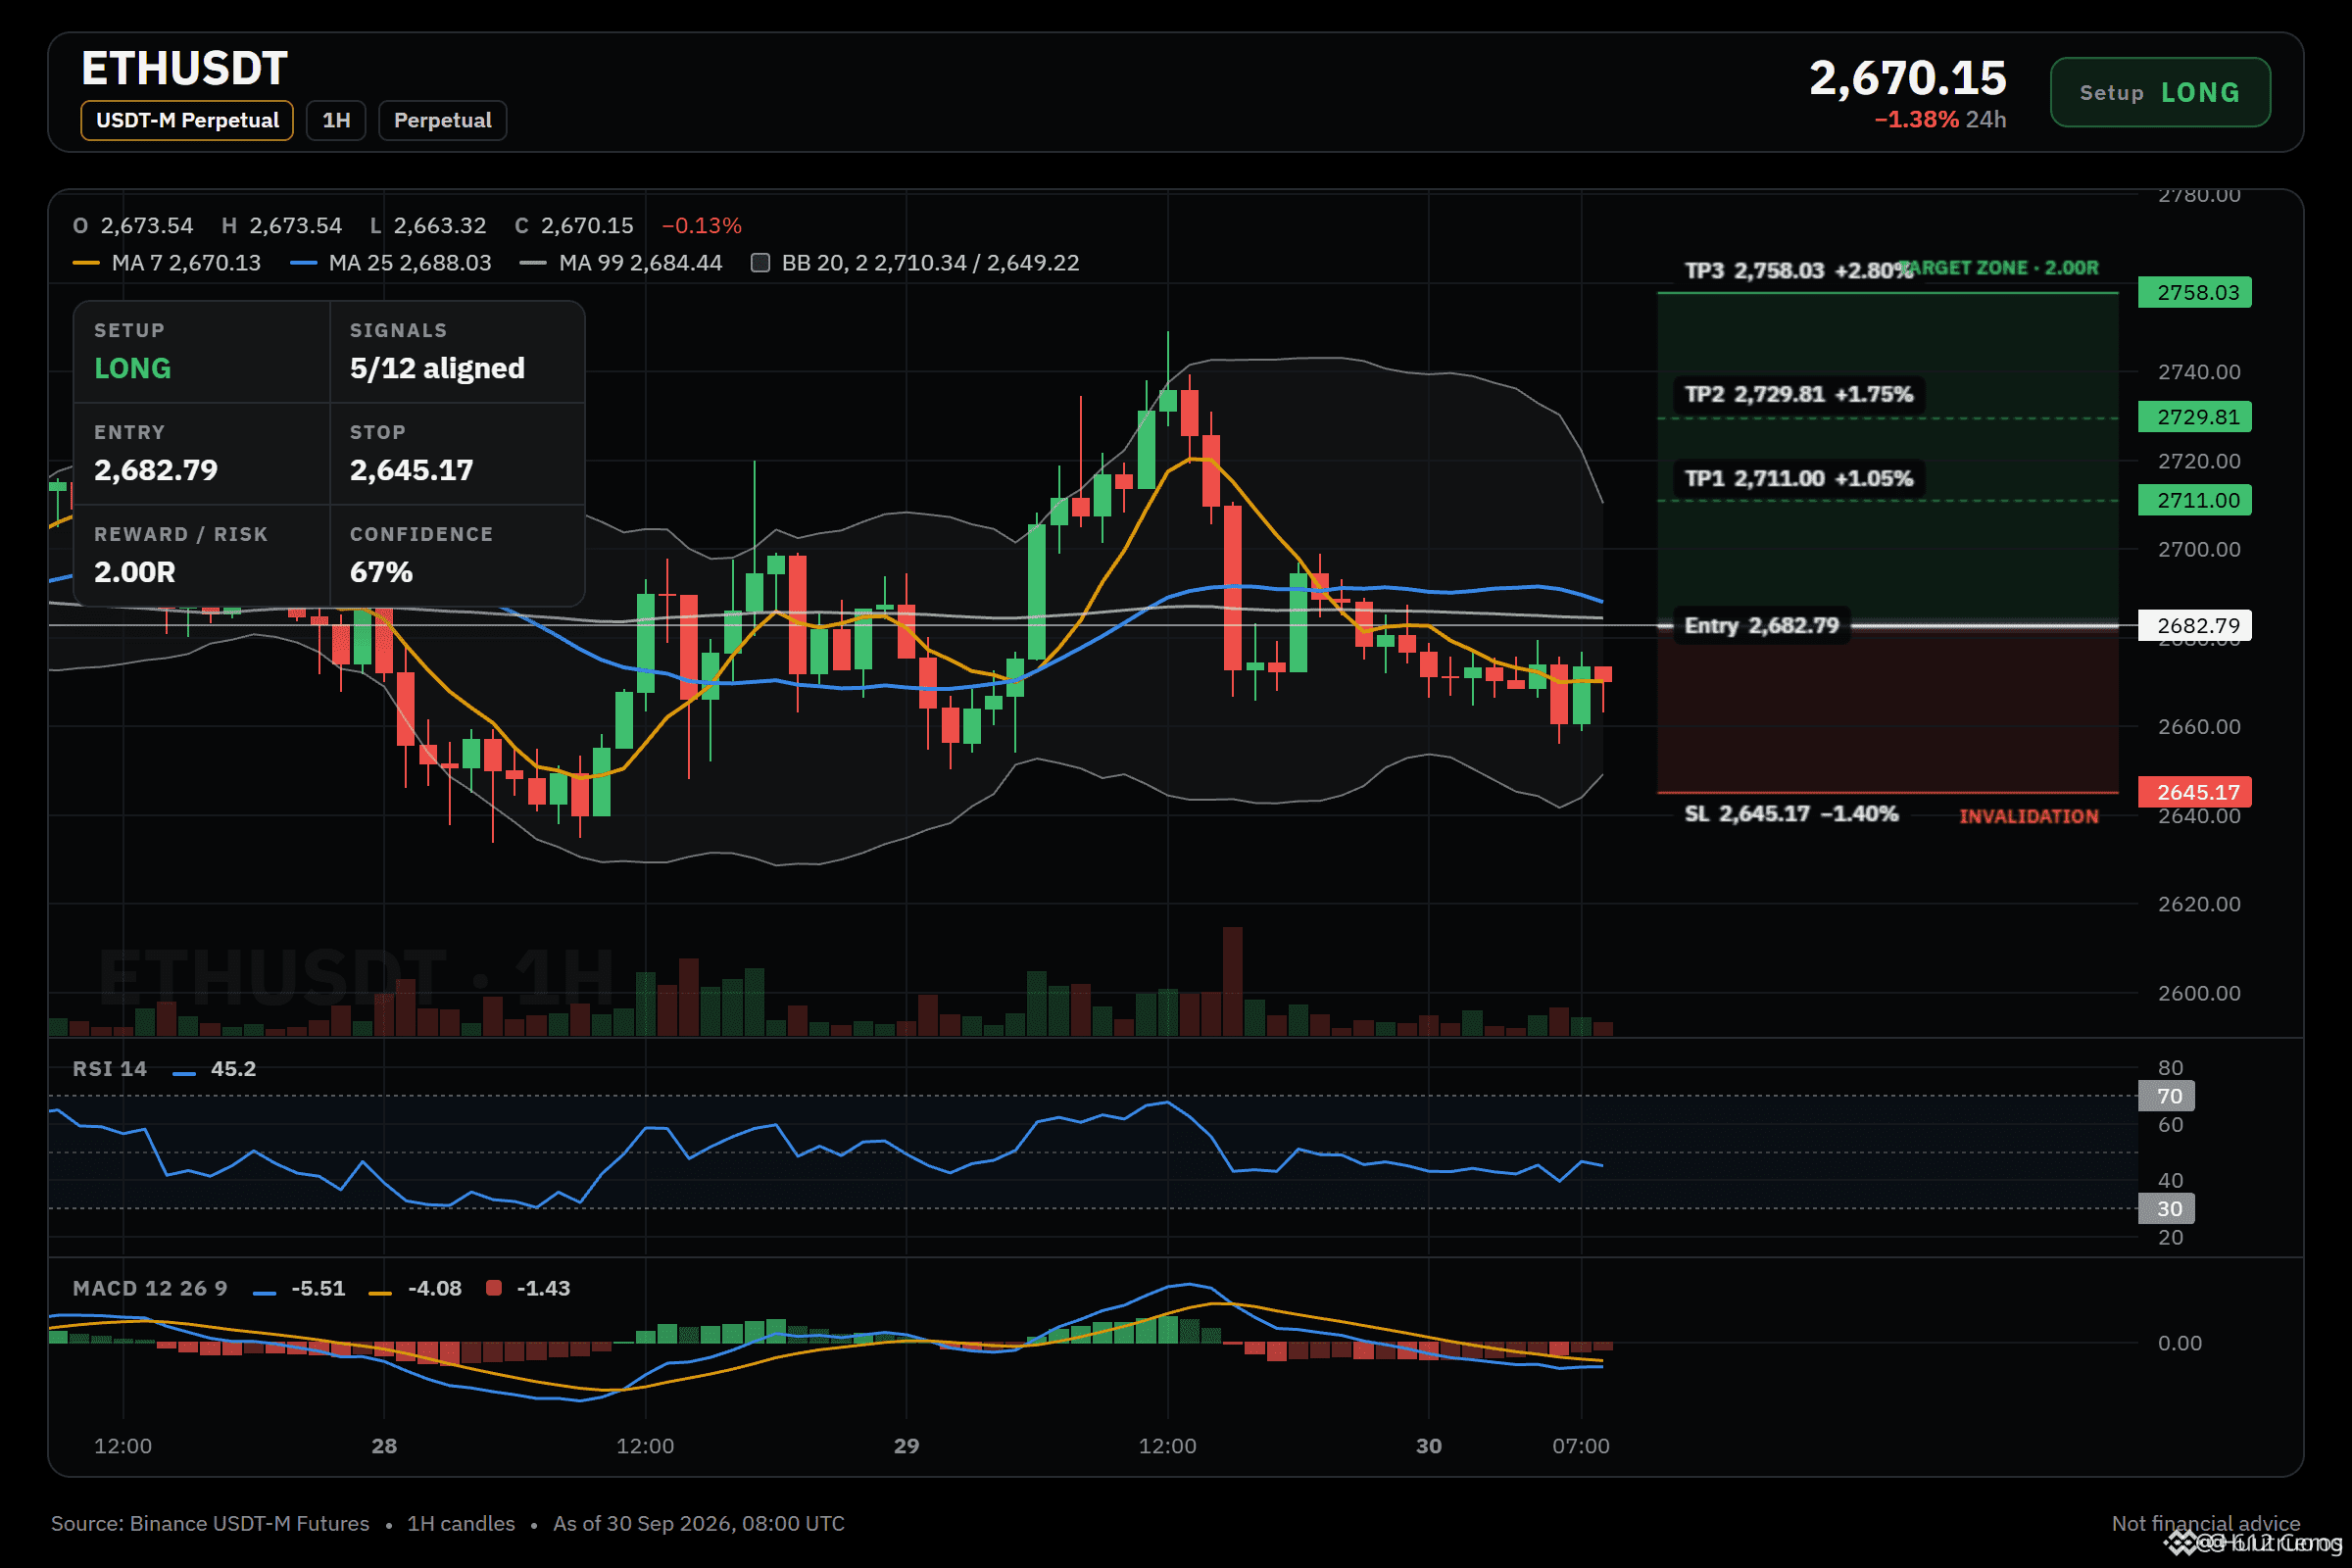
🟢 LONG $ETH /USDT: price expected to INCREASE
Bias: LONG · leaning · 5/12 signals in agreement, 1 against, 6 unclear
📍 Entry: 2681.07 – 2684.51 · limit order within the zone, don’t chase
🎯 TP1: 2711.00 (+1.1%) · close about half, then move SL to the entry price
🎯 TP2: 2729.81 (+1.8%) · close most of the remaining position
🎯 TP3: 2758.03 (+2.8%) · final target
🛑 SL: 2645.17 (-1.4%) · close everything, never move the SL farther
⚖️ Take-profit / stop-loss profit-to-risk ratio: 0.75R / 1.25R / 2R at TP1 / TP2 / TP3
Only TP1 pays less than the cost of the stop-out order, so then the SL is moved to the entry.
⏳ Timing: 15m timeframe momentum is in agreement. Ignore if TP1 hits before you get filled.
⚠️ Confidence level is moderate, 1 signal against. Keep position size small.
Why LONG? Technical conclusion: LEANS LONG, 5/12 signals agree, 1 against, 6 unclear.
✅ Daily trend: price > EMA50 > EMA200, bullish stacking → larger timeframe trend is INCREASING
✅ 4h trend: price > EMA50 > EMA200, bullish stacking → swing trend is INCREASING
✅ 1h trend: price > EMA50 > EMA200, bullish stacking → short-term trend is INCREASING
⚠️ RSI is over-extended within a range: RSI z-score +3.16 in range, risk of “fades-the-high” → top of the range, sellers often start entering
ETH is about to break through
🟢 LONG $ETH /USDT: price expected to INCREASE
Bias: LONG · leaning · 5/12 signals in agreement, 1 against, 6 unclear
📍 Entry: 2681.07 – 2684.51 · limit order within the zone, don’t chase
🎯 TP1: 2711.00 (+1.1%) · close about half, then move SL to the entry price
🎯 TP2: 2729.81 (+1.8%) · close most of the remaining position
🎯 TP3: 2758.03 (+2.8%) · final target
🛑 SL: 2645.17 (-1.4%) · close everything, never move the SL farther
⚖️ Take-profit / stop-loss profit-to-risk ratio: 0.75R / 1.25R / 2R at TP1 / TP2 / TP3
Only TP1 pays less than the cost of the stop-out order, so then the SL is moved to the entry.
⏳ Timing: 15m timeframe momentum is in agreement. Ignore if TP1 hits before you get filled.
⚠️ Confidence level is moderate, 1 signal against. Keep position size small.
Why LONG? Technical conclusion: LEANS LONG, 5/12 signals agree, 1 against, 6 unclear.
✅ Daily trend: price > EMA50 > EMA200, bullish stacking → larger timeframe trend is INCREASING
✅ 4h trend: price > EMA50 > EMA200, bullish stacking → swing trend is INCREASING
✅ 1h trend: price > EMA50 > EMA200, bullish stacking → short-term trend is INCREASING
⚠️ RSI is over-extended within a range: RSI z-score +3.16 in range, risk of “fades-the-high” → top of the range, sellers often start entering
🟢 LONG $ETH /USDT: price expected to INCREASE
Bias: LONG · leaning · 5/12 signals in agreement, 1 against, 6 unclear
📍 Entry: 2681.07 – 2684.51 · limit order within the zone, don’t chase
🎯 TP1: 2711.00 (+1.1%) · close about half, then move SL to the entry price
🎯 TP2: 2729.81 (+1.8%) · close most of the remaining position
🎯 TP3: 2758.03 (+2.8%) · final target
🛑 SL: 2645.17 (-1.4%) · close everything, never move the SL farther
⚖️ Take-profit / stop-loss profit-to-risk ratio: 0.75R / 1.25R / 2R at TP1 / TP2 / TP3
Only TP1 pays less than the cost of the stop-out order, so then the SL is moved to the entry.
⏳ Timing: 15m timeframe momentum is in agreement. Ignore if TP1 hits before you get filled.
⚠️ Confidence level is moderate, 1 signal against. Keep position size small.
Why LONG? Technical conclusion: LEANS LONG, 5/12 signals agree, 1 against, 6 unclear.
✅ Daily trend: price > EMA50 > EMA200, bullish stacking → larger timeframe trend is INCREASING
✅ 4h trend: price > EMA50 > EMA200, bullish stacking → swing trend is INCREASING
✅ 1h trend: price > EMA50 > EMA200, bullish stacking → short-term trend is INCREASING
⚠️ RSI is over-extended within a range: RSI z-score +3.16 in range, risk of “fades-the-high” → top of the range, sellers often start entering
28
·
--
Bullish
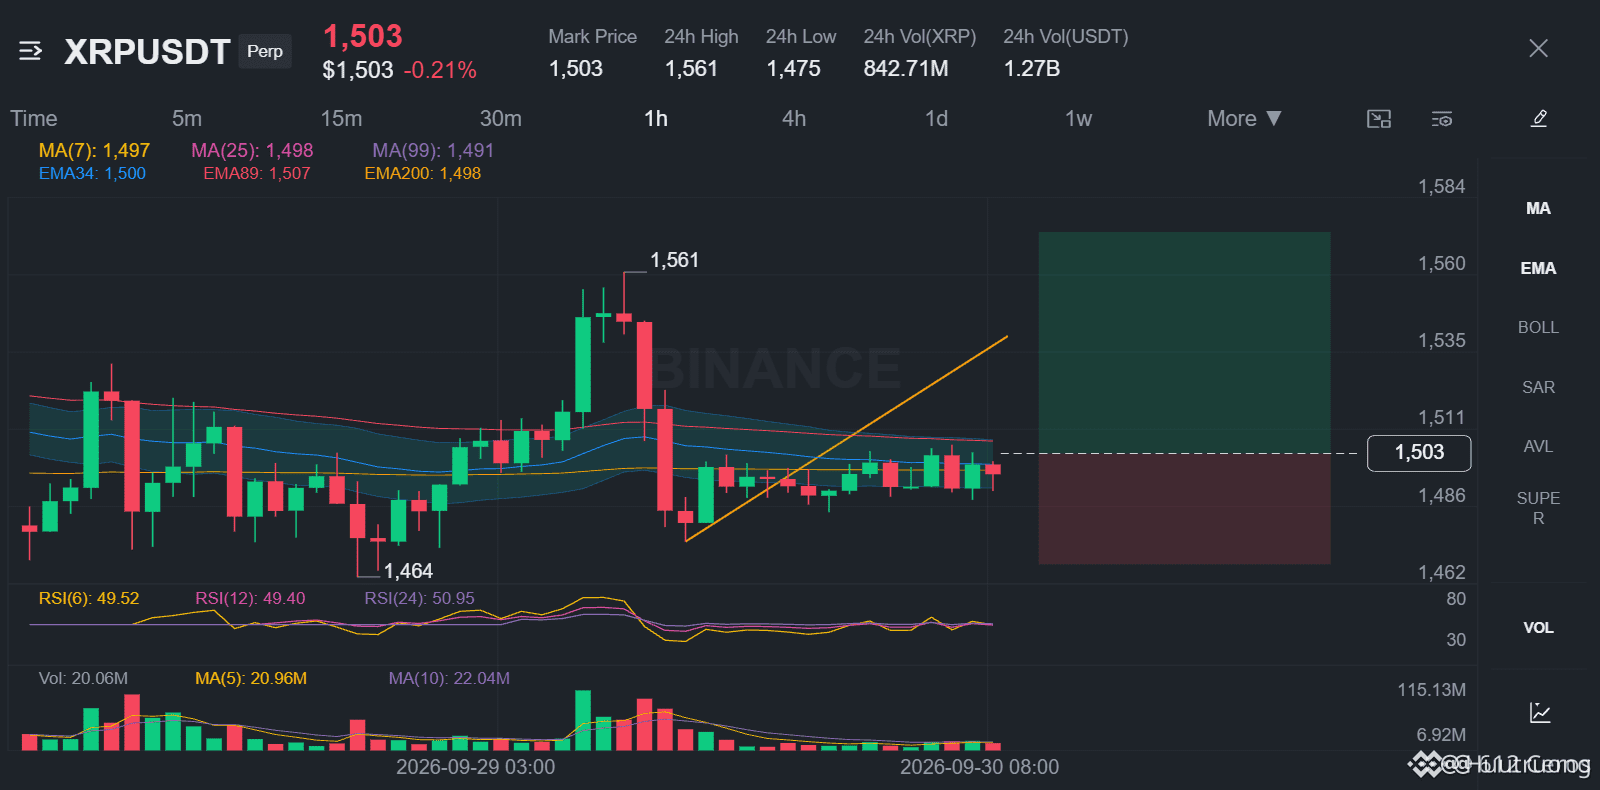
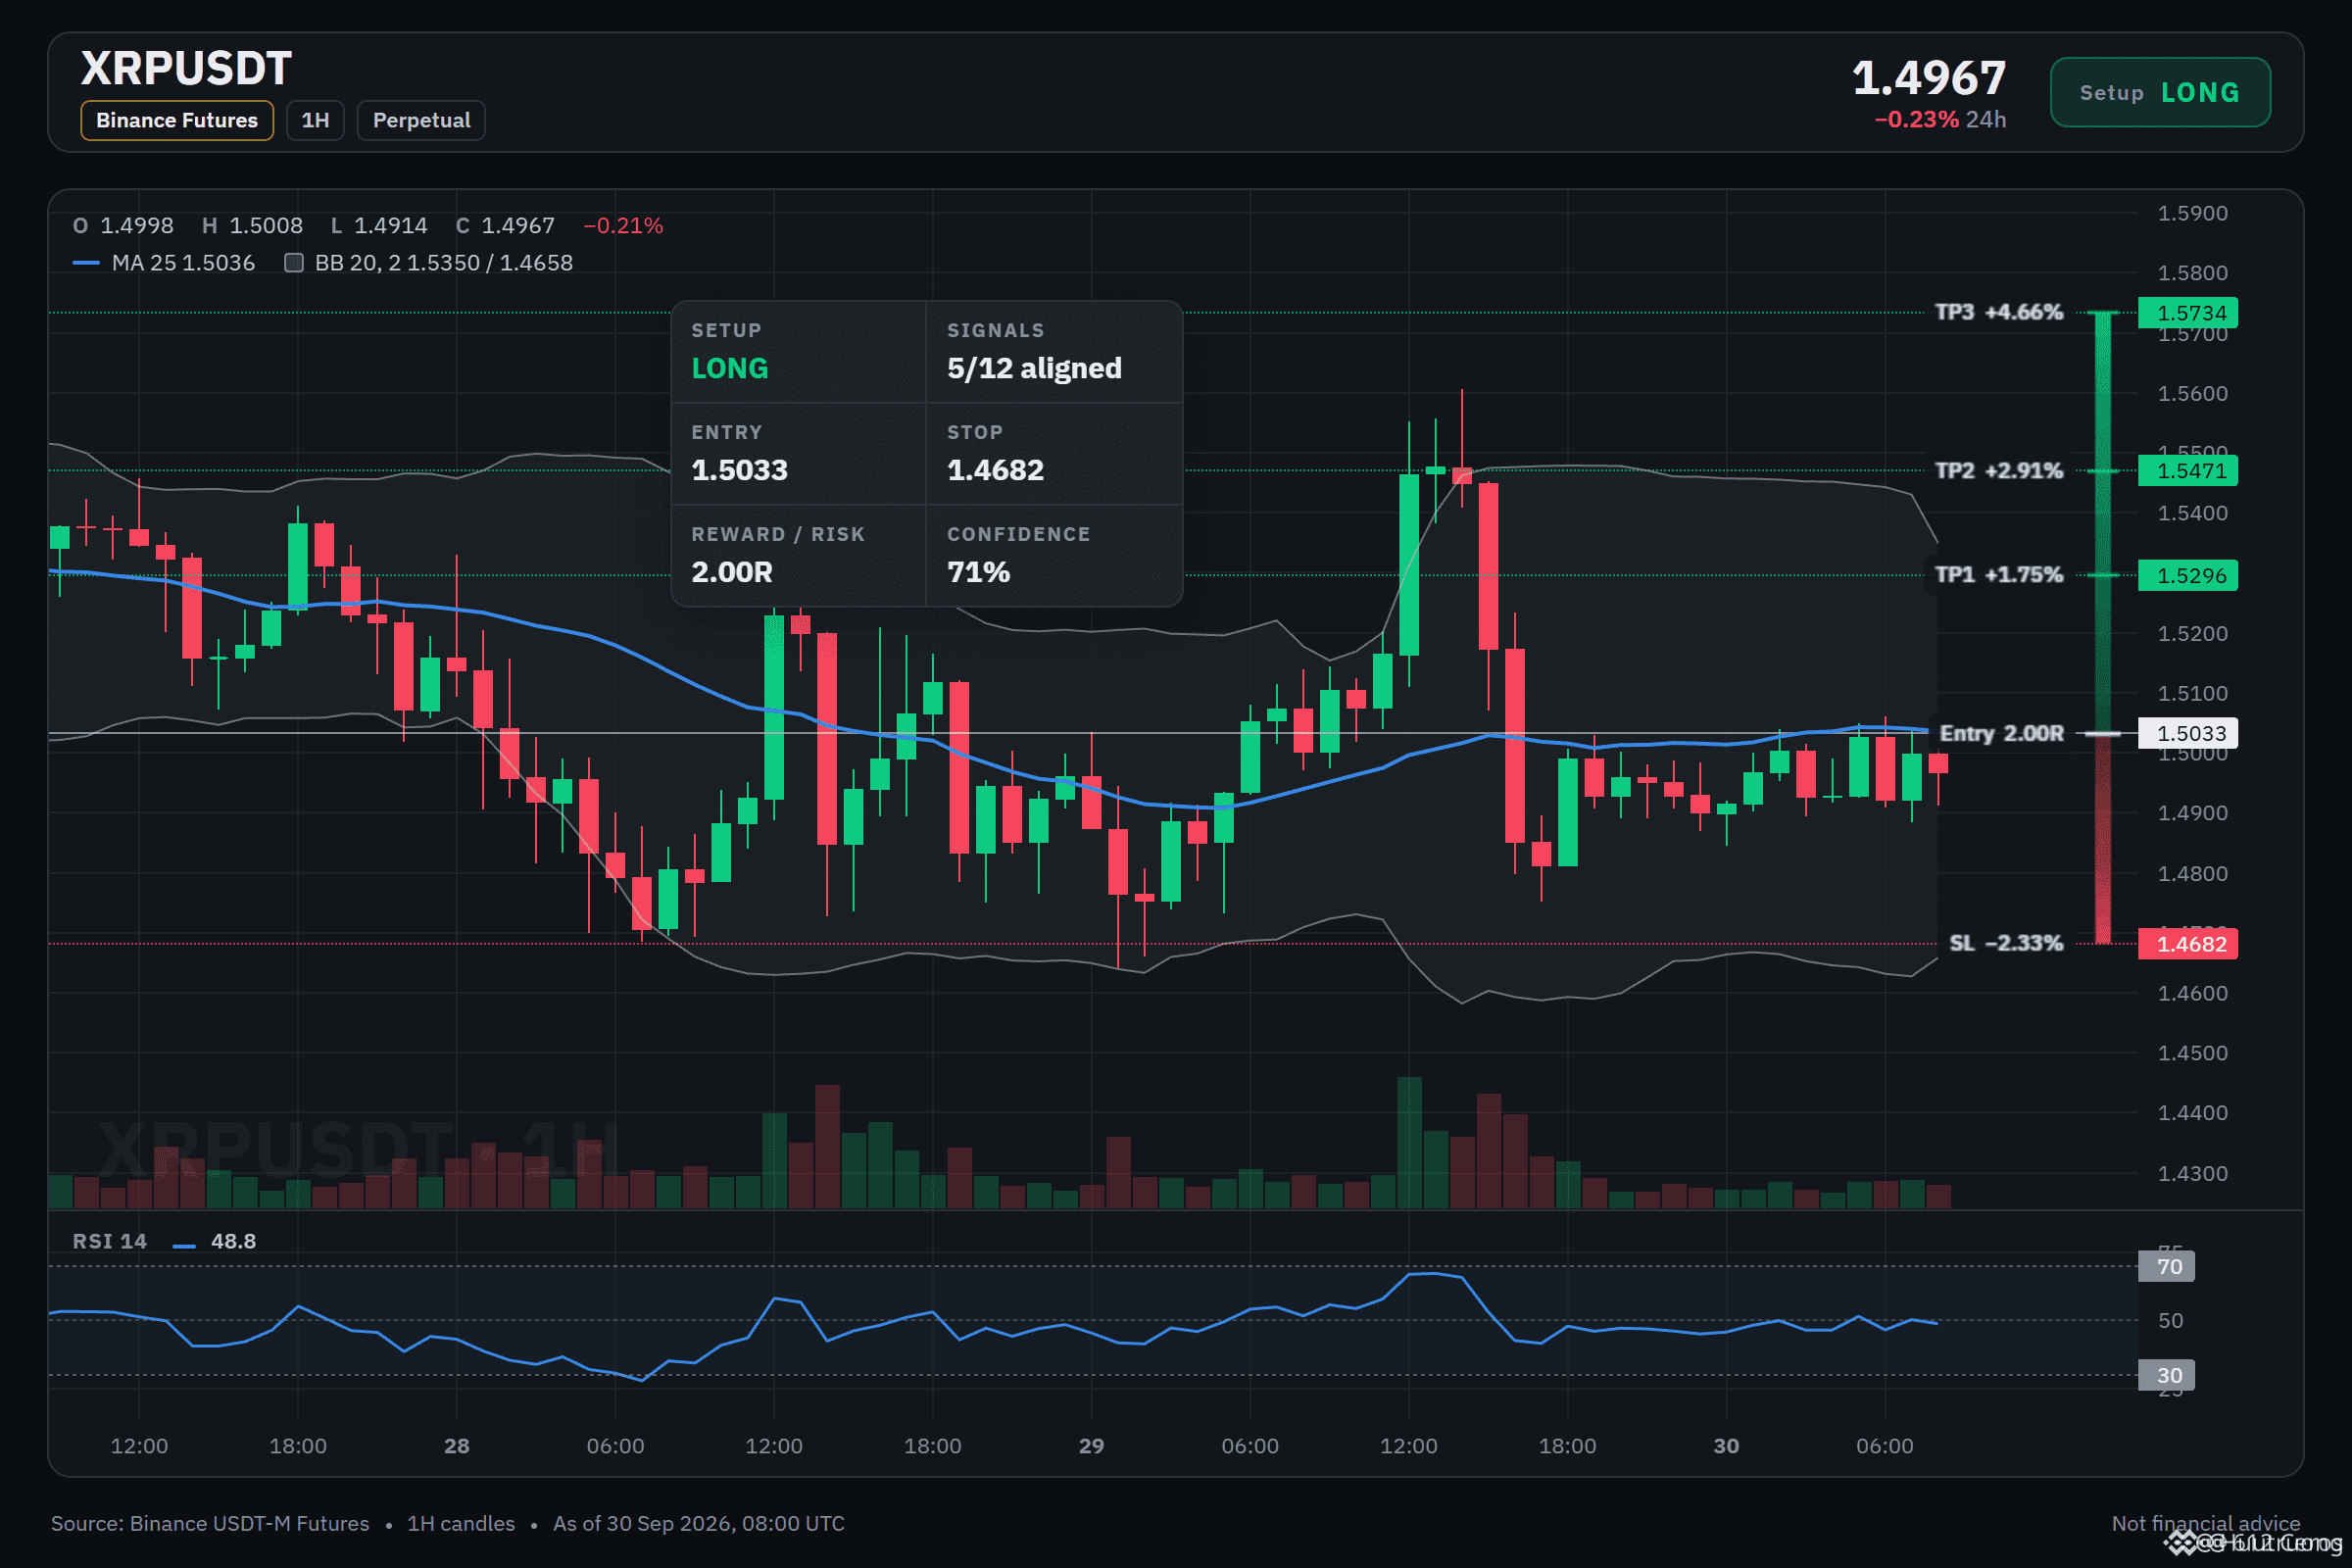
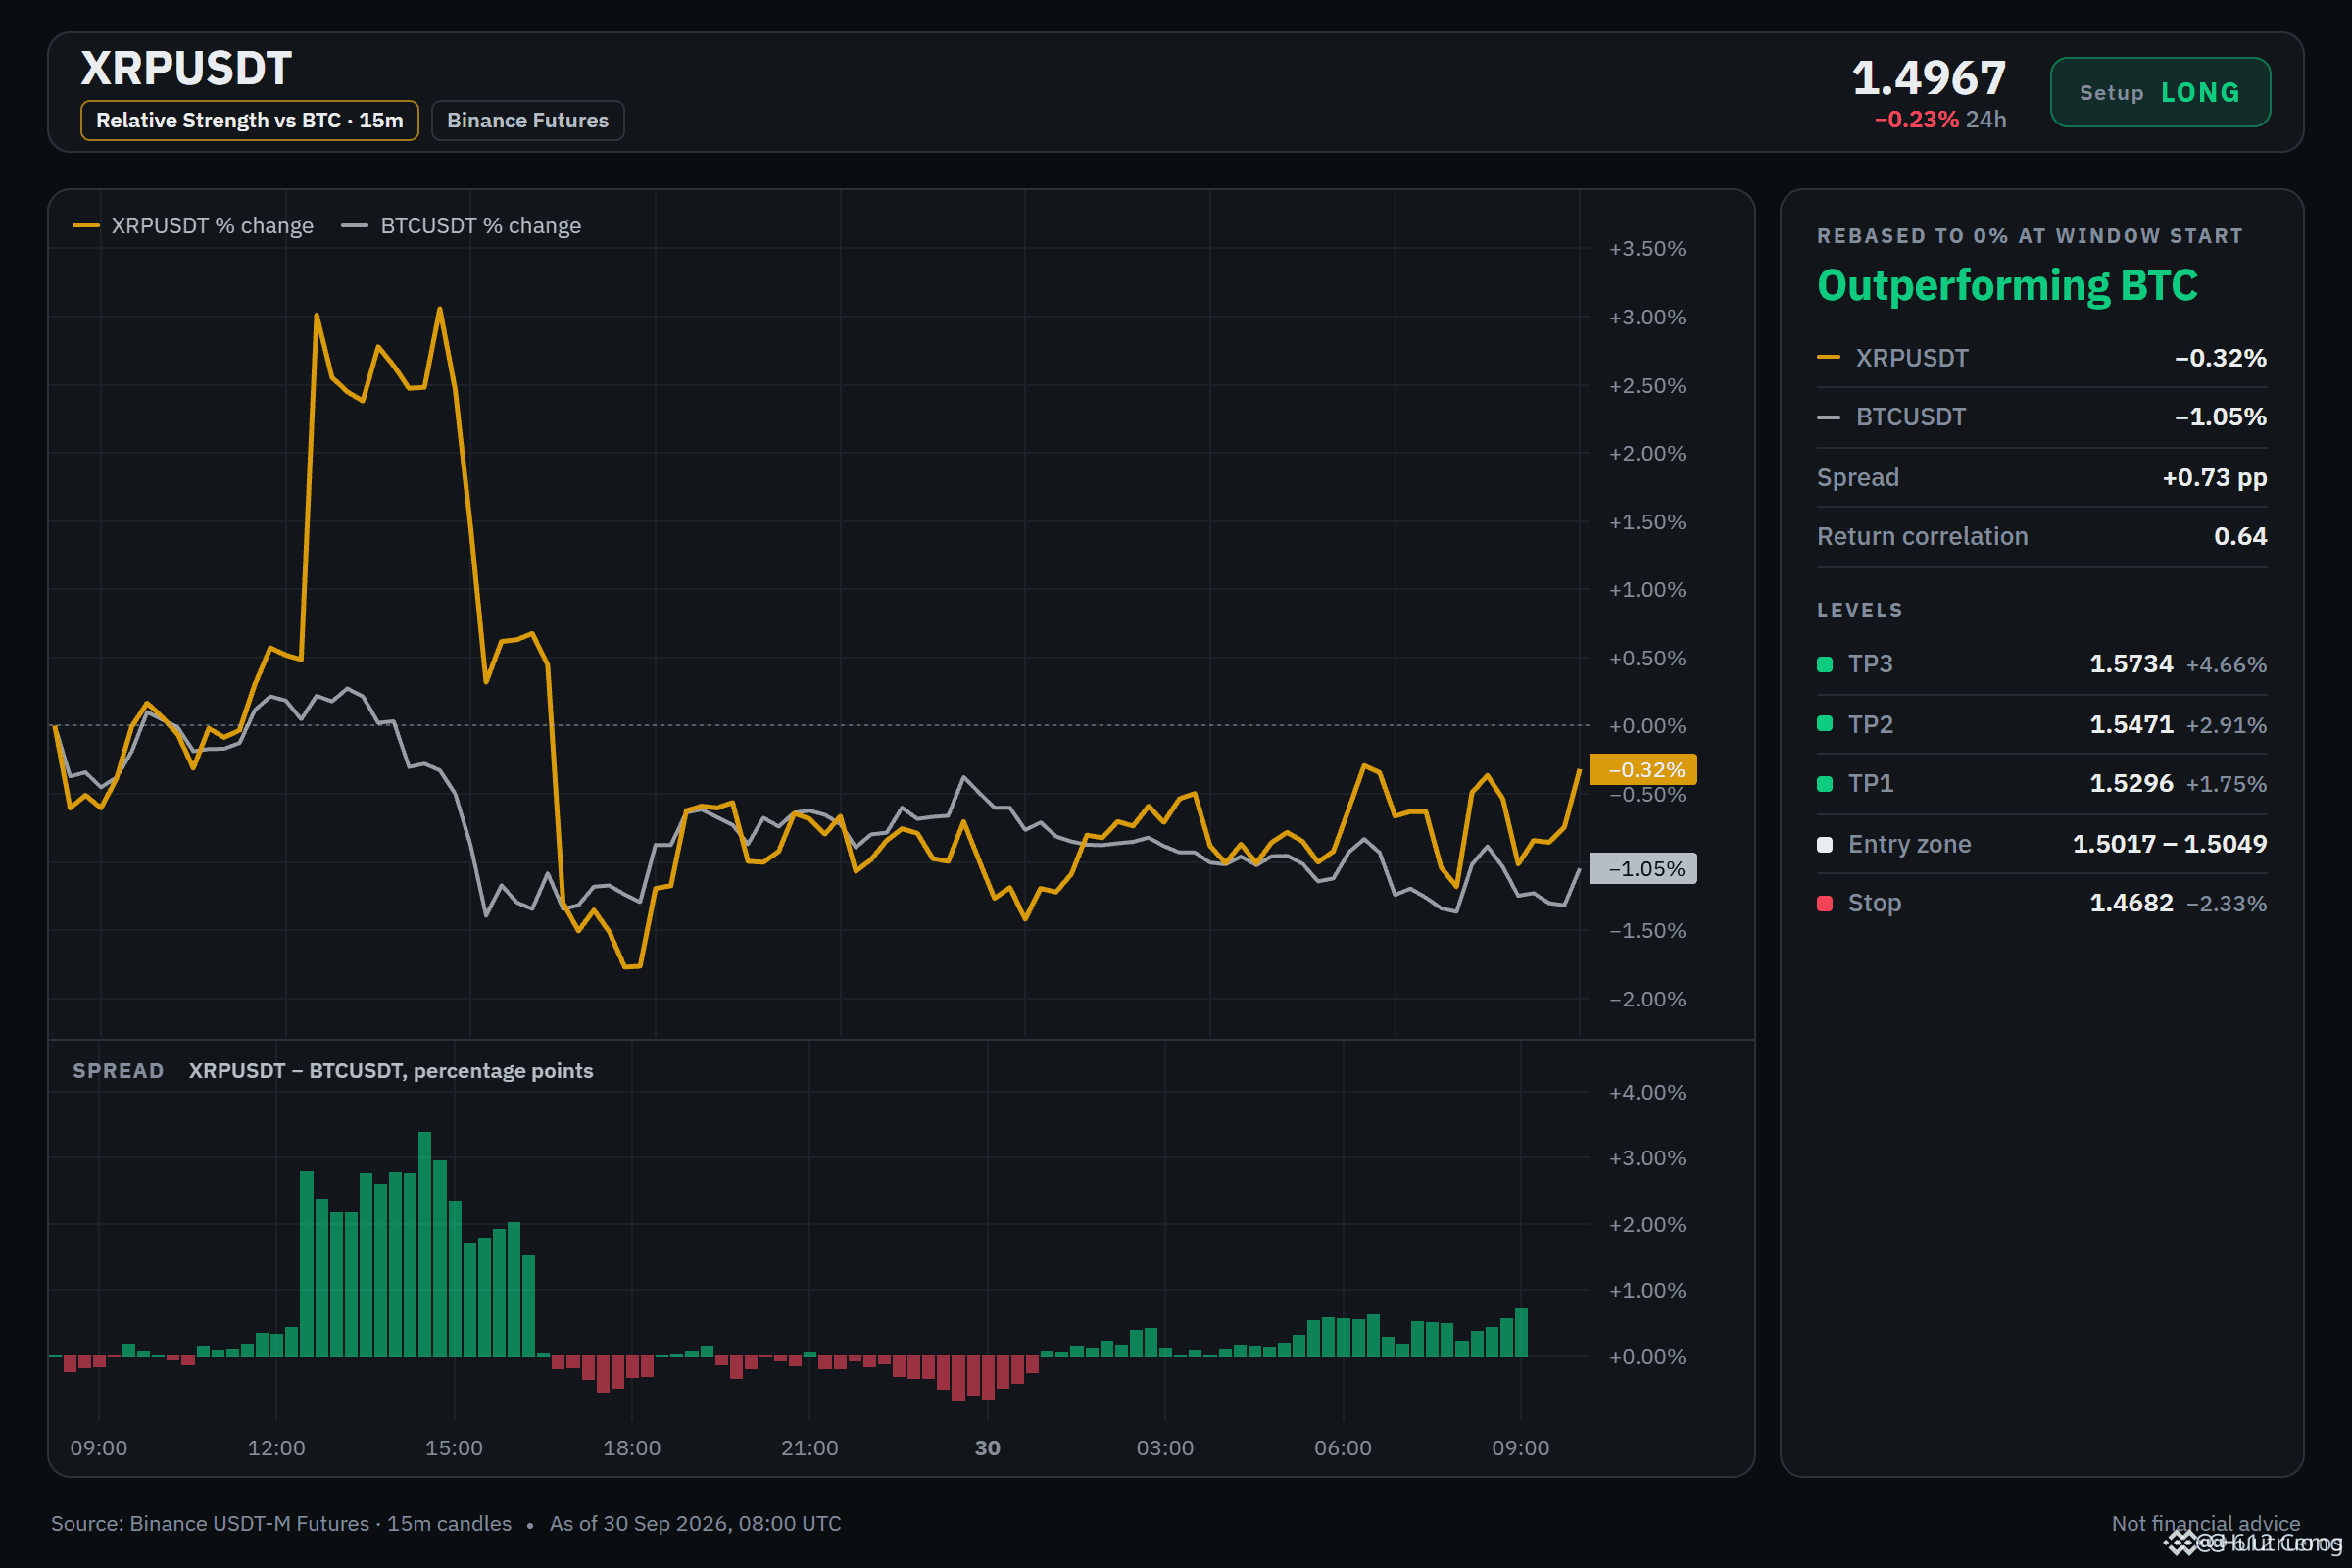
🟢 LONG $XRP /USDT: price is expected to INCREASE
Bias: LONG · Leaning · 5/12 signals in agreement, 0 against, 7 undecided
📍 Entry: 1.5017 – 1.5049 · limit order within the range, don’t chase the price
🎯 TP1: 1.5296 (+1.7%) · take about half profit, then move SL to the entry price
🎯 TP2: 1.5471 (+2.9%) · take most of the remaining position
🎯 TP3: 1.5734 (+4.7%) · final target
🛑 SL: 1.4682 (-2.3%) · close the entire position, never move it farther
⚖️ Profit vs. risk: 0.75R / 1.25R / 2R at TP1 / TP2 / TP3
Only TP1 pays less than the stop’s cost, which is why the stop is moved to the entry after TP1 is reached.
⏳ Timing: 15m timeframe momentum is in agreement. Skip it if TP1 prints before you are filled.
⚠️ Only leaning: 7/12 signals are still hesitant. Keep position size small.
Daily trend leans bullish; buyers are pushing on the 1h chart
Why LONG? Technical conclusion: LEANING LONG, 5/12 signals agree, 0 against, 7 undecided.
✅ Daily trend: price > EMA50 > EMA200, bullish stacking → long-term trend is rising
✅ 4h trend: price > EMA50 > EMA200, bullish stacking → swing trend is rising
✅ 1h trend: price > EMA50 > EMA200, bullish stacking → short-term trend is rising
Currently, there are no factors going against this.
The daily trend is rising, and the 1h chart price action shows buyers are pressing with RSI z-score +1.45, supporting a scenario that leans toward LONG. Confidence is moderate because only 5/12 signals align and the 15m ADX does not show a clear trend.
When will you invalidate this LONG order on XRP?
The levels marked on the chart below 👇
🟢 LONG $XRP /USDT: price is expected to INCREASE
Bias: LONG · Leaning · 5/12 signals in agreement, 0 against, 7 undecided
📍 Entry: 1.5017 – 1.5049 · limit order within the range, don’t chase the price
🎯 TP1: 1.5296 (+1.7%) · take about half profit, then move SL to the entry price
🎯 TP2: 1.5471 (+2.9%) · take most of the remaining position
🎯 TP3: 1.5734 (+4.7%) · final target
🛑 SL: 1.4682 (-2.3%) · close the entire position, never move it farther
⚖️ Profit vs. risk: 0.75R / 1.25R / 2R at TP1 / TP2 / TP3
Only TP1 pays less than the stop’s cost, which is why the stop is moved to the entry after TP1 is reached.
⏳ Timing: 15m timeframe momentum is in agreement. Skip it if TP1 prints before you are filled.
⚠️ Only leaning: 7/12 signals are still hesitant. Keep position size small.
Daily trend leans bullish; buyers are pushing on the 1h chart
Why LONG? Technical conclusion: LEANING LONG, 5/12 signals agree, 0 against, 7 undecided.
✅ Daily trend: price > EMA50 > EMA200, bullish stacking → long-term trend is rising
✅ 4h trend: price > EMA50 > EMA200, bullish stacking → swing trend is rising
✅ 1h trend: price > EMA50 > EMA200, bullish stacking → short-term trend is rising
Currently, there are no factors going against this.
The daily trend is rising, and the 1h chart price action shows buyers are pressing with RSI z-score +1.45, supporting a scenario that leans toward LONG. Confidence is moderate because only 5/12 signals align and the 15m ADX does not show a clear trend.
When will you invalidate this LONG order on XRP?
The levels marked on the chart below 👇
Bias: LONG · Leaning · 5/12 signals in agreement, 0 against, 7 undecided
📍 Entry: 1.5017 – 1.5049 · limit order within the range, don’t chase the price
🎯 TP1: 1.5296 (+1.7%) · take about half profit, then move SL to the entry price
🎯 TP2: 1.5471 (+2.9%) · take most of the remaining position
🎯 TP3: 1.5734 (+4.7%) · final target
🛑 SL: 1.4682 (-2.3%) · close the entire position, never move it farther
⚖️ Profit vs. risk: 0.75R / 1.25R / 2R at TP1 / TP2 / TP3
Only TP1 pays less than the stop’s cost, which is why the stop is moved to the entry after TP1 is reached.
⏳ Timing: 15m timeframe momentum is in agreement. Skip it if TP1 prints before you are filled.
⚠️ Only leaning: 7/12 signals are still hesitant. Keep position size small.
Daily trend leans bullish; buyers are pushing on the 1h chart
Why LONG? Technical conclusion: LEANING LONG, 5/12 signals agree, 0 against, 7 undecided.
✅ Daily trend: price > EMA50 > EMA200, bullish stacking → long-term trend is rising
✅ 4h trend: price > EMA50 > EMA200, bullish stacking → swing trend is rising
✅ 1h trend: price > EMA50 > EMA200, bullish stacking → short-term trend is rising
Currently, there are no factors going against this.
The daily trend is rising, and the 1h chart price action shows buyers are pressing with RSI z-score +1.45, supporting a scenario that leans toward LONG. Confidence is moderate because only 5/12 signals align and the 15m ADX does not show a clear trend.
When will you invalidate this LONG order on XRP?
The levels marked on the chart below 👇
3
·
--
Bullish
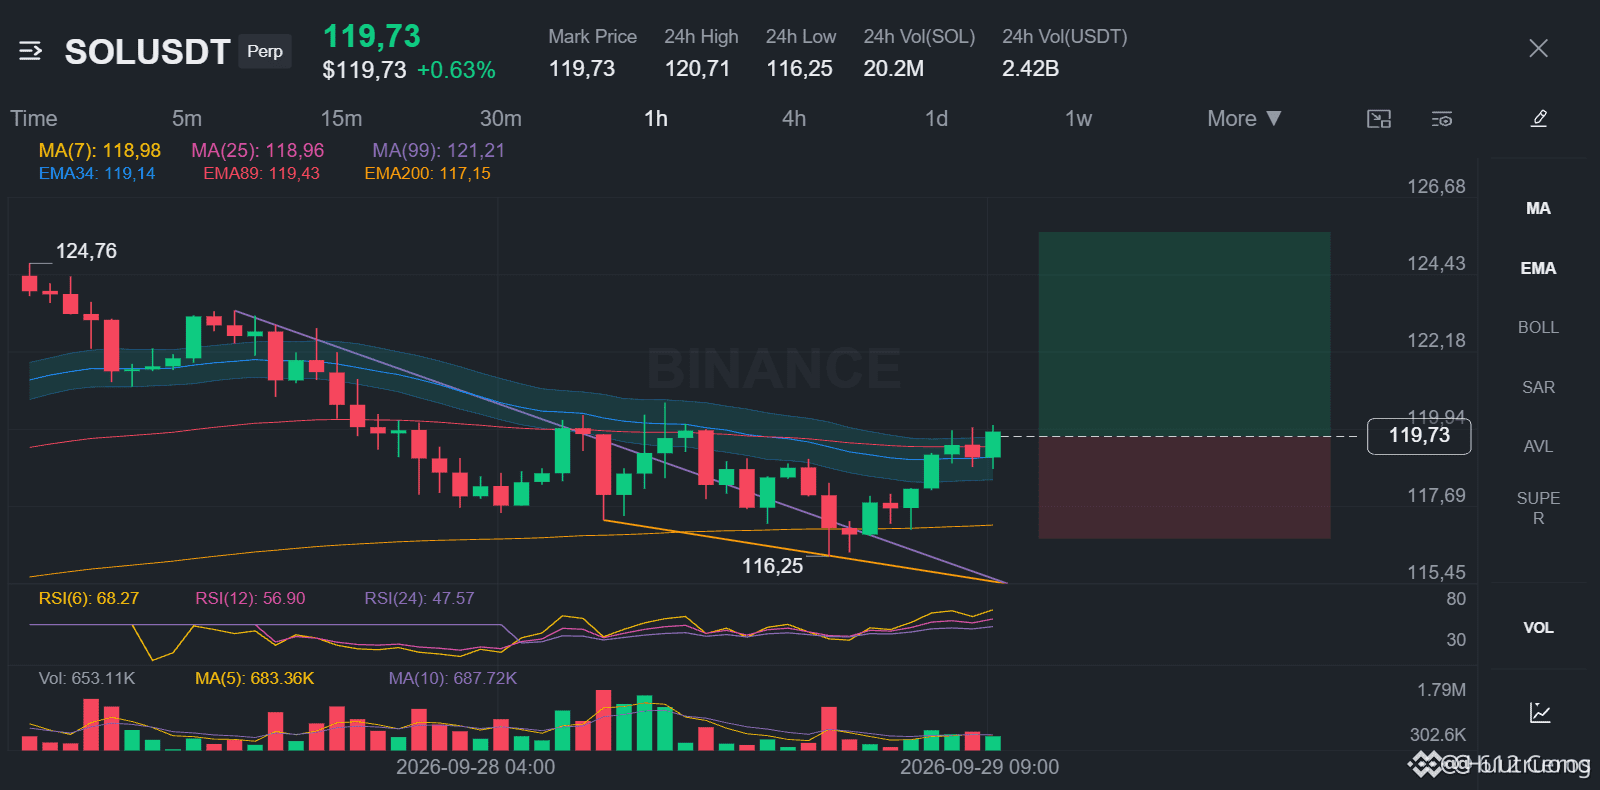
SOL has found a floor (base) and the clusters below it are trending upward.
🟢 $SOL /USDT | Bias: LONG (Bullish) | 5/12 signals in agreement
⚠️ Only slightly bullish: 7/12 signals are still unclear. Keep position size small.
Technical conclusion: BIAS TOWARD LONG. 5/12 signals agree, 0 against.
What supports it (5):
• Daily trend: price > EMA50 > EMA200, bullish cluster
• 4h trend: price > EMA50 > EMA200, bullish cluster
• 1h trend: price > EMA50 > EMA200, bullish cluster
• BTC foundation: BTC is bullish and the correlation is 0.90
Currently, there are no factors working against this.
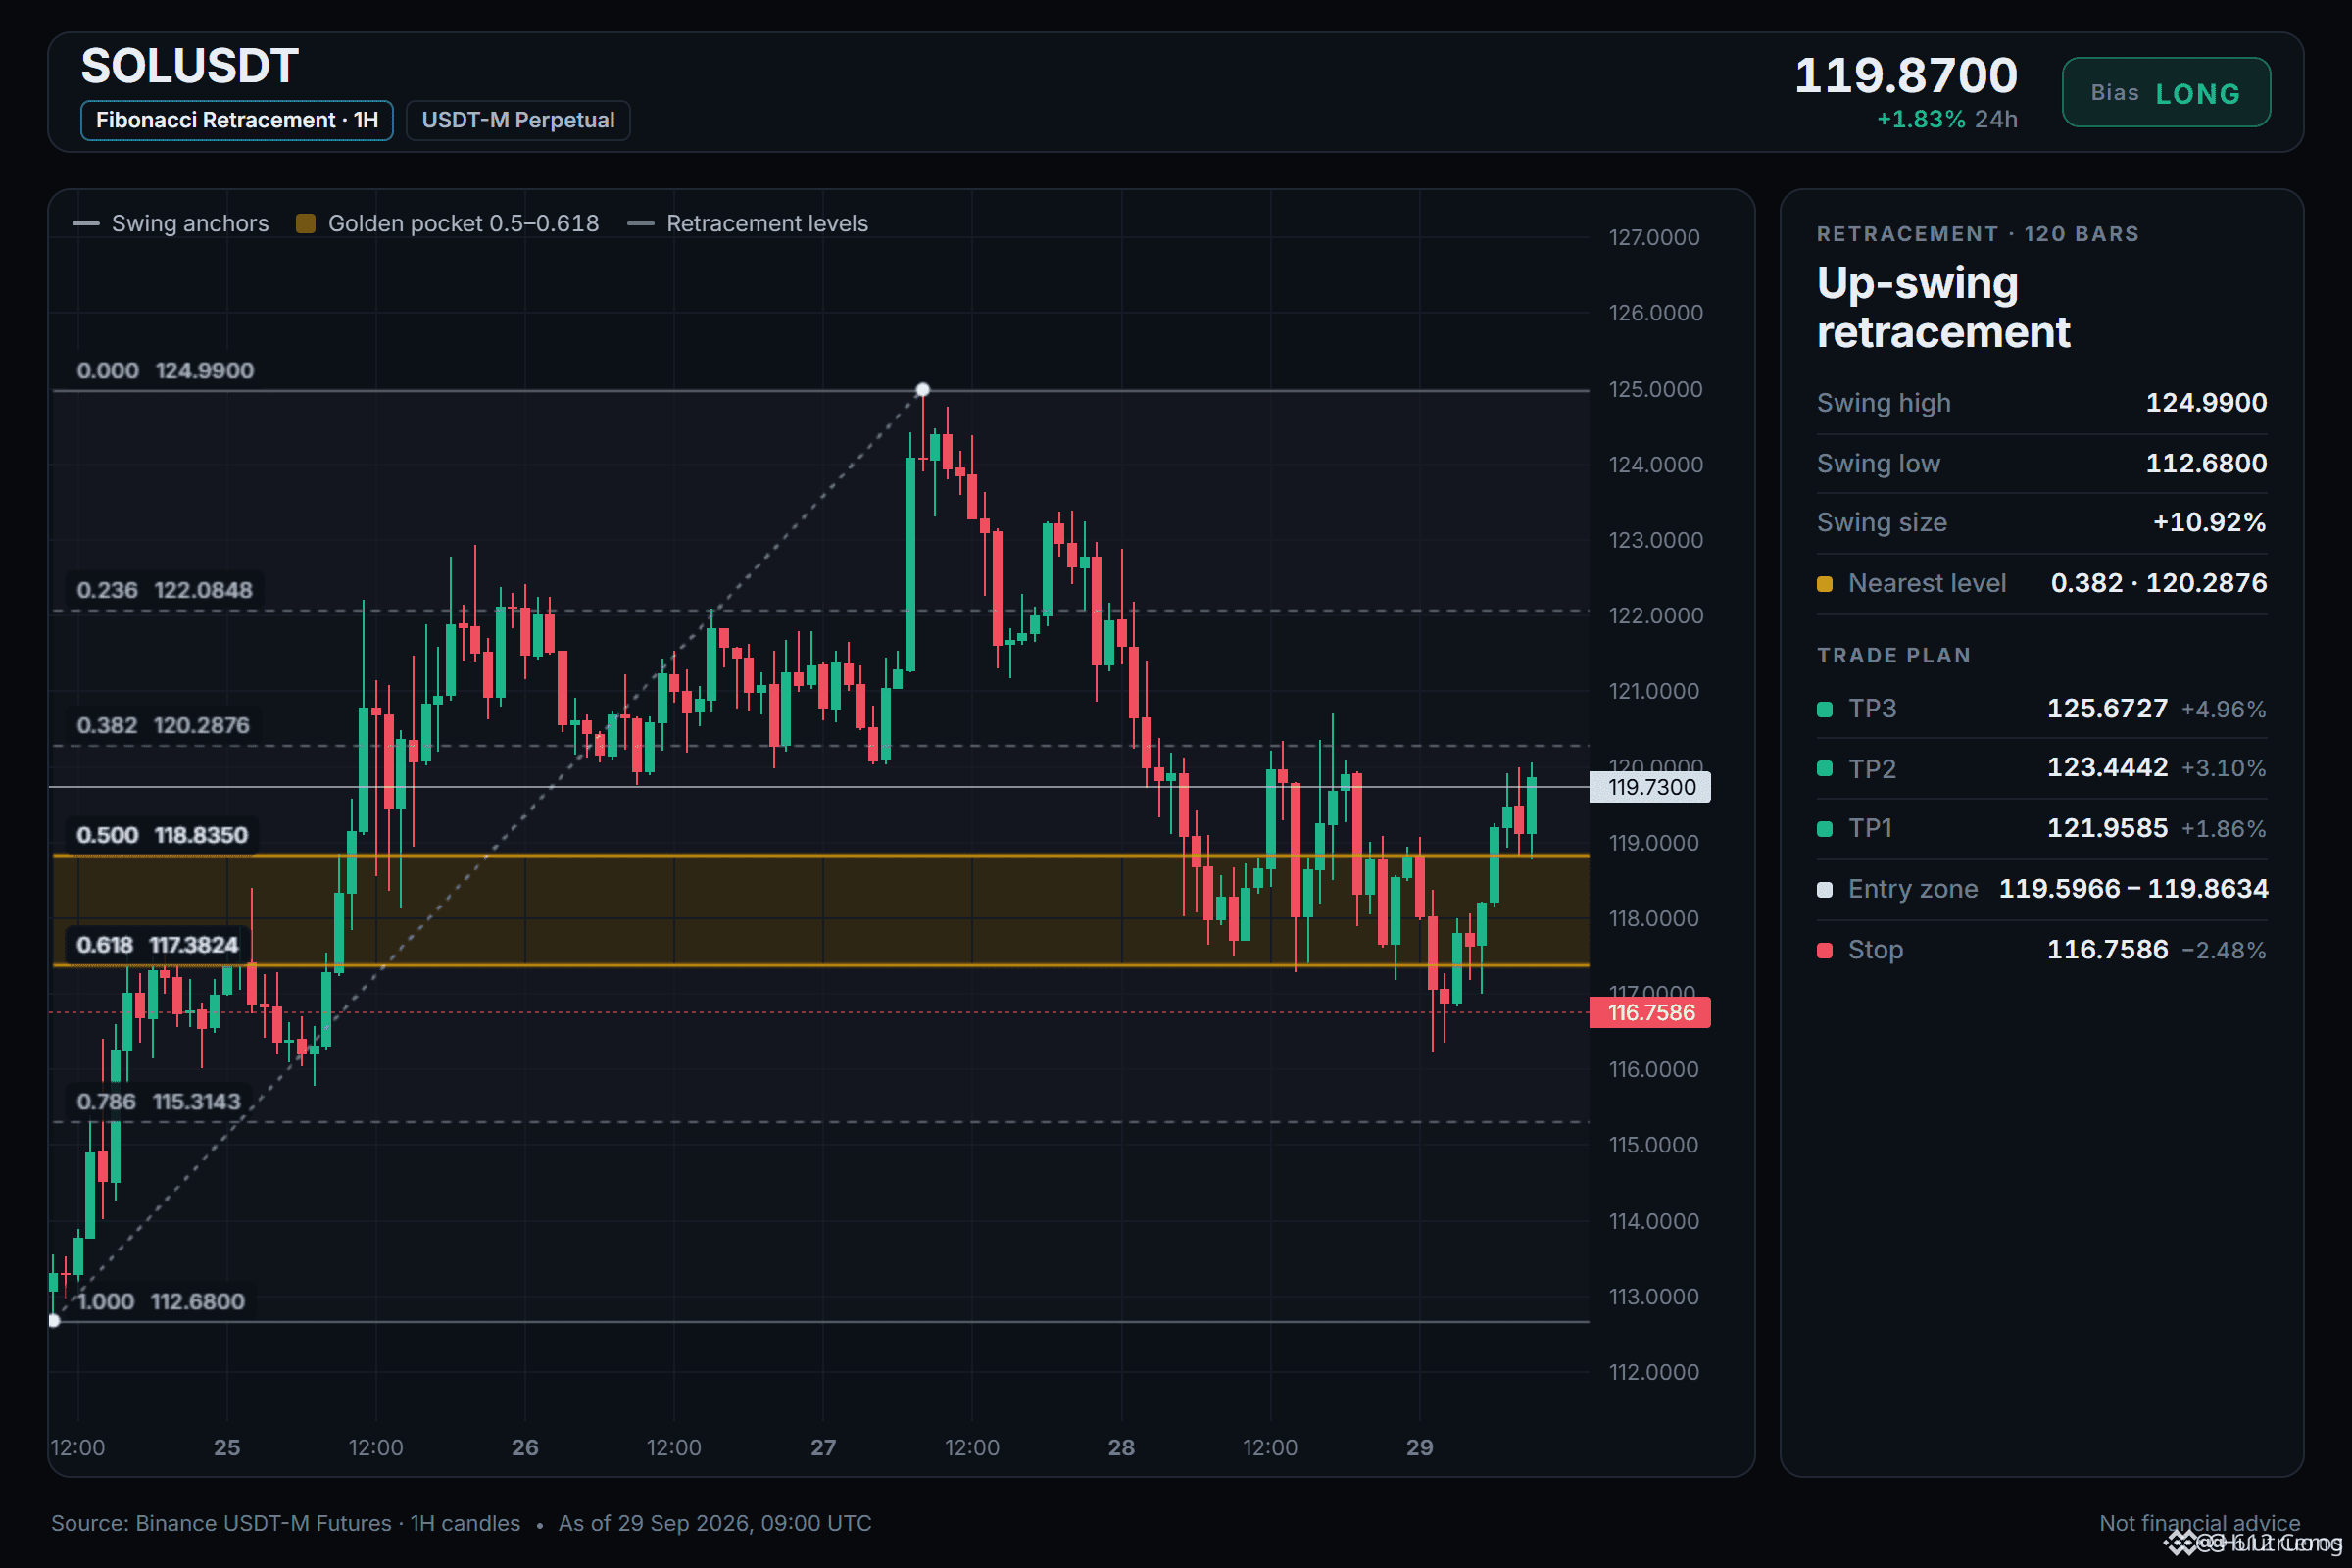
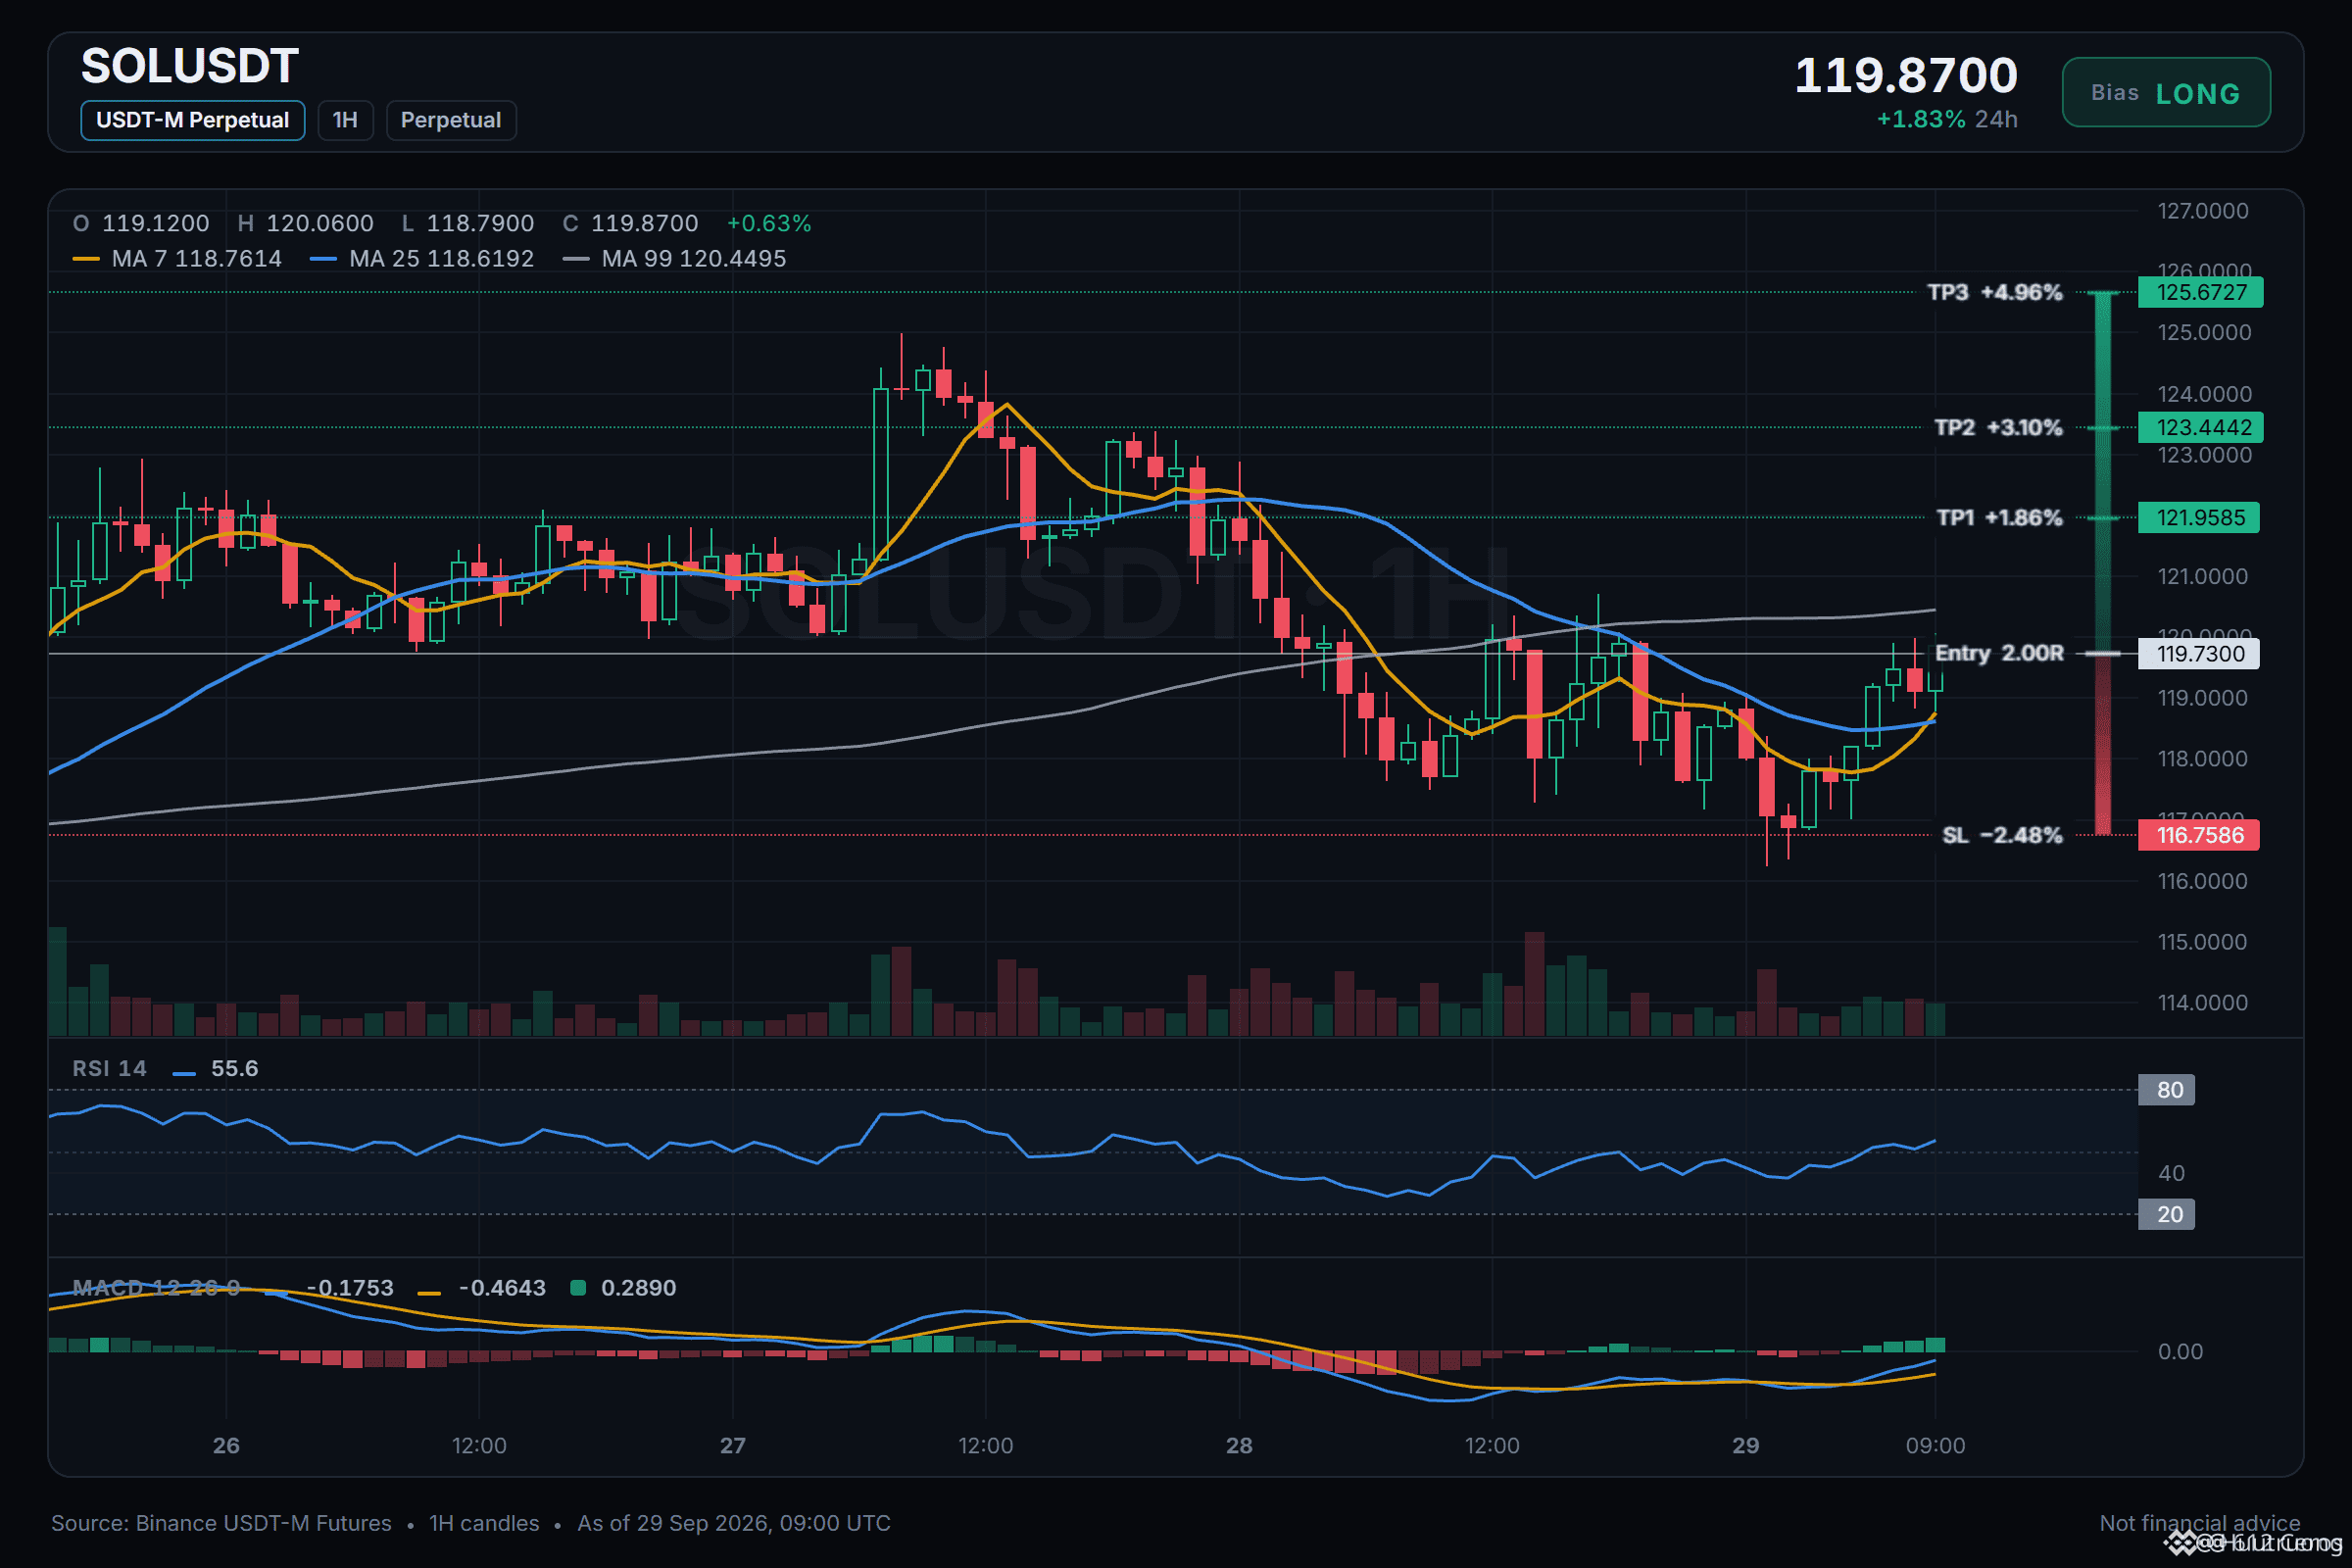
📍 Entry: 119.5966 – 119.8634
🎯 TP1: 121.9585 | TP2: 123.4442 | TP3: 125.6727
🛑 SL: 116.7586
🟢 Bullish scenario:
From the entry zone 119.5966 to 119.8634, SOL needs to push up first to 121.9585, then 123.4442. The 4h trend supports this: price is above EMA50 and EMA200, with a bullish cluster.
🛑 What would make the scenario fail:
A close below 116.1532 will invalidate this level and reverse the idea; I will step back and wait for a new structure. SL is at 116.7586.
Where would you place your stop below 116.1532, and what level would make you take profit early at 121.9585?
Watch on the chart 👇
SOL has found a floor (base) and the clusters below it are trending upward.
🟢 $SOL /USDT | Bias: LONG (Bullish) | 5/12 signals in agreement
⚠️ Only slightly bullish: 7/12 signals are still unclear. Keep position size small.
Technical conclusion: BIAS TOWARD LONG. 5/12 signals agree, 0 against.
What supports it (5):
• Daily trend: price > EMA50 > EMA200, bullish cluster
• 4h trend: price > EMA50 > EMA200, bullish cluster
• 1h trend: price > EMA50 > EMA200, bullish cluster
• BTC foundation: BTC is bullish and the correlation is 0.90
Currently, there are no factors working against this.
📍 Entry: 119.5966 – 119.8634
🎯 TP1: 121.9585 | TP2: 123.4442 | TP3: 125.6727
🛑 SL: 116.7586
🟢 Bullish scenario:
From the entry zone 119.5966 to 119.8634, SOL needs to push up first to 121.9585, then 123.4442. The 4h trend supports this: price is above EMA50 and EMA200, with a bullish cluster.
🛑 What would make the scenario fail:
A close below 116.1532 will invalidate this level and reverse the idea; I will step back and wait for a new structure. SL is at 116.7586.
Where would you place your stop below 116.1532, and what level would make you take profit early at 121.9585?
Watch on the chart 👇
🟢 $SOL /USDT | Bias: LONG (Bullish) | 5/12 signals in agreement
⚠️ Only slightly bullish: 7/12 signals are still unclear. Keep position size small.
Technical conclusion: BIAS TOWARD LONG. 5/12 signals agree, 0 against.
What supports it (5):
• Daily trend: price > EMA50 > EMA200, bullish cluster
• 4h trend: price > EMA50 > EMA200, bullish cluster
• 1h trend: price > EMA50 > EMA200, bullish cluster
• BTC foundation: BTC is bullish and the correlation is 0.90
Currently, there are no factors working against this.
📍 Entry: 119.5966 – 119.8634
🎯 TP1: 121.9585 | TP2: 123.4442 | TP3: 125.6727
🛑 SL: 116.7586
🟢 Bullish scenario:
From the entry zone 119.5966 to 119.8634, SOL needs to push up first to 121.9585, then 123.4442. The 4h trend supports this: price is above EMA50 and EMA200, with a bullish cluster.
🛑 What would make the scenario fail:
A close below 116.1532 will invalidate this level and reverse the idea; I will step back and wait for a new structure. SL is at 116.7586.
Where would you place your stop below 116.1532, and what level would make you take profit early at 121.9585?
Watch on the chart 👇
19
·
--
Bullish
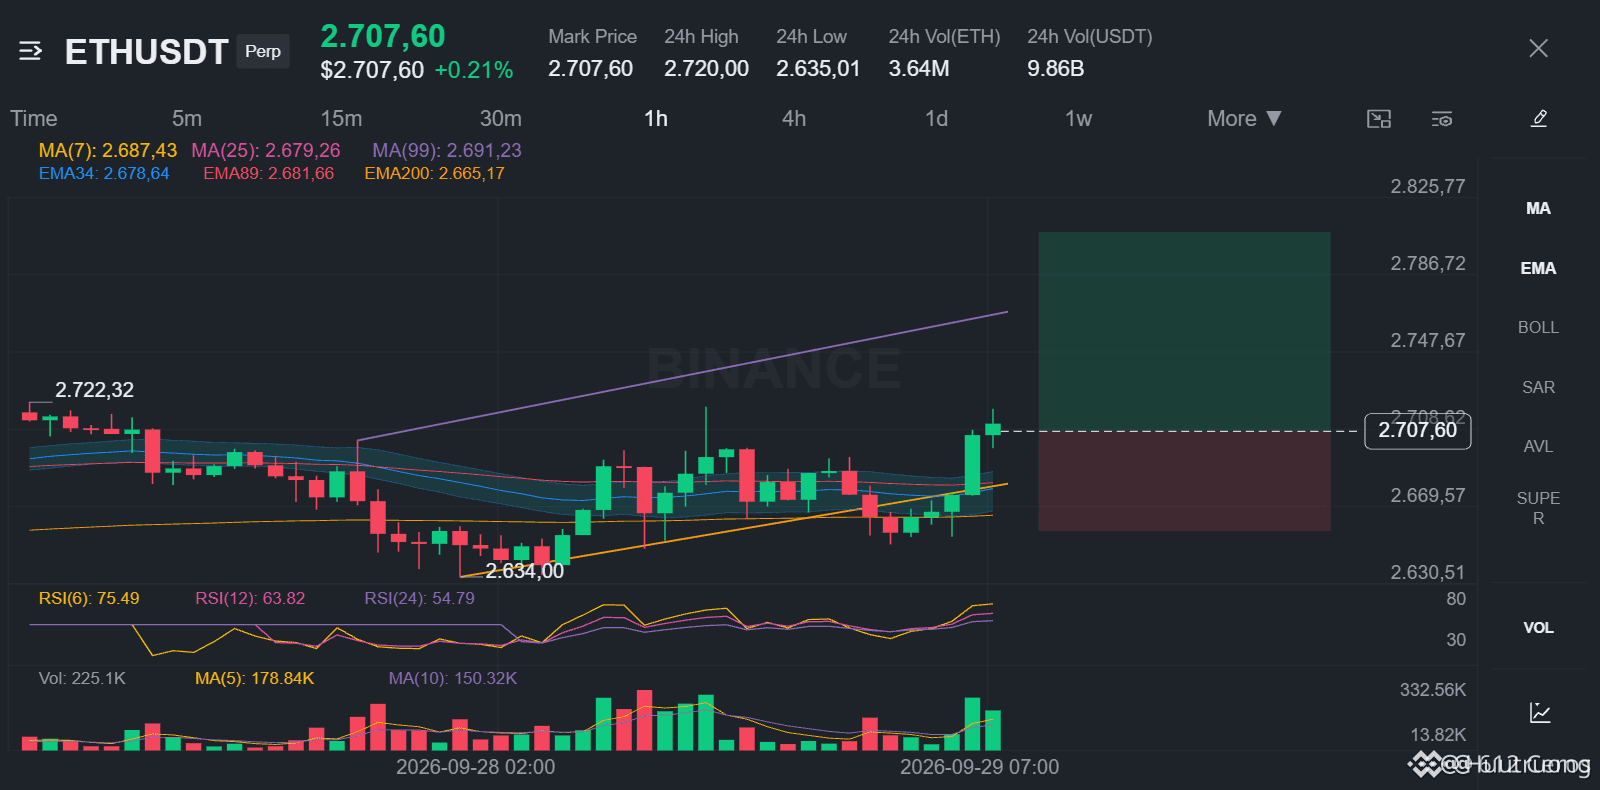
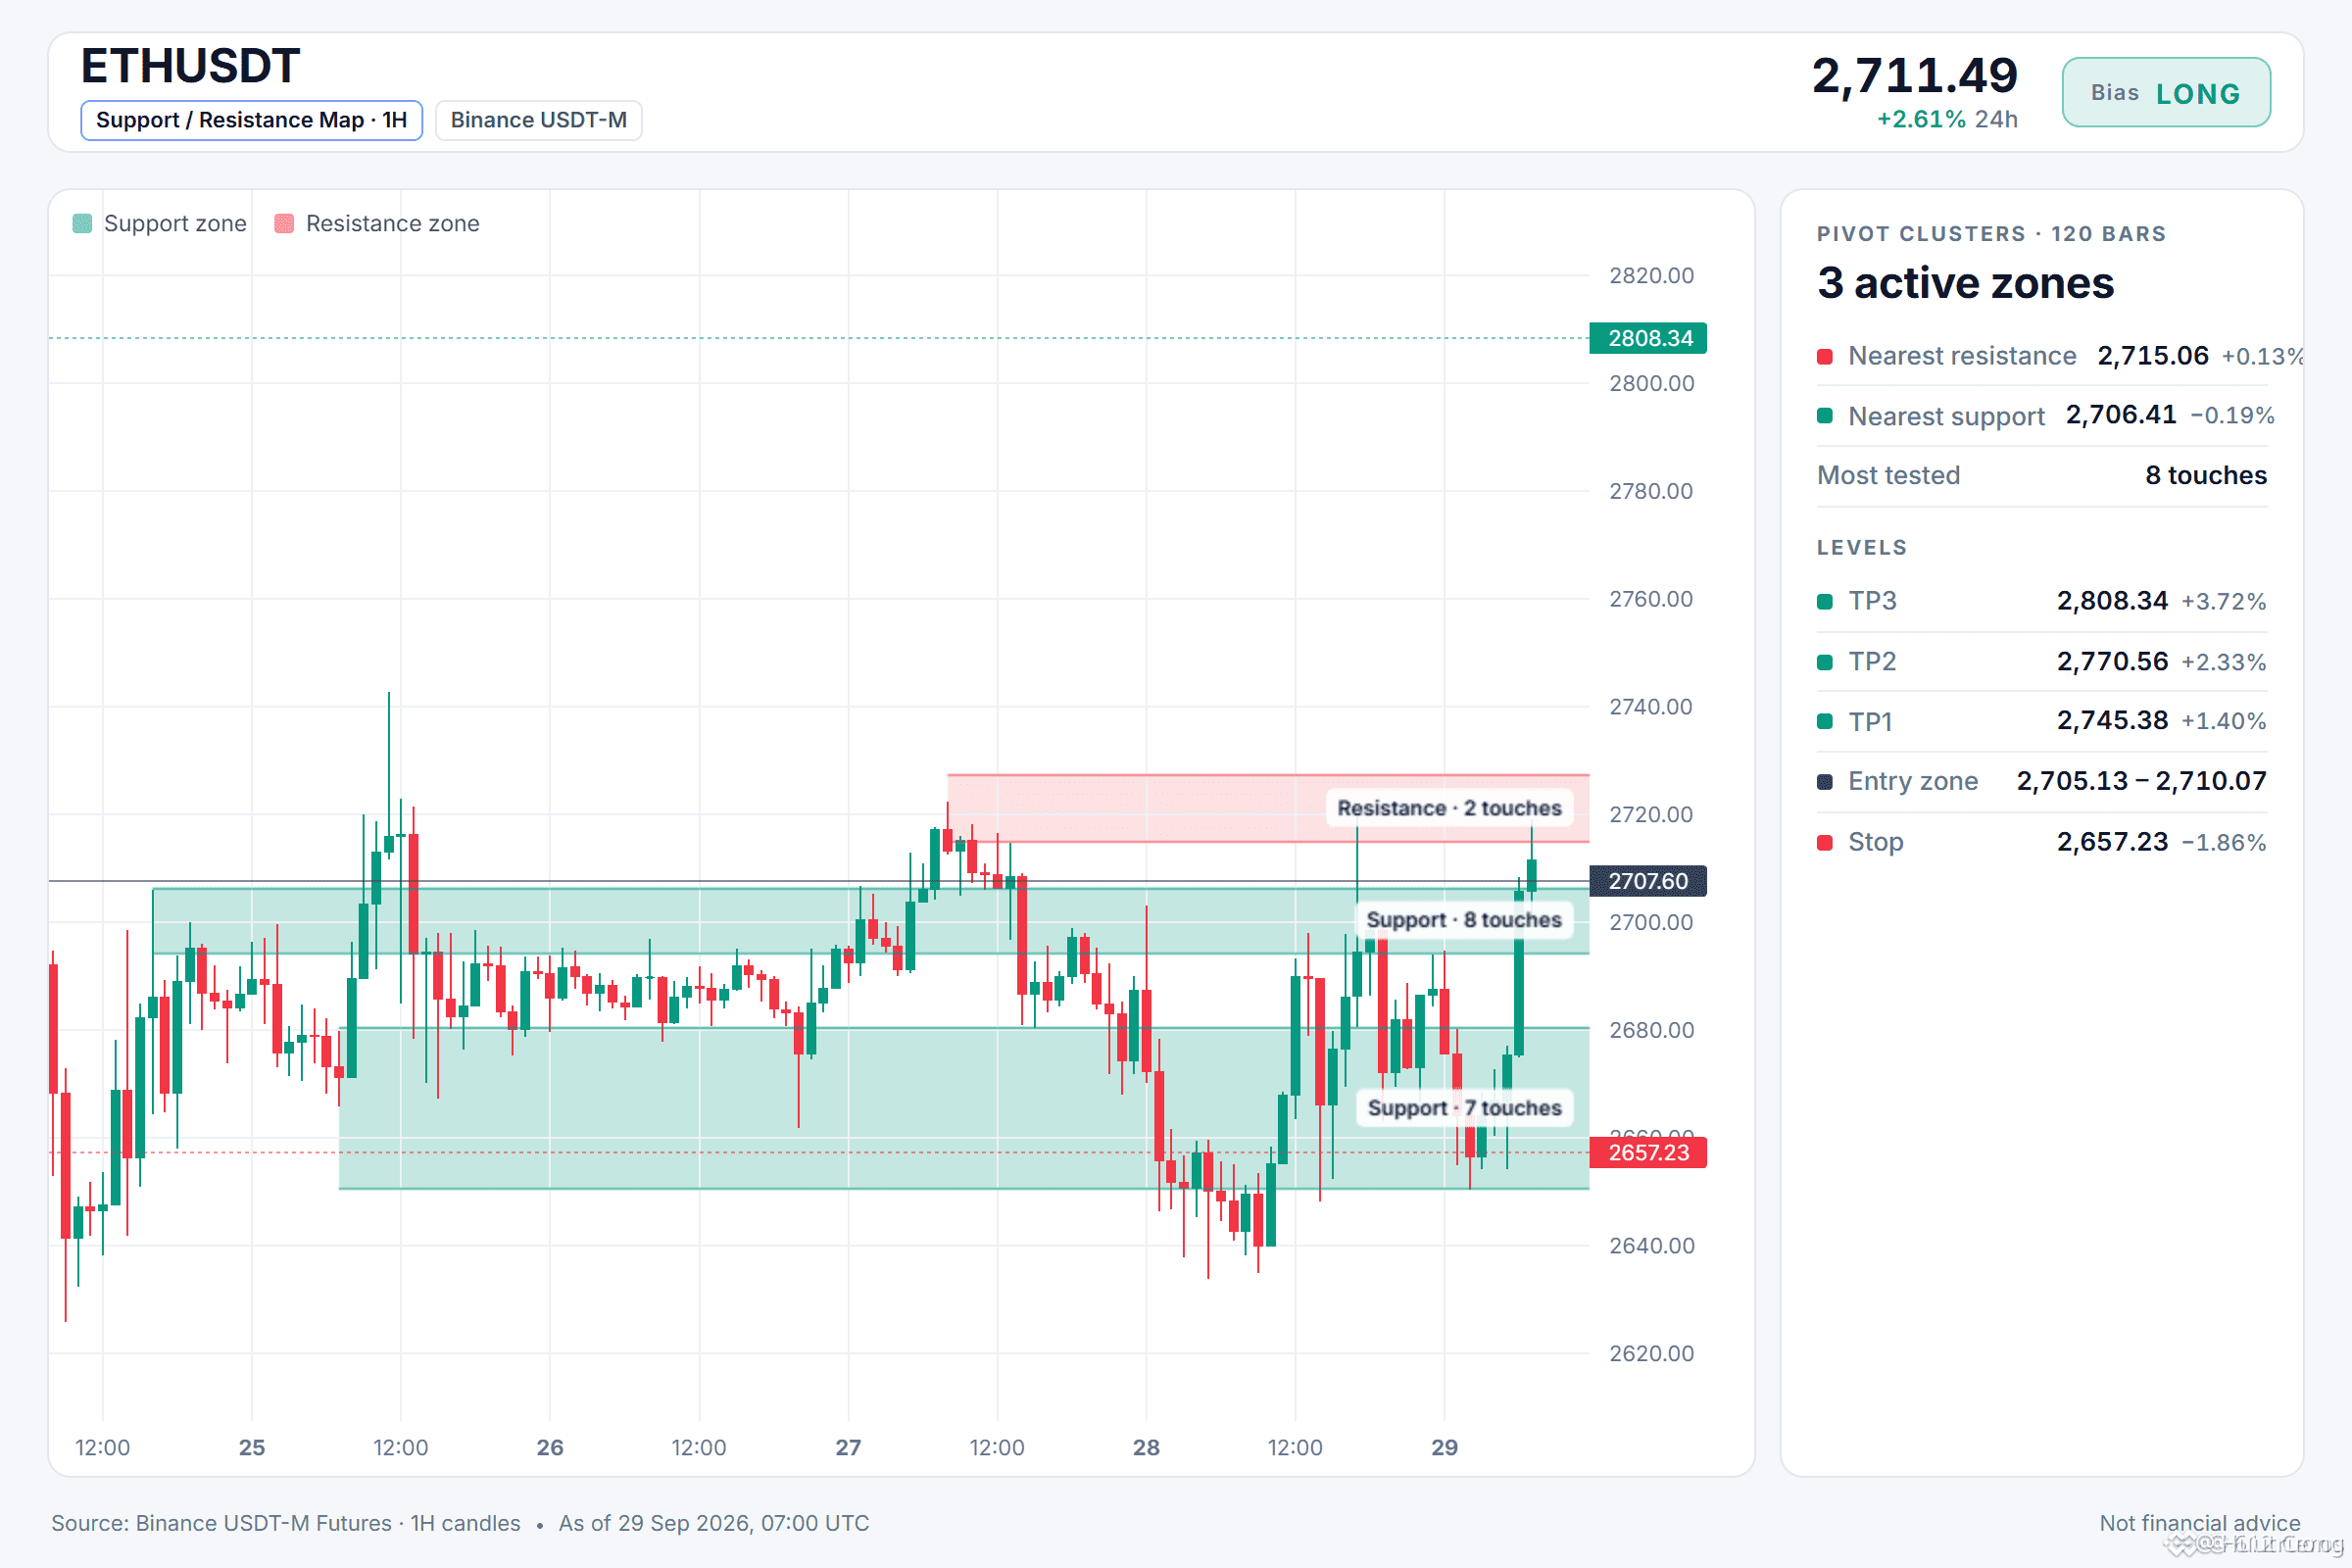
Can ETH break through the 1-hour resistance?
My outlook on ETH today
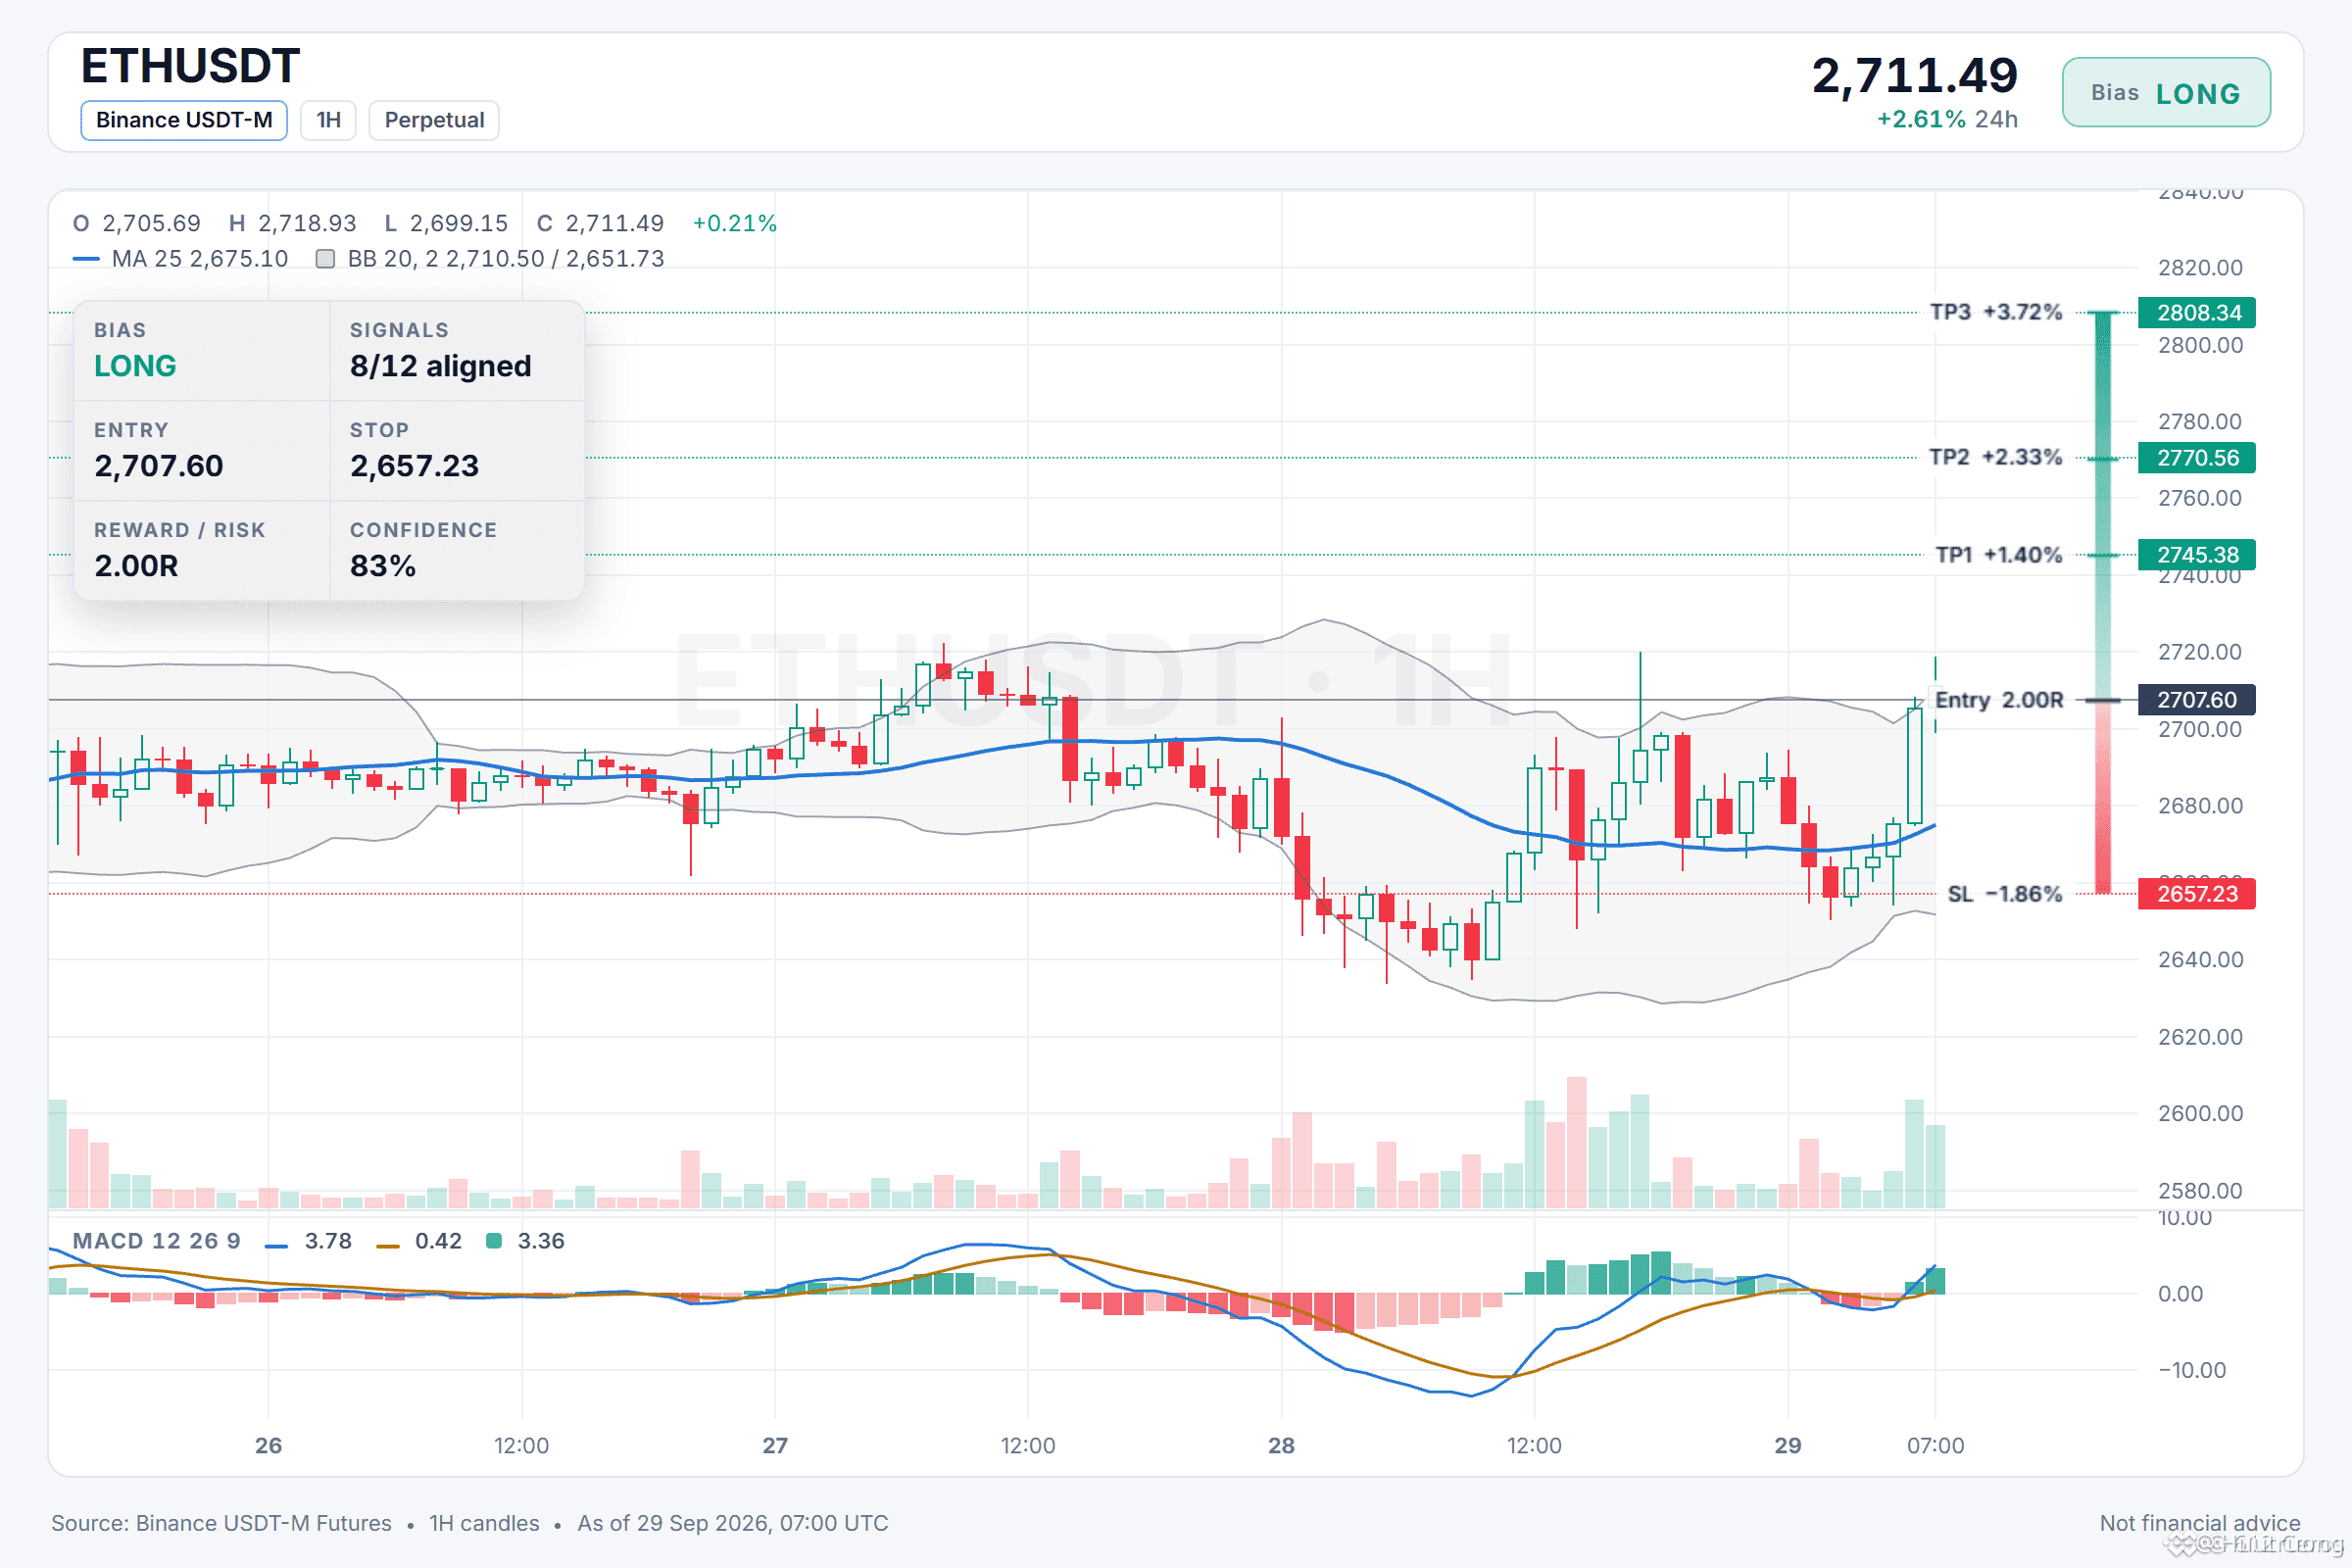
$ETH /USDT · Trend: LONG · 8/12 consensus signals
Technical conclusion: STRONG LONG. 8/12 consensus signals, 0 opposing signals.
✅ Daily trend: price > EMA50 > EMA200, bullish stacking
✅ 4h trend: price > EMA50 > EMA200, bullish stacking
✅ 1h trend: price > EMA50 > EMA200, bullish stacking
✅ Trend strength (ADX/DI, 15m): ADX 28.1, buyers are in control (DI+ 36.8 vs DI− 17.2)
At the moment, there are no factors indicating the opposite direction.
I’m watching ETH to enter a LONG position near 2707.60, with the daily trend rising and the 4h structure stacked above both EMAs. The 1h price is currently about 1.4 ATR above the 1h EMA50, so I’ll be wrong if the 1h price breaks down below 2657.23. I want to see the 1h RSI stay above 55 and the 4h RSI remain above 55, with an invalidation level at 2650.79.
📍 Entry: 2705.13 – 2710.07
🎯 TP1: 2745.38 | TP2: 2770.56 | TP3: 2808.34
🛑 Stop loss: 2657.23
💬 If you short instead of going long, where do you set your stop?
All the setup on the chart 👇
Can ETH break through the 1-hour resistance?
My outlook on ETH today
$ETH /USDT · Trend: LONG · 8/12 consensus signals
Technical conclusion: STRONG LONG. 8/12 consensus signals, 0 opposing signals.
✅ Daily trend: price > EMA50 > EMA200, bullish stacking
✅ 4h trend: price > EMA50 > EMA200, bullish stacking
✅ 1h trend: price > EMA50 > EMA200, bullish stacking
✅ Trend strength (ADX/DI, 15m): ADX 28.1, buyers are in control (DI+ 36.8 vs DI− 17.2)
At the moment, there are no factors indicating the opposite direction.
I’m watching ETH to enter a LONG position near 2707.60, with the daily trend rising and the 4h structure stacked above both EMAs. The 1h price is currently about 1.4 ATR above the 1h EMA50, so I’ll be wrong if the 1h price breaks down below 2657.23. I want to see the 1h RSI stay above 55 and the 4h RSI remain above 55, with an invalidation level at 2650.79.
📍 Entry: 2705.13 – 2710.07
🎯 TP1: 2745.38 | TP2: 2770.56 | TP3: 2808.34
🛑 Stop loss: 2657.23
💬 If you short instead of going long, where do you set your stop?
All the setup on the chart 👇
My outlook on ETH today
$ETH /USDT · Trend: LONG · 8/12 consensus signals
Technical conclusion: STRONG LONG. 8/12 consensus signals, 0 opposing signals.
✅ Daily trend: price > EMA50 > EMA200, bullish stacking
✅ 4h trend: price > EMA50 > EMA200, bullish stacking
✅ 1h trend: price > EMA50 > EMA200, bullish stacking
✅ Trend strength (ADX/DI, 15m): ADX 28.1, buyers are in control (DI+ 36.8 vs DI− 17.2)
At the moment, there are no factors indicating the opposite direction.
I’m watching ETH to enter a LONG position near 2707.60, with the daily trend rising and the 4h structure stacked above both EMAs. The 1h price is currently about 1.4 ATR above the 1h EMA50, so I’ll be wrong if the 1h price breaks down below 2657.23. I want to see the 1h RSI stay above 55 and the 4h RSI remain above 55, with an invalidation level at 2650.79.
📍 Entry: 2705.13 – 2710.07
🎯 TP1: 2745.38 | TP2: 2770.56 | TP3: 2808.34
🛑 Stop loss: 2657.23
💬 If you short instead of going long, where do you set your stop?
All the setup on the chart 👇
51
Log in to explore more content
Join global crypto users on Binance Square
⚡️ Get latest and useful information about crypto.
💬 Trusted by the world’s largest crypto exchange.
👍 Discover real insights from verified creators.
Email / Phone number
Trending Topics
BitcoinClears$85200
2,060 views
93 Discussing
We got the move, and $BTC is standing exactly where we were before the data. That’s what actual patience for a trade looks like.
The data came in mixed but with some important numbers. ADP Non-Farm Employment Change came at 90K vs 73K forecast, while Core PCE came in at 0.2% vs 0.3% expected. Final GDP was also stronger at 2.2% vs 1.5% forecast, while Personal Spending came in at 0.9% vs 0.8% expected. At the same time, Personal Income missed at 0.2% vs 0.5% forecast.
BTC initially surged to $85,600 and is now back where it needs to be. I’m still looking toward the lower ranges at $82,759 and the $80,000 liquidity, because the overhead liquidity is done and dusted.
We had a live session during the data, and during that session we saw the market at $83,800, then $85,600, and then back toward $83,000 and we still didn’t enter a trade.
That’s what patience is.
We can’t force an entry when the market has no clear direction. The same range is still in focus, and we’ll wait for the market to give us the setup.
Let me know, guys, how was the session? And should we have more regular sessions with our respected members so we can have proper discussions regarding the market?
#BitcoinClears$85200 #AltcoinSeasonIndexHoldsAbove60For5Days #USADPAdds90000JobsInSeptember #BitcoinSlipsBelow$84000 #SECToClarifyOnChainFundraisingRules
Crypto_LUX
·18 Likes
·5k views
AltcoinSeasonIndexHoldsAbove60For5Days
14,000 views
581 Discussing
USADPAdds90000JobsInSeptember
4,291 views
291 Discussing