

David-1
373 Posts

David-1
Report
Block User
推特X:@Davidinfuture |all in crypto |实战派全职交易员|币安邀请码:AMJO37NO |精准位置|你导师的导师
12 Following
131 Followers
158 Liked
Posts
All
Quotes
·
--
David's Trading Notes
$ETH September 29, 2026
I. Intraday Plan
Today intraday: mainly ranging/sideways, with reversals as secondary
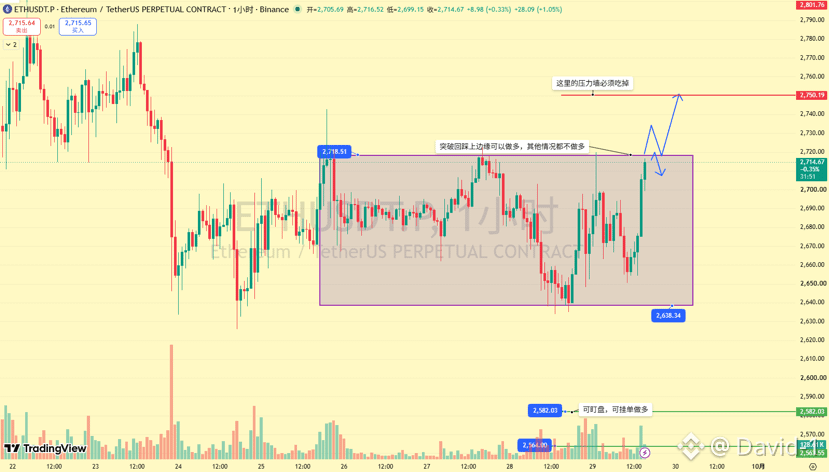
1. For Figure 1, in the purple area (the ranging box). Only when reversal signals appear at the upper and lower edges of the smaller timeframe do you go long or short.
2. At the two edges: 2718 and 2638 on the smaller timeframe provide signals—then do the reversal.
3. If you want to chase a long: watch for a breakout above 2718, then enter long only after a pullback that holds (doesn't break). Target: 2750.
4. 2750 is a pressure wall with very thick stacked liquidity. You must first eat through this supply; only then can the bulls really ignite.
Wait for the signal! Wait for the signal! Wait for the signal!
In the ranging zone, if you don't wait for the signal, are you M?
II. View
During the adjustment phase, sideways movement indicates strength. Be patient and wait for opportunities at key levels. The data on Wednesday and Friday will become the fuel that ignites the market.
What ranging fears most is chasing in the middle of the mountain. Either wait for the edges, or wait for 2718 to pull back and hold. If it hasn’t reached the edge and hasn’t given the reversal signal, then be patient and wait for the key level.
#黄金跌至4144美元
#eth
{future}(ETHUSDT)
David's Trading Notes
$ETH September 29, 2026
I. Intraday Plan
Today intraday: mainly ranging/sideways, with reversals as secondary
1. For Figure 1, in the purple area (the ranging box). Only when reversal signals appear at the upper and lower edges of the smaller timeframe do you go long or short.
2. At the two edges: 2718 and 2638 on the smaller timeframe provide signals—then do the reversal.
3. If you want to chase a long: watch for a breakout above 2718, then enter long only after a pullback that holds (doesn't break). Target: 2750.
4. 2750 is a pressure wall with very thick stacked liquidity. You must first eat through this supply; only then can the bulls really ignite.
Wait for the signal! Wait for the signal! Wait for the signal!
In the ranging zone, if you don't wait for the signal, are you M?
II. View
During the adjustment phase, sideways movement indicates strength. Be patient and wait for opportunities at key levels. The data on Wednesday and Friday will become the fuel that ignites the market.
What ranging fears most is chasing in the middle of the mountain. Either wait for the edges, or wait for 2718 to pull back and hold. If it hasn’t reached the edge and hasn’t given the reversal signal, then be patient and wait for the key level.
#黄金跌至4144美元
#eth
$ETH September 29, 2026
I. Intraday Plan
Today intraday: mainly ranging/sideways, with reversals as secondary
1. For Figure 1, in the purple area (the ranging box). Only when reversal signals appear at the upper and lower edges of the smaller timeframe do you go long or short.
2. At the two edges: 2718 and 2638 on the smaller timeframe provide signals—then do the reversal.
3. If you want to chase a long: watch for a breakout above 2718, then enter long only after a pullback that holds (doesn't break). Target: 2750.
4. 2750 is a pressure wall with very thick stacked liquidity. You must first eat through this supply; only then can the bulls really ignite.
Wait for the signal! Wait for the signal! Wait for the signal!
In the ranging zone, if you don't wait for the signal, are you M?
II. View
During the adjustment phase, sideways movement indicates strength. Be patient and wait for opportunities at key levels. The data on Wednesday and Friday will become the fuel that ignites the market.
What ranging fears most is chasing in the middle of the mountain. Either wait for the edges, or wait for 2718 to pull back and hold. If it hasn’t reached the edge and hasn’t given the reversal signal, then be patient and wait for the key level.
#黄金跌至4144美元
#eth
1
315
·
--
$ETH People say the crypto market is all about cycles—“one cycle every four years.” But I’m increasingly feeling that this one really is different.
What’s different isn’t the pattern, but the rhythm of time and space has changed.
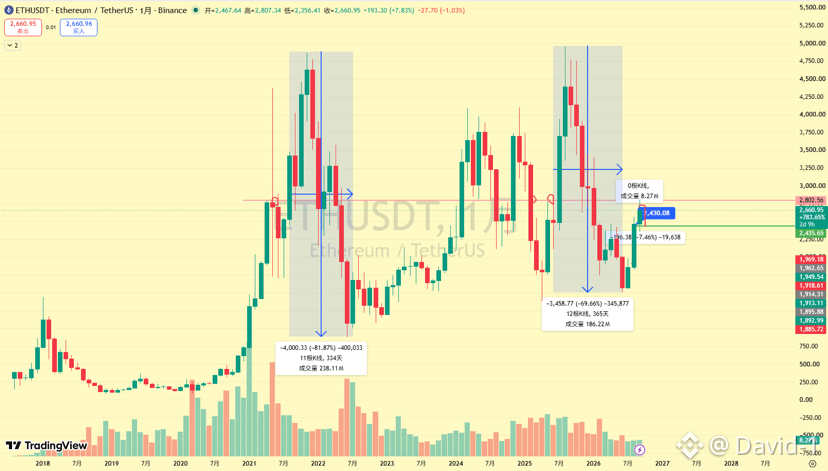
Historically, whether it’s the transition from a bear to a bull market, or a major-level rebound within a bear market, when ETH enters a deep correction from its high, the decline often reaches around 80%.
Remember this number.
Now look at this round:
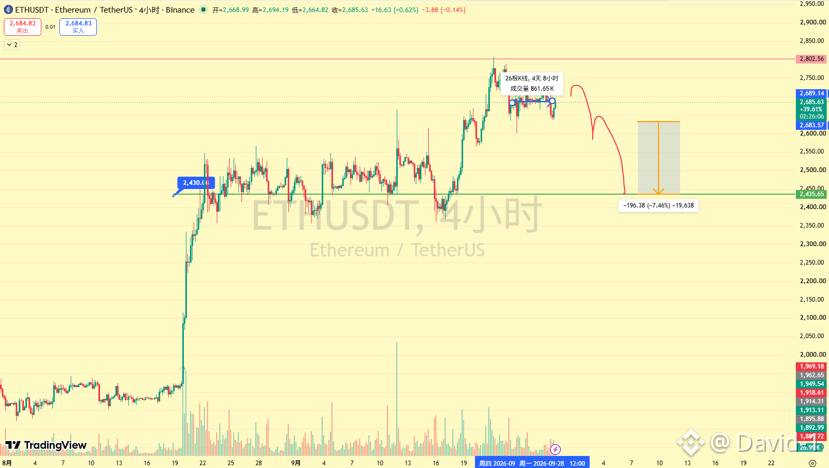
In terms of space, the correction hasn’t fully played out yet. If we estimate it using the historical 80% retracement level, ETH’s corresponding position should be around 2430.
That’s what I mean by “different.”
Looking at the time * space* dimension of this correction: in the past, corrections of this scale often lasted a long time. But this time, the correction cycle is being shortened again and again.
Now look at the chart:
1. The major-level correction has already played out. Now we’re entering the most grinding “tail-end行情” — not necessarily the steepest decline, but usually the most torturous: repeated tug-of-war, repeated shakeouts.
2. The position where the correction has retraced 80% is roughly around 2430. Unless there’s a macro-level black swan event, this is likely to serve as the end point of the correction.
Cycles haven’t disappeared. It’s just that this time, the timing and magnitude of the cycle may be getting repriced.
{future}(ETHUSDT)
$ETH People say the crypto market is all about cycles—“one cycle every four years.” But I’m increasingly feeling that this one really is different.
What’s different isn’t the pattern, but the rhythm of time and space has changed.
Historically, whether it’s the transition from a bear to a bull market, or a major-level rebound within a bear market, when ETH enters a deep correction from its high, the decline often reaches around 80%.
Remember this number.
Now look at this round:
In terms of space, the correction hasn’t fully played out yet. If we estimate it using the historical 80% retracement level, ETH’s corresponding position should be around 2430.
That’s what I mean by “different.”
Looking at the time * space* dimension of this correction: in the past, corrections of this scale often lasted a long time. But this time, the correction cycle is being shortened again and again.
Now look at the chart:
1. The major-level correction has already played out. Now we’re entering the most grinding “tail-end行情” — not necessarily the steepest decline, but usually the most torturous: repeated tug-of-war, repeated shakeouts.
2. The position where the correction has retraced 80% is roughly around 2430. Unless there’s a macro-level black swan event, this is likely to serve as the end point of the correction.
Cycles haven’t disappeared. It’s just that this time, the timing and magnitude of the cycle may be getting repriced.
What’s different isn’t the pattern, but the rhythm of time and space has changed.
Historically, whether it’s the transition from a bear to a bull market, or a major-level rebound within a bear market, when ETH enters a deep correction from its high, the decline often reaches around 80%.
Remember this number.
Now look at this round:
In terms of space, the correction hasn’t fully played out yet. If we estimate it using the historical 80% retracement level, ETH’s corresponding position should be around 2430.
That’s what I mean by “different.”
Looking at the time * space* dimension of this correction: in the past, corrections of this scale often lasted a long time. But this time, the correction cycle is being shortened again and again.
Now look at the chart:
1. The major-level correction has already played out. Now we’re entering the most grinding “tail-end行情” — not necessarily the steepest decline, but usually the most torturous: repeated tug-of-war, repeated shakeouts.
2. The position where the correction has retraced 80% is roughly around 2430. Unless there’s a macro-level black swan event, this is likely to serve as the end point of the correction.
Cycles haven’t disappeared. It’s just that this time, the timing and magnitude of the cycle may be getting repriced.
1.3k
·
--
David’s Trading Notes
$ETH September 28, 2026
During the Mid-Autumn Festival period, this pushed through to the final defensive line of the shorts at 2742, but it failed to break through and carry on—so adjustments are here.
I. Short-term
Today intraday: mainly focus on shorting at higher levels, with long positions as a secondary.
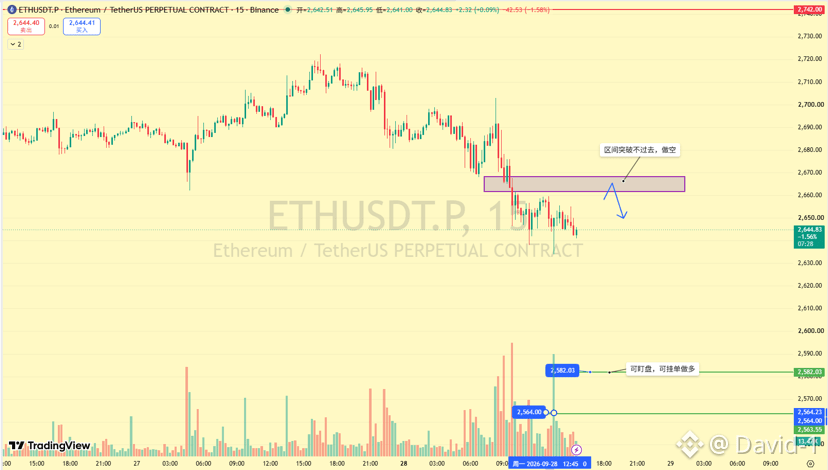
1. Rebound into the 2660–2667 zone; when a five-minute candle forms a bearish engulfing (yin within yang), then short again.
2. If the 2660–2667 zone is not broken, don’t look for a bullish reversal. If it does break through, I’ll update in real time 👗.
3. Below, major-level support: 2582 and 2564—shorts are likely to see a reversal around here. Enter long again after a five-minute bullish engulfing (yang covering yin). If you place orders, use a 1% stop loss.
4. Adjustments have arrived; don’t chase or place long positions recklessly without reaching the key levels. There are too many bear traps and fake signals.
II. Scenario Planning
2742 is the watershed level from the previous phase. After the breakout failed, the main storyline is the adjustment. Above 2500 is the adjustment area I consider more favorable. Once it reaches 2500, consider adding positions (medium/long-term) and holding. In this bull market cycle, the big target of 6000–7000 is something that’s quite visible #Bitwise提交NEAR现货ETF最终招股书 #eth
{future}(ETHUSDT)
David’s Trading Notes
$ETH September 28, 2026
During the Mid-Autumn Festival period, this pushed through to the final defensive line of the shorts at 2742, but it failed to break through and carry on—so adjustments are here.
I. Short-term
Today intraday: mainly focus on shorting at higher levels, with long positions as a secondary.
1. Rebound into the 2660–2667 zone; when a five-minute candle forms a bearish engulfing (yin within yang), then short again.
2. If the 2660–2667 zone is not broken, don’t look for a bullish reversal. If it does break through, I’ll update in real time 👗.
3. Below, major-level support: 2582 and 2564—shorts are likely to see a reversal around here. Enter long again after a five-minute bullish engulfing (yang covering yin). If you place orders, use a 1% stop loss.
4. Adjustments have arrived; don’t chase or place long positions recklessly without reaching the key levels. There are too many bear traps and fake signals.
II. Scenario Planning
2742 is the watershed level from the previous phase. After the breakout failed, the main storyline is the adjustment. Above 2500 is the adjustment area I consider more favorable. Once it reaches 2500, consider adding positions (medium/long-term) and holding. In this bull market cycle, the big target of 6000–7000 is something that’s quite visible #Bitwise提交NEAR现货ETF最终招股书 #eth
$ETH September 28, 2026
During the Mid-Autumn Festival period, this pushed through to the final defensive line of the shorts at 2742, but it failed to break through and carry on—so adjustments are here.
I. Short-term
Today intraday: mainly focus on shorting at higher levels, with long positions as a secondary.
1. Rebound into the 2660–2667 zone; when a five-minute candle forms a bearish engulfing (yin within yang), then short again.
2. If the 2660–2667 zone is not broken, don’t look for a bullish reversal. If it does break through, I’ll update in real time 👗.
3. Below, major-level support: 2582 and 2564—shorts are likely to see a reversal around here. Enter long again after a five-minute bullish engulfing (yang covering yin). If you place orders, use a 1% stop loss.
4. Adjustments have arrived; don’t chase or place long positions recklessly without reaching the key levels. There are too many bear traps and fake signals.
II. Scenario Planning
2742 is the watershed level from the previous phase. After the breakout failed, the main storyline is the adjustment. Above 2500 is the adjustment area I consider more favorable. Once it reaches 2500, consider adding positions (medium/long-term) and holding. In this bull market cycle, the big target of 6000–7000 is something that’s quite visible #Bitwise提交NEAR现货ETF最终招股书 #eth
228
·
--
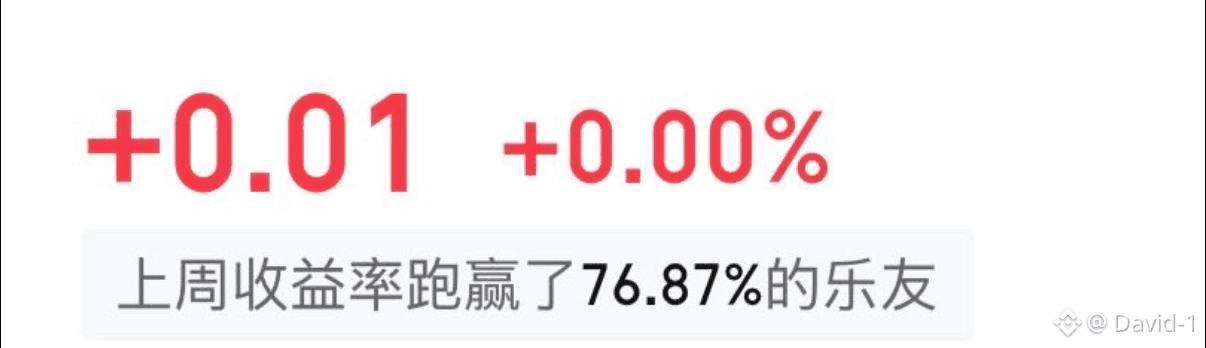
Seeing a picture, hahaha, I have to say, Big A is still unbeatable. We’ve been professionally trained; normally we wouldn’t laugh…#BigA
Seeing a picture, hahaha, I have to say, Big A is still unbeatable. We’ve been professionally trained; normally we wouldn’t laugh…#BigA
1
331
·
--
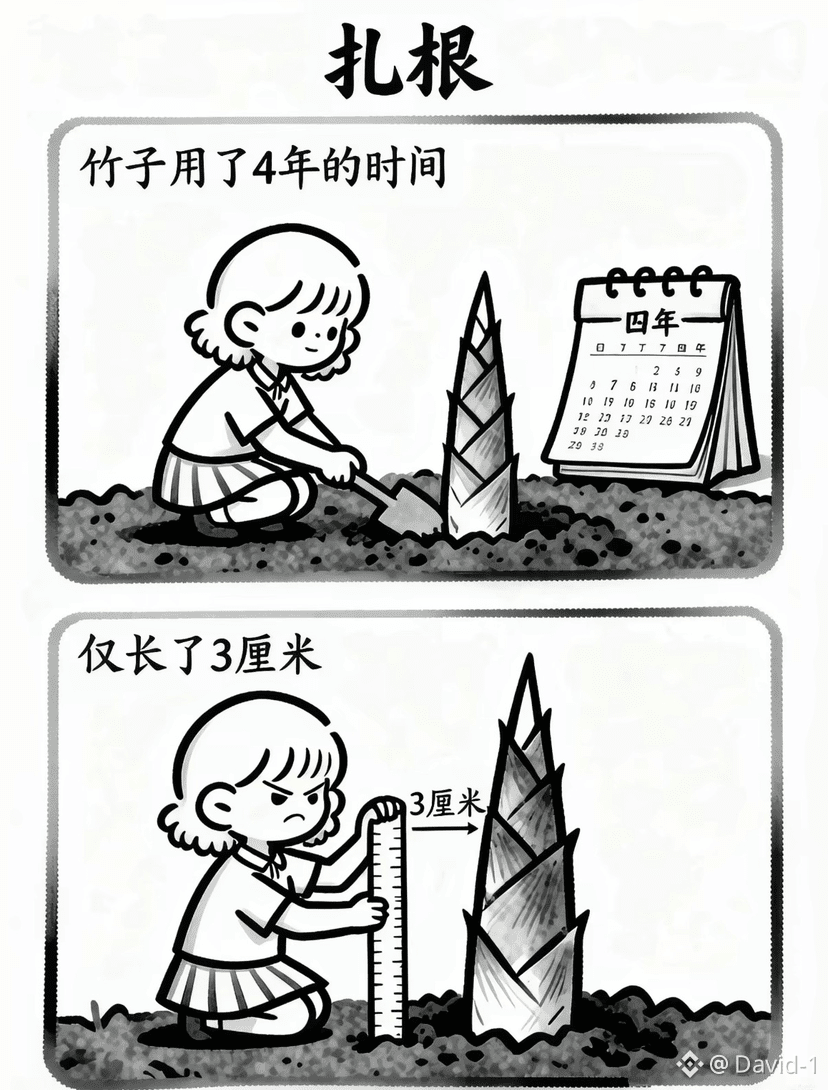
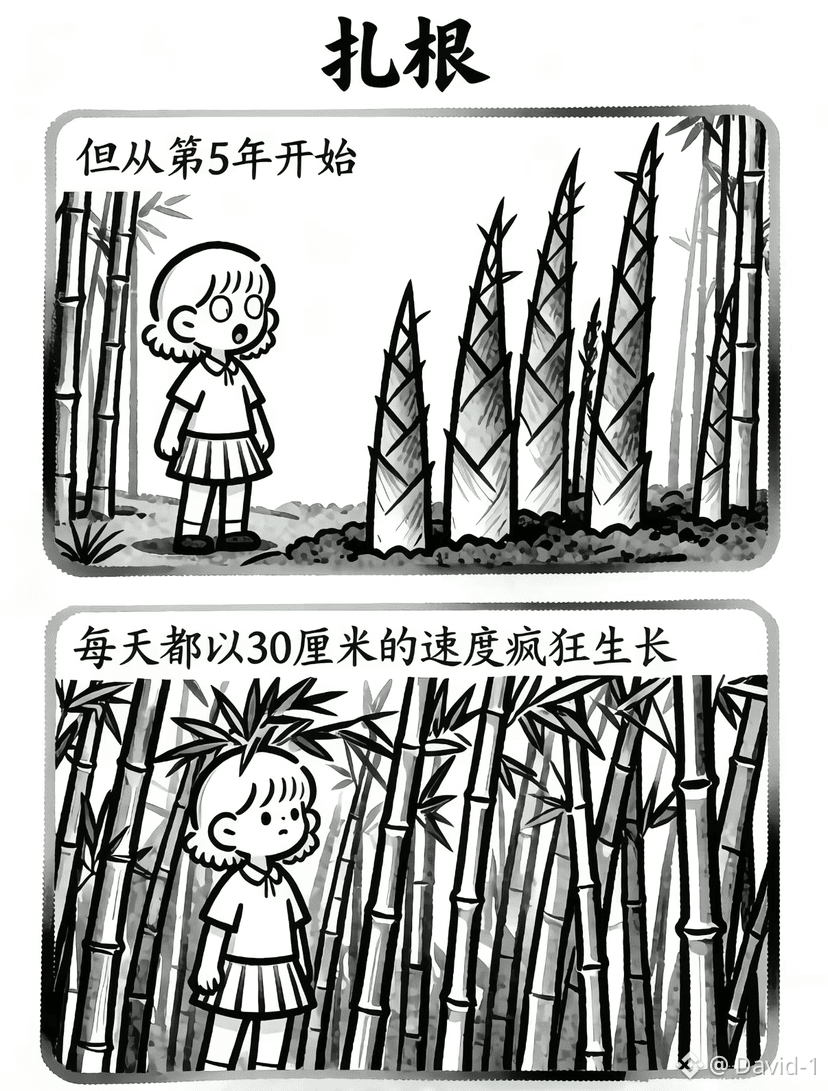
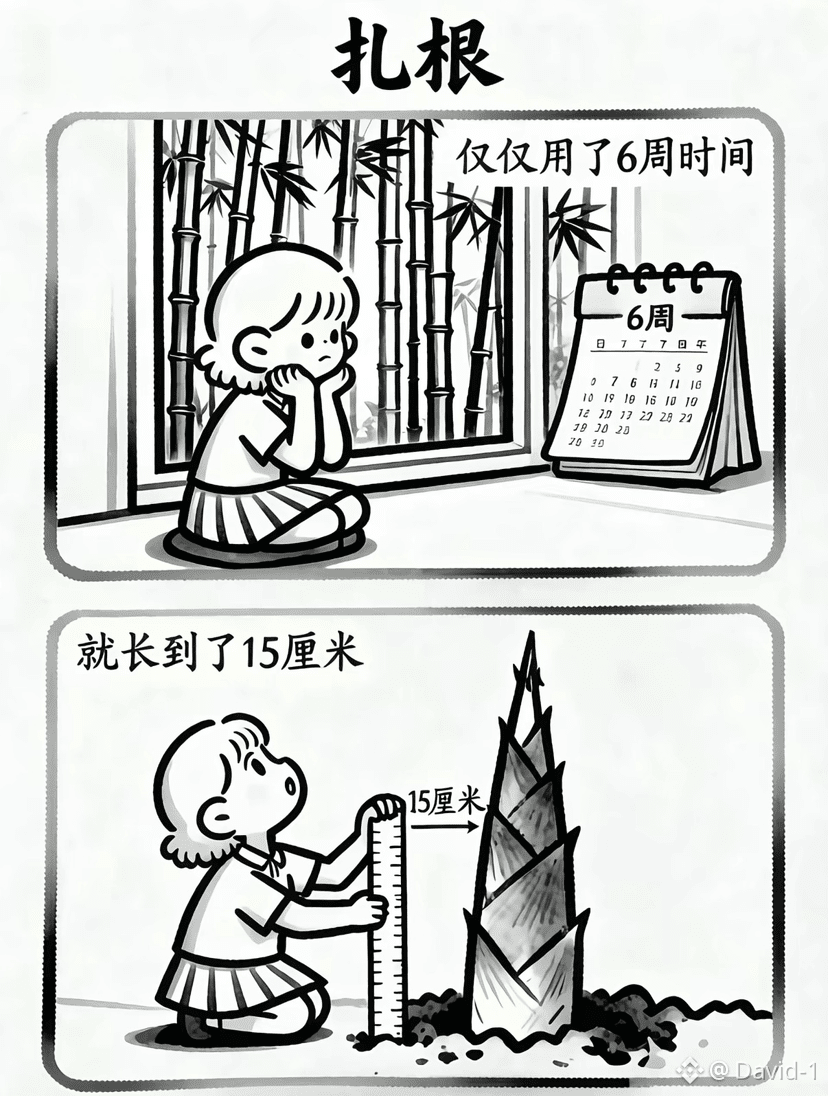
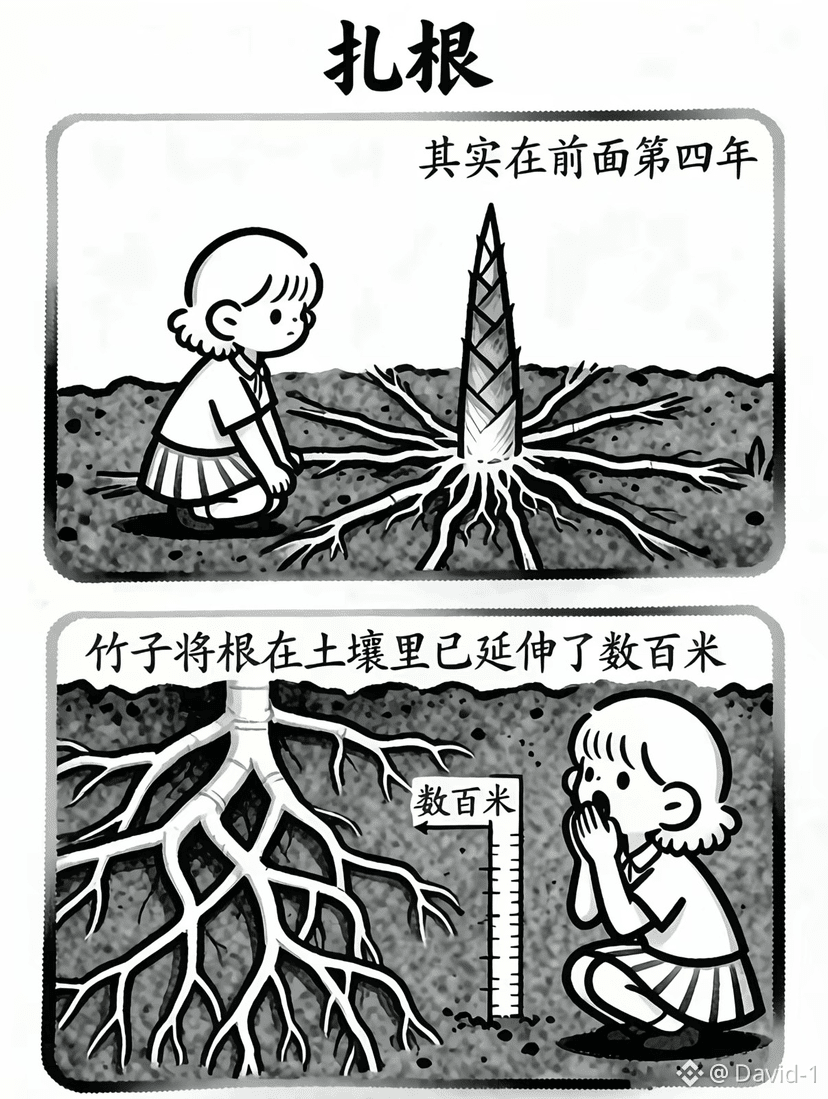
Rooted in #BTC
The extension of rootedness; the prerequisite is always “preparation”;
When the opportunity comes, that’s when you can seize it.
The crypto world is much the same. If you truly love it, calm down and focus on learning, and improve your trading system;
In the beginning, learning may take two or three years before you make any money. But once you’ve mastered it, the returns from those two or three years can be earned back within a single month.
Rooted in #BTC
The extension of rootedness; the prerequisite is always “preparation”;
When the opportunity comes, that’s when you can seize it.
The crypto world is much the same. If you truly love it, calm down and focus on learning, and improve your trading system;
In the beginning, learning may take two or three years before you make any money. But once you’ve mastered it, the returns from those two or three years can be earned back within a single month.
The extension of rootedness; the prerequisite is always “preparation”;
When the opportunity comes, that’s when you can seize it.
The crypto world is much the same. If you truly love it, calm down and focus on learning, and improve your trading system;
In the beginning, learning may take two or three years before you make any money. But once you’ve mastered it, the returns from those two or three years can be earned back within a single month.
310
·
--
On-chain entities holding 100,000 BTC suddenly reduced their holdings by 25,000 BTC after BTC broke above $86,000. This is the first major de-risking action by this group since April this year.
At present, it seems the market may be able to absorb this wave of selling pressure, though the pressure may not have fully transmitted to the secondary market yet. We should closely monitor subsequent actions to determine whether this is a one-off event or a sustained trend.
This could affect BTC’s price performance over the next 2–3 months
#本周Strategy与Strive增持2305枚BTC
On-chain entities holding 100,000 BTC suddenly reduced their holdings by 25,000 BTC after BTC broke above $86,000. This is the first major de-risking action by this group since April this year.
At present, it seems the market may be able to absorb this wave of selling pressure, though the pressure may not have fully transmitted to the secondary market yet. We should closely monitor subsequent actions to determine whether this is a one-off event or a sustained trend.
This could affect BTC’s price performance over the next 2–3 months
#本周Strategy与Strive增持2305枚BTC
At present, it seems the market may be able to absorb this wave of selling pressure, though the pressure may not have fully transmitted to the secondary market yet. We should closely monitor subsequent actions to determine whether this is a one-off event or a sustained trend.
This could affect BTC’s price performance over the next 2–3 months
#本周Strategy与Strive增持2305枚BTC
199
·
--
No ability to catch hackers.
No ability to do security management.
And even less courage to admit their own mistakes.
So all they can do is vent at a tool that turns a hacker into a way to make money.
It’s like a group of people driving Teslas robbing a bank. Instead of going after the robbers or reporting to the police, they all go to Musk and demand that all Tesla cars stop working.
Ridiculous.
No ability to catch hackers.
No ability to do security management.
And even less courage to admit their own mistakes.
So all they can do is vent at a tool that turns a hacker into a way to make money.
It’s like a group of people driving Teslas robbing a bank. Instead of going after the robbers or reporting to the police, they all go to Musk and demand that all Tesla cars stop working.
Ridiculous.
No ability to do security management.
And even less courage to admit their own mistakes.
So all they can do is vent at a tool that turns a hacker into a way to make money.
It’s like a group of people driving Teslas robbing a bank. Instead of going after the robbers or reporting to the police, they all go to Musk and demand that all Tesla cars stop working.
Ridiculous.
41
·
--
Wishing everyone a Happy Mid-Autumn Festival 🌕🎑
Binance can even take me on travels spanning thousands of miles.
If you see this post, you’ll definitely stay safe and make big money!
Wishing everyone a Happy Mid-Autumn Festival 🌕🎑
Binance can even take me on travels spanning thousands of miles.
If you see this post, you’ll definitely stay safe and make big money!
Binance can even take me on travels spanning thousands of miles.
If you see this post, you’ll definitely stay safe and make big money!

126
·
--
I can’t understand how people are still bearish just because interest rates are being raised, and think the bottom of the cycle hasn’t arrived yet:
1. Trends are a good thing. If you go back and look at BTC’s full cycle, any quarterly candle increase that fully contains the previous quarterly candle’s decline is the first candle of a trend reversal.
2. Most of BTC’s upside happens during the rate-hike cycle. Besides, the rate is already lower than the 2023 peak, and back then BTC was between 25k and 28k. If you believe that a high-rate BTC can’t rise, then you’ll just keep missing out.
#美联储10月加息概率升至69.7%
I can’t understand how people are still bearish just because interest rates are being raised, and think the bottom of the cycle hasn’t arrived yet:
1. Trends are a good thing. If you go back and look at BTC’s full cycle, any quarterly candle increase that fully contains the previous quarterly candle’s decline is the first candle of a trend reversal.
2. Most of BTC’s upside happens during the rate-hike cycle. Besides, the rate is already lower than the 2023 peak, and back then BTC was between 25k and 28k. If you believe that a high-rate BTC can’t rise, then you’ll just keep missing out.
#美联储10月加息概率升至69.7%
1. Trends are a good thing. If you go back and look at BTC’s full cycle, any quarterly candle increase that fully contains the previous quarterly candle’s decline is the first candle of a trend reversal.
2. Most of BTC’s upside happens during the rate-hike cycle. Besides, the rate is already lower than the 2023 peak, and back then BTC was between 25k and 28k. If you believe that a high-rate BTC can’t rise, then you’ll just keep missing out.
#美联储10月加息概率升至69.7%
141
·
--
David’s Trading Notes
2026.9.24 $ETH
1. Review
Now the smaller timeframe has already exited the correction. Looking at the Ethereum candlesticks, will the correction expand further?
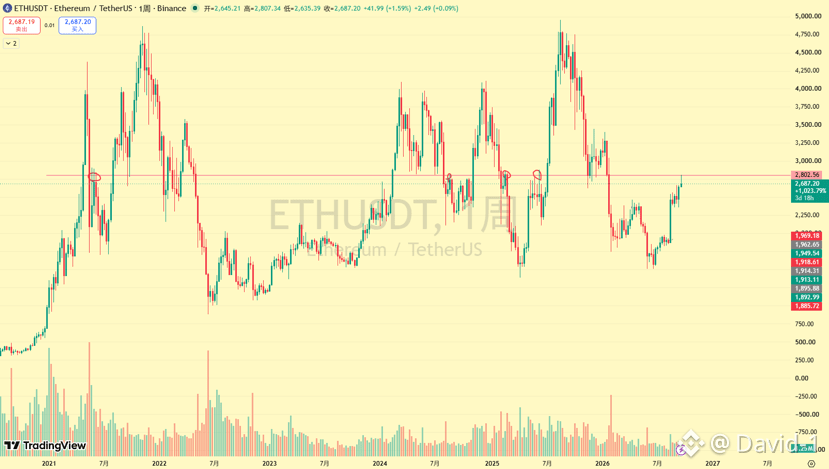
(Figure 1) “Locking a boat to find a sword” — throughout history, whenever price reaches 2800, there has been a major reaction. See how far this time’s reaction can go.
On the macro side, the dominant factors affecting the U.S. dollar index, inflation, U.S.-Iran relations, and interest rates are: oil prices. Once oil prices are dealt with, everyone’s situation improves.
Today intraday: mainly short setups, with longs as a supplement.
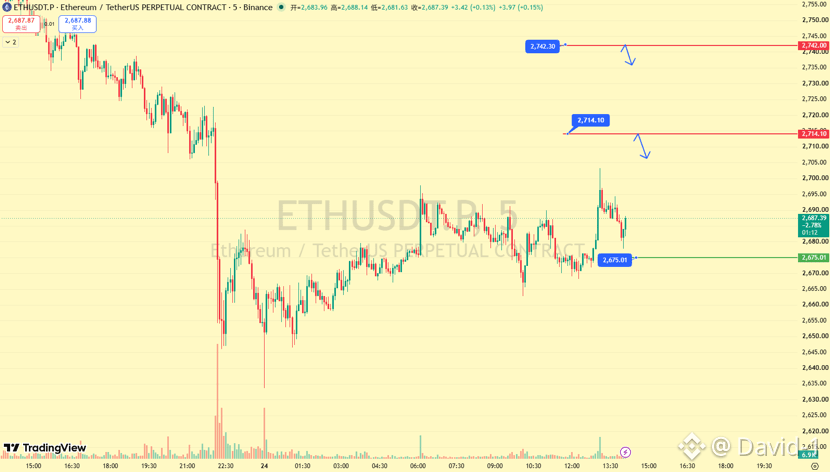
(Figure 2) Going long
1. Watch 2675: wait for a five-minute bullish engulfing (yang engulfing yin) signal, then enter.
Going short
1. Watch 2714: wait for a five-minute bearish engulfing (yin engulfing yang) signal, then enter.
2. After 2742 breaks down, the former support turns into resistance. If the five-minute chart gives a signal again, consider shorting.
2. As for the structure of the market itself
I scanned the whole market. Ethereum’s path and走势 are almost the most standard. Considering volatility, formations, and the trading/positioning experience, for current operation focus and mind (投心思操作), it’s truly “one分耕耘一分收获.” Focus on Ethereum first, then Bitcoin, and altcoins (altcoins only take one wave and don’t chase). #美国拟推动美元稳定币海外使用
{future}(ETHUSDT)
David’s Trading Notes
2026.9.24 $ETH
1. Review
Now the smaller timeframe has already exited the correction. Looking at the Ethereum candlesticks, will the correction expand further?
(Figure 1) “Locking a boat to find a sword” — throughout history, whenever price reaches 2800, there has been a major reaction. See how far this time’s reaction can go.
On the macro side, the dominant factors affecting the U.S. dollar index, inflation, U.S.-Iran relations, and interest rates are: oil prices. Once oil prices are dealt with, everyone’s situation improves.
Today intraday: mainly short setups, with longs as a supplement.
(Figure 2) Going long
1. Watch 2675: wait for a five-minute bullish engulfing (yang engulfing yin) signal, then enter.
Going short
1. Watch 2714: wait for a five-minute bearish engulfing (yin engulfing yang) signal, then enter.
2. After 2742 breaks down, the former support turns into resistance. If the five-minute chart gives a signal again, consider shorting.
2. As for the structure of the market itself
I scanned the whole market. Ethereum’s path and走势 are almost the most standard. Considering volatility, formations, and the trading/positioning experience, for current operation focus and mind (投心思操作), it’s truly “one分耕耘一分收获.” Focus on Ethereum first, then Bitcoin, and altcoins (altcoins only take one wave and don’t chase). #美国拟推动美元稳定币海外使用
2026.9.24 $ETH
1. Review
Now the smaller timeframe has already exited the correction. Looking at the Ethereum candlesticks, will the correction expand further?
(Figure 1) “Locking a boat to find a sword” — throughout history, whenever price reaches 2800, there has been a major reaction. See how far this time’s reaction can go.
On the macro side, the dominant factors affecting the U.S. dollar index, inflation, U.S.-Iran relations, and interest rates are: oil prices. Once oil prices are dealt with, everyone’s situation improves.
Today intraday: mainly short setups, with longs as a supplement.
(Figure 2) Going long
1. Watch 2675: wait for a five-minute bullish engulfing (yang engulfing yin) signal, then enter.
Going short
1. Watch 2714: wait for a five-minute bearish engulfing (yin engulfing yang) signal, then enter.
2. After 2742 breaks down, the former support turns into resistance. If the five-minute chart gives a signal again, consider shorting.
2. As for the structure of the market itself
I scanned the whole market. Ethereum’s path and走势 are almost the most standard. Considering volatility, formations, and the trading/positioning experience, for current operation focus and mind (投心思操作), it’s truly “one分耕耘一分收获.” Focus on Ethereum first, then Bitcoin, and altcoins (altcoins only take one wave and don’t chase). #美国拟推动美元稳定币海外使用
196
·
--
Obviously, this is almost impossible to happen.
Cancel cryptocurrency restrictions
= Allow free cross-border movement of capital
= Massive capital flight
= Accelerate capital outflows
= Put further strain on the fiscal and financial system
= Further worsen government stability.
So, at the end of the day, it boils down to one thing:
Canceling cryptocurrency restrictions doesn’t just mean opening up the crypto market—it also means opening the channel for capital outflows.
That’s also why, in countries where high inflation, capital controls, and currency pressure coexist, governments usually won’t easily and completely lift cryptocurrency restrictions.
#美国拟推动美元稳定币海外使用
Obviously, this is almost impossible to happen.
Cancel cryptocurrency restrictions
= Allow free cross-border movement of capital
= Massive capital flight
= Accelerate capital outflows
= Put further strain on the fiscal and financial system
= Further worsen government stability.
So, at the end of the day, it boils down to one thing:
Canceling cryptocurrency restrictions doesn’t just mean opening up the crypto market—it also means opening the channel for capital outflows.
That’s also why, in countries where high inflation, capital controls, and currency pressure coexist, governments usually won’t easily and completely lift cryptocurrency restrictions.
#美国拟推动美元稳定币海外使用
Cancel cryptocurrency restrictions
= Allow free cross-border movement of capital
= Massive capital flight
= Accelerate capital outflows
= Put further strain on the fiscal and financial system
= Further worsen government stability.
So, at the end of the day, it boils down to one thing:
Canceling cryptocurrency restrictions doesn’t just mean opening up the crypto market—it also means opening the channel for capital outflows.
That’s also why, in countries where high inflation, capital controls, and currency pressure coexist, governments usually won’t easily and completely lift cryptocurrency restrictions.
#美国拟推动美元稳定币海外使用
148
·
--
David's Trading Notes
2026.9.23$ETH
I. Today still focuses on adjustments as the main strategy, with going long on pullbacks as the auxiliary; watch the pullback—don’t force changes; go long in the direction of the trend
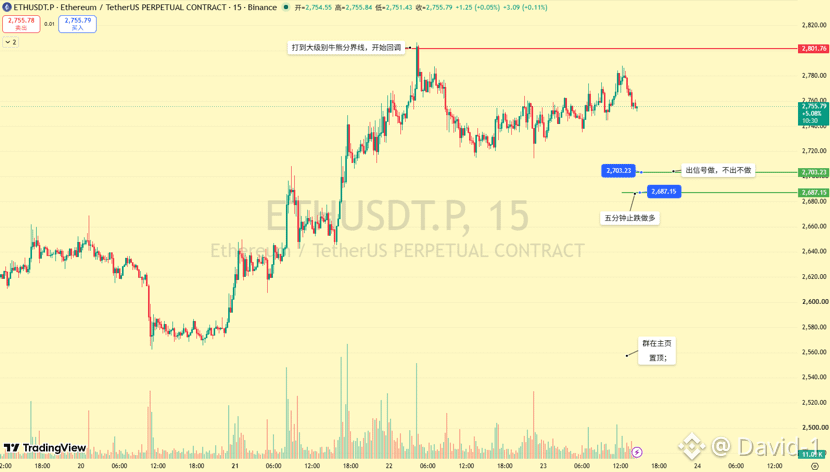
The pressure at 2800 versus ETH is roughly equivalent to BTC moving about 100,000, so it’s normal to see an adjustment here. The key is to watch ETH’s strength during the adjustment: if strong, expect a retracement of 2–4%; if weak, 5–8%.
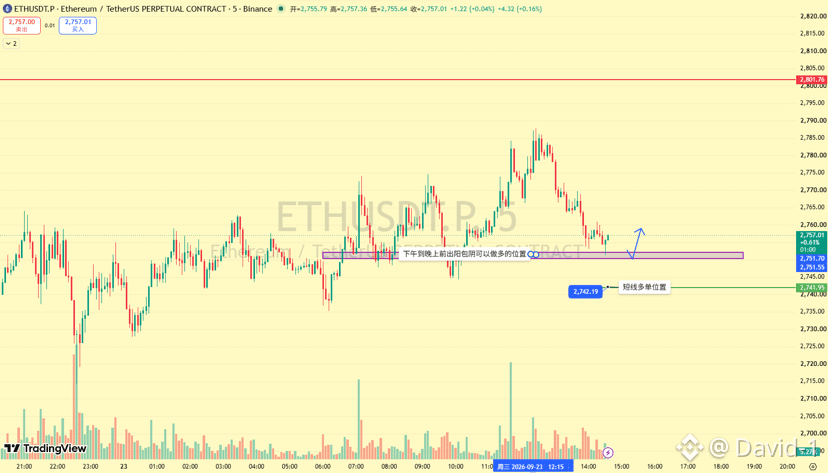
1. Short-term going long: the purple area is 2750. Go long after a five-minute bullish engulfing candle (yang inside covering yin); if there’s no signal, don’t trade.
After the 2742 wick/pin, go long once you get a bullish engulfing candle; if there’s no signal, don’t trade.
2. Two unchanged positions on the higher timeframe: 2703 and 2687. On the five-minute chart, after a pin-wick candle followed by a bullish engulfing (yang包阴) that gives a signal, enter longs within that range.
II. There’s pressure on the higher timeframe. If you can’t do well in two directions, and you tend to get stuck in a back-and-forth “left-right brain sparring” pattern, then follow the trend. Use the depth and/or shallowness of the adjustment to gauge the retracement amount.
The low-long framework from yesterday is still in place, but the positions are split into two layers: the nearer zone and the higher timeframe zone, to avoid chasing a short mid-slope. Execute your plan—execute the plan you set.
{future}(ETHUSDT)
#BitwiseNEAR质押ETP资产突破1亿美元 #140亿美元比特币期权周五到期
David's Trading Notes
2026.9.23$ETH
I. Today still focuses on adjustments as the main strategy, with going long on pullbacks as the auxiliary; watch the pullback—don’t force changes; go long in the direction of the trend
The pressure at 2800 versus ETH is roughly equivalent to BTC moving about 100,000, so it’s normal to see an adjustment here. The key is to watch ETH’s strength during the adjustment: if strong, expect a retracement of 2–4%; if weak, 5–8%.
1. Short-term going long: the purple area is 2750. Go long after a five-minute bullish engulfing candle (yang inside covering yin); if there’s no signal, don’t trade.
After the 2742 wick/pin, go long once you get a bullish engulfing candle; if there’s no signal, don’t trade.
2. Two unchanged positions on the higher timeframe: 2703 and 2687. On the five-minute chart, after a pin-wick candle followed by a bullish engulfing (yang包阴) that gives a signal, enter longs within that range.
II. There’s pressure on the higher timeframe. If you can’t do well in two directions, and you tend to get stuck in a back-and-forth “left-right brain sparring” pattern, then follow the trend. Use the depth and/or shallowness of the adjustment to gauge the retracement amount.
The low-long framework from yesterday is still in place, but the positions are split into two layers: the nearer zone and the higher timeframe zone, to avoid chasing a short mid-slope. Execute your plan—execute the plan you set.
#BitwiseNEAR质押ETP资产突破1亿美元 #140亿美元比特币期权周五到期
2026.9.23$ETH
I. Today still focuses on adjustments as the main strategy, with going long on pullbacks as the auxiliary; watch the pullback—don’t force changes; go long in the direction of the trend
The pressure at 2800 versus ETH is roughly equivalent to BTC moving about 100,000, so it’s normal to see an adjustment here. The key is to watch ETH’s strength during the adjustment: if strong, expect a retracement of 2–4%; if weak, 5–8%.
1. Short-term going long: the purple area is 2750. Go long after a five-minute bullish engulfing candle (yang inside covering yin); if there’s no signal, don’t trade.
After the 2742 wick/pin, go long once you get a bullish engulfing candle; if there’s no signal, don’t trade.
2. Two unchanged positions on the higher timeframe: 2703 and 2687. On the five-minute chart, after a pin-wick candle followed by a bullish engulfing (yang包阴) that gives a signal, enter longs within that range.
II. There’s pressure on the higher timeframe. If you can’t do well in two directions, and you tend to get stuck in a back-and-forth “left-right brain sparring” pattern, then follow the trend. Use the depth and/or shallowness of the adjustment to gauge the retracement amount.
The low-long framework from yesterday is still in place, but the positions are split into two layers: the nearer zone and the higher timeframe zone, to avoid chasing a short mid-slope. Execute your plan—execute the plan you set.
#BitwiseNEAR质押ETP资产突破1亿美元 #140亿美元比特币期权周五到期
1
199
·
--
In the past two days, I finally saw that on the BN Square, quite a few bloggers have begun to believe that this round is a “trend reversal,” no longer a “technical rebound.” After all, from a technical perspective, if BTC breaks above the previous rebound high of 82,850, it means the downward structure has been invalidated.
But the truth is, we made this point clear 20 days ago—when the first green signal appeared in the red/green zones.
Price is just the result of matching in the secondary market, while on-chain data is the most direct behavioral feedback from all participants. That’s exactly what makes it so appealing: it may lag in the short term, but in the long run it often leads.
If you’ve been following me since 2023, you won’t be unfamiliar with this indicator: the green zone between two red zones corresponds to a segment of trend.
A whole bull cycle is made up of N such trend segments.
As you can see now, the indicator is currently in a clear green-signal zone. What is there left to doubt? Remember! Pullbacks are opportunities.
The dishes are almost all on the table, and you’re still hesitating about whether to move quickly—are you waiting for someone else to feed you?...... Mute the noise, stay firm in your conviction, and trust yourself.
Only when the next Confidence Index leaves the green zone and enters the red zone—then that’s the signal that a trend is over. My “👗” will update first and share my view.
You’re always welcome to join Binance with me—we can discuss together
#AI股持续上涨还有哪些投资机会
$BTC
{future}(BTCUSDT)
In the past two days, I finally saw that on the BN Square, quite a few bloggers have begun to believe that this round is a “trend reversal,” no longer a “technical rebound.” After all, from a technical perspective, if BTC breaks above the previous rebound high of 82,850, it means the downward structure has been invalidated.
But the truth is, we made this point clear 20 days ago—when the first green signal appeared in the red/green zones.
Price is just the result of matching in the secondary market, while on-chain data is the most direct behavioral feedback from all participants. That’s exactly what makes it so appealing: it may lag in the short term, but in the long run it often leads.
If you’ve been following me since 2023, you won’t be unfamiliar with this indicator: the green zone between two red zones corresponds to a segment of trend.
A whole bull cycle is made up of N such trend segments.
As you can see now, the indicator is currently in a clear green-signal zone. What is there left to doubt? Remember! Pullbacks are opportunities.
The dishes are almost all on the table, and you’re still hesitating about whether to move quickly—are you waiting for someone else to feed you?...... Mute the noise, stay firm in your conviction, and trust yourself.
Only when the next Confidence Index leaves the green zone and enters the red zone—then that’s the signal that a trend is over. My “👗” will update first and share my view.
You’re always welcome to join Binance with me—we can discuss together
#AI股持续上涨还有哪些投资机会
$BTC
But the truth is, we made this point clear 20 days ago—when the first green signal appeared in the red/green zones.
Price is just the result of matching in the secondary market, while on-chain data is the most direct behavioral feedback from all participants. That’s exactly what makes it so appealing: it may lag in the short term, but in the long run it often leads.
If you’ve been following me since 2023, you won’t be unfamiliar with this indicator: the green zone between two red zones corresponds to a segment of trend.
A whole bull cycle is made up of N such trend segments.
As you can see now, the indicator is currently in a clear green-signal zone. What is there left to doubt? Remember! Pullbacks are opportunities.
The dishes are almost all on the table, and you’re still hesitating about whether to move quickly—are you waiting for someone else to feed you?...... Mute the noise, stay firm in your conviction, and trust yourself.
Only when the next Confidence Index leaves the green zone and enters the red zone—then that’s the signal that a trend is over. My “👗” will update first and share my view.
You’re always welcome to join Binance with me—we can discuss together
#AI股持续上涨还有哪些投资机会
$BTC
159
·
--
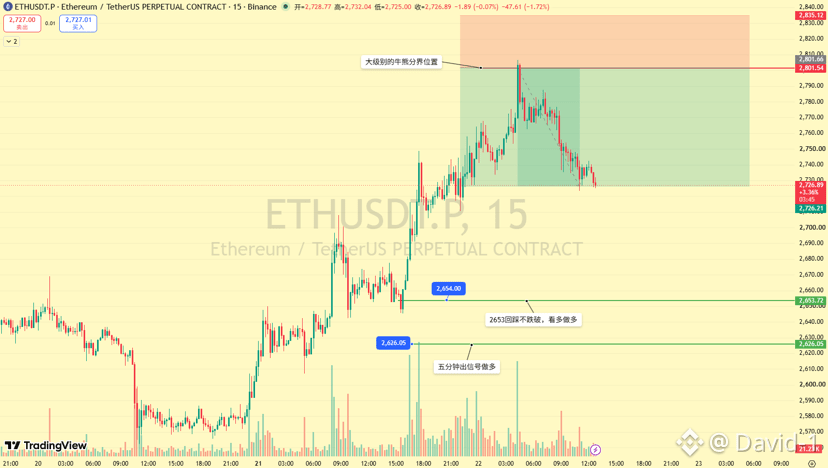
Everyone’s feeling it! $ETH
Front-Cannon, this part
Prophet, this part
Eats the meat, this part
Gets the final results, this part
{future}(ETHUSDT)
Everyone’s feeling it! $ETH
Front-Cannon, this part
Prophet, this part
Eats the meat, this part
Gets the final results, this part
Front-Cannon, this part
Prophet, this part
Eats the meat, this part
Gets the final results, this part
David-1
·
--
David’s Trading Notes
2026.9.21 $ETH
1. Intraday
Today intraday: focus on going long when possible, and treat shorts as secondary
Go Long|
1. Watch 2653 on the 5-minute chart: if the pullback doesn’t break, go long after a bullish engulfing (sunny engulfing) following a bearish candle.
2. After the 2626 wick/probe goes down and then a bullish candle closes, go long; you can also place a pending order with a stop loss of 20 USD.
Go Short|
1. Watch the 2796–2801 range; consider shorting after a 5-minute bearish engulfing forms (or a bearish-after-bullish pattern) and the signal appears.
2. Only take the short when the signal is confirmed; if no signal appears, don’t trade.
2. Trading Logic
This week the bulls have been very strong. After the price broke down from 2460 and then recovered (reclaiming it), the direction was turned back to low-long bias—this is a primary trend market. Trade in line with the trend and reduce actions against the market;
Shorts are only for the higher 2796–2801 area. If price hasn’t reached this zone, don’t treat intraday consolidation as a high-short opportunity. Don’t randomly make moves.
Step by step, improve your trading system. If you don’t know how to build a trading system, follow me on Binance and I’ll give you the answer when the time comes 🫵
#以太坊突破2700美元
#MichaelSaylor暗示增持BTC
2026.9.21 $ETH
1. Intraday
Today intraday: focus on going long when possible, and treat shorts as secondary
Go Long|
1. Watch 2653 on the 5-minute chart: if the pullback doesn’t break, go long after a bullish engulfing (sunny engulfing) following a bearish candle.
2. After the 2626 wick/probe goes down and then a bullish candle closes, go long; you can also place a pending order with a stop loss of 20 USD.
Go Short|
1. Watch the 2796–2801 range; consider shorting after a 5-minute bearish engulfing forms (or a bearish-after-bullish pattern) and the signal appears.
2. Only take the short when the signal is confirmed; if no signal appears, don’t trade.
2. Trading Logic
This week the bulls have been very strong. After the price broke down from 2460 and then recovered (reclaiming it), the direction was turned back to low-long bias—this is a primary trend market. Trade in line with the trend and reduce actions against the market;
Shorts are only for the higher 2796–2801 area. If price hasn’t reached this zone, don’t treat intraday consolidation as a high-short opportunity. Don’t randomly make moves.
Step by step, improve your trading system. If you don’t know how to build a trading system, follow me on Binance and I’ll give you the answer when the time comes 🫵
#以太坊突破2700美元
#MichaelSaylor暗示增持BTC
112
·
--
#ETH
David's Trading Notes
2026.9.22
1. About positions / intraday plan
Yesterday we followed the trend and went long: “buy more and you’ll be fed,” plus the only provided shorting zone 2796-01 was reversed after entering long.
Today’s market characterization: mainly a correction. But we won’t trade this correction itself as the main theme; use low longs as a secondary approach and only trade with the trend—long setups.
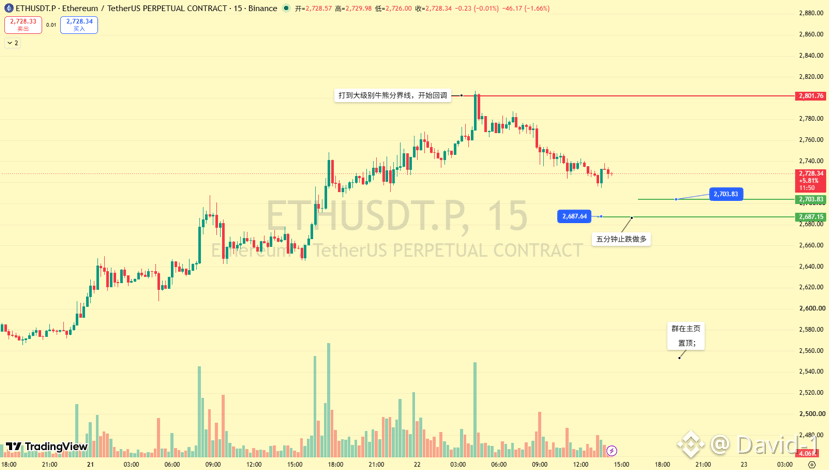
1) For longs, watch two levels: 2703 and 2687. Only enter after a 5-minute bullish engulfing that turns bearish candles into bullish; if the signal doesn’t appear, don’t trade.
2. Viewpoints
The market has reached a historical pivot between long and short positions. When 2800 is touched, it gets smashed. The structure is complete and now there is a need for correction. Next we’ll see how deep the correction goes.
2703 and 2687 are the pullback/entry points within the correction. If you get a bullish engulfing pattern, then follow the larger direction and go long. If you don’t, don’t try to guess the bottom.
Taking profit doesn’t mean you should short today too. “Trade the correction, don’t trade the correction” is the discipline: don’t chase shorts anymore—only take them again when a pullback provides a signal.
Trading can’t mean you get full profit every day, and you can’t win forever. When it’s a good market, go hard. When it’s a bad market, slow down the pace. #XRP上涨8%
#比特币现货ETF净流入9.99亿美元
#ETH
David's Trading Notes
2026.9.22
1. About positions / intraday plan
Yesterday we followed the trend and went long: “buy more and you’ll be fed,” plus the only provided shorting zone 2796-01 was reversed after entering long.
Today’s market characterization: mainly a correction. But we won’t trade this correction itself as the main theme; use low longs as a secondary approach and only trade with the trend—long setups.
1) For longs, watch two levels: 2703 and 2687. Only enter after a 5-minute bullish engulfing that turns bearish candles into bullish; if the signal doesn’t appear, don’t trade.
2. Viewpoints
The market has reached a historical pivot between long and short positions. When 2800 is touched, it gets smashed. The structure is complete and now there is a need for correction. Next we’ll see how deep the correction goes.
2703 and 2687 are the pullback/entry points within the correction. If you get a bullish engulfing pattern, then follow the larger direction and go long. If you don’t, don’t try to guess the bottom.
Taking profit doesn’t mean you should short today too. “Trade the correction, don’t trade the correction” is the discipline: don’t chase shorts anymore—only take them again when a pullback provides a signal.
Trading can’t mean you get full profit every day, and you can’t win forever. When it’s a good market, go hard. When it’s a bad market, slow down the pace. #XRP上涨8%
#比特币现货ETF净流入9.99亿美元
David's Trading Notes
2026.9.22
1. About positions / intraday plan
Yesterday we followed the trend and went long: “buy more and you’ll be fed,” plus the only provided shorting zone 2796-01 was reversed after entering long.
Today’s market characterization: mainly a correction. But we won’t trade this correction itself as the main theme; use low longs as a secondary approach and only trade with the trend—long setups.
1) For longs, watch two levels: 2703 and 2687. Only enter after a 5-minute bullish engulfing that turns bearish candles into bullish; if the signal doesn’t appear, don’t trade.
2. Viewpoints
The market has reached a historical pivot between long and short positions. When 2800 is touched, it gets smashed. The structure is complete and now there is a need for correction. Next we’ll see how deep the correction goes.
2703 and 2687 are the pullback/entry points within the correction. If you get a bullish engulfing pattern, then follow the larger direction and go long. If you don’t, don’t try to guess the bottom.
Taking profit doesn’t mean you should short today too. “Trade the correction, don’t trade the correction” is the discipline: don’t chase shorts anymore—only take them again when a pullback provides a signal.
Trading can’t mean you get full profit every day, and you can’t win forever. When it’s a good market, go hard. When it’s a bad market, slow down the pace. #XRP上涨8%
#比特币现货ETF净流入9.99亿美元
280
·
--
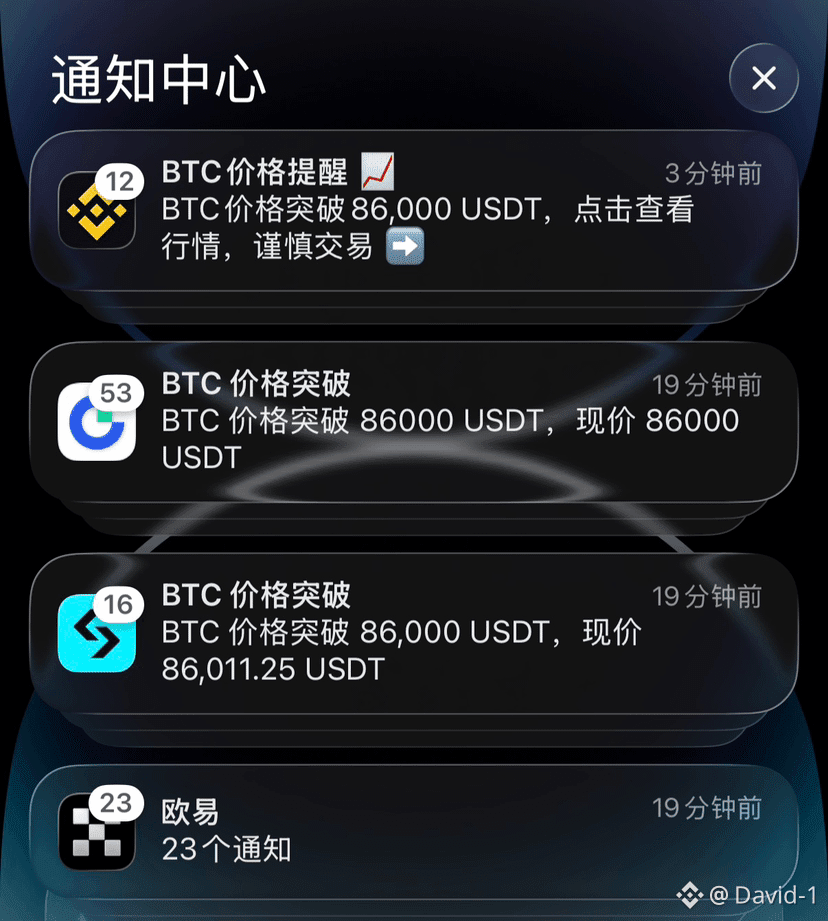
The big pancake finally heard my call! #BTC
E guards, wake up all of you!
After holding it in for so long, it’s finally our turn to fight a comeback
We endured what had to be endured and stayed up through what had to be stayed up—now we’ll see if this round can pull out the market trend that belongs to us
When the opportunity comes, go all in
E guards, assemble! This time, charge! 🚀
The big pancake finally heard my call! #BTC
E guards, wake up all of you!
After holding it in for so long, it’s finally our turn to fight a comeback
We endured what had to be endured and stayed up through what had to be stayed up—now we’ll see if this round can pull out the market trend that belongs to us
When the opportunity comes, go all in
E guards, assemble! This time, charge! 🚀
E guards, wake up all of you!
After holding it in for so long, it’s finally our turn to fight a comeback
We endured what had to be endured and stayed up through what had to be stayed up—now we’ll see if this round can pull out the market trend that belongs to us
When the opportunity comes, go all in
E guards, assemble! This time, charge! 🚀
358
·
--
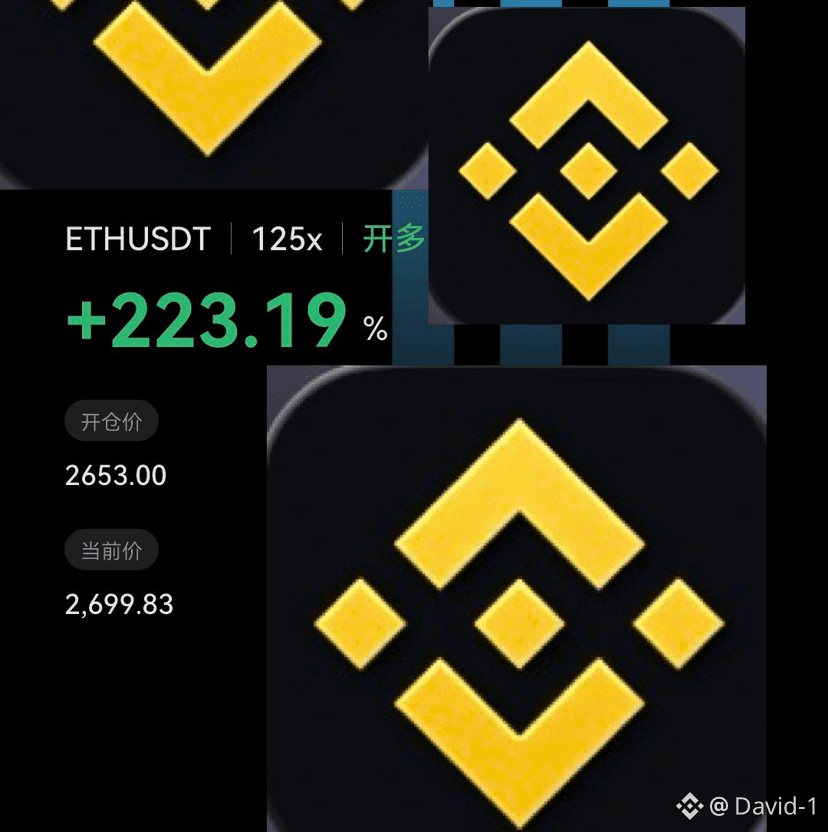
Keep up! Eat meat!
Just that simple
You can too! $ETH
{future}(ETHUSDT)
Keep up! Eat meat!
Just that simple
You can too! $ETH
Just that simple
You can too! $ETH
David-1
·
--
David’s Trading Notes
2026.9.21 $ETH
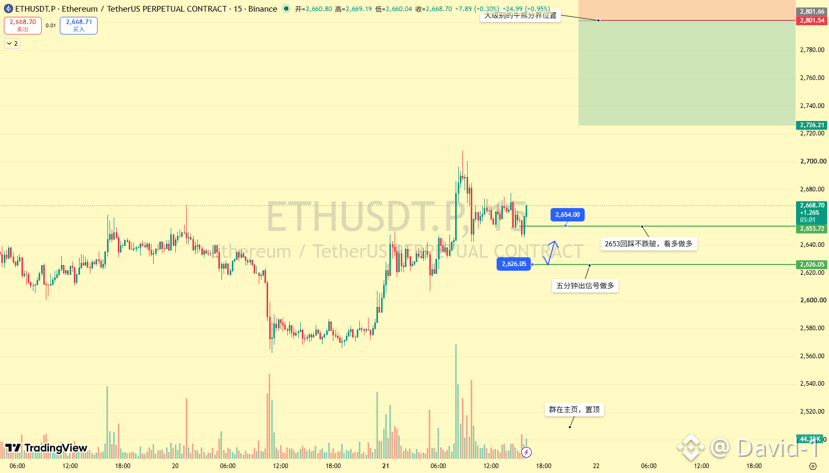
1. Intraday
Today intraday: focus on going long when possible, and treat shorts as secondary
Go Long|
1. Watch 2653 on the 5-minute chart: if the pullback doesn’t break, go long after a bullish engulfing (sunny engulfing) following a bearish candle.
2. After the 2626 wick/probe goes down and then a bullish candle closes, go long; you can also place a pending order with a stop loss of 20 USD.
Go Short|
1. Watch the 2796–2801 range; consider shorting after a 5-minute bearish engulfing forms (or a bearish-after-bullish pattern) and the signal appears.
2. Only take the short when the signal is confirmed; if no signal appears, don’t trade.
2. Trading Logic
This week the bulls have been very strong. After the price broke down from 2460 and then recovered (reclaiming it), the direction was turned back to low-long bias—this is a primary trend market. Trade in line with the trend and reduce actions against the market;
Shorts are only for the higher 2796–2801 area. If price hasn’t reached this zone, don’t treat intraday consolidation as a high-short opportunity. Don’t randomly make moves.
Step by step, improve your trading system. If you don’t know how to build a trading system, follow me on Binance and I’ll give you the answer when the time comes 🫵
#以太坊突破2700美元
#MichaelSaylor暗示增持BTC
2026.9.21 $ETH
1. Intraday
Today intraday: focus on going long when possible, and treat shorts as secondary
Go Long|
1. Watch 2653 on the 5-minute chart: if the pullback doesn’t break, go long after a bullish engulfing (sunny engulfing) following a bearish candle.
2. After the 2626 wick/probe goes down and then a bullish candle closes, go long; you can also place a pending order with a stop loss of 20 USD.
Go Short|
1. Watch the 2796–2801 range; consider shorting after a 5-minute bearish engulfing forms (or a bearish-after-bullish pattern) and the signal appears.
2. Only take the short when the signal is confirmed; if no signal appears, don’t trade.
2. Trading Logic
This week the bulls have been very strong. After the price broke down from 2460 and then recovered (reclaiming it), the direction was turned back to low-long bias—this is a primary trend market. Trade in line with the trend and reduce actions against the market;
Shorts are only for the higher 2796–2801 area. If price hasn’t reached this zone, don’t treat intraday consolidation as a high-short opportunity. Don’t randomly make moves.
Step by step, improve your trading system. If you don’t know how to build a trading system, follow me on Binance and I’ll give you the answer when the time comes 🫵
#以太坊突破2700美元
#MichaelSaylor暗示增持BTC
2
106
·
--
David’s Trading Notes
2026.9.21 $ETH
1. Intraday
Today intraday: focus on going long when possible, and treat shorts as secondary
Go Long|
1. Watch 2653 on the 5-minute chart: if the pullback doesn’t break, go long after a bullish engulfing (sunny engulfing) following a bearish candle.
2. After the 2626 wick/probe goes down and then a bullish candle closes, go long; you can also place a pending order with a stop loss of 20 USD.
Go Short|
1. Watch the 2796–2801 range; consider shorting after a 5-minute bearish engulfing forms (or a bearish-after-bullish pattern) and the signal appears.
2. Only take the short when the signal is confirmed; if no signal appears, don’t trade.
2. Trading Logic
This week the bulls have been very strong. After the price broke down from 2460 and then recovered (reclaiming it), the direction was turned back to low-long bias—this is a primary trend market. Trade in line with the trend and reduce actions against the market;
Shorts are only for the higher 2796–2801 area. If price hasn’t reached this zone, don’t treat intraday consolidation as a high-short opportunity. Don’t randomly make moves.
Step by step, improve your trading system. If you don’t know how to build a trading system, follow me on Binance and I’ll give you the answer when the time comes 🫵
#以太坊突破2700美元
#MichaelSaylor暗示增持BTC
{future}(ETHUSDT)
David’s Trading Notes
2026.9.21 $ETH
1. Intraday
Today intraday: focus on going long when possible, and treat shorts as secondary
Go Long|
1. Watch 2653 on the 5-minute chart: if the pullback doesn’t break, go long after a bullish engulfing (sunny engulfing) following a bearish candle.
2. After the 2626 wick/probe goes down and then a bullish candle closes, go long; you can also place a pending order with a stop loss of 20 USD.
Go Short|
1. Watch the 2796–2801 range; consider shorting after a 5-minute bearish engulfing forms (or a bearish-after-bullish pattern) and the signal appears.
2. Only take the short when the signal is confirmed; if no signal appears, don’t trade.
2. Trading Logic
This week the bulls have been very strong. After the price broke down from 2460 and then recovered (reclaiming it), the direction was turned back to low-long bias—this is a primary trend market. Trade in line with the trend and reduce actions against the market;
Shorts are only for the higher 2796–2801 area. If price hasn’t reached this zone, don’t treat intraday consolidation as a high-short opportunity. Don’t randomly make moves.
Step by step, improve your trading system. If you don’t know how to build a trading system, follow me on Binance and I’ll give you the answer when the time comes 🫵
#以太坊突破2700美元
#MichaelSaylor暗示增持BTC
2026.9.21 $ETH
1. Intraday
Today intraday: focus on going long when possible, and treat shorts as secondary
Go Long|
1. Watch 2653 on the 5-minute chart: if the pullback doesn’t break, go long after a bullish engulfing (sunny engulfing) following a bearish candle.
2. After the 2626 wick/probe goes down and then a bullish candle closes, go long; you can also place a pending order with a stop loss of 20 USD.
Go Short|
1. Watch the 2796–2801 range; consider shorting after a 5-minute bearish engulfing forms (or a bearish-after-bullish pattern) and the signal appears.
2. Only take the short when the signal is confirmed; if no signal appears, don’t trade.
2. Trading Logic
This week the bulls have been very strong. After the price broke down from 2460 and then recovered (reclaiming it), the direction was turned back to low-long bias—this is a primary trend market. Trade in line with the trend and reduce actions against the market;
Shorts are only for the higher 2796–2801 area. If price hasn’t reached this zone, don’t treat intraday consolidation as a high-short opportunity. Don’t randomly make moves.
Step by step, improve your trading system. If you don’t know how to build a trading system, follow me on Binance and I’ll give you the answer when the time comes 🫵
#以太坊突破2700美元
#MichaelSaylor暗示增持BTC
2
469
·
--
How should we explain why the Clear Act didn’t pass, yet after the Federal Reserve and the Bank of Japan raised rates, BTC, ETH, and altcoins still surged? What’s the underlying logic?
The underlying logic is “market repricing.”
The market has priced in 3–4 rate hikes. After the hikes were announced,
the expectation was only for one more hike, so the market corrected and rebounded. Once a trend move begins, it usually won’t easily reverse. And considering how strong BTC and ETH’s order books/market structure have been, it’s even less likely to flip.
As everyone knows, ETH is the king of altcoins. In this round of the rally, the background strength is strong: ETH > BTC—strong sideways consolidation, using sideways movement instead of a drop to trade time for space. Then the altcoin juniors catch up and catch a pullback.
#以太坊突破2700美元
#Bank of Japan hikes rates to a 31-year high
How should we explain why the Clear Act didn’t pass, yet after the Federal Reserve and the Bank of Japan raised rates, BTC, ETH, and altcoins still surged? What’s the underlying logic?
The underlying logic is “market repricing.”
The market has priced in 3–4 rate hikes. After the hikes were announced,
the expectation was only for one more hike, so the market corrected and rebounded. Once a trend move begins, it usually won’t easily reverse. And considering how strong BTC and ETH’s order books/market structure have been, it’s even less likely to flip.
As everyone knows, ETH is the king of altcoins. In this round of the rally, the background strength is strong: ETH > BTC—strong sideways consolidation, using sideways movement instead of a drop to trade time for space. Then the altcoin juniors catch up and catch a pullback.
#以太坊突破2700美元
#Bank of Japan hikes rates to a 31-year high
The underlying logic is “market repricing.”
The market has priced in 3–4 rate hikes. After the hikes were announced,
the expectation was only for one more hike, so the market corrected and rebounded. Once a trend move begins, it usually won’t easily reverse. And considering how strong BTC and ETH’s order books/market structure have been, it’s even less likely to flip.
As everyone knows, ETH is the king of altcoins. In this round of the rally, the background strength is strong: ETH > BTC—strong sideways consolidation, using sideways movement instead of a drop to trade time for space. Then the altcoin juniors catch up and catch a pullback.
#以太坊突破2700美元
#Bank of Japan hikes rates to a 31-year high
1
383
·
--
The Core Meaning of a Community
After trading for a long time, you’ve seen too many groups. When a bull market comes, people start calling trades, chasing hot trends, sweeping “broken castles,” leveraging up—one move more ferocious than the next.
In this kind of market, making money isn’t actually that hard. As liquidity rises, even buying the right things can turn a profit. It can also easily create a false illusion: that you really are good at trading.
But once the market turns, you’ll immediately know who is actually making money—and who is only feeding on the market.
So I think what a real trading community should do is not to keep telling you what to “all-in” on for your next trade;
Instead, it should help you practice the most important thing: a trading system.
When to act, when to stop | How to protect profits, how to cut losses | Don’t chase if you miss the move (no FOMO—keep it under control)
Someone in the group said that if you can’t handle lower timeframes, then higher timeframes are still easy to “master.” Honestly, it’s not like that. Higher timeframes evolve from lower ones. It’s not about relying on vibes or executing with different standards every time. After a whole bull market cycle, all you get is chaos and setbacks.
Luck can help you make some money once—but only a closed-loop trading system can keep you in the game.
The most valuable part of a trading system is that it goes through one cycle after another, only making you better. What truly protects you is only your own trading system.
I’m Jungle King—you most stylish guide
The Core Meaning of a Community
After trading for a long time, you’ve seen too many groups. When a bull market comes, people start calling trades, chasing hot trends, sweeping “broken castles,” leveraging up—one move more ferocious than the next.
In this kind of market, making money isn’t actually that hard. As liquidity rises, even buying the right things can turn a profit. It can also easily create a false illusion: that you really are good at trading.
But once the market turns, you’ll immediately know who is actually making money—and who is only feeding on the market.
So I think what a real trading community should do is not to keep telling you what to “all-in” on for your next trade;
Instead, it should help you practice the most important thing: a trading system.
When to act, when to stop | How to protect profits, how to cut losses | Don’t chase if you miss the move (no FOMO—keep it under control)
Someone in the group said that if you can’t handle lower timeframes, then higher timeframes are still easy to “master.” Honestly, it’s not like that. Higher timeframes evolve from lower ones. It’s not about relying on vibes or executing with different standards every time. After a whole bull market cycle, all you get is chaos and setbacks.
Luck can help you make some money once—but only a closed-loop trading system can keep you in the game.
The most valuable part of a trading system is that it goes through one cycle after another, only making you better. What truly protects you is only your own trading system.
I’m Jungle King—you most stylish guide
After trading for a long time, you’ve seen too many groups. When a bull market comes, people start calling trades, chasing hot trends, sweeping “broken castles,” leveraging up—one move more ferocious than the next.
In this kind of market, making money isn’t actually that hard. As liquidity rises, even buying the right things can turn a profit. It can also easily create a false illusion: that you really are good at trading.
But once the market turns, you’ll immediately know who is actually making money—and who is only feeding on the market.
So I think what a real trading community should do is not to keep telling you what to “all-in” on for your next trade;
Instead, it should help you practice the most important thing: a trading system.
When to act, when to stop | How to protect profits, how to cut losses | Don’t chase if you miss the move (no FOMO—keep it under control)
Someone in the group said that if you can’t handle lower timeframes, then higher timeframes are still easy to “master.” Honestly, it’s not like that. Higher timeframes evolve from lower ones. It’s not about relying on vibes or executing with different standards every time. After a whole bull market cycle, all you get is chaos and setbacks.
Luck can help you make some money once—but only a closed-loop trading system can keep you in the game.
The most valuable part of a trading system is that it goes through one cycle after another, only making you better. What truly protects you is only your own trading system.
I’m Jungle King—you most stylish guide
224
Log in to explore more content
Join global crypto users on Binance Square
⚡️ Get latest and useful information about crypto.
💬 Trusted by the world’s largest crypto exchange.
👍 Discover real insights from verified creators.
Email / Phone number
Trending Topics
TrumpRejectsAIRulesForVoluntaryAudits
1,956 views
141 Discussing
Super Intelligence" & The AI Policy Shift: Self-Policing or a Risky Gamble?
Nurul Hasnat Samir
·0 Likes
·342 views
BitgetHotWalletBreachTiedToThirdPartySecurityFlaw
905 views
102 Discussing
OpenAIUnveilsAlwaysOnAgentDots
2,002 views
152 Discussing