
Dai BNB
83 Posts

Dai BNB
Report
Block User
Lucky is better than skill.
2 Following
218 Followers
629 Liked
Posts
·
--
Bearish
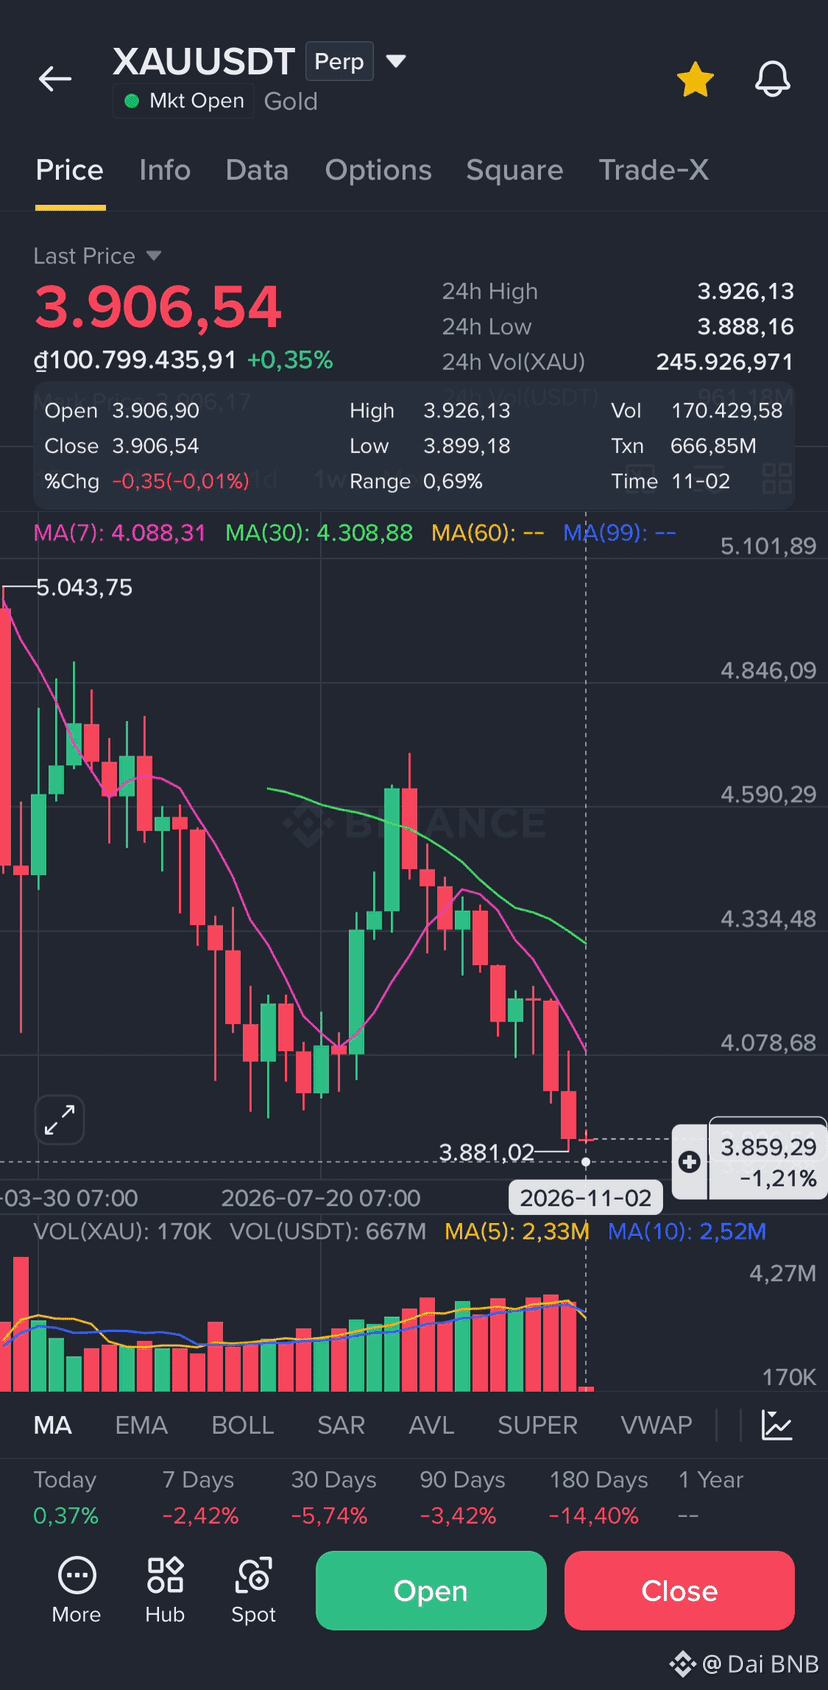
$XAU ⚡️🔥The current price of XAU stands at 3.906,98. The short-term trend appears to be weakening, as the KDJ indicator on the 15-minute timeframe has entered the oversold zone, while the MACD continues to show a bearish divergence. Regarding capital flow, the ratio of active buying has dropped sharply over the last few hours alongside mounting selling pressure; although the long/short ratio still favors the bulls, the gap is narrowing, signaling a shift toward market caution. A key catalyst for short positions is news of a security incident at a major exchange involving XAU, compounded by a high-interest-rate environment that exerts pressure on tokenized gold. Consequently, I believe the downside risk outweighs the potential for a short-term technical rebound.
🧨 Bearish bias: The 15-minute KDJ has fallen deep into the oversold zone, and an expanding negative MACD confirms the downward momentum.
📉 Short
Approximately 65% of traders
Should the price of XAU break below the 3840 level, panic stemming from the security incident—combined with an increase in active selling—could trigger a "floodgate" effect. This would likely cause the price to slide rapidly toward the next support level as long-position holders are forced out, with their stop-loss orders being triggered.
Trade Setup: Short - XAU 📉
Entry: $3.925,02
SL: $3.945,19
TP1: $3.842,85
TP2: $3.782,02
TP3: $3.700,12
$XAG
✅ Click here to trade: 👇
#BitcoinDropsBelow$78K
{future}(XAGUSDT)
{future}(XAUUSDT)
$XAU ⚡️🔥The current price of XAU stands at 3.906,98. The short-term trend appears to be weakening, as the KDJ indicator on the 15-minute timeframe has entered the oversold zone, while the MACD continues to show a bearish divergence. Regarding capital flow, the ratio of active buying has dropped sharply over the last few hours alongside mounting selling pressure; although the long/short ratio still favors the bulls, the gap is narrowing, signaling a shift toward market caution. A key catalyst for short positions is news of a security incident at a major exchange involving XAU, compounded by a high-interest-rate environment that exerts pressure on tokenized gold. Consequently, I believe the downside risk outweighs the potential for a short-term technical rebound.
🧨 Bearish bias: The 15-minute KDJ has fallen deep into the oversold zone, and an expanding negative MACD confirms the downward momentum.
📉 Short
Approximately 65% of traders
Should the price of XAU break below the 3840 level, panic stemming from the security incident—combined with an increase in active selling—could trigger a "floodgate" effect. This would likely cause the price to slide rapidly toward the next support level as long-position holders are forced out, with their stop-loss orders being triggered.
Trade Setup: Short - XAU 📉
Entry: $3.925,02
SL: $3.945,19
TP1: $3.842,85
TP2: $3.782,02
TP3: $3.700,12
$XAG
✅ Click here to trade: 👇
#BitcoinDropsBelow$78K
🧨 Bearish bias: The 15-minute KDJ has fallen deep into the oversold zone, and an expanding negative MACD confirms the downward momentum.
📉 Short
Approximately 65% of traders
Should the price of XAU break below the 3840 level, panic stemming from the security incident—combined with an increase in active selling—could trigger a "floodgate" effect. This would likely cause the price to slide rapidly toward the next support level as long-position holders are forced out, with their stop-loss orders being triggered.
Trade Setup: Short - XAU 📉
Entry: $3.925,02
SL: $3.945,19
TP1: $3.842,85
TP2: $3.782,02
TP3: $3.700,12
$XAG
✅ Click here to trade: 👇
#BitcoinDropsBelow$78K
10
·
--
Bearish
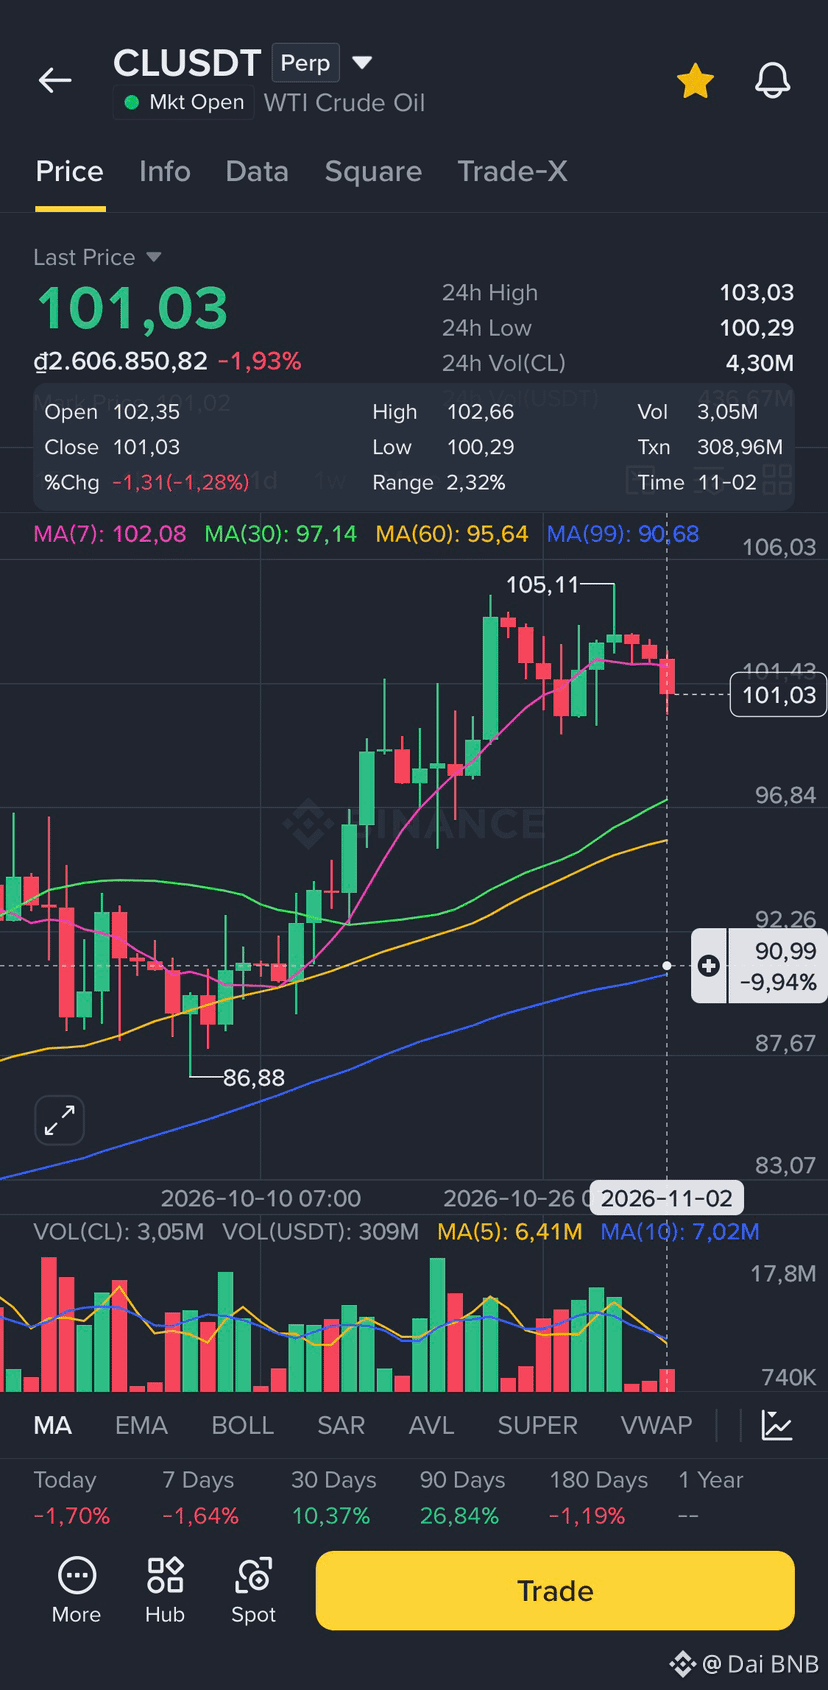
$CL 🎯 Reasons for an Unattractive R/R (Risk/Reward) Ratio: 📉 🛢️
🧨 Geopolitical Risks: News involving Iran and Trump is driving two-way volatility, with the sentiment leaning more toward downside risk than upside potential.
🚨 Positioning Pressure: The long/short ratio among "elite" (top-tier) accounts sits at only 0.67, indicating that the bears maintain absolute dominance on the exchange.
⚡️Weak Active Capital Flow: Aggressive buying remains unsustainable, and the flat MACD on the H1 timeframe signals a lack of momentum to push prices higher.
📉 Downward Selling Pressure:
🔥 Approximately 60% of traders
Should the price break below 97.50, a combination of panic sentiment and the overwhelming short positioning from elite accounts will likely trigger a sharp decline—beware of potential bull traps.
Trade Setup: Short - CL 📉🪫
Entry: $101,05
SL: $102,78
TP1: $97,38
TP2: $94,72
TP3: $90,65
✅ Click here to trade: 👇
#BinanceProcesses$4.65BWithdrawals
{future}(CLUSDT)
$CL 🎯 Reasons for an Unattractive R/R (Risk/Reward) Ratio: 📉 🛢️
🧨 Geopolitical Risks: News involving Iran and Trump is driving two-way volatility, with the sentiment leaning more toward downside risk than upside potential.
🚨 Positioning Pressure: The long/short ratio among "elite" (top-tier) accounts sits at only 0.67, indicating that the bears maintain absolute dominance on the exchange.
⚡️Weak Active Capital Flow: Aggressive buying remains unsustainable, and the flat MACD on the H1 timeframe signals a lack of momentum to push prices higher.
📉 Downward Selling Pressure:
🔥 Approximately 60% of traders
Should the price break below 97.50, a combination of panic sentiment and the overwhelming short positioning from elite accounts will likely trigger a sharp decline—beware of potential bull traps.
Trade Setup: Short - CL 📉🪫
Entry: $101,05
SL: $102,78
TP1: $97,38
TP2: $94,72
TP3: $90,65
✅ Click here to trade: 👇
#BinanceProcesses$4.65BWithdrawals
🧨 Geopolitical Risks: News involving Iran and Trump is driving two-way volatility, with the sentiment leaning more toward downside risk than upside potential.
🚨 Positioning Pressure: The long/short ratio among "elite" (top-tier) accounts sits at only 0.67, indicating that the bears maintain absolute dominance on the exchange.
⚡️Weak Active Capital Flow: Aggressive buying remains unsustainable, and the flat MACD on the H1 timeframe signals a lack of momentum to push prices higher.
📉 Downward Selling Pressure:
🔥 Approximately 60% of traders
Should the price break below 97.50, a combination of panic sentiment and the overwhelming short positioning from elite accounts will likely trigger a sharp decline—beware of potential bull traps.
Trade Setup: Short - CL 📉🪫
Entry: $101,05
SL: $102,78
TP1: $97,38
TP2: $94,72
TP3: $90,65
✅ Click here to trade: 👇
#BinanceProcesses$4.65BWithdrawals
14
·
--
Bearish
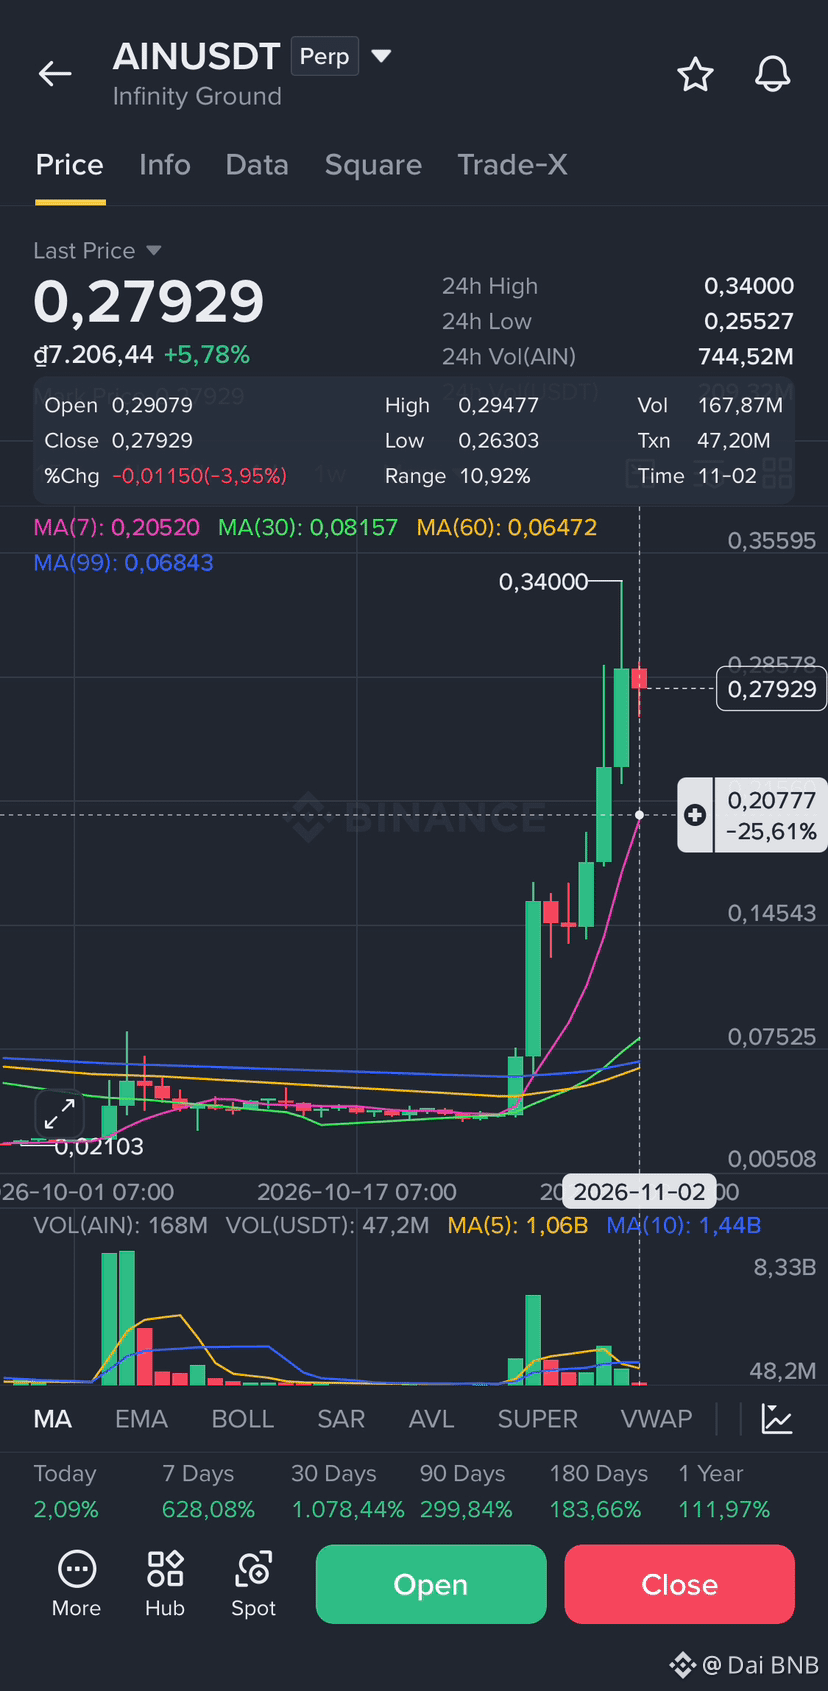
$AIN ⚡️Guy’s open short now 📉🔥
Trade Setup: Short - AIN
Entry: $0.29155
SL: $0.30002
TP1: $0.25552
TP2: $0.23195
TP3: $0.20052
✅ Click here to trade: 👇
#ain
{future}(AINUSDT)
$AIN ⚡️Guy’s open short now 📉🔥
Trade Setup: Short - AIN
Entry: $0.29155
SL: $0.30002
TP1: $0.25552
TP2: $0.23195
TP3: $0.20052
✅ Click here to trade: 👇
#ain
Trade Setup: Short - AIN
Entry: $0.29155
SL: $0.30002
TP1: $0.25552
TP2: $0.23195
TP3: $0.20052
✅ Click here to trade: 👇
#ain
38
·
--
Bearish
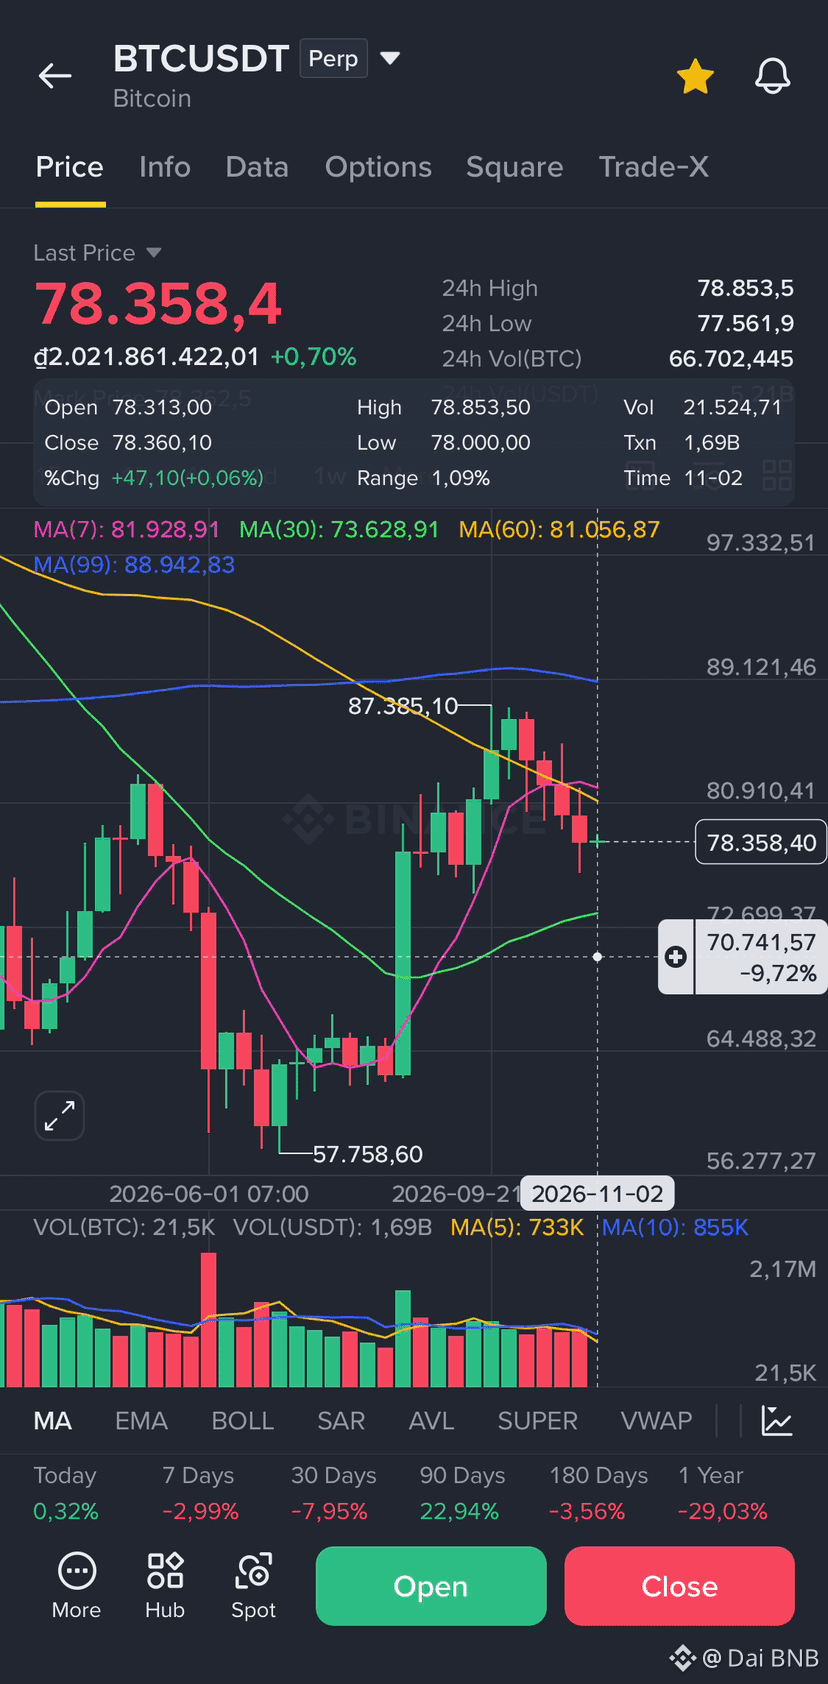
$BTC 📉 Loss of support leads to a sharp sell-off:
Once the 4-hour candle closes below 76,000 USDT—amidst consistent net outflows from ETFs and a significant drop in the Fear & Greed Index—it confirms that the bears have taken full control. There is a high risk of leveraged liquidations in the 73,000 USDT – 71,000 USDT range; avoid "catching the falling knife" (buying the dip too early).
Trade Setup: Short - BTC 📉
Entry: $78,605
SL: $79,198
TP1: $76,052
TP2: $73,532
TP3: $70,305
✅ Click here to trade: 👇
#BitcoinSpotETFsPost$203MWeeklyOutflow
{future}(BTCUSDT)
$BTC 📉 Loss of support leads to a sharp sell-off:
Once the 4-hour candle closes below 76,000 USDT—amidst consistent net outflows from ETFs and a significant drop in the Fear & Greed Index—it confirms that the bears have taken full control. There is a high risk of leveraged liquidations in the 73,000 USDT – 71,000 USDT range; avoid "catching the falling knife" (buying the dip too early).
Trade Setup: Short - BTC 📉
Entry: $78,605
SL: $79,198
TP1: $76,052
TP2: $73,532
TP3: $70,305
✅ Click here to trade: 👇
#BitcoinSpotETFsPost$203MWeeklyOutflow
Once the 4-hour candle closes below 76,000 USDT—amidst consistent net outflows from ETFs and a significant drop in the Fear & Greed Index—it confirms that the bears have taken full control. There is a high risk of leveraged liquidations in the 73,000 USDT – 71,000 USDT range; avoid "catching the falling knife" (buying the dip too early).
Trade Setup: Short - BTC 📉
Entry: $78,605
SL: $79,198
TP1: $76,052
TP2: $73,532
TP3: $70,305
✅ Click here to trade: 👇
#BitcoinSpotETFsPost$203MWeeklyOutflow
36
·
--
Bullish
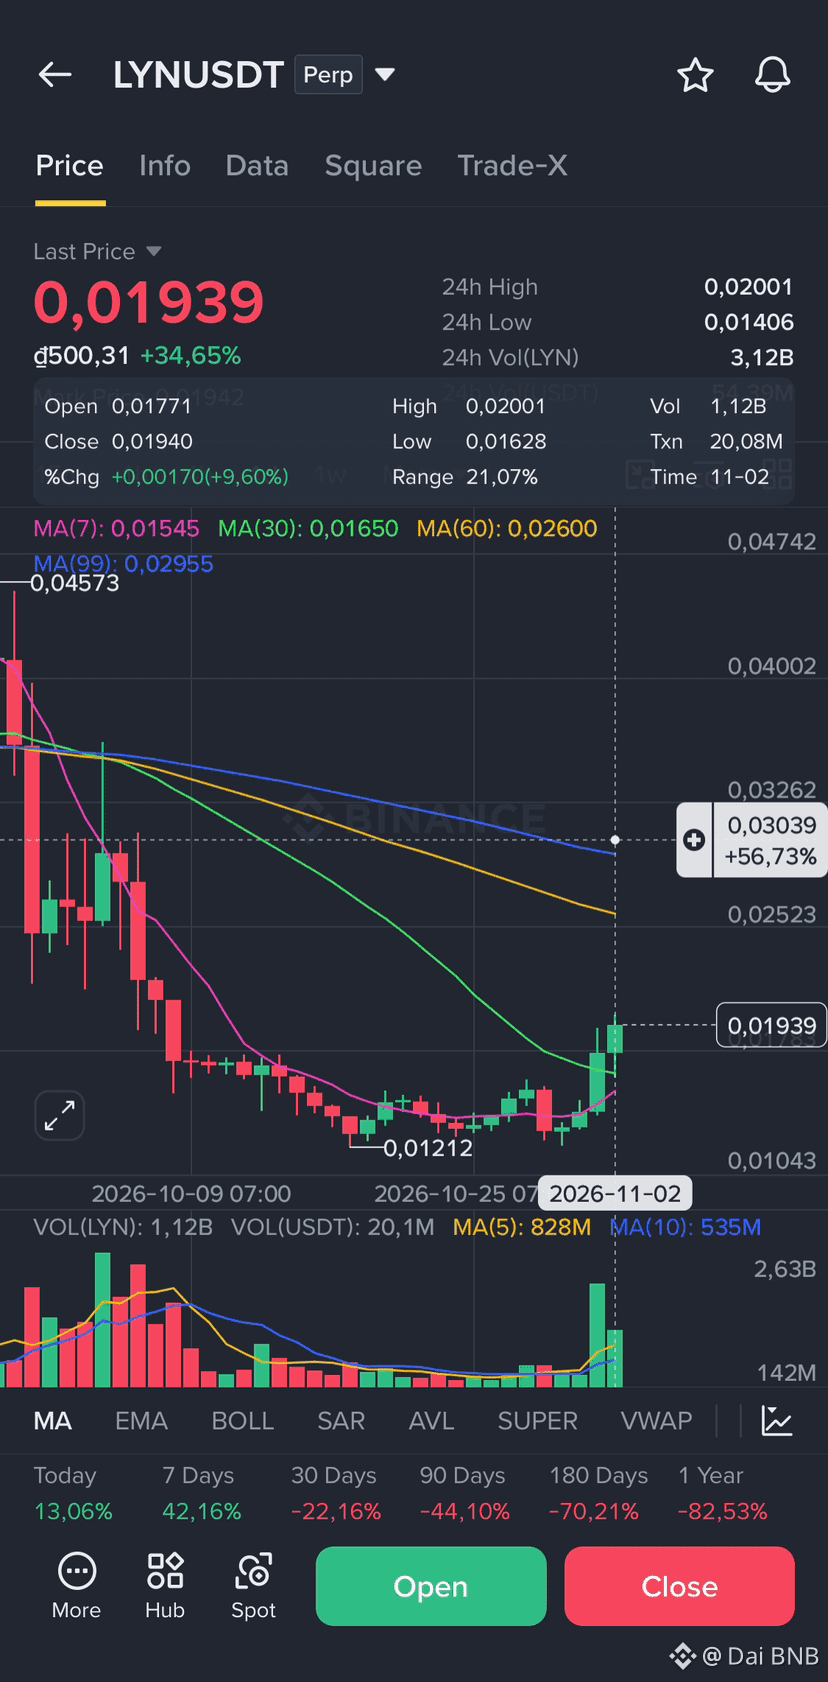
$LYN ⚡️📈 Breaking through resistance, continuing the uptrend
Approximately 71% of traders
If the price of LYN holds at its current level and active buying pressure returns following a KDJ compression, the bulls will regain the upper hand, pushing the price to test the next psychological zone.
Trade Setup: Long - LYN 📈
Entry: $0.01655
SL: $0.01608
TP1: $0.02032
TP2: $0.02132
TP3: $0.02428
✅ Click here to trade: 👇
#lyn
{future}(LYNUSDT)
$LYN ⚡️📈 Breaking through resistance, continuing the uptrend
Approximately 71% of traders
If the price of LYN holds at its current level and active buying pressure returns following a KDJ compression, the bulls will regain the upper hand, pushing the price to test the next psychological zone.
Trade Setup: Long - LYN 📈
Entry: $0.01655
SL: $0.01608
TP1: $0.02032
TP2: $0.02132
TP3: $0.02428
✅ Click here to trade: 👇
#lyn
Approximately 71% of traders
If the price of LYN holds at its current level and active buying pressure returns following a KDJ compression, the bulls will regain the upper hand, pushing the price to test the next psychological zone.
Trade Setup: Long - LYN 📈
Entry: $0.01655
SL: $0.01608
TP1: $0.02032
TP2: $0.02132
TP3: $0.02428
✅ Click here to trade: 👇
#lyn
39
·
--
Bullish
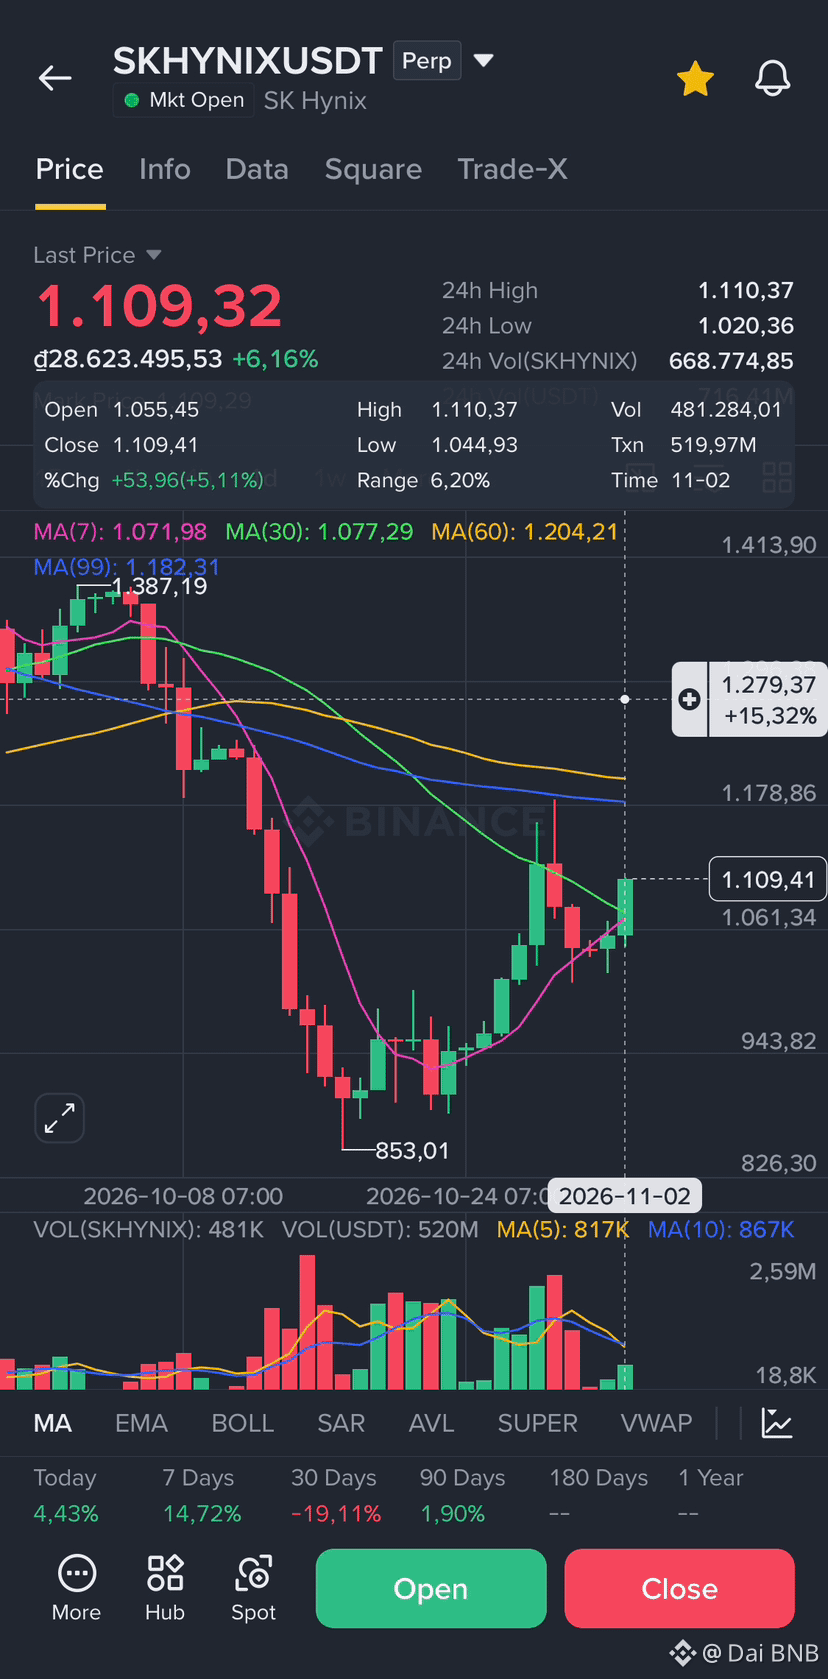
$SKHYNIX 🔥📈 The asset is currently up by approximately 5% for the day, despite news that initially caused an 8%+ drop prior to the U.S. market open. An analysis of contract flow reveals that aggressive buying has completely overwhelmed selling pressure—particularly during peak trading hours—indicating that the bulls are actively absorbing the sell-off. The long-to-short ratio among top-tier accounts remains very high, and a slightly positive funding rate reflects a prevailing bullish sentiment. From a technical perspective, both the MACD and KDJ indicators on the 1-hour timeframe confirm a short-term recovery, pushing the price above the moving average resistance zone. Although the fundamental news is negative, the market’s counterintuitive reaction suggests that the downside risk has already been priced in, with speculative capital now driving the upward momentum.
📈 Approximately 72% of traders
Trade Setup: Long - skhynix 📈
Entry: $1,072.00
SL: $1,045.00
TP1: $1,162.00
TP2: $1.219,00
TP3: $1,275.00
✅ Click here to trade: 👇
#WithdrawalsBack: 15 networks live
{future}(SKHYNIXUSDT)
$SKHYNIX 🔥📈 The asset is currently up by approximately 5% for the day, despite news that initially caused an 8%+ drop prior to the U.S. market open. An analysis of contract flow reveals that aggressive buying has completely overwhelmed selling pressure—particularly during peak trading hours—indicating that the bulls are actively absorbing the sell-off. The long-to-short ratio among top-tier accounts remains very high, and a slightly positive funding rate reflects a prevailing bullish sentiment. From a technical perspective, both the MACD and KDJ indicators on the 1-hour timeframe confirm a short-term recovery, pushing the price above the moving average resistance zone. Although the fundamental news is negative, the market’s counterintuitive reaction suggests that the downside risk has already been priced in, with speculative capital now driving the upward momentum.
📈 Approximately 72% of traders
Trade Setup: Long - skhynix 📈
Entry: $1,072.00
SL: $1,045.00
TP1: $1,162.00
TP2: $1.219,00
TP3: $1,275.00
✅ Click here to trade: 👇
#WithdrawalsBack: 15 networks live
📈 Approximately 72% of traders
Trade Setup: Long - skhynix 📈
Entry: $1,072.00
SL: $1,045.00
TP1: $1,162.00
TP2: $1.219,00
TP3: $1,275.00
✅ Click here to trade: 👇
#WithdrawalsBack: 15 networks live
67
·
--
Bearish
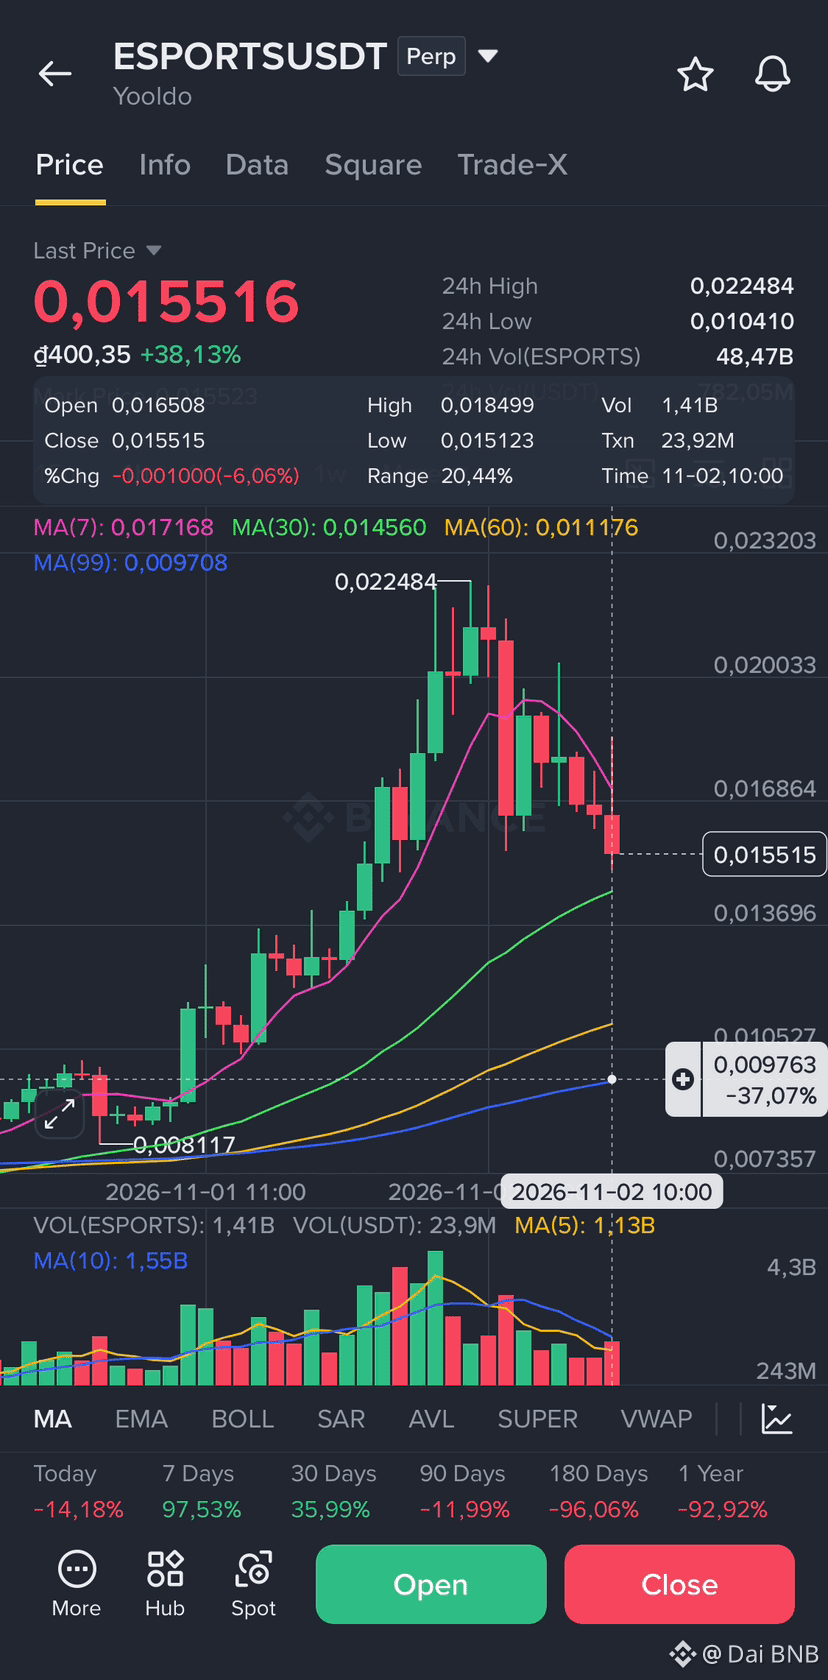
$ESPORTS On the 1-hour ESPORTS timeframe, the price is gradually falling towards the MA30-MA99 line, opening a Short position with an 85% win rate.
Trade Setup: Short - ESPORTS
Entry: $0.018000
SL: $0.018500
TP1: $0.014000
TP2: $0.012000
TP3: $0.010500
✅ Click here to trade: 👇
#BinanceProcesses$4.65BWithdrawals
{future}(ESPORTSUSDT)
$ESPORTS On the 1-hour ESPORTS timeframe, the price is gradually falling towards the MA30-MA99 line, opening a Short position with an 85% win rate.
Trade Setup: Short - ESPORTS
Entry: $0.018000
SL: $0.018500
TP1: $0.014000
TP2: $0.012000
TP3: $0.010500
✅ Click here to trade: 👇
#BinanceProcesses$4.65BWithdrawals
Trade Setup: Short - ESPORTS
Entry: $0.018000
SL: $0.018500
TP1: $0.014000
TP2: $0.012000
TP3: $0.010500
✅ Click here to trade: 👇
#BinanceProcesses$4.65BWithdrawals
84
·
--
Bullish
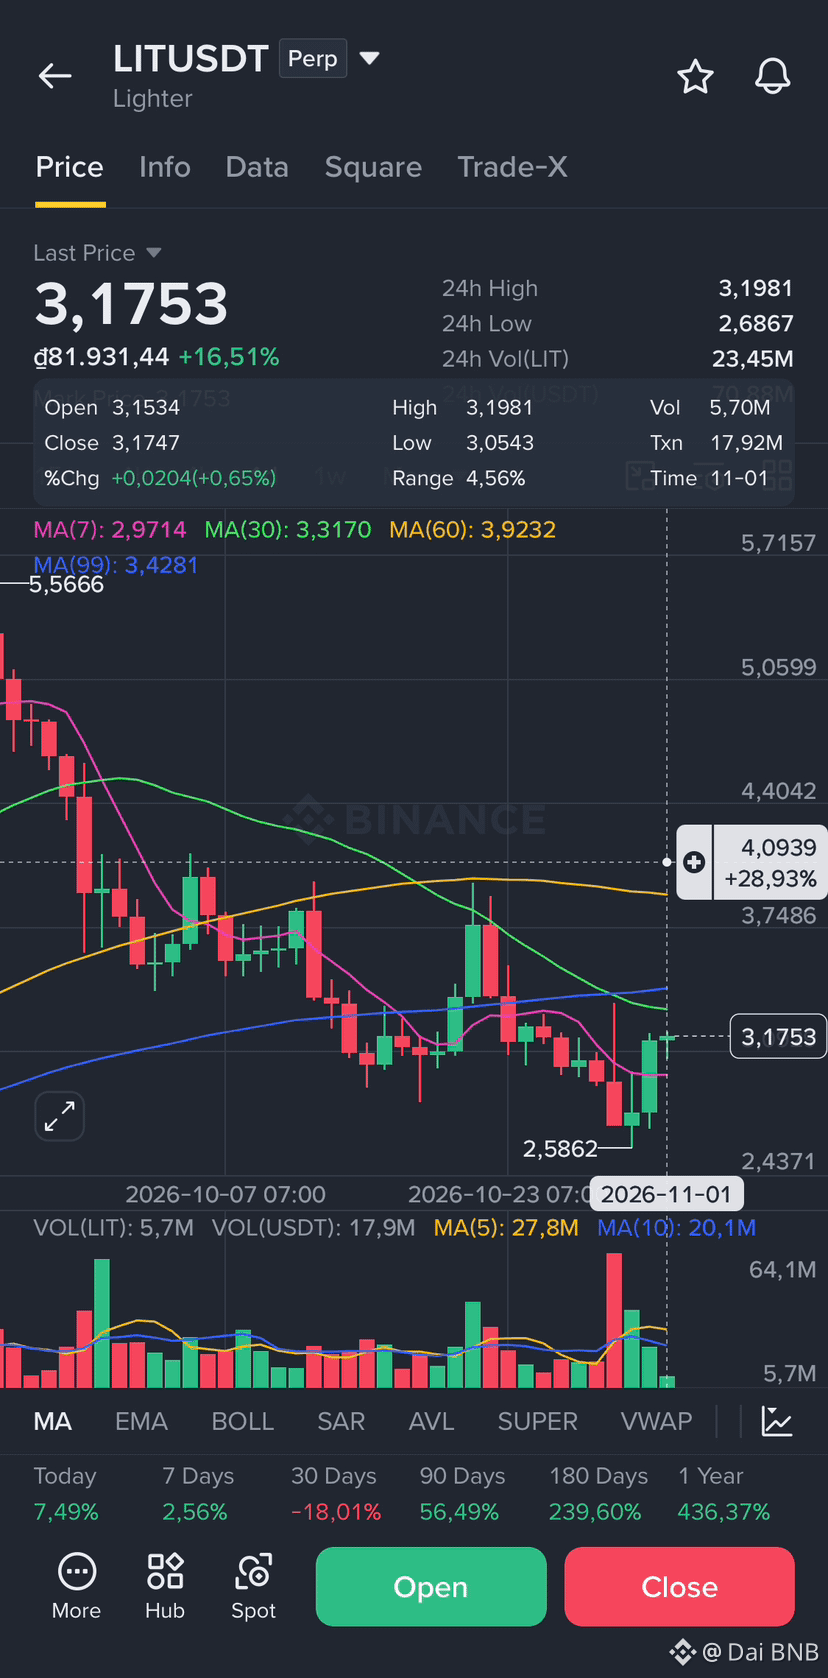
$LIT 📈 Recovery Momentum:
If the price holds above 3.05 USDT, accompanied by an increase in active buying pressure, the bulls will absorb the profit-taking and push the price to retest the 3.35 USDT resistance level. 🔥Expected to break through the resistance zone and surge to $4.0152
Trade Setup: Long - LIT 📈
Entry: $3.0785
SL: $3.0085
TP1: $3.3502
TP2: $3.5852
TP3: $3.8598 - $4.0152
✅ Click here to trade: 👇
#BinanceToResumePhaseOneOfWithdrawals
{future}(LITUSDT)
$LIT 📈 Recovery Momentum:
If the price holds above 3.05 USDT, accompanied by an increase in active buying pressure, the bulls will absorb the profit-taking and push the price to retest the 3.35 USDT resistance level. 🔥Expected to break through the resistance zone and surge to $4.0152
Trade Setup: Long - LIT 📈
Entry: $3.0785
SL: $3.0085
TP1: $3.3502
TP2: $3.5852
TP3: $3.8598 - $4.0152
✅ Click here to trade: 👇
#BinanceToResumePhaseOneOfWithdrawals
If the price holds above 3.05 USDT, accompanied by an increase in active buying pressure, the bulls will absorb the profit-taking and push the price to retest the 3.35 USDT resistance level. 🔥Expected to break through the resistance zone and surge to $4.0152
Trade Setup: Long - LIT 📈
Entry: $3.0785
SL: $3.0085
TP1: $3.3502
TP2: $3.5852
TP3: $3.8598 - $4.0152
✅ Click here to trade: 👇
#BinanceToResumePhaseOneOfWithdrawals
84
·
--
Bearish
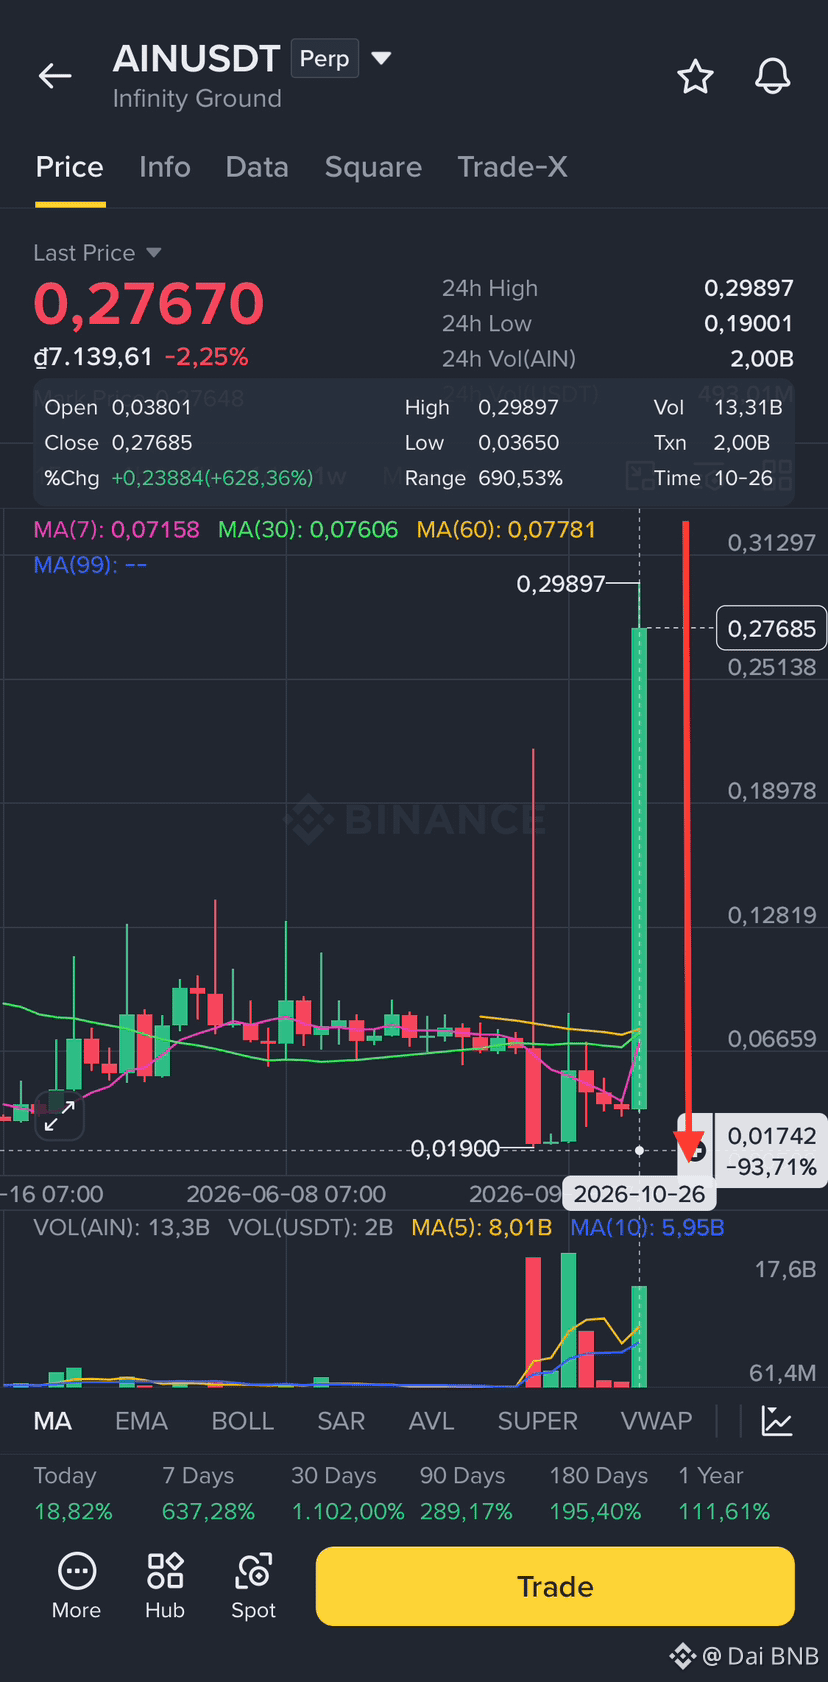
$AIN 🔥 is currently trading at 0.27832, showing a strong short-term uptrend fueled by the AI narrative—up nearly 5% for the day. However, net capital flows turned negative yesterday, with over $400,000 in outflows, while a predominance of short positions in the derivatives market signals growing market caution following the recent sharp rally. Technical indicators, such as the KDJ, are in overbought territory; combined with a lack of concrete fundamental news and the risk of confusion with other tokens sharing the same ticker, this suggests that the current momentum is largely speculative. Consequently, the asset is vulnerable to a significant downward correction or a period of sideways consolidation in the near term. 💸 Strong cash flow withdrawal: Negative net capital of 403k USD yesterday shows that profit taking is taking place after the hot rally.
Trade Setup: Short - AIN 📉🔥
Entry: $0.29698
SL: $0.30002
TP1: $0.25132
TP2: $0.22085
TP3: $0.17892
✅ Click here to trade: 👇
#ain
{future}(AINUSDT)
$AIN 🔥 is currently trading at 0.27832, showing a strong short-term uptrend fueled by the AI narrative—up nearly 5% for the day. However, net capital flows turned negative yesterday, with over $400,000 in outflows, while a predominance of short positions in the derivatives market signals growing market caution following the recent sharp rally. Technical indicators, such as the KDJ, are in overbought territory; combined with a lack of concrete fundamental news and the risk of confusion with other tokens sharing the same ticker, this suggests that the current momentum is largely speculative. Consequently, the asset is vulnerable to a significant downward correction or a period of sideways consolidation in the near term. 💸 Strong cash flow withdrawal: Negative net capital of 403k USD yesterday shows that profit taking is taking place after the hot rally.
Trade Setup: Short - AIN 📉🔥
Entry: $0.29698
SL: $0.30002
TP1: $0.25132
TP2: $0.22085
TP3: $0.17892
✅ Click here to trade: 👇
#ain
Trade Setup: Short - AIN 📉🔥
Entry: $0.29698
SL: $0.30002
TP1: $0.25132
TP2: $0.22085
TP3: $0.17892
✅ Click here to trade: 👇
#ain
1
684
·
--
Bullish
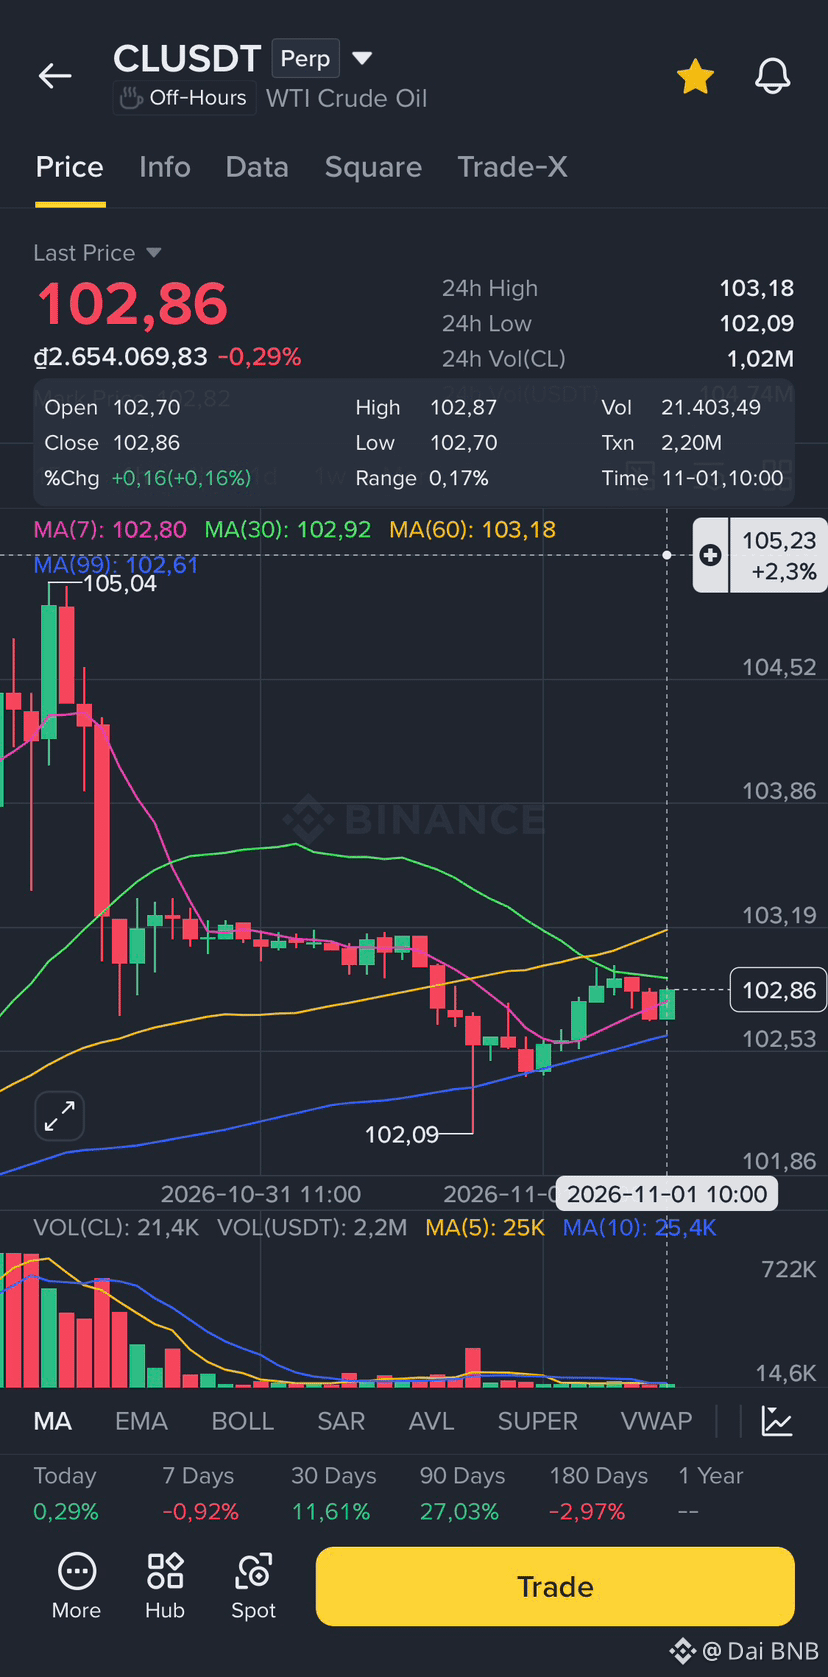
$CL 🚀Currently trading around the 103.00 level—a key resistance zone that requires confirmation to establish a new uptrend—the price has held firm above the 103 mark, supported by expectations regarding supply-side risks. Consequently, a genuine breakout will only be confirmed once the price closes decisively above 103.00, accompanied by a reversal in contract capital flows.
Trade Setup: Long - CL 📈🔥
Entry: $102,78
SL: $10158
TP1: $106,39
TP2: $110,32
TP3: $115,75 - $125,15
✅ Click here to trade: 👇
#BinanceToResumePhaseOneOfWithdrawals
{future}(CLUSDT)
$CL 🚀Currently trading around the 103.00 level—a key resistance zone that requires confirmation to establish a new uptrend—the price has held firm above the 103 mark, supported by expectations regarding supply-side risks. Consequently, a genuine breakout will only be confirmed once the price closes decisively above 103.00, accompanied by a reversal in contract capital flows.
Trade Setup: Long - CL 📈🔥
Entry: $102,78
SL: $10158
TP1: $106,39
TP2: $110,32
TP3: $115,75 - $125,15
✅ Click here to trade: 👇
#BinanceToResumePhaseOneOfWithdrawals
Trade Setup: Long - CL 📈🔥
Entry: $102,78
SL: $10158
TP1: $106,39
TP2: $110,32
TP3: $115,75 - $125,15
✅ Click here to trade: 👇
#BinanceToResumePhaseOneOfWithdrawals
225
·
--
Bearish
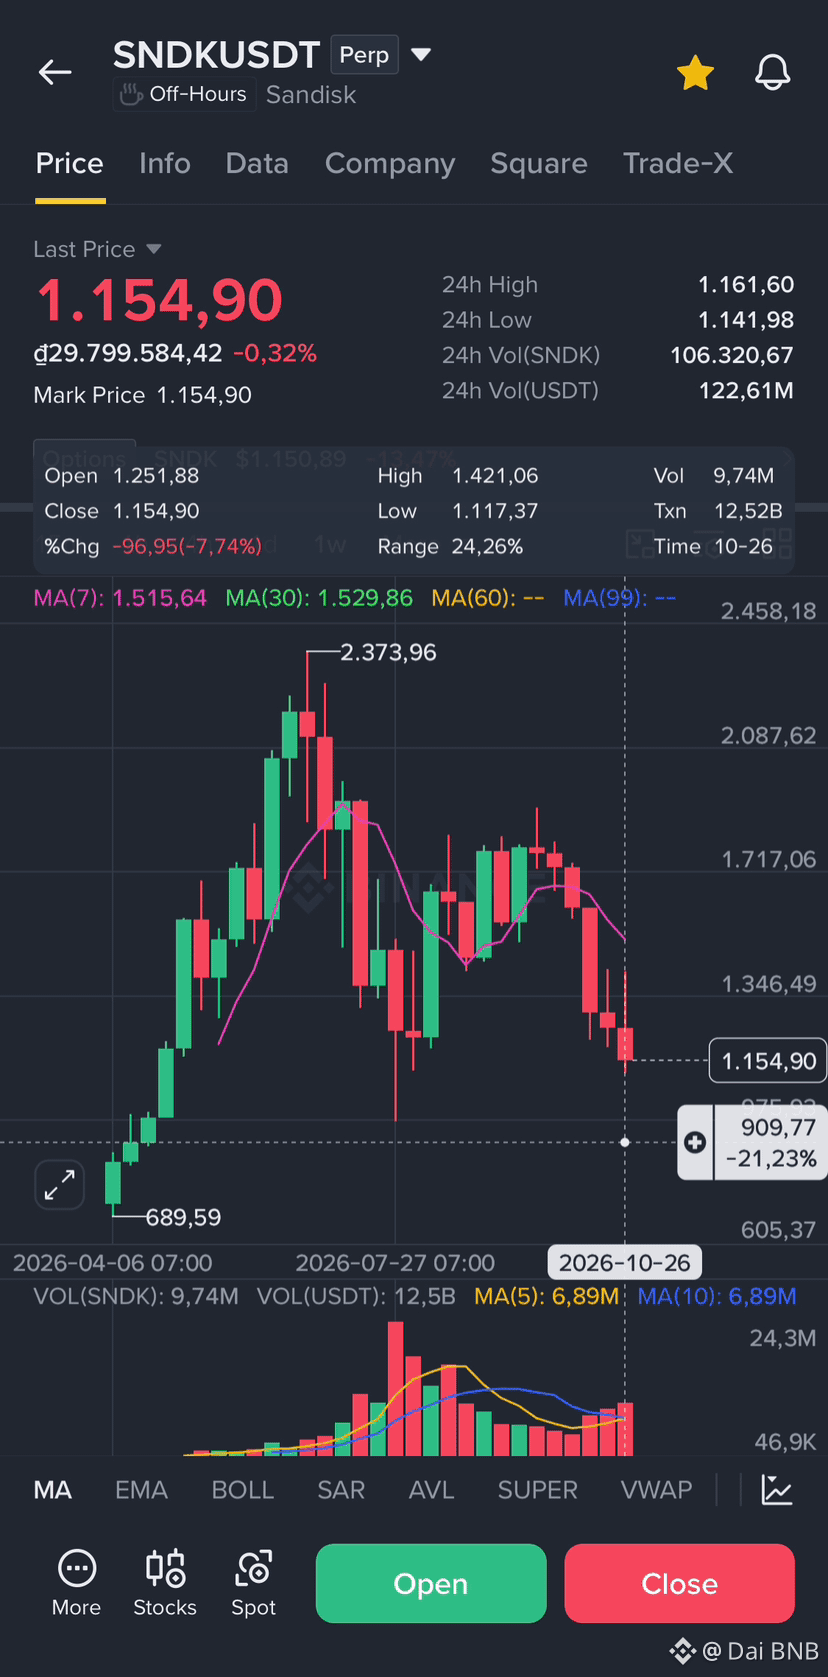
$SNDK 🚨Opportunity/Advantage: 📉
Short-term profit-taking pressure: SNDK is under strong downward pressure after its parent company, SanDisk, opposed the tokenization of its shares, combined with the decline in global chip stocks and fearful crypto market sentiment. This presents a short-term downtrend trading opportunity amidst the weakening of $BTC and $ETH. ⚡️Technical Advantage:
Clear downtrend: On the H4 timeframe, the MACD remains negative (-43) and the KDJ is in the oversold region (J=55), confirming that the short-term downtrend is not over despite a slight technical rebound.
🧨Active selling pressure dominates: Recent active trading data shows that the volume of sell orders (Ask) frequently outweighs buy orders (Bid), especially during high-volatility hours, reflecting that the bears are in control. 🔥Position Imbalance: The Long/Short ratio of the Elite account is as high as 43.26, indicating that the crowd is buying the dip too early; history shows that when this ratio is too high in a downtrend, the likelihood of a liquidity sweep on the Long side is very high.
Trade Setup: Short - SNDK
Entry: $1.175,02
SL: $1.210,02
TP1: $1.100,02
TP2: $1.030,05
TP3: $950,58
✅ Click here to trade: 👇
#FBIConfirmsNorthKoreaIsResponsibleForBinanceCryptoHack
{future}(SNDKUSDT)
$SNDK 🚨Opportunity/Advantage: 📉
Short-term profit-taking pressure: SNDK is under strong downward pressure after its parent company, SanDisk, opposed the tokenization of its shares, combined with the decline in global chip stocks and fearful crypto market sentiment. This presents a short-term downtrend trading opportunity amidst the weakening of $BTC and $ETH. ⚡️Technical Advantage:
Clear downtrend: On the H4 timeframe, the MACD remains negative (-43) and the KDJ is in the oversold region (J=55), confirming that the short-term downtrend is not over despite a slight technical rebound.
🧨Active selling pressure dominates: Recent active trading data shows that the volume of sell orders (Ask) frequently outweighs buy orders (Bid), especially during high-volatility hours, reflecting that the bears are in control. 🔥Position Imbalance: The Long/Short ratio of the Elite account is as high as 43.26, indicating that the crowd is buying the dip too early; history shows that when this ratio is too high in a downtrend, the likelihood of a liquidity sweep on the Long side is very high.
Trade Setup: Short - SNDK
Entry: $1.175,02
SL: $1.210,02
TP1: $1.100,02
TP2: $1.030,05
TP3: $950,58
✅ Click here to trade: 👇
#FBIConfirmsNorthKoreaIsResponsibleForBinanceCryptoHack
Short-term profit-taking pressure: SNDK is under strong downward pressure after its parent company, SanDisk, opposed the tokenization of its shares, combined with the decline in global chip stocks and fearful crypto market sentiment. This presents a short-term downtrend trading opportunity amidst the weakening of $BTC and $ETH. ⚡️Technical Advantage:
Clear downtrend: On the H4 timeframe, the MACD remains negative (-43) and the KDJ is in the oversold region (J=55), confirming that the short-term downtrend is not over despite a slight technical rebound.
🧨Active selling pressure dominates: Recent active trading data shows that the volume of sell orders (Ask) frequently outweighs buy orders (Bid), especially during high-volatility hours, reflecting that the bears are in control. 🔥Position Imbalance: The Long/Short ratio of the Elite account is as high as 43.26, indicating that the crowd is buying the dip too early; history shows that when this ratio is too high in a downtrend, the likelihood of a liquidity sweep on the Long side is very high.
Trade Setup: Short - SNDK
Entry: $1.175,02
SL: $1.210,02
TP1: $1.100,02
TP2: $1.030,05
TP3: $950,58
✅ Click here to trade: 👇
#FBIConfirmsNorthKoreaIsResponsibleForBinanceCryptoHack
217
·
--
Bullish
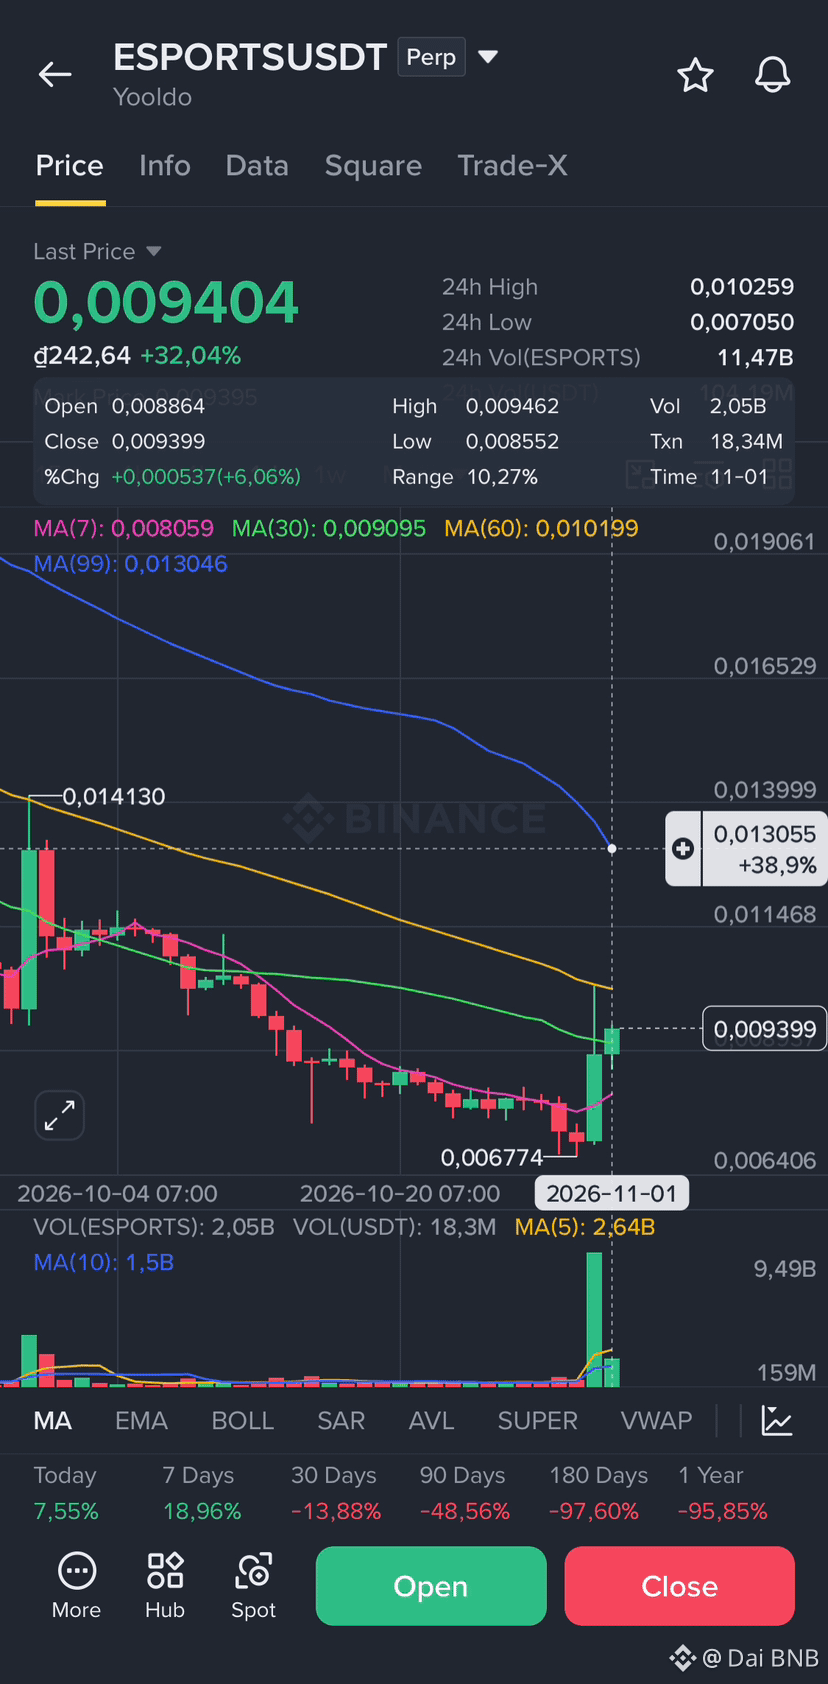
$ESPORTS 🔥 Guy's Open Buy Now 🚀
Trade Setup: Long - ESPORTS 📈
Entry: $0.008800
SL: $0.008605
TP1: $0.009955
TP2: $0.01515
TP3: $0.01158 - $0.013069
✅ Click here to trade: 👇
#BinanceHadAlreadyCovered$6BofHackLoss
{future}(ESPORTSUSDT)
$ESPORTS 🔥 Guy's Open Buy Now 🚀
Trade Setup: Long - ESPORTS 📈
Entry: $0.008800
SL: $0.008605
TP1: $0.009955
TP2: $0.01515
TP3: $0.01158 - $0.013069
✅ Click here to trade: 👇
#BinanceHadAlreadyCovered$6BofHackLoss
Trade Setup: Long - ESPORTS 📈
Entry: $0.008800
SL: $0.008605
TP1: $0.009955
TP2: $0.01515
TP3: $0.01158 - $0.013069
✅ Click here to trade: 👇
#BinanceHadAlreadyCovered$6BofHackLoss
246
·
--
Bullish
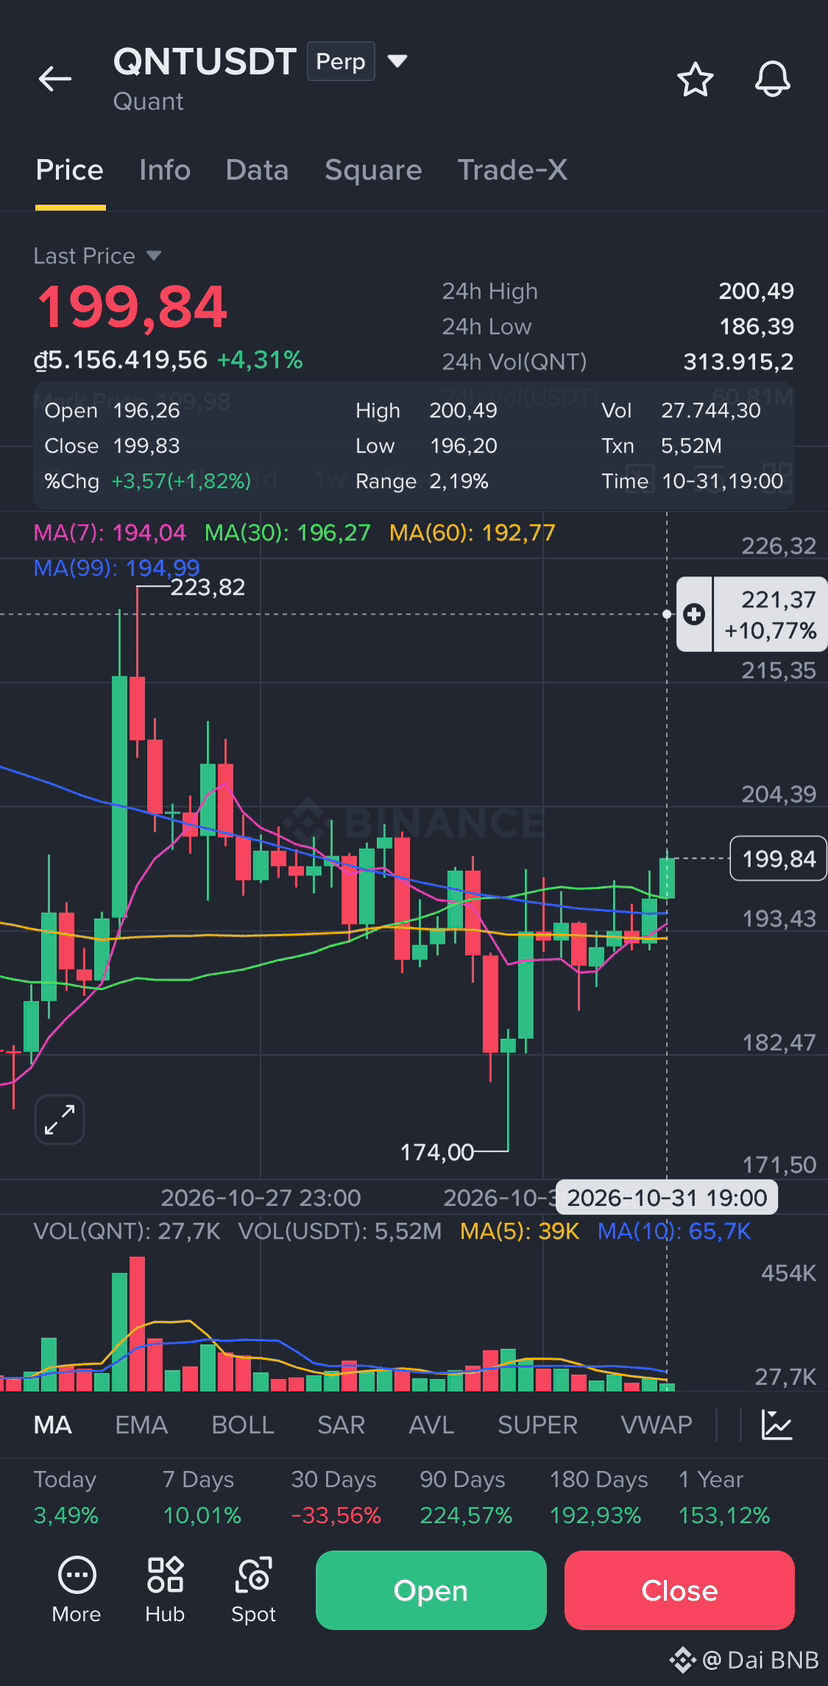
$QNT Technical structure: The MA5/10 are positioned above the longer-term MAs, and the 4H KDJ indicator is trending upward, confirming a short-term recovery trend.
📈 Breaking the 200 Level – Squeezing Positions
Approximately 75% of traders [are positioned].
If the price of QNT (198.37) holds firmly above 200.00, speculative capital will likely trigger a "chase" (buying in) driven by RWA-related news, forcing short sellers to cut their losses and fueling a rapid breakout.
Trade Setup: Long - QNT
Entry: $198,25
SL: $195,55
TP1: $205,02
TP2: $210,55
TP3: $220,89
✅ Click here to trade: 👇
#CZSaysCompensationIsinPlaceUsersAreProtected
{future}(QNTUSDT)
$QNT Technical structure: The MA5/10 are positioned above the longer-term MAs, and the 4H KDJ indicator is trending upward, confirming a short-term recovery trend.
📈 Breaking the 200 Level – Squeezing Positions
Approximately 75% of traders [are positioned].
If the price of QNT (198.37) holds firmly above 200.00, speculative capital will likely trigger a "chase" (buying in) driven by RWA-related news, forcing short sellers to cut their losses and fueling a rapid breakout.
Trade Setup: Long - QNT
Entry: $198,25
SL: $195,55
TP1: $205,02
TP2: $210,55
TP3: $220,89
✅ Click here to trade: 👇
#CZSaysCompensationIsinPlaceUsersAreProtected
📈 Breaking the 200 Level – Squeezing Positions
Approximately 75% of traders [are positioned].
If the price of QNT (198.37) holds firmly above 200.00, speculative capital will likely trigger a "chase" (buying in) driven by RWA-related news, forcing short sellers to cut their losses and fueling a rapid breakout.
Trade Setup: Long - QNT
Entry: $198,25
SL: $195,55
TP1: $205,02
TP2: $210,55
TP3: $220,89
✅ Click here to trade: 👇
#CZSaysCompensationIsinPlaceUsersAreProtected
284
·
--
Bullish
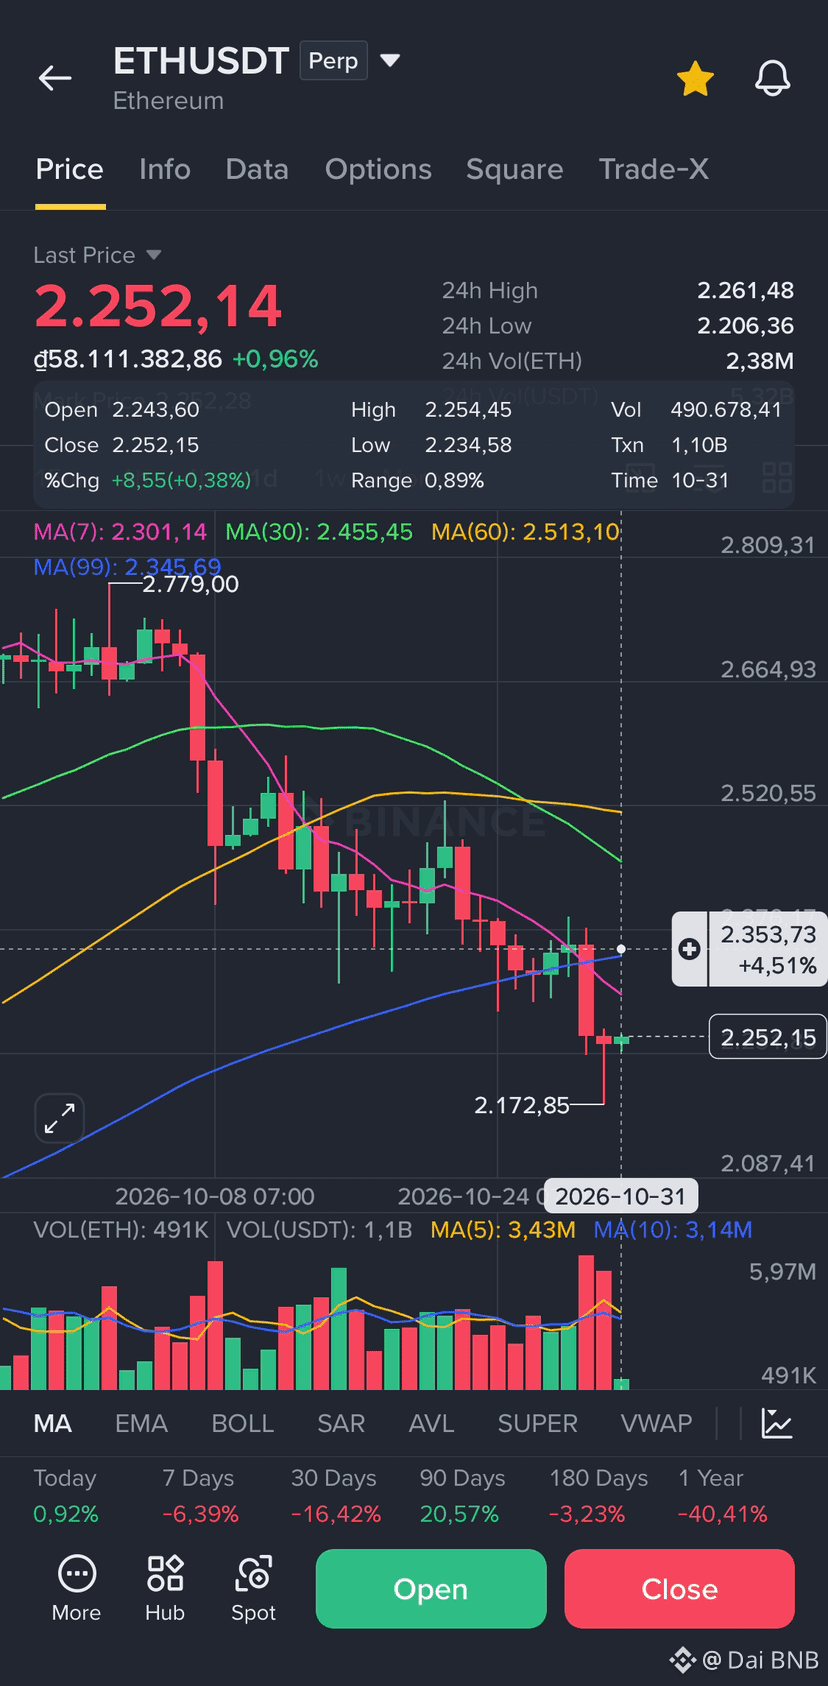
$ETH In the short term, ETH is expected to rebound to the $2,352 price level.
Trade Setup: Long - ETH
Entry: $2.248,52
SL: $2.217,52
TP1: $2.281,45
TP2: $2.316,92
TP3: $2.352
✅ Click here to trade: 👇
#BinanceReports80%Recoveryof$6.3BillioninLossesfromHackIncident
{future}(ETHUSDT)
$ETH In the short term, ETH is expected to rebound to the $2,352 price level.
Trade Setup: Long - ETH
Entry: $2.248,52
SL: $2.217,52
TP1: $2.281,45
TP2: $2.316,92
TP3: $2.352
✅ Click here to trade: 👇
#BinanceReports80%Recoveryof$6.3BillioninLossesfromHackIncident
Trade Setup: Long - ETH
Entry: $2.248,52
SL: $2.217,52
TP1: $2.281,45
TP2: $2.316,92
TP3: $2.352
✅ Click here to trade: 👇
#BinanceReports80%Recoveryof$6.3BillioninLossesfromHackIncident
23
·
--
Bearish
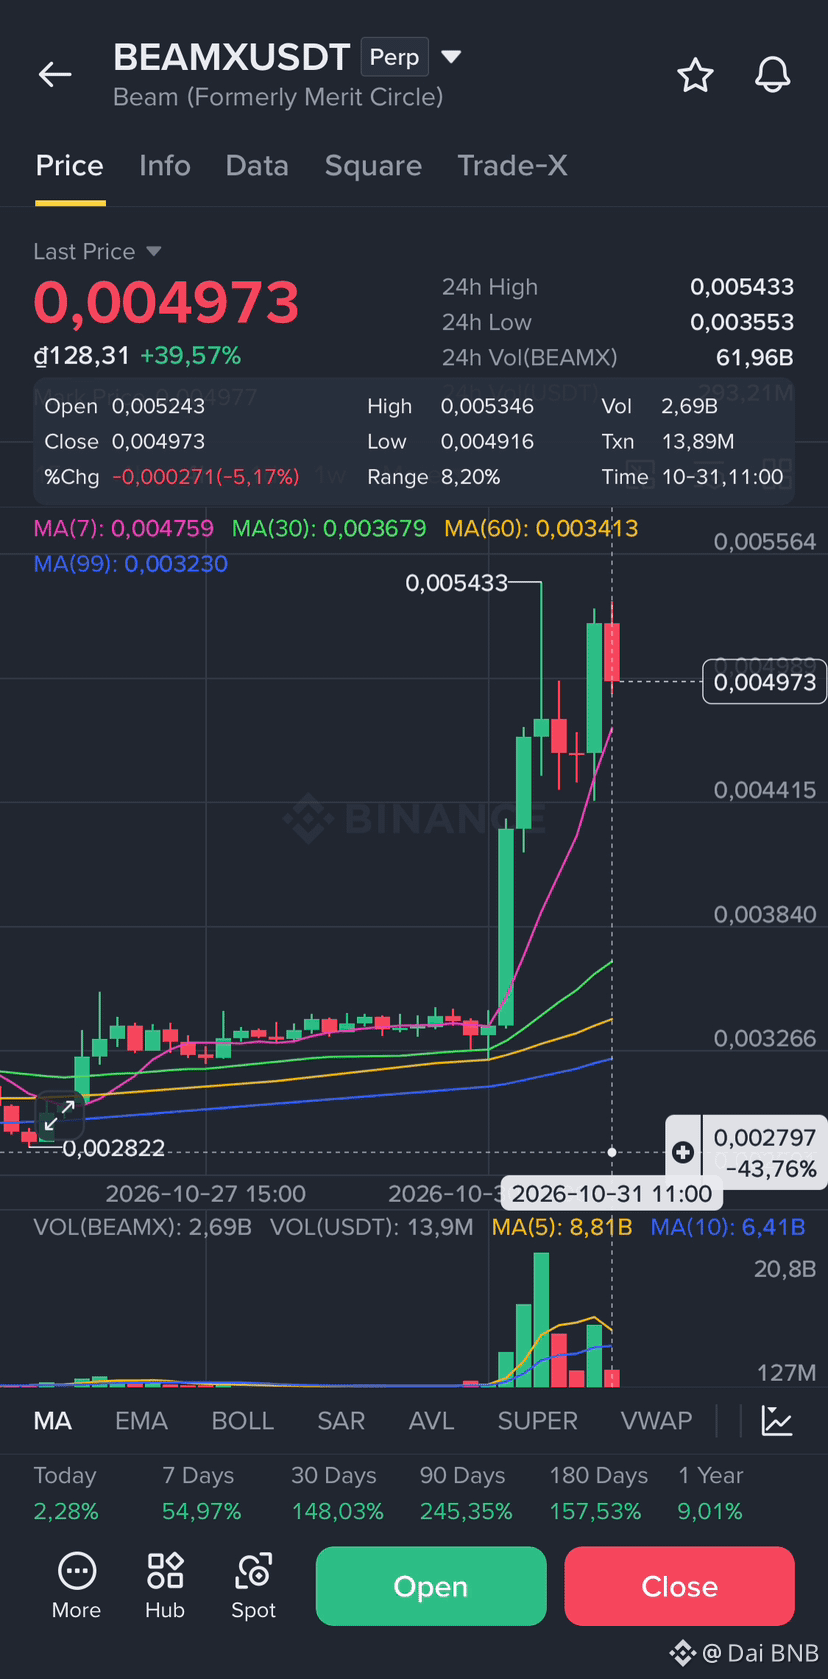
$BEAMX BEAMX failed to break above the resistance zone of $0.0054, making a sharp decline highly likely. Therefore, opening a short position at this time would yield higher profits.
Trade Setup: Short - BEAMX
Entry: $0.005342
SL: $0.005455
TP1: $0.004839
TP2: $0.004442
TP3: $0.003965
✅ Click here to trade: 👇
#FutureTarding
{future}(BEAMXUSDT)
$BEAMX BEAMX failed to break above the resistance zone of $0.0054, making a sharp decline highly likely. Therefore, opening a short position at this time would yield higher profits.
Trade Setup: Short - BEAMX
Entry: $0.005342
SL: $0.005455
TP1: $0.004839
TP2: $0.004442
TP3: $0.003965
✅ Click here to trade: 👇
#FutureTarding
Trade Setup: Short - BEAMX
Entry: $0.005342
SL: $0.005455
TP1: $0.004839
TP2: $0.004442
TP3: $0.003965
✅ Click here to trade: 👇
#FutureTarding
100
·
--
Bearish
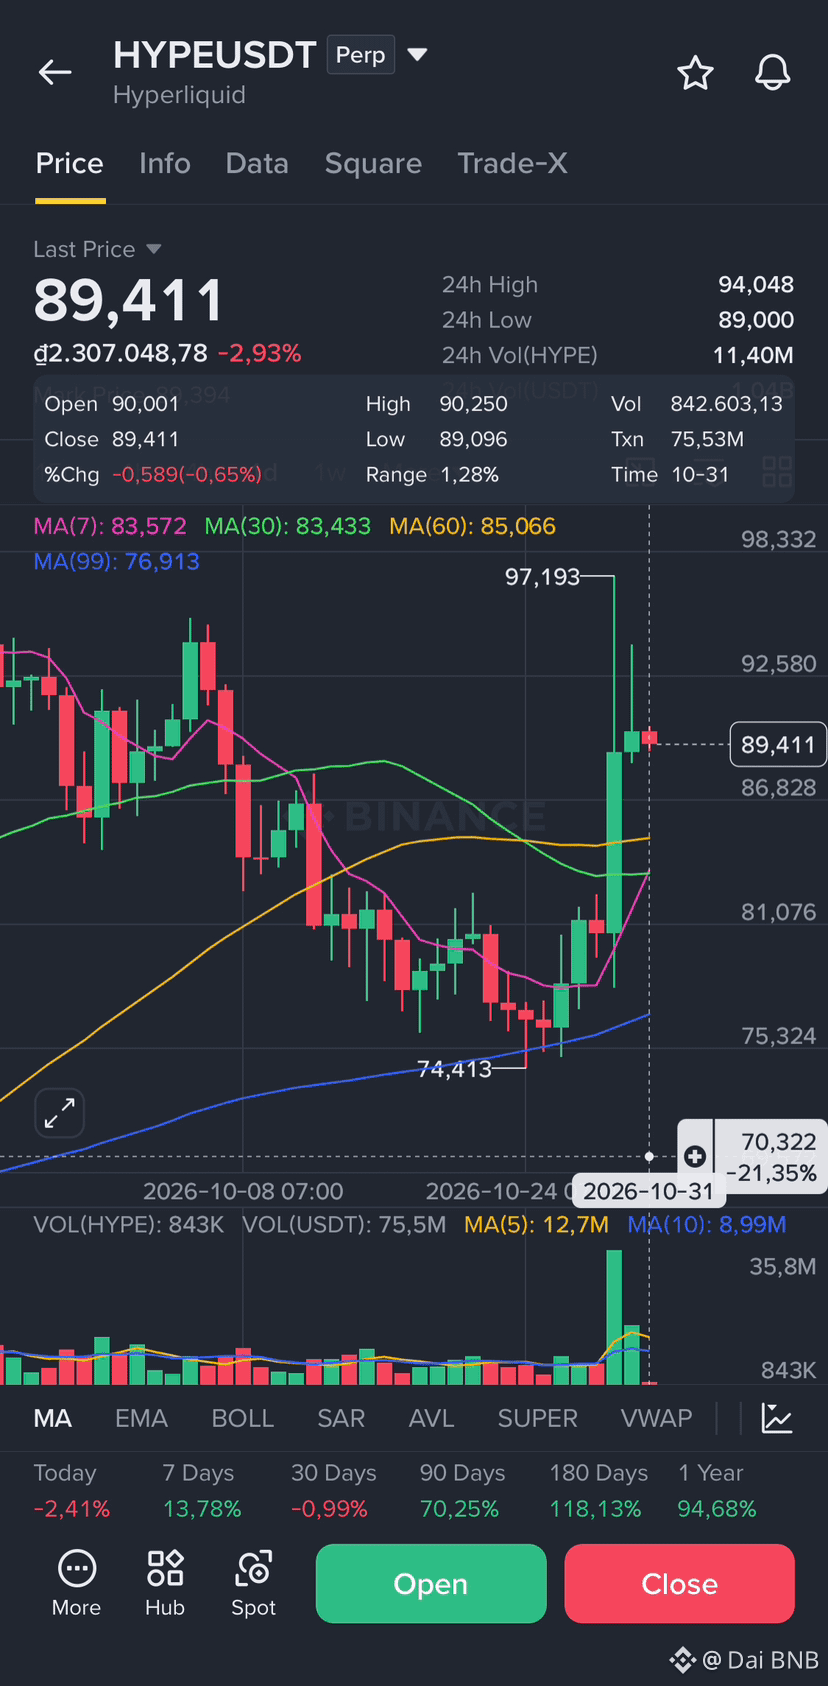
$HYPE The 4-hour and daily charts are bearish; a drop in HYPE to $80-$70 is highly probable.
Trade Setup: Short - HYPE
Entry: $90,022
SL: $91,575
TP1: $85,549
TP2: $80,282
TP3: $75,598 - $70,385
✅ Click here to trade: 👇
#RecallAnnouncesLiquidationPlansToBurn35.86%OfSupply
{future}(HYPEUSDT)
$HYPE The 4-hour and daily charts are bearish; a drop in HYPE to $80-$70 is highly probable.
Trade Setup: Short - HYPE
Entry: $90,022
SL: $91,575
TP1: $85,549
TP2: $80,282
TP3: $75,598 - $70,385
✅ Click here to trade: 👇
#RecallAnnouncesLiquidationPlansToBurn35.86%OfSupply
Trade Setup: Short - HYPE
Entry: $90,022
SL: $91,575
TP1: $85,549
TP2: $80,282
TP3: $75,598 - $70,385
✅ Click here to trade: 👇
#RecallAnnouncesLiquidationPlansToBurn35.86%OfSupply
183
·
--
Bearish
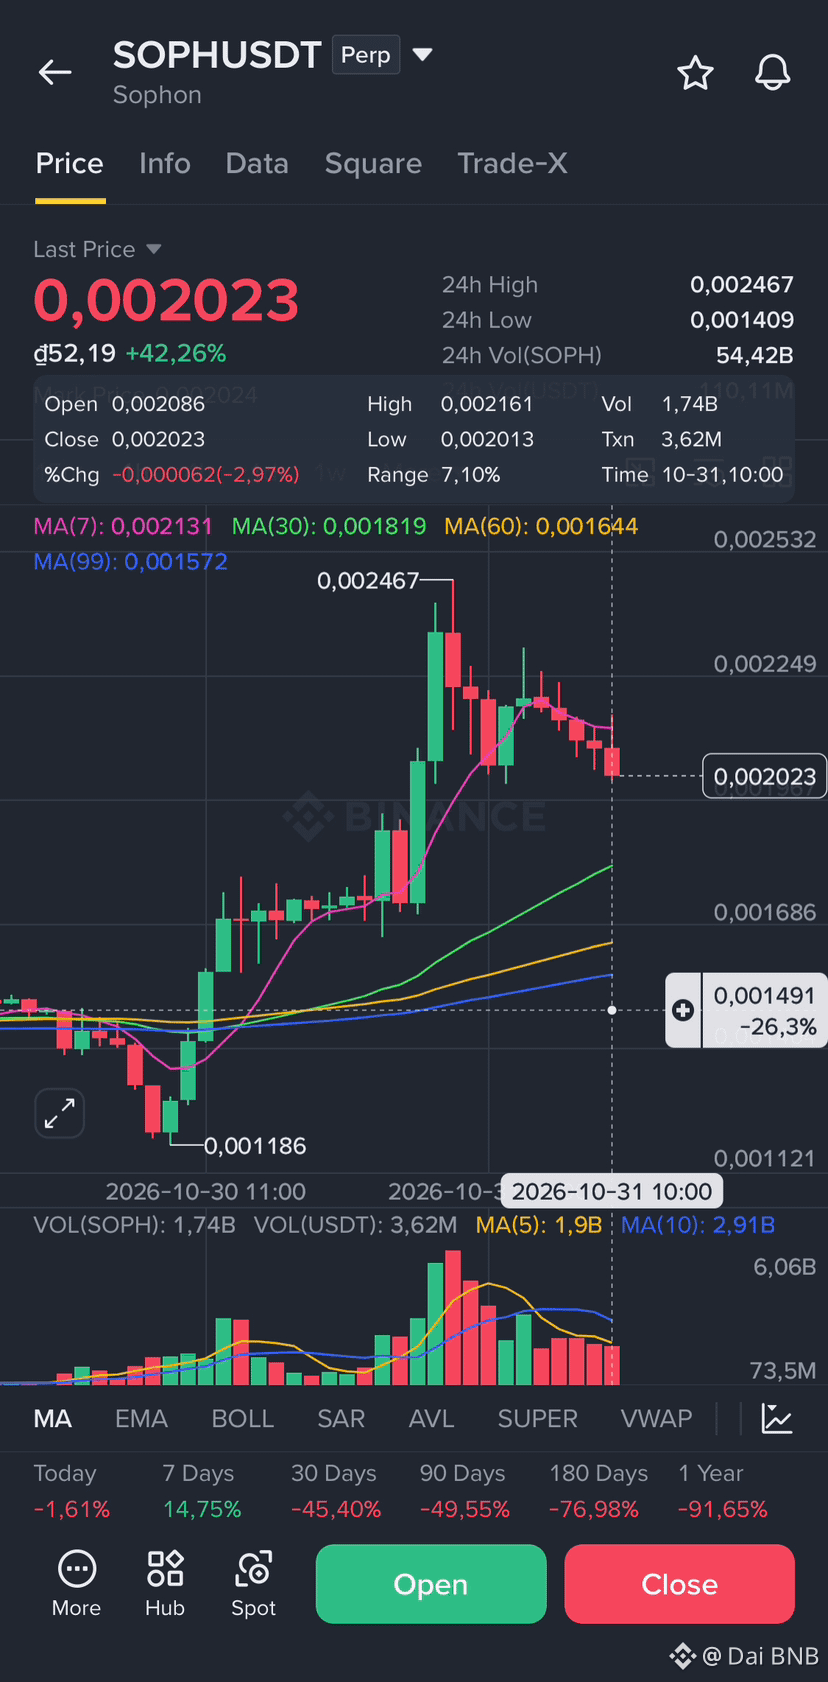
$SOPH The 1-hour chart is gradually moving down to touch the MA30-MA99 on this chart.
Now is the time to open a short position, the price is gradually going down.
Trade Setup: Short - SOPH
Entry: $0.002158
SL: $0.002238
TP1: $0.001928
TP2: $0.001772
TP3: $0.001569
✅ Click here to trade: 👇
#ASICHasReceivedNoPredictionMarketApplications
{future}(SOPHUSDT)
$SOPH The 1-hour chart is gradually moving down to touch the MA30-MA99 on this chart.
Now is the time to open a short position, the price is gradually going down.
Trade Setup: Short - SOPH
Entry: $0.002158
SL: $0.002238
TP1: $0.001928
TP2: $0.001772
TP3: $0.001569
✅ Click here to trade: 👇
#ASICHasReceivedNoPredictionMarketApplications
Now is the time to open a short position, the price is gradually going down.
Trade Setup: Short - SOPH
Entry: $0.002158
SL: $0.002238
TP1: $0.001928
TP2: $0.001772
TP3: $0.001569
✅ Click here to trade: 👇
#ASICHasReceivedNoPredictionMarketApplications
145
·
--
Bearish
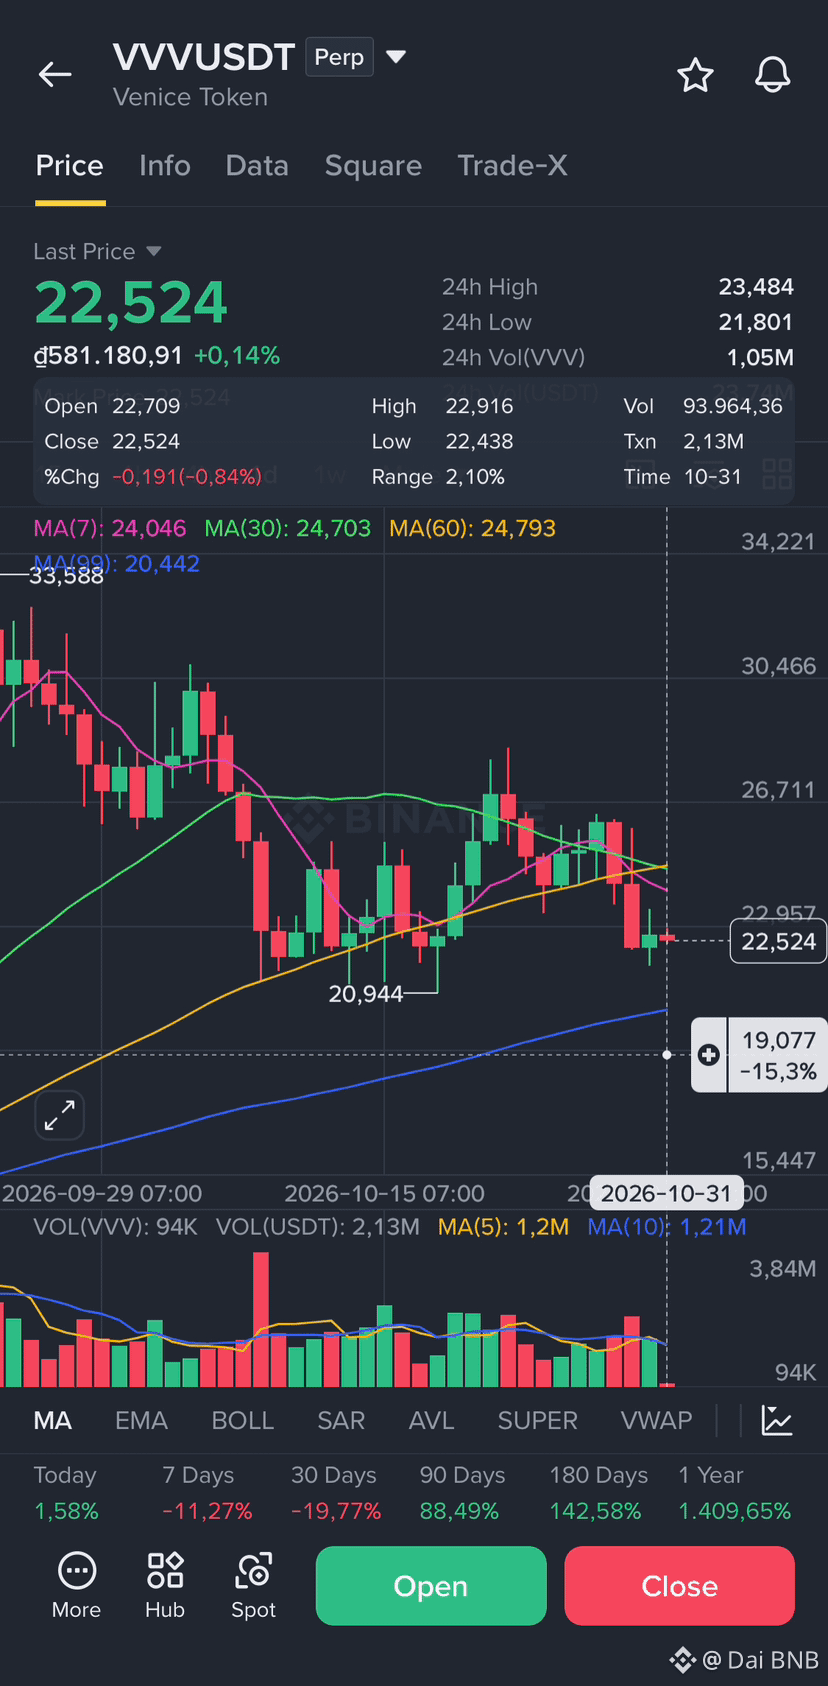
$VVV Today's chart shows VVV is highly likely to fall to $19, with selling pressure accounting for 85%. Opening a short position now offers a higher chance of winning.
Trade Setup: Shot - VVV
Entry: $22,882
SL: $23,192
TP1: $21,668
TP2: $20,522
TP3: $19,022
✅ Click here to trade: 👇
#OpenAICutsFundraisingTargetBy$10B
{future}(VVVUSDT)
$VVV Today's chart shows VVV is highly likely to fall to $19, with selling pressure accounting for 85%. Opening a short position now offers a higher chance of winning.
Trade Setup: Shot - VVV
Entry: $22,882
SL: $23,192
TP1: $21,668
TP2: $20,522
TP3: $19,022
✅ Click here to trade: 👇
#OpenAICutsFundraisingTargetBy$10B
Trade Setup: Shot - VVV
Entry: $22,882
SL: $23,192
TP1: $21,668
TP2: $20,522
TP3: $19,022
✅ Click here to trade: 👇
#OpenAICutsFundraisingTargetBy$10B
256
·
--
Bullish
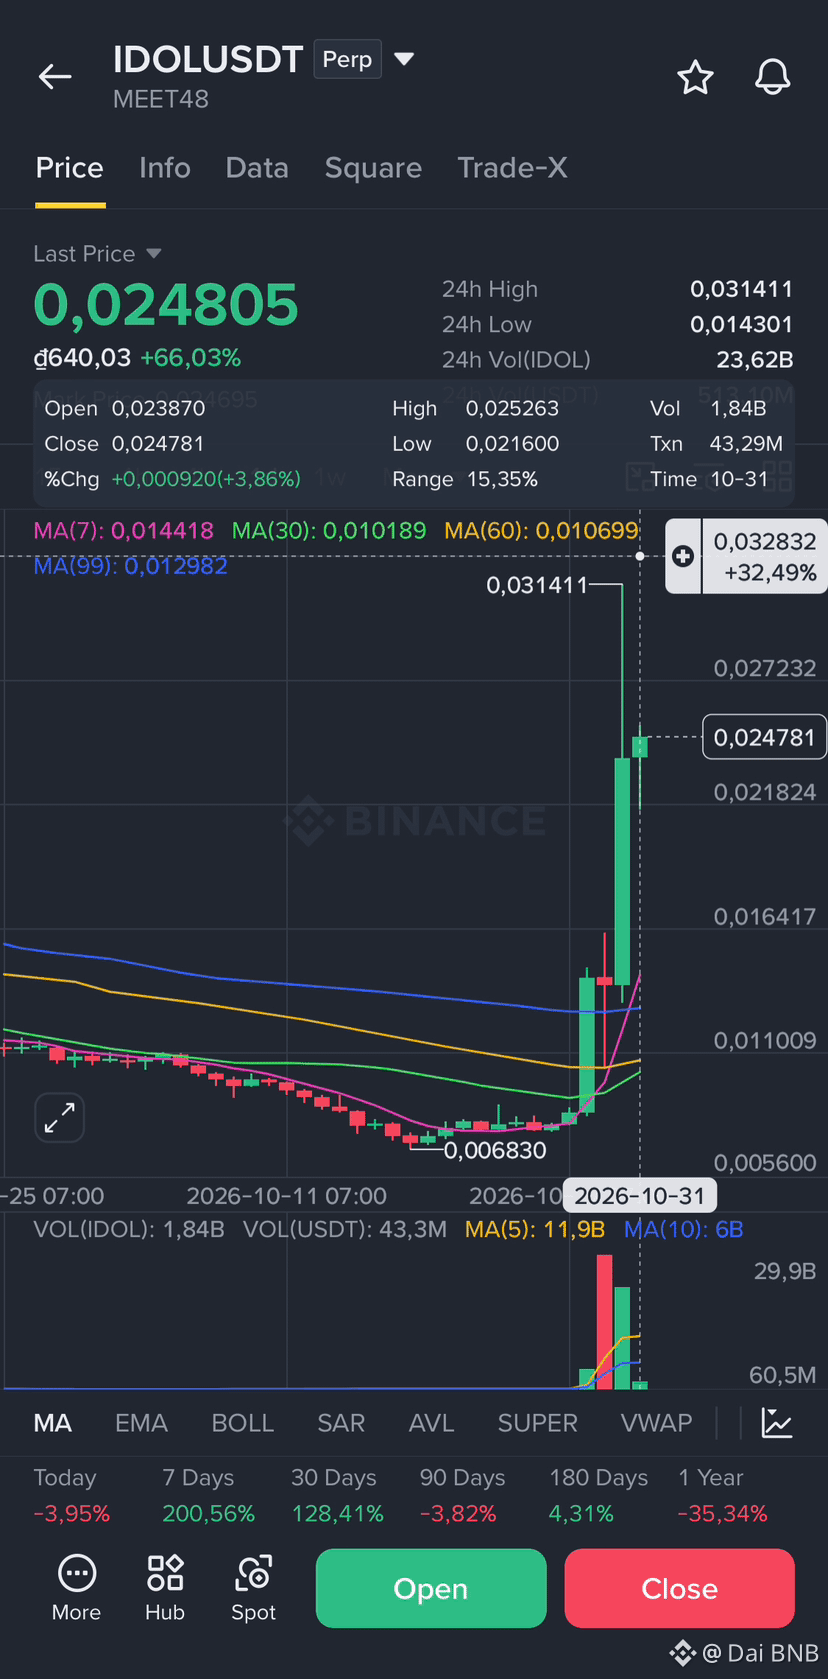
$IDOL IDOL is still doing very well and its price will continue to rise sharply, so those who are shorting should be careful.
Trade Setup: Long - IDOL
Entry: $0.022732
SL: $0.021625
TP1: $0.027125
TP2: $0.030952
TP3: $0.035898 - $0.038539
✅ Click here to trade: 👇
#SuspectedNorthKoreaAttacksAccountForNearly89%OfCryptoHackLosses
{future}(IDOLUSDT)
$IDOL IDOL is still doing very well and its price will continue to rise sharply, so those who are shorting should be careful.
Trade Setup: Long - IDOL
Entry: $0.022732
SL: $0.021625
TP1: $0.027125
TP2: $0.030952
TP3: $0.035898 - $0.038539
✅ Click here to trade: 👇
#SuspectedNorthKoreaAttacksAccountForNearly89%OfCryptoHackLosses
Trade Setup: Long - IDOL
Entry: $0.022732
SL: $0.021625
TP1: $0.027125
TP2: $0.030952
TP3: $0.035898 - $0.038539
✅ Click here to trade: 👇
#SuspectedNorthKoreaAttacksAccountForNearly89%OfCryptoHackLosses
370
·
--
Bullish
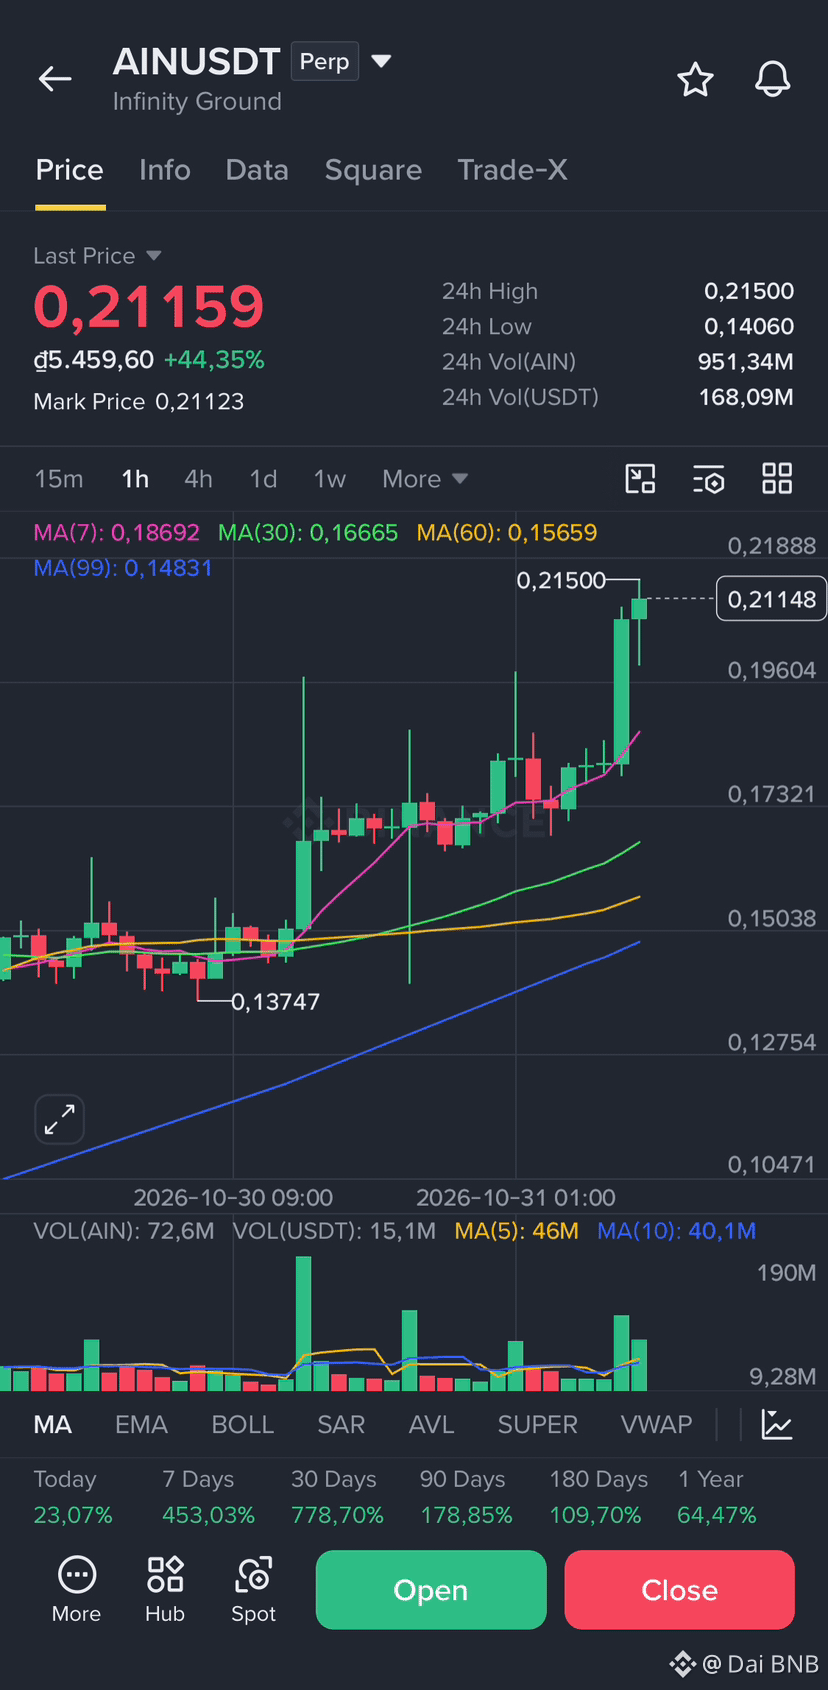
$AIN The upward momentum is still very strong, so open another Long position; the chances of winning will be higher.
Trade Setup: Long - AIN
Entry: $0.20015
SL: $0.19622
TP1: $0.23205
TP2: $0.26012
TP3: $0.30152
✅ Click here to trade: 👇
#ASICHasReceivedNoPredictionMarketApplications
{future}(AINUSDT)
$AIN The upward momentum is still very strong, so open another Long position; the chances of winning will be higher.
Trade Setup: Long - AIN
Entry: $0.20015
SL: $0.19622
TP1: $0.23205
TP2: $0.26012
TP3: $0.30152
✅ Click here to trade: 👇
#ASICHasReceivedNoPredictionMarketApplications
Trade Setup: Long - AIN
Entry: $0.20015
SL: $0.19622
TP1: $0.23205
TP2: $0.26012
TP3: $0.30152
✅ Click here to trade: 👇
#ASICHasReceivedNoPredictionMarketApplications
1
1
875
Log in to explore more content
Join global crypto users on Binance Square
⚡️ Get latest and useful information about crypto.
💬 Trusted by the world’s largest crypto exchange.
👍 Discover real insights from verified creators.
Email / Phone number
Trending Topics
BinanceWithdrawalScamWarning
19,983 views
483 Discussing
Binance Warns Users of Withdrawal Scams as Services Resume: It Will Never Charge Fees, Sell Queue Spots or Ask You to Move Funds to a “Vault”
Binance News
·10 Likes
·6k views
USMidtermElections
573,958 views
3,055 Discussing
USOctoberNFP-AreRateCutsStillPossible
29,400 views
435 Discussing