
Cycle Shark
2.2k Posts

Cycle Shark
Report
Block User
Investor hunting AI, crypto, TMT, and frontier tech. I track unconventional macro-political-economic signals.
0 Following
616 Followers
1.6K+ Liked
Posts
·
--
BlackRock and other ETFs just offloaded $1.07B in $BTC this week. Month-to-date? Over $2.35B dumped.
This is institutional distribution at scale. When the smart money that drove the rally starts exiting in size, it's worth paying attention. ETF flows were the narrative that pushed $BTC from $40K to $70K+ — now they're reversing.
A few things to consider:
1. This isn't retail panic selling. This is structured, large-scale redemption pressure from institutional vehicles.
2. ETF outflows often precede broader market weakness. When the marginal buyer (institutions via ETFs) becomes the marginal seller, price discovery gets messy.
3. Liquidity conditions matter. If this is happening while global liquidity is tightening or risk-off sentiment is spreading across macro markets, the downside accelerates.
4. The $2.35B figure in one month is significant relative to total ETF AUM. It suggests either profit-taking after a strong run, or positioning shifts ahead of expected volatility.
Watch the next few weeks. If outflows continue at this pace, we're looking at a regime change in how institutions are treating $BTC exposure — from accumulation to distribution. That's not a dip to buy blindly. That's a trend shift.
BlackRock and other ETFs just offloaded $1.07B in $BTC this week. Month-to-date? Over $2.35B dumped.
This is institutional distribution at scale. When the smart money that drove the rally starts exiting in size, it's worth paying attention. ETF flows were the narrative that pushed $BTC from $40K to $70K+ — now they're reversing.
A few things to consider:
1. This isn't retail panic selling. This is structured, large-scale redemption pressure from institutional vehicles.
2. ETF outflows often precede broader market weakness. When the marginal buyer (institutions via ETFs) becomes the marginal seller, price discovery gets messy.
3. Liquidity conditions matter. If this is happening while global liquidity is tightening or risk-off sentiment is spreading across macro markets, the downside accelerates.
4. The $2.35B figure in one month is significant relative to total ETF AUM. It suggests either profit-taking after a strong run, or positioning shifts ahead of expected volatility.
Watch the next few weeks. If outflows continue at this pace, we're looking at a regime change in how institutions are treating $BTC exposure — from accumulation to distribution. That's not a dip to buy blindly. That's a trend shift.
This is institutional distribution at scale. When the smart money that drove the rally starts exiting in size, it's worth paying attention. ETF flows were the narrative that pushed $BTC from $40K to $70K+ — now they're reversing.
A few things to consider:
1. This isn't retail panic selling. This is structured, large-scale redemption pressure from institutional vehicles.
2. ETF outflows often precede broader market weakness. When the marginal buyer (institutions via ETFs) becomes the marginal seller, price discovery gets messy.
3. Liquidity conditions matter. If this is happening while global liquidity is tightening or risk-off sentiment is spreading across macro markets, the downside accelerates.
4. The $2.35B figure in one month is significant relative to total ETF AUM. It suggests either profit-taking after a strong run, or positioning shifts ahead of expected volatility.
Watch the next few weeks. If outflows continue at this pace, we're looking at a regime change in how institutions are treating $BTC exposure — from accumulation to distribution. That's not a dip to buy blindly. That's a trend shift.
1
1.1k
·
--
Market just got wrecked. $BTC dropped under $67k, $ETH below $1,900.
$230M in longs wiped out in 20 minutes.
Leverage kills fast when volatility spikes. This is what overleveraged positioning looks like when the bid disappears — cascading liquidations feeding into themselves.
Usual pattern: panic selloff → flush out weak hands → potential bounce if there's real buying interest underneath. But right now, the tape shows pure liquidation pressure.
Watch funding rates and open interest to see if this was just a leverage flush or if there's deeper selling coming.
Market just got wrecked. $BTC dropped under $67k, $ETH below $1,900.
$230M in longs wiped out in 20 minutes.
Leverage kills fast when volatility spikes. This is what overleveraged positioning looks like when the bid disappears — cascading liquidations feeding into themselves.
Usual pattern: panic selloff → flush out weak hands → potential bounce if there's real buying interest underneath. But right now, the tape shows pure liquidation pressure.
Watch funding rates and open interest to see if this was just a leverage flush or if there's deeper selling coming.
$230M in longs wiped out in 20 minutes.
Leverage kills fast when volatility spikes. This is what overleveraged positioning looks like when the bid disappears — cascading liquidations feeding into themselves.
Usual pattern: panic selloff → flush out weak hands → potential bounce if there's real buying interest underneath. But right now, the tape shows pure liquidation pressure.
Watch funding rates and open interest to see if this was just a leverage flush or if there's deeper selling coming.
430
·
--
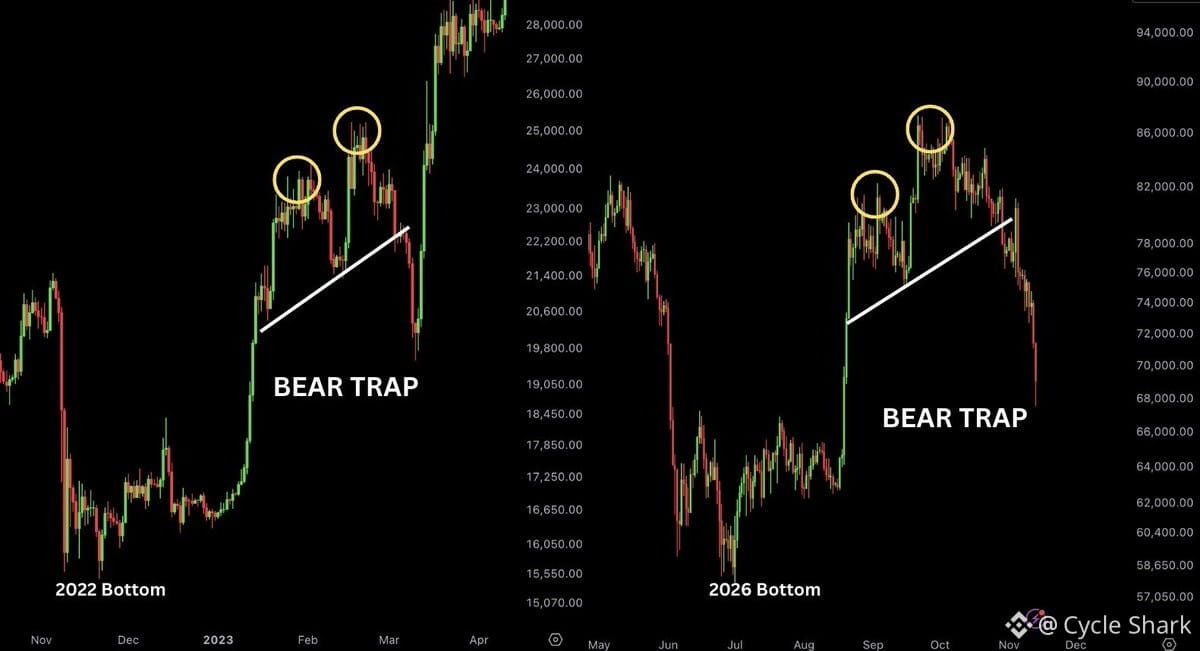
We might be seeing the same bear trap pattern that played out in 2023.
Back then, the market faked everyone out with what looked like a major downturn, shaking out weak hands before the real rally began. The setup now has similar characteristics — sharp drops creating panic, retail capitulating, and sentiment turning extremely negative right before a potential reversal.
The 2023 bear trap caught most people off guard because:
1. Everyone was positioned for further downside
2. Macro conditions looked terrible on the surface
3. The bounce came faster and stronger than expected
If this parallel holds, we're at the exact moment where conviction matters most. The question is whether liquidity conditions and market structure support a similar reversal, or if this time the bear case actually plays out.
Watch how price action behaves at key support levels and whether we see aggressive buying on dips like we did before the 2023 turnaround.
We might be seeing the same bear trap pattern that played out in 2023.
Back then, the market faked everyone out with what looked like a major downturn, shaking out weak hands before the real rally began. The setup now has similar characteristics — sharp drops creating panic, retail capitulating, and sentiment turning extremely negative right before a potential reversal.
The 2023 bear trap caught most people off guard because:
1. Everyone was positioned for further downside
2. Macro conditions looked terrible on the surface
3. The bounce came faster and stronger than expected
If this parallel holds, we're at the exact moment where conviction matters most. The question is whether liquidity conditions and market structure support a similar reversal, or if this time the bear case actually plays out.
Watch how price action behaves at key support levels and whether we see aggressive buying on dips like we did before the 2023 turnaround.
Back then, the market faked everyone out with what looked like a major downturn, shaking out weak hands before the real rally began. The setup now has similar characteristics — sharp drops creating panic, retail capitulating, and sentiment turning extremely negative right before a potential reversal.
The 2023 bear trap caught most people off guard because:
1. Everyone was positioned for further downside
2. Macro conditions looked terrible on the surface
3. The bounce came faster and stronger than expected
If this parallel holds, we're at the exact moment where conviction matters most. The question is whether liquidity conditions and market structure support a similar reversal, or if this time the bear case actually plays out.
Watch how price action behaves at key support levels and whether we see aggressive buying on dips like we did before the 2023 turnaround.
1
2
5
3.1k
·
--
UK, Singapore, and Thailand central banks just completed a successful pilot testing cross-border trading between traditional fiat and tokenized currencies.
This isn't some distant future anymore. Three major financial centers are actively testing the rails that will connect legacy banking systems with onchain settlement. The implications are bigger than most people realize:
1. Central banks are building the infrastructure for programmable money at the sovereign level
2. Cross-border settlements could shift from days to seconds
3. The line between "traditional finance" and "crypto" is dissolving faster than expected
When you see coordinated tests across UK, Singapore, and Thailand, you're watching the early stages of a new global financial architecture. These aren't crypto-native experiments — these are the institutions that control trillions in capital flow testing how to bring that capital onchain.
The tokenization wave isn't coming. It's already here, being built by the very institutions that were supposed to resist it.
UK, Singapore, and Thailand central banks just completed a successful pilot testing cross-border trading between traditional fiat and tokenized currencies.
This isn't some distant future anymore. Three major financial centers are actively testing the rails that will connect legacy banking systems with onchain settlement. The implications are bigger than most people realize:
1. Central banks are building the infrastructure for programmable money at the sovereign level
2. Cross-border settlements could shift from days to seconds
3. The line between "traditional finance" and "crypto" is dissolving faster than expected
When you see coordinated tests across UK, Singapore, and Thailand, you're watching the early stages of a new global financial architecture. These aren't crypto-native experiments — these are the institutions that control trillions in capital flow testing how to bring that capital onchain.
The tokenization wave isn't coming. It's already here, being built by the very institutions that were supposed to resist it.
This isn't some distant future anymore. Three major financial centers are actively testing the rails that will connect legacy banking systems with onchain settlement. The implications are bigger than most people realize:
1. Central banks are building the infrastructure for programmable money at the sovereign level
2. Cross-border settlements could shift from days to seconds
3. The line between "traditional finance" and "crypto" is dissolving faster than expected
When you see coordinated tests across UK, Singapore, and Thailand, you're watching the early stages of a new global financial architecture. These aren't crypto-native experiments — these are the institutions that control trillions in capital flow testing how to bring that capital onchain.
The tokenization wave isn't coming. It's already here, being built by the very institutions that were supposed to resist it.
74
·
--
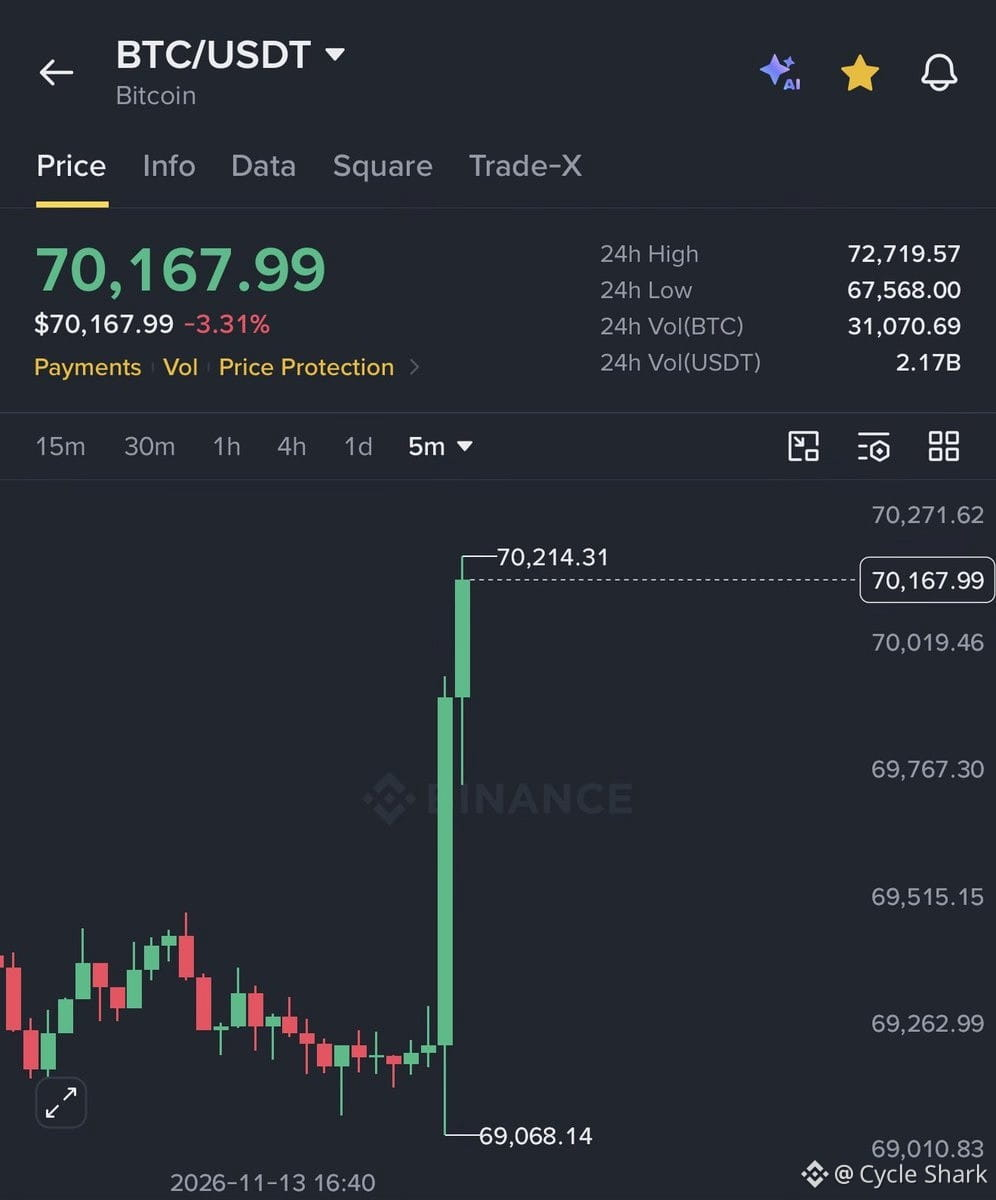
Bitcoin just smashed through $70,000 right after PPI data came in softer than expected.
$50 million in shorts got wiped out in 15 minutes.
This is classic — macro data surprises to the downside, risk-on assets rip, and overleveraged bears get crushed. The speed of the move tells you how crowded the short side was. When everyone's positioned the same way and the narrative flips, you get violent squeezes like this.
PPI running cooler than forecasts signals less inflationary pressure, which means the Fed has more room to stay accommodative or at least not tighten further. That's rocket fuel for $BTC and risk assets in general. Lower inflation expectations → lower real rates → higher asset prices.
The $50M liquidation cascade is the leverage unwind in action. Shorts get margin called, forced to buy back $BTC to close positions, which pushes price higher, which triggers more liquidations — rinse and repeat. It's a self-reinforcing feedback loop.
This kind of price action also confirms that $BTC is still highly sensitive to macro liquidity conditions and Fed policy signals. It's not just a speculative tech bet anymore — it trades like a global liquidity barometer.
Bitcoin just smashed through $70,000 right after PPI data came in softer than expected.
$50 million in shorts got wiped out in 15 minutes.
This is classic — macro data surprises to the downside, risk-on assets rip, and overleveraged bears get crushed. The speed of the move tells you how crowded the short side was. When everyone's positioned the same way and the narrative flips, you get violent squeezes like this.
PPI running cooler than forecasts signals less inflationary pressure, which means the Fed has more room to stay accommodative or at least not tighten further. That's rocket fuel for $BTC and risk assets in general. Lower inflation expectations → lower real rates → higher asset prices.
The $50M liquidation cascade is the leverage unwind in action. Shorts get margin called, forced to buy back $BTC to close positions, which pushes price higher, which triggers more liquidations — rinse and repeat. It's a self-reinforcing feedback loop.
This kind of price action also confirms that $BTC is still highly sensitive to macro liquidity conditions and Fed policy signals. It's not just a speculative tech bet anymore — it trades like a global liquidity barometer.
$50 million in shorts got wiped out in 15 minutes.
This is classic — macro data surprises to the downside, risk-on assets rip, and overleveraged bears get crushed. The speed of the move tells you how crowded the short side was. When everyone's positioned the same way and the narrative flips, you get violent squeezes like this.
PPI running cooler than forecasts signals less inflationary pressure, which means the Fed has more room to stay accommodative or at least not tighten further. That's rocket fuel for $BTC and risk assets in general. Lower inflation expectations → lower real rates → higher asset prices.
The $50M liquidation cascade is the leverage unwind in action. Shorts get margin called, forced to buy back $BTC to close positions, which pushes price higher, which triggers more liquidations — rinse and repeat. It's a self-reinforcing feedback loop.
This kind of price action also confirms that $BTC is still highly sensitive to macro liquidity conditions and Fed policy signals. It's not just a speculative tech bet anymore — it trades like a global liquidity barometer.
145
·
--
US PPI just hit 6.5% — highest we've seen in nearly 4 years.
This matters because producer price inflation feeds through to consumer prices eventually. When manufacturers and wholesalers pay more, those costs get passed down the chain. The Fed's been trying to engineer a soft landing, but sticky producer inflation complicates that narrative.
Context: PPI tracks what producers pay for goods and services before they reach consumers. It's a leading indicator for CPI. If PPI stays elevated, consumer inflation pressures won't fade as quickly as the market's been pricing in.
What this means:
1. Rate cut expectations need recalibration. Market was getting comfortable with cuts starting mid-year, but persistent inflation data pushes that timeline out.
2. Dollar strength likely continues. Higher-for-longer rates support $USD, which creates headwinds for risk assets and emerging markets.
3. Crypto and growth assets face pressure. When real rates stay high, speculative assets lose relative appeal. Liquidity conditions tighten.
The macro backdrop is shifting. This isn't 2021 liquidity anymore — we're in a regime where inflation data actually moves markets again. Pay attention to how bond yields react over the next few sessions. That'll tell you whether this is a one-off print or the start of a new trend.
US PPI just hit 6.5% — highest we've seen in nearly 4 years.
This matters because producer price inflation feeds through to consumer prices eventually. When manufacturers and wholesalers pay more, those costs get passed down the chain. The Fed's been trying to engineer a soft landing, but sticky producer inflation complicates that narrative.
Context: PPI tracks what producers pay for goods and services before they reach consumers. It's a leading indicator for CPI. If PPI stays elevated, consumer inflation pressures won't fade as quickly as the market's been pricing in.
What this means:
1. Rate cut expectations need recalibration. Market was getting comfortable with cuts starting mid-year, but persistent inflation data pushes that timeline out.
2. Dollar strength likely continues. Higher-for-longer rates support $USD, which creates headwinds for risk assets and emerging markets.
3. Crypto and growth assets face pressure. When real rates stay high, speculative assets lose relative appeal. Liquidity conditions tighten.
The macro backdrop is shifting. This isn't 2021 liquidity anymore — we're in a regime where inflation data actually moves markets again. Pay attention to how bond yields react over the next few sessions. That'll tell you whether this is a one-off print or the start of a new trend.
This matters because producer price inflation feeds through to consumer prices eventually. When manufacturers and wholesalers pay more, those costs get passed down the chain. The Fed's been trying to engineer a soft landing, but sticky producer inflation complicates that narrative.
Context: PPI tracks what producers pay for goods and services before they reach consumers. It's a leading indicator for CPI. If PPI stays elevated, consumer inflation pressures won't fade as quickly as the market's been pricing in.
What this means:
1. Rate cut expectations need recalibration. Market was getting comfortable with cuts starting mid-year, but persistent inflation data pushes that timeline out.
2. Dollar strength likely continues. Higher-for-longer rates support $USD, which creates headwinds for risk assets and emerging markets.
3. Crypto and growth assets face pressure. When real rates stay high, speculative assets lose relative appeal. Liquidity conditions tighten.
The macro backdrop is shifting. This isn't 2021 liquidity anymore — we're in a regime where inflation data actually moves markets again. Pay attention to how bond yields react over the next few sessions. That'll tell you whether this is a one-off print or the start of a new trend.

2
1
2k
·
--
$BTC is sitting right on its 200-week moving average around $68,000. If bulls can't hold this and close the week above it, things could get messy.
Historically, midterm election years have crushed crypto short-term but set up massive long-term entries. The pattern is weirdly consistent:
Nov 2014 (midterm): $320
Nov 2016: $750
Nov 2017: $11,000 — that's a 34x from the midterm low
Nov 2018 (midterm): $3,500
Nov 2020: $19,000
Nov 2021: $69,000 — 20x from the midterm low
Nov 2022 (midterm): $20,500
Nov 2024: $99,000
Nov 2025 projection: $111,000 — about 5.5x from the midterm low
If the cycle holds:
Nov 2026 (midterm): could drop back to ~$72,000
Nov 2028–2029: a 3x move from there would push $BTC above $200,000
The setup is simple: midterm years hurt, but they also mark generational lows. If you're long-term focused, these dips are where fortunes get built — not during the euphoria.
$BTC is sitting right on its 200-week moving average around $68,000. If bulls can't hold this and close the week above it, things could get messy.
Historically, midterm election years have crushed crypto short-term but set up massive long-term entries. The pattern is weirdly consistent:
Nov 2014 (midterm): $320
Nov 2016: $750
Nov 2017: $11,000 — that's a 34x from the midterm low
Nov 2018 (midterm): $3,500
Nov 2020: $19,000
Nov 2021: $69,000 — 20x from the midterm low
Nov 2022 (midterm): $20,500
Nov 2024: $99,000
Nov 2025 projection: $111,000 — about 5.5x from the midterm low
If the cycle holds:
Nov 2026 (midterm): could drop back to ~$72,000
Nov 2028–2029: a 3x move from there would push $BTC above $200,000
The setup is simple: midterm years hurt, but they also mark generational lows. If you're long-term focused, these dips are where fortunes get built — not during the euphoria.
Historically, midterm election years have crushed crypto short-term but set up massive long-term entries. The pattern is weirdly consistent:
Nov 2014 (midterm): $320
Nov 2016: $750
Nov 2017: $11,000 — that's a 34x from the midterm low
Nov 2018 (midterm): $3,500
Nov 2020: $19,000
Nov 2021: $69,000 — 20x from the midterm low
Nov 2022 (midterm): $20,500
Nov 2024: $99,000
Nov 2025 projection: $111,000 — about 5.5x from the midterm low
If the cycle holds:
Nov 2026 (midterm): could drop back to ~$72,000
Nov 2028–2029: a 3x move from there would push $BTC above $200,000
The setup is simple: midterm years hurt, but they also mark generational lows. If you're long-term focused, these dips are where fortunes get built — not during the euphoria.
5
1.3k
·
--
The past 3 months felt like textbook bull confirmation for $BTC — reclaimed 50W MA, higher high printed, weekly Supertrend flipped bullish. All the technical signals lined up.
Yet during that same window, we absorbed serious macro FUD: geopolitical tensions, the Binance hack, Clarity Act failure, AI stock selloffs. Bitcoin held.
Then Nvidia's CEO scandal breaks — something with zero fundamental link to crypto — and suddenly $BTC loses every key level it just reclaimed.
This feels orchestrated. Like the players who missed the Q4 dip are now forcing one. They sat out the rally, watched retail pile in on confirmation signals, and are now using any narrative excuse to shake the tree and reload lower.
Retail once again caught holding the bag while big money rewrites the script. The manipulation isn't even subtle anymore — it's just brazen enough that most people will rationalize it as "the market being the market."
But when a CEO's personal life tanks an asset class that has nothing to do with him, you have to ask: who benefits from this narrative, and who's setting it up?
The past 3 months felt like textbook bull confirmation for $BTC — reclaimed 50W MA, higher high printed, weekly Supertrend flipped bullish. All the technical signals lined up.
Yet during that same window, we absorbed serious macro FUD: geopolitical tensions, the Binance hack, Clarity Act failure, AI stock selloffs. Bitcoin held.
Then Nvidia's CEO scandal breaks — something with zero fundamental link to crypto — and suddenly $BTC loses every key level it just reclaimed.
This feels orchestrated. Like the players who missed the Q4 dip are now forcing one. They sat out the rally, watched retail pile in on confirmation signals, and are now using any narrative excuse to shake the tree and reload lower.
Retail once again caught holding the bag while big money rewrites the script. The manipulation isn't even subtle anymore — it's just brazen enough that most people will rationalize it as "the market being the market."
But when a CEO's personal life tanks an asset class that has nothing to do with him, you have to ask: who benefits from this narrative, and who's setting it up?
Yet during that same window, we absorbed serious macro FUD: geopolitical tensions, the Binance hack, Clarity Act failure, AI stock selloffs. Bitcoin held.
Then Nvidia's CEO scandal breaks — something with zero fundamental link to crypto — and suddenly $BTC loses every key level it just reclaimed.
This feels orchestrated. Like the players who missed the Q4 dip are now forcing one. They sat out the rally, watched retail pile in on confirmation signals, and are now using any narrative excuse to shake the tree and reload lower.
Retail once again caught holding the bag while big money rewrites the script. The manipulation isn't even subtle anymore — it's just brazen enough that most people will rationalize it as "the market being the market."
But when a CEO's personal life tanks an asset class that has nothing to do with him, you have to ask: who benefits from this narrative, and who's setting it up?
380
·
--
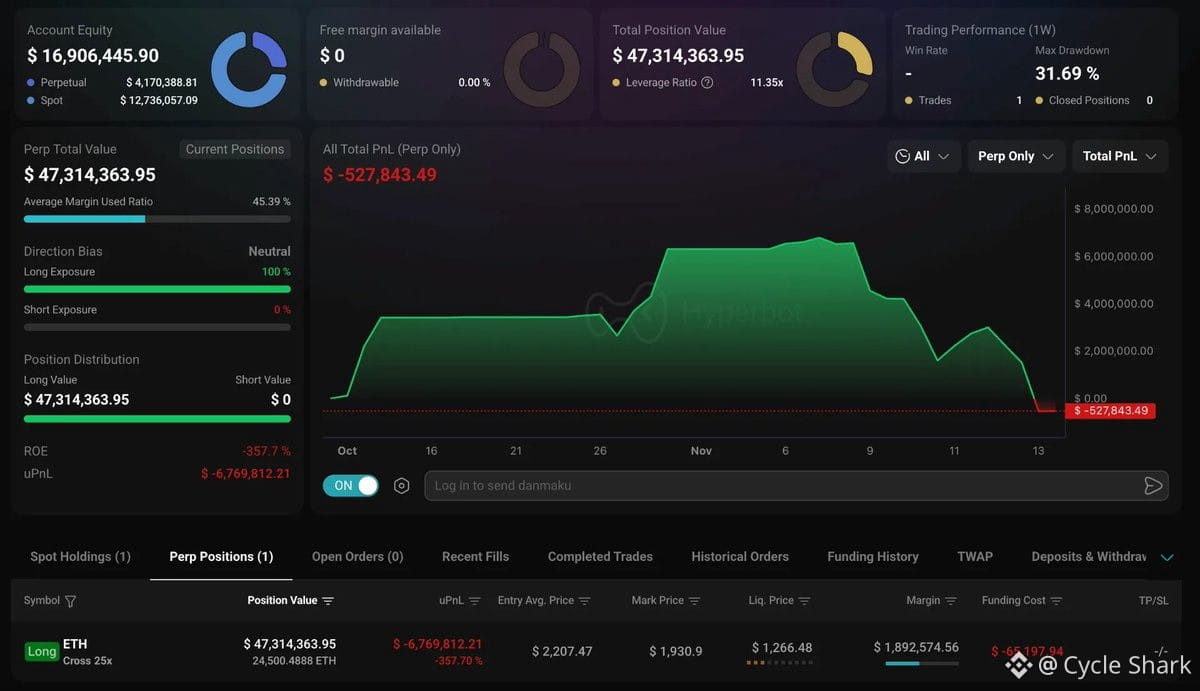
Brutal reminder that risk management beats win streaks every time.
A trader strung together 10 consecutive wins, banking $6.32M in profit. Then went all-in on a single $ETH position and lost $6.76M — erasing everything and finishing $527K in the red.
This isn't about bad luck. It's about position sizing discipline breaking down after a hot streak. When you're riding high, overconfidence creeps in. You start believing your edge is permanent. You size up. One bad trade later, months of gains vanish.
The math is unforgiving: a 10% gain needs an 11% loss to break even. A 50% gain needs a 33% loss. But a 100% loss? Game over. This trader likely went heavy into $ETH at the wrong moment — maybe chasing a breakout, maybe overleveraged, maybe both.
Winning streaks create psychological traps. You feel invincible. You stop respecting the downside. You forget that markets don't care about your last 10 trades.
The real skill isn't racking up wins. It's surviving the inevitable loss without blowing up your account. Professional traders protect capital first, chase returns second. This guy did the opposite.
$527K loss is the tuition for learning that lesson the hard way.
Brutal reminder that risk management beats win streaks every time.
A trader strung together 10 consecutive wins, banking $6.32M in profit. Then went all-in on a single $ETH position and lost $6.76M — erasing everything and finishing $527K in the red.
This isn't about bad luck. It's about position sizing discipline breaking down after a hot streak. When you're riding high, overconfidence creeps in. You start believing your edge is permanent. You size up. One bad trade later, months of gains vanish.
The math is unforgiving: a 10% gain needs an 11% loss to break even. A 50% gain needs a 33% loss. But a 100% loss? Game over. This trader likely went heavy into $ETH at the wrong moment — maybe chasing a breakout, maybe overleveraged, maybe both.
Winning streaks create psychological traps. You feel invincible. You stop respecting the downside. You forget that markets don't care about your last 10 trades.
The real skill isn't racking up wins. It's surviving the inevitable loss without blowing up your account. Professional traders protect capital first, chase returns second. This guy did the opposite.
$527K loss is the tuition for learning that lesson the hard way.
A trader strung together 10 consecutive wins, banking $6.32M in profit. Then went all-in on a single $ETH position and lost $6.76M — erasing everything and finishing $527K in the red.
This isn't about bad luck. It's about position sizing discipline breaking down after a hot streak. When you're riding high, overconfidence creeps in. You start believing your edge is permanent. You size up. One bad trade later, months of gains vanish.
The math is unforgiving: a 10% gain needs an 11% loss to break even. A 50% gain needs a 33% loss. But a 100% loss? Game over. This trader likely went heavy into $ETH at the wrong moment — maybe chasing a breakout, maybe overleveraged, maybe both.
Winning streaks create psychological traps. You feel invincible. You stop respecting the downside. You forget that markets don't care about your last 10 trades.
The real skill isn't racking up wins. It's surviving the inevitable loss without blowing up your account. Professional traders protect capital first, chase returns second. This guy did the opposite.
$527K loss is the tuition for learning that lesson the hard way.
326
·
--
Thailand just opened the door for tourists to convert stablecoins directly into Thai baht for everyday purchases.
This isn't some pilot program or sandbox test — tourists can now walk in and swap their $USDT or $USDC for local currency to spend.
Why this matters:
1. Payments infrastructure is shifting. Traditional currency exchange booths have been the default for decades. Now stablecoins are becoming an alternative on-ramp, bypassing banks and forex desks entirely.
2. Tourism is a natural testing ground. High transaction volume, diverse user base, clear use case. If it works here, other countries will watch closely.
3. Regulatory clarity is moving faster than expected. Thailand isn't known for being crypto-hostile, but this level of integration shows they've thought through compliance, AML, and consumer protection.
4. This creates real demand for stablecoins beyond speculation. Tourists holding $USDC suddenly have a reason to keep it in their wallet instead of converting back to fiat at home.
The bigger trend: Countries are realizing stablecoins can improve capital efficiency, reduce remittance costs, and attract a new class of digitally-native travelers. Thailand is early, but they won't be alone for long.
Real-world adoption isn't just about price going up — it's about infrastructure being built quietly in the background.
Thailand just opened the door for tourists to convert stablecoins directly into Thai baht for everyday purchases.
This isn't some pilot program or sandbox test — tourists can now walk in and swap their $USDT or $USDC for local currency to spend.
Why this matters:
1. Payments infrastructure is shifting. Traditional currency exchange booths have been the default for decades. Now stablecoins are becoming an alternative on-ramp, bypassing banks and forex desks entirely.
2. Tourism is a natural testing ground. High transaction volume, diverse user base, clear use case. If it works here, other countries will watch closely.
3. Regulatory clarity is moving faster than expected. Thailand isn't known for being crypto-hostile, but this level of integration shows they've thought through compliance, AML, and consumer protection.
4. This creates real demand for stablecoins beyond speculation. Tourists holding $USDC suddenly have a reason to keep it in their wallet instead of converting back to fiat at home.
The bigger trend: Countries are realizing stablecoins can improve capital efficiency, reduce remittance costs, and attract a new class of digitally-native travelers. Thailand is early, but they won't be alone for long.
Real-world adoption isn't just about price going up — it's about infrastructure being built quietly in the background.
This isn't some pilot program or sandbox test — tourists can now walk in and swap their $USDT or $USDC for local currency to spend.
Why this matters:
1. Payments infrastructure is shifting. Traditional currency exchange booths have been the default for decades. Now stablecoins are becoming an alternative on-ramp, bypassing banks and forex desks entirely.
2. Tourism is a natural testing ground. High transaction volume, diverse user base, clear use case. If it works here, other countries will watch closely.
3. Regulatory clarity is moving faster than expected. Thailand isn't known for being crypto-hostile, but this level of integration shows they've thought through compliance, AML, and consumer protection.
4. This creates real demand for stablecoins beyond speculation. Tourists holding $USDC suddenly have a reason to keep it in their wallet instead of converting back to fiat at home.
The bigger trend: Countries are realizing stablecoins can improve capital efficiency, reduce remittance costs, and attract a new class of digitally-native travelers. Thailand is early, but they won't be alone for long.
Real-world adoption isn't just about price going up — it's about infrastructure being built quietly in the background.
337
·
--
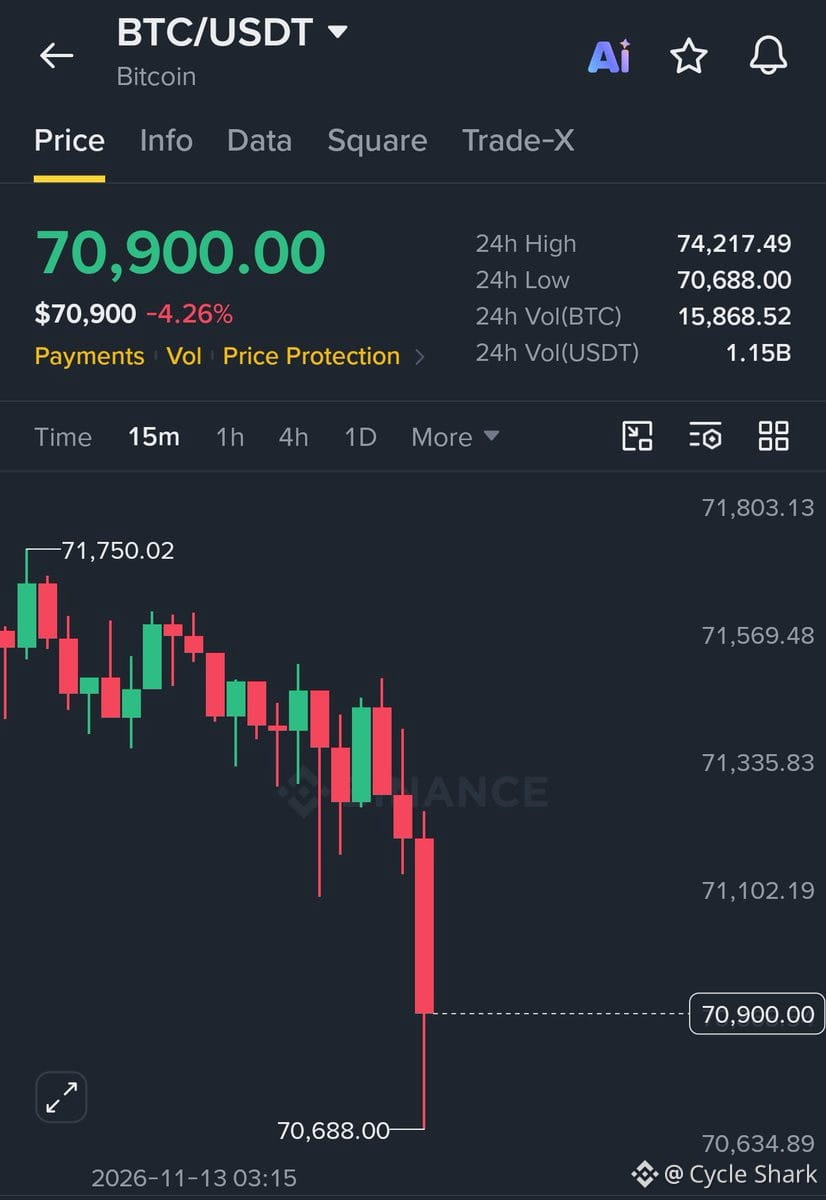
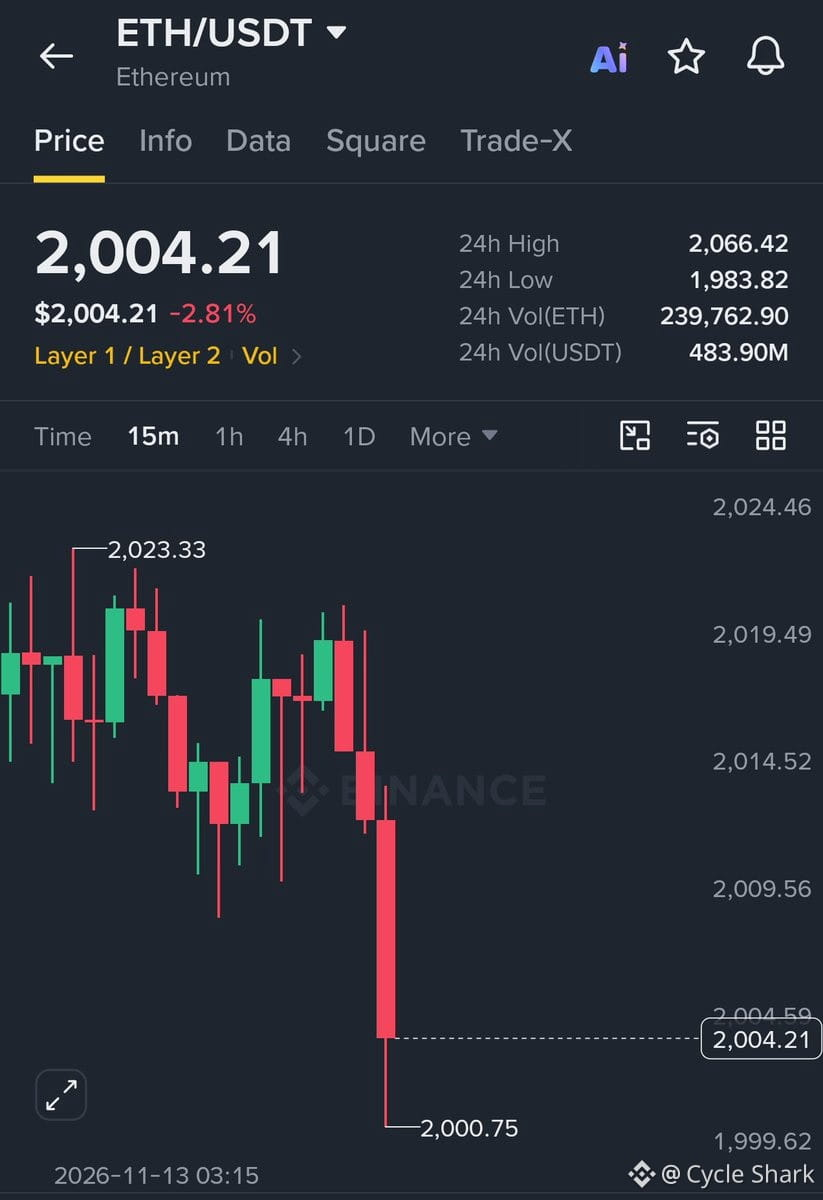
$BTC just slipped under $71,000 — $50 million in longs got wiped out in 15 minutes.
That's a clean flush. When leverage unwinds this fast, it usually means someone was way too confident at the top. The question now is whether this is just a quick squeeze or the start of something deeper. Watch how price behaves around $70k — if it holds, we're probably fine. If it keeps bleeding, the next support zone is around $68k-$69k.
Liquidation cascades like this create short-term volatility, but they also clear out weak hands. If you were thinking about entering, this kind of dip is where the risk/reward starts to shift in your favor — assuming the broader macro setup still holds.
$BTC just slipped under $71,000 — $50 million in longs got wiped out in 15 minutes.
That's a clean flush. When leverage unwinds this fast, it usually means someone was way too confident at the top. The question now is whether this is just a quick squeeze or the start of something deeper. Watch how price behaves around $70k — if it holds, we're probably fine. If it keeps bleeding, the next support zone is around $68k-$69k.
Liquidation cascades like this create short-term volatility, but they also clear out weak hands. If you were thinking about entering, this kind of dip is where the risk/reward starts to shift in your favor — assuming the broader macro setup still holds.
That's a clean flush. When leverage unwinds this fast, it usually means someone was way too confident at the top. The question now is whether this is just a quick squeeze or the start of something deeper. Watch how price behaves around $70k — if it holds, we're probably fine. If it keeps bleeding, the next support zone is around $68k-$69k.
Liquidation cascades like this create short-term volatility, but they also clear out weak hands. If you were thinking about entering, this kind of dip is where the risk/reward starts to shift in your favor — assuming the broader macro setup still holds.
1.2k
·
--
DOJ just seized $1.2 billion in crypto linked to North Korea — part of the $6.3 billion Binance hack.
This is one of the largest crypto seizures on record. North Korea's state-sponsored hacking groups (Lazarus Group and others) have been systematically targeting exchanges for years, funneling stolen funds into weapons programs and regime operations.
What's notable:
1. The scale — $1.2B recovered out of $6.3B stolen shows how much crypto infrastructure has improved in tracking and freezing illicit flows. Chainalysis, TRM Labs, and on-chain forensics are now core tools for law enforcement.
2. The geopolitical angle — this isn't just about crypto crime. It's about cutting off funding for a nuclear state. The US has been increasingly aggressive in using financial sanctions and asset seizures as a geopolitical weapon.
3. The timing — comes as crypto regulation is tightening globally. This kind of headline gives regulators more ammunition to push for stricter KYC/AML and exchange oversight.
For the industry: this is both good and bad. Good because it shows crypto isn't a lawless Wild West — bad because it reinforces the narrative that crypto = crime in the eyes of policymakers.
The bigger question: where's the other $5.1 billion? Likely laundered through mixers, bridges, and OTC desks across multiple jurisdictions. Some of it is probably already converted into fiat or other hard assets.
DOJ just seized $1.2 billion in crypto linked to North Korea — part of the $6.3 billion Binance hack.
This is one of the largest crypto seizures on record. North Korea's state-sponsored hacking groups (Lazarus Group and others) have been systematically targeting exchanges for years, funneling stolen funds into weapons programs and regime operations.
What's notable:
1. The scale — $1.2B recovered out of $6.3B stolen shows how much crypto infrastructure has improved in tracking and freezing illicit flows. Chainalysis, TRM Labs, and on-chain forensics are now core tools for law enforcement.
2. The geopolitical angle — this isn't just about crypto crime. It's about cutting off funding for a nuclear state. The US has been increasingly aggressive in using financial sanctions and asset seizures as a geopolitical weapon.
3. The timing — comes as crypto regulation is tightening globally. This kind of headline gives regulators more ammunition to push for stricter KYC/AML and exchange oversight.
For the industry: this is both good and bad. Good because it shows crypto isn't a lawless Wild West — bad because it reinforces the narrative that crypto = crime in the eyes of policymakers.
The bigger question: where's the other $5.1 billion? Likely laundered through mixers, bridges, and OTC desks across multiple jurisdictions. Some of it is probably already converted into fiat or other hard assets.
This is one of the largest crypto seizures on record. North Korea's state-sponsored hacking groups (Lazarus Group and others) have been systematically targeting exchanges for years, funneling stolen funds into weapons programs and regime operations.
What's notable:
1. The scale — $1.2B recovered out of $6.3B stolen shows how much crypto infrastructure has improved in tracking and freezing illicit flows. Chainalysis, TRM Labs, and on-chain forensics are now core tools for law enforcement.
2. The geopolitical angle — this isn't just about crypto crime. It's about cutting off funding for a nuclear state. The US has been increasingly aggressive in using financial sanctions and asset seizures as a geopolitical weapon.
3. The timing — comes as crypto regulation is tightening globally. This kind of headline gives regulators more ammunition to push for stricter KYC/AML and exchange oversight.
For the industry: this is both good and bad. Good because it shows crypto isn't a lawless Wild West — bad because it reinforces the narrative that crypto = crime in the eyes of policymakers.
The bigger question: where's the other $5.1 billion? Likely laundered through mixers, bridges, and OTC desks across multiple jurisdictions. Some of it is probably already converted into fiat or other hard assets.


2k
·
--
One more month. That's the mantra right now.
Look at the pattern:
2018 bear — $BTC bottomed in December at $3,200, then ran to $69,000.
2022 bear — $BTC bottomed in November at $15,400, then ran to $126,000.
2026 bear — the thesis is that $BTC already bottomed in June at $57,800. One final shake to low $60k by early December, then up only.
The logic is clean: cycles rhyme. December has been the reset month twice. If you survive the final capitulation, you earn the next leg up.
But here's what matters more than the dates: survival itself. Markets reward patience during maximum fear. The question isn't whether the pattern repeats — it's whether you're still holding when it does.
If the low-$60k retest happens, that's the last chance to accumulate before the real move. If it doesn't, the bottom is already in. Either way, the setup favors those who didn't panic sell.
He who survives the dump, deserves the mega pump. That's not hopium — it's how every cycle has worked so far.
One more month. That's the mantra right now.
Look at the pattern:
2018 bear — $BTC bottomed in December at $3,200, then ran to $69,000.
2022 bear — $BTC bottomed in November at $15,400, then ran to $126,000.
2026 bear — the thesis is that $BTC already bottomed in June at $57,800. One final shake to low $60k by early December, then up only.
The logic is clean: cycles rhyme. December has been the reset month twice. If you survive the final capitulation, you earn the next leg up.
But here's what matters more than the dates: survival itself. Markets reward patience during maximum fear. The question isn't whether the pattern repeats — it's whether you're still holding when it does.
If the low-$60k retest happens, that's the last chance to accumulate before the real move. If it doesn't, the bottom is already in. Either way, the setup favors those who didn't panic sell.
He who survives the dump, deserves the mega pump. That's not hopium — it's how every cycle has worked so far.
Look at the pattern:
2018 bear — $BTC bottomed in December at $3,200, then ran to $69,000.
2022 bear — $BTC bottomed in November at $15,400, then ran to $126,000.
2026 bear — the thesis is that $BTC already bottomed in June at $57,800. One final shake to low $60k by early December, then up only.
The logic is clean: cycles rhyme. December has been the reset month twice. If you survive the final capitulation, you earn the next leg up.
But here's what matters more than the dates: survival itself. Markets reward patience during maximum fear. The question isn't whether the pattern repeats — it's whether you're still holding when it does.
If the low-$60k retest happens, that's the last chance to accumulate before the real move. If it doesn't, the bottom is already in. Either way, the setup favors those who didn't panic sell.
He who survives the dump, deserves the mega pump. That's not hopium — it's how every cycle has worked so far.
2k
·
--
Whale alert 🚨
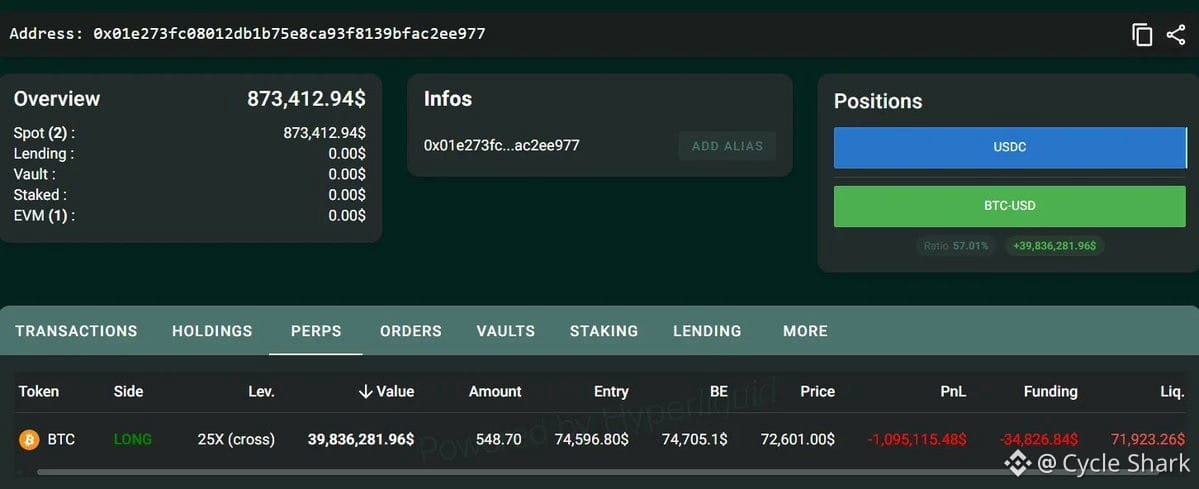
Someone just opened a $40M $BTC long at 40x leverage and they're dancing on the edge — literally $700 away from liquidation.
This is the kind of setup that either prints legendary or becomes a cautionary tale by morning. At 40x, a 2.5% move against you and it's over. No second chances.
Few things here:
1. Position sizing at this scale with that leverage means either supreme confidence or supreme recklessness. Could be a fund, could be a degen with too much capital.
2. $700 buffer is nothing in crypto volatility. One wick, one headline, one exchange outage and $40M evaporates. The liquidation cascade this could trigger would be brutal.
3. This screams either insider conviction on an imminent move up or someone who's already underwater from a higher entry and adding to a losing position.
The market loves hunting these whales. If this gets liquidated, expect a sharp downward spike as the position unwinds and triggers stop losses below.
Watch $BTC closely. When leverage gets this concentrated and this fragile, someone's about to learn an expensive lesson.
Whale alert 🚨
Someone just opened a $40M $BTC long at 40x leverage and they're dancing on the edge — literally $700 away from liquidation.
This is the kind of setup that either prints legendary or becomes a cautionary tale by morning. At 40x, a 2.5% move against you and it's over. No second chances.
Few things here:
1. Position sizing at this scale with that leverage means either supreme confidence or supreme recklessness. Could be a fund, could be a degen with too much capital.
2. $700 buffer is nothing in crypto volatility. One wick, one headline, one exchange outage and $40M evaporates. The liquidation cascade this could trigger would be brutal.
3. This screams either insider conviction on an imminent move up or someone who's already underwater from a higher entry and adding to a losing position.
The market loves hunting these whales. If this gets liquidated, expect a sharp downward spike as the position unwinds and triggers stop losses below.
Watch $BTC closely. When leverage gets this concentrated and this fragile, someone's about to learn an expensive lesson.
Someone just opened a $40M $BTC long at 40x leverage and they're dancing on the edge — literally $700 away from liquidation.
This is the kind of setup that either prints legendary or becomes a cautionary tale by morning. At 40x, a 2.5% move against you and it's over. No second chances.
Few things here:
1. Position sizing at this scale with that leverage means either supreme confidence or supreme recklessness. Could be a fund, could be a degen with too much capital.
2. $700 buffer is nothing in crypto volatility. One wick, one headline, one exchange outage and $40M evaporates. The liquidation cascade this could trigger would be brutal.
3. This screams either insider conviction on an imminent move up or someone who's already underwater from a higher entry and adding to a losing position.
The market loves hunting these whales. If this gets liquidated, expect a sharp downward spike as the position unwinds and triggers stop losses below.
Watch $BTC closely. When leverage gets this concentrated and this fragile, someone's about to learn an expensive lesson.
5
1
6.8k
·
--
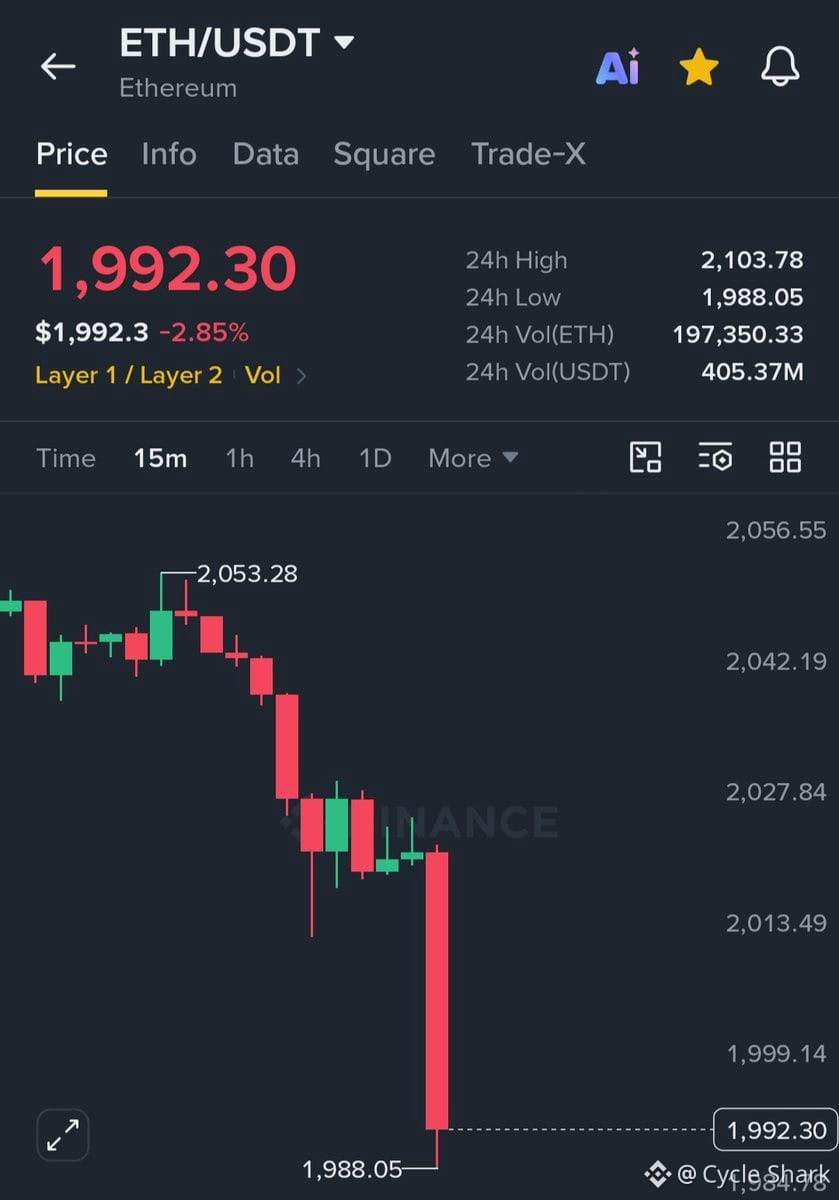
$ETH just broke below $2,000 — first time since early December.
This isn't just a number. It's a psychological floor that held through most of Q4. Now it's gone.
What changed?
1. Macro pressure — rate cut expectations pushed out, dollar strength persists
2. Relative weakness vs $BTC — the flippening narrative is dead for now
3. Staking yield compression — real yield on $ETH dropped as activity cooled
4. Lack of narrative catalyst — no major upgrades, no DeFi summer 2.0, no NFT resurgence
The $2,000 level matters because it was where institutions and long-term holders drew a line. Breaking it signals either capitulation or a deeper re-rating of $ETH's risk premium.
Watch for:
- Whether $1,800–$1,900 holds as new support
- Correlation with $BTC — if $BTC holds but $ETH keeps sliding, that's a structural problem
- On-chain activity — if usage doesn't pick up, price won't either
This could be a flush before a bounce, or the start of a longer grind lower. Either way, the old floor is now overhead resistance.
$ETH just broke below $2,000 — first time since early December.
This isn't just a number. It's a psychological floor that held through most of Q4. Now it's gone.
What changed?
1. Macro pressure — rate cut expectations pushed out, dollar strength persists
2. Relative weakness vs $BTC — the flippening narrative is dead for now
3. Staking yield compression — real yield on $ETH dropped as activity cooled
4. Lack of narrative catalyst — no major upgrades, no DeFi summer 2.0, no NFT resurgence
The $2,000 level matters because it was where institutions and long-term holders drew a line. Breaking it signals either capitulation or a deeper re-rating of $ETH's risk premium.
Watch for:
- Whether $1,800–$1,900 holds as new support
- Correlation with $BTC — if $BTC holds but $ETH keeps sliding, that's a structural problem
- On-chain activity — if usage doesn't pick up, price won't either
This could be a flush before a bounce, or the start of a longer grind lower. Either way, the old floor is now overhead resistance.
This isn't just a number. It's a psychological floor that held through most of Q4. Now it's gone.
What changed?
1. Macro pressure — rate cut expectations pushed out, dollar strength persists
2. Relative weakness vs $BTC — the flippening narrative is dead for now
3. Staking yield compression — real yield on $ETH dropped as activity cooled
4. Lack of narrative catalyst — no major upgrades, no DeFi summer 2.0, no NFT resurgence
The $2,000 level matters because it was where institutions and long-term holders drew a line. Breaking it signals either capitulation or a deeper re-rating of $ETH's risk premium.
Watch for:
- Whether $1,800–$1,900 holds as new support
- Correlation with $BTC — if $BTC holds but $ETH keeps sliding, that's a structural problem
- On-chain activity — if usage doesn't pick up, price won't either
This could be a flush before a bounce, or the start of a longer grind lower. Either way, the old floor is now overhead resistance.
1.6k
·
--
MSCI just kicked Strategy ($MSTR) out of their indexes.
This matters because MSCI indexes drive passive fund flows. When a stock gets removed, index-tracking funds are forced to sell. That creates mechanical selling pressure on $MSTR shares.
Why this hits $BTC:
1. $MSTR is essentially a levered $BTC proxy. The company holds ~500k+ bitcoin on its balance sheet and has been the most visible corporate buyer in this cycle.
2. Forced selling from index funds means $MSTR's stock price takes a hit. Lower stock price = higher cost of capital for the company = harder to raise money for more bitcoin purchases.
3. Market psychology. $MSTR has been a bellwether for institutional appetite around bitcoin exposure. When it gets downgraded or excluded like this, it signals reduced mainstream acceptance through traditional finance channels.
4. Potential cascade. If $MSTR's stock drops hard enough, it could trigger margin concerns or force the company to adjust its strategy. That would remove one of bitcoin's most consistent bid sources.
This isn't a death blow, but it's a structural headwind. One less avenue for TradFi money to flow into bitcoin exposure. One less reason for passive funds to hold bitcoin indirectly.
Watch $MSTR's stock reaction closely. If it craters, expect some knock-on selling pressure in $BTC spot markets.
MSCI just kicked Strategy ($MSTR) out of their indexes.
This matters because MSCI indexes drive passive fund flows. When a stock gets removed, index-tracking funds are forced to sell. That creates mechanical selling pressure on $MSTR shares.
Why this hits $BTC:
1. $MSTR is essentially a levered $BTC proxy. The company holds ~500k+ bitcoin on its balance sheet and has been the most visible corporate buyer in this cycle.
2. Forced selling from index funds means $MSTR's stock price takes a hit. Lower stock price = higher cost of capital for the company = harder to raise money for more bitcoin purchases.
3. Market psychology. $MSTR has been a bellwether for institutional appetite around bitcoin exposure. When it gets downgraded or excluded like this, it signals reduced mainstream acceptance through traditional finance channels.
4. Potential cascade. If $MSTR's stock drops hard enough, it could trigger margin concerns or force the company to adjust its strategy. That would remove one of bitcoin's most consistent bid sources.
This isn't a death blow, but it's a structural headwind. One less avenue for TradFi money to flow into bitcoin exposure. One less reason for passive funds to hold bitcoin indirectly.
Watch $MSTR's stock reaction closely. If it craters, expect some knock-on selling pressure in $BTC spot markets.
This matters because MSCI indexes drive passive fund flows. When a stock gets removed, index-tracking funds are forced to sell. That creates mechanical selling pressure on $MSTR shares.
Why this hits $BTC:
1. $MSTR is essentially a levered $BTC proxy. The company holds ~500k+ bitcoin on its balance sheet and has been the most visible corporate buyer in this cycle.
2. Forced selling from index funds means $MSTR's stock price takes a hit. Lower stock price = higher cost of capital for the company = harder to raise money for more bitcoin purchases.
3. Market psychology. $MSTR has been a bellwether for institutional appetite around bitcoin exposure. When it gets downgraded or excluded like this, it signals reduced mainstream acceptance through traditional finance channels.
4. Potential cascade. If $MSTR's stock drops hard enough, it could trigger margin concerns or force the company to adjust its strategy. That would remove one of bitcoin's most consistent bid sources.
This isn't a death blow, but it's a structural headwind. One less avenue for TradFi money to flow into bitcoin exposure. One less reason for passive funds to hold bitcoin indirectly.
Watch $MSTR's stock reaction closely. If it craters, expect some knock-on selling pressure in $BTC spot markets.
99
·
--
US equities just printed $2.6 trillion in market cap gains this week. The S&P 500 is now sitting less than 3% below its all-time high.
Here's the setup: traditional markets are recovering fast, risk appetite is back, and liquidity is flowing again. Historically, when equities stabilize and push toward new highs, crypto — especially $BTC — tends to lag by a few weeks, then explodes.
The pattern is clear: macro risk-on sentiment precedes Bitcoin's catch-up rallies. November has historically been volatile, but if you can hold through the chop, the upside into year-end could be violent. Liquidity cycles, positioning, and momentum all point to a delayed but powerful Bitcoin move once stocks fully confirm their trend.
Don't get shaken out in November. The catch-up trade is coming.
US equities just printed $2.6 trillion in market cap gains this week. The S&P 500 is now sitting less than 3% below its all-time high.
Here's the setup: traditional markets are recovering fast, risk appetite is back, and liquidity is flowing again. Historically, when equities stabilize and push toward new highs, crypto — especially $BTC — tends to lag by a few weeks, then explodes.
The pattern is clear: macro risk-on sentiment precedes Bitcoin's catch-up rallies. November has historically been volatile, but if you can hold through the chop, the upside into year-end could be violent. Liquidity cycles, positioning, and momentum all point to a delayed but powerful Bitcoin move once stocks fully confirm their trend.
Don't get shaken out in November. The catch-up trade is coming.
Here's the setup: traditional markets are recovering fast, risk appetite is back, and liquidity is flowing again. Historically, when equities stabilize and push toward new highs, crypto — especially $BTC — tends to lag by a few weeks, then explodes.
The pattern is clear: macro risk-on sentiment precedes Bitcoin's catch-up rallies. November has historically been volatile, but if you can hold through the chop, the upside into year-end could be violent. Liquidity cycles, positioning, and momentum all point to a delayed but powerful Bitcoin move once stocks fully confirm their trend.
Don't get shaken out in November. The catch-up trade is coming.
36
·
--
Bitcoin dominance sitting at a critical inflection point — this could dictate whether altcoins stay suppressed or finally catch a bid.
The setup is straightforward:
1. Above 61.5% = $BTC maintains control, altcoins stay weak
2. Below 58% = $ETH and alts likely start gaining ground
3. Rejection at 61% = alts get breathing room to recover
Right now, the key is watching whether dominance gets rejected at that 61% level. If it does, we could see capital rotation back into altcoins. If it breaks higher, expect continued alt underperformance while $BTC absorbs most of the liquidity.
This is a classic late-cycle dynamic — dominance peaks often precede alt rallies, but only if the rejection holds. Otherwise, we're still in $BTC season.
Bitcoin dominance sitting at a critical inflection point — this could dictate whether altcoins stay suppressed or finally catch a bid.
The setup is straightforward:
1. Above 61.5% = $BTC maintains control, altcoins stay weak
2. Below 58% = $ETH and alts likely start gaining ground
3. Rejection at 61% = alts get breathing room to recover
Right now, the key is watching whether dominance gets rejected at that 61% level. If it does, we could see capital rotation back into altcoins. If it breaks higher, expect continued alt underperformance while $BTC absorbs most of the liquidity.
This is a classic late-cycle dynamic — dominance peaks often precede alt rallies, but only if the rejection holds. Otherwise, we're still in $BTC season.
The setup is straightforward:
1. Above 61.5% = $BTC maintains control, altcoins stay weak
2. Below 58% = $ETH and alts likely start gaining ground
3. Rejection at 61% = alts get breathing room to recover
Right now, the key is watching whether dominance gets rejected at that 61% level. If it does, we could see capital rotation back into altcoins. If it breaks higher, expect continued alt underperformance while $BTC absorbs most of the liquidity.
This is a classic late-cycle dynamic — dominance peaks often precede alt rallies, but only if the rejection holds. Otherwise, we're still in $BTC season.
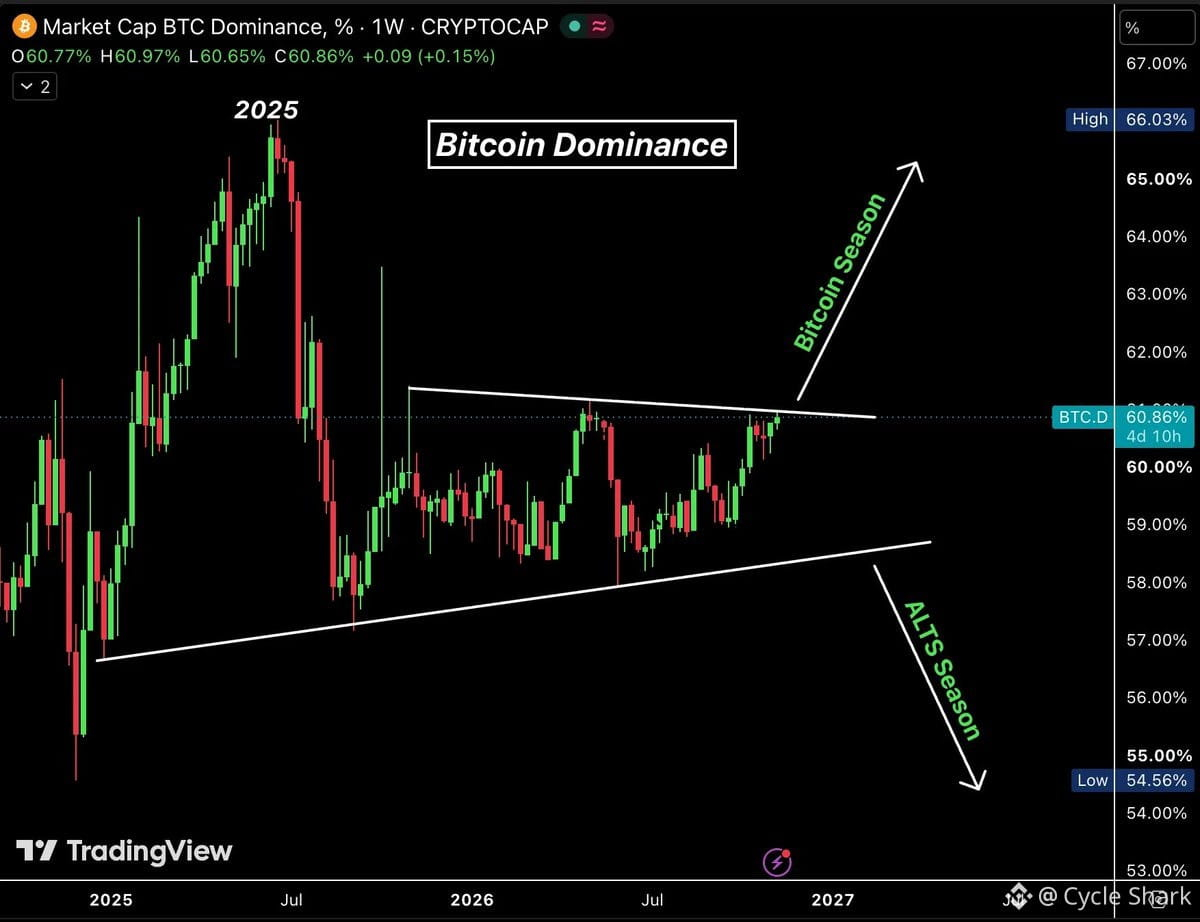
79
·
--
AI agent activity on Concordium exploded 40x since July — from 15.6K transactions to 670K.
The gap between hype and reality is massive right now. Everyone's talking about AI agents, but very few projects have them actually deployed and running at scale.
Concordium seems to be one of the few chains where agents are genuinely active, not just vaporware. That kind of on-chain usage growth is rare.
Still holding all $CCD — betting on execution over narrative.
AI agent activity on Concordium exploded 40x since July — from 15.6K transactions to 670K.
The gap between hype and reality is massive right now. Everyone's talking about AI agents, but very few projects have them actually deployed and running at scale.
Concordium seems to be one of the few chains where agents are genuinely active, not just vaporware. That kind of on-chain usage growth is rare.
Still holding all $CCD — betting on execution over narrative.
The gap between hype and reality is massive right now. Everyone's talking about AI agents, but very few projects have them actually deployed and running at scale.
Concordium seems to be one of the few chains where agents are genuinely active, not just vaporware. That kind of on-chain usage growth is rare.
Still holding all $CCD — betting on execution over narrative.
39
·
--
AI agent activity on Concordium has exploded—transactions surged 40x since July, jumping from 15.6K to 670K.
The interesting gap here: everyone talks about AI agents, but actual deployment numbers tell a different story. Most projects are still vaporware or demos. Real on-chain activity like this is rare.
Concordium's growth suggests they've moved past the hype phase into actual utility. When transaction volume multiplies by 40x in months, something real is happening under the hood—either developers are building seriously or agents are autonomously transacting at scale.
Still holding $CCD. The thesis is simple: bet on chains where AI agents are provably active, not just conceptually possible.
AI agent activity on Concordium has exploded—transactions surged 40x since July, jumping from 15.6K to 670K.
The interesting gap here: everyone talks about AI agents, but actual deployment numbers tell a different story. Most projects are still vaporware or demos. Real on-chain activity like this is rare.
Concordium's growth suggests they've moved past the hype phase into actual utility. When transaction volume multiplies by 40x in months, something real is happening under the hood—either developers are building seriously or agents are autonomously transacting at scale.
Still holding $CCD. The thesis is simple: bet on chains where AI agents are provably active, not just conceptually possible.
The interesting gap here: everyone talks about AI agents, but actual deployment numbers tell a different story. Most projects are still vaporware or demos. Real on-chain activity like this is rare.
Concordium's growth suggests they've moved past the hype phase into actual utility. When transaction volume multiplies by 40x in months, something real is happening under the hood—either developers are building seriously or agents are autonomously transacting at scale.
Still holding $CCD. The thesis is simple: bet on chains where AI agents are provably active, not just conceptually possible.
32
Log in to explore more content
Join global crypto users on Binance Square
⚡️ Get latest and useful information about crypto.
💬 Trusted by the world’s largest crypto exchange.
👍 Discover real insights from verified creators.
Email / Phone number
Trending Topics
WhoWillSucceedJensenHuangatNvidia?
35,450 views
499 Discussing
Nvidia Says No CEO Talks Underway as "Stand With Jensen" Petition Tops 77,900 Signatures
Binance News
·14 Likes
·17.3k views
WhatWillDriveCryptoandStocks’NextRebound?
346,407 views
2,471 Discussing
USPPIMissMayEaseBTCPressure
158,027 views
1,727 Discussing