

Nhân Capital _8386
162 Posts

Nhân Capital _8386
Report
Block User
Cộng Đồng Crypto & GOLD : Záloo-@9423@5832
Open Trade
1.1 Years
3 Following
38 Followers
160 Liked
Posts
Portfolio
·
--
Bullish
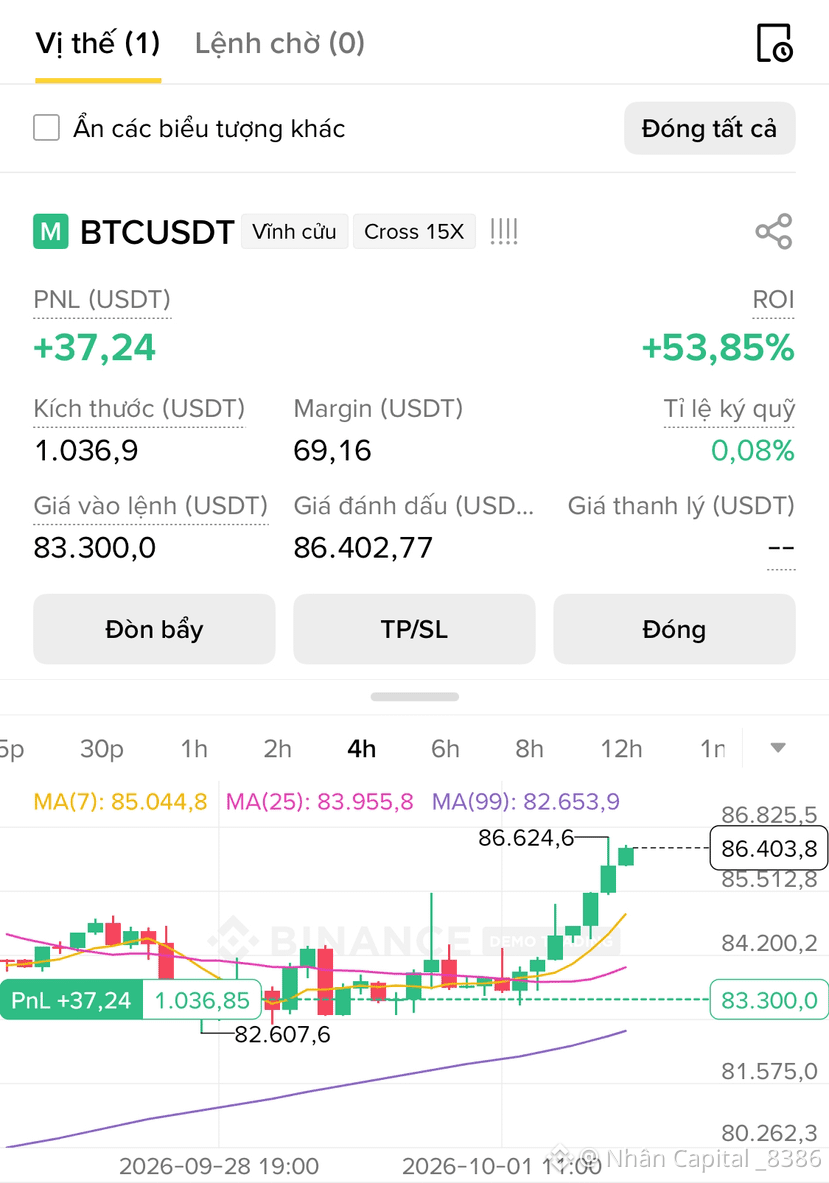
Update $BTC day 2/10 :
After the adjustment swing from the 87,000–88,000$ zone from last week, BTC is currently recovering again and continuing to move upward to test this important resistance area.
Technically on the H4 timeframe, the price structure is gradually becoming more positive as BTC holds the support zones below and keeps forming recovery moves after each pullback. Notably, the 87,000–88,000$ zone has been tested previously but has not been broken through completely.
Therefore, the price’s reaction at this zone will determine the next direction.
-\u003e Just give a little (extra) there—whoever is following your Long view from 82k, you’re eating again, right!!!
$BTC
{spot}(BTCUSDT)
Update $BTC day 2/10 :
After the adjustment swing from the 87,000–88,000$ zone from last week, BTC is currently recovering again and continuing to move upward to test this important resistance area.
Technically on the H4 timeframe, the price structure is gradually becoming more positive as BTC holds the support zones below and keeps forming recovery moves after each pullback. Notably, the 87,000–88,000$ zone has been tested previously but has not been broken through completely.
Therefore, the price’s reaction at this zone will determine the next direction.
-\u003e Just give a little (extra) there—whoever is following your Long view from 82k, you’re eating again, right!!!
$BTC
After the adjustment swing from the 87,000–88,000$ zone from last week, BTC is currently recovering again and continuing to move upward to test this important resistance area.
Technically on the H4 timeframe, the price structure is gradually becoming more positive as BTC holds the support zones below and keeps forming recovery moves after each pullback. Notably, the 87,000–88,000$ zone has been tested previously but has not been broken through completely.
Therefore, the price’s reaction at this zone will determine the next direction.
-\u003e Just give a little (extra) there—whoever is following your Long view from 82k, you’re eating again, right!!!
$BTC
1
338
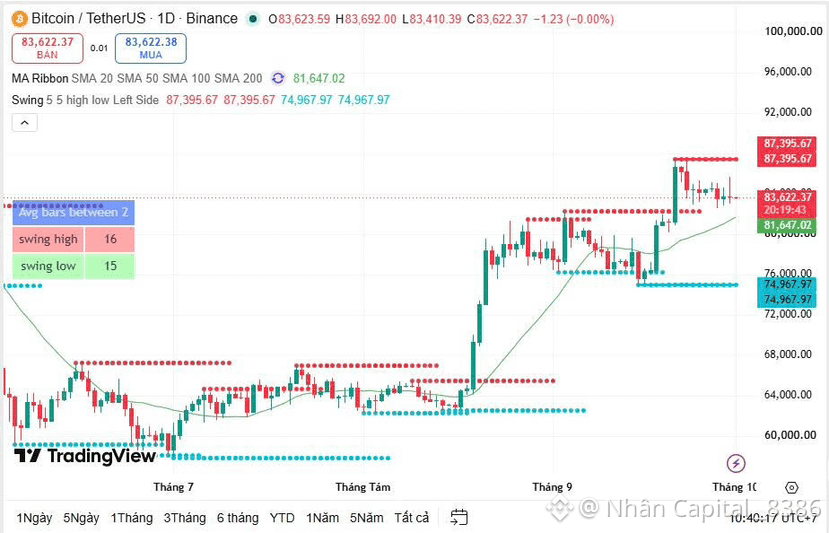
Update $BTC on 1/10:
The market continues to maintain a growth structure as Bitcoin has closed September with a bullish green candle, confirming a strong recovery trend.
Bitcoin has recorded an increase of about $25,800 (+44%) in just 3 months, marking one of the strongest growth quarters for BTC in previous cycles. At the same time, the September candle closed at the highest level in 2026, helping BTC officially break out of the multi-month mid-term accumulation range that had formed earlier.
From a technical standpoint, BTC’s current price structure is still leaning toward the buyers, as it continuously holds higher low regions after the breakout. However, after a strong upward move from the bottom, it is completely normal for there to be choppy fluctuations or a retest of the breakout zone.
Update $BTC on 1/10:
The market continues to maintain a growth structure as Bitcoin has closed September with a bullish green candle, confirming a strong recovery trend.
Bitcoin has recorded an increase of about $25,800 (+44%) in just 3 months, marking one of the strongest growth quarters for BTC in previous cycles. At the same time, the September candle closed at the highest level in 2026, helping BTC officially break out of the multi-month mid-term accumulation range that had formed earlier.
From a technical standpoint, BTC’s current price structure is still leaning toward the buyers, as it continuously holds higher low regions after the breakout. However, after a strong upward move from the bottom, it is completely normal for there to be choppy fluctuations or a retest of the breakout zone.
The market continues to maintain a growth structure as Bitcoin has closed September with a bullish green candle, confirming a strong recovery trend.
Bitcoin has recorded an increase of about $25,800 (+44%) in just 3 months, marking one of the strongest growth quarters for BTC in previous cycles. At the same time, the September candle closed at the highest level in 2026, helping BTC officially break out of the multi-month mid-term accumulation range that had formed earlier.
From a technical standpoint, BTC’s current price structure is still leaning toward the buyers, as it continuously holds higher low regions after the breakout. However, after a strong upward move from the bottom, it is completely normal for there to be choppy fluctuations or a retest of the breakout zone.
1
264
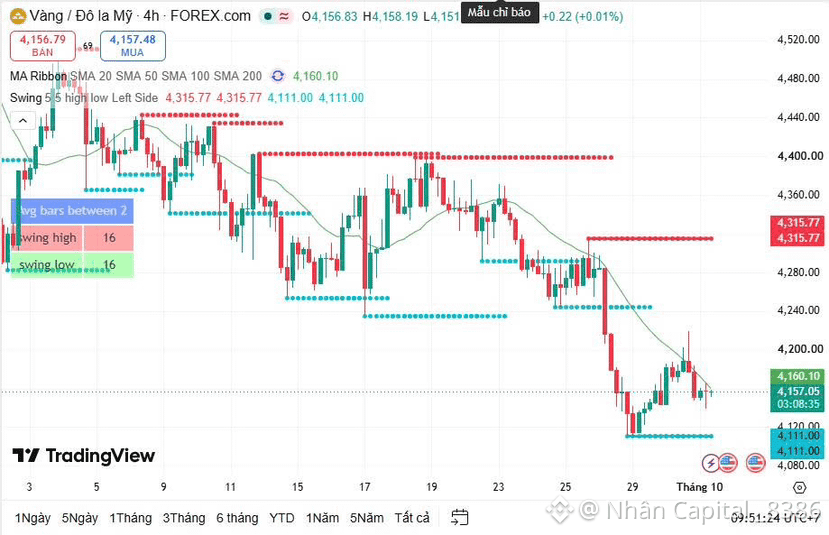
Update $XAU on Oct 1:
Gold prices continue to face adjustment pressure in the past session as the US dollar remains strong, while global bond yields stay at high levels, causing capital to trend away from non-yielding assets like gold. At present, the market is still absorbing expectations related to Fed interest-rate policy, so gold’s short-term direction is not yet entirely clear.
However, friends should note that we are entering October—a period that often sees strong physical-buying demand from Asian markets, especially India during the festival and wedding seasons. India is one of the world’s largest gold consumers, and buying gold for festivals may provide additional support for prices in the coming period.
From a technical perspective, after the sharp sell-off just occurred, gold is currently reacting around the key support zone of 4150. In the short term, prices are likely to continue ranging and consolidating around this area to seek momentum before determining the next direction.
My current personal view still prioritizes observing price reactions at the support zone. If gold holds the 4150 area and reversal signals appear on the H1/H4 charts, we may consider tentative long positions with expectations of a rebound back up.
Update $XAU on Oct 1:
Gold prices continue to face adjustment pressure in the past session as the US dollar remains strong, while global bond yields stay at high levels, causing capital to trend away from non-yielding assets like gold. At present, the market is still absorbing expectations related to Fed interest-rate policy, so gold’s short-term direction is not yet entirely clear.
However, friends should note that we are entering October—a period that often sees strong physical-buying demand from Asian markets, especially India during the festival and wedding seasons. India is one of the world’s largest gold consumers, and buying gold for festivals may provide additional support for prices in the coming period.
From a technical perspective, after the sharp sell-off just occurred, gold is currently reacting around the key support zone of 4150. In the short term, prices are likely to continue ranging and consolidating around this area to seek momentum before determining the next direction.
My current personal view still prioritizes observing price reactions at the support zone. If gold holds the 4150 area and reversal signals appear on the H1/H4 charts, we may consider tentative long positions with expectations of a rebound back up.
Gold prices continue to face adjustment pressure in the past session as the US dollar remains strong, while global bond yields stay at high levels, causing capital to trend away from non-yielding assets like gold. At present, the market is still absorbing expectations related to Fed interest-rate policy, so gold’s short-term direction is not yet entirely clear.
However, friends should note that we are entering October—a period that often sees strong physical-buying demand from Asian markets, especially India during the festival and wedding seasons. India is one of the world’s largest gold consumers, and buying gold for festivals may provide additional support for prices in the coming period.
From a technical perspective, after the sharp sell-off just occurred, gold is currently reacting around the key support zone of 4150. In the short term, prices are likely to continue ranging and consolidating around this area to seek momentum before determining the next direction.
My current personal view still prioritizes observing price reactions at the support zone. If gold holds the 4150 area and reversal signals appear on the H1/H4 charts, we may consider tentative long positions with expectations of a rebound back up.
1
420
·
--
Bullish
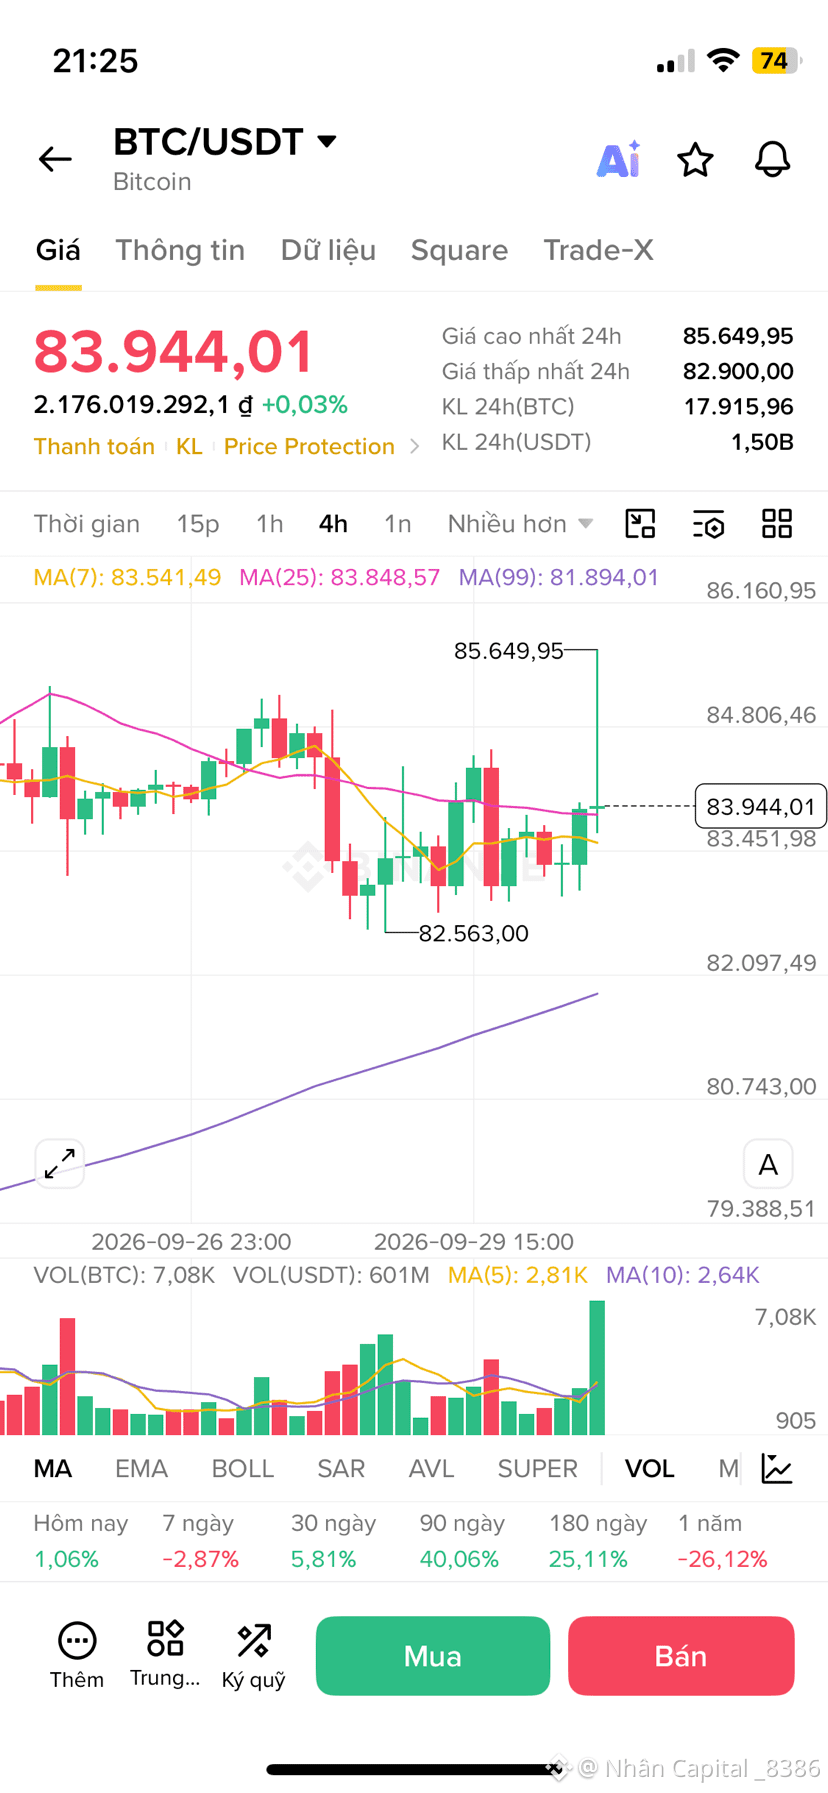
$BTC đúng view then just shout as you see it, my fellow brothers !!!
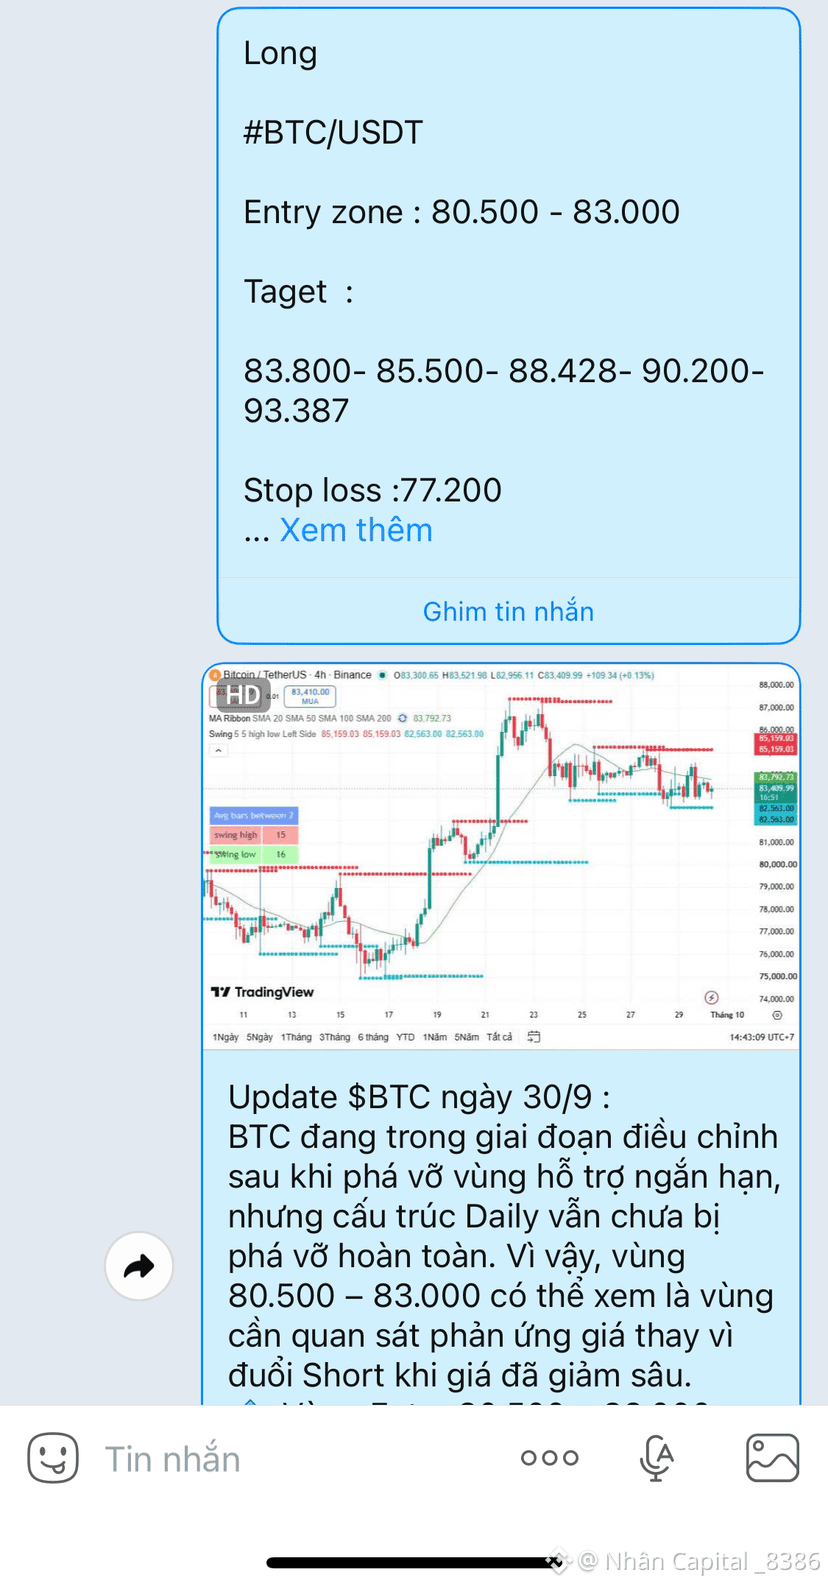
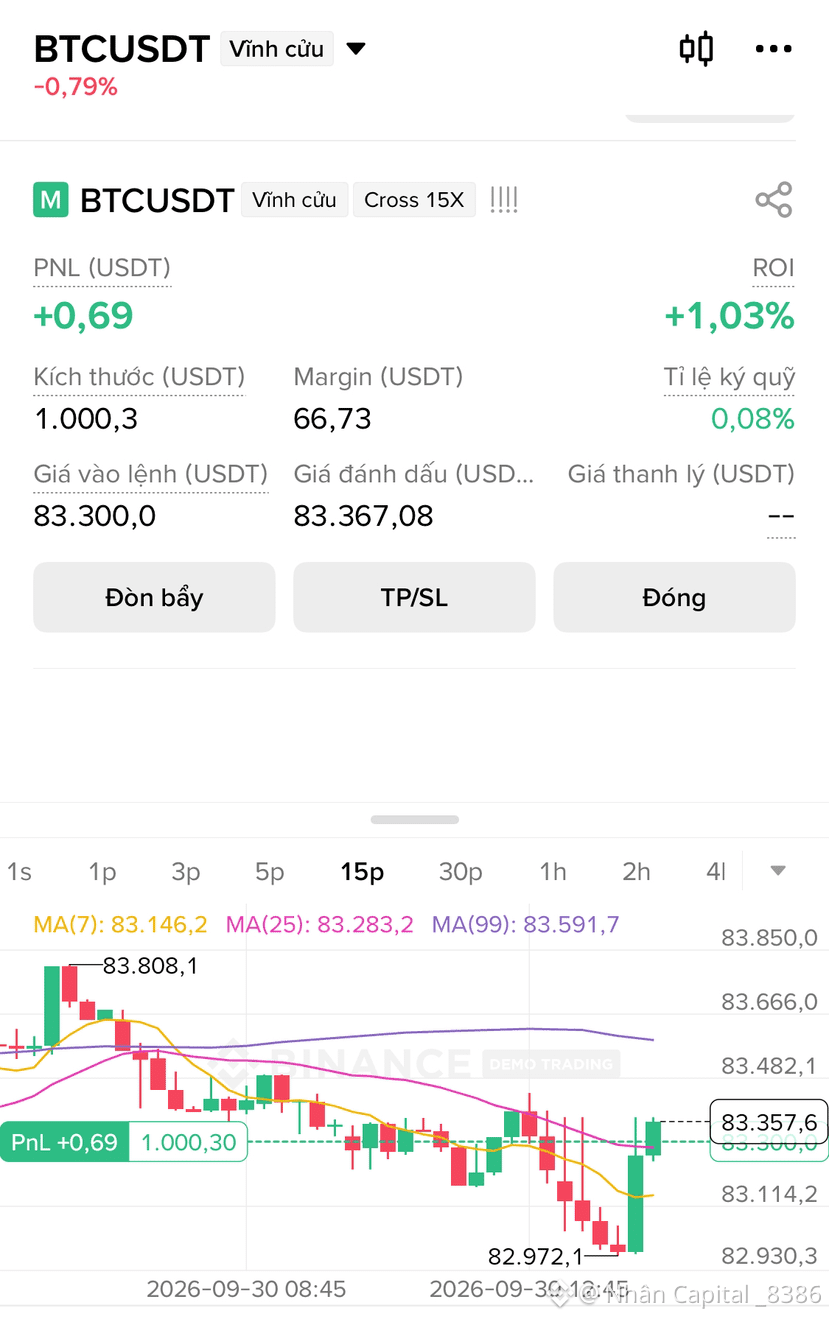
Today I shared an H4 priority Long view for the 80,500 - 83,000 zone. At that time, many brothers still doubted because BTC was breaking support and market psychology was quite weak. But my view is still: don’t chase Shorts in the low-price area; wait for BTC to react at the support zone and re-confirm the H4 structure.
And the result today: BTC surged strongly to 85,600. Overall, if any of you who can read my view and follow it, you’ve got the deal today !!!
$BTC
{future}(BTCUSDT)
$BTC đúng view then just shout as you see it, my fellow brothers !!!
Today I shared an H4 priority Long view for the 80,500 - 83,000 zone. At that time, many brothers still doubted because BTC was breaking support and market psychology was quite weak. But my view is still: don’t chase Shorts in the low-price area; wait for BTC to react at the support zone and re-confirm the H4 structure.
And the result today: BTC surged strongly to 85,600. Overall, if any of you who can read my view and follow it, you’ve got the deal today !!!
$BTC
Today I shared an H4 priority Long view for the 80,500 - 83,000 zone. At that time, many brothers still doubted because BTC was breaking support and market psychology was quite weak. But my view is still: don’t chase Shorts in the low-price area; wait for BTC to react at the support zone and re-confirm the H4 structure.
And the result today: BTC surged strongly to 85,600. Overall, if any of you who can read my view and follow it, you’ve got the deal today !!!
$BTC
1
2
419
·
--
Bullish
Update $BTC day 30/9:
BTC is in a correction phase after breaking a short-term support zone, but the Daily structure has not been fully broken yet. Therefore, the 80,500 – 83,000 zone can be considered an area to watch for price reaction rather than chasing a Short once the price has dropped deeply.
🔹 Entry zone 80,500 – 83,000
This is the zone expected to see BTC find renewed buying pressure.
If H4 shows a rejection wick candle, a bullish engulfing pattern, or forms a Higher Low within this zone, the Long signal will be strengthened.
In case the price only pierces the 80,500 zone but quickly closes an H4 candle back above it, it can be seen as a liquidity sweep.
$BTC #bitcoin
{future}(BTCUSDT)
Update $BTC day 30/9:
BTC is in a correction phase after breaking a short-term support zone, but the Daily structure has not been fully broken yet. Therefore, the 80,500 – 83,000 zone can be considered an area to watch for price reaction rather than chasing a Short once the price has dropped deeply.
🔹 Entry zone 80,500 – 83,000
This is the zone expected to see BTC find renewed buying pressure.
If H4 shows a rejection wick candle, a bullish engulfing pattern, or forms a Higher Low within this zone, the Long signal will be strengthened.
In case the price only pierces the 80,500 zone but quickly closes an H4 candle back above it, it can be seen as a liquidity sweep.
$BTC #bitcoin
BTC is in a correction phase after breaking a short-term support zone, but the Daily structure has not been fully broken yet. Therefore, the 80,500 – 83,000 zone can be considered an area to watch for price reaction rather than chasing a Short once the price has dropped deeply.
🔹 Entry zone 80,500 – 83,000
This is the zone expected to see BTC find renewed buying pressure.
If H4 shows a rejection wick candle, a bullish engulfing pattern, or forms a Higher Low within this zone, the Long signal will be strengthened.
In case the price only pierces the 80,500 zone but quickly closes an H4 candle back above it, it can be seen as a liquidity sweep.
$BTC #bitcoin
1
1
310
Update $XAU on 30/9:
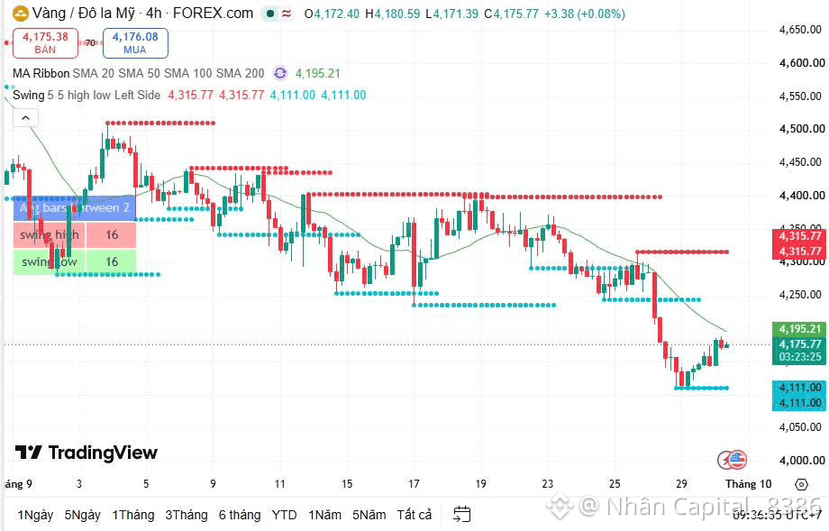
Gold prices in the previous session saw a fairly strong rebound from the bottom zone after facing heavy selling pressure earlier in the week. The rebound was driven by oil prices cooling off, U.S. Treasury yields falling back again, and the increasing pressure from the USD being eased—thereby helping Gold regain part of its buying demand. Reuters reported that Spot Gold rose by about 1% in the session on 29/09 after hitting the lowest level in seven weeks.
In terms of technicals, the 4100–4150 zone is currently becoming a notable support area after the sharp sell-off. If Gold continues to hold this area and forms a recovery structure on H1/H4, the possibility of another upward move is entirely plausible.
Update $XAU on 30/9:
Gold prices in the previous session saw a fairly strong rebound from the bottom zone after facing heavy selling pressure earlier in the week. The rebound was driven by oil prices cooling off, U.S. Treasury yields falling back again, and the increasing pressure from the USD being eased—thereby helping Gold regain part of its buying demand. Reuters reported that Spot Gold rose by about 1% in the session on 29/09 after hitting the lowest level in seven weeks.
In terms of technicals, the 4100–4150 zone is currently becoming a notable support area after the sharp sell-off. If Gold continues to hold this area and forms a recovery structure on H1/H4, the possibility of another upward move is entirely plausible.
Gold prices in the previous session saw a fairly strong rebound from the bottom zone after facing heavy selling pressure earlier in the week. The rebound was driven by oil prices cooling off, U.S. Treasury yields falling back again, and the increasing pressure from the USD being eased—thereby helping Gold regain part of its buying demand. Reuters reported that Spot Gold rose by about 1% in the session on 29/09 after hitting the lowest level in seven weeks.
In terms of technicals, the 4100–4150 zone is currently becoming a notable support area after the sharp sell-off. If Gold continues to hold this area and forms a recovery structure on H1/H4, the possibility of another upward move is entirely plausible.
1
244
·
--
Bullish
Update $BTC September 29:
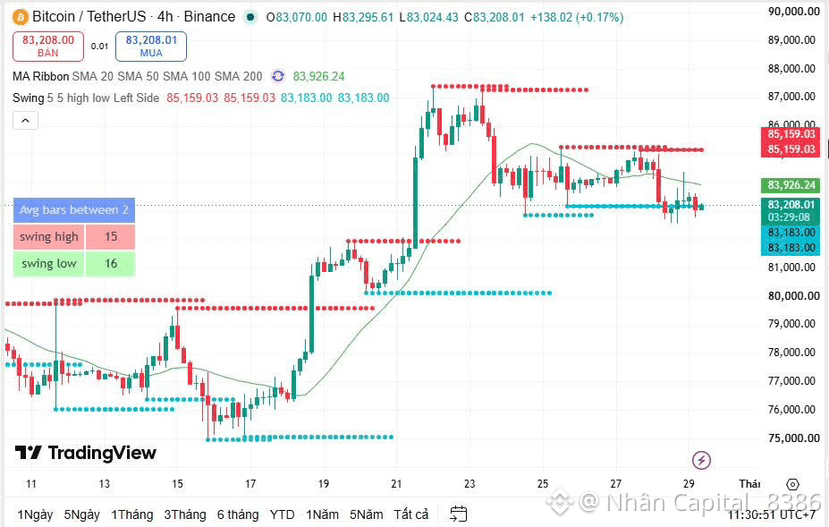
Bitcoin has broken through the previous accumulation range and is now returning to retest the support zone that was just broken.
If BTC can hold this area and buying pressure returns, the likelihood of forming a strong bullish leg next will be reinforced. Conversely, if support is broken, the price structure may need more time to accumulate before determining a new direction.
=> Current key point: 82.5K–83K is the reaction zone; 84K+ is the confirmation zone for a recovery; 81.6K is the milestone that needs to be especially noted if it is broken.
#BTC
Update $BTC September 29:
Bitcoin has broken through the previous accumulation range and is now returning to retest the support zone that was just broken.
If BTC can hold this area and buying pressure returns, the likelihood of forming a strong bullish leg next will be reinforced. Conversely, if support is broken, the price structure may need more time to accumulate before determining a new direction.
=> Current key point: 82.5K–83K is the reaction zone; 84K+ is the confirmation zone for a recovery; 81.6K is the milestone that needs to be especially noted if it is broken.
#BTC
Bitcoin has broken through the previous accumulation range and is now returning to retest the support zone that was just broken.
If BTC can hold this area and buying pressure returns, the likelihood of forming a strong bullish leg next will be reinforced. Conversely, if support is broken, the price structure may need more time to accumulate before determining a new direction.
=> Current key point: 82.5K–83K is the reaction zone; 84K+ is the confirmation zone for a recovery; 81.6K is the milestone that needs to be especially noted if it is broken.
#BTC
1
411
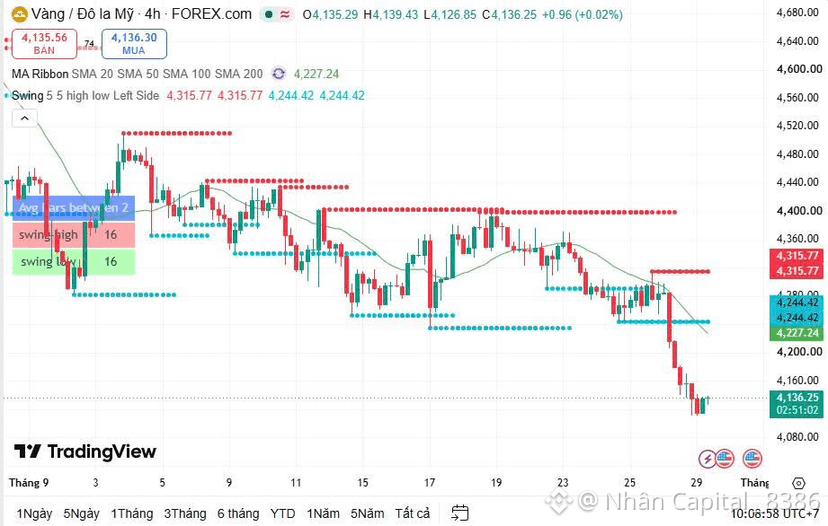
Update $XAU on September 29:
Yesterday’s gold price continued to see a very strong down-move, at times breaking through into around the 4100 area, amid geopolitical tensions and especially conflicting information related to the US–Iran negotiations, which has made market sentiment extremely cautious.
From a technical perspective, the decline into the 4100 zone is currently bringing prices back toward a very notable support area. This is also the area where Gold is approaching again a previously established downward trendline, while the H4 timeframe has entered an oversold state after the sharp sell-off.
Therefore, although short-term selling pressure is still quite strong, I believe the 4100–4150 area could see a rebound/relief reaction. However, the point to note is that upward momentum has not truly appeared yet, especially when the positive news from the US–Iran negotiations is still not clear enough. The market is currently reacting very sensitively to every new piece of information and could continue to see sharp volatility swings.
$XAU
{future}(XAUUSDT)
Update $XAU on September 29:
Yesterday’s gold price continued to see a very strong down-move, at times breaking through into around the 4100 area, amid geopolitical tensions and especially conflicting information related to the US–Iran negotiations, which has made market sentiment extremely cautious.
From a technical perspective, the decline into the 4100 zone is currently bringing prices back toward a very notable support area. This is also the area where Gold is approaching again a previously established downward trendline, while the H4 timeframe has entered an oversold state after the sharp sell-off.
Therefore, although short-term selling pressure is still quite strong, I believe the 4100–4150 area could see a rebound/relief reaction. However, the point to note is that upward momentum has not truly appeared yet, especially when the positive news from the US–Iran negotiations is still not clear enough. The market is currently reacting very sensitively to every new piece of information and could continue to see sharp volatility swings.
$XAU
Yesterday’s gold price continued to see a very strong down-move, at times breaking through into around the 4100 area, amid geopolitical tensions and especially conflicting information related to the US–Iran negotiations, which has made market sentiment extremely cautious.
From a technical perspective, the decline into the 4100 zone is currently bringing prices back toward a very notable support area. This is also the area where Gold is approaching again a previously established downward trendline, while the H4 timeframe has entered an oversold state after the sharp sell-off.
Therefore, although short-term selling pressure is still quite strong, I believe the 4100–4150 area could see a rebound/relief reaction. However, the point to note is that upward momentum has not truly appeared yet, especially when the positive news from the US–Iran negotiations is still not clear enough. The market is currently reacting very sensitively to every new piece of information and could continue to see sharp volatility swings.
$XAU
1
357
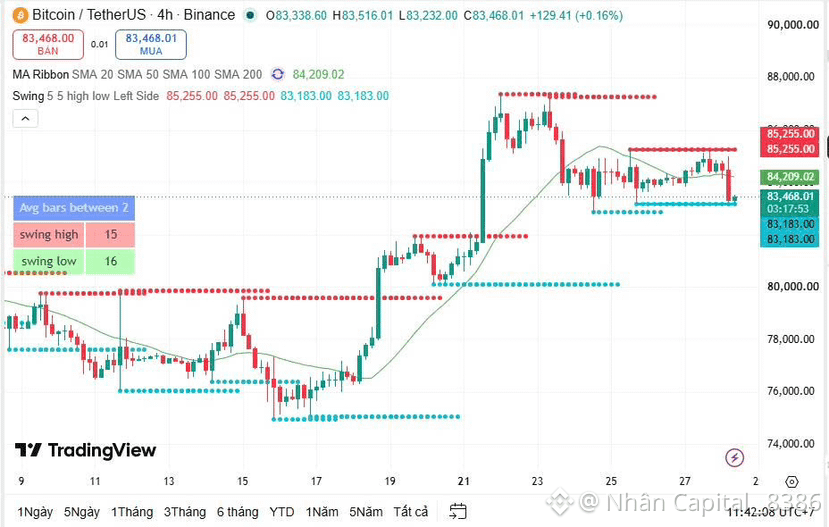
- Update $BTC ngày 28/9 :
Based on order book data and large trading orders recorded on major exchanges such as Binance and Coinbase, the 85,000 – 90,000 USD area is currently showing a relatively large amount of supply. Some market data also reports a cluster of sell orders lasting from around 85K to 91K, where 85K–85.8K is the nearby resistance zone, and 88K and 90K are the next notable levels.
On the technical side, BTC is still holding above support around 83K–84K, but after a strong rally from the 80K area to nearly 87.3K, the price has responded with a corrective move and returned to accumulation around 84K–85K. Price data also shows BTC has tested the 85K area multiple times but has not been able to sustain momentum to push higher above it.
I update the detailed plan in the group every day!!!
#BTC $BTC
{future}(BTCUSDT)
- Update $BTC ngày 28/9 :
Based on order book data and large trading orders recorded on major exchanges such as Binance and Coinbase, the 85,000 – 90,000 USD area is currently showing a relatively large amount of supply. Some market data also reports a cluster of sell orders lasting from around 85K to 91K, where 85K–85.8K is the nearby resistance zone, and 88K and 90K are the next notable levels.
On the technical side, BTC is still holding above support around 83K–84K, but after a strong rally from the 80K area to nearly 87.3K, the price has responded with a corrective move and returned to accumulation around 84K–85K. Price data also shows BTC has tested the 85K area multiple times but has not been able to sustain momentum to push higher above it.
I update the detailed plan in the group every day!!!
#BTC $BTC
Based on order book data and large trading orders recorded on major exchanges such as Binance and Coinbase, the 85,000 – 90,000 USD area is currently showing a relatively large amount of supply. Some market data also reports a cluster of sell orders lasting from around 85K to 91K, where 85K–85.8K is the nearby resistance zone, and 88K and 90K are the next notable levels.
On the technical side, BTC is still holding above support around 83K–84K, but after a strong rally from the 80K area to nearly 87.3K, the price has responded with a corrective move and returned to accumulation around 84K–85K. Price data also shows BTC has tested the 85K area multiple times but has not been able to sustain momentum to push higher above it.
I update the detailed plan in the group every day!!!
#BTC $BTC
1
274
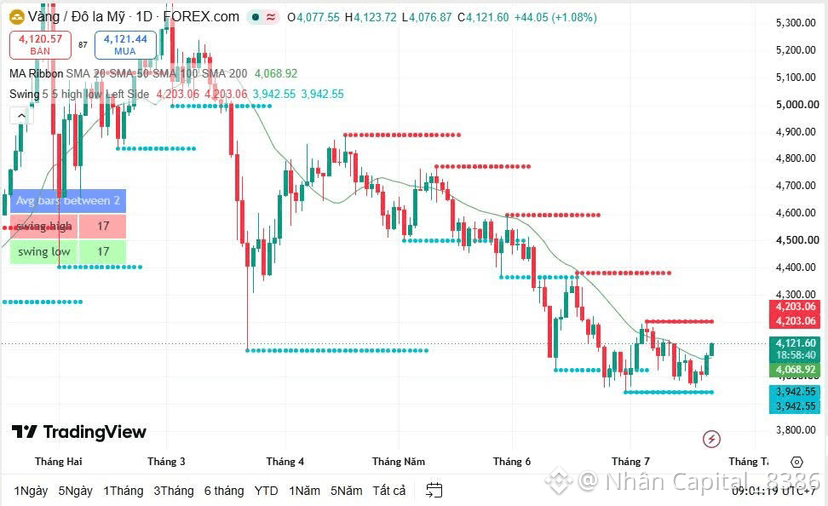
Update $Xau on 22/7:
Gold prices continue to maintain their recovery momentum and are currently trading around the 4,080 area, indicating that buying pressure is gradually gaining the upper hand after a consolidation period. The market appears to be betting that the Middle East tensions will not escalate into a full-scale conflict, while also expecting the parties to soon return to the negotiating table. In addition, a weaker US dollar and falling bond yields are also supporting gold’s upward move.
Technically, the short-term trend looks more positive as gold holds above the key support zone around 4,000–4,020. However, after the current upswings, it is entirely normal for a technical correction to occur.
Update $Xau on 22/7:
Gold prices continue to maintain their recovery momentum and are currently trading around the 4,080 area, indicating that buying pressure is gradually gaining the upper hand after a consolidation period. The market appears to be betting that the Middle East tensions will not escalate into a full-scale conflict, while also expecting the parties to soon return to the negotiating table. In addition, a weaker US dollar and falling bond yields are also supporting gold’s upward move.
Technically, the short-term trend looks more positive as gold holds above the key support zone around 4,000–4,020. However, after the current upswings, it is entirely normal for a technical correction to occur.
Gold prices continue to maintain their recovery momentum and are currently trading around the 4,080 area, indicating that buying pressure is gradually gaining the upper hand after a consolidation period. The market appears to be betting that the Middle East tensions will not escalate into a full-scale conflict, while also expecting the parties to soon return to the negotiating table. In addition, a weaker US dollar and falling bond yields are also supporting gold’s upward move.
Technically, the short-term trend looks more positive as gold holds above the key support zone around 4,000–4,020. However, after the current upswings, it is entirely normal for a technical correction to occur.
277
·
--
Bullish
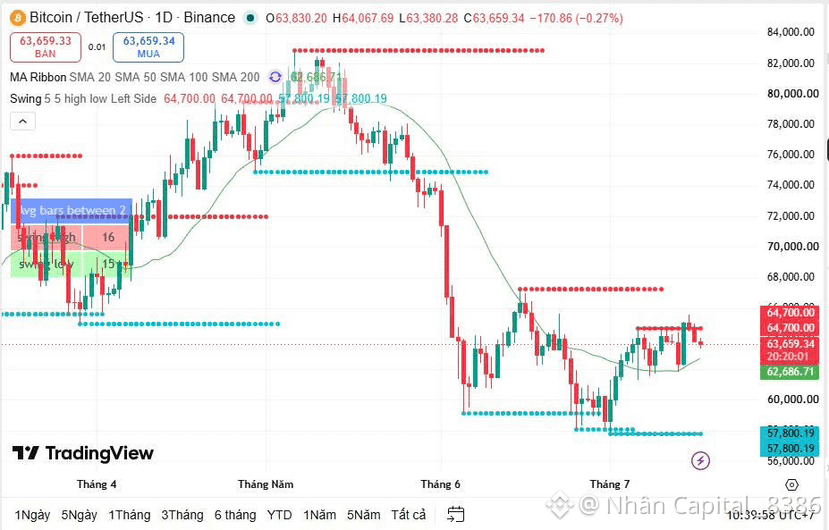
Update $BTC on July 17:
Bitcoin is maintaining a positive trend after breaking out of the consolidation range, although the most recent session formed a Bearish Pin Bar candle at the 65K resistance zone. Current selling pressure mainly comes from short-term profit-taking, while buying power is still absorbing quite well.
On the D1 timeframe, BTC is gradually completing an inverse Head and Shoulders pattern, with the right shoulder forming a Higher Low, RSI staying above the 50 level, and the Bollinger Bands beginning to expand—signals that indicate improving upward momentum. If the price successfully breaks through the 65K–66K area, the uptrend will be confirmed with the next target around 69K–70K.
On the H4 timeframe, BTC is still holding above the breakout zone and is accumulating just above the old resistance instead of making a deep pullback. Any downward dips are quickly met with buying support, suggesting that capital is still in the market and that the buyers are controlling the short-term trend.
$BTC
{future}(BTCUSDT)
Update $BTC on July 17:
Bitcoin is maintaining a positive trend after breaking out of the consolidation range, although the most recent session formed a Bearish Pin Bar candle at the 65K resistance zone. Current selling pressure mainly comes from short-term profit-taking, while buying power is still absorbing quite well.
On the D1 timeframe, BTC is gradually completing an inverse Head and Shoulders pattern, with the right shoulder forming a Higher Low, RSI staying above the 50 level, and the Bollinger Bands beginning to expand—signals that indicate improving upward momentum. If the price successfully breaks through the 65K–66K area, the uptrend will be confirmed with the next target around 69K–70K.
On the H4 timeframe, BTC is still holding above the breakout zone and is accumulating just above the old resistance instead of making a deep pullback. Any downward dips are quickly met with buying support, suggesting that capital is still in the market and that the buyers are controlling the short-term trend.
$BTC
Bitcoin is maintaining a positive trend after breaking out of the consolidation range, although the most recent session formed a Bearish Pin Bar candle at the 65K resistance zone. Current selling pressure mainly comes from short-term profit-taking, while buying power is still absorbing quite well.
On the D1 timeframe, BTC is gradually completing an inverse Head and Shoulders pattern, with the right shoulder forming a Higher Low, RSI staying above the 50 level, and the Bollinger Bands beginning to expand—signals that indicate improving upward momentum. If the price successfully breaks through the 65K–66K area, the uptrend will be confirmed with the next target around 69K–70K.
On the H4 timeframe, BTC is still holding above the breakout zone and is accumulating just above the old resistance instead of making a deep pullback. Any downward dips are quickly met with buying support, suggesting that capital is still in the market and that the buyers are controlling the short-term trend.
$BTC
1
149
Update $Xau on 17/7:
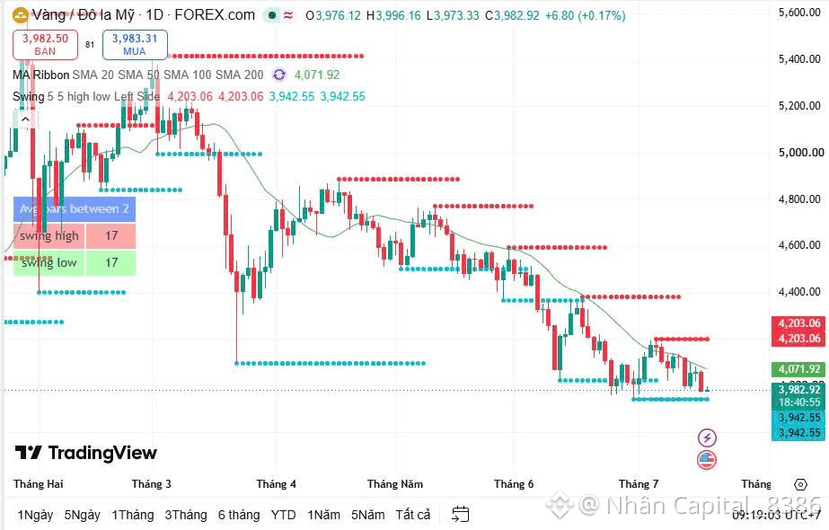
Gold prices in yesterday’s session continued to face very strong selling pressure as US–Iran tensions escalated, causing the market to worry that energy prices would remain at high levels. Although oil has not broken out too strongly, inflation risks are still present, increasing expectations that the Fed will continue its tight monetary policy, which is unfavorable for gold. This development is also consistent with market trends: as yields and the US dollar rise, gold prices fell below the 4,000 USD zone in the most recent session.
In the short term, the downward trend remains dominant, and the next target could be the 3,900 area if selling pressure continues. However, since the price is moving close to the short-term bottom, investors should be patient and observe the market’s reaction rather than chasing the sell-off.
$XAUT
{future}(XAUTUSDT)
Update $Xau on 17/7:
Gold prices in yesterday’s session continued to face very strong selling pressure as US–Iran tensions escalated, causing the market to worry that energy prices would remain at high levels. Although oil has not broken out too strongly, inflation risks are still present, increasing expectations that the Fed will continue its tight monetary policy, which is unfavorable for gold. This development is also consistent with market trends: as yields and the US dollar rise, gold prices fell below the 4,000 USD zone in the most recent session.
In the short term, the downward trend remains dominant, and the next target could be the 3,900 area if selling pressure continues. However, since the price is moving close to the short-term bottom, investors should be patient and observe the market’s reaction rather than chasing the sell-off.
$XAUT
Gold prices in yesterday’s session continued to face very strong selling pressure as US–Iran tensions escalated, causing the market to worry that energy prices would remain at high levels. Although oil has not broken out too strongly, inflation risks are still present, increasing expectations that the Fed will continue its tight monetary policy, which is unfavorable for gold. This development is also consistent with market trends: as yields and the US dollar rise, gold prices fell below the 4,000 USD zone in the most recent session.
In the short term, the downward trend remains dominant, and the next target could be the 3,900 area if selling pressure continues. However, since the price is moving close to the short-term bottom, investors should be patient and observe the market’s reaction rather than chasing the sell-off.
$XAUT
2
465
Update $BTC day 15/7:
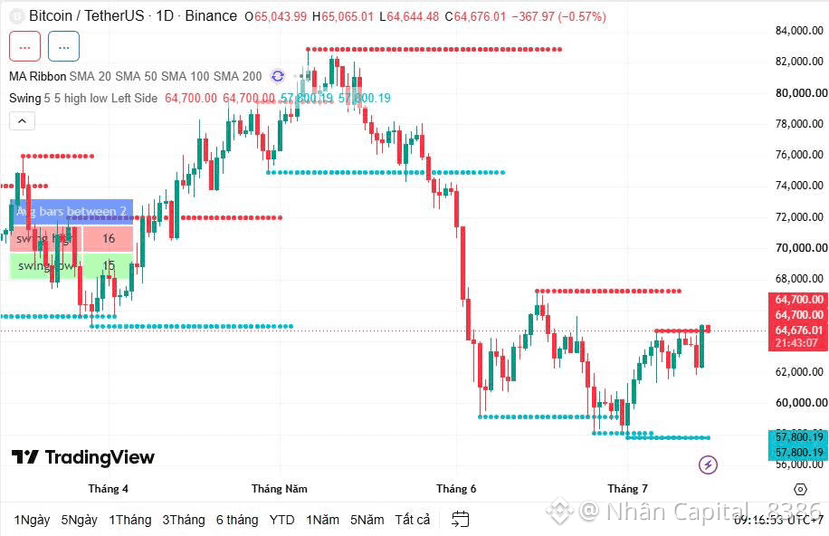
Last night, Bitcoin surged strongly again and reclaimed the $65,000 level, triggering the liquidation of more than $280 million in positions in the derivatives market. The momentum came from Trump saying he does not support imposing fees on vessels transiting the Strait of Hormuz, contrary to the earlier proposal of a 20% fee. At the same time, the action plan with Iran has also been pushed to next week.
Meanwhile, during the hearing, Fed Vice Chairman Kevin Warsh reiterated that the top priority remains bringing inflation back to the 2% target. He also said the Fed is rushing to finalize regulations to implement the GENIUS Act ahead of the deadline of 19/7.
$BTC
{future}(BTCUSDT)
Update $BTC day 15/7:
Last night, Bitcoin surged strongly again and reclaimed the $65,000 level, triggering the liquidation of more than $280 million in positions in the derivatives market. The momentum came from Trump saying he does not support imposing fees on vessels transiting the Strait of Hormuz, contrary to the earlier proposal of a 20% fee. At the same time, the action plan with Iran has also been pushed to next week.
Meanwhile, during the hearing, Fed Vice Chairman Kevin Warsh reiterated that the top priority remains bringing inflation back to the 2% target. He also said the Fed is rushing to finalize regulations to implement the GENIUS Act ahead of the deadline of 19/7.
$BTC
Last night, Bitcoin surged strongly again and reclaimed the $65,000 level, triggering the liquidation of more than $280 million in positions in the derivatives market. The momentum came from Trump saying he does not support imposing fees on vessels transiting the Strait of Hormuz, contrary to the earlier proposal of a 20% fee. At the same time, the action plan with Iran has also been pushed to next week.
Meanwhile, during the hearing, Fed Vice Chairman Kevin Warsh reiterated that the top priority remains bringing inflation back to the 2% target. He also said the Fed is rushing to finalize regulations to implement the GENIUS Act ahead of the deadline of 19/7.
$BTC
215
Update $Xau on 15/7:
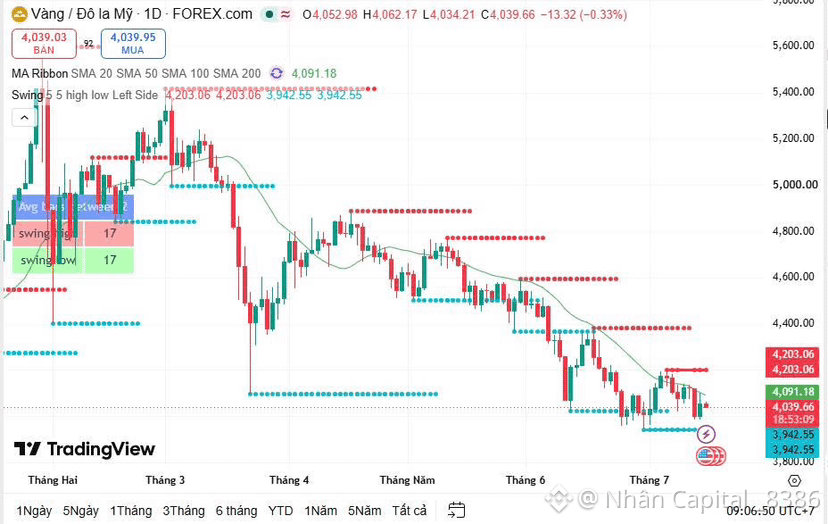
Gold prices have adjusted again after completing the GAP fill around the 4100 area, facing pressure from remarks with a “hawkish” stance by Fed officials Kevin Warsh and Christopher Waller. Although CPI has shown signs of cooling, inflation has not returned to the 2% target, making it likely that the Fed will continue to maintain a cautious policy. This limits gold’s room to rise in the short term.
However, the market is still waiting for the U.S. PPI to be released today. If the data comes in below expectations, the USD could weaken and provide conditions for gold to recover technically before facing renewed selling pressure.
$BTC
{future}(BTCUSDT)
Update $Xau on 15/7:
Gold prices have adjusted again after completing the GAP fill around the 4100 area, facing pressure from remarks with a “hawkish” stance by Fed officials Kevin Warsh and Christopher Waller. Although CPI has shown signs of cooling, inflation has not returned to the 2% target, making it likely that the Fed will continue to maintain a cautious policy. This limits gold’s room to rise in the short term.
However, the market is still waiting for the U.S. PPI to be released today. If the data comes in below expectations, the USD could weaken and provide conditions for gold to recover technically before facing renewed selling pressure.
$BTC
Gold prices have adjusted again after completing the GAP fill around the 4100 area, facing pressure from remarks with a “hawkish” stance by Fed officials Kevin Warsh and Christopher Waller. Although CPI has shown signs of cooling, inflation has not returned to the 2% target, making it likely that the Fed will continue to maintain a cautious policy. This limits gold’s room to rise in the short term.
However, the market is still waiting for the U.S. PPI to be released today. If the data comes in below expectations, the USD could weaken and provide conditions for gold to recover technically before facing renewed selling pressure.
$BTC
1
210
Update $BTC.D July 14:
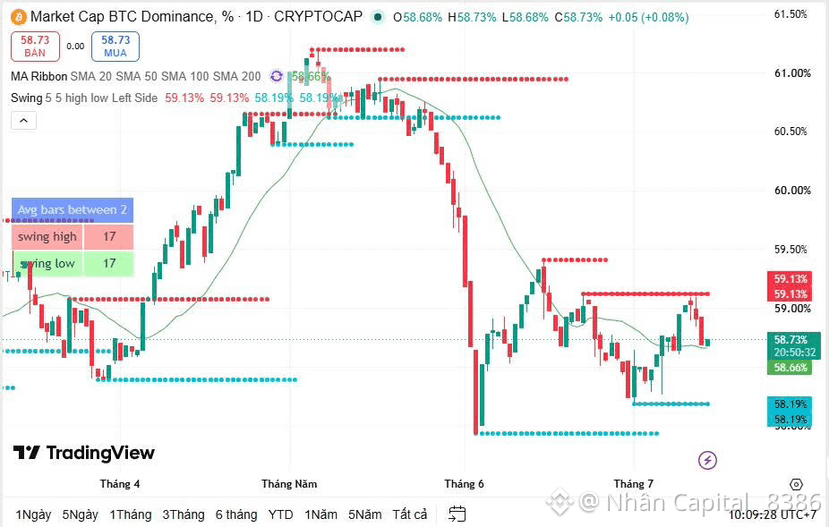
BTC Dominance is trading just below the important resistance zone of the triangle pattern, indicating that resistance is still present after several consecutive bullish sessions. Meanwhile, the Ichimoku cloud below continues to act as a dynamic support zone, helping ensure that BTC.D’s uptrend has not been invalidated.
If BTC.D successfully breaks out above the upper edge of the pattern, capital flows are likely to keep focusing on Bitcoin, which would put pressure on altcoins and make it difficult to see a strong rally.
On the other hand, if BTC.D loses the Ichimoku cloud support zone and breaks down below the pattern, that would be a positive signal for altcoins, as money could shift from BTC to smaller-cap coins, creating an opportunity for a short-term Altcoin Season.
$BTCDOM #BTC.Dominance
{future}(BTCDOMUSDT)
Update $BTC.D July 14:
BTC Dominance is trading just below the important resistance zone of the triangle pattern, indicating that resistance is still present after several consecutive bullish sessions. Meanwhile, the Ichimoku cloud below continues to act as a dynamic support zone, helping ensure that BTC.D’s uptrend has not been invalidated.
If BTC.D successfully breaks out above the upper edge of the pattern, capital flows are likely to keep focusing on Bitcoin, which would put pressure on altcoins and make it difficult to see a strong rally.
On the other hand, if BTC.D loses the Ichimoku cloud support zone and breaks down below the pattern, that would be a positive signal for altcoins, as money could shift from BTC to smaller-cap coins, creating an opportunity for a short-term Altcoin Season.
$BTCDOM #BTC.Dominance
BTC Dominance is trading just below the important resistance zone of the triangle pattern, indicating that resistance is still present after several consecutive bullish sessions. Meanwhile, the Ichimoku cloud below continues to act as a dynamic support zone, helping ensure that BTC.D’s uptrend has not been invalidated.
If BTC.D successfully breaks out above the upper edge of the pattern, capital flows are likely to keep focusing on Bitcoin, which would put pressure on altcoins and make it difficult to see a strong rally.
On the other hand, if BTC.D loses the Ichimoku cloud support zone and breaks down below the pattern, that would be a positive signal for altcoins, as money could shift from BTC to smaller-cap coins, creating an opportunity for a short-term Altcoin Season.
$BTCDOM #BTC.Dominance
1
407
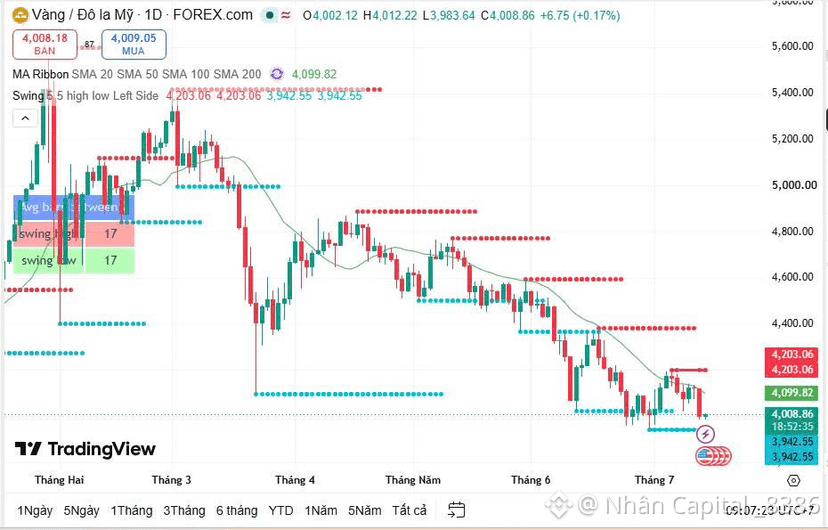
Update $Xau on 14/7:
Gold prices continue to face strong selling pressure as U.S.–Iran tensions escalate again, along with the risk of disruption at the Strait of Hormuz, which pushes oil prices sharply higher and raises concerns that inflation may return. This leads to expectations that the Fed will keep monetary policy tight for longer, thereby putting pressure on gold.
On the technical side, the price losing the 4022 support zone completes the Double Top pattern, opening up the possibility of the downtrend continuing in the short term. Although the GAP zone above has not yet been filled, selling pressure is still dominant and no clear reversal signal has appeared.
Under the current scenario, if the selling pressure continues to be maintained, GOLD is likely to move toward the important support area of 3940. Therefore, the priority for today’s session is to look for SELL opportunities on pullbacks, and to avoid catching the bottom while the downtrend still dominates.
$XAU
{future}(XAUUSDT)
Update $Xau on 14/7:
Gold prices continue to face strong selling pressure as U.S.–Iran tensions escalate again, along with the risk of disruption at the Strait of Hormuz, which pushes oil prices sharply higher and raises concerns that inflation may return. This leads to expectations that the Fed will keep monetary policy tight for longer, thereby putting pressure on gold.
On the technical side, the price losing the 4022 support zone completes the Double Top pattern, opening up the possibility of the downtrend continuing in the short term. Although the GAP zone above has not yet been filled, selling pressure is still dominant and no clear reversal signal has appeared.
Under the current scenario, if the selling pressure continues to be maintained, GOLD is likely to move toward the important support area of 3940. Therefore, the priority for today’s session is to look for SELL opportunities on pullbacks, and to avoid catching the bottom while the downtrend still dominates.
$XAU
Gold prices continue to face strong selling pressure as U.S.–Iran tensions escalate again, along with the risk of disruption at the Strait of Hormuz, which pushes oil prices sharply higher and raises concerns that inflation may return. This leads to expectations that the Fed will keep monetary policy tight for longer, thereby putting pressure on gold.
On the technical side, the price losing the 4022 support zone completes the Double Top pattern, opening up the possibility of the downtrend continuing in the short term. Although the GAP zone above has not yet been filled, selling pressure is still dominant and no clear reversal signal has appeared.
Under the current scenario, if the selling pressure continues to be maintained, GOLD is likely to move toward the important support area of 3940. Therefore, the priority for today’s session is to look for SELL opportunities on pullbacks, and to avoid catching the bottom while the downtrend still dominates.
$XAU
1
154
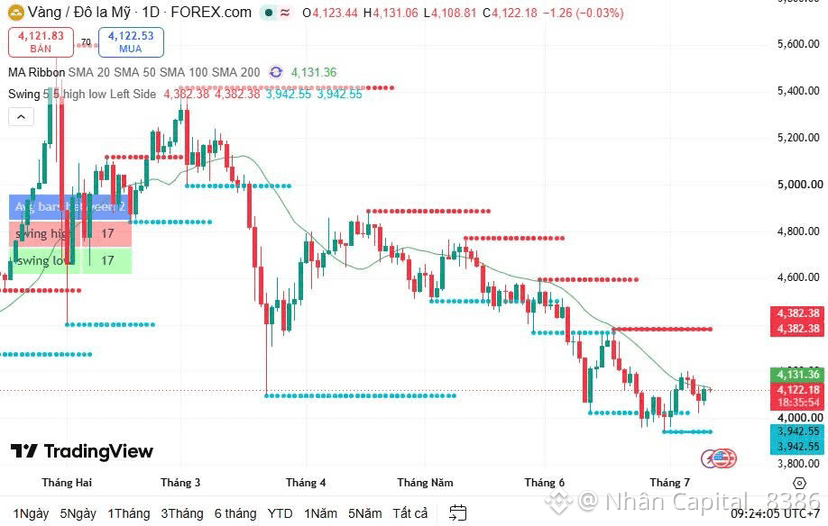
Update $Xau on 10/7:
In the previous session, gold prices continued to maintain the rebound momentum and regained the 4,100 level as market sentiment improved following news that the US and Iran had temporarily halted airstrikes. In addition, easing oil prices helped weaken the US dollar, creating conditions for gold to rise again.
From a technical perspective, GOLD is currently moving closer to the descending trendline extending from prior peaks. Although this remains a notable resistance zone, buying pressure shows signs of improving, and the trendline could be broken soon if prices stay above the short-term support area.
$XAU
{future}(XAUUSDT)
Update $Xau on 10/7:
In the previous session, gold prices continued to maintain the rebound momentum and regained the 4,100 level as market sentiment improved following news that the US and Iran had temporarily halted airstrikes. In addition, easing oil prices helped weaken the US dollar, creating conditions for gold to rise again.
From a technical perspective, GOLD is currently moving closer to the descending trendline extending from prior peaks. Although this remains a notable resistance zone, buying pressure shows signs of improving, and the trendline could be broken soon if prices stay above the short-term support area.
$XAU
In the previous session, gold prices continued to maintain the rebound momentum and regained the 4,100 level as market sentiment improved following news that the US and Iran had temporarily halted airstrikes. In addition, easing oil prices helped weaken the US dollar, creating conditions for gold to rise again.
From a technical perspective, GOLD is currently moving closer to the descending trendline extending from prior peaks. Although this remains a notable resistance zone, buying pressure shows signs of improving, and the trendline could be broken soon if prices stay above the short-term support area.
$XAU
1
210
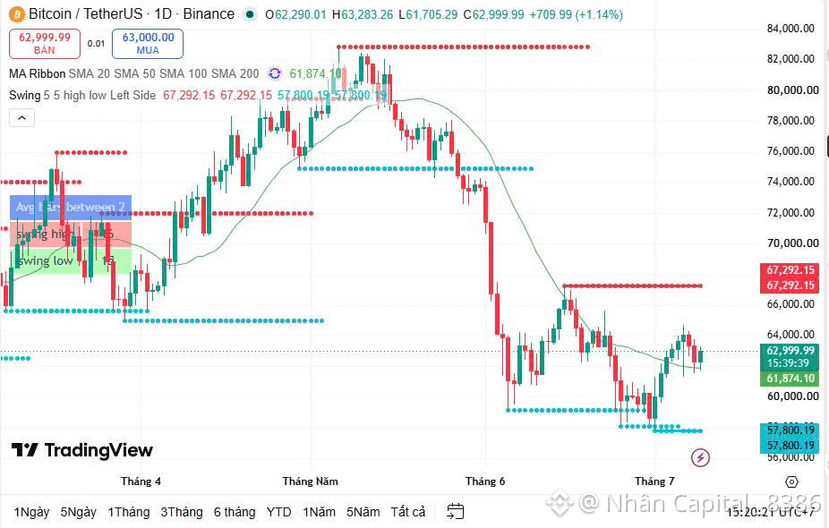
Update $BTC day 9/7 :
BTC has confirmed a breakdown below the Rising Wedge pattern with increasing trading volume, indicating that the sell-side is dominant in the short term. At present, the price is undergoing a rebound to retest the trendline area that was just broken.
On the D1 timeframe, the Ichimoku cloud is still acting as an important support zone, so bearish pressure has not completely taken over and the market may still show some technical pullback moves.
♦ If BTC is rejected at the retest zone and cannot return inside the pattern, it is likely that the price will continue extending the corrective move toward lower support areas.
♦ Conversely, if the buyers reclaim the lost trendline zone and the candle closes back within the pattern, this would be a signal of a false breakdown, creating an opportunity for a short-term rebound.
$BTC
{future}(BTCUSDT)
Update $BTC day 9/7 :
BTC has confirmed a breakdown below the Rising Wedge pattern with increasing trading volume, indicating that the sell-side is dominant in the short term. At present, the price is undergoing a rebound to retest the trendline area that was just broken.
On the D1 timeframe, the Ichimoku cloud is still acting as an important support zone, so bearish pressure has not completely taken over and the market may still show some technical pullback moves.
♦ If BTC is rejected at the retest zone and cannot return inside the pattern, it is likely that the price will continue extending the corrective move toward lower support areas.
♦ Conversely, if the buyers reclaim the lost trendline zone and the candle closes back within the pattern, this would be a signal of a false breakdown, creating an opportunity for a short-term rebound.
$BTC
BTC has confirmed a breakdown below the Rising Wedge pattern with increasing trading volume, indicating that the sell-side is dominant in the short term. At present, the price is undergoing a rebound to retest the trendline area that was just broken.
On the D1 timeframe, the Ichimoku cloud is still acting as an important support zone, so bearish pressure has not completely taken over and the market may still show some technical pullback moves.
♦ If BTC is rejected at the retest zone and cannot return inside the pattern, it is likely that the price will continue extending the corrective move toward lower support areas.
♦ Conversely, if the buyers reclaim the lost trendline zone and the candle closes back within the pattern, this would be a signal of a false breakdown, creating an opportunity for a short-term rebound.
$BTC
1
159
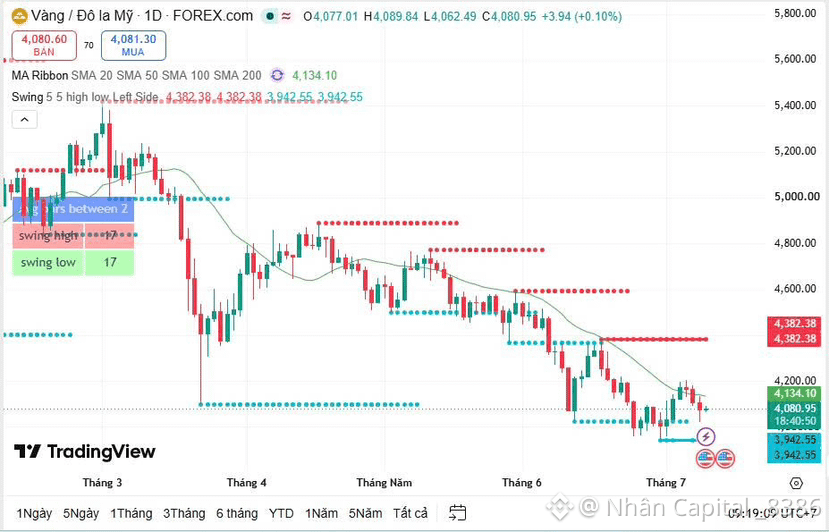
Update $Xau on 9/7:
Gold prices continue to face selling pressure and fall back toward the psychological support zone of 4,000 amid escalating tensions in the Middle East, along with concerns surrounding the Strait of Hormuz. However, the market has not yet shown signs of panic, indicating that investors are assessing the likelihood of the conflict expanding further as not too high.
In my personal view, a complete closure of the Strait of Hormuz would bring about many economic and political consequences; therefore, the probability of this scenario occurring in the short term is not very large. This may also cause the downward momentum of gold to gradually slow down after it approaches a strong support area.
➡️ Priority strategy: Continue monitoring the price reaction around the 4,000 zone. If reversal confirmation signals appear, this would be a suitable area to consider a Buy setup, with the expectation that gold will accumulate before rebounding again.
$XAU
{future}(XAUUSDT)
Update $Xau on 9/7:
Gold prices continue to face selling pressure and fall back toward the psychological support zone of 4,000 amid escalating tensions in the Middle East, along with concerns surrounding the Strait of Hormuz. However, the market has not yet shown signs of panic, indicating that investors are assessing the likelihood of the conflict expanding further as not too high.
In my personal view, a complete closure of the Strait of Hormuz would bring about many economic and political consequences; therefore, the probability of this scenario occurring in the short term is not very large. This may also cause the downward momentum of gold to gradually slow down after it approaches a strong support area.
➡️ Priority strategy: Continue monitoring the price reaction around the 4,000 zone. If reversal confirmation signals appear, this would be a suitable area to consider a Buy setup, with the expectation that gold will accumulate before rebounding again.
$XAU
Gold prices continue to face selling pressure and fall back toward the psychological support zone of 4,000 amid escalating tensions in the Middle East, along with concerns surrounding the Strait of Hormuz. However, the market has not yet shown signs of panic, indicating that investors are assessing the likelihood of the conflict expanding further as not too high.
In my personal view, a complete closure of the Strait of Hormuz would bring about many economic and political consequences; therefore, the probability of this scenario occurring in the short term is not very large. This may also cause the downward momentum of gold to gradually slow down after it approaches a strong support area.
➡️ Priority strategy: Continue monitoring the price reaction around the 4,000 zone. If reversal confirmation signals appear, this would be a suitable area to consider a Buy setup, with the expectation that gold will accumulate before rebounding again.
$XAU
1
226
·
--
Bearish
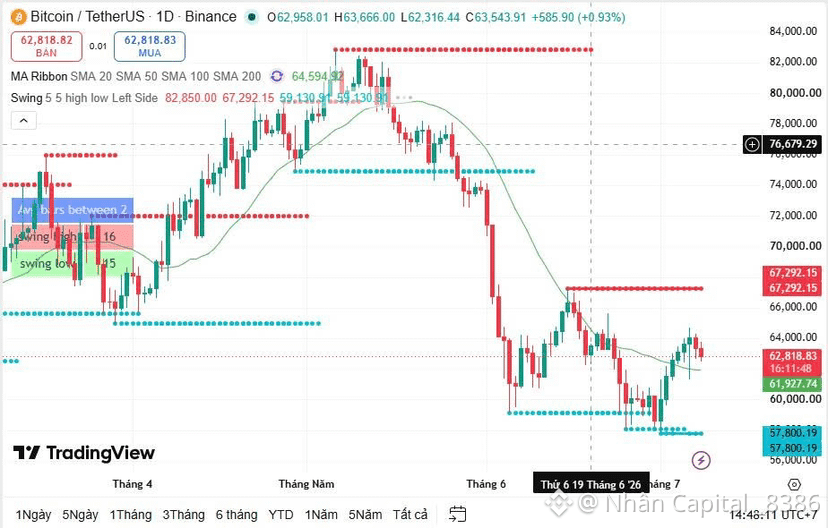
Update $BTC day 8/7 :
BTC has rebounded to the 64k area, matching the previous scenario. However, when entering an important resistance zone, the increasing momentum shows signs of slowing down, and the market may enter a short-term correction before determining the next trend.
After a streak of 6 consecutive bullish sessions, BTC formed a Pin Bar candle with a long lower wick, indicating that profit-taking selling pressure is quite strong, but it has still been absorbed well by the buyers. Even so, the subsequent bearish candle confirmed that selling supply pressure is increasing at the 64k zone, and also suggests that the uptrend’s momentum is no longer as dominant as in the earlier phase.
➡️ The scenario I prioritize is that BTC will have a pullback to the 60k–61k area to absorb supply before finding an opportunity to continue the rebound trend.
$BTC
{future}(BTCUSDT)
Update $BTC day 8/7 :
BTC has rebounded to the 64k area, matching the previous scenario. However, when entering an important resistance zone, the increasing momentum shows signs of slowing down, and the market may enter a short-term correction before determining the next trend.
After a streak of 6 consecutive bullish sessions, BTC formed a Pin Bar candle with a long lower wick, indicating that profit-taking selling pressure is quite strong, but it has still been absorbed well by the buyers. Even so, the subsequent bearish candle confirmed that selling supply pressure is increasing at the 64k zone, and also suggests that the uptrend’s momentum is no longer as dominant as in the earlier phase.
➡️ The scenario I prioritize is that BTC will have a pullback to the 60k–61k area to absorb supply before finding an opportunity to continue the rebound trend.
$BTC
BTC has rebounded to the 64k area, matching the previous scenario. However, when entering an important resistance zone, the increasing momentum shows signs of slowing down, and the market may enter a short-term correction before determining the next trend.
After a streak of 6 consecutive bullish sessions, BTC formed a Pin Bar candle with a long lower wick, indicating that profit-taking selling pressure is quite strong, but it has still been absorbed well by the buyers. Even so, the subsequent bearish candle confirmed that selling supply pressure is increasing at the 64k zone, and also suggests that the uptrend’s momentum is no longer as dominant as in the earlier phase.
➡️ The scenario I prioritize is that BTC will have a pullback to the 60k–61k area to absorb supply before finding an opportunity to continue the rebound trend.
$BTC
2
149
Log in to explore more content
Join global crypto users on Binance Square
⚡️ Get latest and useful information about crypto.
💬 Trusted by the world’s largest crypto exchange.
👍 Discover real insights from verified creators.
Email / Phone number