

CRYPTOMOJO_TA
1.6k Posts

CRYPTOMOJO_TA
Report
Block User
#Bitcoin and #Ethereum Learning Technical Analysis sharing margin or sport trades.
Occasional Trader
8 Years
17 Following
10.1K+ Followers
5.1K+ Liked
Posts
All
Quotes
Videos
$ETH Update
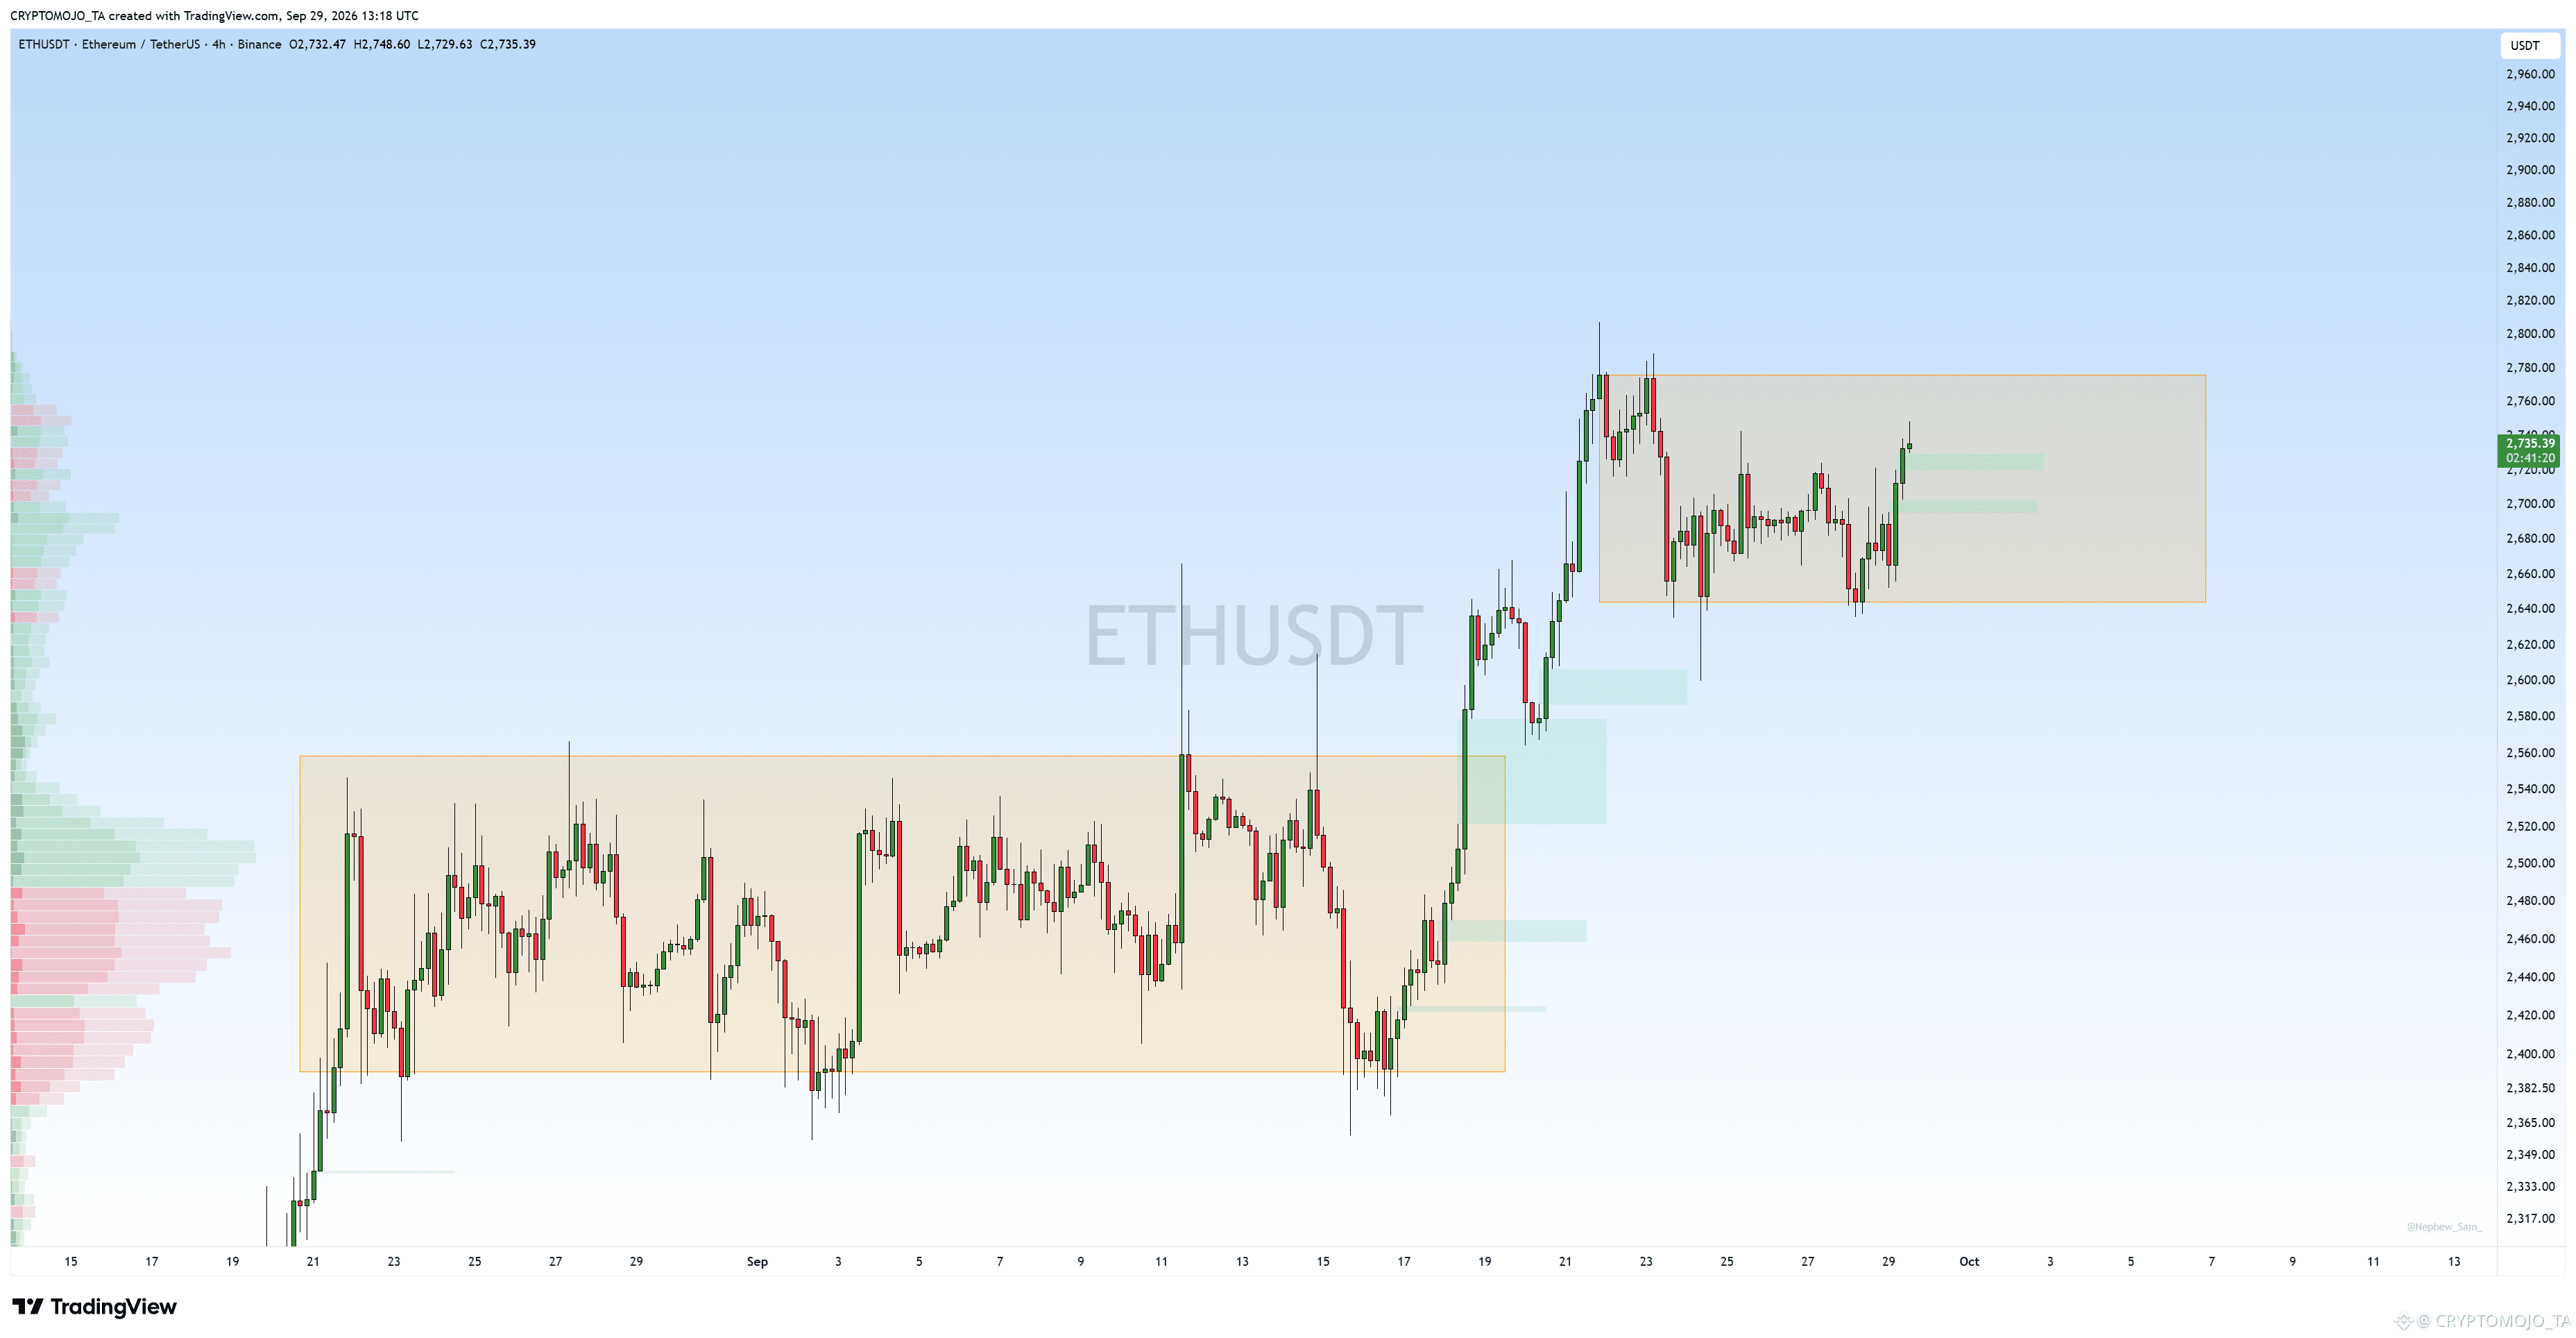
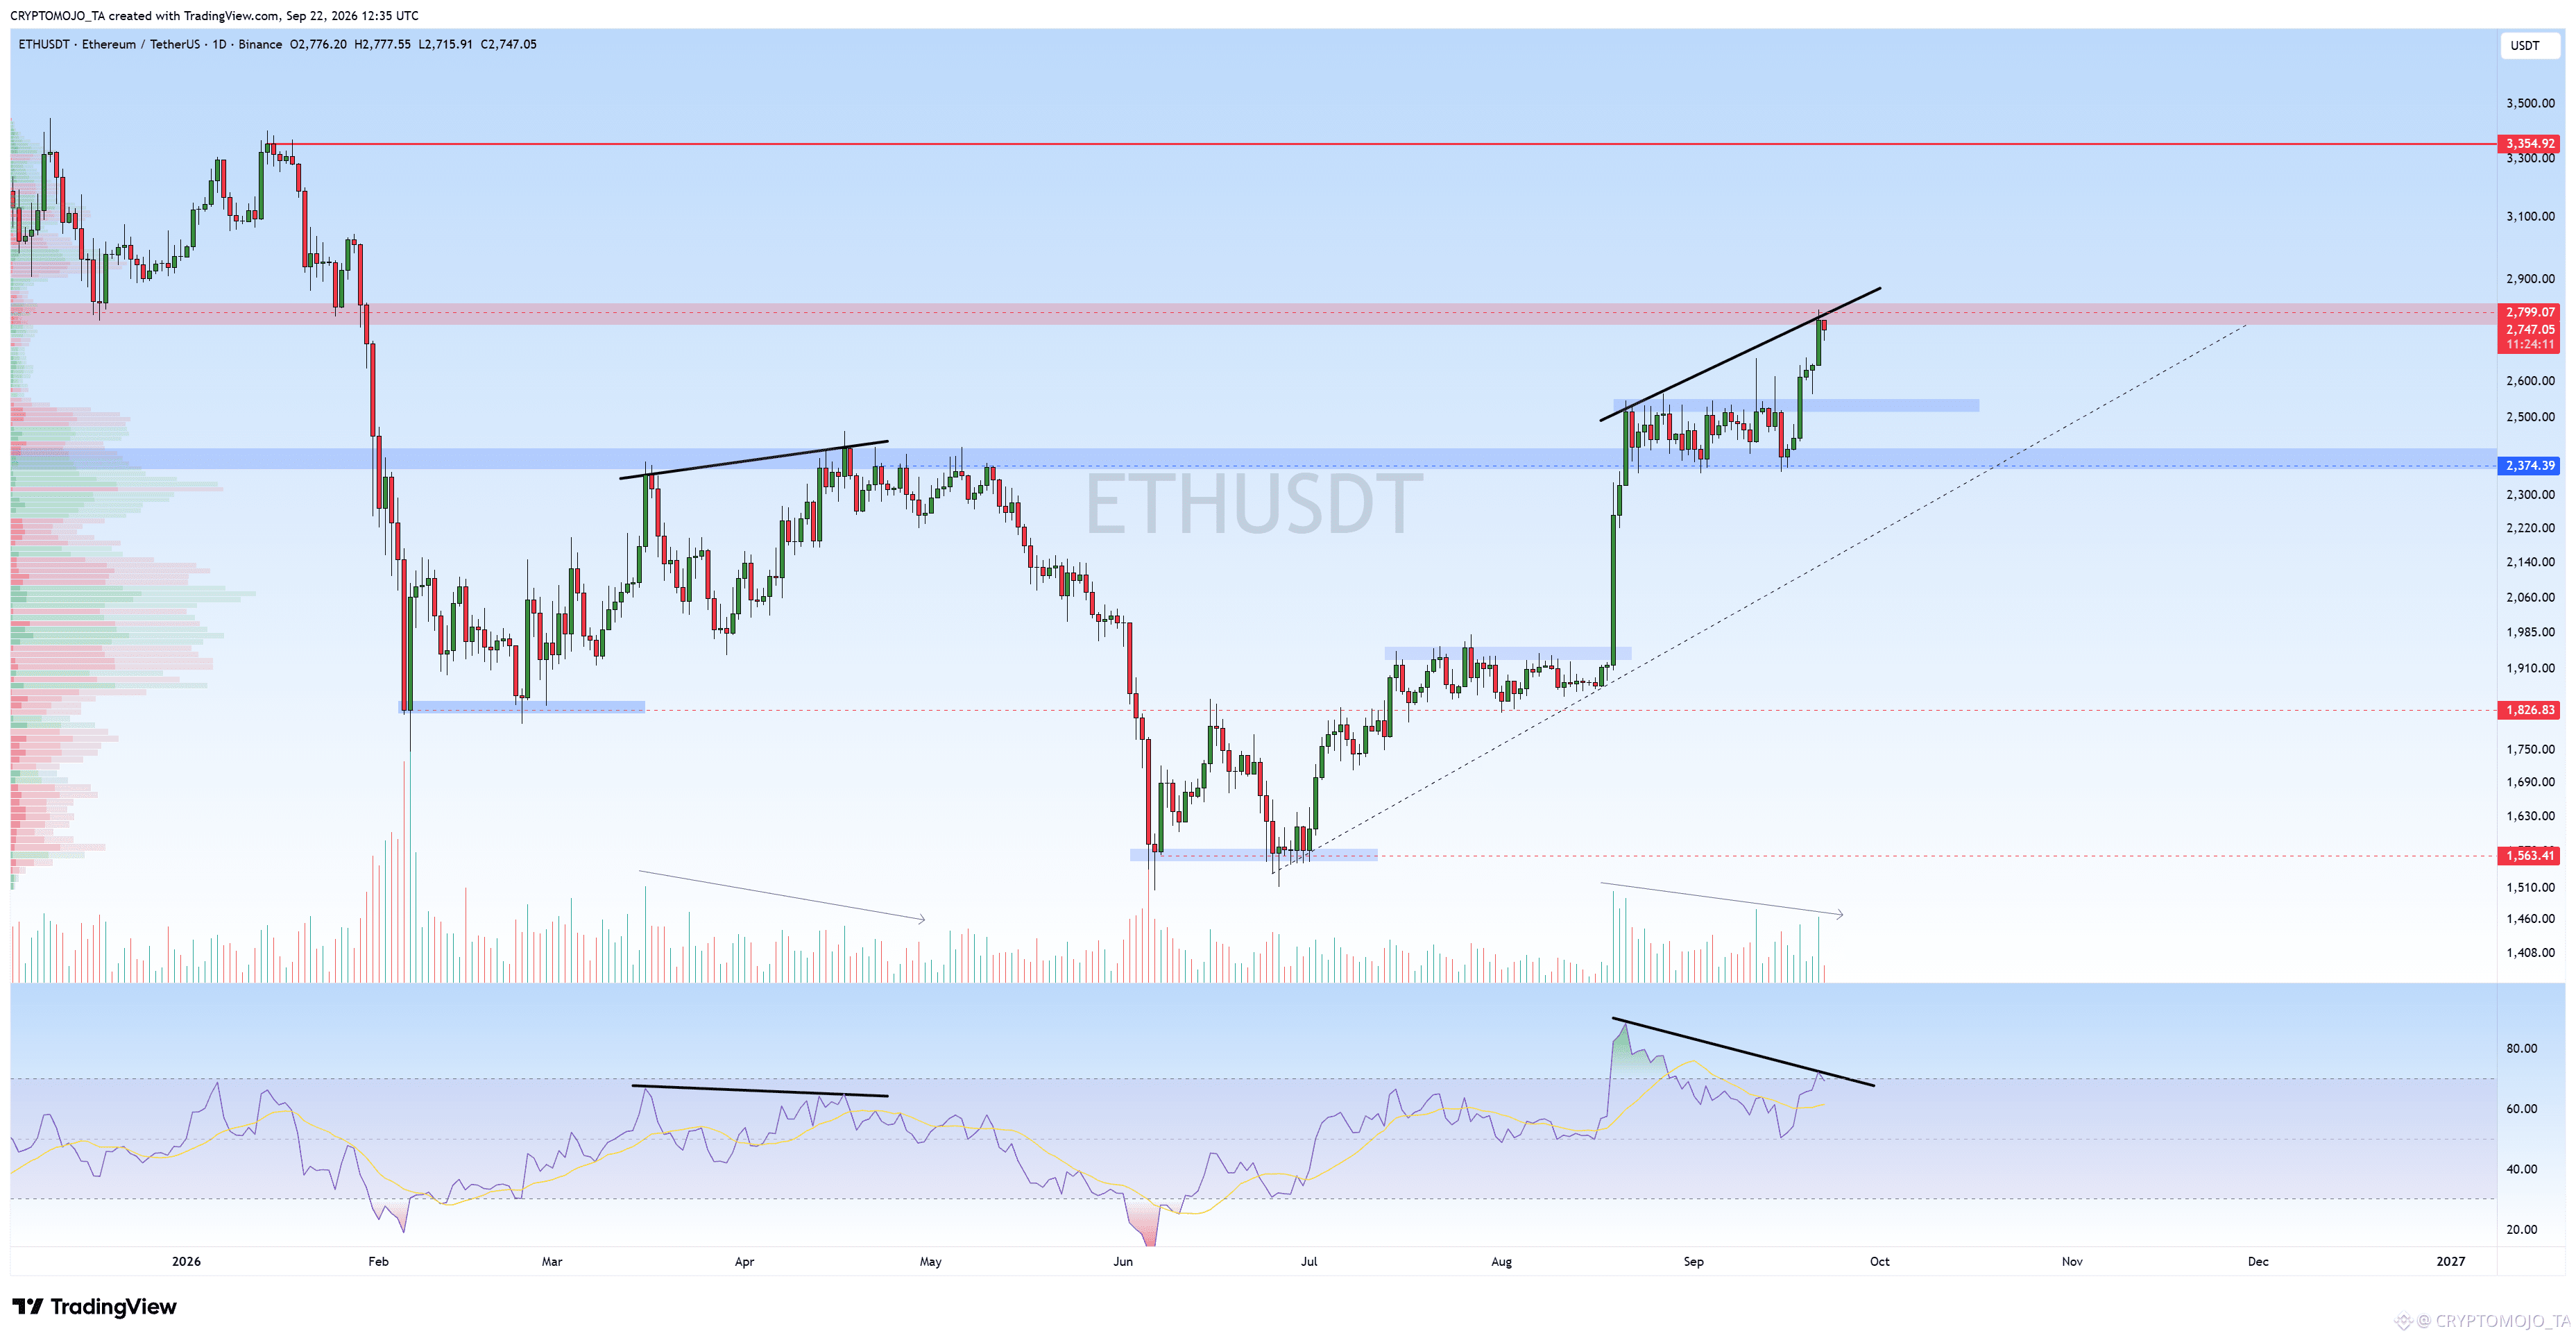
ETH is currently trading around $2,735 and has been consolidating inside a new range after the strong breakout from the previous range.
The previous range was roughly $2,390–$2,560. ETH eventually broke above it and pushed toward $2,780, creating a new consolidation zone around $2,650–$2,780.
Now the important part is the range breakout:
Above $2,780: could open the way toward $2,850–$2,900.
Below $2,650: the current structure would weaken and a deeper pullback could start.
$2,700–$2,730: short-term area to watch for support.
So far, ETH is holding the upper range well. A clean breakout above $2,780 would be the next major confirmation.
$ETH Update
ETH is currently trading around $2,735 and has been consolidating inside a new range after the strong breakout from the previous range.
The previous range was roughly $2,390–$2,560. ETH eventually broke above it and pushed toward $2,780, creating a new consolidation zone around $2,650–$2,780.
Now the important part is the range breakout:
Above $2,780: could open the way toward $2,850–$2,900.
Below $2,650: the current structure would weaken and a deeper pullback could start.
$2,700–$2,730: short-term area to watch for support.
So far, ETH is holding the upper range well. A clean breakout above $2,780 would be the next major confirmation.
ETH is currently trading around $2,735 and has been consolidating inside a new range after the strong breakout from the previous range.
The previous range was roughly $2,390–$2,560. ETH eventually broke above it and pushed toward $2,780, creating a new consolidation zone around $2,650–$2,780.
Now the important part is the range breakout:
Above $2,780: could open the way toward $2,850–$2,900.
Below $2,650: the current structure would weaken and a deeper pullback could start.
$2,700–$2,730: short-term area to watch for support.
So far, ETH is holding the upper range well. A clean breakout above $2,780 would be the next major confirmation.
96
#Bitcoin If this support breaks, we’re done with this setup.
#Bitcoin If this support breaks, we’re done with this setup.
1
204
$BTC Short-Term Outlook
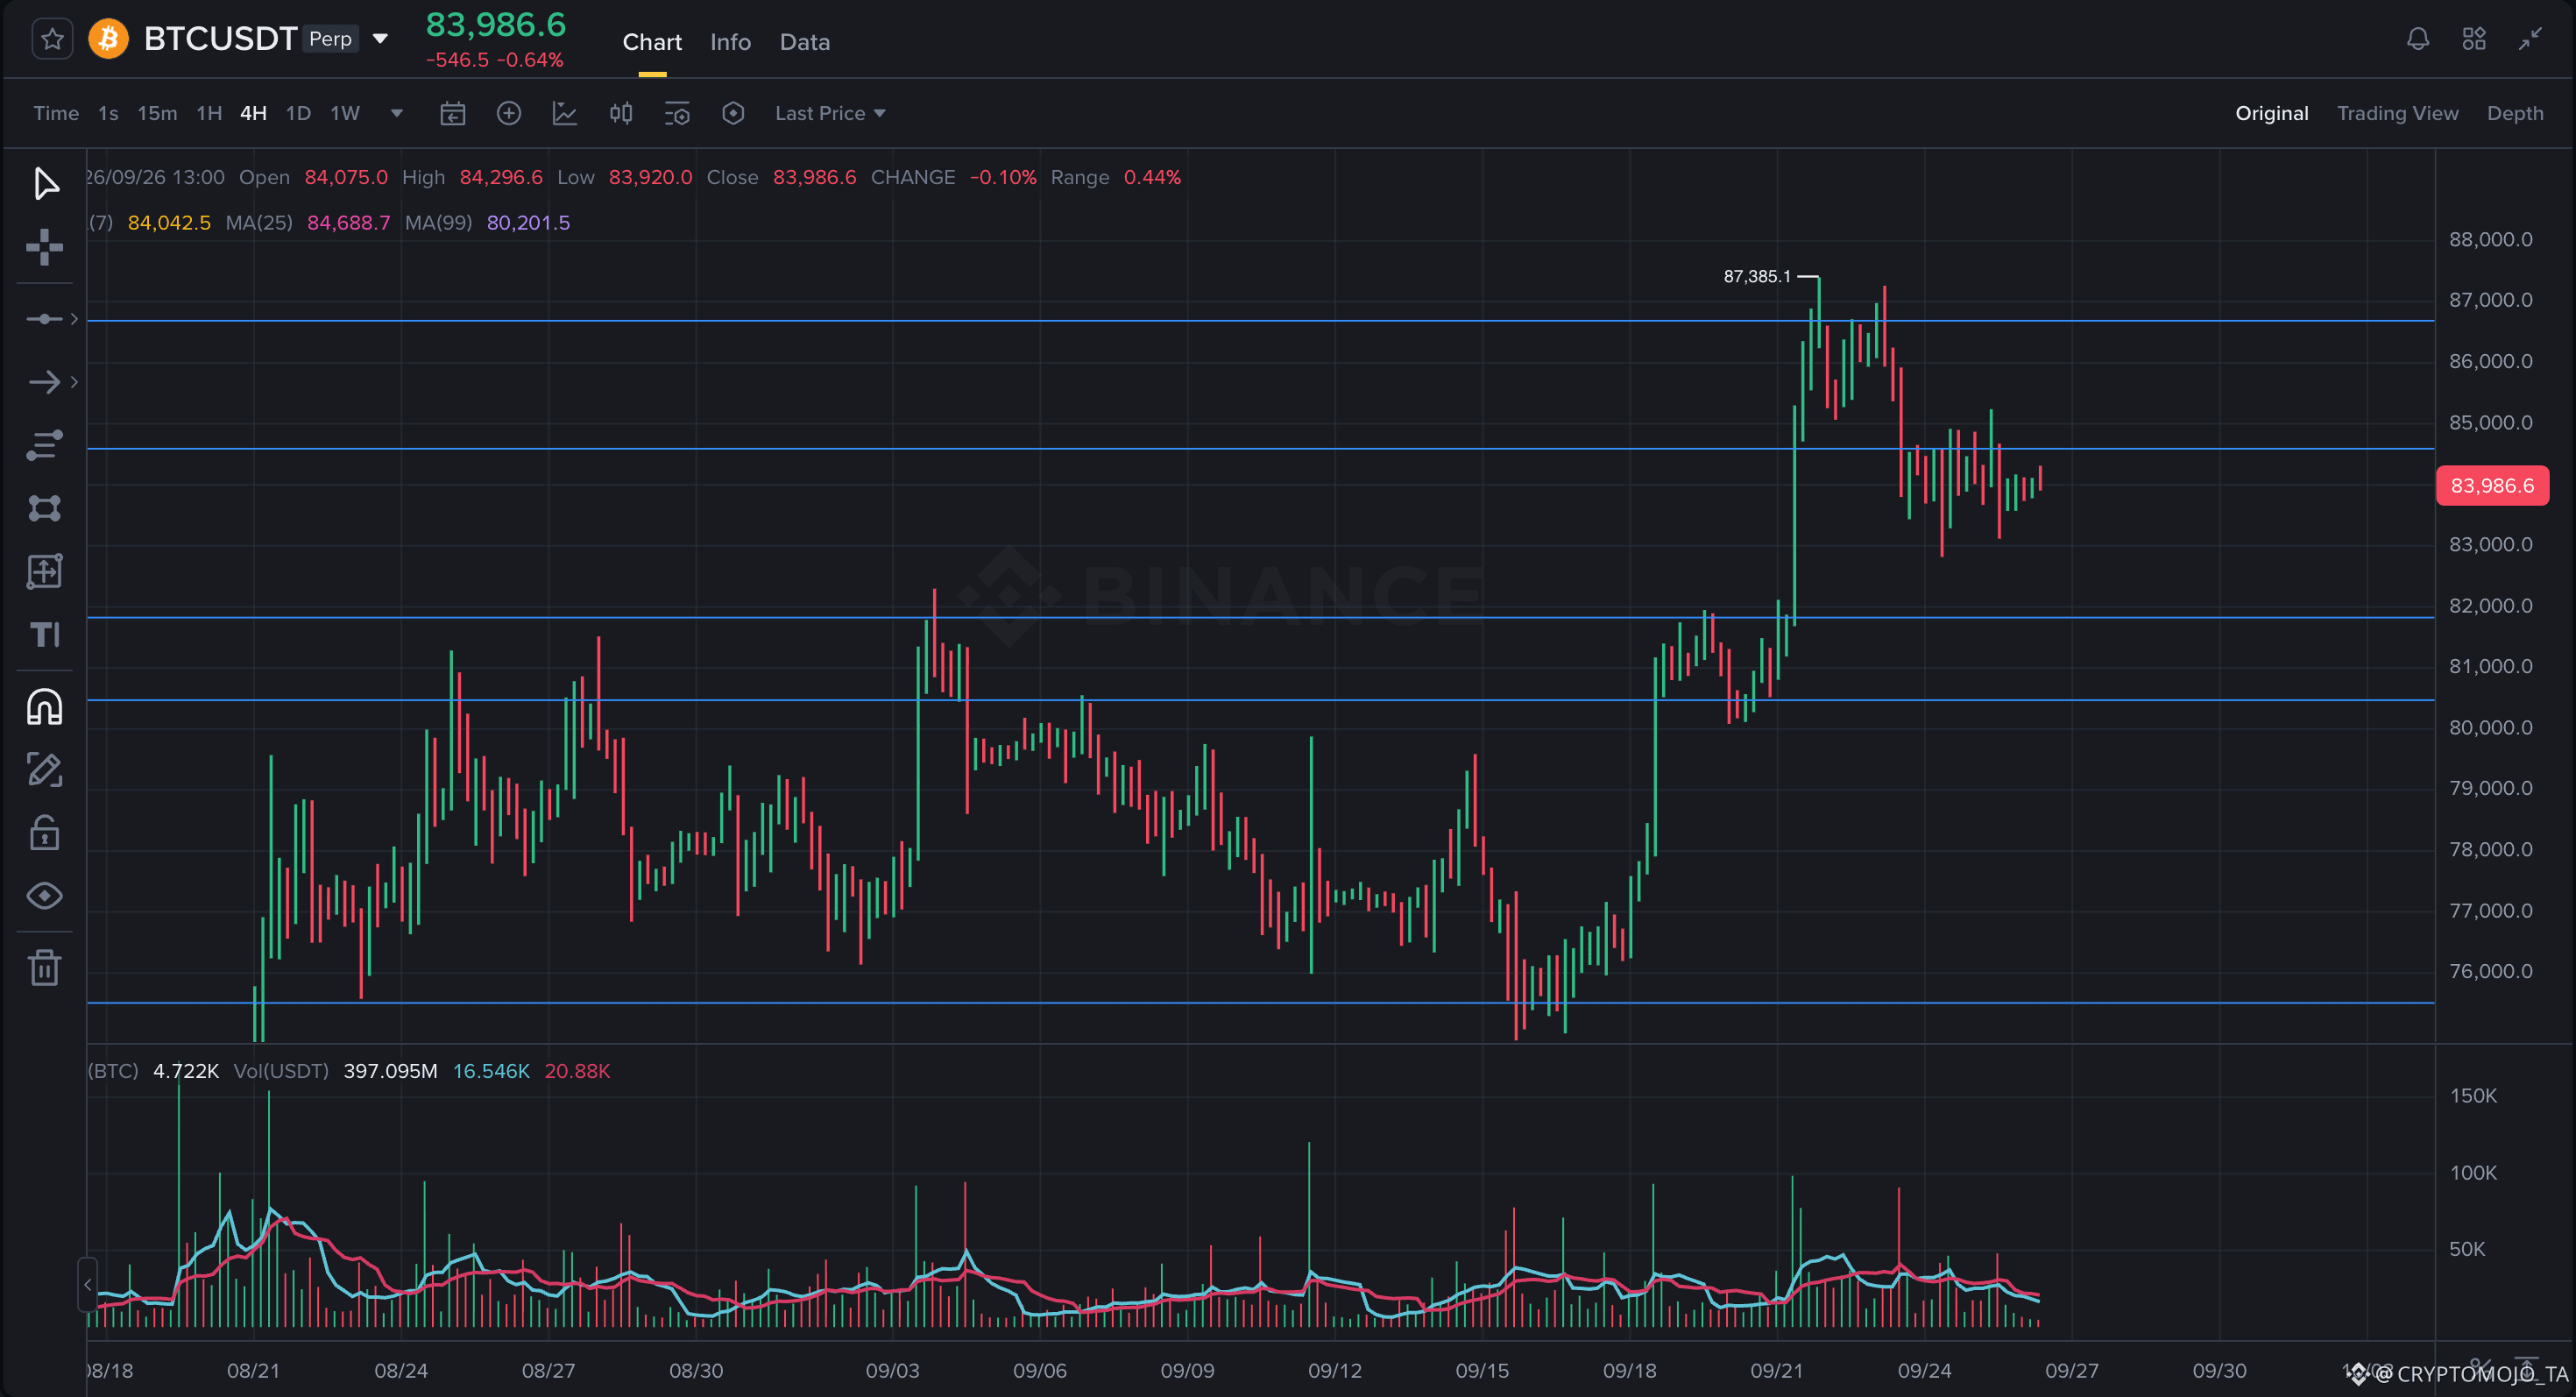
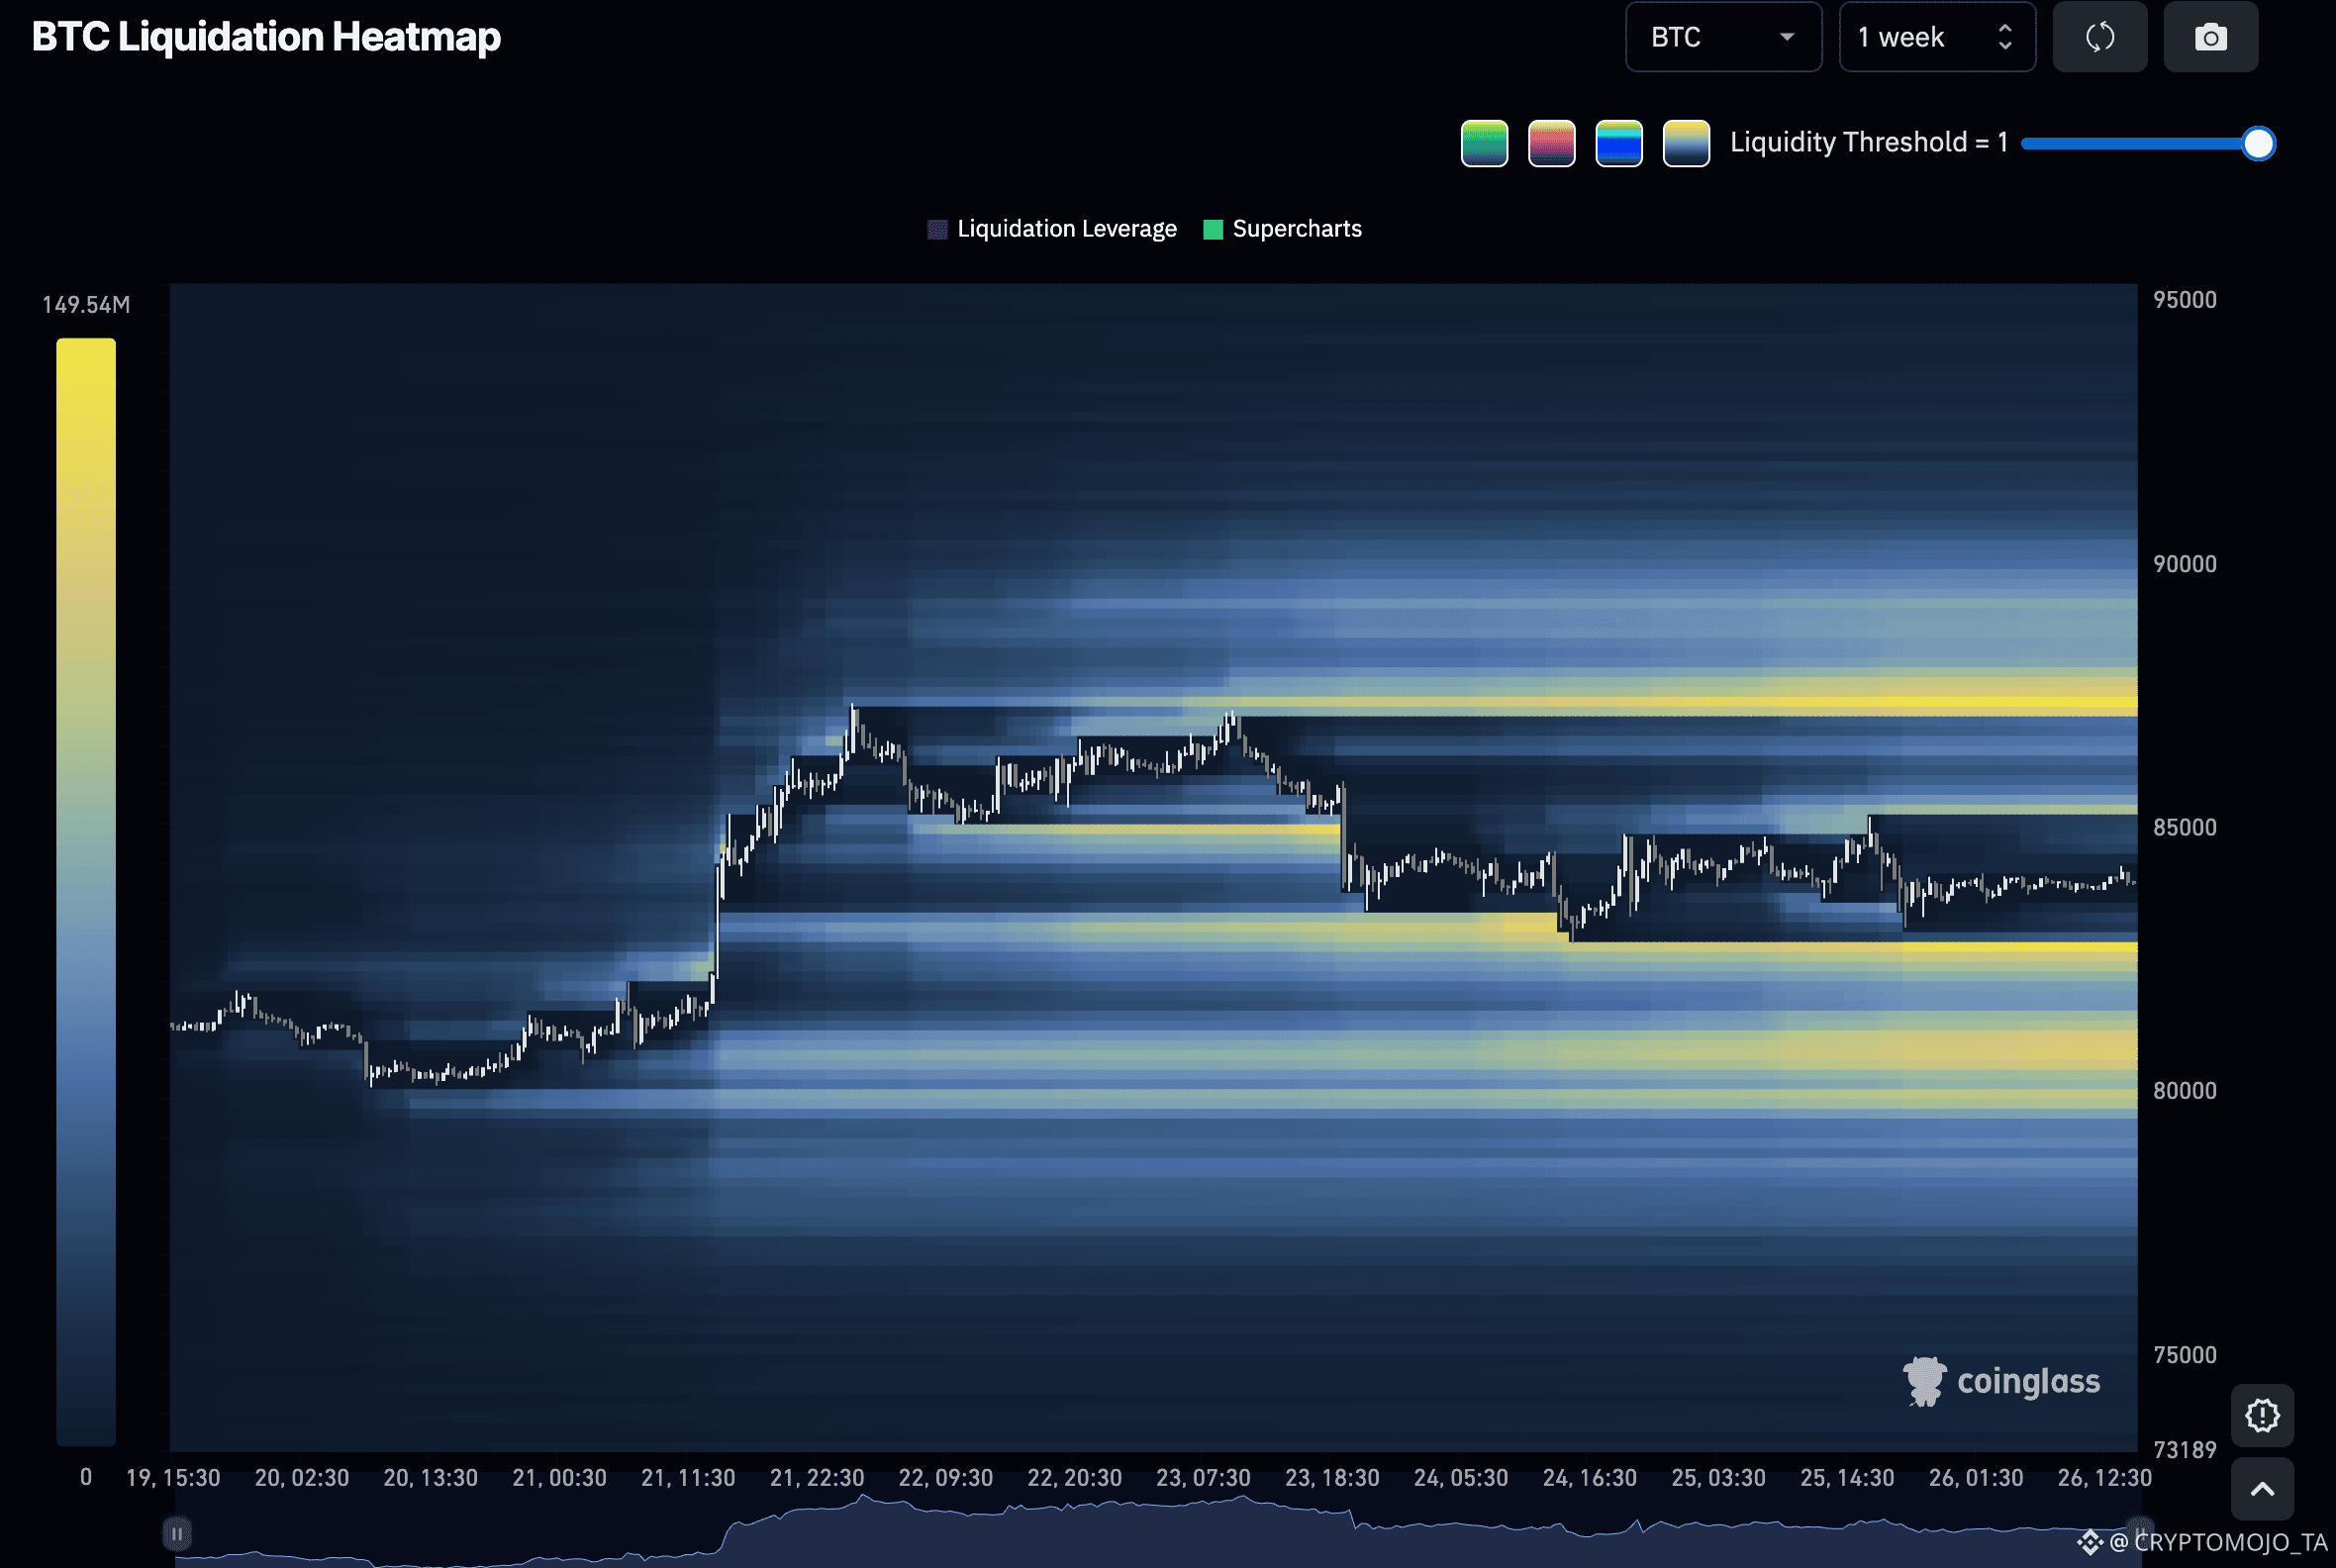
#BTC has been chopping sideways for the last few days after the recent bearish divergence.
This is actually a common outcome after bearish divergence, not necessarily an immediate crash, but sideways/choppy price action or a mild pullback.
I expect this type of price action to continue over the coming days, possibly into next week.
Key levels I’m watching:
$82.7K–$82.8K → key liquidity target
$80.8K–$81K → secondary liquidity
$80K → important support
If we see a pullback, I’d be watching the $80K–$82K region for a potential reaction before BTC tries to resume the larger bullish trend.
These are the levels I’m watching closely.
$BTC Short-Term Outlook
#BTC has been chopping sideways for the last few days after the recent bearish divergence.
This is actually a common outcome after bearish divergence, not necessarily an immediate crash, but sideways/choppy price action or a mild pullback.
I expect this type of price action to continue over the coming days, possibly into next week.
Key levels I’m watching:
$82.7K–$82.8K → key liquidity target
$80.8K–$81K → secondary liquidity
$80K → important support
If we see a pullback, I’d be watching the $80K–$82K region for a potential reaction before BTC tries to resume the larger bullish trend.
These are the levels I’m watching closely.
#BTC has been chopping sideways for the last few days after the recent bearish divergence.
This is actually a common outcome after bearish divergence, not necessarily an immediate crash, but sideways/choppy price action or a mild pullback.
I expect this type of price action to continue over the coming days, possibly into next week.
Key levels I’m watching:
$82.7K–$82.8K → key liquidity target
$80.8K–$81K → secondary liquidity
$80K → important support
If we see a pullback, I’d be watching the $80K–$82K region for a potential reaction before BTC tries to resume the larger bullish trend.
These are the levels I’m watching closely.
141
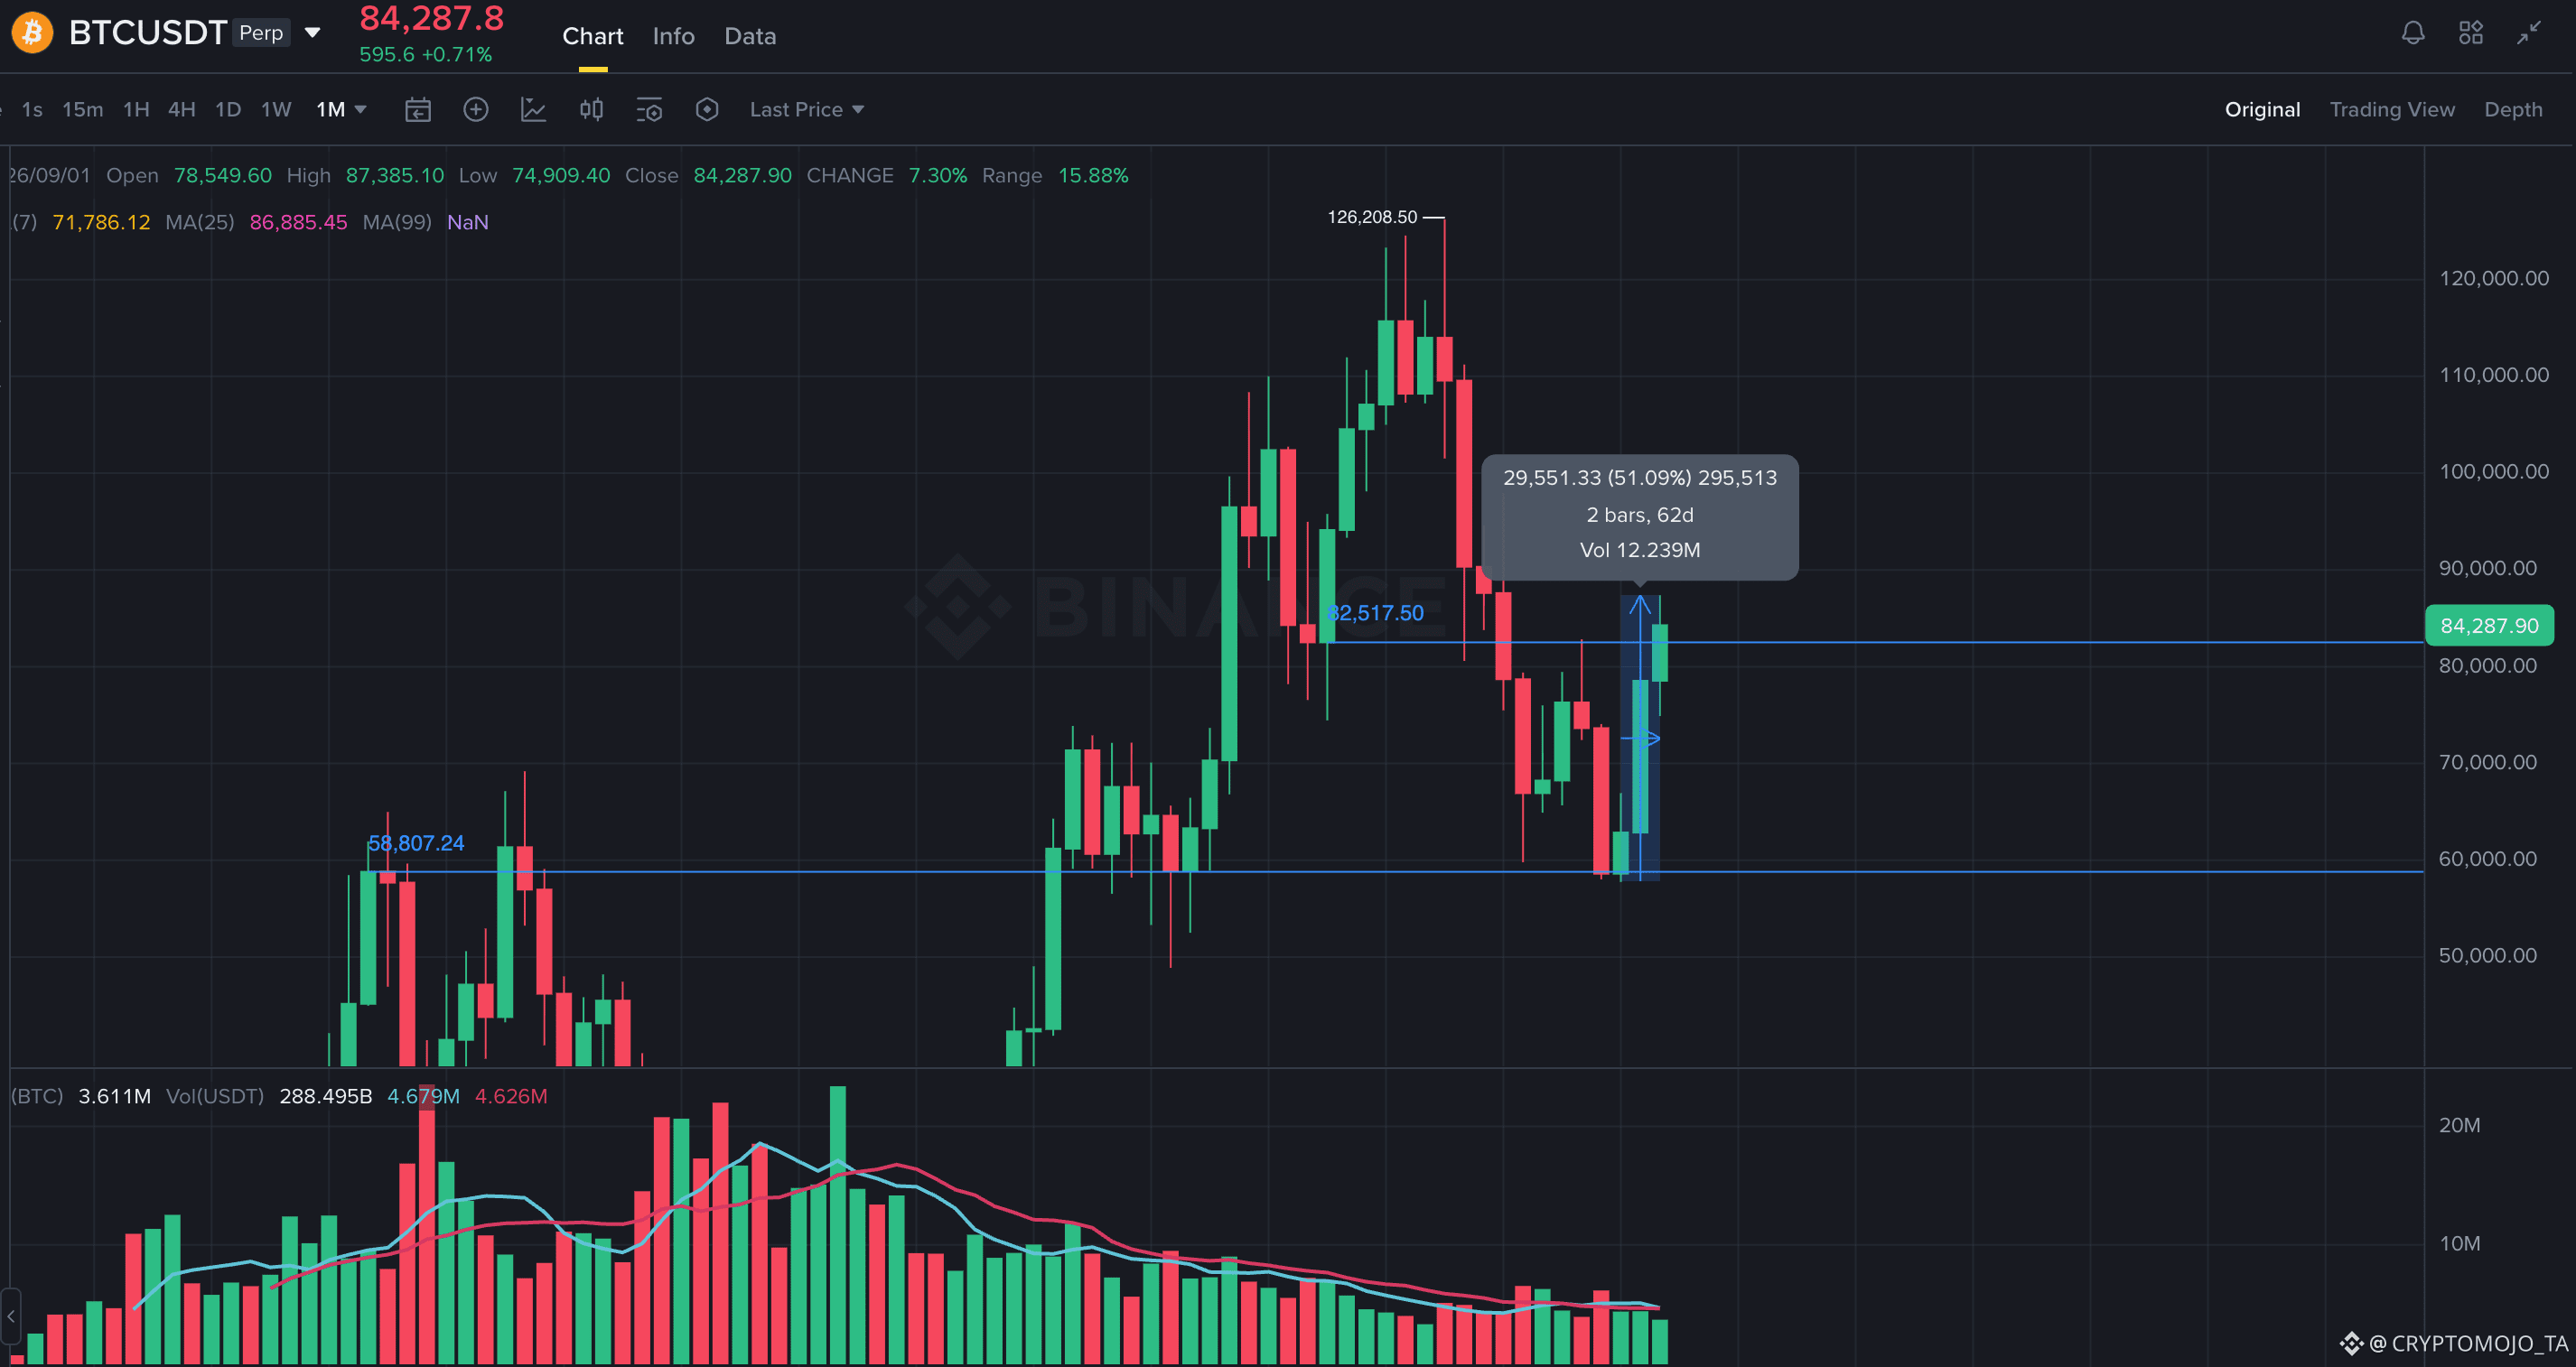
#BTC monthly chart is getting very interesting.
From the $58.8K low, BTC has already bounced nearly 43% and has now broken above the $82.5K horizontal resistance.
But there are only ~5 days left before the monthly candle closes.
The big question is: Can BTC hold above this breakout into the monthly close?
This monthly candle could be very important for the bigger-picture structure. Let’s see how it closes. 🔥
#bitcoin $BTC
#BTC monthly chart is getting very interesting.
From the $58.8K low, BTC has already bounced nearly 43% and has now broken above the $82.5K horizontal resistance.
But there are only ~5 days left before the monthly candle closes.
The big question is: Can BTC hold above this breakout into the monthly close?
This monthly candle could be very important for the bigger-picture structure. Let’s see how it closes. 🔥
#bitcoin $BTC
From the $58.8K low, BTC has already bounced nearly 43% and has now broken above the $82.5K horizontal resistance.
But there are only ~5 days left before the monthly candle closes.
The big question is: Can BTC hold above this breakout into the monthly close?
This monthly candle could be very important for the bigger-picture structure. Let’s see how it closes. 🔥
#bitcoin $BTC
1
1
160
·
--
Bearish
$BTC Update!!
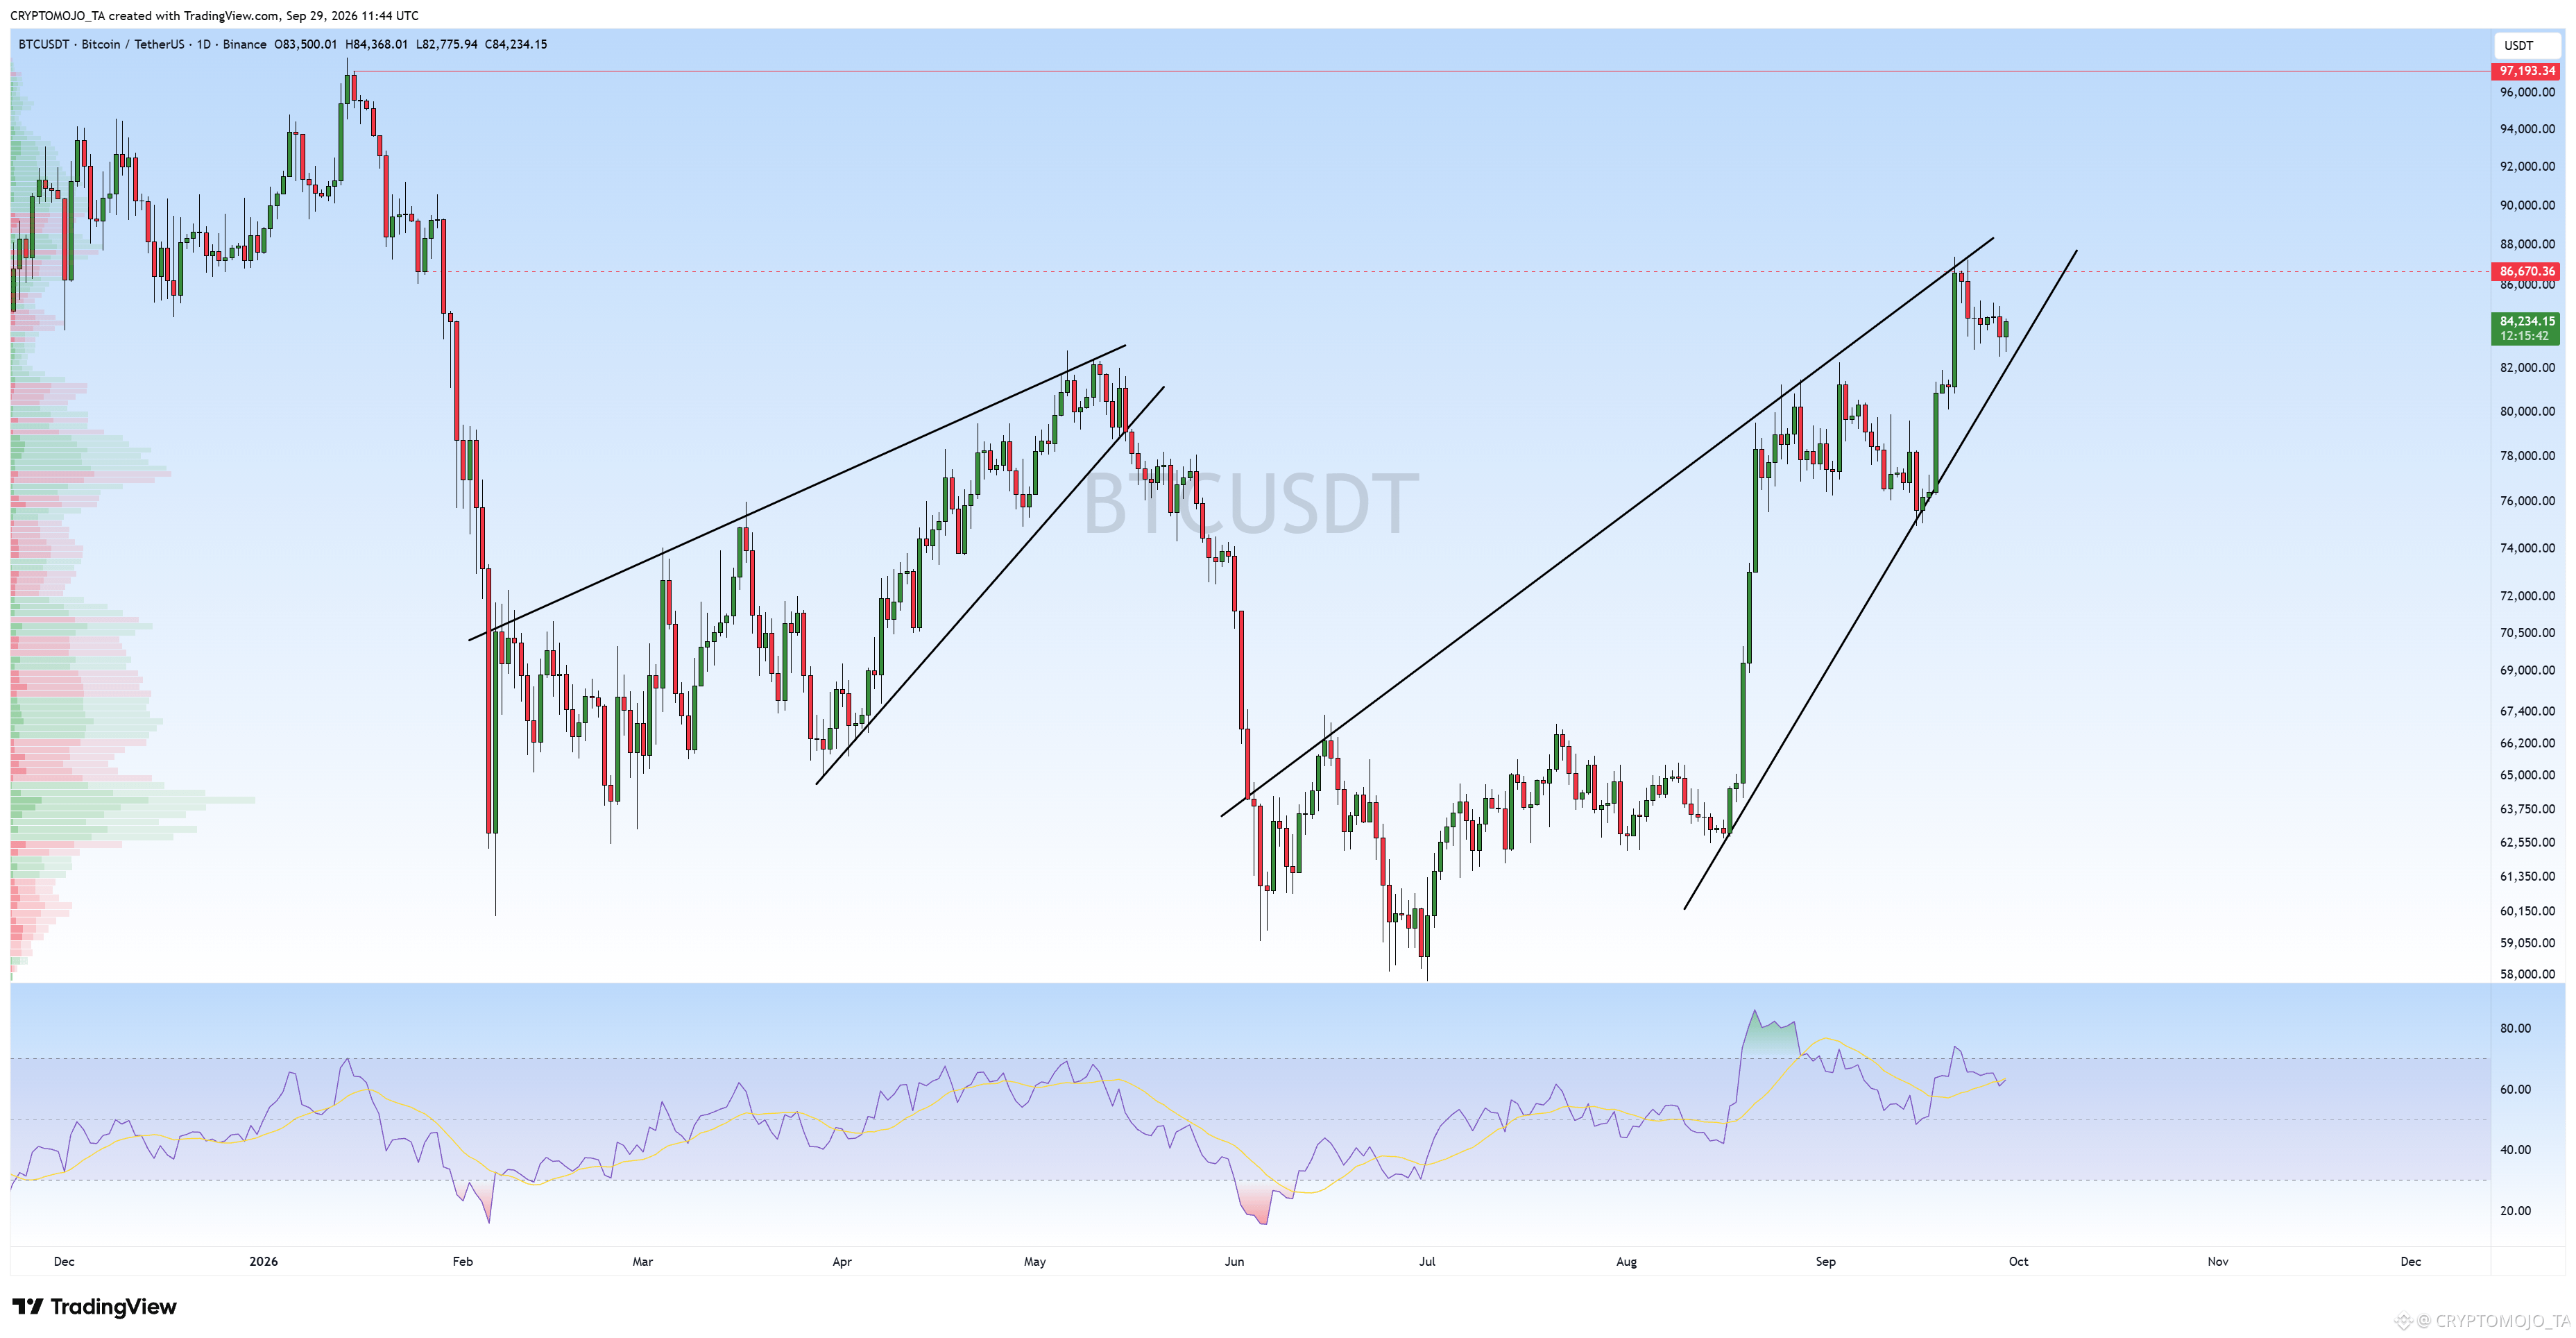
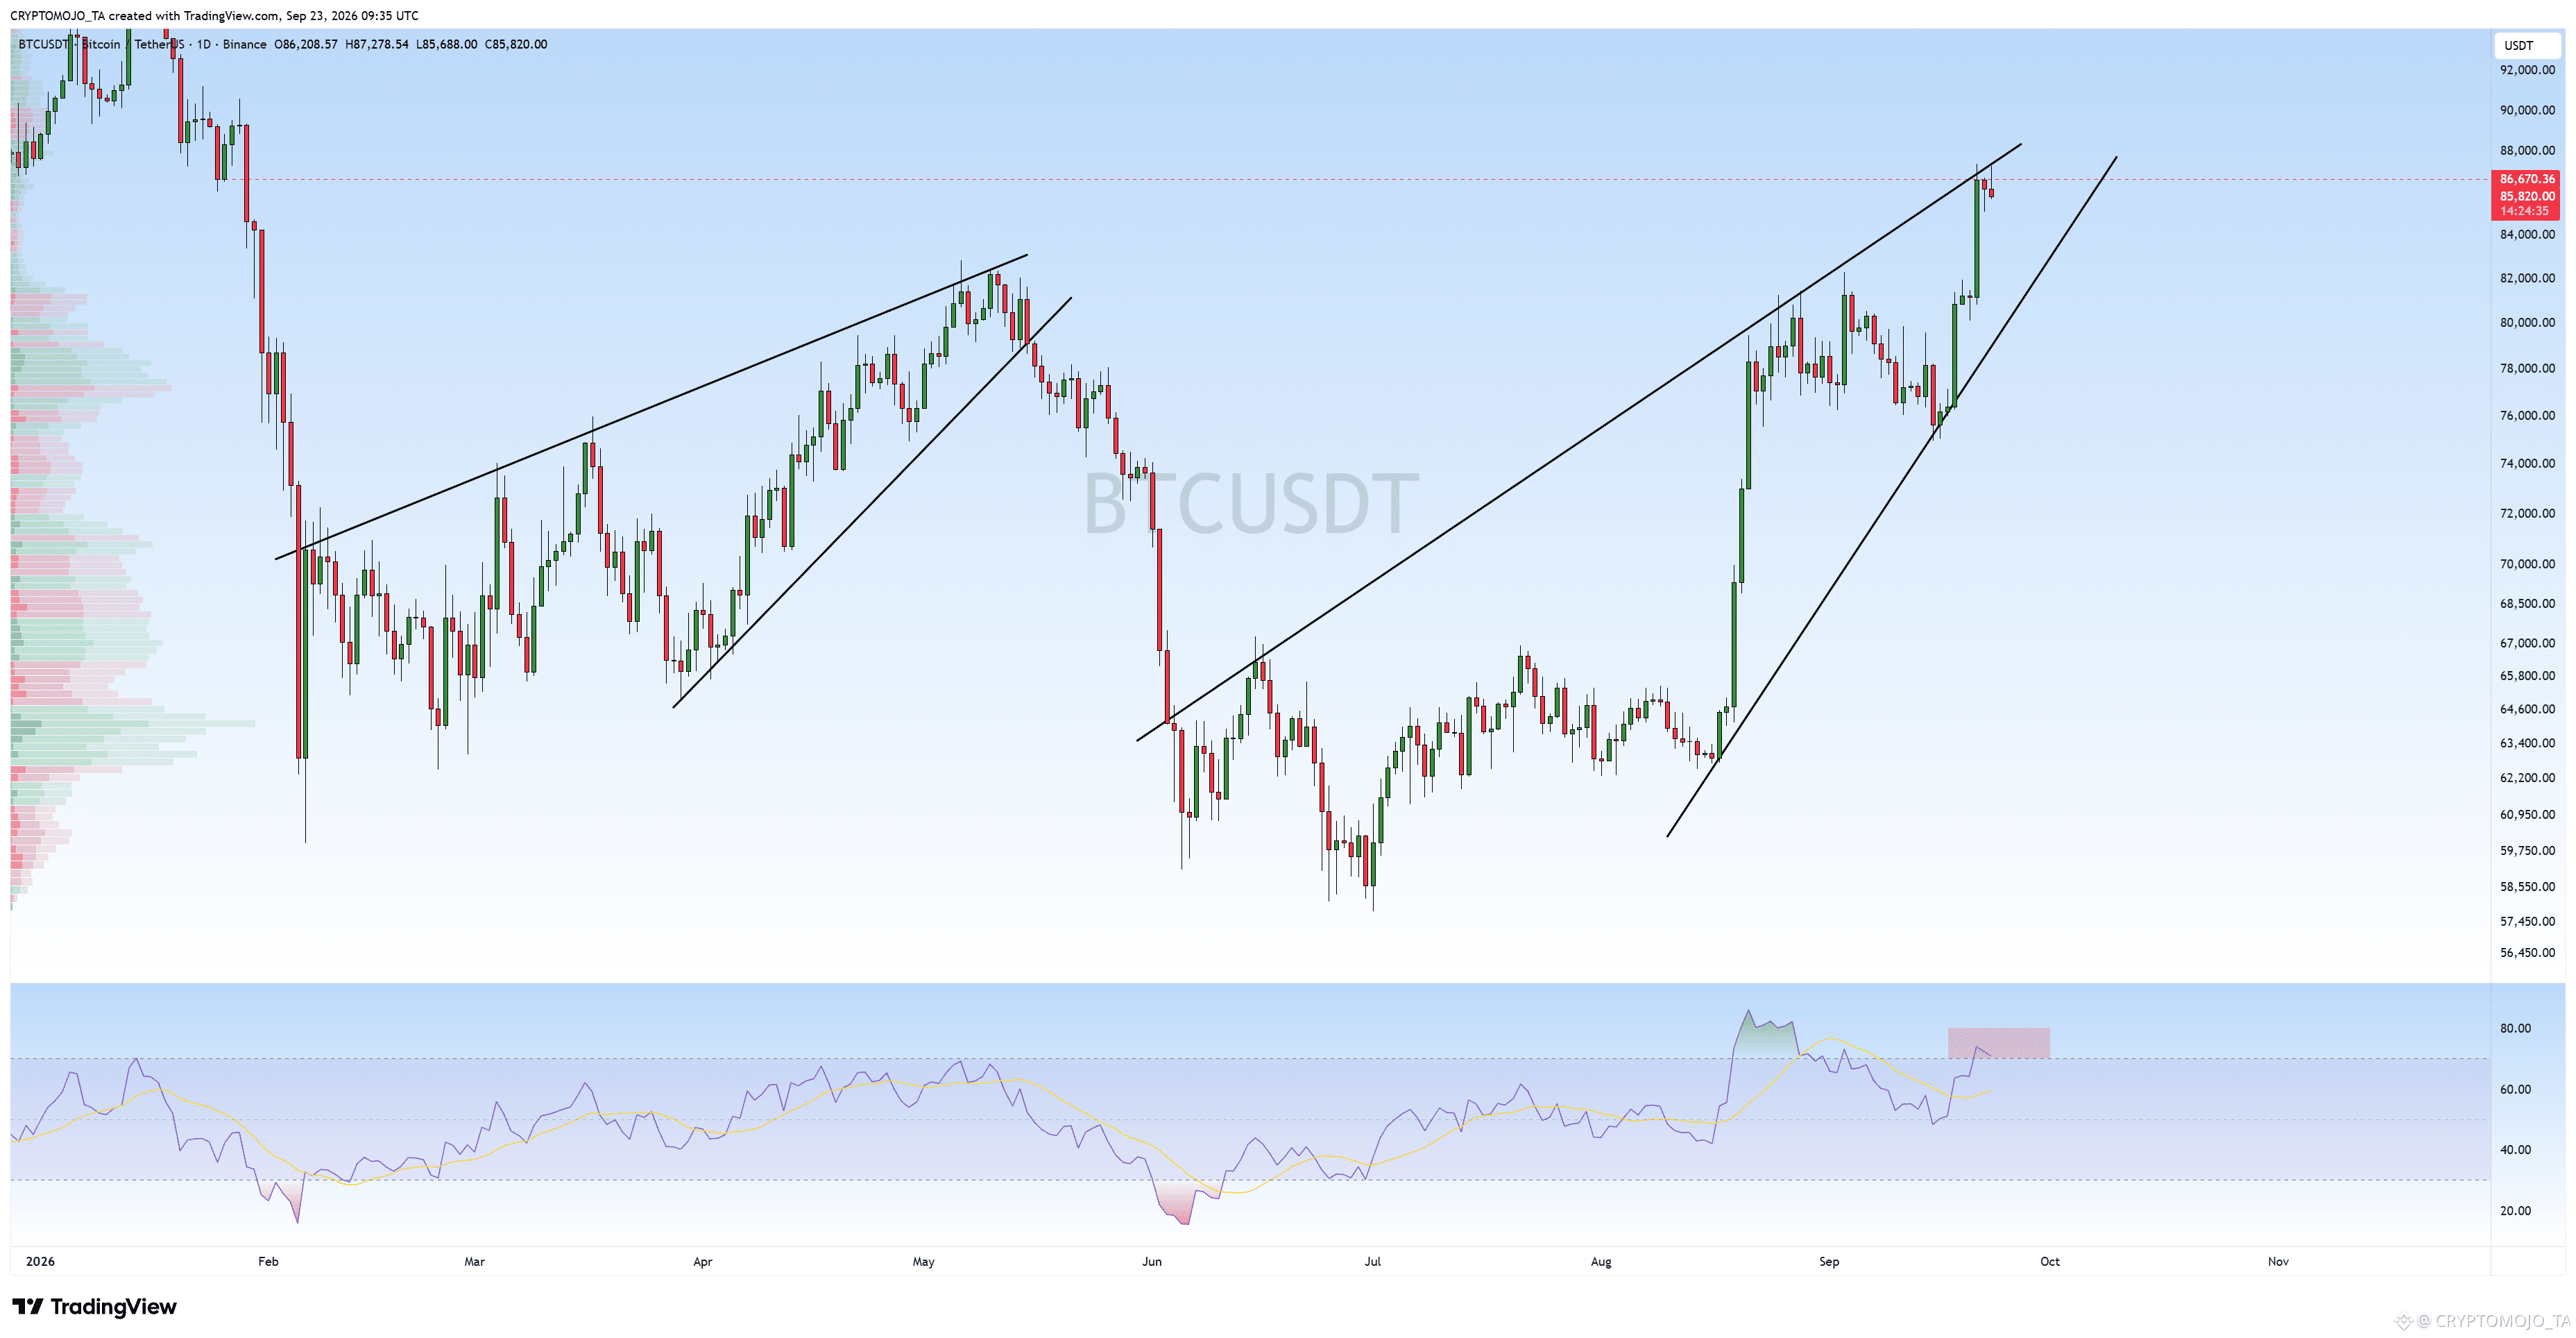
BTC is testing a major resistance zone around $86.5K–$87K on the daily timeframe.
Price has been moving inside a rising structure since the June low, and we can see a similar ascending pattern from the previous move earlier this year. BTC is now approaching the upper trendline of the current structure.
The interesting part is the daily RSI, which has moved back above 70 and is showing signs of becoming stretched. We’re also seeing a small rejection from the $86.7K area.
If BTC breaks and closes cleanly above $87K, the next area to watch would be around $88K+.
But if this resistance holds, a pullback toward the lower trendline could come into play before another attempt higher.
$86.5K–$87K is the key zone right now. I’m watching the reaction here closely.
#bitcoin
$BTC Update!!
BTC is testing a major resistance zone around $86.5K–$87K on the daily timeframe.
Price has been moving inside a rising structure since the June low, and we can see a similar ascending pattern from the previous move earlier this year. BTC is now approaching the upper trendline of the current structure.
The interesting part is the daily RSI, which has moved back above 70 and is showing signs of becoming stretched. We’re also seeing a small rejection from the $86.7K area.
If BTC breaks and closes cleanly above $87K, the next area to watch would be around $88K+.
But if this resistance holds, a pullback toward the lower trendline could come into play before another attempt higher.
$86.5K–$87K is the key zone right now. I’m watching the reaction here closely.
#bitcoin
BTC is testing a major resistance zone around $86.5K–$87K on the daily timeframe.
Price has been moving inside a rising structure since the June low, and we can see a similar ascending pattern from the previous move earlier this year. BTC is now approaching the upper trendline of the current structure.
The interesting part is the daily RSI, which has moved back above 70 and is showing signs of becoming stretched. We’re also seeing a small rejection from the $86.7K area.
If BTC breaks and closes cleanly above $87K, the next area to watch would be around $88K+.
But if this resistance holds, a pullback toward the lower trendline could come into play before another attempt higher.
$86.5K–$87K is the key zone right now. I’m watching the reaction here closely.
#bitcoin
1
87
·
--
Bearish
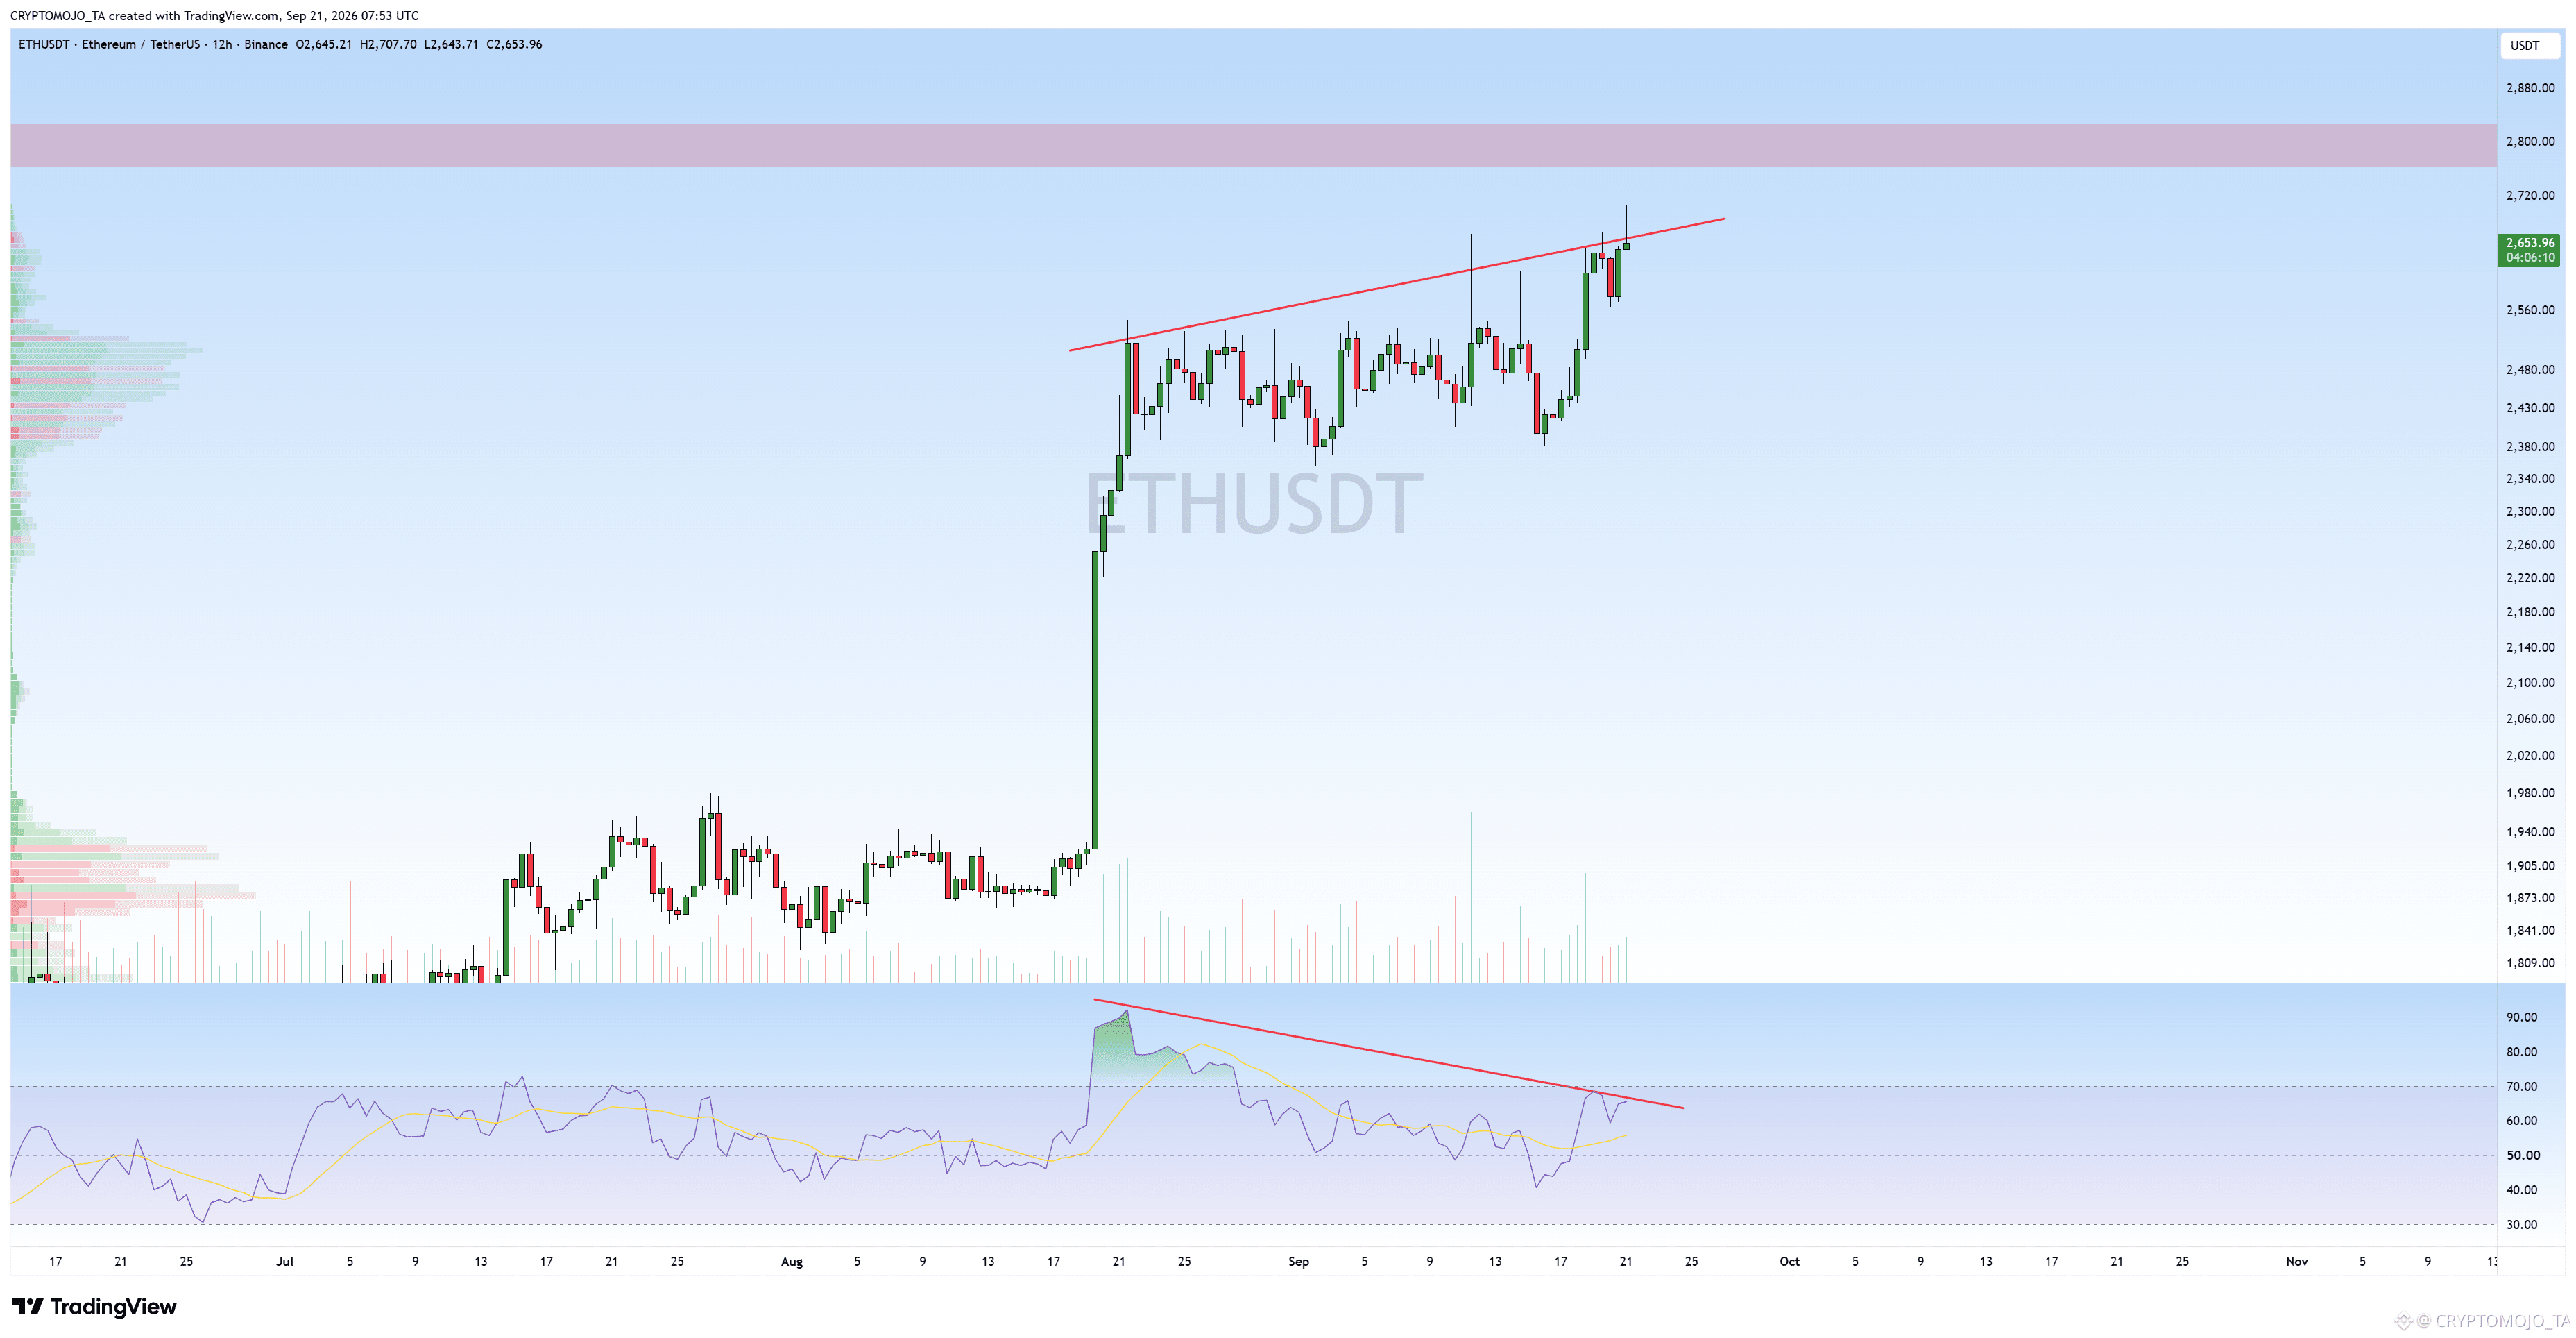
$ETH Update
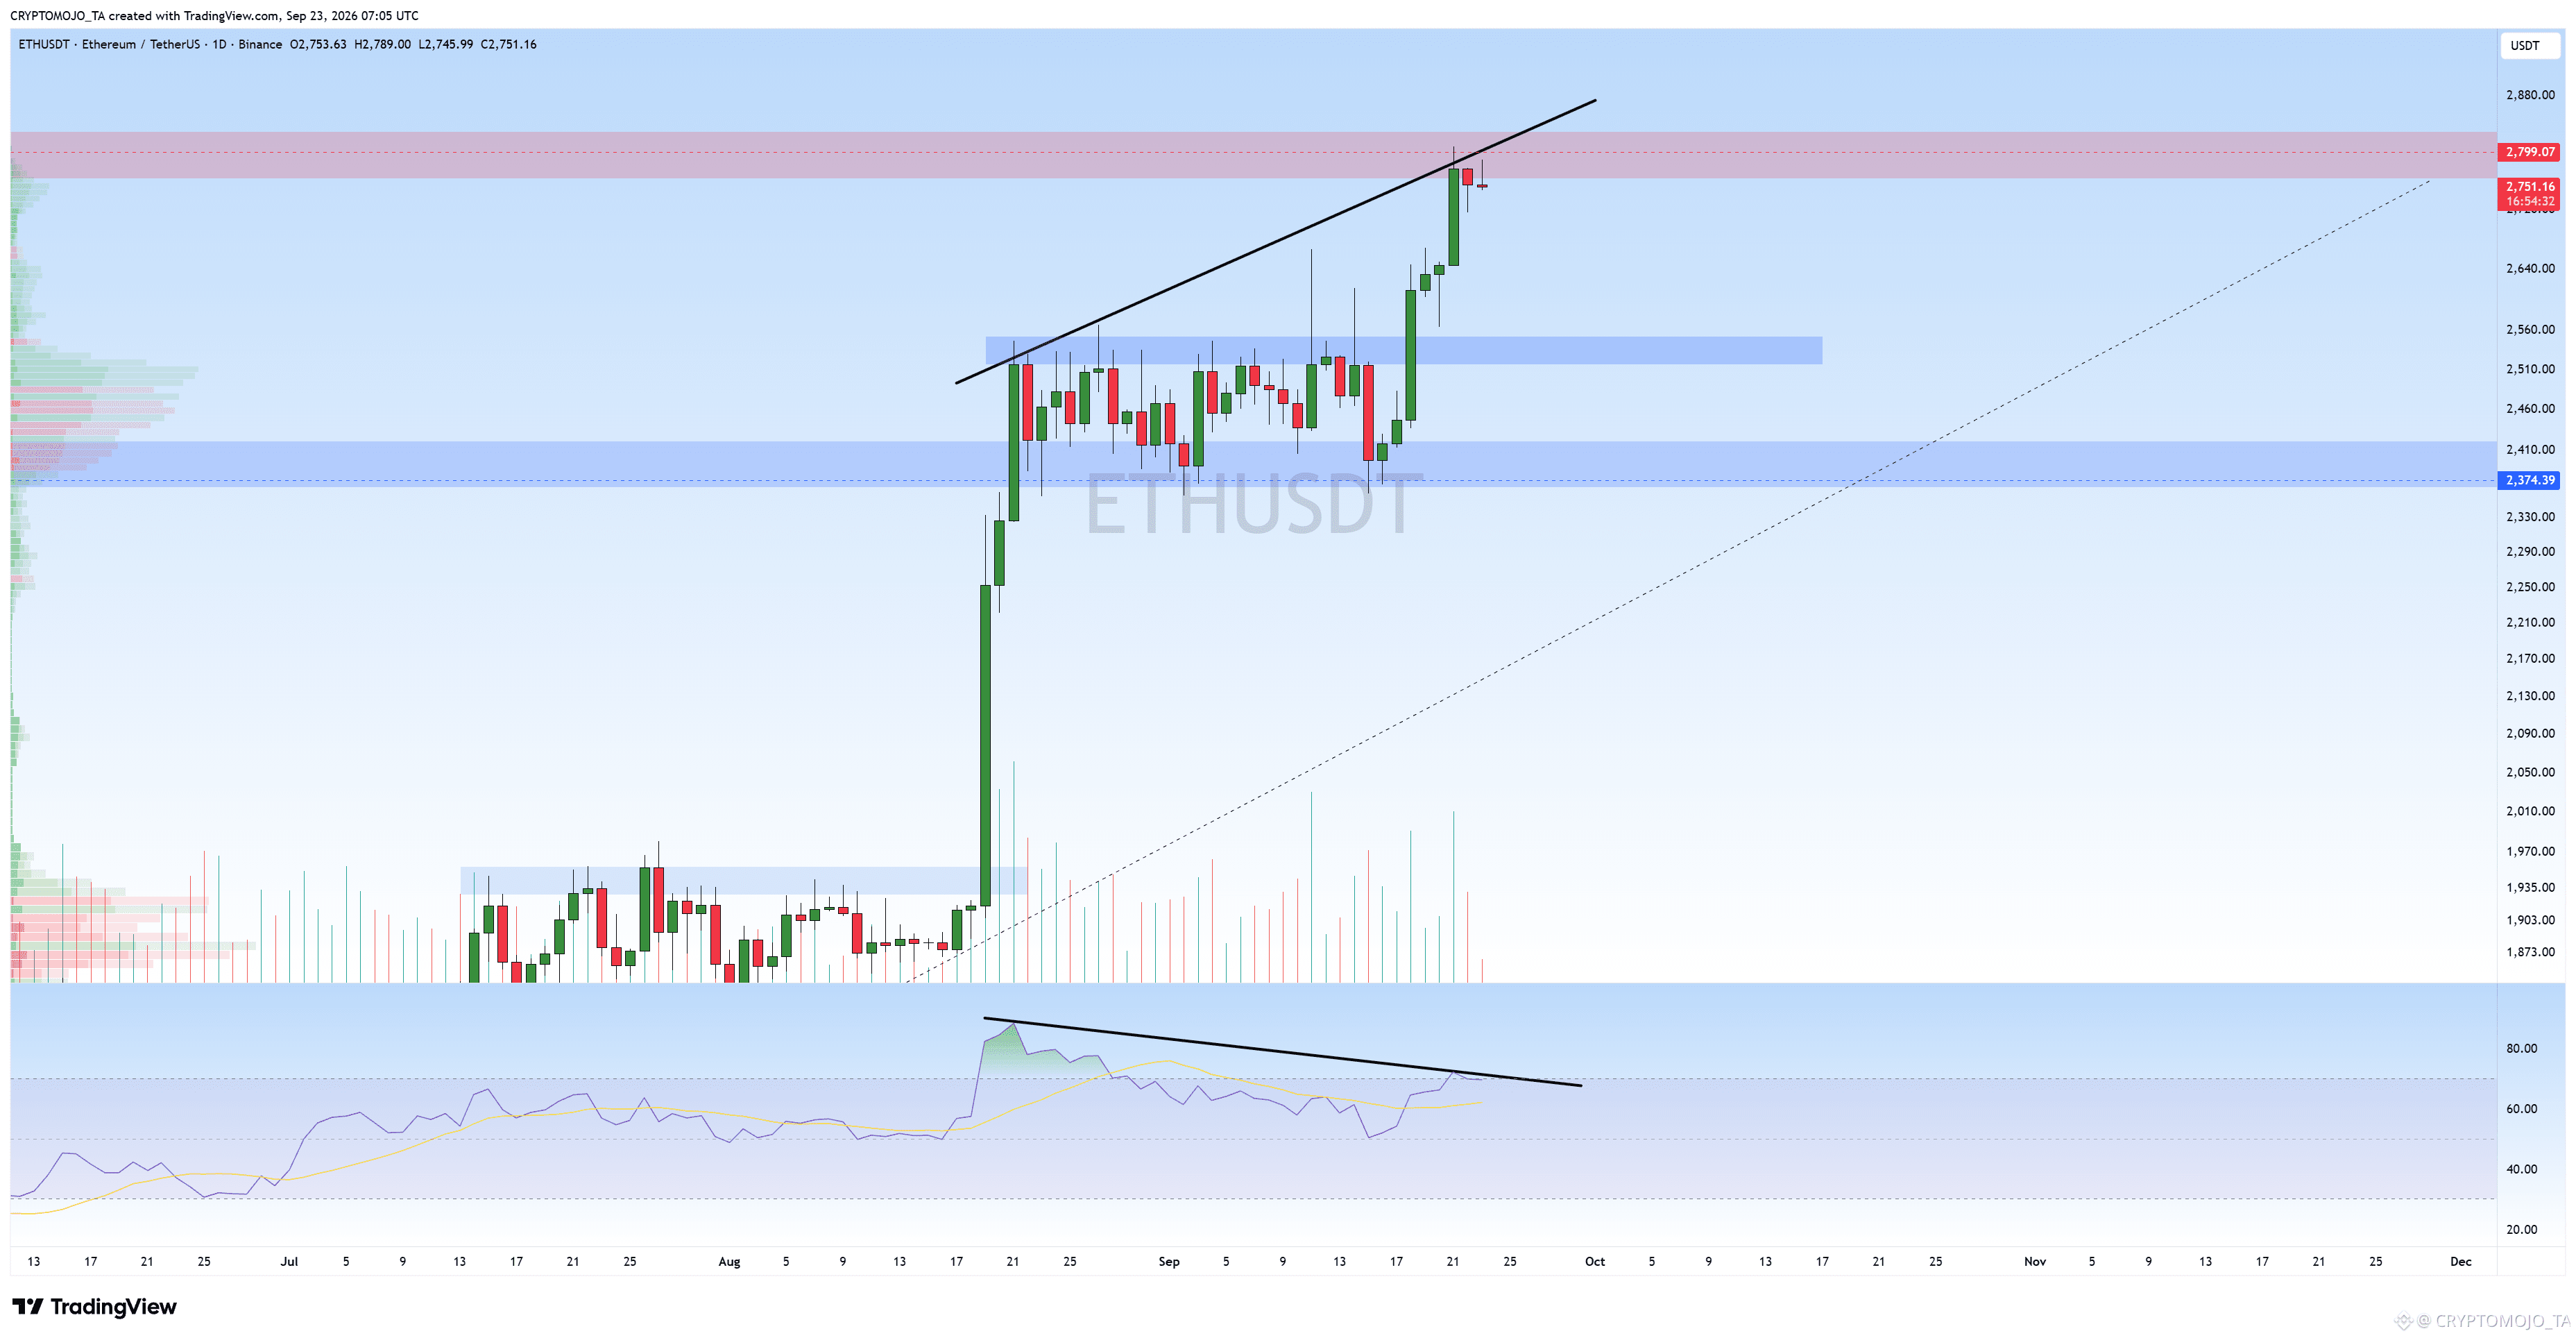
#ETH is approaching the $2,780–$2,820 resistance zone, which has been an important area on the chart.
What makes this move interesting is the bearish divergence forming on the daily RSI. We saw a similar divergence during the previous move, and after that setup appeared, ETH experienced a noticeable correction.
Now we’re seeing a similar pattern again as price pushes back toward the major resistance.
Another thing to watch is volume.
ETH has been moving higher, but the volume behind this recent recovery hasn’t increased significantly. That makes the move less convincing compared with a breakout supported by strong buying volume.
If ETH gets rejected from $2,780–$2,820, a pullback toward $2,500 and potentially $2,374 could come into play.
On the other hand, if ETH breaks above $2,820 with strong volume, it would weaken the bearish divergence setup and could open the way toward $3,350.
For now, the reaction around $2,780–$2,820 is the key thing I’m watching.
$ETH Update
#ETH is approaching the $2,780–$2,820 resistance zone, which has been an important area on the chart.
What makes this move interesting is the bearish divergence forming on the daily RSI. We saw a similar divergence during the previous move, and after that setup appeared, ETH experienced a noticeable correction.
Now we’re seeing a similar pattern again as price pushes back toward the major resistance.
Another thing to watch is volume.
ETH has been moving higher, but the volume behind this recent recovery hasn’t increased significantly. That makes the move less convincing compared with a breakout supported by strong buying volume.
If ETH gets rejected from $2,780–$2,820, a pullback toward $2,500 and potentially $2,374 could come into play.
On the other hand, if ETH breaks above $2,820 with strong volume, it would weaken the bearish divergence setup and could open the way toward $3,350.
For now, the reaction around $2,780–$2,820 is the key thing I’m watching.
#ETH is approaching the $2,780–$2,820 resistance zone, which has been an important area on the chart.
What makes this move interesting is the bearish divergence forming on the daily RSI. We saw a similar divergence during the previous move, and after that setup appeared, ETH experienced a noticeable correction.
Now we’re seeing a similar pattern again as price pushes back toward the major resistance.
Another thing to watch is volume.
ETH has been moving higher, but the volume behind this recent recovery hasn’t increased significantly. That makes the move less convincing compared with a breakout supported by strong buying volume.
If ETH gets rejected from $2,780–$2,820, a pullback toward $2,500 and potentially $2,374 could come into play.
On the other hand, if ETH breaks above $2,820 with strong volume, it would weaken the bearish divergence setup and could open the way toward $3,350.
For now, the reaction around $2,780–$2,820 is the key thing I’m watching.
1
113
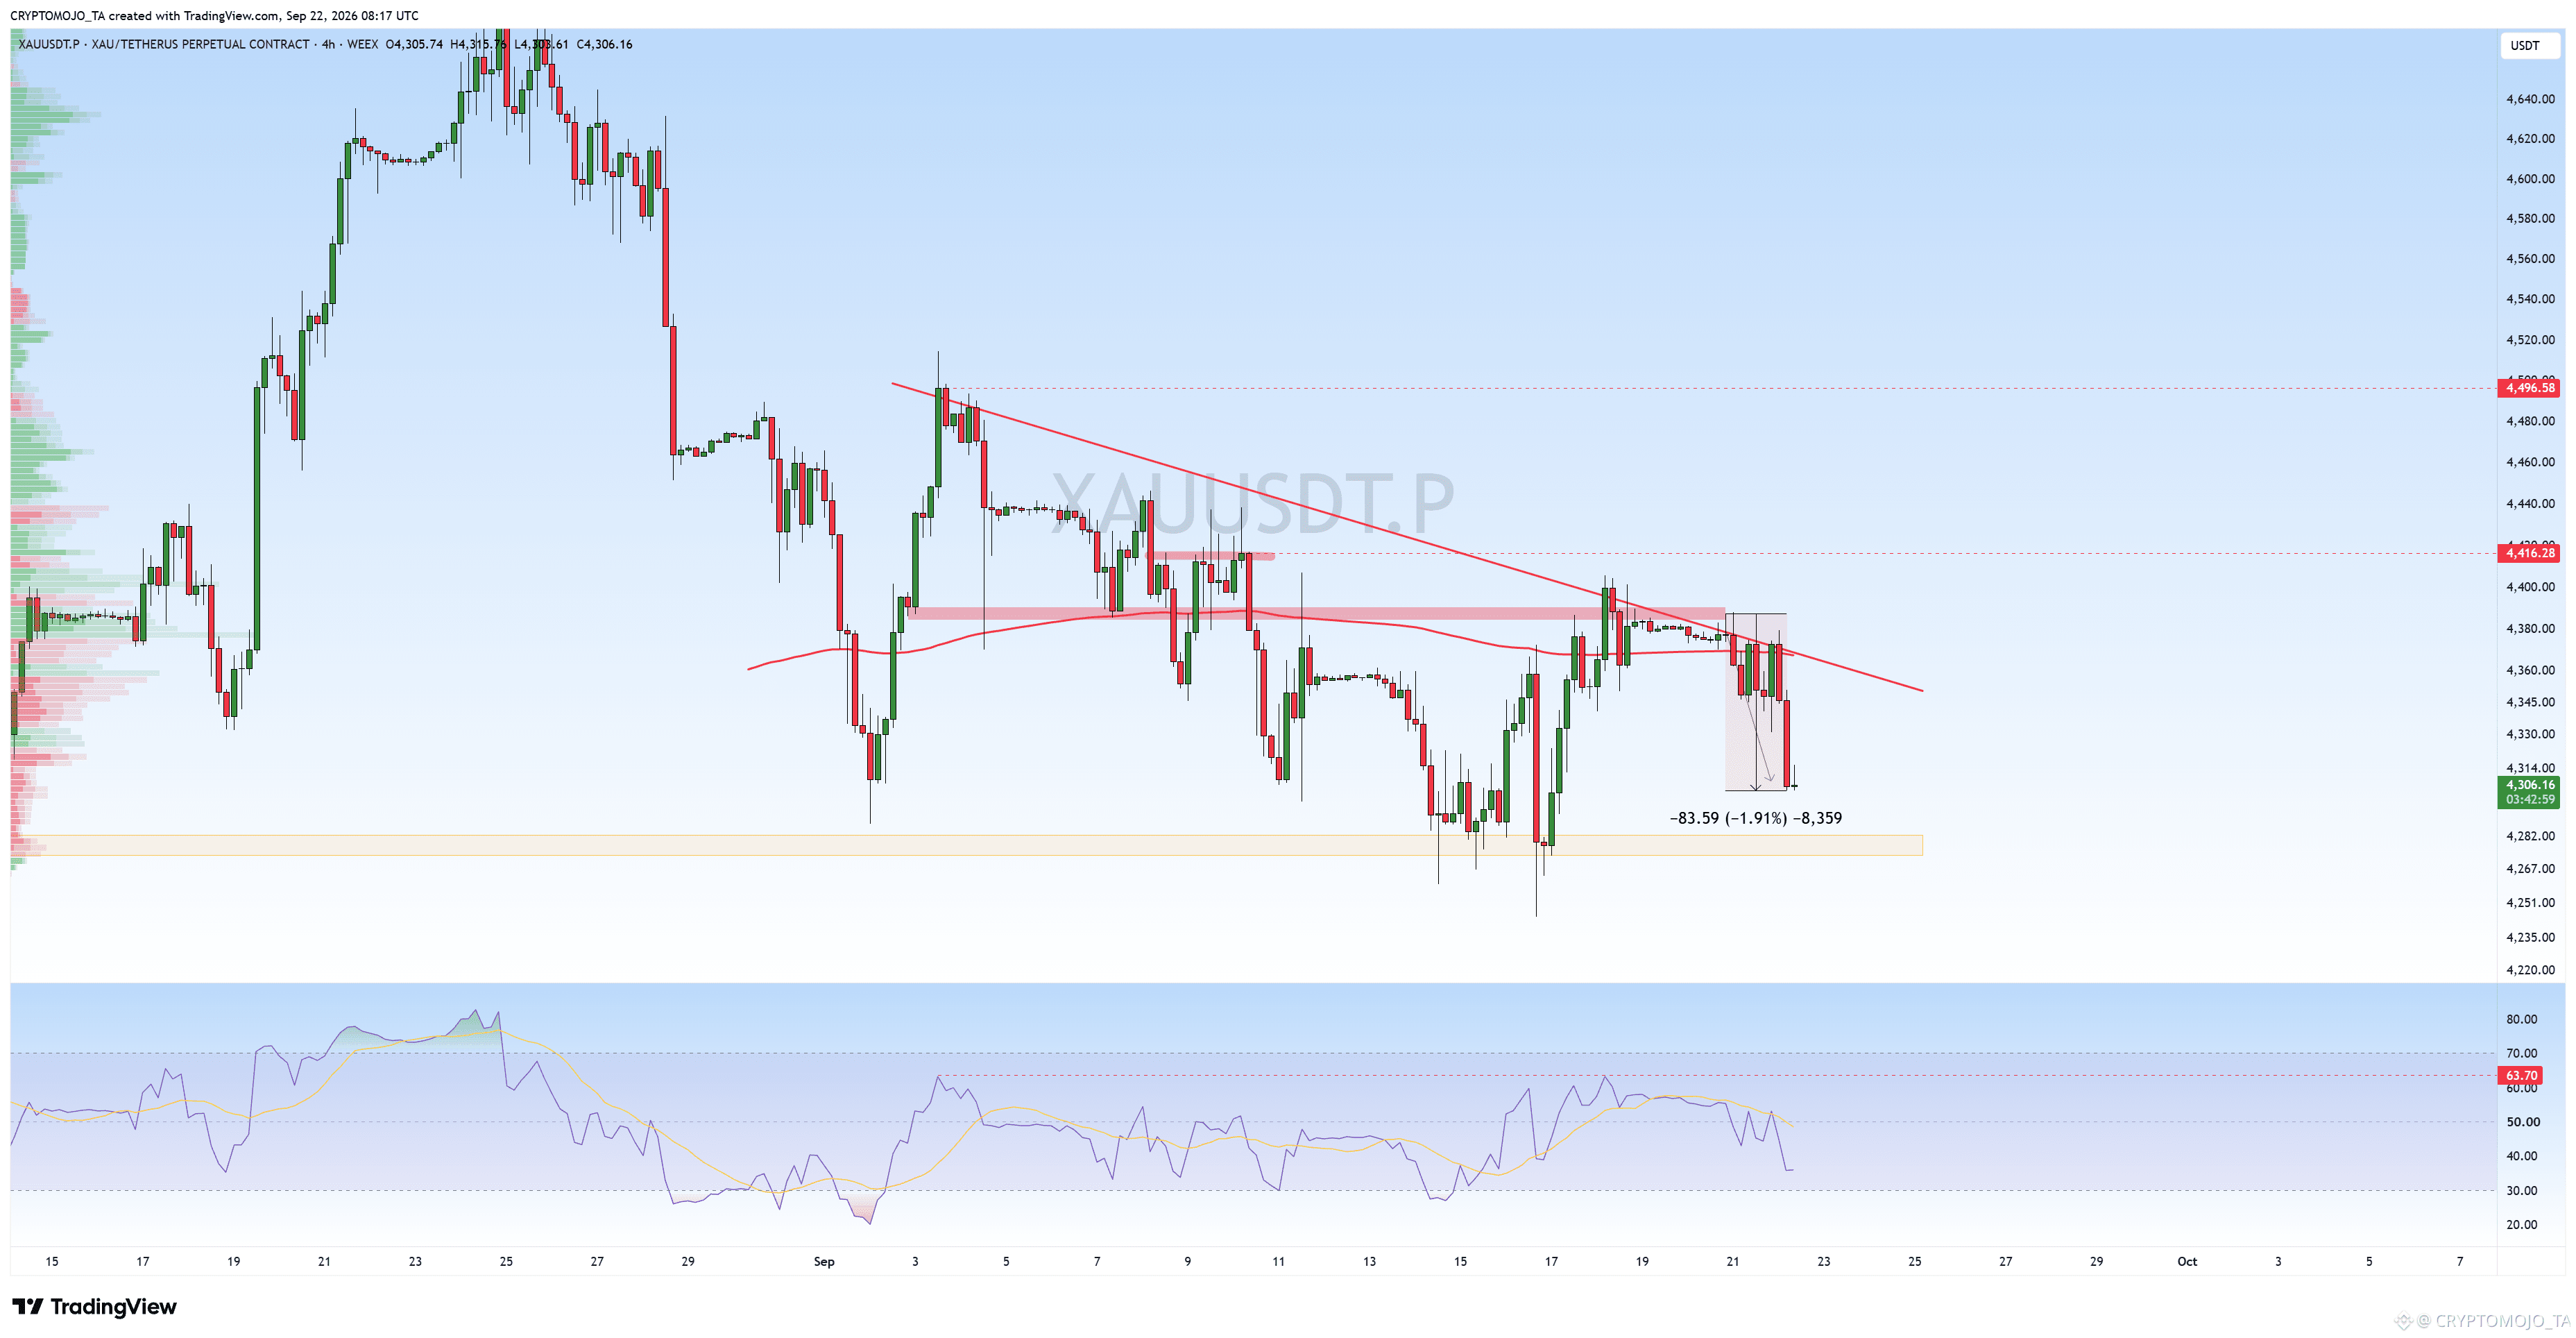
#XAUUSDT
Gold is playing out yesterday’s scenario perfectly. Price rejected the key resistance zone and has now reached one of the identified downside targets.
Result: -1.9%
#XAUUSDT
Gold is playing out yesterday’s scenario perfectly. Price rejected the key resistance zone and has now reached one of the identified downside targets.
Result: -1.9%
Gold is playing out yesterday’s scenario perfectly. Price rejected the key resistance zone and has now reached one of the identified downside targets.
Result: -1.9%
CRYPTOMOJO_TA
·
--
Bearish$XAUT Update
#GOLD is compressing below a major descending trendline resistance.
Price is currently around $4,378, with the trendline coming in around $4,390–$4,400. We’ve already seen multiple rejections from this area, so this is an important level to watch.
The bigger resistance zone is around $4,400–$4,416, while the key downside level is $4,308.
RSI is around 63, showing that momentum has recovered, but it’s not yet in an extreme overbought zone.
If gold breaks and closes above $4,416, the bearish structure could start weakening.
But if price gets rejected from the trendline again, a move toward $4,308 looks possible, with the $4,270–$4,290 zone acting as the next major support.
#GOLD is compressing below a major descending trendline resistance.
Price is currently around $4,378, with the trendline coming in around $4,390–$4,400. We’ve already seen multiple rejections from this area, so this is an important level to watch.
The bigger resistance zone is around $4,400–$4,416, while the key downside level is $4,308.
RSI is around 63, showing that momentum has recovered, but it’s not yet in an extreme overbought zone.
If gold breaks and closes above $4,416, the bearish structure could start weakening.
But if price gets rejected from the trendline again, a move toward $4,308 looks possible, with the $4,270–$4,290 zone acting as the next major support.
269
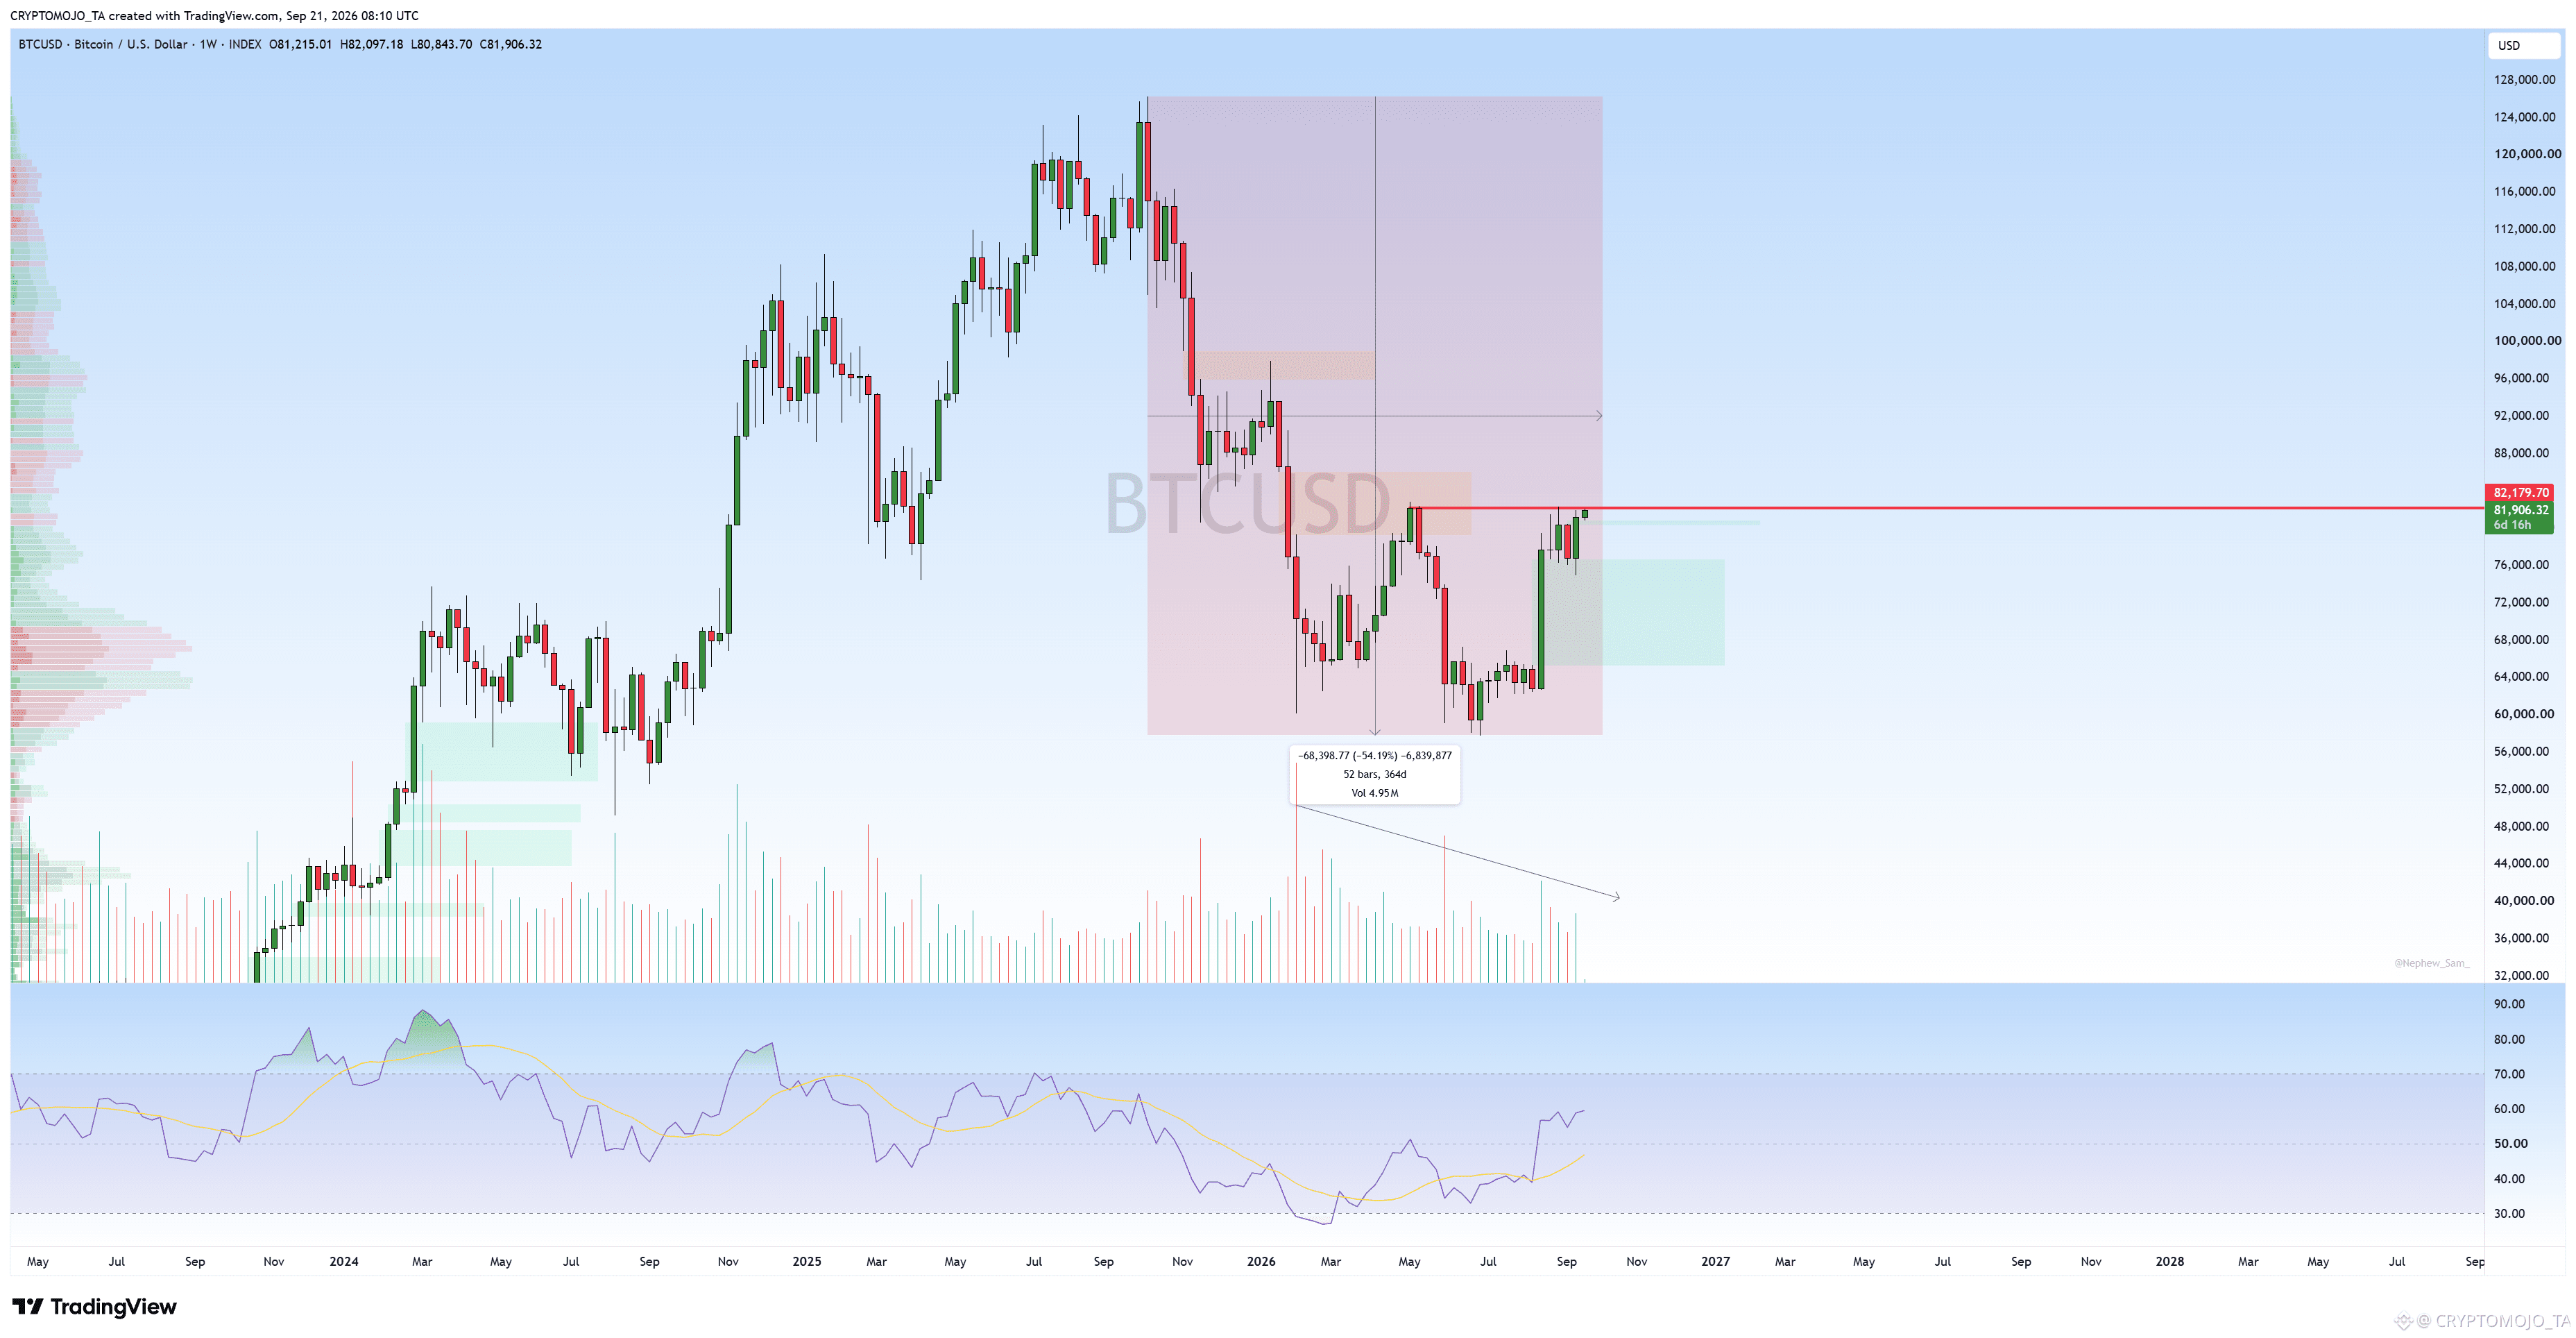
$BTC Update 👀
BTC is still below this key weekly resistance at $82K–$ 82.2 K.
The upcoming weekly candle is very important. BTC has recovered strongly from the ~$57.7K low, but it still needs to break and close above this resistance to confirm further upside.
If we get a clean weekly close above $82.2K, the next areas to watch are $88K–$92K, followed by the $95K–$98K zone.
But if BTC gets rejected again, we could see another pullback toward $76K–$72K.
For me, $82K–$82.2K is the key level.
This weekly close could be very important for BTC.
$BTC Update 👀
BTC is still below this key weekly resistance at $82K–$ 82.2 K.
The upcoming weekly candle is very important. BTC has recovered strongly from the ~$57.7K low, but it still needs to break and close above this resistance to confirm further upside.
If we get a clean weekly close above $82.2K, the next areas to watch are $88K–$92K, followed by the $95K–$98K zone.
But if BTC gets rejected again, we could see another pullback toward $76K–$72K.
For me, $82K–$82.2K is the key level.
This weekly close could be very important for BTC.
BTC is still below this key weekly resistance at $82K–$ 82.2 K.
The upcoming weekly candle is very important. BTC has recovered strongly from the ~$57.7K low, but it still needs to break and close above this resistance to confirm further upside.
If we get a clean weekly close above $82.2K, the next areas to watch are $88K–$92K, followed by the $95K–$98K zone.
But if BTC gets rejected again, we could see another pullback toward $76K–$72K.
For me, $82K–$82.2K is the key level.
This weekly close could be very important for BTC.
3
2.3k
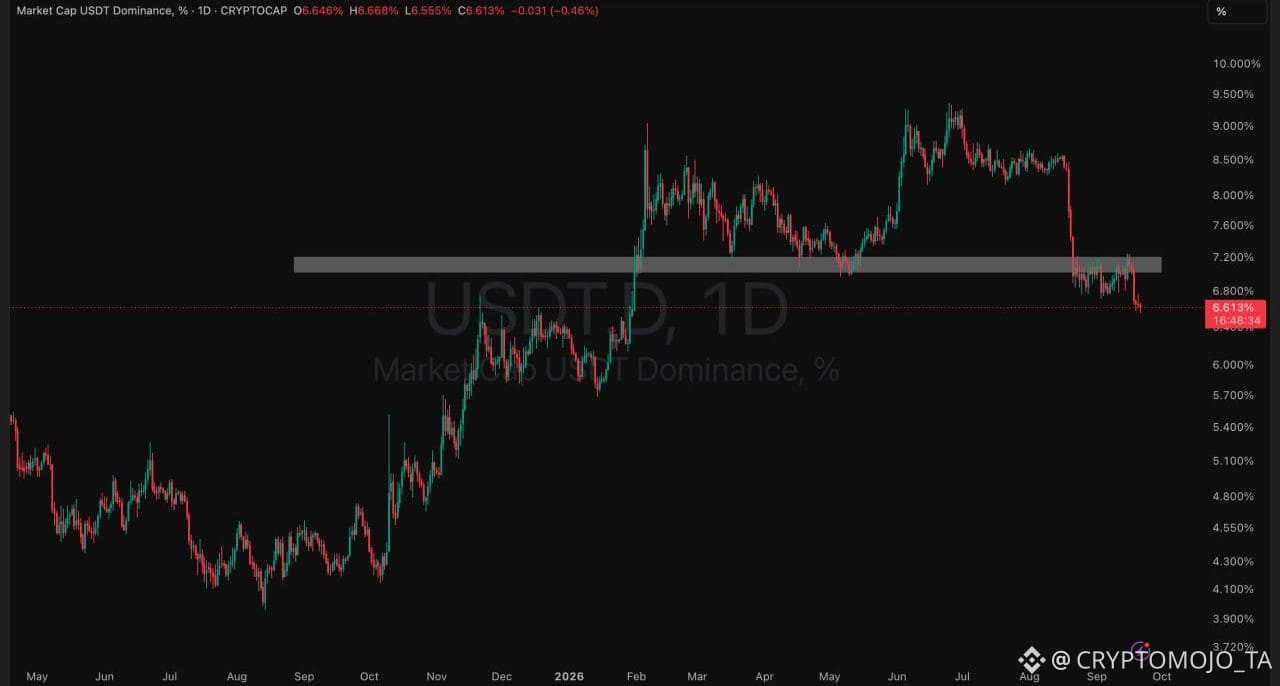
USDT.D Update
USDT Dominance has now lost a key daily support level around 7%, which is a positive sign for alts.
I’ll be looking for longs on alts today, but I don’t want to chase price. Ideally, we get some retracements into support first and then confirmation for entries.
Lower USDT.D = more potential strength across the altcoin market.
#crypto
USDT.D Update
USDT Dominance has now lost a key daily support level around 7%, which is a positive sign for alts.
I’ll be looking for longs on alts today, but I don’t want to chase price. Ideally, we get some retracements into support first and then confirmation for entries.
Lower USDT.D = more potential strength across the altcoin market.
#crypto
USDT Dominance has now lost a key daily support level around 7%, which is a positive sign for alts.
I’ll be looking for longs on alts today, but I don’t want to chase price. Ideally, we get some retracements into support first and then confirmation for entries.
Lower USDT.D = more potential strength across the altcoin market.
#crypto
1
2
271
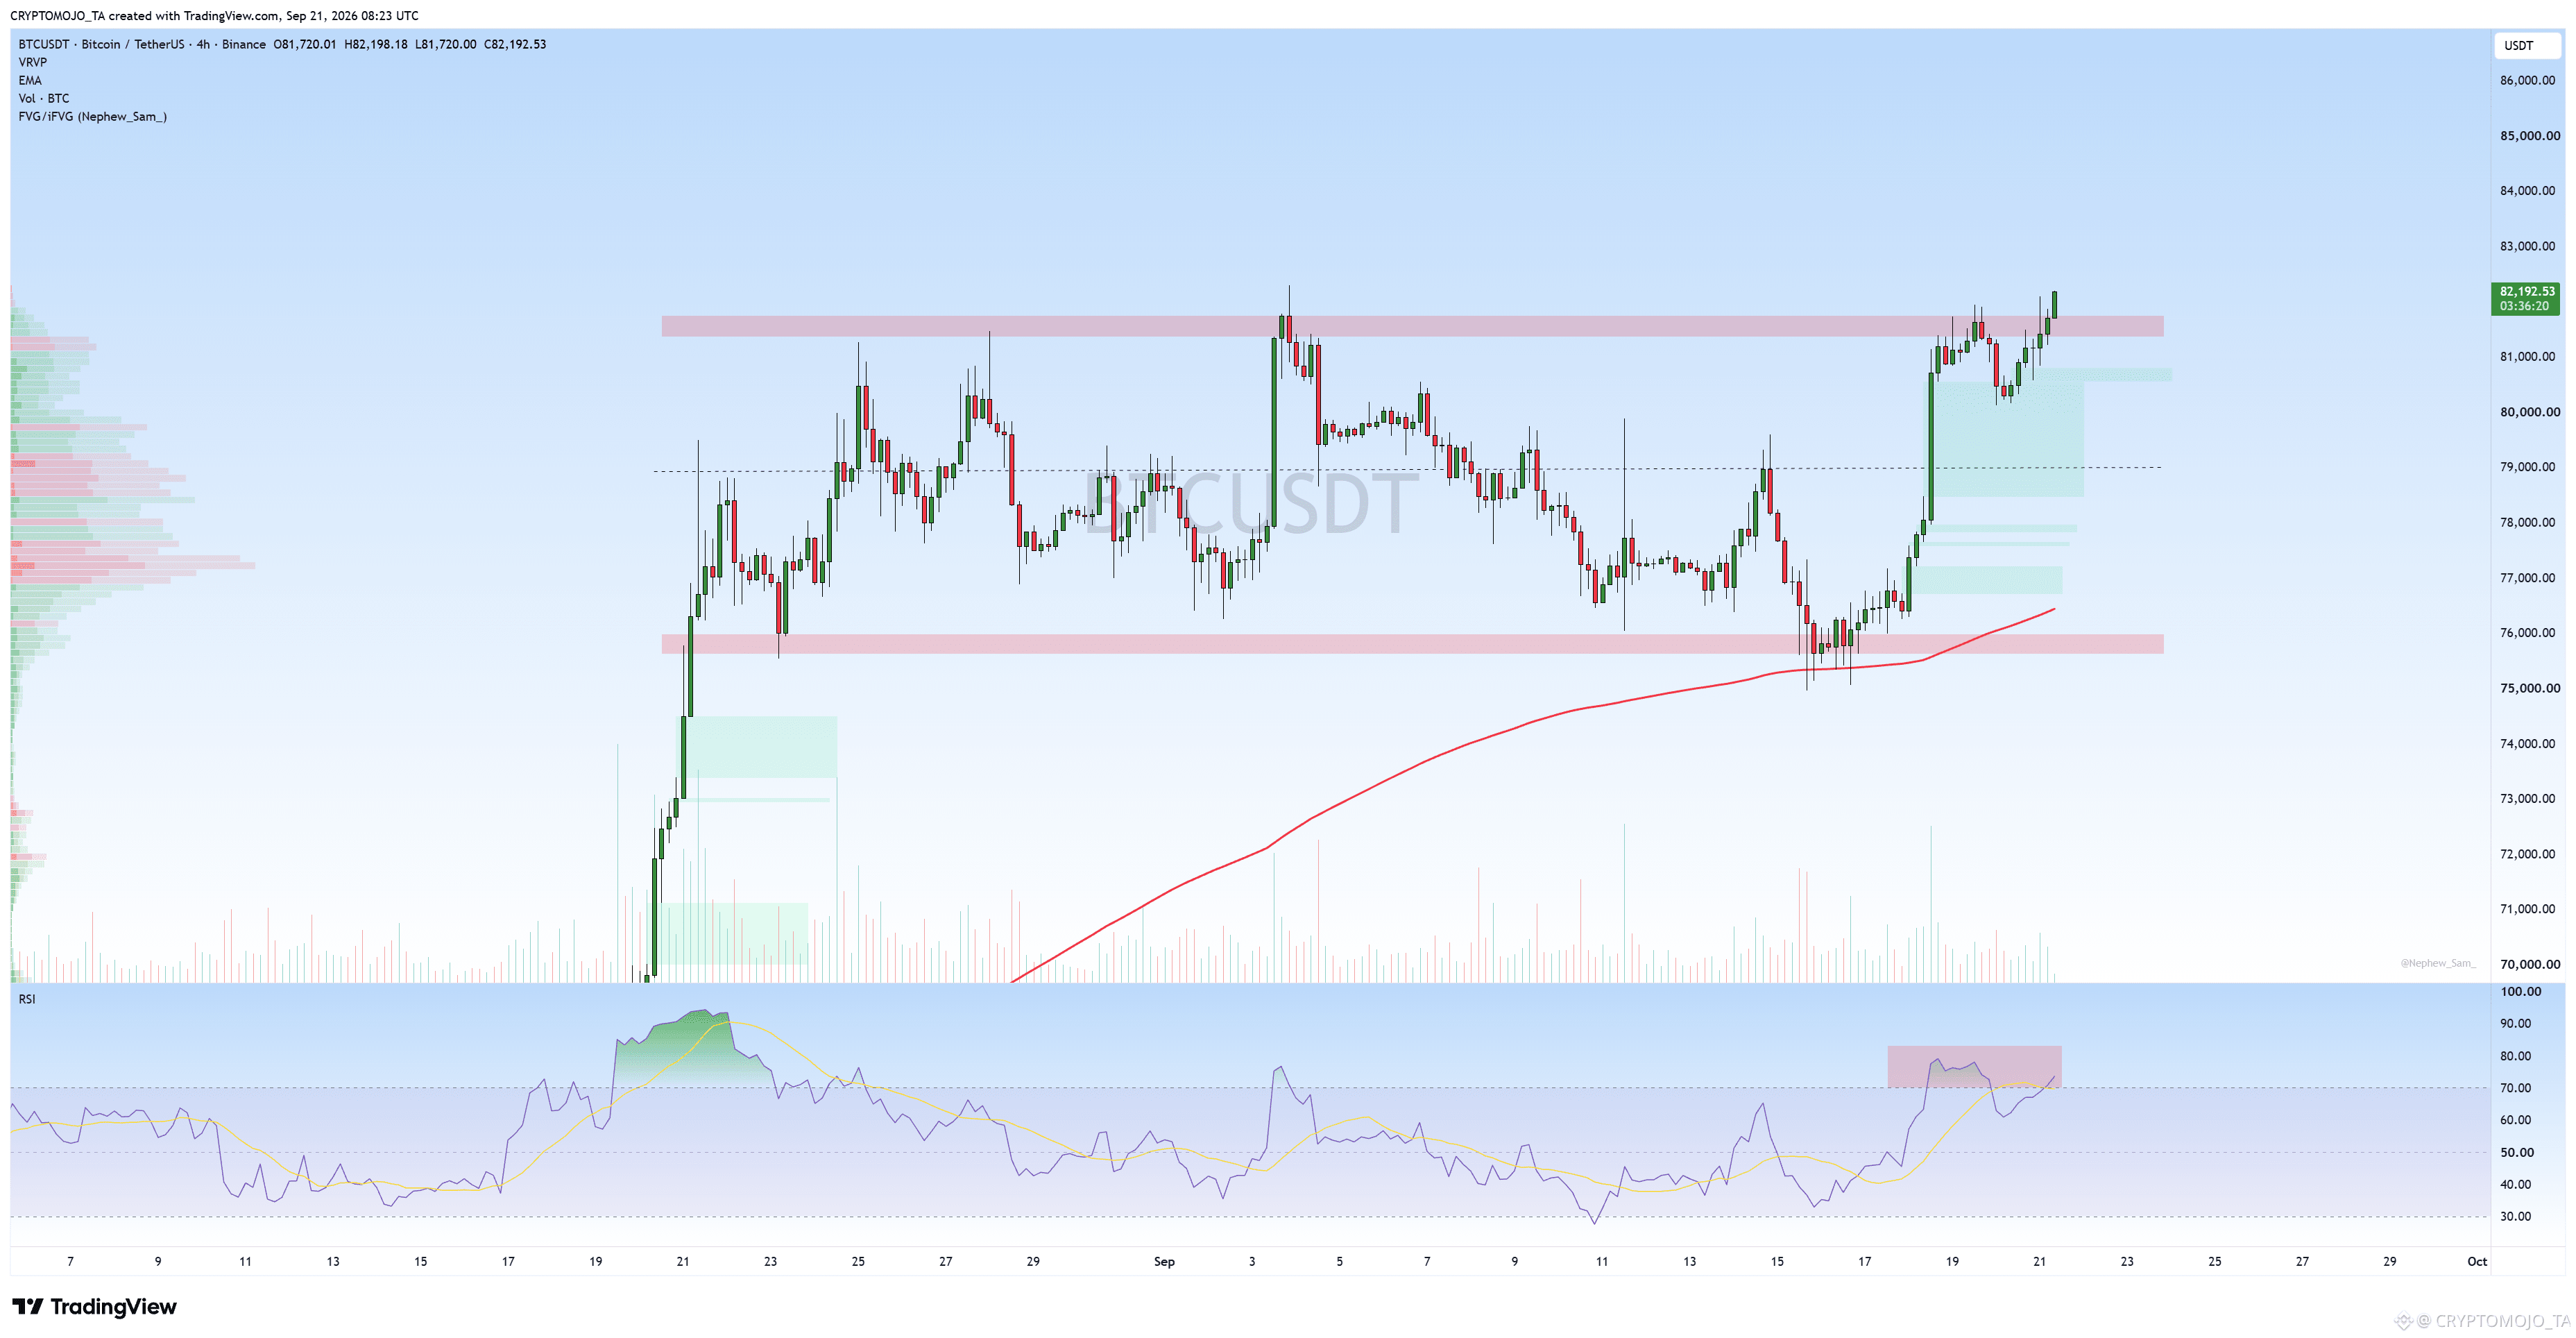
$BTC breakout? 👀
Or is this just another fake breakout to grab liquidity and trap late buyers?
$BTC breakout? 👀
Or is this just another fake breakout to grab liquidity and trap late buyers?
Or is this just another fake breakout to grab liquidity and trap late buyers?
685
·
--
Bearish
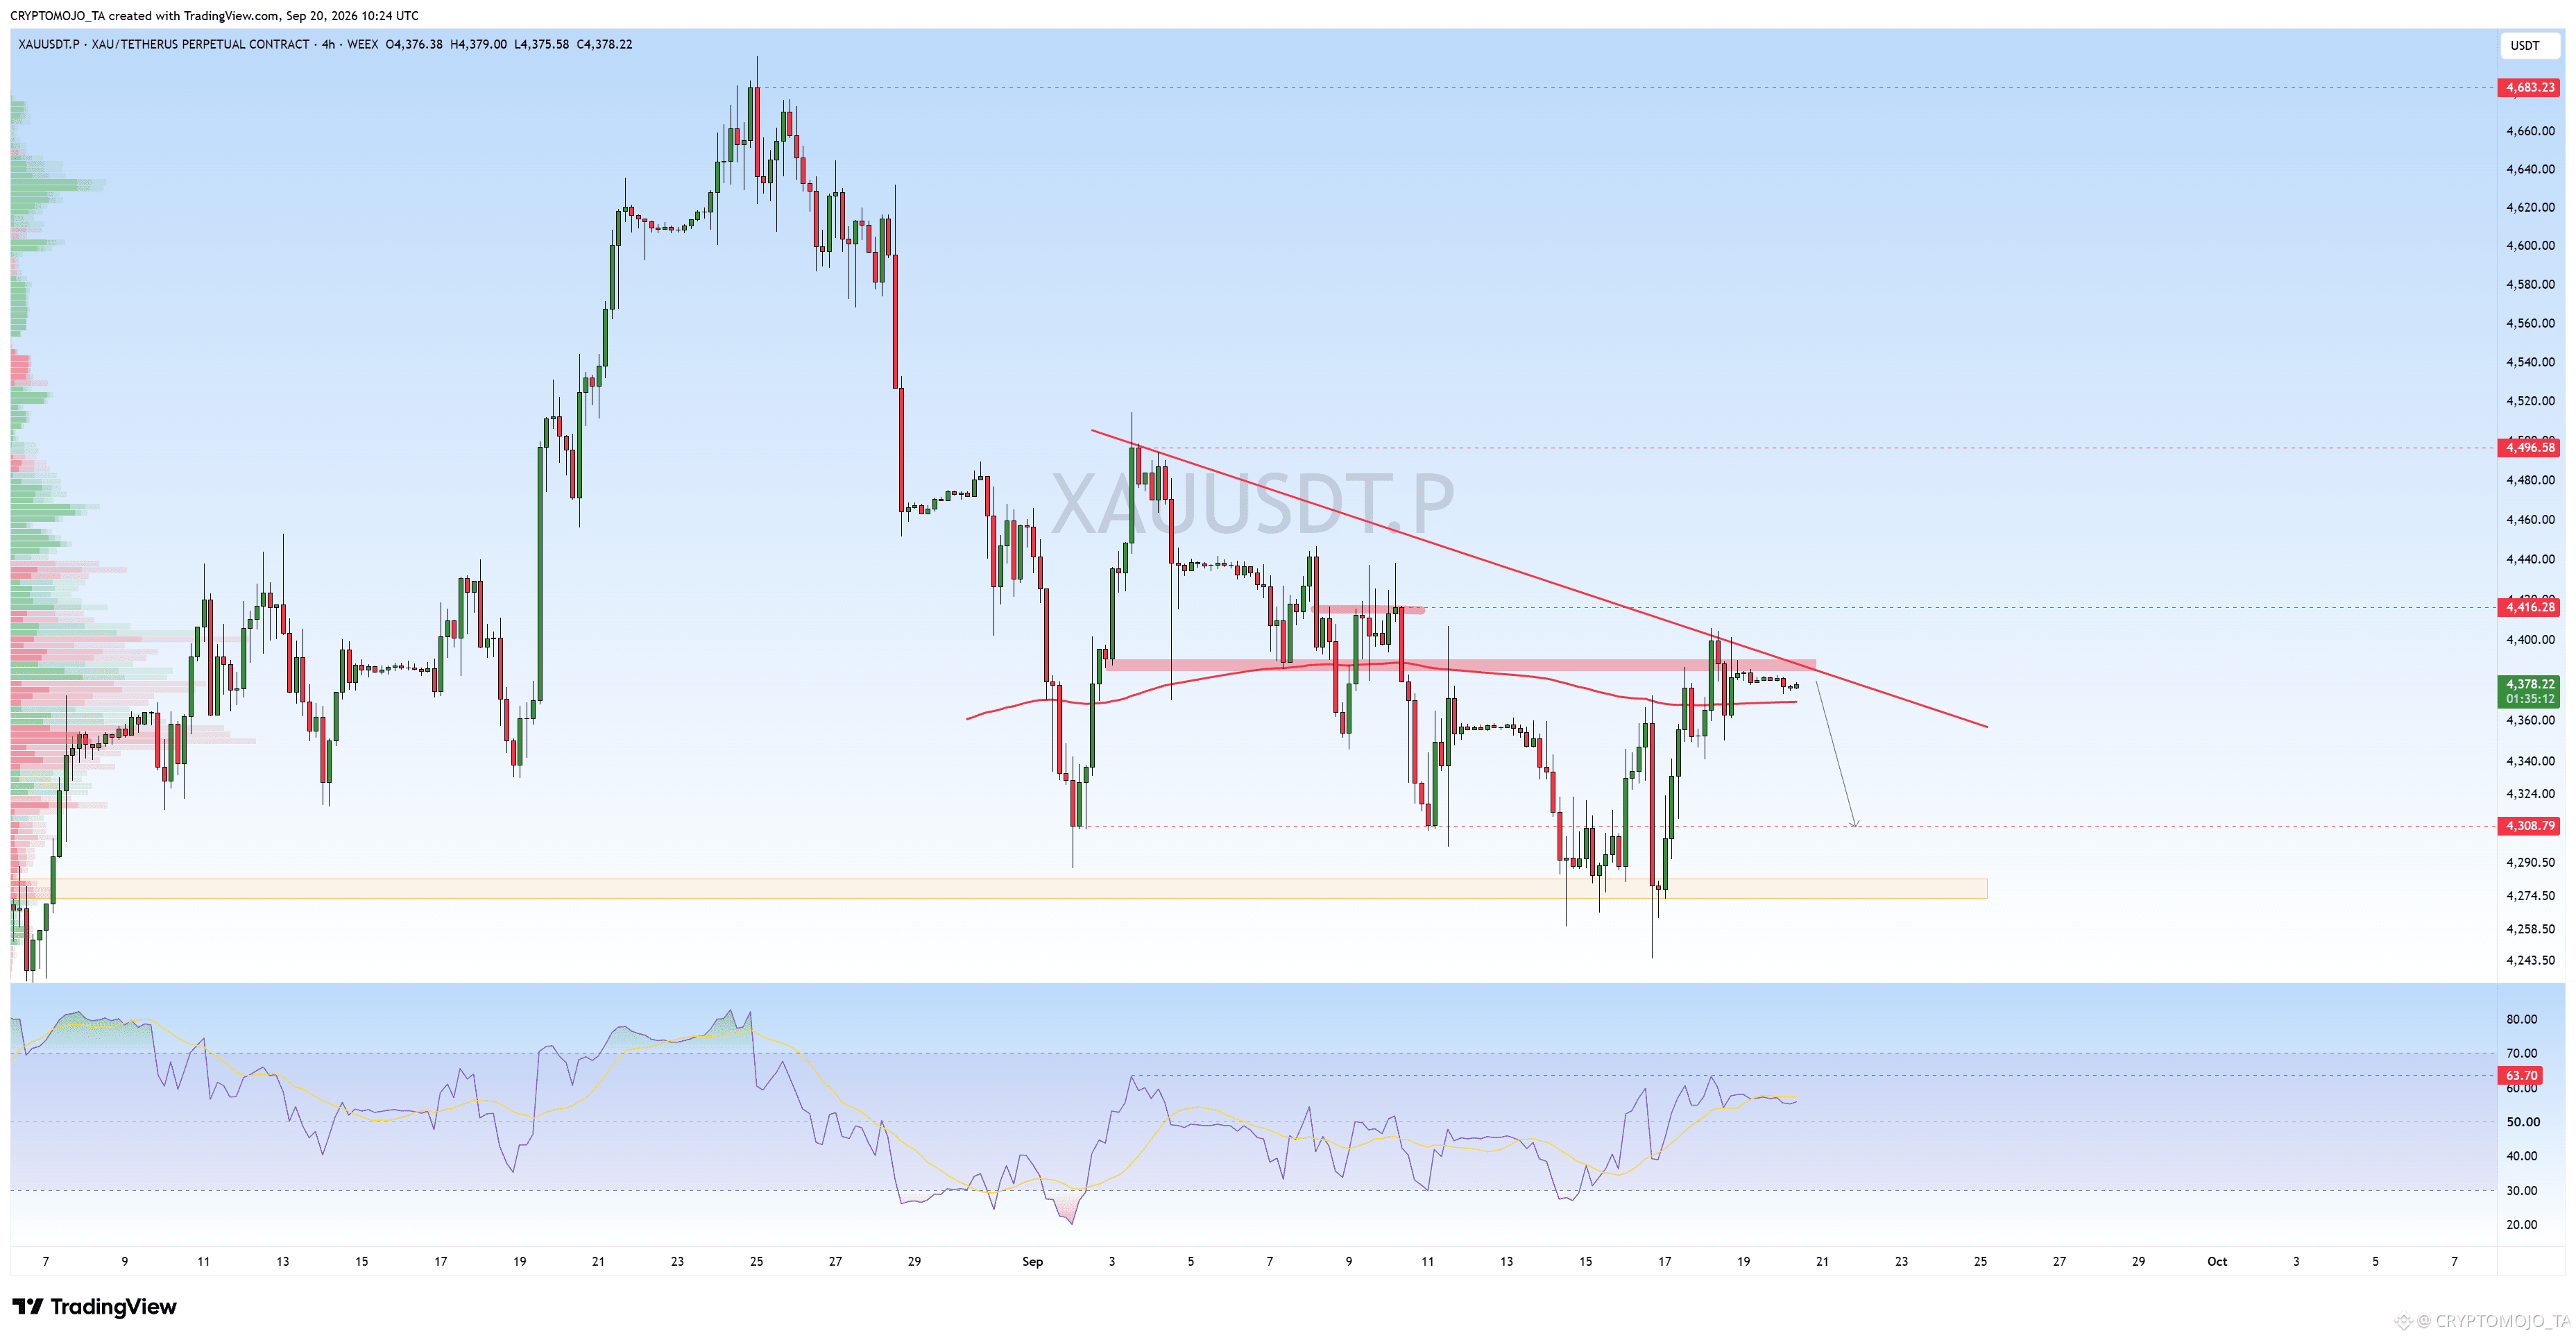
$XAUT Update
#GOLD is compressing below a major descending trendline resistance.
Price is currently around $4,378, with the trendline coming in around $4,390–$4,400. We’ve already seen multiple rejections from this area, so this is an important level to watch.
The bigger resistance zone is around $4,400–$4,416, while the key downside level is $4,308.
RSI is around 63, showing that momentum has recovered, but it’s not yet in an extreme overbought zone.
If gold breaks and closes above $4,416, the bearish structure could start weakening.
But if price gets rejected from the trendline again, a move toward $4,308 looks possible, with the $4,270–$4,290 zone acting as the next major support.
$XAUT Update
#GOLD is compressing below a major descending trendline resistance.
Price is currently around $4,378, with the trendline coming in around $4,390–$4,400. We’ve already seen multiple rejections from this area, so this is an important level to watch.
The bigger resistance zone is around $4,400–$4,416, while the key downside level is $4,308.
RSI is around 63, showing that momentum has recovered, but it’s not yet in an extreme overbought zone.
If gold breaks and closes above $4,416, the bearish structure could start weakening.
But if price gets rejected from the trendline again, a move toward $4,308 looks possible, with the $4,270–$4,290 zone acting as the next major support.
#GOLD is compressing below a major descending trendline resistance.
Price is currently around $4,378, with the trendline coming in around $4,390–$4,400. We’ve already seen multiple rejections from this area, so this is an important level to watch.
The bigger resistance zone is around $4,400–$4,416, while the key downside level is $4,308.
RSI is around 63, showing that momentum has recovered, but it’s not yet in an extreme overbought zone.
If gold breaks and closes above $4,416, the bearish structure could start weakening.
But if price gets rejected from the trendline again, a move toward $4,308 looks possible, with the $4,270–$4,290 zone acting as the next major support.
1
147
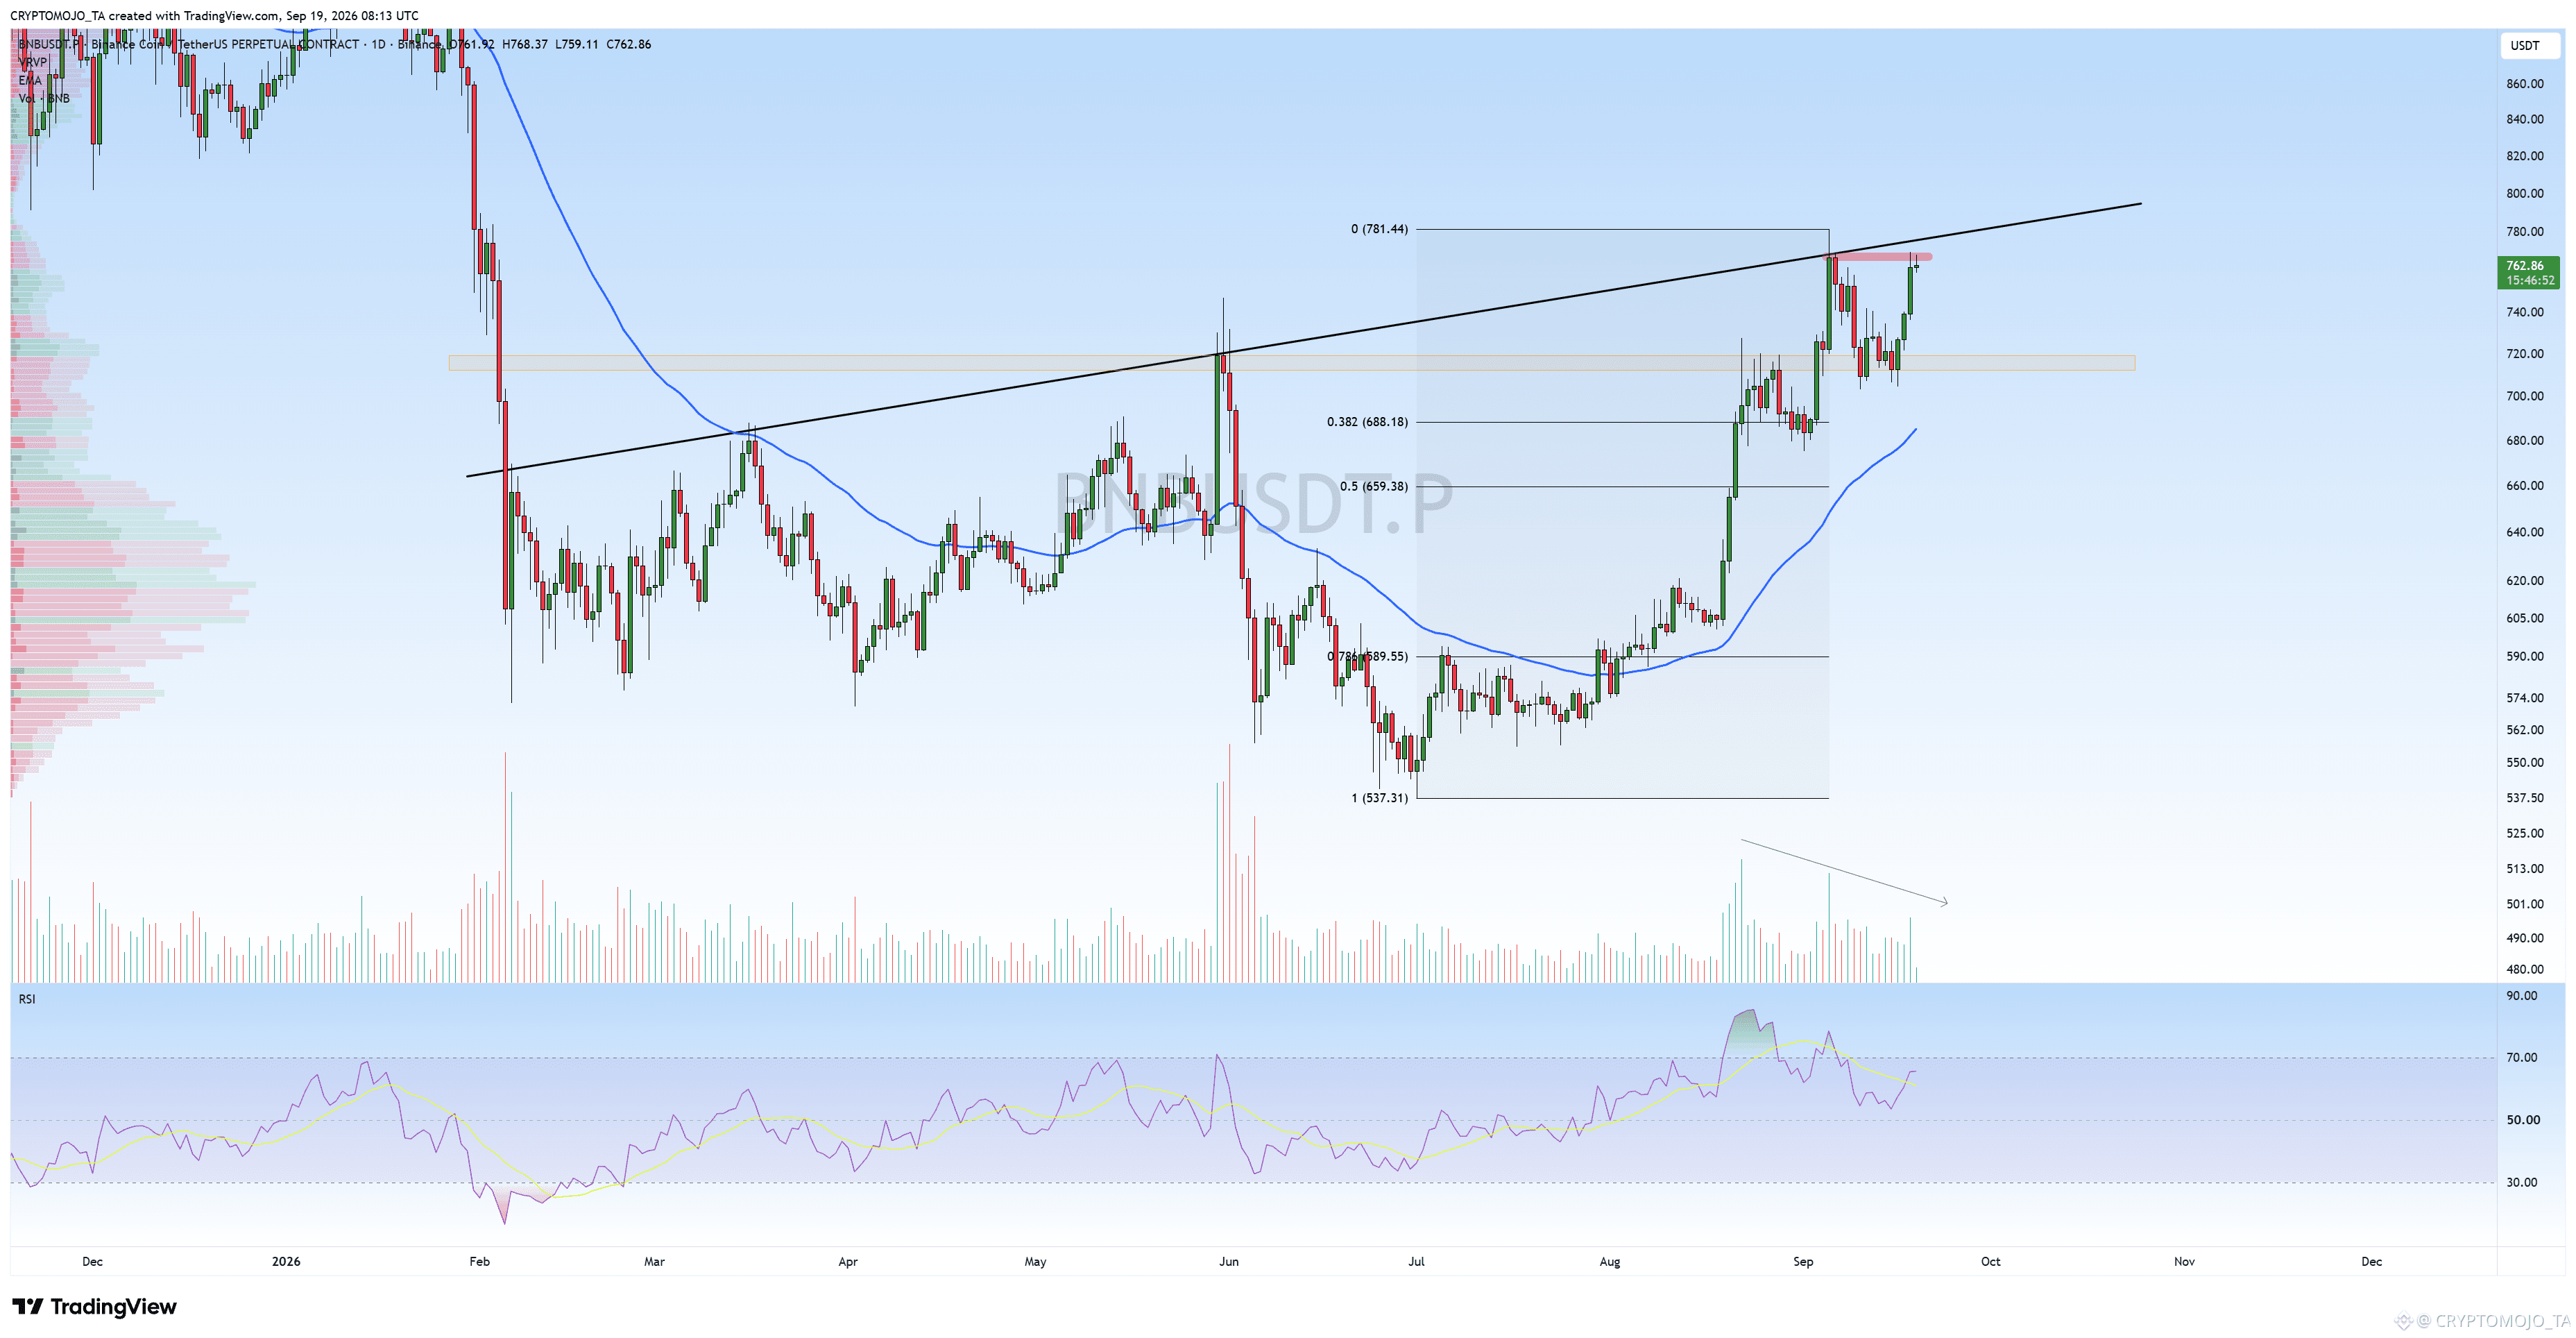
$BNB Update
#BNB is getting very close to a major resistance zone around $780–$782.
Price has recovered strongly from the $537 low and is now trading near the 0 Fibonacci level at $781.44, while also approaching the upper rising trendline.
This area has already acted as a major rejection zone, so I’m watching the reaction here very closely.
The $715–$720 area is the key support zone below. If BNB gets rejected from $780–$782, a pullback toward this zone could be possible.
RSI is also approaching the 70 area, so momentum is strong but starting to become stretched.
A clean breakout and close above $782 could open the door for further upside. Until then, this remains a major resistance to watch.
Let's see how BNB reacts here.
$BNB Update
#BNB is getting very close to a major resistance zone around $780–$782.
Price has recovered strongly from the $537 low and is now trading near the 0 Fibonacci level at $781.44, while also approaching the upper rising trendline.
This area has already acted as a major rejection zone, so I’m watching the reaction here very closely.
The $715–$720 area is the key support zone below. If BNB gets rejected from $780–$782, a pullback toward this zone could be possible.
RSI is also approaching the 70 area, so momentum is strong but starting to become stretched.
A clean breakout and close above $782 could open the door for further upside. Until then, this remains a major resistance to watch.
Let's see how BNB reacts here.
#BNB is getting very close to a major resistance zone around $780–$782.
Price has recovered strongly from the $537 low and is now trading near the 0 Fibonacci level at $781.44, while also approaching the upper rising trendline.
This area has already acted as a major rejection zone, so I’m watching the reaction here very closely.
The $715–$720 area is the key support zone below. If BNB gets rejected from $780–$782, a pullback toward this zone could be possible.
RSI is also approaching the 70 area, so momentum is strong but starting to become stretched.
A clean breakout and close above $782 could open the door for further upside. Until then, this remains a major resistance to watch.
Let's see how BNB reacts here.
1
99
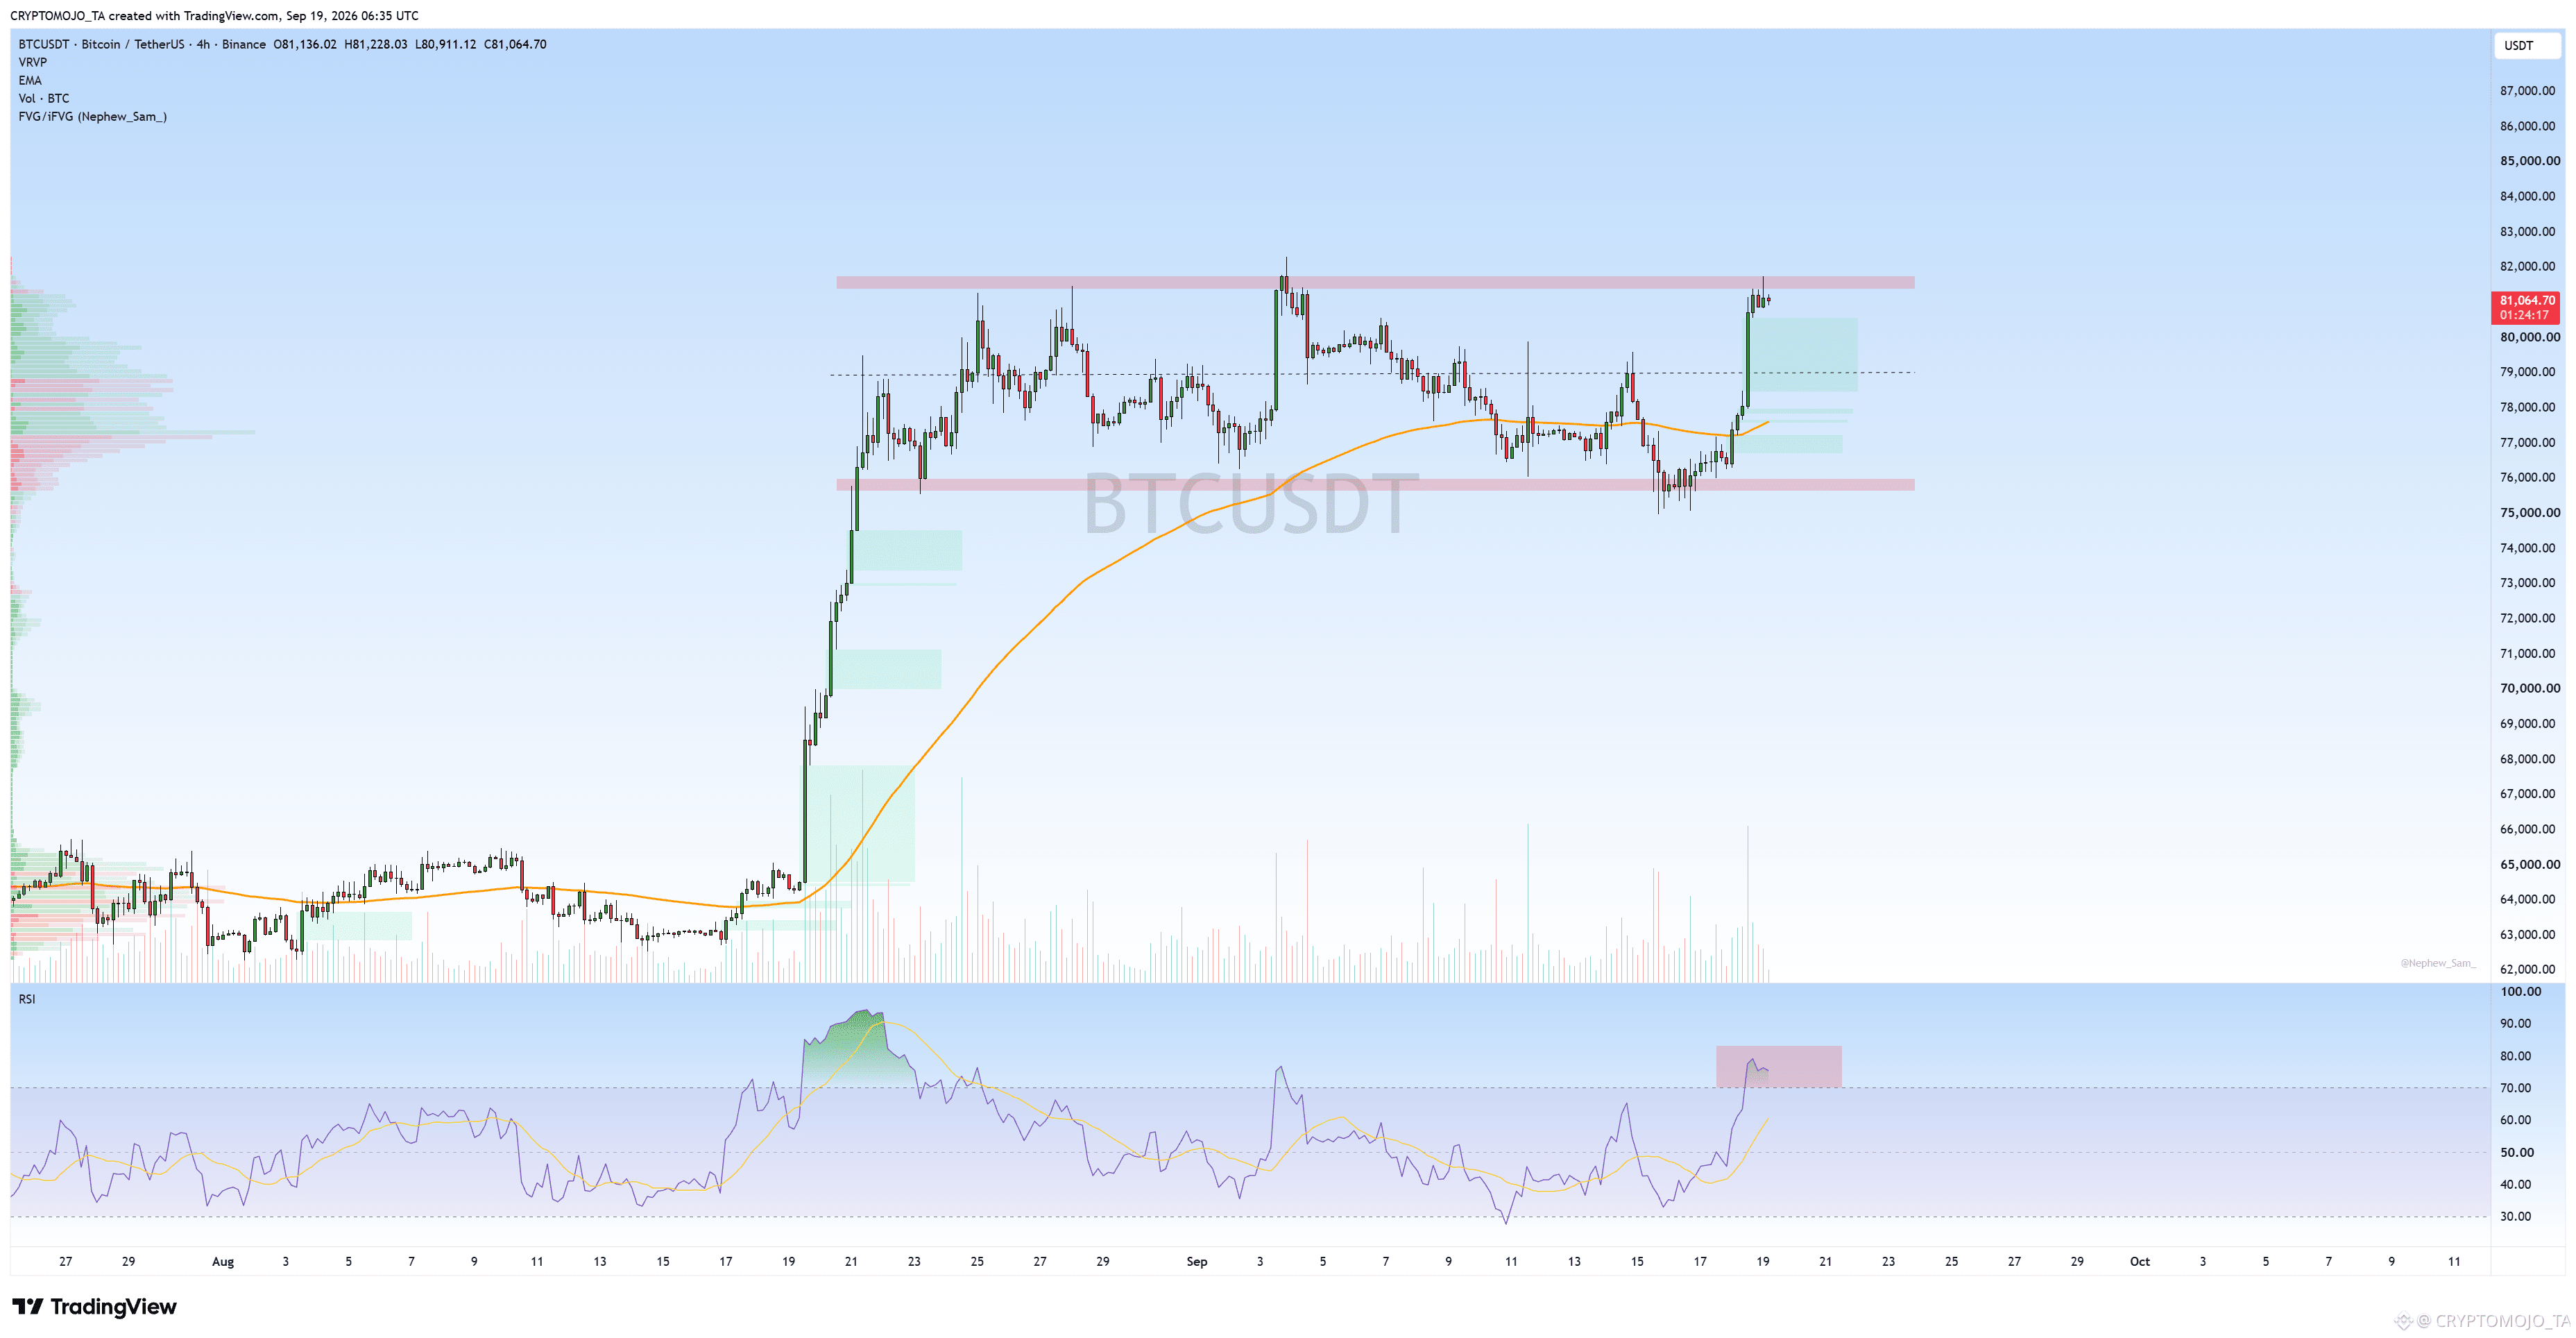
Yesterday we saw a straight bounce, and BTC is now trending around this area while facing strong horizontal resistance.
This zone won’t be easy to break, especially with RSI already back in the overbought range.
So, we could see some sideways movement or a rejection from this level as the RSI cools off and resets below the overbought zone.
Let’s see how #BTC reacts here. 👀
Comment your views below.
Yesterday we saw a straight bounce, and BTC is now trending around this area while facing strong horizontal resistance.
This zone won’t be easy to break, especially with RSI already back in the overbought range.
So, we could see some sideways movement or a rejection from this level as the RSI cools off and resets below the overbought zone.
Let’s see how #BTC reacts here. 👀
Comment your views below.
This zone won’t be easy to break, especially with RSI already back in the overbought range.
So, we could see some sideways movement or a rejection from this level as the RSI cools off and resets below the overbought zone.
Let’s see how #BTC reacts here. 👀
Comment your views below.
148
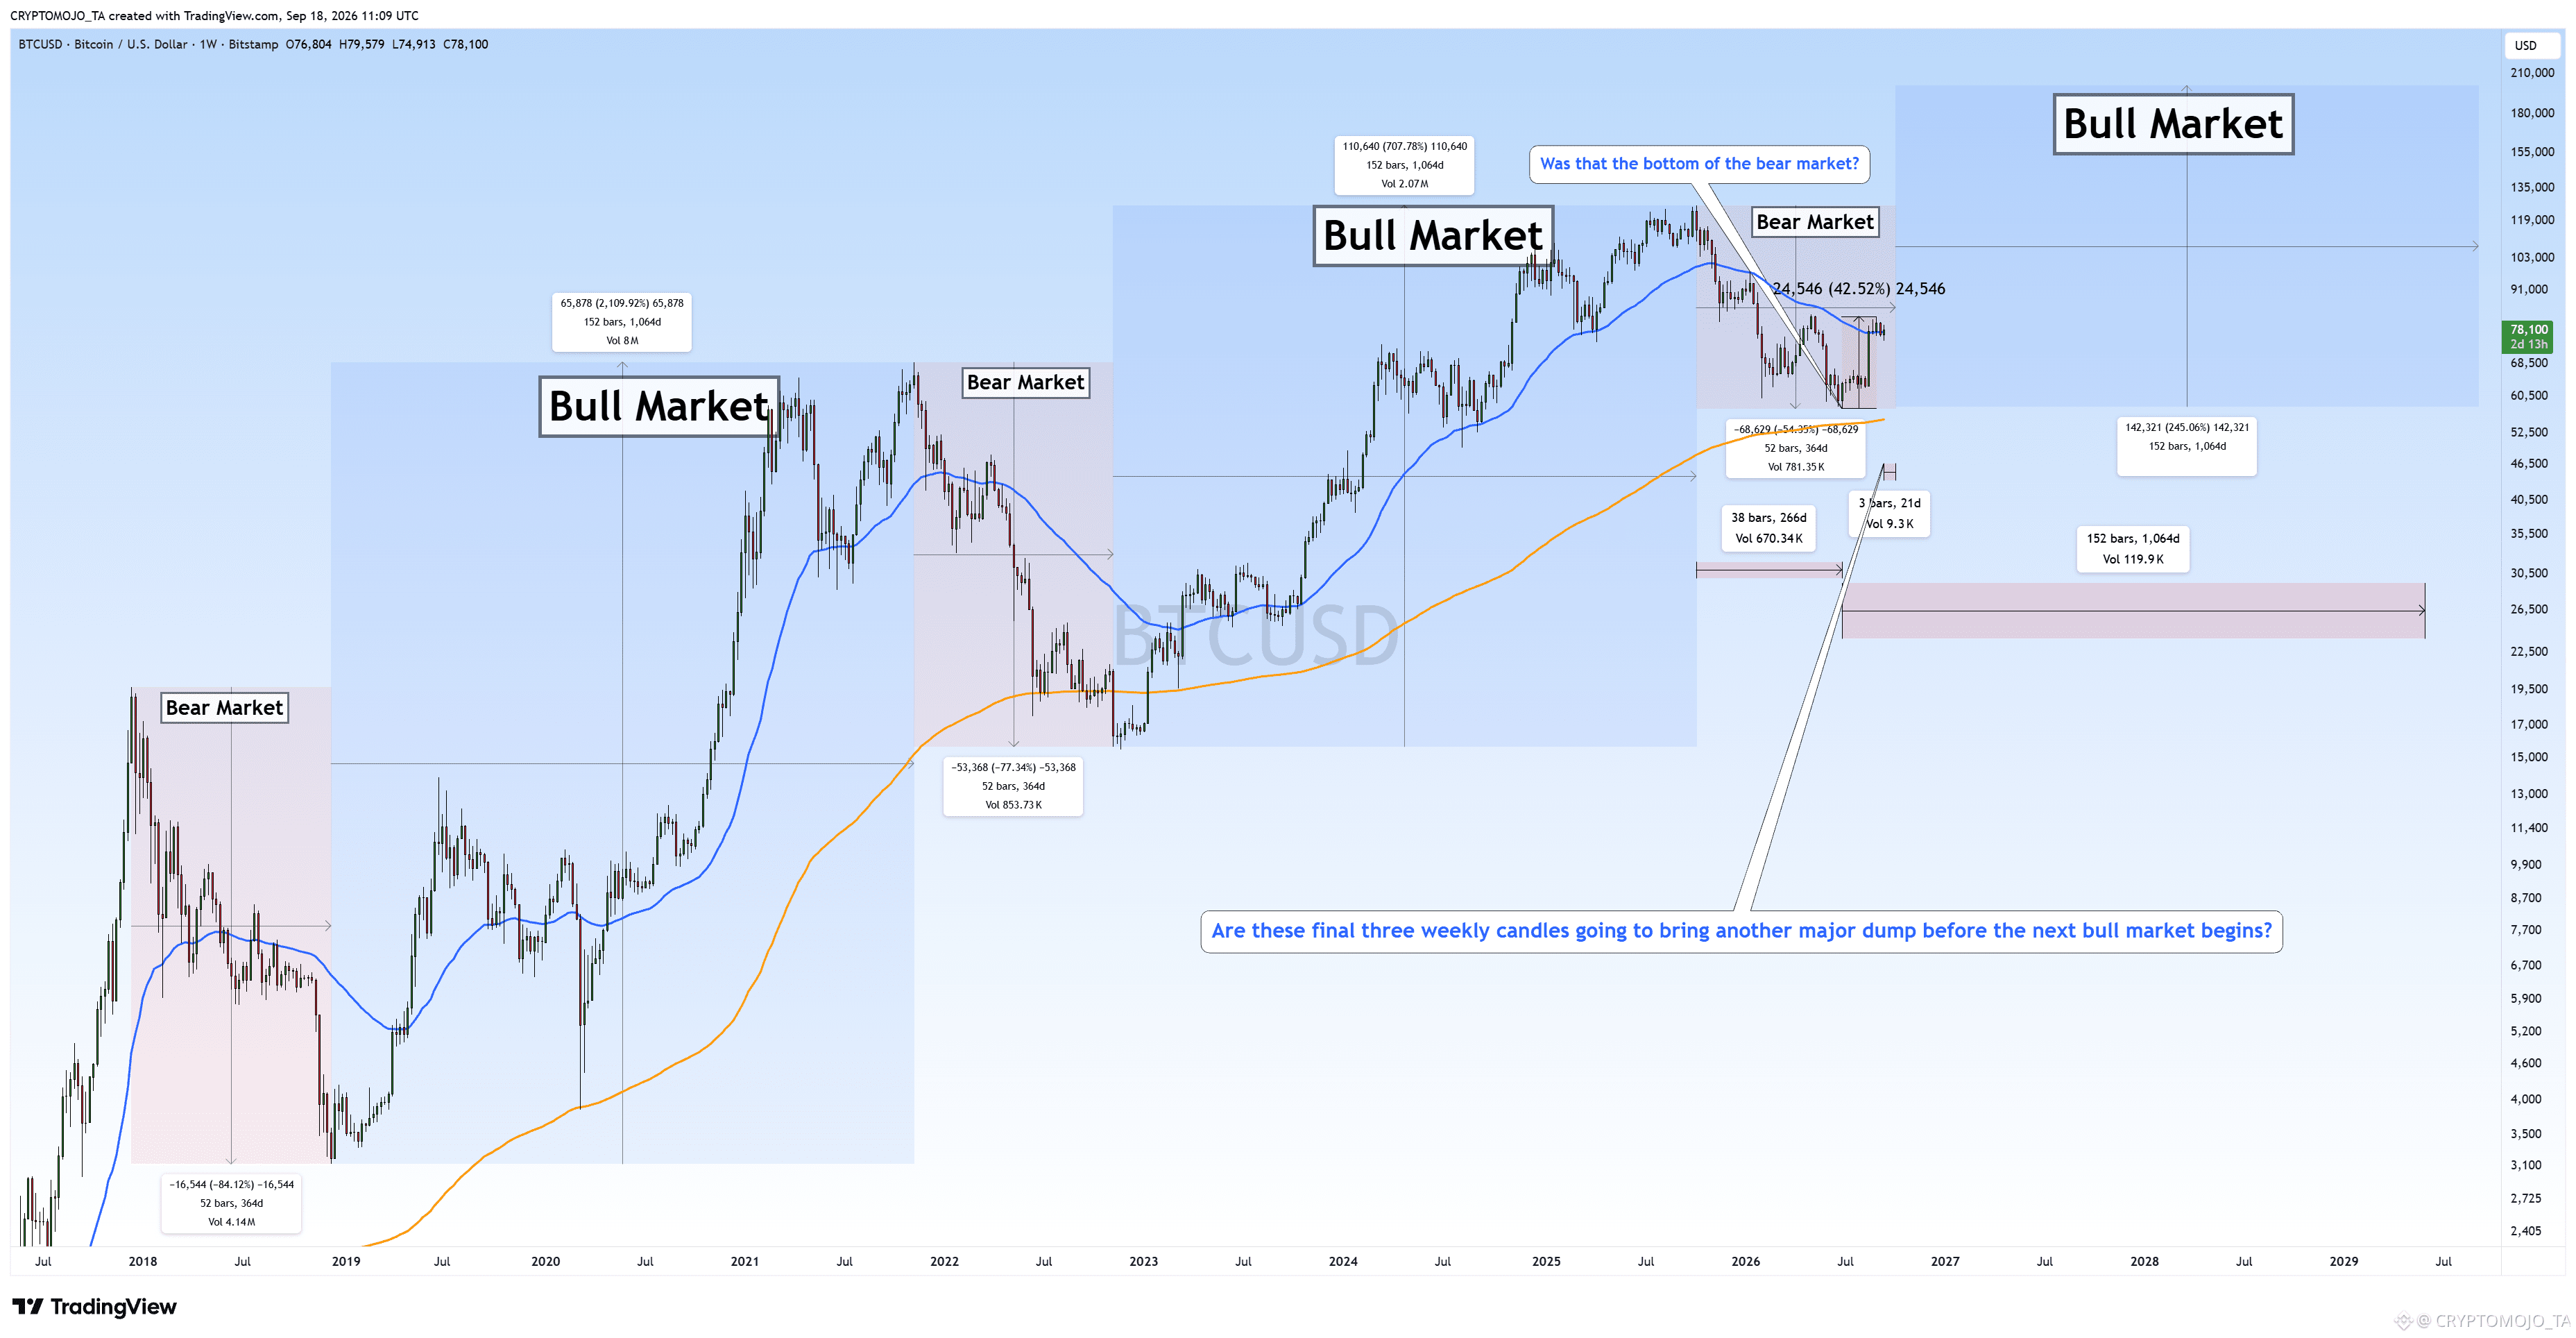
Was $57,735 the bottom of this bear market? 👀
If that was the bottom, we have now completed around 266 days of this bear-market phase.
Historically, Bitcoin’s major bear markets have lasted roughly a full year. In 2018, the decline continued from December 2017 into December 2018. In the previous cycle, the bear market began after the November 2021 top and continued into November 2022.
This time, the structure is different.
From the October 2025 ATH to the June 2026 low, BTC went through a major correction. Since that low, we have already seen a recovery of roughly 42%, with BTC now around $78K.
So the big question is:
Was this a shorter bear market, and has the next bull phase already started?
Or...
Are these final three weekly candles going to bring another major dump before the next bull market begins?
The historical timing would suggest that the market could need more time before a new major bull phase, but Bitcoin doesn't always follow the exact same schedule.
For me, the next 3 weekly candles are extremely important.
I’m not going to assume the bottom is confirmed yet. I’d rather wait for the price action to give us confirmation.
BTC has surprised us many times before.
👀
What do you think was the June low the actual bottom, or are we going to see one more major drop before the next bull market?
#Bitcoin
Was $57,735 the bottom of this bear market? 👀
If that was the bottom, we have now completed around 266 days of this bear-market phase.
Historically, Bitcoin’s major bear markets have lasted roughly a full year. In 2018, the decline continued from December 2017 into December 2018. In the previous cycle, the bear market began after the November 2021 top and continued into November 2022.
This time, the structure is different.
From the October 2025 ATH to the June 2026 low, BTC went through a major correction. Since that low, we have already seen a recovery of roughly 42%, with BTC now around $78K.
So the big question is:
Was this a shorter bear market, and has the next bull phase already started?
Or...
Are these final three weekly candles going to bring another major dump before the next bull market begins?
The historical timing would suggest that the market could need more time before a new major bull phase, but Bitcoin doesn't always follow the exact same schedule.
For me, the next 3 weekly candles are extremely important.
I’m not going to assume the bottom is confirmed yet. I’d rather wait for the price action to give us confirmation.
BTC has surprised us many times before.
👀
What do you think was the June low the actual bottom, or are we going to see one more major drop before the next bull market?
#Bitcoin
If that was the bottom, we have now completed around 266 days of this bear-market phase.
Historically, Bitcoin’s major bear markets have lasted roughly a full year. In 2018, the decline continued from December 2017 into December 2018. In the previous cycle, the bear market began after the November 2021 top and continued into November 2022.
This time, the structure is different.
From the October 2025 ATH to the June 2026 low, BTC went through a major correction. Since that low, we have already seen a recovery of roughly 42%, with BTC now around $78K.
So the big question is:
Was this a shorter bear market, and has the next bull phase already started?
Or...
Are these final three weekly candles going to bring another major dump before the next bull market begins?
The historical timing would suggest that the market could need more time before a new major bull phase, but Bitcoin doesn't always follow the exact same schedule.
For me, the next 3 weekly candles are extremely important.
I’m not going to assume the bottom is confirmed yet. I’d rather wait for the price action to give us confirmation.
BTC has surprised us many times before.
👀
What do you think was the June low the actual bottom, or are we going to see one more major drop before the next bull market?
#Bitcoin
234
·
--
Bearish
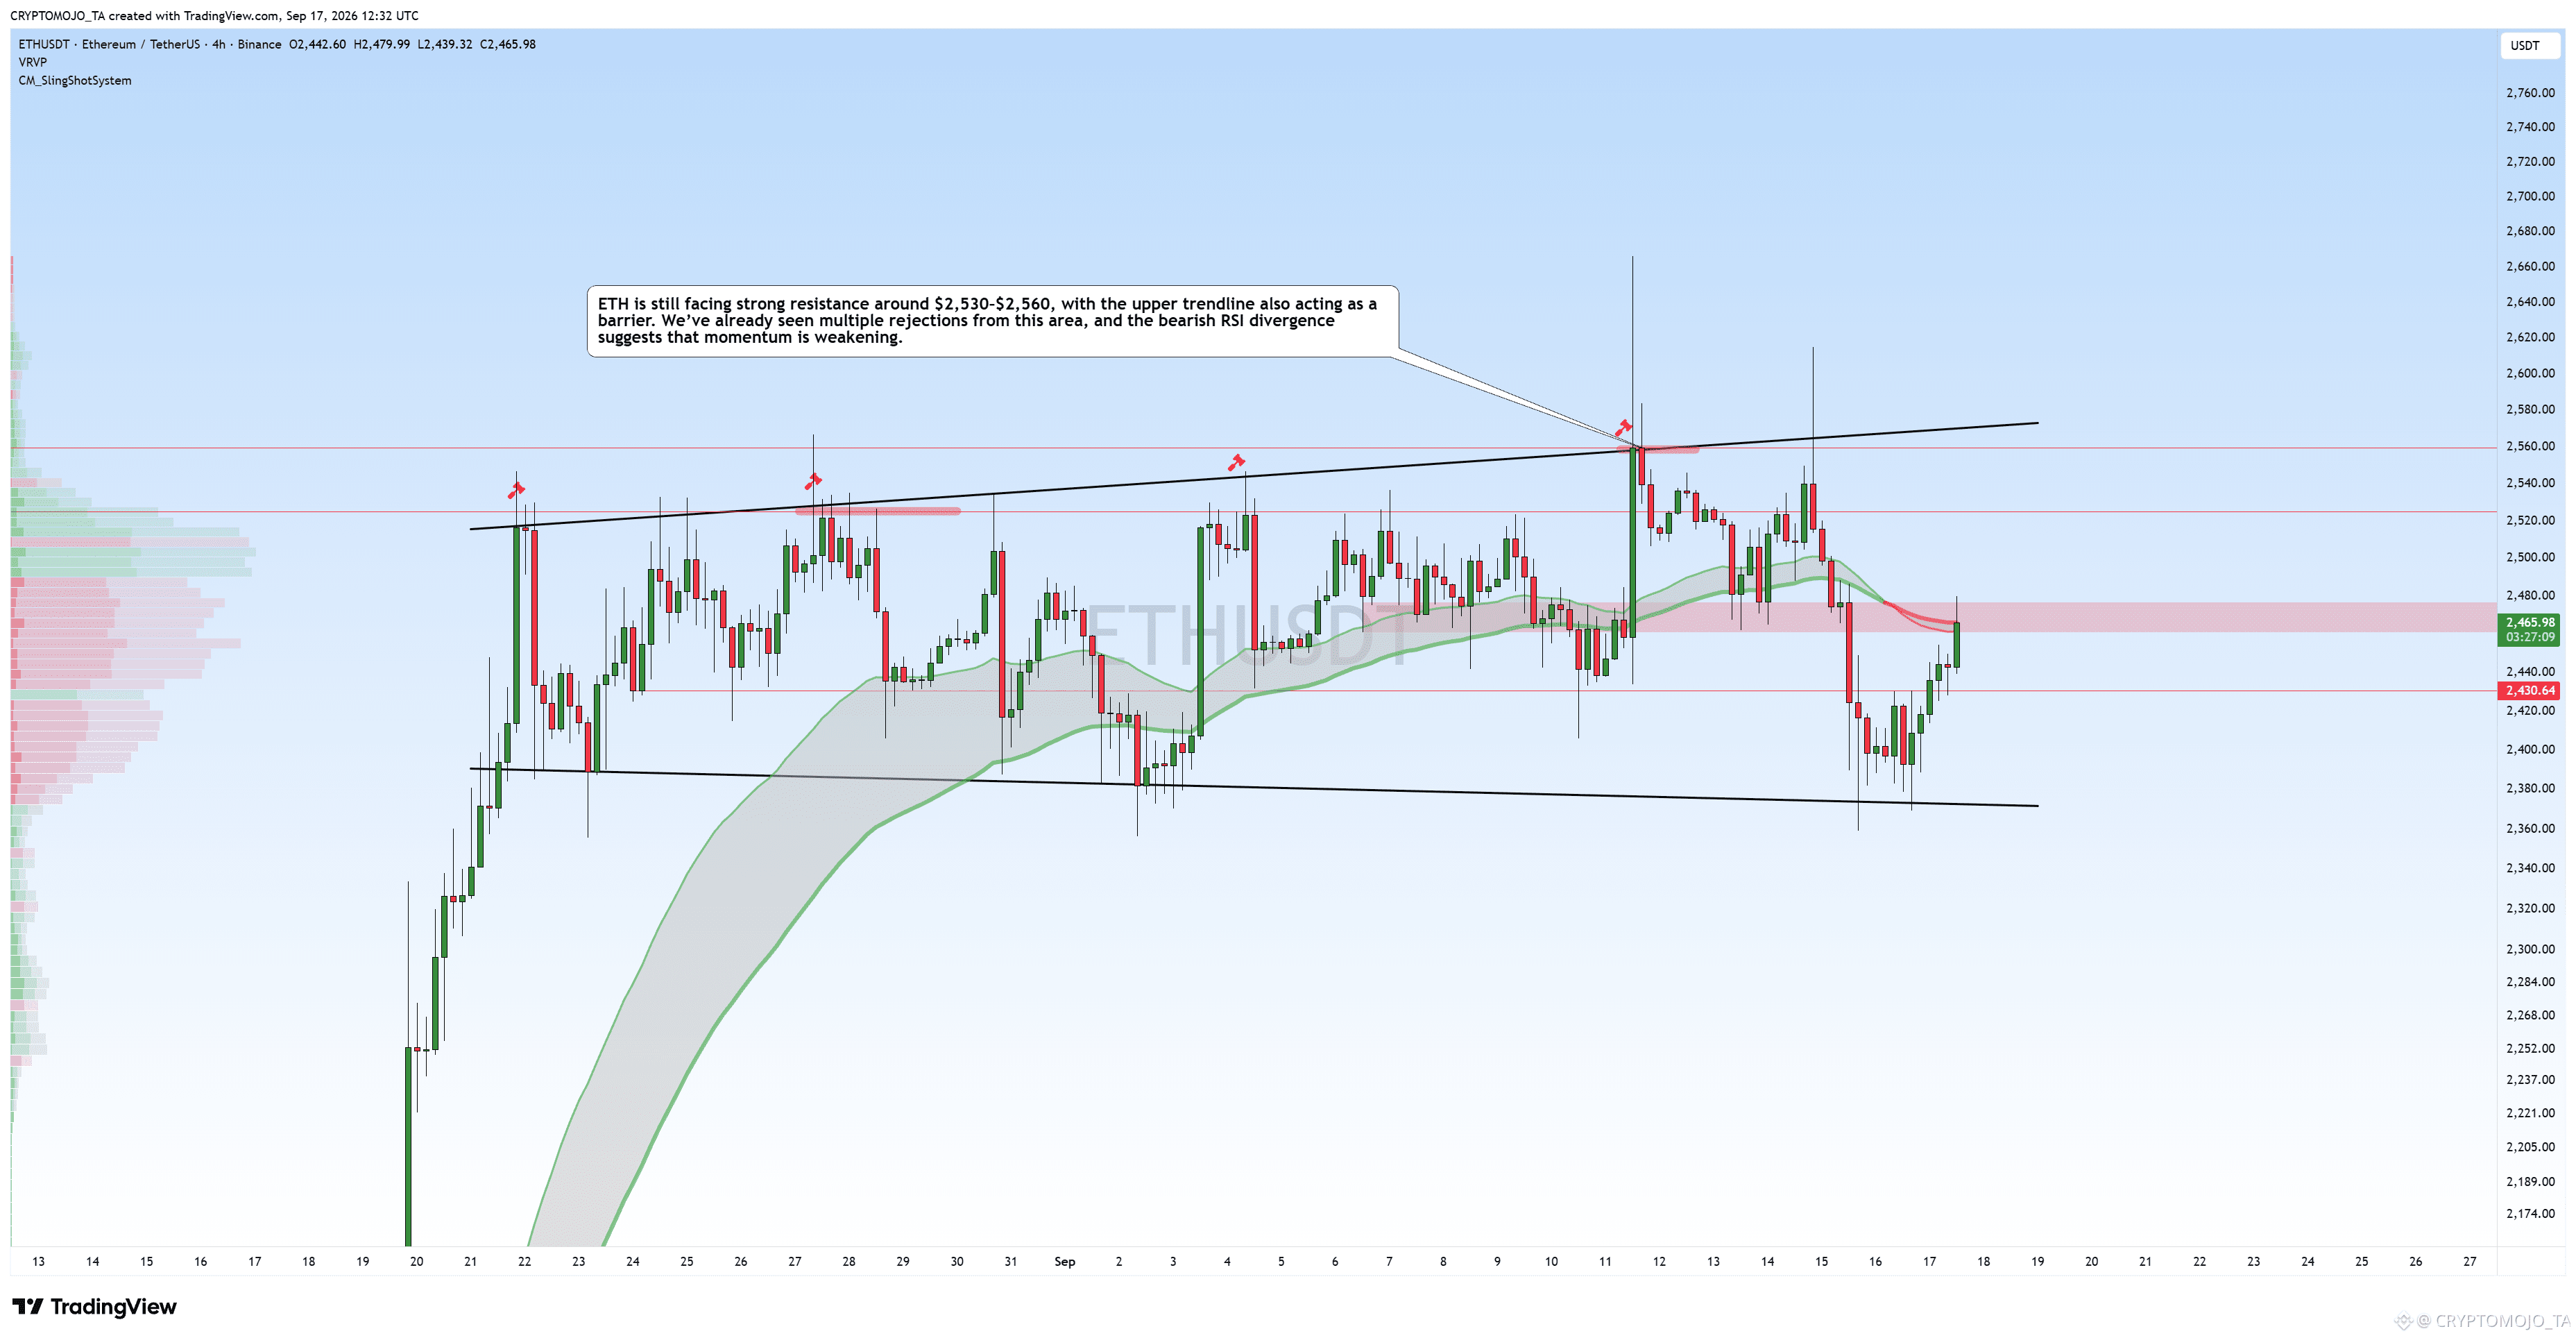
$ETH Update 👀
ETH bounced strongly from the $2,380–$2,400 support zone and is now back around $2,465.
But the recovery is already approaching a key resistance area around $2,465–$2,480, where the moving averages and previous breakdown zone are sitting.
If ETH reclaims $2,480, the next major resistance remains $2,530–$2,560 along the upper trendline.
On the other hand, rejection here could send ETH back toward $2,430, followed by $2,380.
For now, I’m watching $2,480 closely. A clean breakout could change the structure; rejection keeps the bearish setup alive.
#Ethereum✅
$ETH Update 👀
ETH bounced strongly from the $2,380–$2,400 support zone and is now back around $2,465.
But the recovery is already approaching a key resistance area around $2,465–$2,480, where the moving averages and previous breakdown zone are sitting.
If ETH reclaims $2,480, the next major resistance remains $2,530–$2,560 along the upper trendline.
On the other hand, rejection here could send ETH back toward $2,430, followed by $2,380.
For now, I’m watching $2,480 closely. A clean breakout could change the structure; rejection keeps the bearish setup alive.
#Ethereum✅
ETH bounced strongly from the $2,380–$2,400 support zone and is now back around $2,465.
But the recovery is already approaching a key resistance area around $2,465–$2,480, where the moving averages and previous breakdown zone are sitting.
If ETH reclaims $2,480, the next major resistance remains $2,530–$2,560 along the upper trendline.
On the other hand, rejection here could send ETH back toward $2,430, followed by $2,380.
For now, I’m watching $2,480 closely. A clean breakout could change the structure; rejection keeps the bearish setup alive.
#Ethereum✅
101
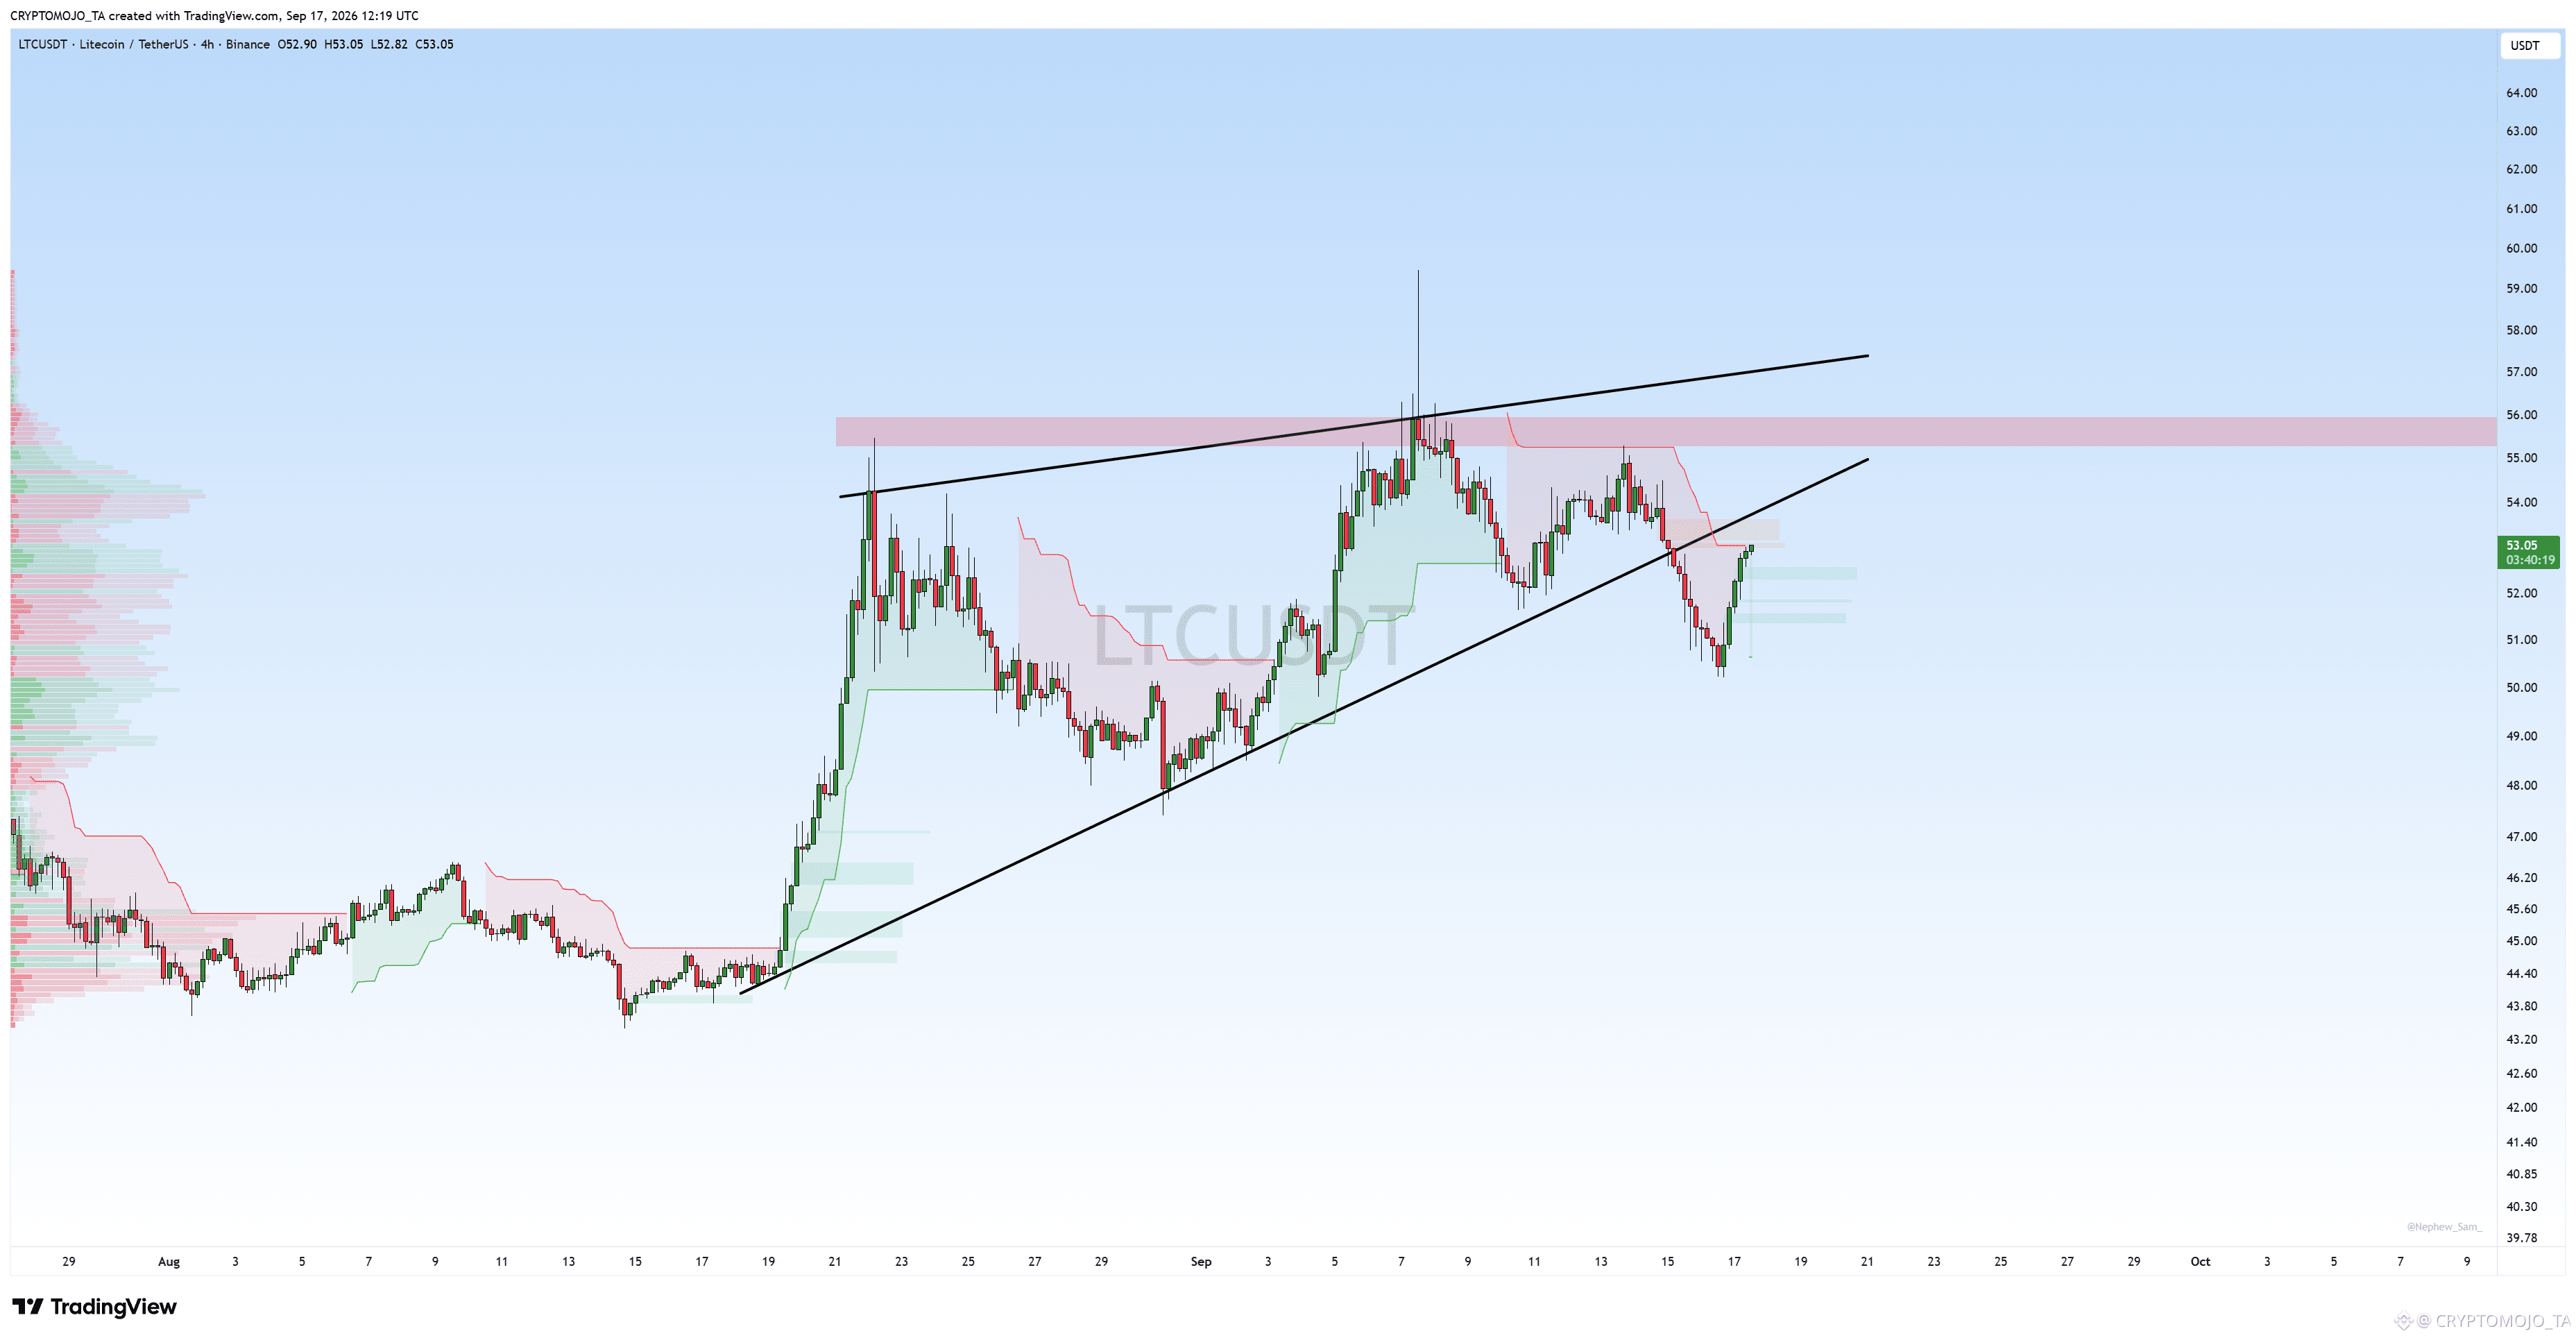
$LTC Update
#LTC bounced strongly from the $50.5–$51 area and is now back around $53.But price is still below the rising trendline that was acting as support.
This makes $53.5–$54.5 an important zone to reclaim.
If LTC breaks back above the trendline, the next major resistance sits around $55.5–$56.
If rejected here, another retest of $51–$50.5 remains possible.
For now, $54 is the level I’m watching for confirmation.
$LTC Update
#LTC bounced strongly from the $50.5–$51 area and is now back around $53.But price is still below the rising trendline that was acting as support.
This makes $53.5–$54.5 an important zone to reclaim.
If LTC breaks back above the trendline, the next major resistance sits around $55.5–$56.
If rejected here, another retest of $51–$50.5 remains possible.
For now, $54 is the level I’m watching for confirmation.
#LTC bounced strongly from the $50.5–$51 area and is now back around $53.But price is still below the rising trendline that was acting as support.
This makes $53.5–$54.5 an important zone to reclaim.
If LTC breaks back above the trendline, the next major resistance sits around $55.5–$56.
If rejected here, another retest of $51–$50.5 remains possible.
For now, $54 is the level I’m watching for confirmation.
1
212
·
--
Bearish
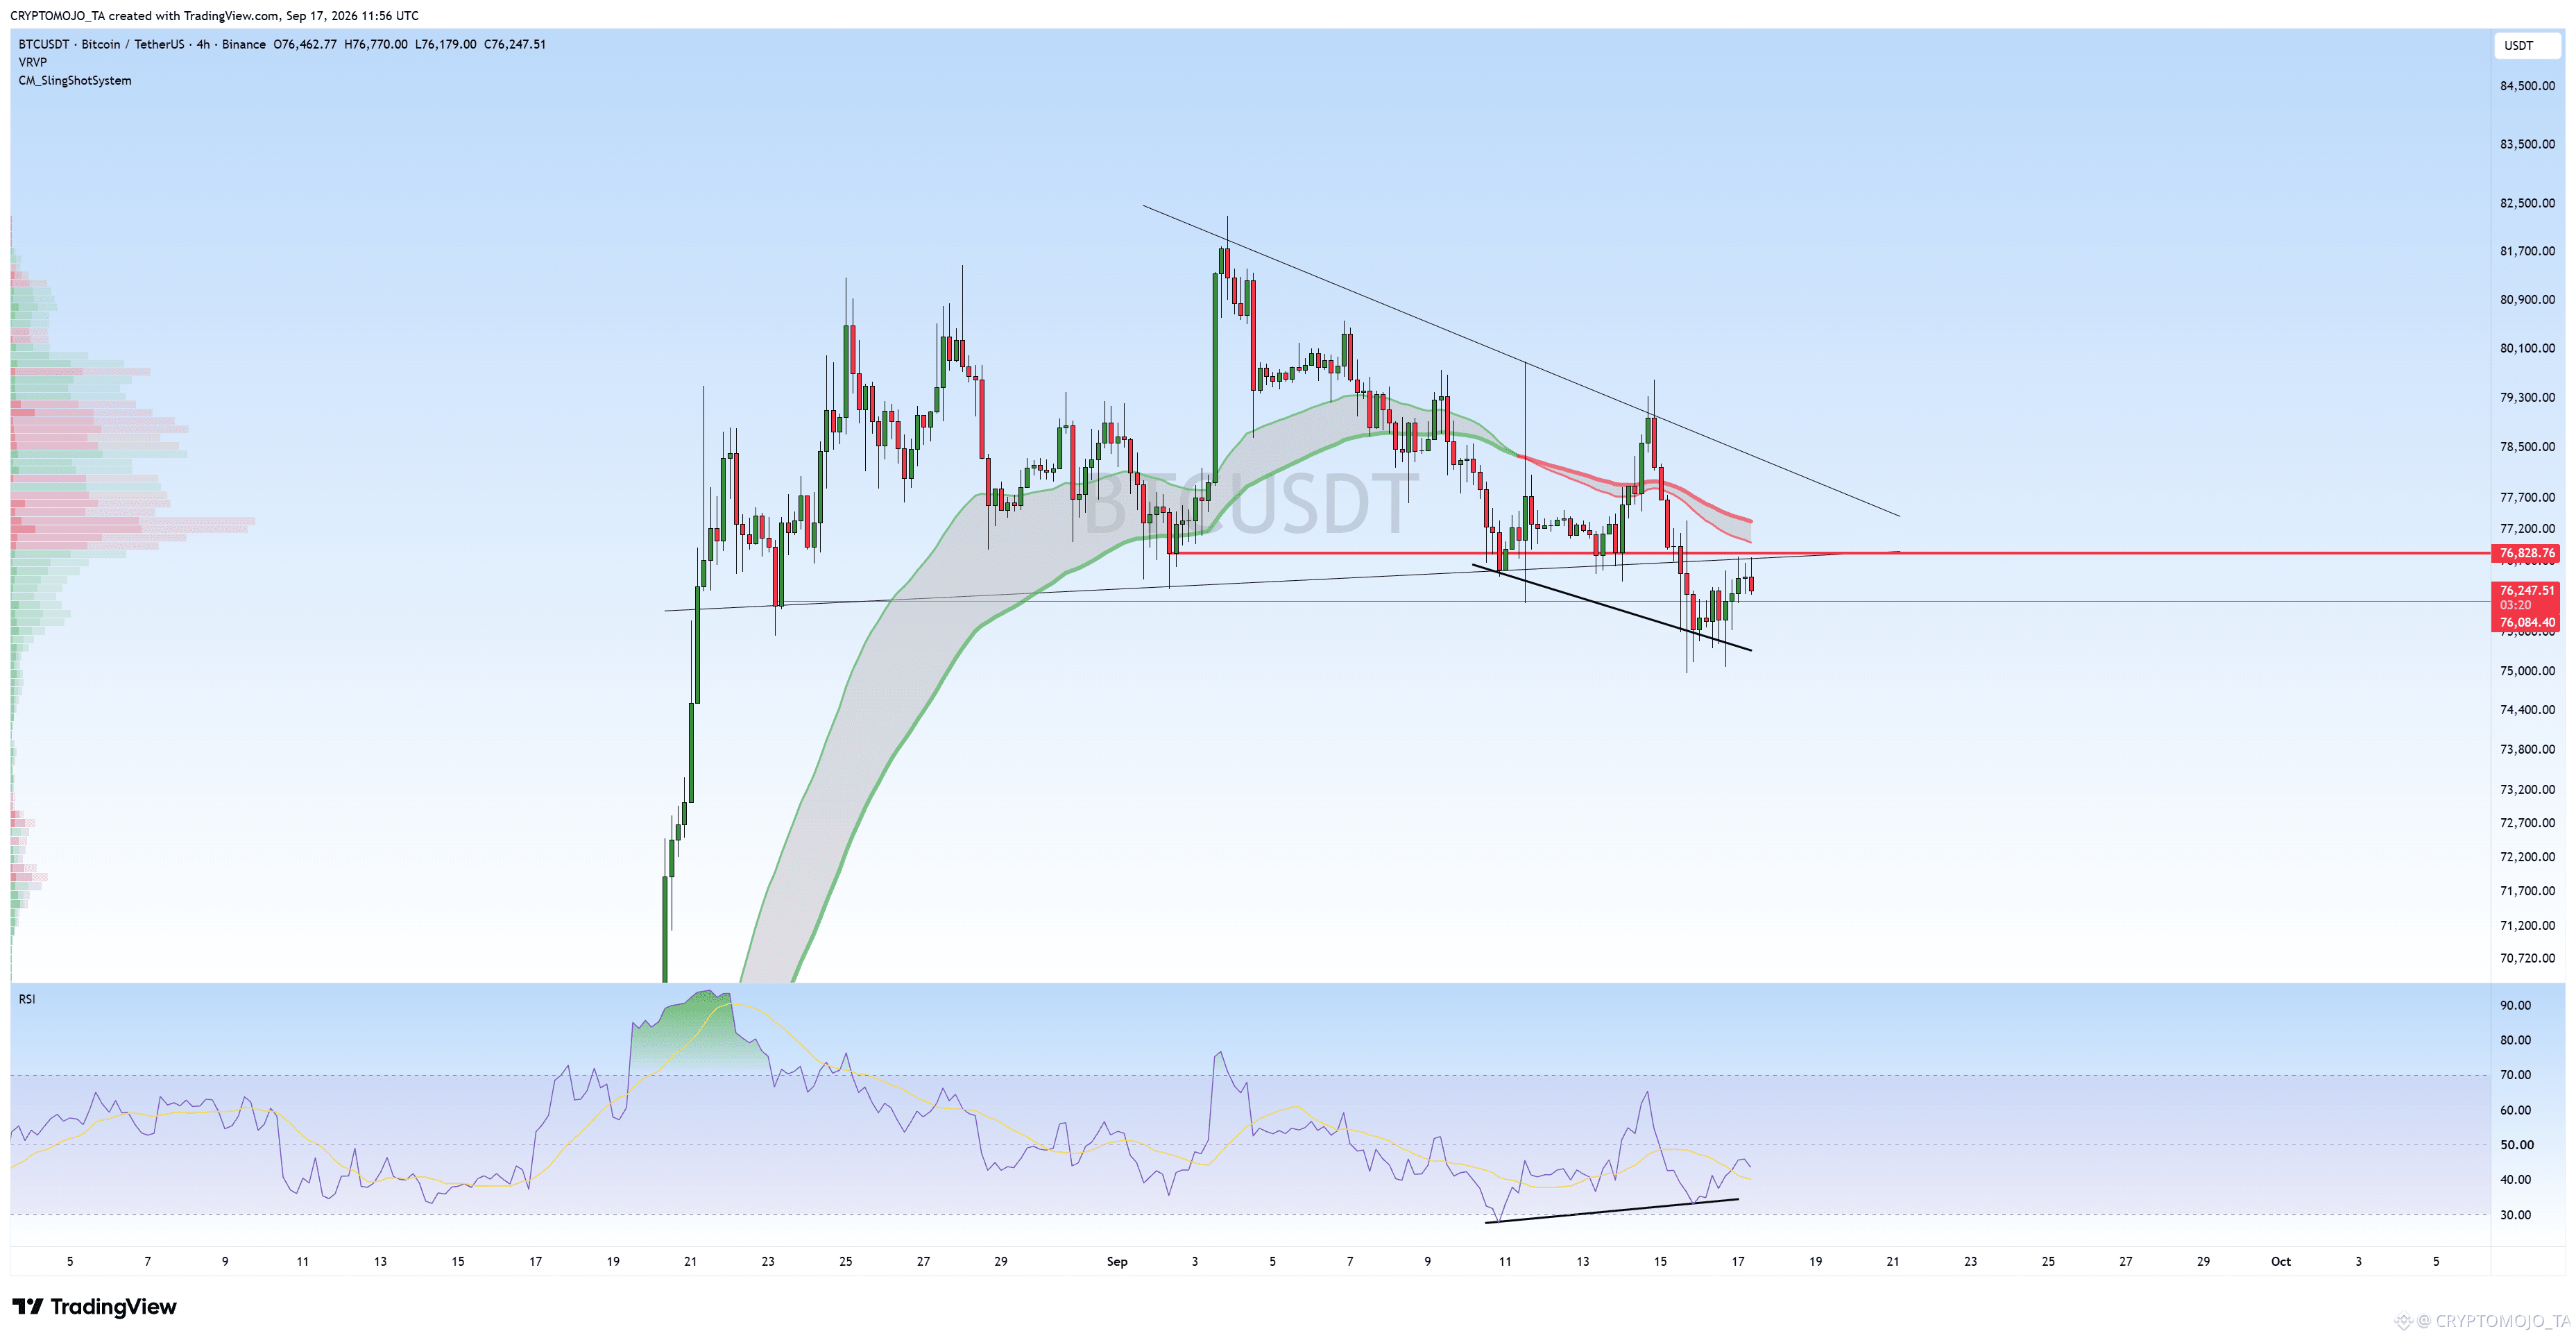
$BTC is still trading below the key $76.8K resistance.
We’re seeing a small bullish RSI divergence from the recent lows, but price is yet to reclaim the resistance and descending trendline.
A breakout above $76.8K could open the way toward $78K–$80K. Until then, this remains a key level to watch.
$BTC is still trading below the key $76.8K resistance.
We’re seeing a small bullish RSI divergence from the recent lows, but price is yet to reclaim the resistance and descending trendline.
A breakout above $76.8K could open the way toward $78K–$80K. Until then, this remains a key level to watch.
We’re seeing a small bullish RSI divergence from the recent lows, but price is yet to reclaim the resistance and descending trendline.
A breakout above $76.8K could open the way toward $78K–$80K. Until then, this remains a key level to watch.
101
·
--
Bearish
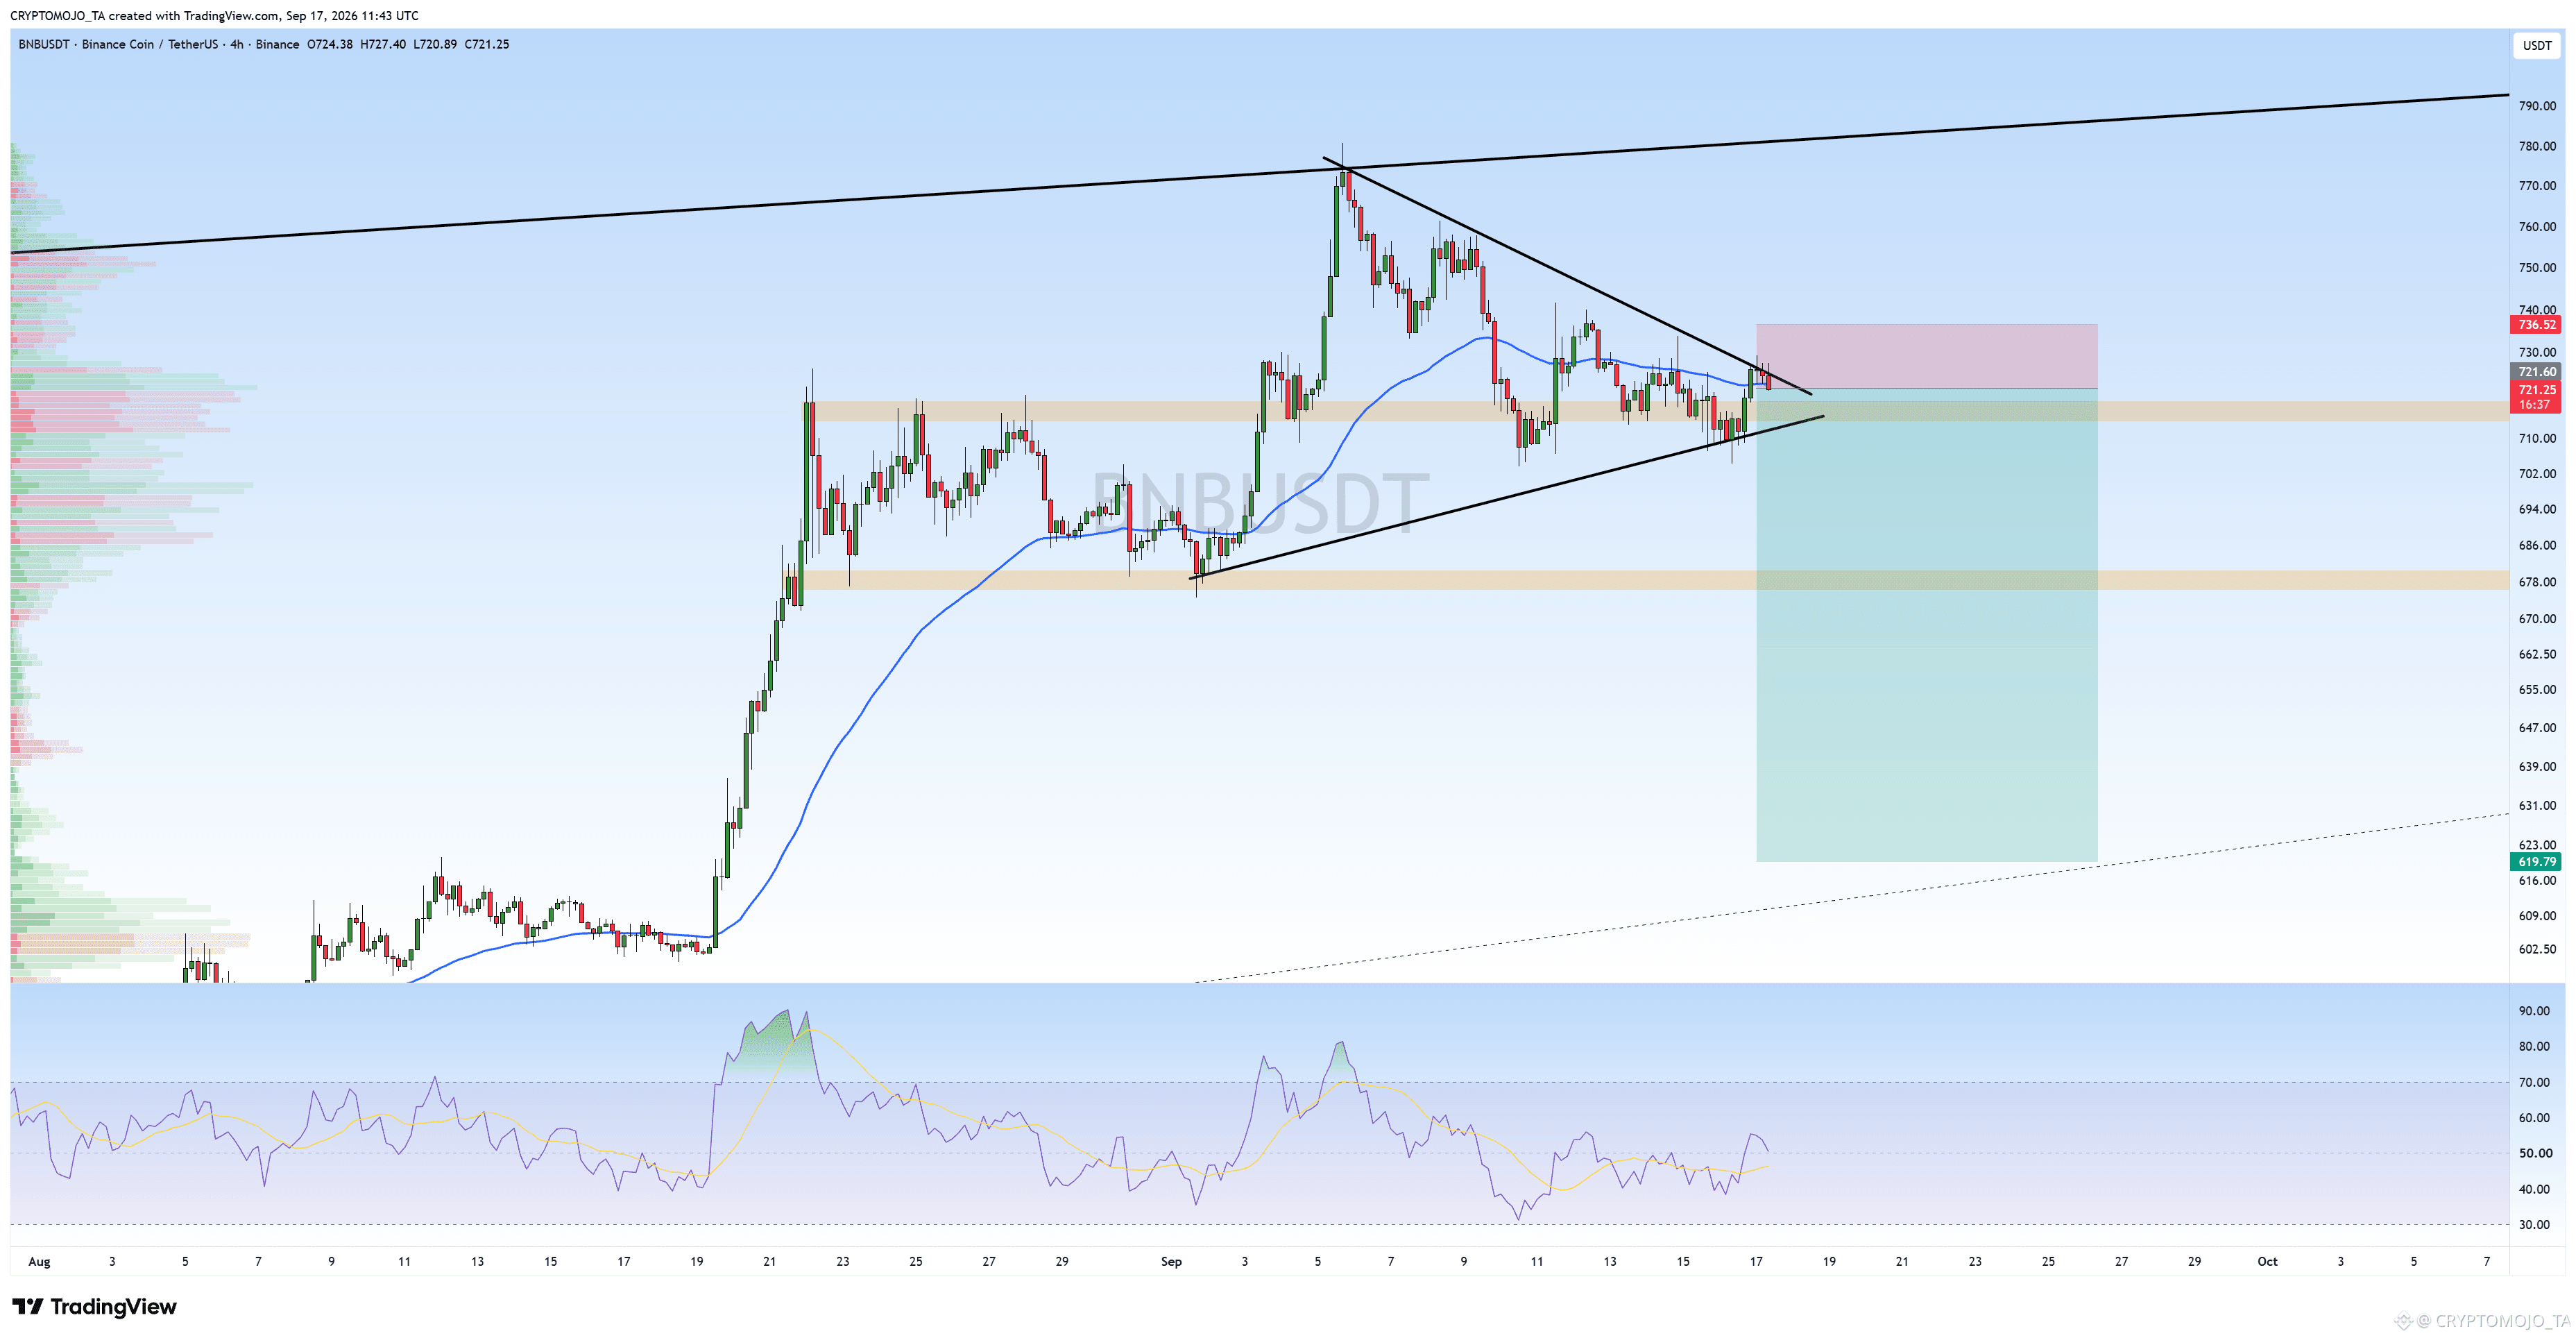
$BNB is sitting at a critical resistance zone, and the rejection here could be important.
A breakdown below $710–$712 could trigger a sharp move toward the lower levels around $680 and potentially $620.
I’ve taken a short position around CMP and also placed additional short orders at $724.91 and $726.56, with a tight SL at $729.57, roughly 2% away.
With such a tight invalidation, this gives the setup a good risk-to-reward profile if the breakdown confirms.
Let’s see how this plays out.
#BNB
$BNB is sitting at a critical resistance zone, and the rejection here could be important.
A breakdown below $710–$712 could trigger a sharp move toward the lower levels around $680 and potentially $620.
I’ve taken a short position around CMP and also placed additional short orders at $724.91 and $726.56, with a tight SL at $729.57, roughly 2% away.
With such a tight invalidation, this gives the setup a good risk-to-reward profile if the breakdown confirms.
Let’s see how this plays out.
#BNB
A breakdown below $710–$712 could trigger a sharp move toward the lower levels around $680 and potentially $620.
I’ve taken a short position around CMP and also placed additional short orders at $724.91 and $726.56, with a tight SL at $729.57, roughly 2% away.
With such a tight invalidation, this gives the setup a good risk-to-reward profile if the breakdown confirms.
Let’s see how this plays out.
#BNB
175
Log in to explore more content
Join global crypto users on Binance Square
⚡️ Get latest and useful information about crypto.
💬 Trusted by the world’s largest crypto exchange.
👍 Discover real insights from verified creators.
Email / Phone number