
CRYPTO SHARKSS
1k Posts

CRYPTO SHARKSS
Report
Block User
Crypto Trading Trainer / Blockchain / Airdrop / Crypto News / NFT
106 Following
215 Followers
1.2K+ Liked
Posts
All
Videos
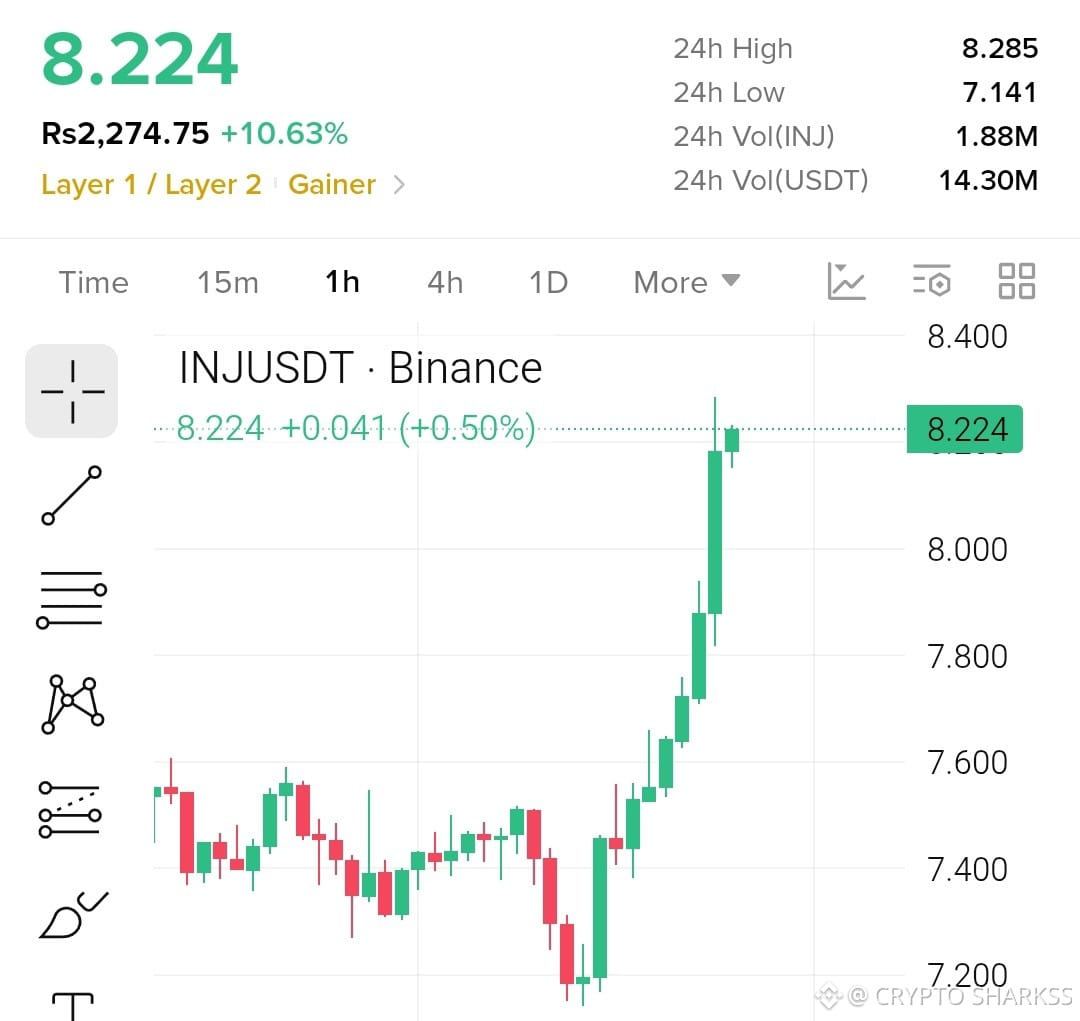
$INJ Long trade ‼️‼️
{future}(INJUSDT)
Entry: 8.05 - 8.224
TP1: 8.285
TP2: 8.40
TP3: 8.60
TP4: 8.85
SL: 7.85
$INJ Long trade ‼️‼️
Entry: 8.05 - 8.224
TP1: 8.285
TP2: 8.40
TP3: 8.60
TP4: 8.85
SL: 7.85
Entry: 8.05 - 8.224
TP1: 8.285
TP2: 8.40
TP3: 8.60
TP4: 8.85
SL: 7.85
1
31
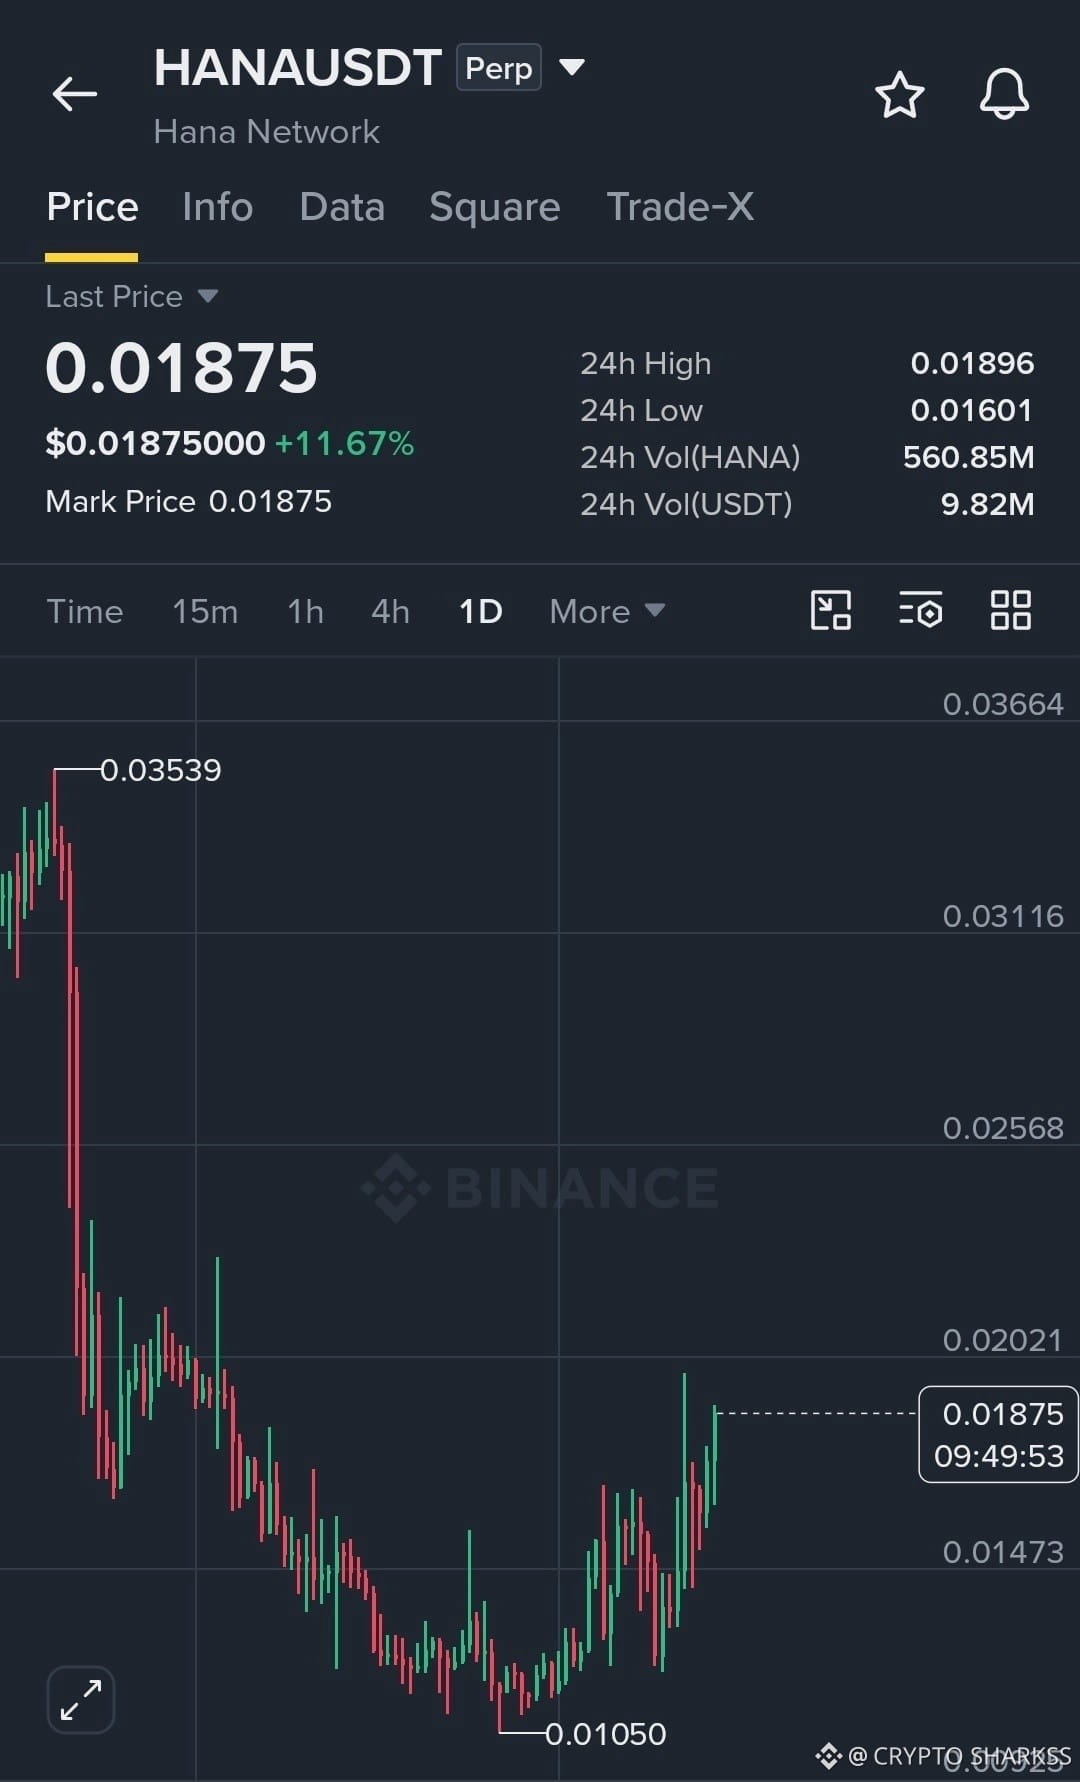
🚀 $HANA LONG POSITION – Bulls are aiming for the next resistance level...
Entry: 0.01820 – 0.01880
TP1: 0.02020
TP2: 0.02250
TP3: 0.02560
Final target: 0.03000
SL: 0.01450
Trade rationale:
$HANA is trading around 0.01875 on the Binance daily chart, showing a solid recovery after recently bottoming near 0.01050.
Buyers are gaining strength and pushing the price toward the key resistance zone around 0.02020. If the price holds above 0.01800 and breaks through 0.02020, further upside toward 0.02250–0.02560 is possible.
A confirmed breakout above 0.02560 could pave the way to the next resistance near 0.03000.
If the price drops below 0.01590, the bullish scenario may become invalid.
Resistance still lies ahead... Use a stop-loss and manage your risk carefully.
Trade $HANA here...👇
{future}(HANAUSDT)
🚀 $HANA LONG POSITION – Bulls are aiming for the next resistance level...
Entry: 0.01820 – 0.01880
TP1: 0.02020
TP2: 0.02250
TP3: 0.02560
Final target: 0.03000
SL: 0.01450
Trade rationale:
$HANA is trading around 0.01875 on the Binance daily chart, showing a solid recovery after recently bottoming near 0.01050.
Buyers are gaining strength and pushing the price toward the key resistance zone around 0.02020. If the price holds above 0.01800 and breaks through 0.02020, further upside toward 0.02250–0.02560 is possible.
A confirmed breakout above 0.02560 could pave the way to the next resistance near 0.03000.
If the price drops below 0.01590, the bullish scenario may become invalid.
Resistance still lies ahead... Use a stop-loss and manage your risk carefully.
Trade $HANA here...👇
Entry: 0.01820 – 0.01880
TP1: 0.02020
TP2: 0.02250
TP3: 0.02560
Final target: 0.03000
SL: 0.01450
Trade rationale:
$HANA is trading around 0.01875 on the Binance daily chart, showing a solid recovery after recently bottoming near 0.01050.
Buyers are gaining strength and pushing the price toward the key resistance zone around 0.02020. If the price holds above 0.01800 and breaks through 0.02020, further upside toward 0.02250–0.02560 is possible.
A confirmed breakout above 0.02560 could pave the way to the next resistance near 0.03000.
If the price drops below 0.01590, the bullish scenario may become invalid.
Resistance still lies ahead... Use a stop-loss and manage your risk carefully.
Trade $HANA here...👇
1
14
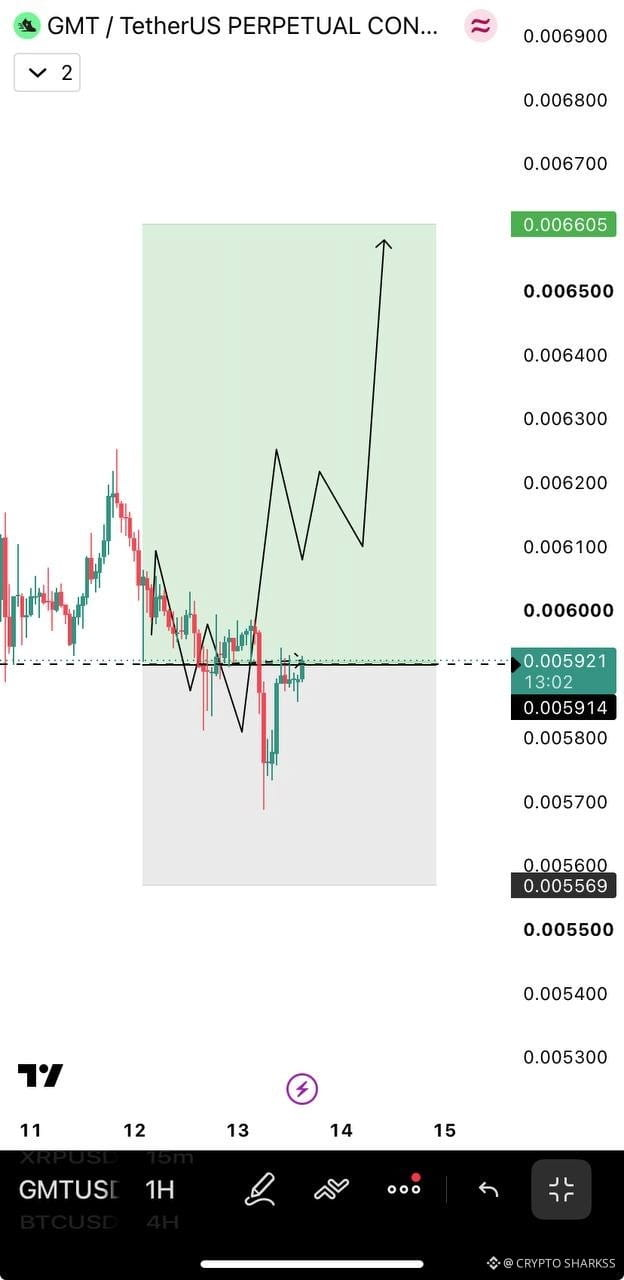
📈$GMT is holding up pretty well!
{future}(GMTUSDT)
It's clear that a major player continues to hold the asset despite the market situation.
I'm staying in the position and waiting to see how things develop.
📈$GMT is holding up pretty well!
It's clear that a major player continues to hold the asset despite the market situation.
I'm staying in the position and waiting to see how things develop.
It's clear that a major player continues to hold the asset despite the market situation.
I'm staying in the position and waiting to see how things develop.
1
24
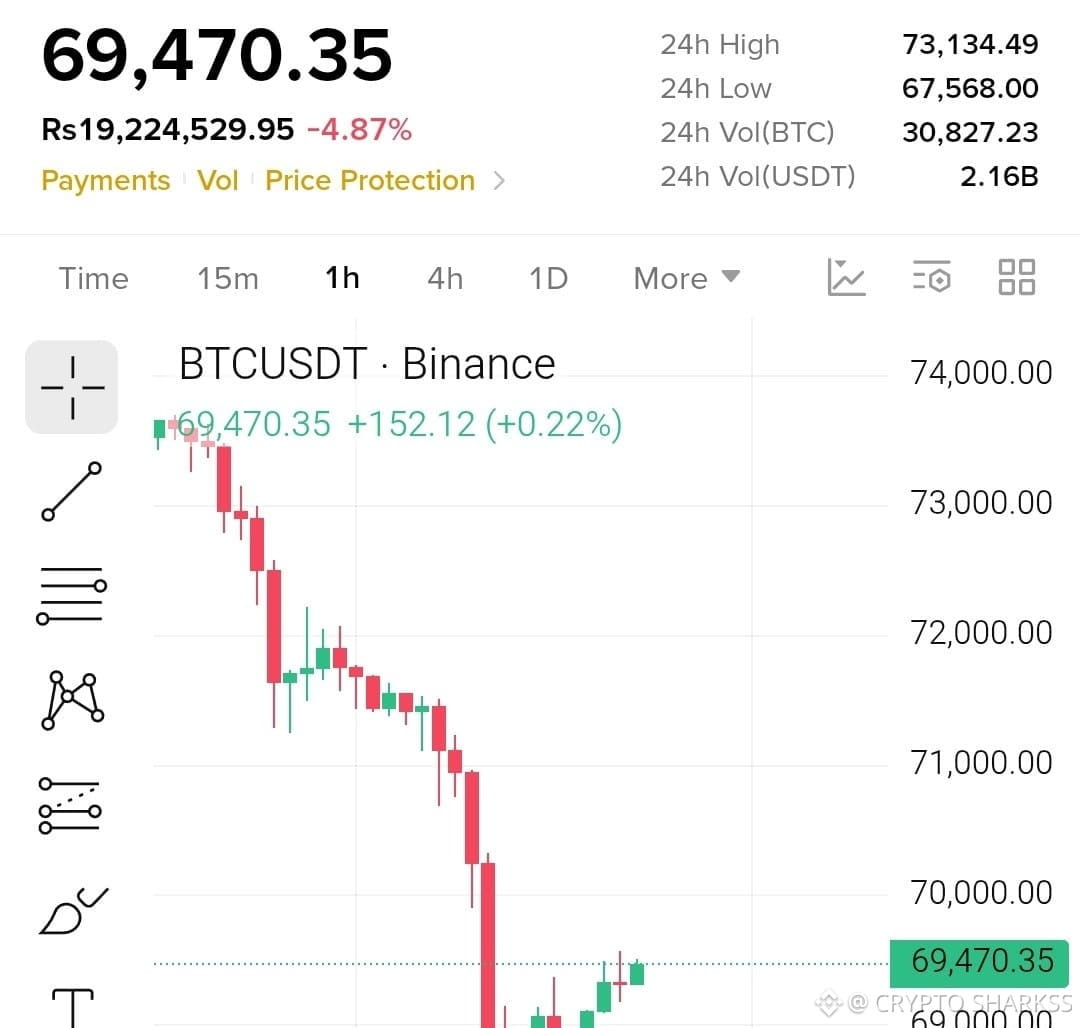
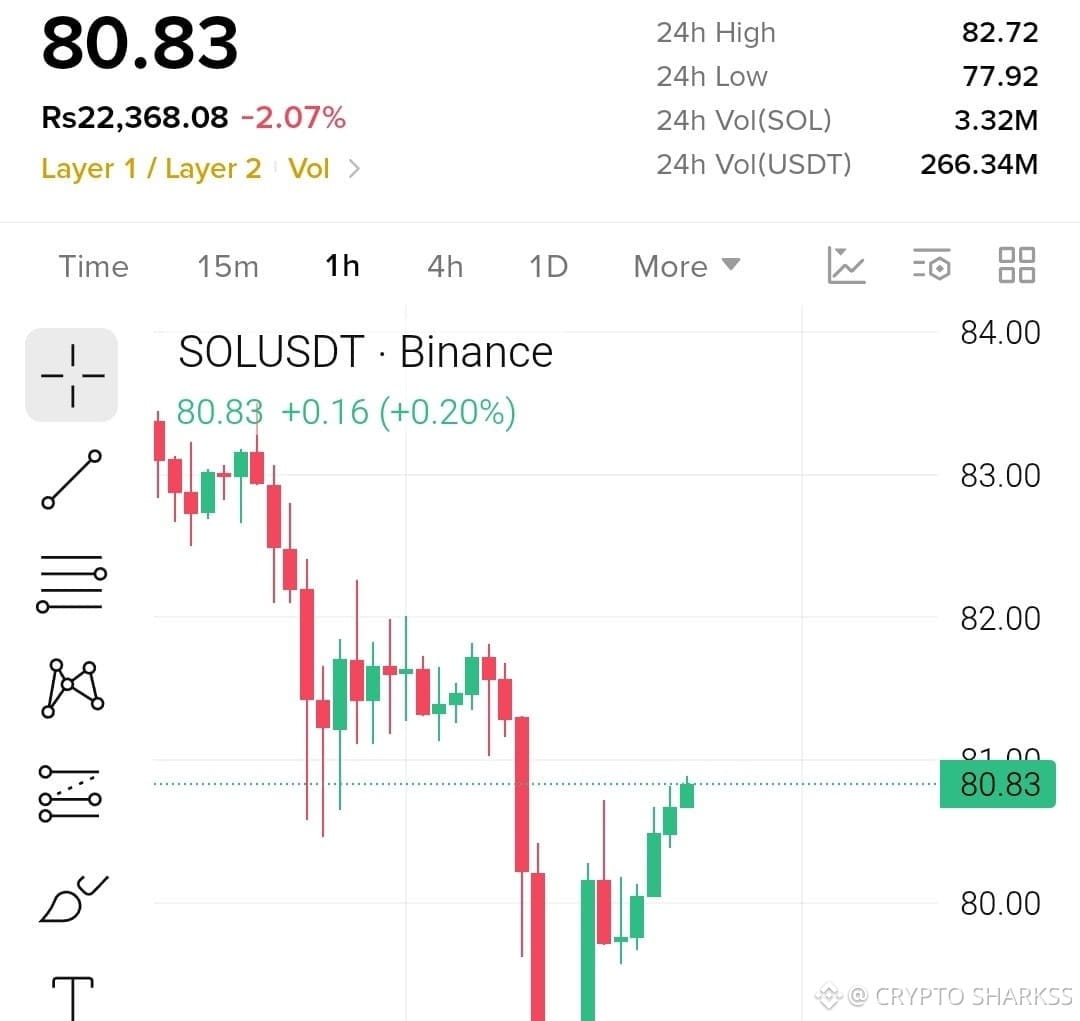
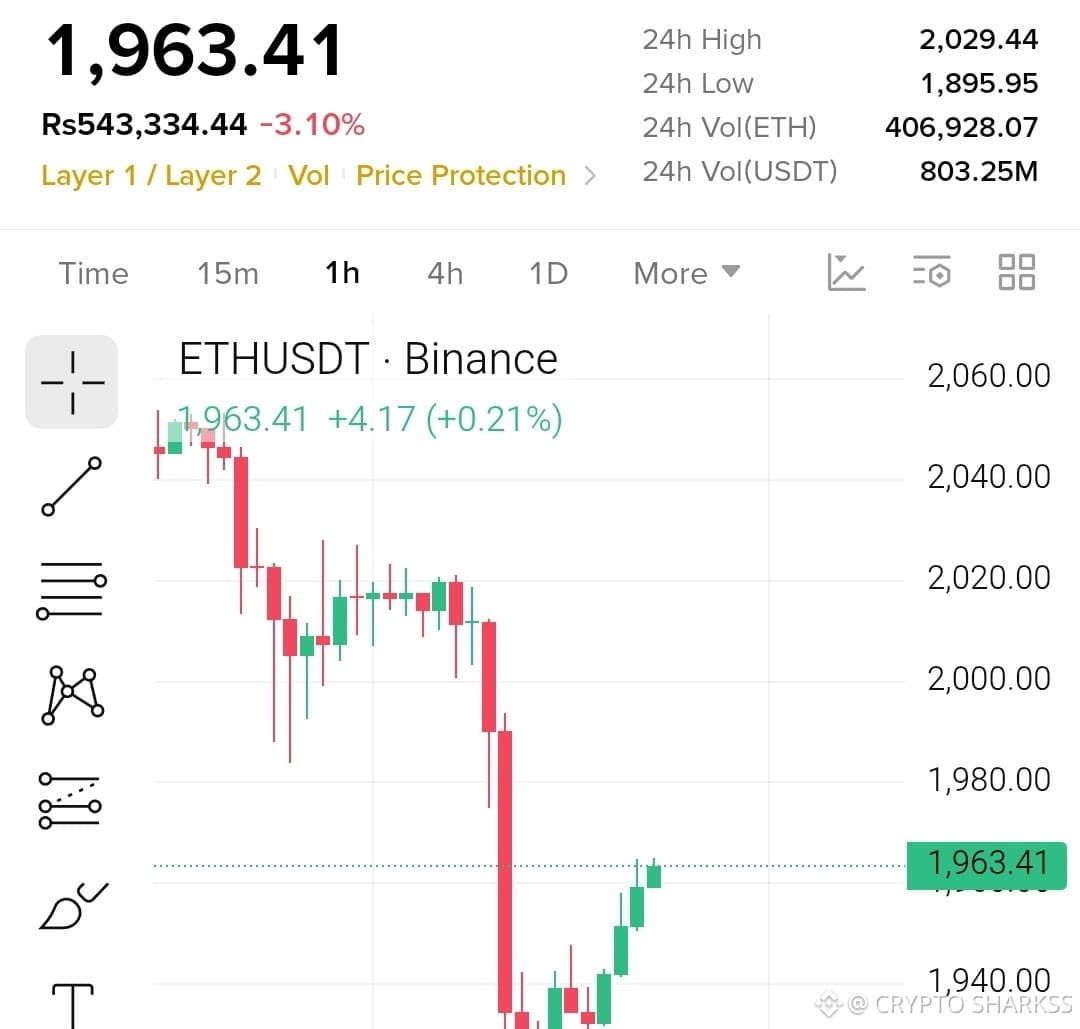
🚨The guy's long position $BTC l $ETH l $SOL now
ETH long trade
Entry: 1940.00 - 1963.41
Target 1: 1985.00
Target 2: 2000.00
Target 3: 2029.00
Target 4: 2060.00
Stop-loss: 1895.00
SOL long trade
Entry: 79.80 - 80.83
Target 1: 81.80
Target 2: 82.72
Target 3: 84.00
Target 4: 86.00
Stop-loss: 77.90
BTC long trade
Entry: 68,800.00 - 69,470.35
Target 1: 70,000.00
Target 2: 71,000.00
Target 3: 72,000.00
Target 4: 73,134.00
Stop-loss: 67,500.00
🚨The guy's long position $BTC l $ETH l $SOL now
ETH long trade
Entry: 1940.00 - 1963.41
Target 1: 1985.00
Target 2: 2000.00
Target 3: 2029.00
Target 4: 2060.00
Stop-loss: 1895.00
SOL long trade
Entry: 79.80 - 80.83
Target 1: 81.80
Target 2: 82.72
Target 3: 84.00
Target 4: 86.00
Stop-loss: 77.90
BTC long trade
Entry: 68,800.00 - 69,470.35
Target 1: 70,000.00
Target 2: 71,000.00
Target 3: 72,000.00
Target 4: 73,134.00
Stop-loss: 67,500.00
ETH long trade
Entry: 1940.00 - 1963.41
Target 1: 1985.00
Target 2: 2000.00
Target 3: 2029.00
Target 4: 2060.00
Stop-loss: 1895.00
SOL long trade
Entry: 79.80 - 80.83
Target 1: 81.80
Target 2: 82.72
Target 3: 84.00
Target 4: 86.00
Stop-loss: 77.90
BTC long trade
Entry: 68,800.00 - 69,470.35
Target 1: 70,000.00
Target 2: 71,000.00
Target 3: 72,000.00
Target 4: 73,134.00
Stop-loss: 67,500.00
1
12
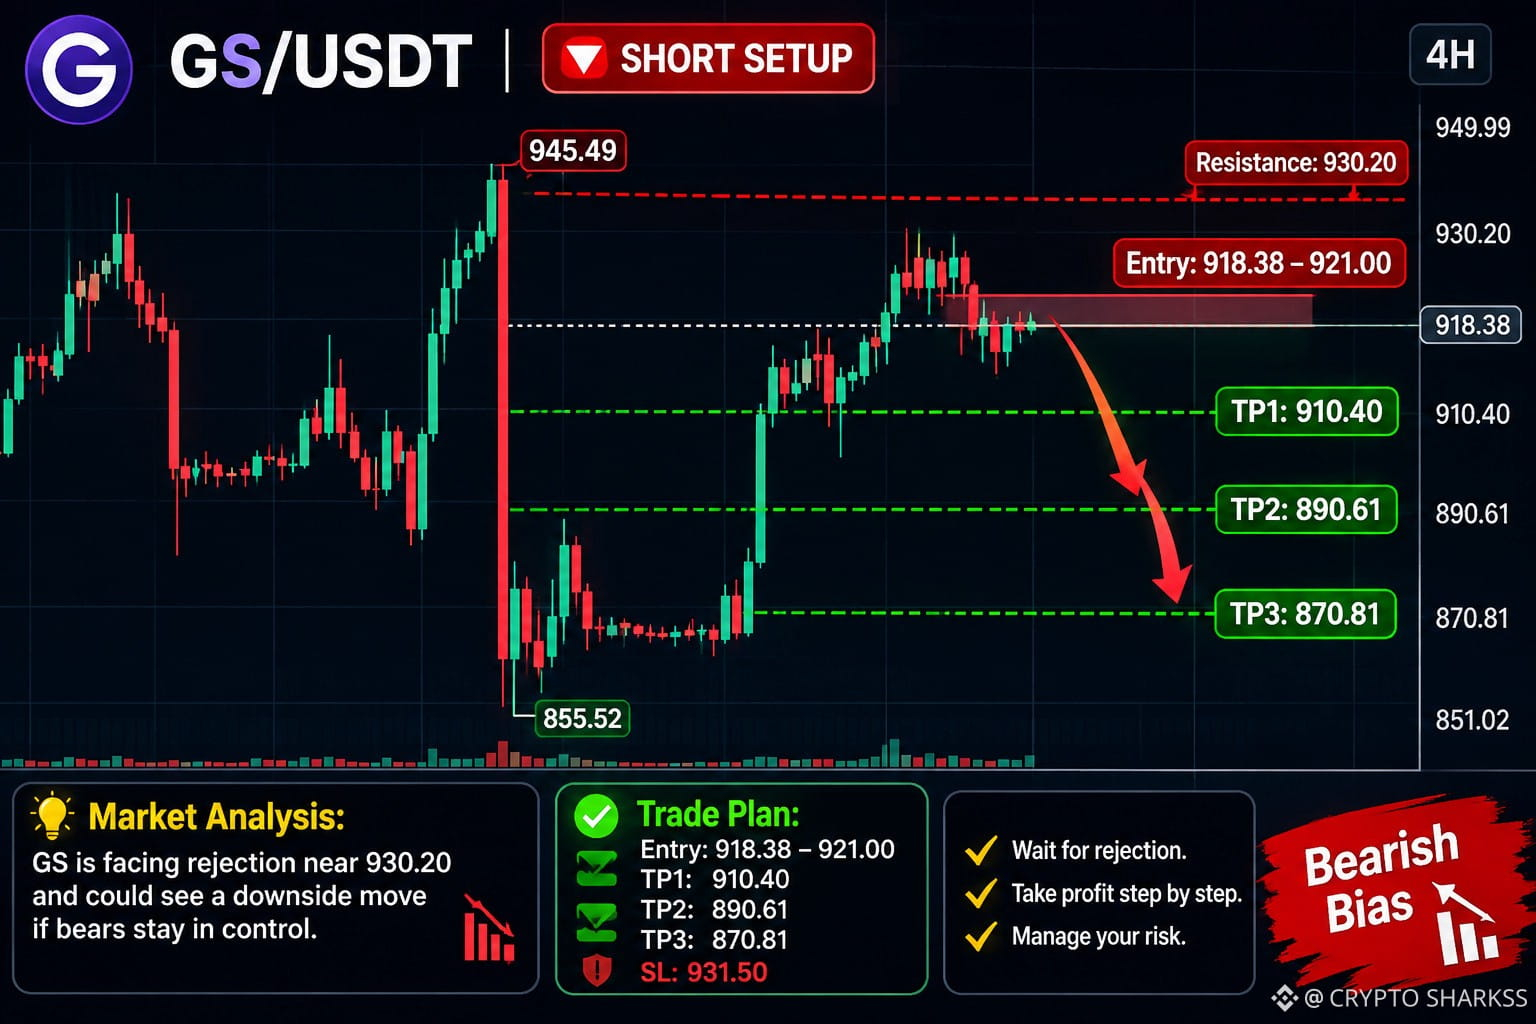
$GS SHORT IDEA 📉
{future}(GSUSDT)
GS is struggling to hold its recent upward momentum. Sellers are showing strength near the 930 resistance level.
I’m watching for a potential move lower if the price fails to reclaim and hold above resistance.
Entry: 918–922
TP1: 910
TP2: 903
TP3: 897
SL: 927
$GS SHORT IDEA 📉
GS is struggling to hold its recent upward momentum. Sellers are showing strength near the 930 resistance level.
I’m watching for a potential move lower if the price fails to reclaim and hold above resistance.
Entry: 918–922
TP1: 910
TP2: 903
TP3: 897
SL: 927
GS is struggling to hold its recent upward momentum. Sellers are showing strength near the 930 resistance level.
I’m watching for a potential move lower if the price fails to reclaim and hold above resistance.
Entry: 918–922
TP1: 910
TP2: 903
TP3: 897
SL: 927
1
25
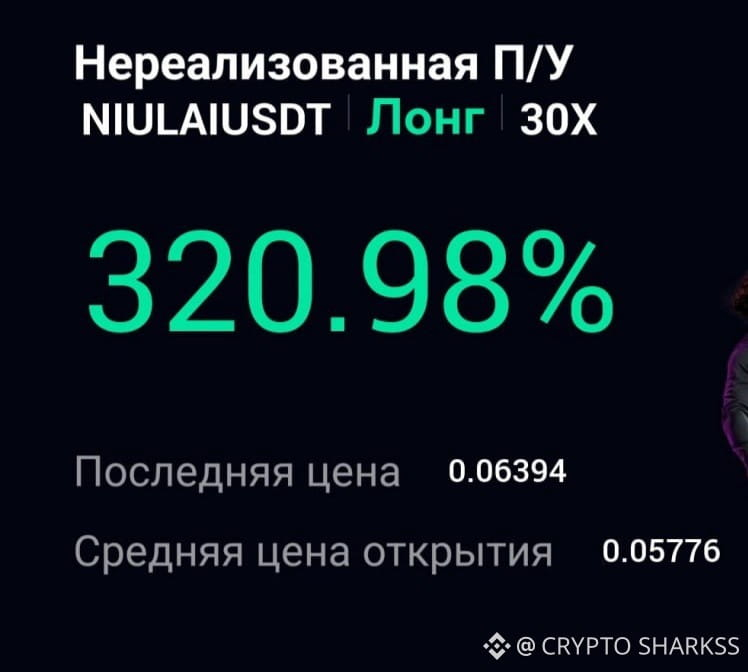
We hit the second take-profit right away🔥
Closed part of the position at take profit; moving the rest to breakeven🐋
We hit the second take-profit right away🔥
Closed part of the position at take profit; moving the rest to breakeven🐋
Closed part of the position at take profit; moving the rest to breakeven🐋
1
22
STOP..... STOP..... STOP 🚨
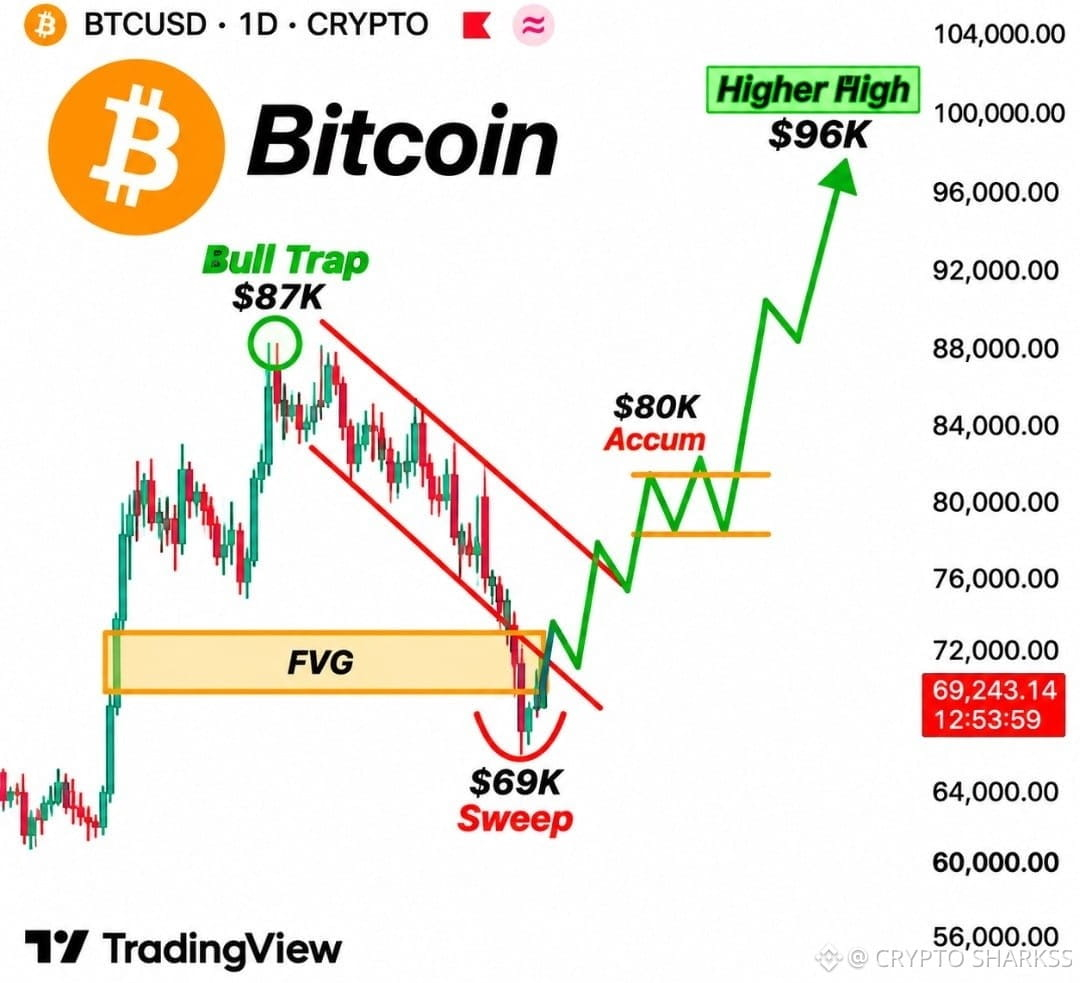
$BTC IT’S MOVING EXACTLY AS I PREDICTED
I’ve been waiting for a liquidity sweep at $69K for several weeks.
BTC has finally taken that liquidity, and now I’m watching this level very closely.
I don’t think this move is over yet, but we’re approaching an area where the next major reversal could begin.
My plan for now:
→ Liquidity at $69K swept
→ Waiting for a convincing reclaim above the level and a bear trap
→ Recovery above $80K
→ Liquidity at $96K becomes the next target
The key now is how BTC reacts after the liquidity sweep.
I want to see buyers step in and turn this breakdown into a failed attempt to move lower.
That’s exactly the scenario I’ve been waiting for.
$ETH l
#WhatWillDriveCryptoandStocks’NextRebound? #Anthropic’s6xIPODemandSignalsPotentialRecordRaise
#HuangExitNvidiaStrategyInFocus
STOP..... STOP..... STOP 🚨
$BTC IT’S MOVING EXACTLY AS I PREDICTED
I’ve been waiting for a liquidity sweep at $69K for several weeks.
BTC has finally taken that liquidity, and now I’m watching this level very closely.
I don’t think this move is over yet, but we’re approaching an area where the next major reversal could begin.
My plan for now:
→ Liquidity at $69K swept
→ Waiting for a convincing reclaim above the level and a bear trap
→ Recovery above $80K
→ Liquidity at $96K becomes the next target
The key now is how BTC reacts after the liquidity sweep.
I want to see buyers step in and turn this breakdown into a failed attempt to move lower.
That’s exactly the scenario I’ve been waiting for.
$ETH l
#WhatWillDriveCryptoandStocks’NextRebound? #Anthropic’s6xIPODemandSignalsPotentialRecordRaise
#HuangExitNvidiaStrategyInFocus
$BTC IT’S MOVING EXACTLY AS I PREDICTED
I’ve been waiting for a liquidity sweep at $69K for several weeks.
BTC has finally taken that liquidity, and now I’m watching this level very closely.
I don’t think this move is over yet, but we’re approaching an area where the next major reversal could begin.
My plan for now:
→ Liquidity at $69K swept
→ Waiting for a convincing reclaim above the level and a bear trap
→ Recovery above $80K
→ Liquidity at $96K becomes the next target
The key now is how BTC reacts after the liquidity sweep.
I want to see buyers step in and turn this breakdown into a failed attempt to move lower.
That’s exactly the scenario I’ve been waiting for.
$ETH l
#WhatWillDriveCryptoandStocks’NextRebound? #Anthropic’s6xIPODemandSignalsPotentialRecordRaise
#HuangExitNvidiaStrategyInFocus
1
29
❗️SIGNAL
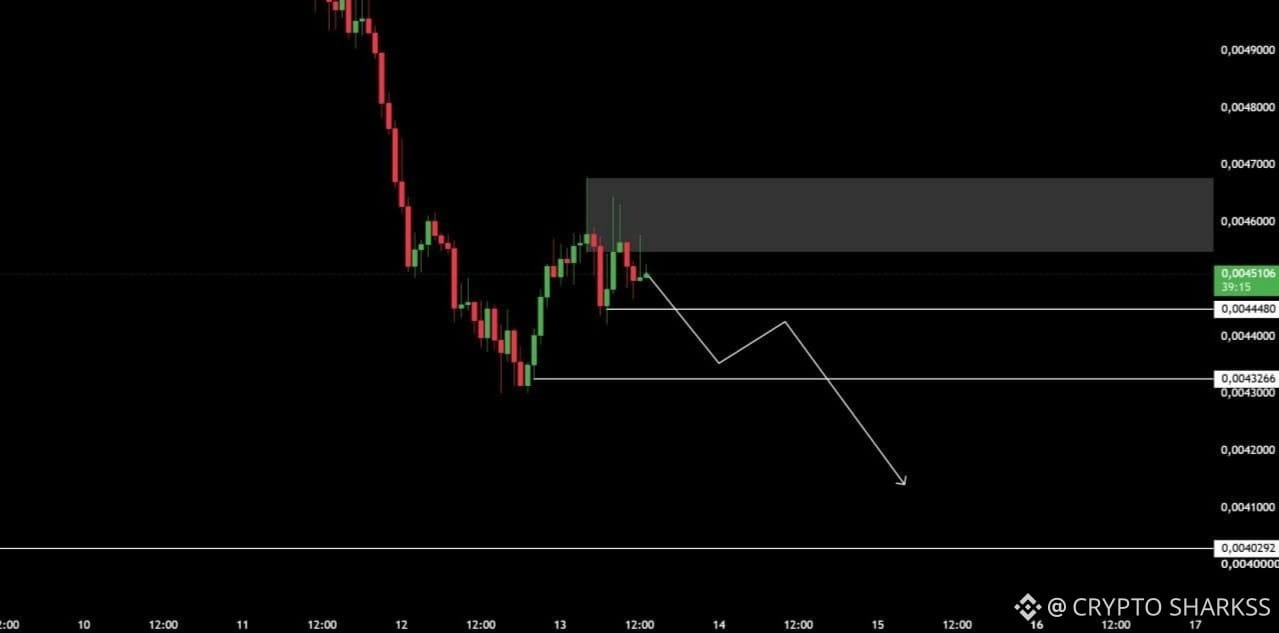
🗯 $1000PEPE SHORT 📉
{future}(1000PEPEUSDT)
leverage - 25x cross
entry price - 0.0044977-0.0045851$
targets - 0.0044480, 0.0043266, 0.0040292
stop - 0.0048121
❗️SIGNAL
🗯 $1000PEPE SHORT 📉
leverage - 25x cross
entry price - 0.0044977-0.0045851$
targets - 0.0044480, 0.0043266, 0.0040292
stop - 0.0048121
🗯 $1000PEPE SHORT 📉
leverage - 25x cross
entry price - 0.0044977-0.0045851$
targets - 0.0044480, 0.0043266, 0.0040292
stop - 0.0048121
1
40
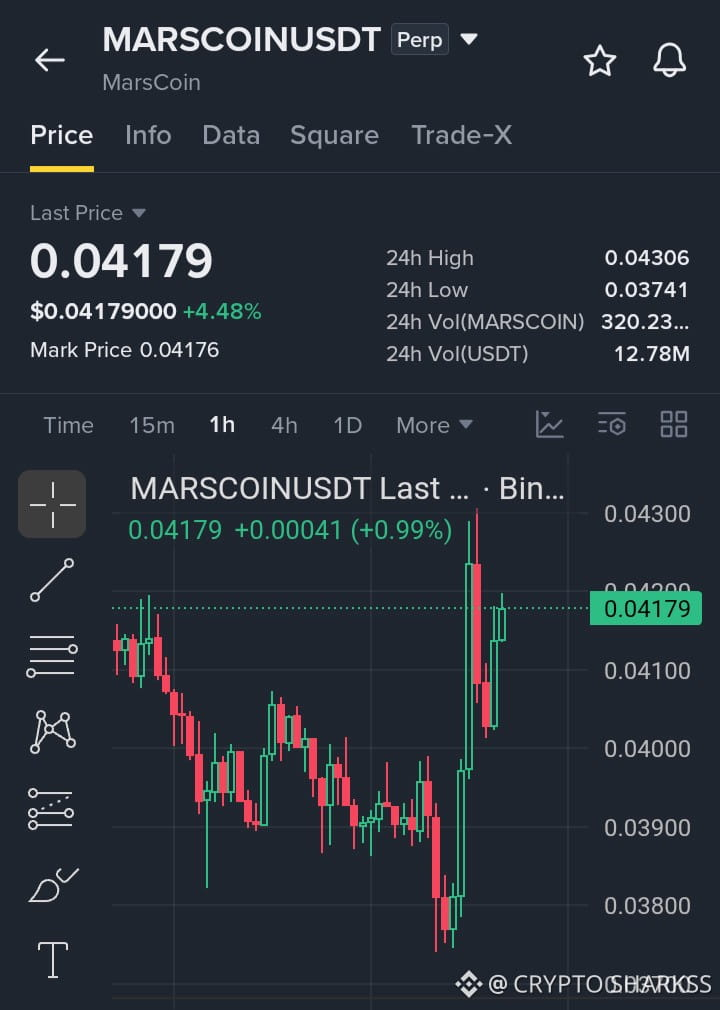
$MARSCOIN Attention... Open a large short position right now and soon you’ll earn money with me
Entry: 0.04200–0.04250
Stop-loss: 0.04350
Take-profit: 0.03800–0.03750
Sell $MARSCOIN 👇
{future}(MARSCOINUSDT)
Let’s take $MARSCOIN on the hourly chart as an example. A huge candle with a long wick at the 0.043 resistance level confirms strong selling pressure.
$MARSCOIN Attention... Open a large short position right now and soon you’ll earn money with me
Entry: 0.04200–0.04250
Stop-loss: 0.04350
Take-profit: 0.03800–0.03750
Sell $MARSCOIN 👇
Let’s take $MARSCOIN on the hourly chart as an example. A huge candle with a long wick at the 0.043 resistance level confirms strong selling pressure.
Entry: 0.04200–0.04250
Stop-loss: 0.04350
Take-profit: 0.03800–0.03750
Sell $MARSCOIN 👇
Let’s take $MARSCOIN on the hourly chart as an example. A huge candle with a long wick at the 0.043 resistance level confirms strong selling pressure.
1
30
🗣The U.S. controls the Strait of Hormuz and hundreds of billions of dollars belonging to Iran, so a deal with Tehran is no longer needed, Trump says.
🗣The U.S. controls the Strait of Hormuz and hundreds of billions of dollars belonging to Iran, so a deal with Tehran is no longer needed, Trump says.

1
120
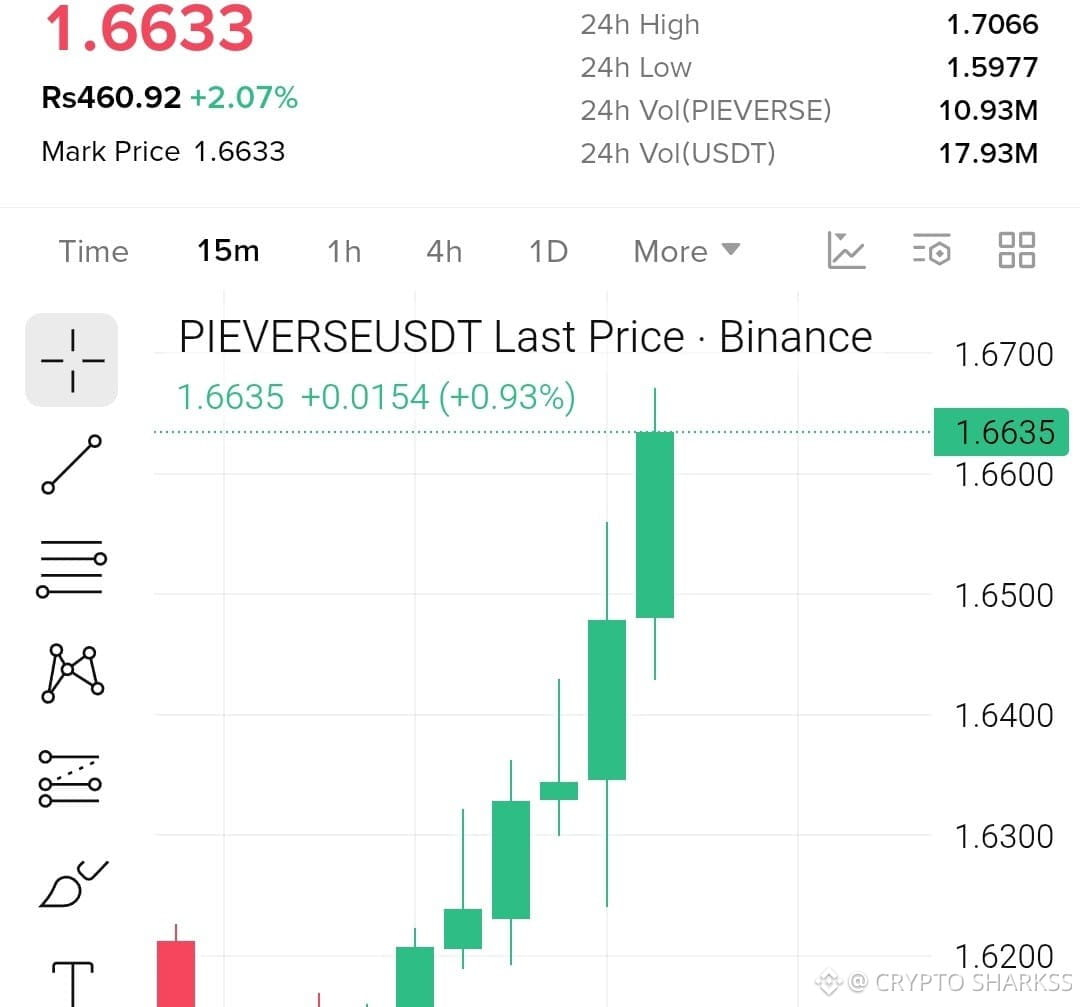
$PIEVERSE Long position
Entry: 1.6200 - 1.6633
Take-profit 1: 1.7060
Take-profit 2: 1.7600
Take-profit 3: 1.8300
Take-profit 4: 1.9200
Stop-loss: 1.5850
{future}(PIEVERSEUSDT)
$PIEVERSE Long position
Entry: 1.6200 - 1.6633
Take-profit 1: 1.7060
Take-profit 2: 1.7600
Take-profit 3: 1.8300
Take-profit 4: 1.9200
Stop-loss: 1.5850
Entry: 1.6200 - 1.6633
Take-profit 1: 1.7060
Take-profit 2: 1.7600
Take-profit 3: 1.8300
Take-profit 4: 1.9200
Stop-loss: 1.5850
1
15
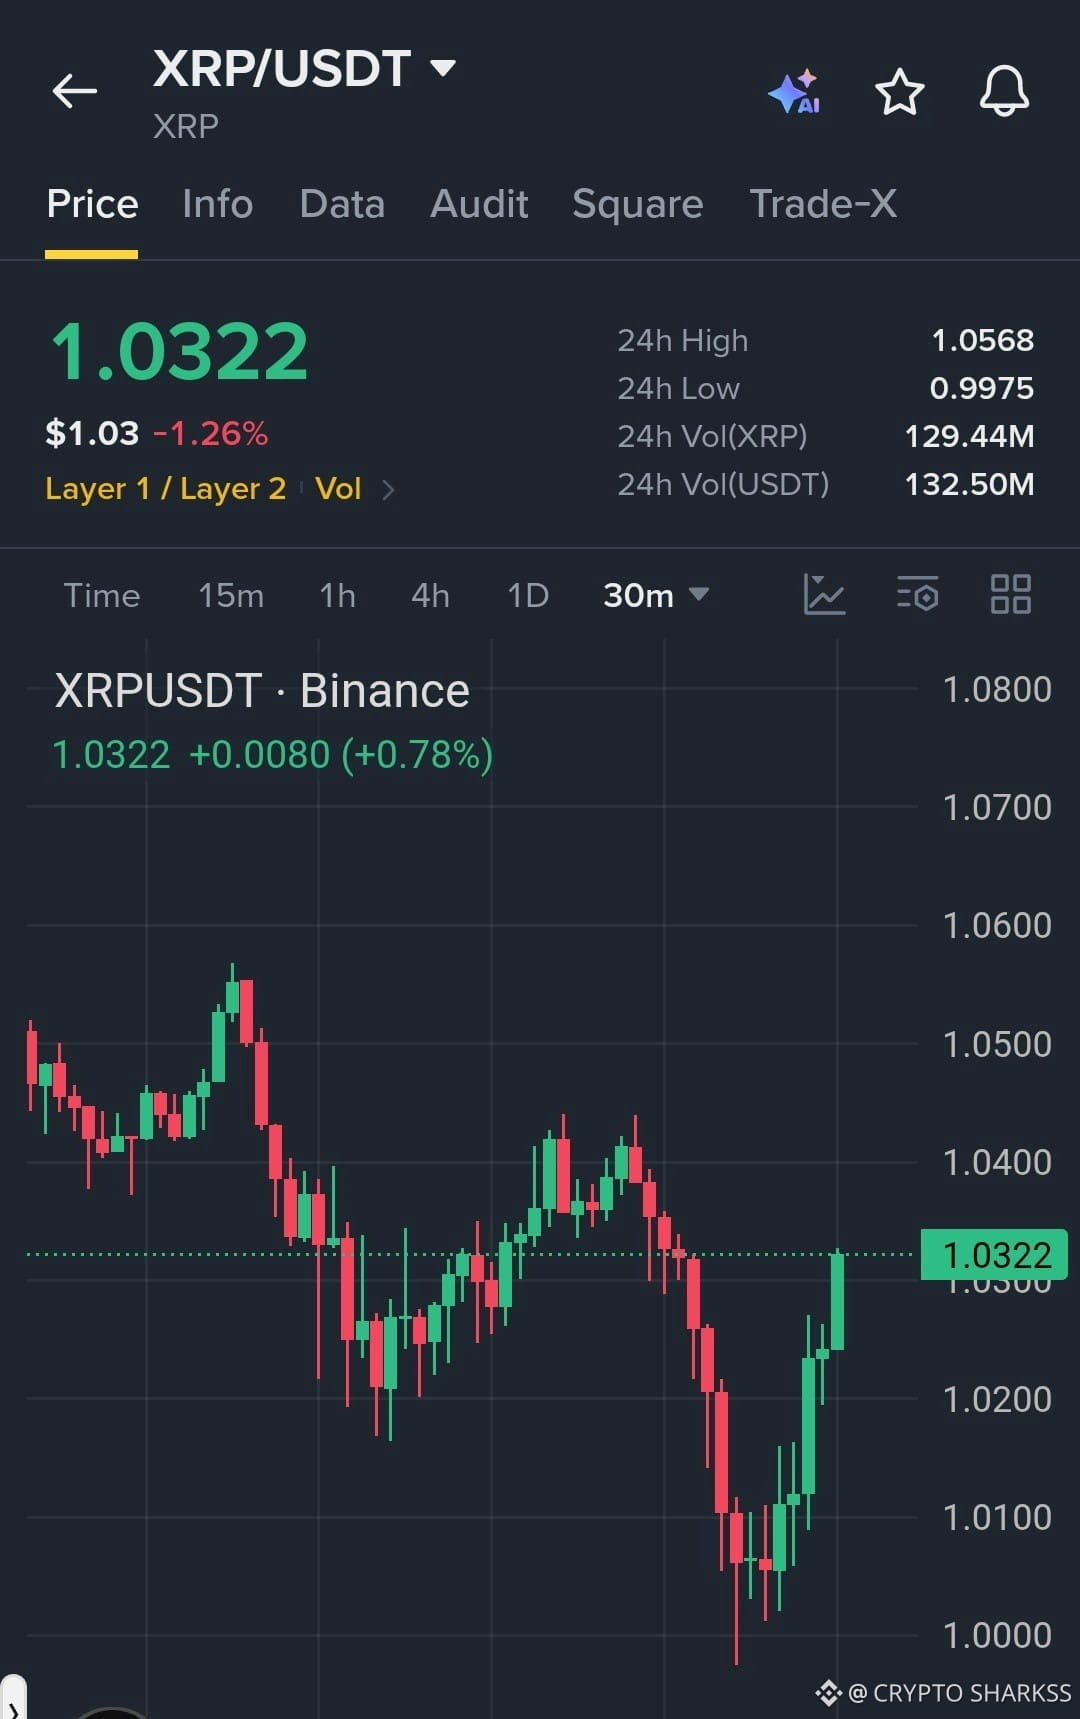
$XRP sharply bounced off the $1.00 level: buyers became more active and pushed the price back up to $1.0322. The 30-minute chart shows a strengthening bullish momentum.
A breakout above $1.034 could pave the way for further gains toward $1.042.
Trading plan — LONG
Entry: $1.030–$1.034 TP: $1.042 SL: $1.022
Wait for confirmation of the breakout before entering.
Buy and trade $XRP
{future}(XRPUSDT)
$XRP sharply bounced off the $1.00 level: buyers became more active and pushed the price back up to $1.0322. The 30-minute chart shows a strengthening bullish momentum.
A breakout above $1.034 could pave the way for further gains toward $1.042.
Trading plan — LONG
Entry: $1.030–$1.034 TP: $1.042 SL: $1.022
Wait for confirmation of the breakout before entering.
Buy and trade $XRP
A breakout above $1.034 could pave the way for further gains toward $1.042.
Trading plan — LONG
Entry: $1.030–$1.034 TP: $1.042 SL: $1.022
Wait for confirmation of the breakout before entering.
Buy and trade $XRP
1
17
$PEPE — Nobody needs it today. 🐸
Tomorrow, if its price reaches $1, everyone will regret not buying it earlier. 🚀
The biggest opportunities often arise before the hype begins. 🔥
{spot}(PEPEUSDT)
$PEPE — Nobody needs it today. 🐸
Tomorrow, if its price reaches $1, everyone will regret not buying it earlier. 🚀
The biggest opportunities often arise before the hype begins. 🔥
Tomorrow, if its price reaches $1, everyone will regret not buying it earlier. 🚀
The biggest opportunities often arise before the hype begins. 🔥

1
42
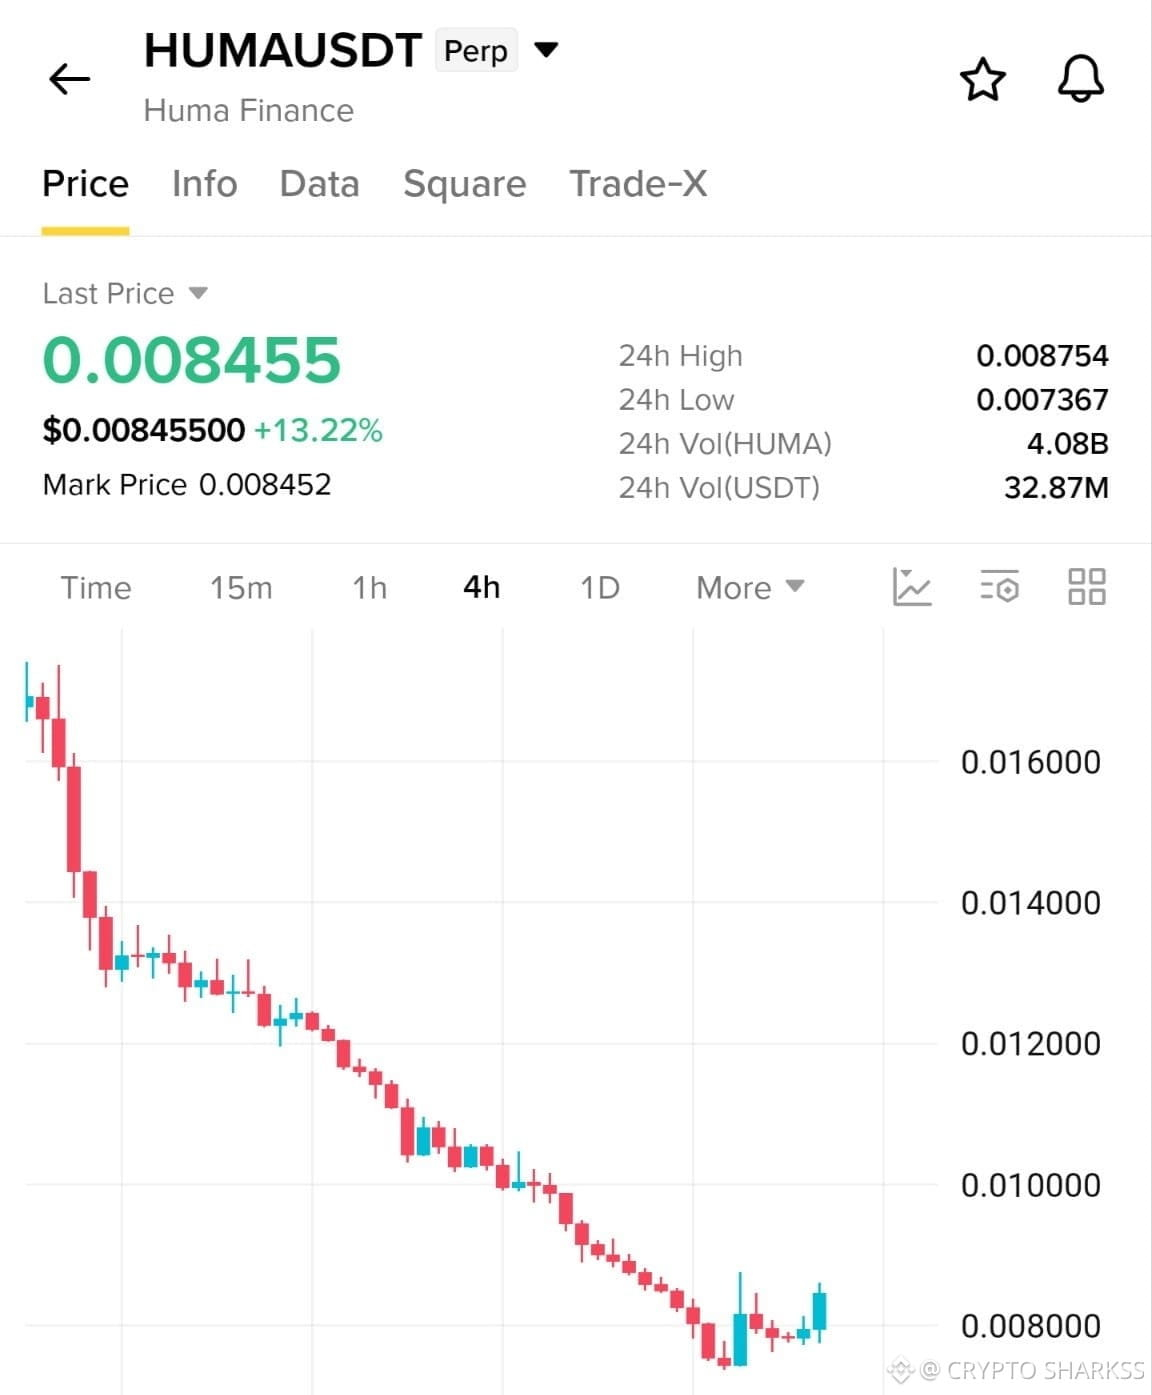
$HUMA The drop is over. The rebound has begun. Long setup
Fam, take a look at this chart. The decline has finally stopped.
The price plunged from $0.016 to $0.0073, but buyers stepped in and saved the day. It’s now bouncing back to $0.0084 — up more than 13% today, backed by high volume.
Why this is a good entry point
The sellers have run out of steam, while big players scooped up the asset at the bottom. As soon as the price breaks above $0.0090, it will take off quickly.
Long setup
· Entry: $0.00830–$0.00850 (right now)
· Target 1: $0.00950
· Target 2: $0.01050
· Target 3: $0.01200
· Stop-loss: $0.00730 (below the low)
We caught powerful pumps on $AGT , INIT, and ARIA. Now it’s time to catch this one too. Don’t miss the rebound!
I’m already in the trade. The fam is too. What about you?
The fam moves together. Time to make money.
Not financial advice. Do your own research.
Trade here 👉🏻 $HUMA
{future}(HUMAUSDT)
$HUMA The drop is over. The rebound has begun. Long setup
Fam, take a look at this chart. The decline has finally stopped.
The price plunged from $0.016 to $0.0073, but buyers stepped in and saved the day. It’s now bouncing back to $0.0084 — up more than 13% today, backed by high volume.
Why this is a good entry point
The sellers have run out of steam, while big players scooped up the asset at the bottom. As soon as the price breaks above $0.0090, it will take off quickly.
Long setup
· Entry: $0.00830–$0.00850 (right now)
· Target 1: $0.00950
· Target 2: $0.01050
· Target 3: $0.01200
· Stop-loss: $0.00730 (below the low)
We caught powerful pumps on $AGT , INIT, and ARIA. Now it’s time to catch this one too. Don’t miss the rebound!
I’m already in the trade. The fam is too. What about you?
The fam moves together. Time to make money.
Not financial advice. Do your own research.
Trade here 👉🏻 $HUMA
Fam, take a look at this chart. The decline has finally stopped.
The price plunged from $0.016 to $0.0073, but buyers stepped in and saved the day. It’s now bouncing back to $0.0084 — up more than 13% today, backed by high volume.
Why this is a good entry point
The sellers have run out of steam, while big players scooped up the asset at the bottom. As soon as the price breaks above $0.0090, it will take off quickly.
Long setup
· Entry: $0.00830–$0.00850 (right now)
· Target 1: $0.00950
· Target 2: $0.01050
· Target 3: $0.01200
· Stop-loss: $0.00730 (below the low)
We caught powerful pumps on $AGT , INIT, and ARIA. Now it’s time to catch this one too. Don’t miss the rebound!
I’m already in the trade. The fam is too. What about you?
The fam moves together. Time to make money.
Not financial advice. Do your own research.
Trade here 👉🏻 $HUMA
1
29
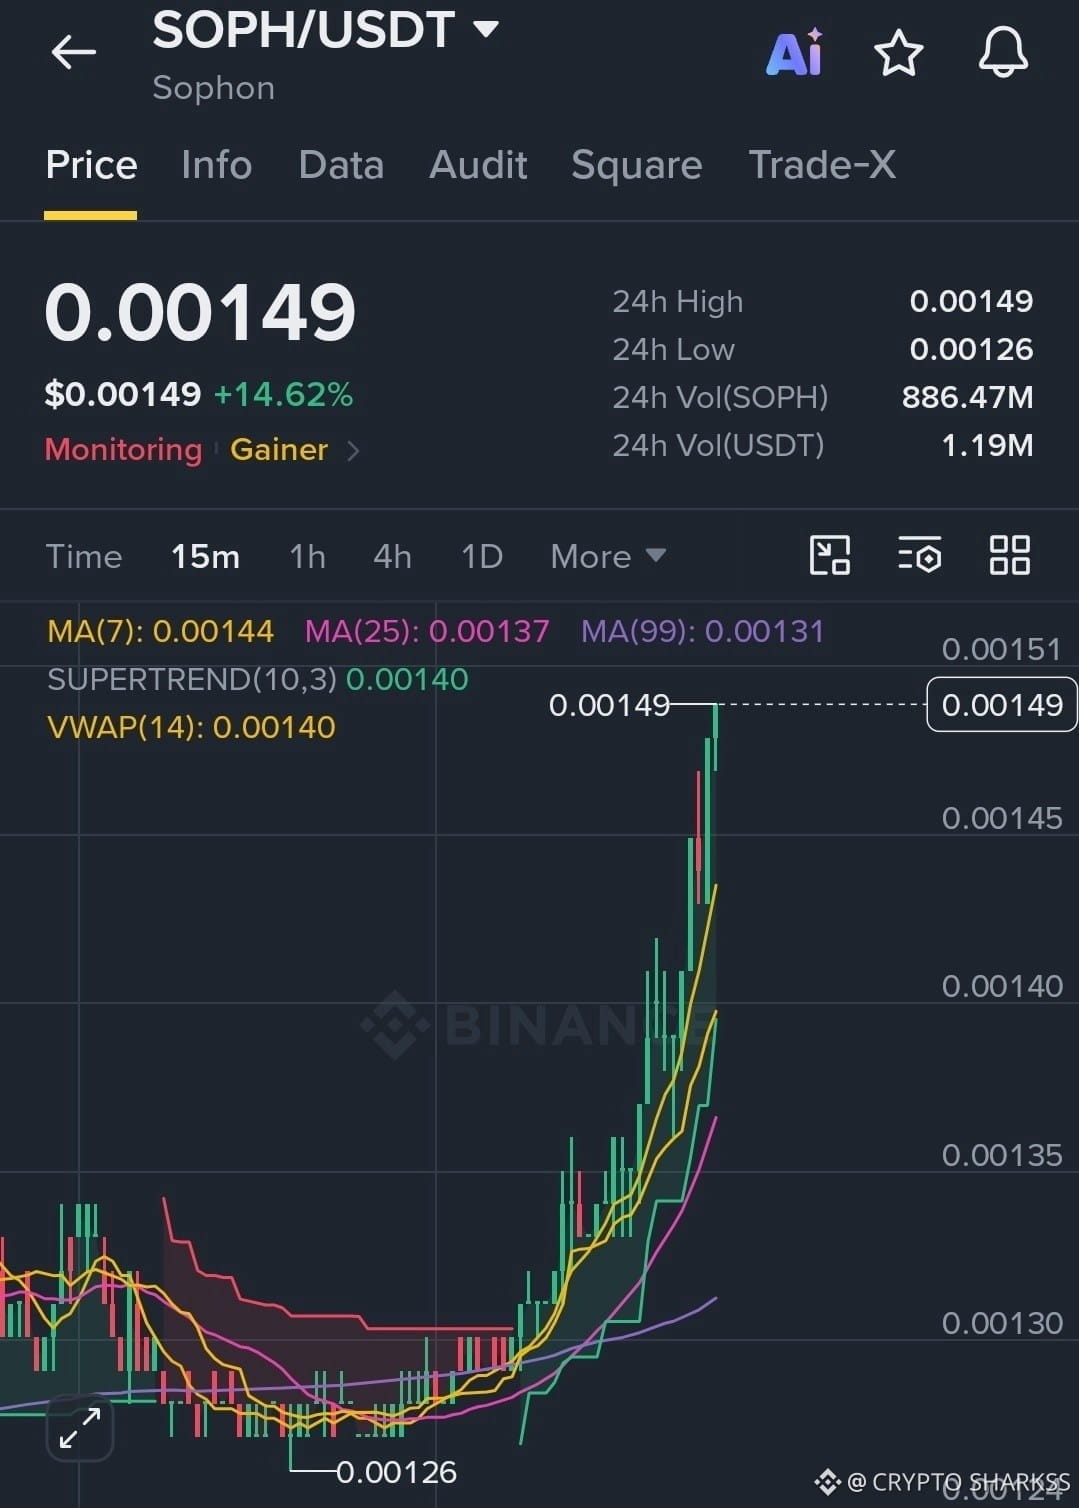
$SOPH – Upside breakout setup 🚀
* Entry: 0.00143–0.00145
* Targets: 0.00155 / 0.00160 / 0.00165
* Stop-loss: 0.00139
* Bias: bullish
Wait for pullback confirmation. Don’t chase the pump.
{future}(SOPHUSDT)
$SOPH – Upside breakout setup 🚀
* Entry: 0.00143–0.00145
* Targets: 0.00155 / 0.00160 / 0.00165
* Stop-loss: 0.00139
* Bias: bullish
Wait for pullback confirmation. Don’t chase the pump.
* Entry: 0.00143–0.00145
* Targets: 0.00155 / 0.00160 / 0.00165
* Stop-loss: 0.00139
* Bias: bullish
Wait for pullback confirmation. Don’t chase the pump.
1
18
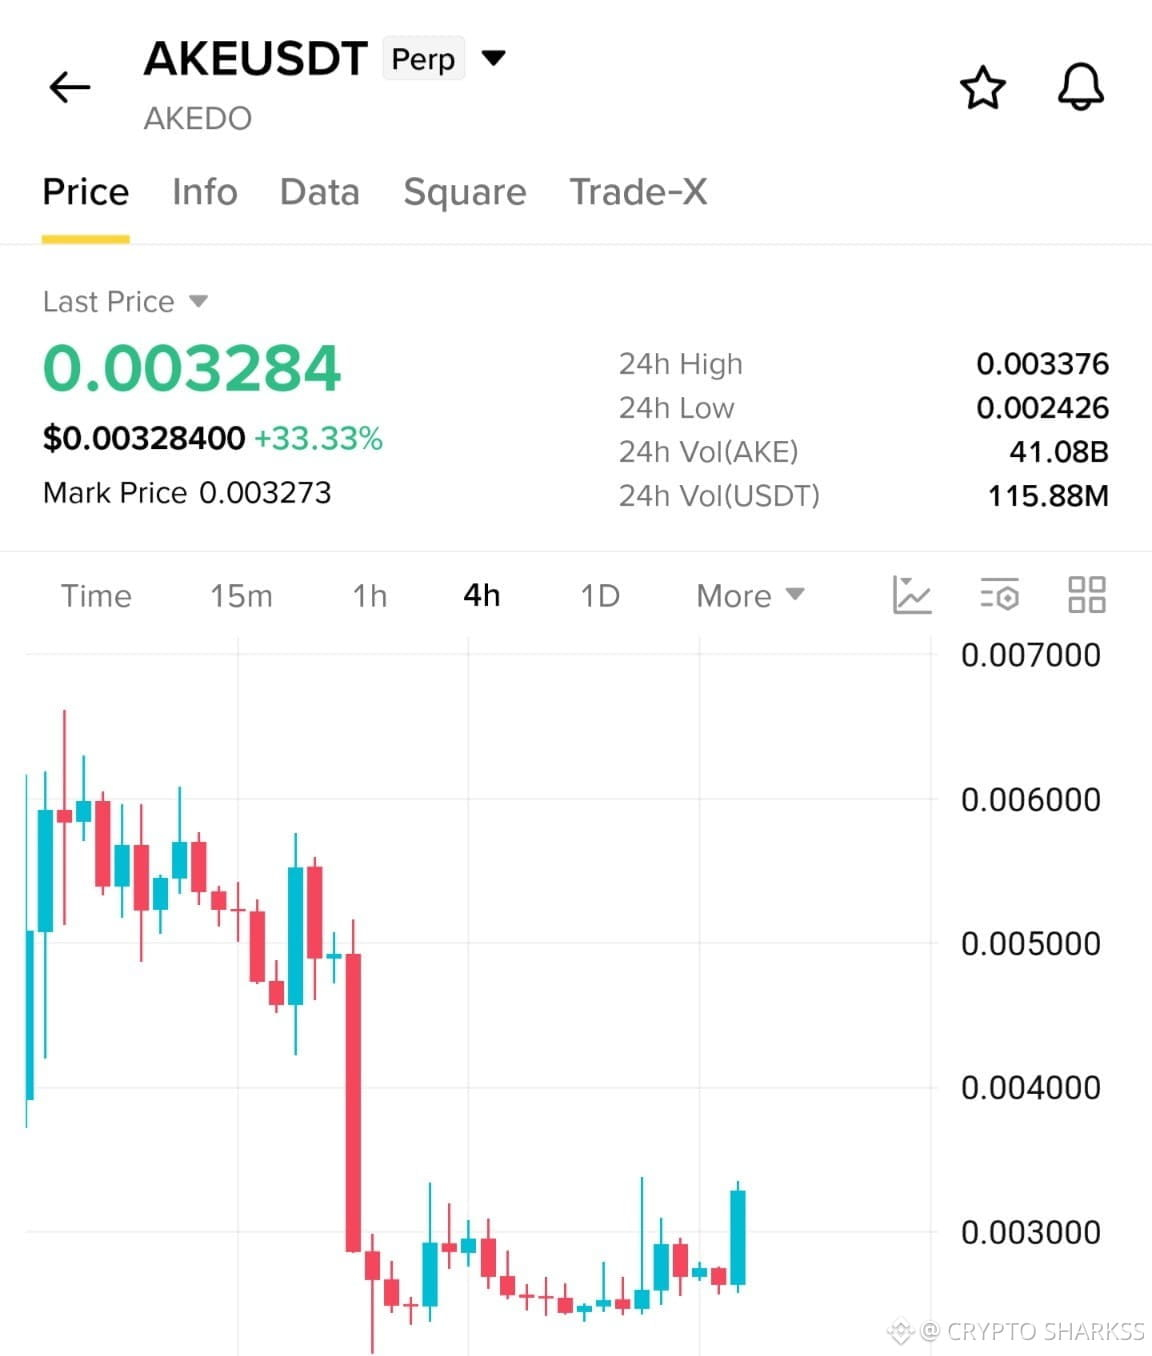
$AKE The bottom is finally holding. The rebound has begun
Family, take a look at this 4-hour chart. The bloodbath is over.
The price kept falling relentlessly, breaking through to $0.0024. Panic sellers were everywhere. But look at the chart now. Selling pressure has completely dried up. Buyers stepped in, formed a solid bottom, and the price has already returned to $0.00328 — up more than 33% today.
Why I’m opening a long position now
The drop to $0.0024 was a classic liquidity grab. Weak hands are already out, and sellers have run out of ammunition. We’ve just formed a clear higher low, and the **$115M USDT** volume shows that big players are clearly returning to the market. The structure has changed.
If you missed the bottom, don’t chase the green candle. A small pullback to the entry zone is your chance.
Long position plan
· Entry: $0.00320–$0.00330 (current market price)
· Target 1: $0.00380
· Target 2: $0.00420
· Target 3: $0.00450
· Stop-loss: $0.00280 (strictly below the reversal low)
We caught powerful pumps on $AGT , $INIT, and $ARIA. Now it’s time to catch this rebound. The chart looks clean, buyers are back in control, and the next targets are already close.
Trade here 👉🏻 $AKE
{future}(AKEUSDT)
$AKE The bottom is finally holding. The rebound has begun
Family, take a look at this 4-hour chart. The bloodbath is over.
The price kept falling relentlessly, breaking through to $0.0024. Panic sellers were everywhere. But look at the chart now. Selling pressure has completely dried up. Buyers stepped in, formed a solid bottom, and the price has already returned to $0.00328 — up more than 33% today.
Why I’m opening a long position now
The drop to $0.0024 was a classic liquidity grab. Weak hands are already out, and sellers have run out of ammunition. We’ve just formed a clear higher low, and the **$115M USDT** volume shows that big players are clearly returning to the market. The structure has changed.
If you missed the bottom, don’t chase the green candle. A small pullback to the entry zone is your chance.
Long position plan
· Entry: $0.00320–$0.00330 (current market price)
· Target 1: $0.00380
· Target 2: $0.00420
· Target 3: $0.00450
· Stop-loss: $0.00280 (strictly below the reversal low)
We caught powerful pumps on $AGT , $INIT, and $ARIA. Now it’s time to catch this rebound. The chart looks clean, buyers are back in control, and the next targets are already close.
Trade here 👉🏻 $AKE
Family, take a look at this 4-hour chart. The bloodbath is over.
The price kept falling relentlessly, breaking through to $0.0024. Panic sellers were everywhere. But look at the chart now. Selling pressure has completely dried up. Buyers stepped in, formed a solid bottom, and the price has already returned to $0.00328 — up more than 33% today.
Why I’m opening a long position now
The drop to $0.0024 was a classic liquidity grab. Weak hands are already out, and sellers have run out of ammunition. We’ve just formed a clear higher low, and the **$115M USDT** volume shows that big players are clearly returning to the market. The structure has changed.
If you missed the bottom, don’t chase the green candle. A small pullback to the entry zone is your chance.
Long position plan
· Entry: $0.00320–$0.00330 (current market price)
· Target 1: $0.00380
· Target 2: $0.00420
· Target 3: $0.00450
· Stop-loss: $0.00280 (strictly below the reversal low)
We caught powerful pumps on $AGT , $INIT, and $ARIA. Now it’s time to catch this rebound. The chart looks clean, buyers are back in control, and the next targets are already close.
Trade here 👉🏻 $AKE
1
41
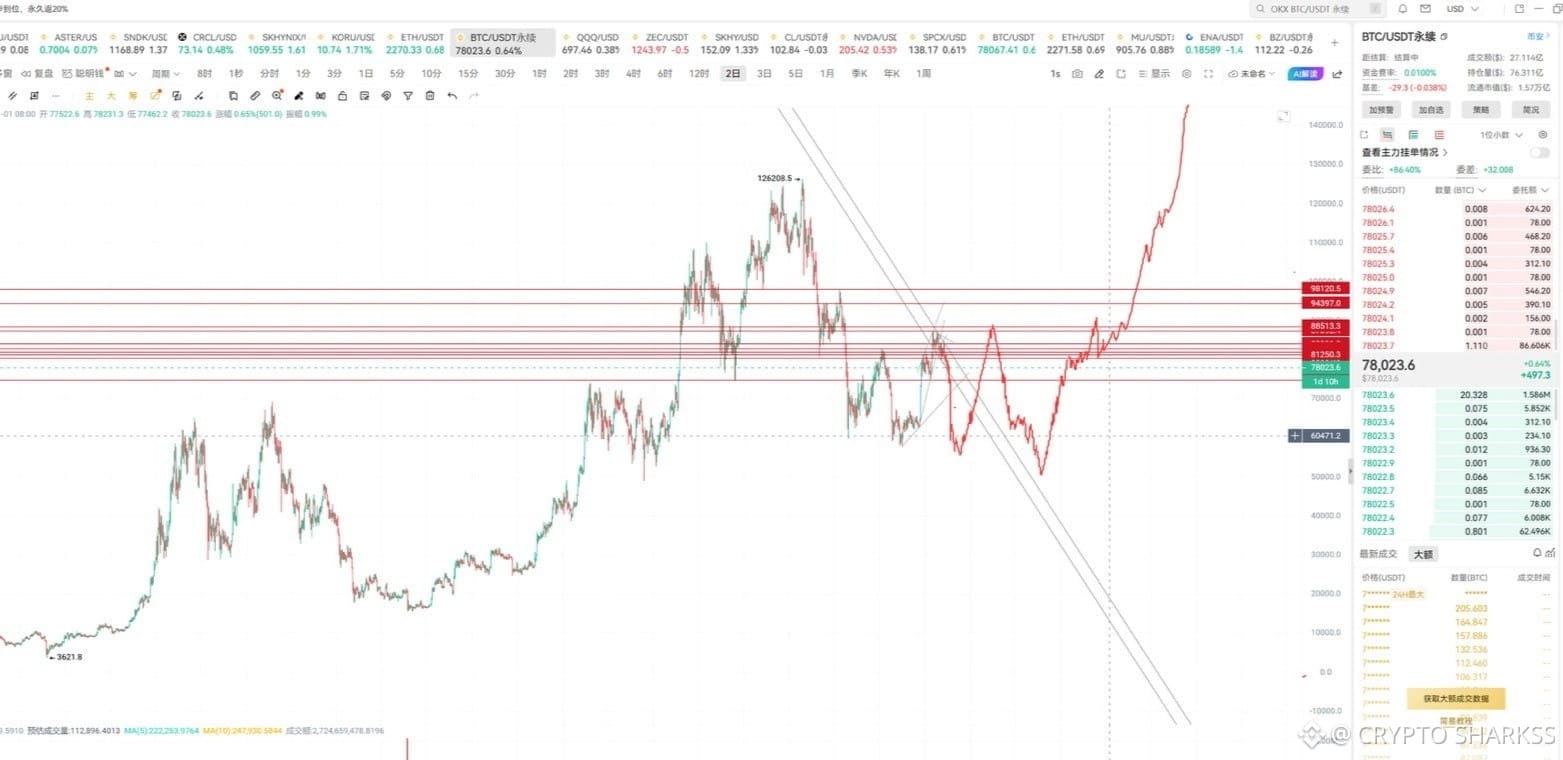
This is the chart I put together on November 1. Basically, I just couldn't resist and traded the bounce, thinking that the level around 70,000 wouldn't be so easy to break below... You can use this chart as a reference.
This is the chart I put together on November 1. Basically, I just couldn't resist and traded the bounce, thinking that the level around 70,000 wouldn't be so easy to break below... You can use this chart as a reference.
1
30
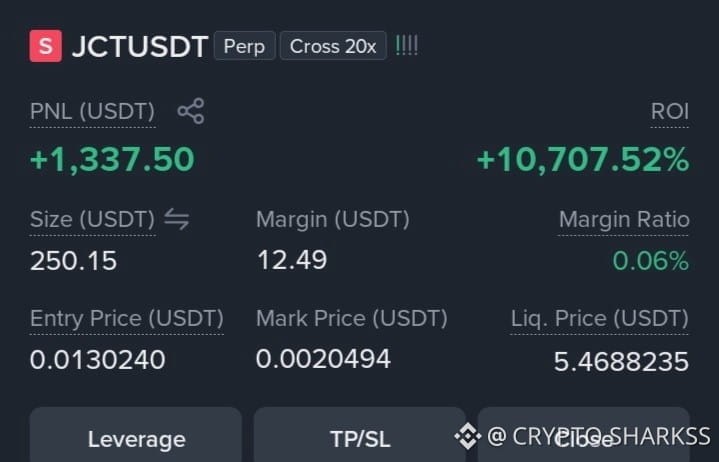
$JCT It keeps falling, while we're printing money 🤑🤑
Stay short $JCT 🥂
Take-profit: 0.0012
{future}(JCTUSDT)
$JCT It keeps falling, while we're printing money 🤑🤑
Stay short $JCT 🥂
Take-profit: 0.0012
Stay short $JCT 🥂
Take-profit: 0.0012
1
53
Log in to explore more content
Join global crypto users on Binance Square
⚡️ Get latest and useful information about crypto.
💬 Trusted by the world’s largest crypto exchange.
👍 Discover real insights from verified creators.
Email / Phone number