

Crypto_Vazima
5.2k Posts

Crypto_Vazima
Report
Block User
Fresh crypto news EVERY DAY! Subscribe now! Official STON.fi Ambassador! @crypto_vazima
29 Following
887 Followers
4.8K+ Liked
Posts
All
Quotes
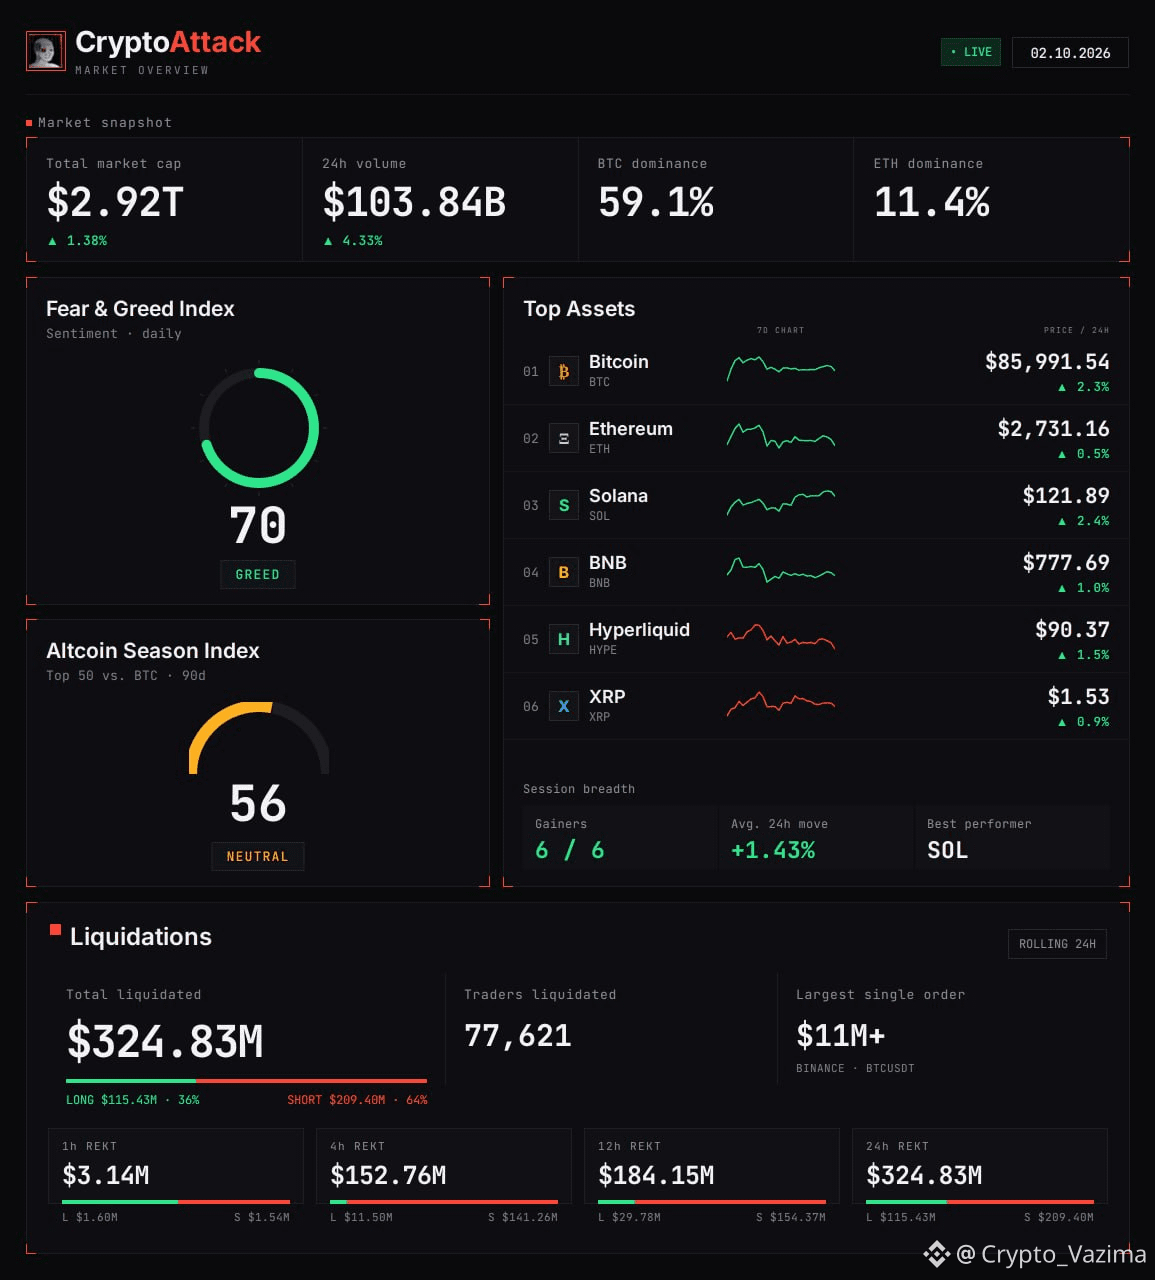
Crypto Turns Green on 2 Oct 2026: $2.92T Cap, Greed at 70, Shorts Hit Hard
The 2 October 2026 CryptoAttack board is fully green. Market cap is up, volume is higher, and short liquidations are doing most of the damage.
🚀 What the tape shows
- Total market cap: $2.92T, up 1.38%.
- 24-hour volume: $103.84B, up 4.33%.
- Bitcoin dominance holds at 59.1%. Ethereum dominance sits at 11.4%.
- All 6 tracked majors are gainers. Average 24-hour move: +1.43%. Best performer: SOL.
📈 Prices on the board
- Bitcoin: $85,991.54, up 2.3%.
- Ethereum: $2,731.16, up 0.5%.
- Solana: $121.89, up 2.4%.
- BNB: $777.69, up 1.0%.
- Hyperliquid (HYPE): $90.37, up 1.5%.
- XRP: $1.53, up 0.9%.
😬 Sentiment check
- Fear and Greed Index: 70, Greed.
- Altcoin Season Index: 56, Neutral on the 90-day top-50 vs. Bitcoin measure.
- Breadth is positive, but the season score has not flipped to altcoin season.
💥 Who got liquidated
- Rolling 24 hours: $324.83M liquidated, 77,621 traders.
- Shorts: $209.40M, 64%. Longs: $115.43M, 36%.
- Largest single order: $11M+ on Binance BTCUSDT.
- By window: 1h $3.14M, 4h $152.76M (shorts $141.26M), 12h $184.15M, 24h $324.83M.
Why it matters: price and volume are higher together, but Bitcoin still dominates and the altcoin-season gauge remains neutral. The squeeze is concentrated in shorts, not a broad long wipeout.
Is the 64% short-liquidation share the real story of this green session, or is Bitcoin dominance? 👇
Tell me which print stands out more to you - the greed reading or the short squeeze.
Not investment advice - research on your own! 🚀
$BTC $XRP
Crypto Turns Green on 2 Oct 2026: $2.92T Cap, Greed at 70, Shorts Hit Hard
The 2 October 2026 CryptoAttack board is fully green. Market cap is up, volume is higher, and short liquidations are doing most of the damage.
🚀 What the tape shows
- Total market cap: $2.92T, up 1.38%.
- 24-hour volume: $103.84B, up 4.33%.
- Bitcoin dominance holds at 59.1%. Ethereum dominance sits at 11.4%.
- All 6 tracked majors are gainers. Average 24-hour move: +1.43%. Best performer: SOL.
📈 Prices on the board
- Bitcoin: $85,991.54, up 2.3%.
- Ethereum: $2,731.16, up 0.5%.
- Solana: $121.89, up 2.4%.
- BNB: $777.69, up 1.0%.
- Hyperliquid (HYPE): $90.37, up 1.5%.
- XRP: $1.53, up 0.9%.
😬 Sentiment check
- Fear and Greed Index: 70, Greed.
- Altcoin Season Index: 56, Neutral on the 90-day top-50 vs. Bitcoin measure.
- Breadth is positive, but the season score has not flipped to altcoin season.
💥 Who got liquidated
- Rolling 24 hours: $324.83M liquidated, 77,621 traders.
- Shorts: $209.40M, 64%. Longs: $115.43M, 36%.
- Largest single order: $11M+ on Binance BTCUSDT.
- By window: 1h $3.14M, 4h $152.76M (shorts $141.26M), 12h $184.15M, 24h $324.83M.
Why it matters: price and volume are higher together, but Bitcoin still dominates and the altcoin-season gauge remains neutral. The squeeze is concentrated in shorts, not a broad long wipeout.
Is the 64% short-liquidation share the real story of this green session, or is Bitcoin dominance? 👇
Tell me which print stands out more to you - the greed reading or the short squeeze.
Not investment advice - research on your own! 🚀
$BTC $XRP
The 2 October 2026 CryptoAttack board is fully green. Market cap is up, volume is higher, and short liquidations are doing most of the damage.
🚀 What the tape shows
- Total market cap: $2.92T, up 1.38%.
- 24-hour volume: $103.84B, up 4.33%.
- Bitcoin dominance holds at 59.1%. Ethereum dominance sits at 11.4%.
- All 6 tracked majors are gainers. Average 24-hour move: +1.43%. Best performer: SOL.
📈 Prices on the board
- Bitcoin: $85,991.54, up 2.3%.
- Ethereum: $2,731.16, up 0.5%.
- Solana: $121.89, up 2.4%.
- BNB: $777.69, up 1.0%.
- Hyperliquid (HYPE): $90.37, up 1.5%.
- XRP: $1.53, up 0.9%.
😬 Sentiment check
- Fear and Greed Index: 70, Greed.
- Altcoin Season Index: 56, Neutral on the 90-day top-50 vs. Bitcoin measure.
- Breadth is positive, but the season score has not flipped to altcoin season.
💥 Who got liquidated
- Rolling 24 hours: $324.83M liquidated, 77,621 traders.
- Shorts: $209.40M, 64%. Longs: $115.43M, 36%.
- Largest single order: $11M+ on Binance BTCUSDT.
- By window: 1h $3.14M, 4h $152.76M (shorts $141.26M), 12h $184.15M, 24h $324.83M.
Why it matters: price and volume are higher together, but Bitcoin still dominates and the altcoin-season gauge remains neutral. The squeeze is concentrated in shorts, not a broad long wipeout.
Is the 64% short-liquidation share the real story of this green session, or is Bitcoin dominance? 👇
Tell me which print stands out more to you - the greed reading or the short squeeze.
Not investment advice - research on your own! 🚀
$BTC $XRP
95
·
--
Bullish
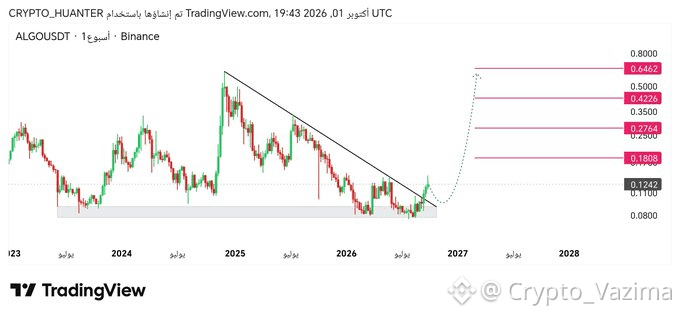
ALGO Just Woke Up, But I Want the Dip Before the Run 🔥
This is the kind of weekly break that gets people clicking buy too fast. ALGO cleared the falling trend with strong candles, and the chart still draws a pullback before the real push.
🔥 Why I am watching
- The downtrend line is broken, not just touched.
- The break came with strong green candles, so sellers lost that line.
- Price is still around 0.124, close to the base, not late in the move.
- The drawn path wants a correction, then a launch toward the red zones.
🚀 The move I see
The read is simple. Correction first, accumulation on the retest, then the run. I like that more than chasing the break candle. If the dip gets bought, 0.1808 is the first magnet, with 0.2764, 0.4226, and 0.6462 stacked above.
🎯 My trade idea
- Bias: Long
- Trigger: retest of the broken trend holds and buyers step back in
- Target: 0.1808 first, then 0.2764, 0.4226, and 0.6462
- Invalidation: retest fails and price loses the recent base under the old trendline
- Confidence: 64 percent
🛡 Where I step back
- No hold on the retest.
- A slip back under the broken trendline.
- Loss of the recent low base.
- No confirmation, no chase.
Would you buy the ALGO dip or wait for the retest to prove itself? 👇
Tell me where you would place invalidation.
Not investment advice - research on your own! 🚀
$ALGO
{future}(ALGOUSDT)
ALGO Just Woke Up, But I Want the Dip Before the Run 🔥
This is the kind of weekly break that gets people clicking buy too fast. ALGO cleared the falling trend with strong candles, and the chart still draws a pullback before the real push.
🔥 Why I am watching
- The downtrend line is broken, not just touched.
- The break came with strong green candles, so sellers lost that line.
- Price is still around 0.124, close to the base, not late in the move.
- The drawn path wants a correction, then a launch toward the red zones.
🚀 The move I see
The read is simple. Correction first, accumulation on the retest, then the run. I like that more than chasing the break candle. If the dip gets bought, 0.1808 is the first magnet, with 0.2764, 0.4226, and 0.6462 stacked above.
🎯 My trade idea
- Bias: Long
- Trigger: retest of the broken trend holds and buyers step back in
- Target: 0.1808 first, then 0.2764, 0.4226, and 0.6462
- Invalidation: retest fails and price loses the recent base under the old trendline
- Confidence: 64 percent
🛡 Where I step back
- No hold on the retest.
- A slip back under the broken trendline.
- Loss of the recent low base.
- No confirmation, no chase.
Would you buy the ALGO dip or wait for the retest to prove itself? 👇
Tell me where you would place invalidation.
Not investment advice - research on your own! 🚀
$ALGO
This is the kind of weekly break that gets people clicking buy too fast. ALGO cleared the falling trend with strong candles, and the chart still draws a pullback before the real push.
🔥 Why I am watching
- The downtrend line is broken, not just touched.
- The break came with strong green candles, so sellers lost that line.
- Price is still around 0.124, close to the base, not late in the move.
- The drawn path wants a correction, then a launch toward the red zones.
🚀 The move I see
The read is simple. Correction first, accumulation on the retest, then the run. I like that more than chasing the break candle. If the dip gets bought, 0.1808 is the first magnet, with 0.2764, 0.4226, and 0.6462 stacked above.
🎯 My trade idea
- Bias: Long
- Trigger: retest of the broken trend holds and buyers step back in
- Target: 0.1808 first, then 0.2764, 0.4226, and 0.6462
- Invalidation: retest fails and price loses the recent base under the old trendline
- Confidence: 64 percent
🛡 Where I step back
- No hold on the retest.
- A slip back under the broken trendline.
- Loss of the recent low base.
- No confirmation, no chase.
Would you buy the ALGO dip or wait for the retest to prove itself? 👇
Tell me where you would place invalidation.
Not investment advice - research on your own! 🚀
$ALGO
1
214
·
--
Bullish
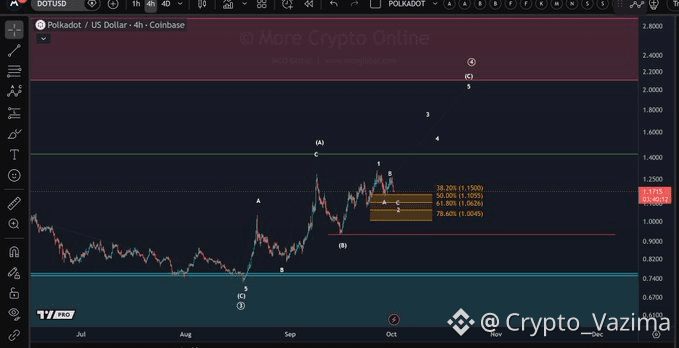
DOT Buyers Are Being Tested Right Inside Wave 2
This is the part of the move that tests patience. DOT still has a 1-2 setup on the table, but wave 2 is unfolding, so I am not chasing the hope of wave 3 yet.
🔥 Why I am watching
- The structure is still a 1-2, not a finished rally.
- Wave 2 looks active right now.
- The bullish path needs the $1 to 1.15 area to hold.
- Lose that pocket and the third-wave idea gets weak fast.
🚀 The part that matters
- Support is the story, not a random bounce.
- I want the pullback to stay contained above 1.
- A hold can set up the next upside leg.
- A failed hold means I step back.
🛡 Where I step back
- A decisive break under the 1 area.
- Wave 2 turning into a deeper breakdown.
- No reclaim after support fails.
🎯 My trade idea
- Bias: Long only after the zone holds
- Trigger: 1 to 1.15 defends and price turns up
- Invalidation: clean break under 1
- Confidence: 60 percent until the hold is clearer
Would you buy the wave 2 dip or wait for the turn? 👇
Drop the confirmation that would make wave 3 real for you.
Not investment advice - research on your own! 🚀
$DOT
{future}(DOTUSDT)
DOT Buyers Are Being Tested Right Inside Wave 2
This is the part of the move that tests patience. DOT still has a 1-2 setup on the table, but wave 2 is unfolding, so I am not chasing the hope of wave 3 yet.
🔥 Why I am watching
- The structure is still a 1-2, not a finished rally.
- Wave 2 looks active right now.
- The bullish path needs the $1 to 1.15 area to hold.
- Lose that pocket and the third-wave idea gets weak fast.
🚀 The part that matters
- Support is the story, not a random bounce.
- I want the pullback to stay contained above 1.
- A hold can set up the next upside leg.
- A failed hold means I step back.
🛡 Where I step back
- A decisive break under the 1 area.
- Wave 2 turning into a deeper breakdown.
- No reclaim after support fails.
🎯 My trade idea
- Bias: Long only after the zone holds
- Trigger: 1 to 1.15 defends and price turns up
- Invalidation: clean break under 1
- Confidence: 60 percent until the hold is clearer
Would you buy the wave 2 dip or wait for the turn? 👇
Drop the confirmation that would make wave 3 real for you.
Not investment advice - research on your own! 🚀
$DOT
This is the part of the move that tests patience. DOT still has a 1-2 setup on the table, but wave 2 is unfolding, so I am not chasing the hope of wave 3 yet.
🔥 Why I am watching
- The structure is still a 1-2, not a finished rally.
- Wave 2 looks active right now.
- The bullish path needs the $1 to 1.15 area to hold.
- Lose that pocket and the third-wave idea gets weak fast.
🚀 The part that matters
- Support is the story, not a random bounce.
- I want the pullback to stay contained above 1.
- A hold can set up the next upside leg.
- A failed hold means I step back.
🛡 Where I step back
- A decisive break under the 1 area.
- Wave 2 turning into a deeper breakdown.
- No reclaim after support fails.
🎯 My trade idea
- Bias: Long only after the zone holds
- Trigger: 1 to 1.15 defends and price turns up
- Invalidation: clean break under 1
- Confidence: 60 percent until the hold is clearer
Would you buy the wave 2 dip or wait for the turn? 👇
Drop the confirmation that would make wave 3 real for you.
Not investment advice - research on your own! 🚀
$DOT
1
58
·
--
Bullish
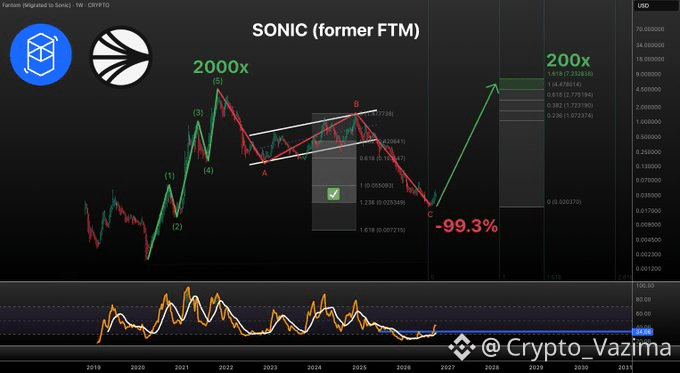
S Could Wake Up Fast If This Low Really Holds
This is the kind of chart that stays quiet for months, then moves once the low is accepted. S just held the C-wave zone, and those reversal signs are no longer easy to fade.
🔥 Why I am watching
- The 1.236 C-wave target held.
- Reversal signs look strong on this update.
- Higher-timeframe structure is still bullish.
- The March path was a bear trap aimed near $5.6 before the leg extended.
👀 The part that matters
- I do not care about the hope. I care that the low stays defended.
- If that C-wave zone keeps holding, the 1.618 near $7 is the map.
- If it fails, the reversal idea gets weaker fast.
- Lagging charts often move only after the low is accepted.
⚡ Market mood
- The correction ran deep, then buyers finally got a held target.
- That does not mean every bounce is safe.
- For me, the story starts with defense of the low, not a blind chase.
- The $7 zone is the destination only if structure keeps agreeing.
🚀 My trade idea
- Bias: Long
- Trigger: hold of the 1.236 C-wave low with reversal signs intact
- Target: about $7 on the 1.618 expansion
- Invalidation: loss of that C-wave low
- Confidence: 64 percent
Would you trust this low, or do you still want one more push down? 👇
Tell me the confirmation you need before you get interested.
Not investment advice - research on your own! 🚀
$S
{future}(SUSDT)
S Could Wake Up Fast If This Low Really Holds
This is the kind of chart that stays quiet for months, then moves once the low is accepted. S just held the C-wave zone, and those reversal signs are no longer easy to fade.
🔥 Why I am watching
- The 1.236 C-wave target held.
- Reversal signs look strong on this update.
- Higher-timeframe structure is still bullish.
- The March path was a bear trap aimed near $5.6 before the leg extended.
👀 The part that matters
- I do not care about the hope. I care that the low stays defended.
- If that C-wave zone keeps holding, the 1.618 near $7 is the map.
- If it fails, the reversal idea gets weaker fast.
- Lagging charts often move only after the low is accepted.
⚡ Market mood
- The correction ran deep, then buyers finally got a held target.
- That does not mean every bounce is safe.
- For me, the story starts with defense of the low, not a blind chase.
- The $7 zone is the destination only if structure keeps agreeing.
🚀 My trade idea
- Bias: Long
- Trigger: hold of the 1.236 C-wave low with reversal signs intact
- Target: about $7 on the 1.618 expansion
- Invalidation: loss of that C-wave low
- Confidence: 64 percent
Would you trust this low, or do you still want one more push down? 👇
Tell me the confirmation you need before you get interested.
Not investment advice - research on your own! 🚀
$S
This is the kind of chart that stays quiet for months, then moves once the low is accepted. S just held the C-wave zone, and those reversal signs are no longer easy to fade.
🔥 Why I am watching
- The 1.236 C-wave target held.
- Reversal signs look strong on this update.
- Higher-timeframe structure is still bullish.
- The March path was a bear trap aimed near $5.6 before the leg extended.
👀 The part that matters
- I do not care about the hope. I care that the low stays defended.
- If that C-wave zone keeps holding, the 1.618 near $7 is the map.
- If it fails, the reversal idea gets weaker fast.
- Lagging charts often move only after the low is accepted.
⚡ Market mood
- The correction ran deep, then buyers finally got a held target.
- That does not mean every bounce is safe.
- For me, the story starts with defense of the low, not a blind chase.
- The $7 zone is the destination only if structure keeps agreeing.
🚀 My trade idea
- Bias: Long
- Trigger: hold of the 1.236 C-wave low with reversal signs intact
- Target: about $7 on the 1.618 expansion
- Invalidation: loss of that C-wave low
- Confidence: 64 percent
Would you trust this low, or do you still want one more push down? 👇
Tell me the confirmation you need before you get interested.
Not investment advice - research on your own! 🚀
$S
2
141
·
--
Bullish
LTC Bounce Idea Only Works After This Dip 🔥
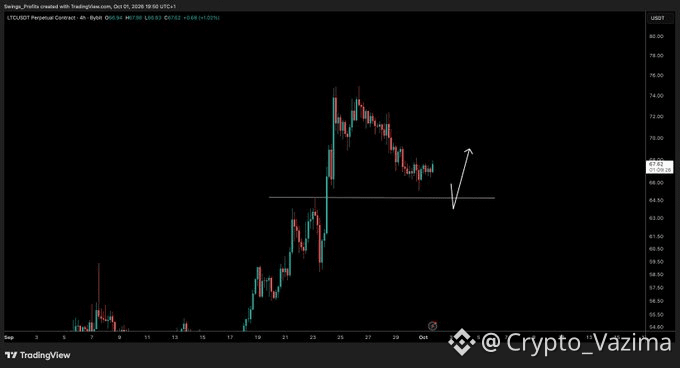
I get the urge to front-run LTC here. I still would not. The interesting part is the support reaction, and that reaction has not happened yet.
🔥 Why I am watching
- The bounce path is drawn, but the dip has not landed.
- Support is still below price, so the defense is unproven.
- Chasing before the test turns a clean idea into a guess.
- The long leg is possible, not confirmed.
⚡ The dip that matters
- I want the marked support zone tagged.
- I want buyers actually defending it.
- A straight breakdown through that zone kills the long idea for me.
- A weak bounce that fails immediately is not enough either.
🎯 My trade idea
- Bias: Wait
- Trigger: support test that holds
- Invalidation: zone fails and price does not reclaim it
- Confidence: 60 percent until the touch is real
Patience is the trade right now. The chart can look tempting and still be early.
Are you patient for the dip, or is waiting the hard part? 👇
Tell me if you want the dip first or a reclaim.
Not investment advice - research on your own! 🚀
$LTC
{future}(LTCUSDT)
LTC Bounce Idea Only Works After This Dip 🔥
I get the urge to front-run LTC here. I still would not. The interesting part is the support reaction, and that reaction has not happened yet.
🔥 Why I am watching
- The bounce path is drawn, but the dip has not landed.
- Support is still below price, so the defense is unproven.
- Chasing before the test turns a clean idea into a guess.
- The long leg is possible, not confirmed.
⚡ The dip that matters
- I want the marked support zone tagged.
- I want buyers actually defending it.
- A straight breakdown through that zone kills the long idea for me.
- A weak bounce that fails immediately is not enough either.
🎯 My trade idea
- Bias: Wait
- Trigger: support test that holds
- Invalidation: zone fails and price does not reclaim it
- Confidence: 60 percent until the touch is real
Patience is the trade right now. The chart can look tempting and still be early.
Are you patient for the dip, or is waiting the hard part? 👇
Tell me if you want the dip first or a reclaim.
Not investment advice - research on your own! 🚀
$LTC
I get the urge to front-run LTC here. I still would not. The interesting part is the support reaction, and that reaction has not happened yet.
🔥 Why I am watching
- The bounce path is drawn, but the dip has not landed.
- Support is still below price, so the defense is unproven.
- Chasing before the test turns a clean idea into a guess.
- The long leg is possible, not confirmed.
⚡ The dip that matters
- I want the marked support zone tagged.
- I want buyers actually defending it.
- A straight breakdown through that zone kills the long idea for me.
- A weak bounce that fails immediately is not enough either.
🎯 My trade idea
- Bias: Wait
- Trigger: support test that holds
- Invalidation: zone fails and price does not reclaim it
- Confidence: 60 percent until the touch is real
Patience is the trade right now. The chart can look tempting and still be early.
Are you patient for the dip, or is waiting the hard part? 👇
Tell me if you want the dip first or a reclaim.
Not investment advice - research on your own! 🚀
$LTC
61
·
--
Bullish
QQQ Dont Blink Move Is Getting Hard to Ignore 🔥
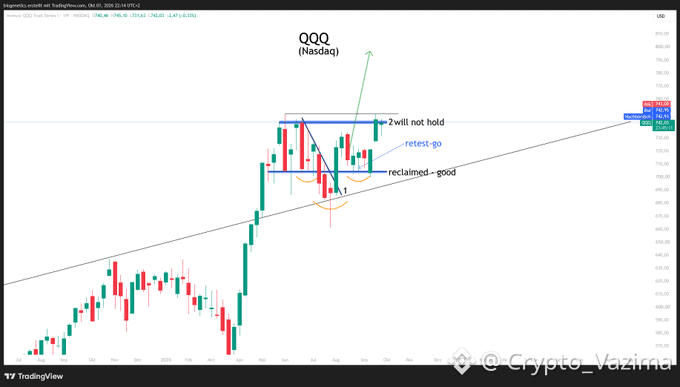
This is the kind of weekly chart that makes you sit up. The line that was supposed to fail just got tested, and the caption says dont blink.
🔥 Why I am watching
- The rounded base is marked as point 1, right near the rising trendline.
- Buyers already reclaimed the lower blue line, and that reclaim was called good.
- The retest after that reclaim was marked retest-go.
- Now price is pressing the upper line labeled 2 will not hold.
🚀 The break that matters
- This is not a random green candle for me.
- The sequence on the chart is base, reclaim, retest, then the line that should break.
- Dont blink only makes sense if this push keeps going.
- The arrow is drawn higher, so the idea is continuation, not a top call.
🛡 Where I step back
- I change my view if line 2 rejects and price falls back through it.
- The reclaimed line is the risk line I do not want lost.
- A wick through resistance is not the same as a held break.
- No hold, no trade. I am not marrying the first push.
🎯 My trade idea
- Bias: Long
- Trigger: line 2 fails to hold as resistance and price stays above it
- Target: higher leg only while the break remains valid
- Invalidation: rejection back under the reclaimed line
- Confidence: 65 percent
The hype is the caption. The trade is the hold.
Would you jump on this QQQ break, or wait for the weekly close? 👇
Drop your cleanest chart read below.
Not investment advice - research on your own! 🚀
$QQQ
{future}(QQQUSDT)
QQQ Dont Blink Move Is Getting Hard to Ignore 🔥
This is the kind of weekly chart that makes you sit up. The line that was supposed to fail just got tested, and the caption says dont blink.
🔥 Why I am watching
- The rounded base is marked as point 1, right near the rising trendline.
- Buyers already reclaimed the lower blue line, and that reclaim was called good.
- The retest after that reclaim was marked retest-go.
- Now price is pressing the upper line labeled 2 will not hold.
🚀 The break that matters
- This is not a random green candle for me.
- The sequence on the chart is base, reclaim, retest, then the line that should break.
- Dont blink only makes sense if this push keeps going.
- The arrow is drawn higher, so the idea is continuation, not a top call.
🛡 Where I step back
- I change my view if line 2 rejects and price falls back through it.
- The reclaimed line is the risk line I do not want lost.
- A wick through resistance is not the same as a held break.
- No hold, no trade. I am not marrying the first push.
🎯 My trade idea
- Bias: Long
- Trigger: line 2 fails to hold as resistance and price stays above it
- Target: higher leg only while the break remains valid
- Invalidation: rejection back under the reclaimed line
- Confidence: 65 percent
The hype is the caption. The trade is the hold.
Would you jump on this QQQ break, or wait for the weekly close? 👇
Drop your cleanest chart read below.
Not investment advice - research on your own! 🚀
$QQQ
This is the kind of weekly chart that makes you sit up. The line that was supposed to fail just got tested, and the caption says dont blink.
🔥 Why I am watching
- The rounded base is marked as point 1, right near the rising trendline.
- Buyers already reclaimed the lower blue line, and that reclaim was called good.
- The retest after that reclaim was marked retest-go.
- Now price is pressing the upper line labeled 2 will not hold.
🚀 The break that matters
- This is not a random green candle for me.
- The sequence on the chart is base, reclaim, retest, then the line that should break.
- Dont blink only makes sense if this push keeps going.
- The arrow is drawn higher, so the idea is continuation, not a top call.
🛡 Where I step back
- I change my view if line 2 rejects and price falls back through it.
- The reclaimed line is the risk line I do not want lost.
- A wick through resistance is not the same as a held break.
- No hold, no trade. I am not marrying the first push.
🎯 My trade idea
- Bias: Long
- Trigger: line 2 fails to hold as resistance and price stays above it
- Target: higher leg only while the break remains valid
- Invalidation: rejection back under the reclaimed line
- Confidence: 65 percent
The hype is the caption. The trade is the hold.
Would you jump on this QQQ break, or wait for the weekly close? 👇
Drop your cleanest chart read below.
Not investment advice - research on your own! 🚀
$QQQ
91
·
--
Bullish
Watching BTC Run Without You Is the Real Pain
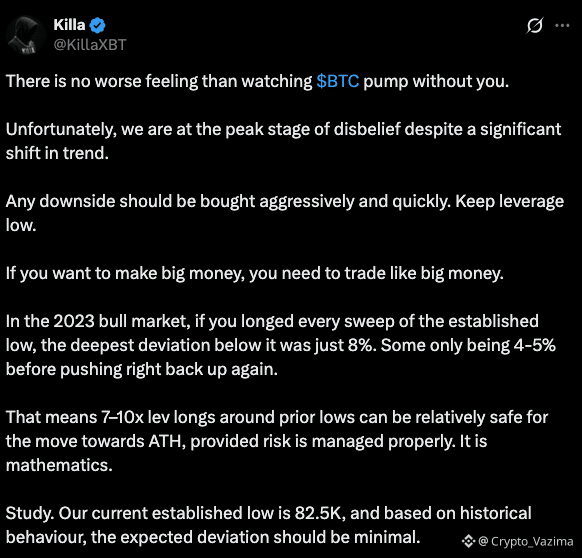
That feeling is everywhere right now. Price can keep moving while the crowd is still arguing that nothing actually changed.
🔥 Why I am watching
- Disbelief is still the dominant mood.
- The trend shift is already on the chart.
- Missing the run hurts more than a planned dip entry.
- I would rather buy weakness than chase a late green candle.
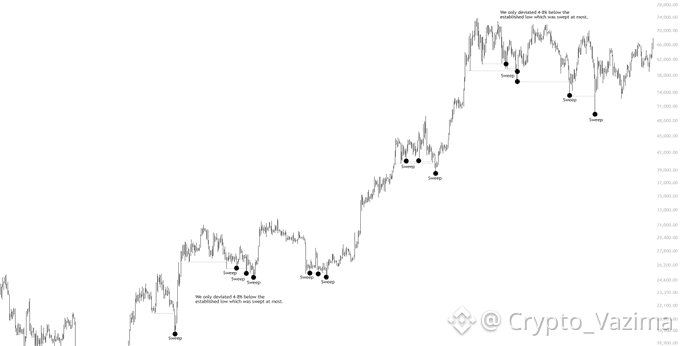
👀 What the old cycle showed
- 2023 bull sweeps under the established low stayed tight.
- The deepest break was around 8 percent.
- Several only went 4 to 5 percent before the bounce.
- The current established low on this read is 82.5K.
- History says the deviation should stay small if the same behavior holds.
💧 How I would play it
1. Wait for a fast dip toward 82.5K.
2. Look for a quick buy reaction, not a slow bleed.
3. Keep leverage low and size already defined.
4. Step away if the low is lost and not reclaimed.
🚀 My trade idea
- Bias: Long the dip
- Trigger: controlled buying if BTC sweeps toward 82.5K and reacts fast
- Target: continuation on the ATH path if that low is reclaimed
- Invalidation: a deeper break under 82.5K with no quick reclaim
- Confidence: 65 percent
A fast dip is only useful if the risk line is already written down.
Are you buying disbelief or waiting for the crowd to flip? 👇
Tell me the level that would kill this idea for you.
Not investment advice - research on your own! 🚀
$BTC
{spot}(BTCUSDT)
Watching BTC Run Without You Is the Real Pain
That feeling is everywhere right now. Price can keep moving while the crowd is still arguing that nothing actually changed.
🔥 Why I am watching
- Disbelief is still the dominant mood.
- The trend shift is already on the chart.
- Missing the run hurts more than a planned dip entry.
- I would rather buy weakness than chase a late green candle.
👀 What the old cycle showed
- 2023 bull sweeps under the established low stayed tight.
- The deepest break was around 8 percent.
- Several only went 4 to 5 percent before the bounce.
- The current established low on this read is 82.5K.
- History says the deviation should stay small if the same behavior holds.
💧 How I would play it
1. Wait for a fast dip toward 82.5K.
2. Look for a quick buy reaction, not a slow bleed.
3. Keep leverage low and size already defined.
4. Step away if the low is lost and not reclaimed.
🚀 My trade idea
- Bias: Long the dip
- Trigger: controlled buying if BTC sweeps toward 82.5K and reacts fast
- Target: continuation on the ATH path if that low is reclaimed
- Invalidation: a deeper break under 82.5K with no quick reclaim
- Confidence: 65 percent
A fast dip is only useful if the risk line is already written down.
Are you buying disbelief or waiting for the crowd to flip? 👇
Tell me the level that would kill this idea for you.
Not investment advice - research on your own! 🚀
$BTC
That feeling is everywhere right now. Price can keep moving while the crowd is still arguing that nothing actually changed.
🔥 Why I am watching
- Disbelief is still the dominant mood.
- The trend shift is already on the chart.
- Missing the run hurts more than a planned dip entry.
- I would rather buy weakness than chase a late green candle.
👀 What the old cycle showed
- 2023 bull sweeps under the established low stayed tight.
- The deepest break was around 8 percent.
- Several only went 4 to 5 percent before the bounce.
- The current established low on this read is 82.5K.
- History says the deviation should stay small if the same behavior holds.
💧 How I would play it
1. Wait for a fast dip toward 82.5K.
2. Look for a quick buy reaction, not a slow bleed.
3. Keep leverage low and size already defined.
4. Step away if the low is lost and not reclaimed.
🚀 My trade idea
- Bias: Long the dip
- Trigger: controlled buying if BTC sweeps toward 82.5K and reacts fast
- Target: continuation on the ATH path if that low is reclaimed
- Invalidation: a deeper break under 82.5K with no quick reclaim
- Confidence: 65 percent
A fast dip is only useful if the risk line is already written down.
Are you buying disbelief or waiting for the crowd to flip? 👇
Tell me the level that would kill this idea for you.
Not investment advice - research on your own! 🚀
$BTC
29
·
--
Bullish
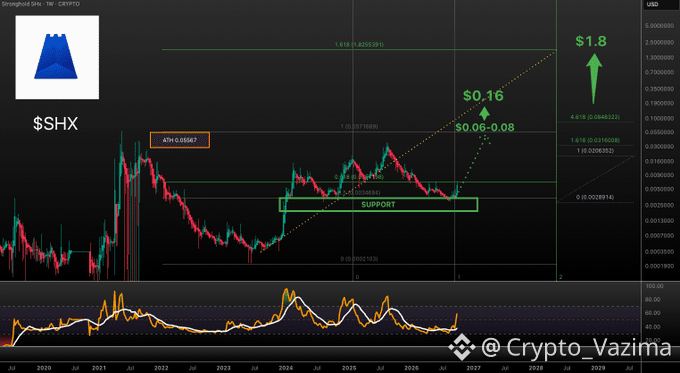
SHX Just Started Sending and the Cycle Map Is Loud
This is the part I like. SHX finally lifted off the weekly support zone instead of dying inside it.
🔥 Why I am watching
- The chart spent a long time respecting that support box.
- Price has started to react higher from it.
- Prior ATH near 0.05567 is still overhead, so the move is early.
- Lower momentum lines are turning up with the bounce.
- A dotted rising path is already drawn toward the higher marks.
🚀 The path on the chart
- First zone marked is 0.06-0.08.
- Cycle band from the note is 0.08-0.16.
- 1.8 only shows up as a distant extension if time does the work.
- I am not treating 1.8 like a this-month target.
- Extension levels match the same story, but price still has to earn them.
🎯 My trade idea
- Bias: Long
- Trigger: Support holds and the bounce keeps printing
- Target: 0.08-0.16 for this cycle
- Invalidation: Weekly loss of the marked support
- Confidence: 63 percent
🛡 Where I step back
- No hold of support, no long for me.
- A failed bounce puts sellers back in control.
- Big targets mean nothing if the base breaks.
- I would rather miss the first candles than chase a weak lift.
Is this the real send, or just a bounce for you? 👇
Tell me the confirmation you need before you trust it.
Not investment advice - research on your own! 🚀
$SHX
SHX Just Started Sending and the Cycle Map Is Loud
This is the part I like. SHX finally lifted off the weekly support zone instead of dying inside it.
🔥 Why I am watching
- The chart spent a long time respecting that support box.
- Price has started to react higher from it.
- Prior ATH near 0.05567 is still overhead, so the move is early.
- Lower momentum lines are turning up with the bounce.
- A dotted rising path is already drawn toward the higher marks.
🚀 The path on the chart
- First zone marked is 0.06-0.08.
- Cycle band from the note is 0.08-0.16.
- 1.8 only shows up as a distant extension if time does the work.
- I am not treating 1.8 like a this-month target.
- Extension levels match the same story, but price still has to earn them.
🎯 My trade idea
- Bias: Long
- Trigger: Support holds and the bounce keeps printing
- Target: 0.08-0.16 for this cycle
- Invalidation: Weekly loss of the marked support
- Confidence: 63 percent
🛡 Where I step back
- No hold of support, no long for me.
- A failed bounce puts sellers back in control.
- Big targets mean nothing if the base breaks.
- I would rather miss the first candles than chase a weak lift.
Is this the real send, or just a bounce for you? 👇
Tell me the confirmation you need before you trust it.
Not investment advice - research on your own! 🚀
$SHX
This is the part I like. SHX finally lifted off the weekly support zone instead of dying inside it.
🔥 Why I am watching
- The chart spent a long time respecting that support box.
- Price has started to react higher from it.
- Prior ATH near 0.05567 is still overhead, so the move is early.
- Lower momentum lines are turning up with the bounce.
- A dotted rising path is already drawn toward the higher marks.
🚀 The path on the chart
- First zone marked is 0.06-0.08.
- Cycle band from the note is 0.08-0.16.
- 1.8 only shows up as a distant extension if time does the work.
- I am not treating 1.8 like a this-month target.
- Extension levels match the same story, but price still has to earn them.
🎯 My trade idea
- Bias: Long
- Trigger: Support holds and the bounce keeps printing
- Target: 0.08-0.16 for this cycle
- Invalidation: Weekly loss of the marked support
- Confidence: 63 percent
🛡 Where I step back
- No hold of support, no long for me.
- A failed bounce puts sellers back in control.
- Big targets mean nothing if the base breaks.
- I would rather miss the first candles than chase a weak lift.
Is this the real send, or just a bounce for you? 👇
Tell me the confirmation you need before you trust it.
Not investment advice - research on your own! 🚀
$SHX
·
--
Bullish
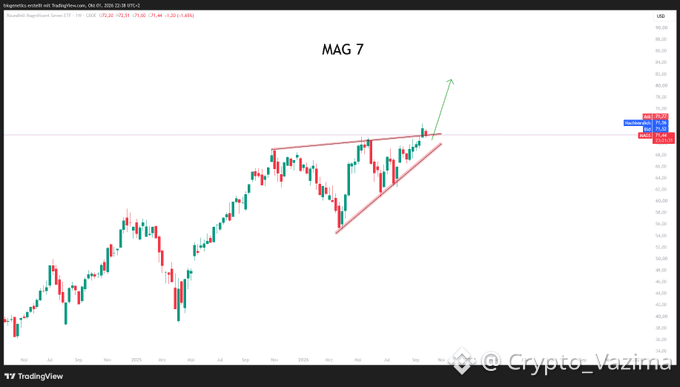
MAGS Is Not Done, and the Chart Is Keeping It Simple
This is the kind of chart that does not need a complicated story. MAGS is back at the line, and the view is still that the move has room.
🔥 Why I am watching
- Price is back at the weekly ceiling near 72.
- The structure underneath is still rising.
- Earlier dips formed rounded recoveries, not a broken trend.
- The update is blunt: still not done.
🚀 The reaction I want
- Buyers need to turn this touch into a real hold.
- A soft red week is fine if the structure stays intact.
- I do not want a fake poke that dies at the line.
- Simple charts get messy when people chase the first touch.
👀 The part that matters
- The old supply band near this same area is the real test.
- Last time price cooled, the dip was bought before the trend broke.
- If that behavior repeats, the upper line becomes a launch area.
- If it does not, this is just another stall at resistance.
🎯 My trade idea
- Bias: Long
- Trigger: Hold above the upper weekly line
- Invalidation: Rising support gives way
- Confidence: 63 percent
🛡 Where I step back
- If the break gets rejected and price slips back under the line, I wait.
- If the rising base fails, the simple long idea is done for me.
Are you treating this as continuation or just another test? 👇
Tell me the signal that would make you stay in.
Not investment advice - research on your own! 🚀
$MAGS
MAGS Is Not Done, and the Chart Is Keeping It Simple
This is the kind of chart that does not need a complicated story. MAGS is back at the line, and the view is still that the move has room.
🔥 Why I am watching
- Price is back at the weekly ceiling near 72.
- The structure underneath is still rising.
- Earlier dips formed rounded recoveries, not a broken trend.
- The update is blunt: still not done.
🚀 The reaction I want
- Buyers need to turn this touch into a real hold.
- A soft red week is fine if the structure stays intact.
- I do not want a fake poke that dies at the line.
- Simple charts get messy when people chase the first touch.
👀 The part that matters
- The old supply band near this same area is the real test.
- Last time price cooled, the dip was bought before the trend broke.
- If that behavior repeats, the upper line becomes a launch area.
- If it does not, this is just another stall at resistance.
🎯 My trade idea
- Bias: Long
- Trigger: Hold above the upper weekly line
- Invalidation: Rising support gives way
- Confidence: 63 percent
🛡 Where I step back
- If the break gets rejected and price slips back under the line, I wait.
- If the rising base fails, the simple long idea is done for me.
Are you treating this as continuation or just another test? 👇
Tell me the signal that would make you stay in.
Not investment advice - research on your own! 🚀
$MAGS
This is the kind of chart that does not need a complicated story. MAGS is back at the line, and the view is still that the move has room.
🔥 Why I am watching
- Price is back at the weekly ceiling near 72.
- The structure underneath is still rising.
- Earlier dips formed rounded recoveries, not a broken trend.
- The update is blunt: still not done.
🚀 The reaction I want
- Buyers need to turn this touch into a real hold.
- A soft red week is fine if the structure stays intact.
- I do not want a fake poke that dies at the line.
- Simple charts get messy when people chase the first touch.
👀 The part that matters
- The old supply band near this same area is the real test.
- Last time price cooled, the dip was bought before the trend broke.
- If that behavior repeats, the upper line becomes a launch area.
- If it does not, this is just another stall at resistance.
🎯 My trade idea
- Bias: Long
- Trigger: Hold above the upper weekly line
- Invalidation: Rising support gives way
- Confidence: 63 percent
🛡 Where I step back
- If the break gets rejected and price slips back under the line, I wait.
- If the rising base fails, the simple long idea is done for me.
Are you treating this as continuation or just another test? 👇
Tell me the signal that would make you stay in.
Not investment advice - research on your own! 🚀
$MAGS
3
·
--
Bullish
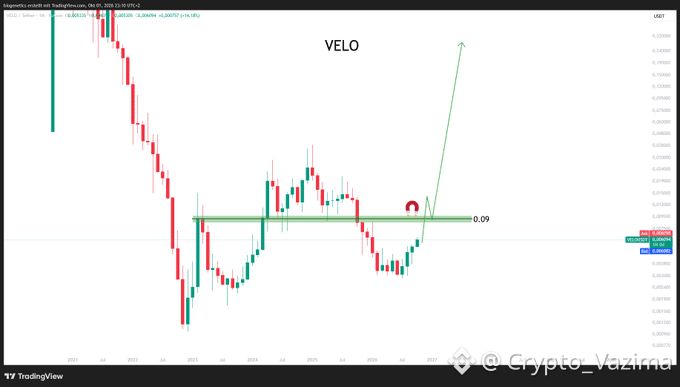
VELO Looks Ready to Wake Up If This Band Breaks 🔥
This monthly chart has that quiet-before-the-move feel. VELO is not running yet, but the arrow above the level says the bigger leg only starts once price clears it.
🔥 Why I am watching
- Years of downside left a deep base.
- Price is lifting off the lows toward one flat band.
- A magnet is sitting right on that level.
- The green arrow only starts after the band.
🚀 The part that matters
- Under the band, I am not chasing.
- The idea gets interesting only if the band breaks and holds.
- A rejection there puts sellers back in control.
- One strong monthly close is the proof I want.
🎯 My trade idea
- Bias: Long after confirmation
- Trigger: Break and hold of the marked horizontal band
- Target: Upside is projected, but no number is given
- Invalidation: Failed break and a drop back into the base
- Confidence: 64 percent
🛡 Where I step back
- If the band rejects price cleanly.
- If the monthly candle closes back inside the base.
- If the bounce fades without follow-through.
Are you treating this band as the real trigger? 👇
Drop the confirmation you need before touching VELO.
Not investment advice - research on your own! 🚀
$VELO
{alpha}(560xf486ad071f3bee968384d2e39e2d8af0fcf6fd46)
VELO Looks Ready to Wake Up If This Band Breaks 🔥
This monthly chart has that quiet-before-the-move feel. VELO is not running yet, but the arrow above the level says the bigger leg only starts once price clears it.
🔥 Why I am watching
- Years of downside left a deep base.
- Price is lifting off the lows toward one flat band.
- A magnet is sitting right on that level.
- The green arrow only starts after the band.
🚀 The part that matters
- Under the band, I am not chasing.
- The idea gets interesting only if the band breaks and holds.
- A rejection there puts sellers back in control.
- One strong monthly close is the proof I want.
🎯 My trade idea
- Bias: Long after confirmation
- Trigger: Break and hold of the marked horizontal band
- Target: Upside is projected, but no number is given
- Invalidation: Failed break and a drop back into the base
- Confidence: 64 percent
🛡 Where I step back
- If the band rejects price cleanly.
- If the monthly candle closes back inside the base.
- If the bounce fades without follow-through.
Are you treating this band as the real trigger? 👇
Drop the confirmation you need before touching VELO.
Not investment advice - research on your own! 🚀
$VELO
This monthly chart has that quiet-before-the-move feel. VELO is not running yet, but the arrow above the level says the bigger leg only starts once price clears it.
🔥 Why I am watching
- Years of downside left a deep base.
- Price is lifting off the lows toward one flat band.
- A magnet is sitting right on that level.
- The green arrow only starts after the band.
🚀 The part that matters
- Under the band, I am not chasing.
- The idea gets interesting only if the band breaks and holds.
- A rejection there puts sellers back in control.
- One strong monthly close is the proof I want.
🎯 My trade idea
- Bias: Long after confirmation
- Trigger: Break and hold of the marked horizontal band
- Target: Upside is projected, but no number is given
- Invalidation: Failed break and a drop back into the base
- Confidence: 64 percent
🛡 Where I step back
- If the band rejects price cleanly.
- If the monthly candle closes back inside the base.
- If the bounce fades without follow-through.
Are you treating this band as the real trigger? 👇
Drop the confirmation you need before touching VELO.
Not investment advice - research on your own! 🚀
$VELO
18
·
--
Bullish
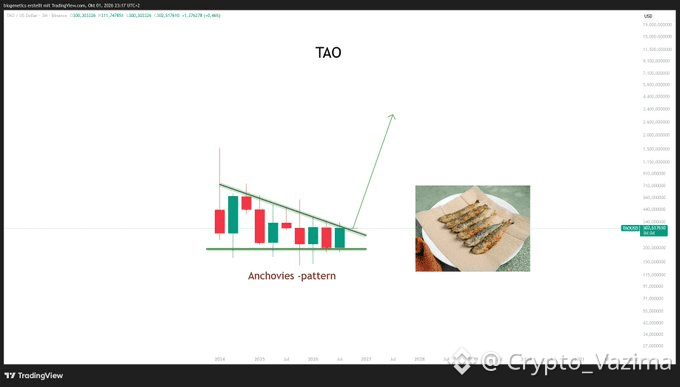
TAO Looks Packed Tight and the Chart Wants Air 🔥
This quarterly TAO chart is squeezed tight, and the arrow is already pointing up. For me the exciting part is the coil, not a blind chase.
🔥 Why I am watching
- Candles are getting smaller under a falling lid.
- The floor underneath is still flat and respected.
- The pattern name fits the picture: Anchovies, packed and compressed.
- Quiet high timeframe charts can turn loud once the lid gives way.
🚀 The squeeze
- This is a quarterly coil, not a random lower timeframe wiggle.
- Upside only makes sense after buyers clear the descending line.
- I do not want the middle of the range.
- The move I care about starts after the break holds.
⚡ What would excite me
- A real close through the falling resistance.
- Follow-through instead of an instant fade.
- The base staying untouched while price leaves the coil.
🛡 Where I step back
- A failed break back under the line kills the idea.
- A clean loss of the flat base flips the read.
- No hold means no trade for me.
🎯 My trade idea
- Bias: Long
- Trigger: break and hold over the falling resistance
- Invalidation: base loss or instant rejection
- Confidence: 63 percent
Would you wait for the break or are you already leaning in on TAO? 👇
Tell me the risk line you would actually respect here.
Not investment advice - research on your own! 🚀
$TAO
{future}(TAOUSDT)
TAO Looks Packed Tight and the Chart Wants Air 🔥
This quarterly TAO chart is squeezed tight, and the arrow is already pointing up. For me the exciting part is the coil, not a blind chase.
🔥 Why I am watching
- Candles are getting smaller under a falling lid.
- The floor underneath is still flat and respected.
- The pattern name fits the picture: Anchovies, packed and compressed.
- Quiet high timeframe charts can turn loud once the lid gives way.
🚀 The squeeze
- This is a quarterly coil, not a random lower timeframe wiggle.
- Upside only makes sense after buyers clear the descending line.
- I do not want the middle of the range.
- The move I care about starts after the break holds.
⚡ What would excite me
- A real close through the falling resistance.
- Follow-through instead of an instant fade.
- The base staying untouched while price leaves the coil.
🛡 Where I step back
- A failed break back under the line kills the idea.
- A clean loss of the flat base flips the read.
- No hold means no trade for me.
🎯 My trade idea
- Bias: Long
- Trigger: break and hold over the falling resistance
- Invalidation: base loss or instant rejection
- Confidence: 63 percent
Would you wait for the break or are you already leaning in on TAO? 👇
Tell me the risk line you would actually respect here.
Not investment advice - research on your own! 🚀
$TAO
This quarterly TAO chart is squeezed tight, and the arrow is already pointing up. For me the exciting part is the coil, not a blind chase.
🔥 Why I am watching
- Candles are getting smaller under a falling lid.
- The floor underneath is still flat and respected.
- The pattern name fits the picture: Anchovies, packed and compressed.
- Quiet high timeframe charts can turn loud once the lid gives way.
🚀 The squeeze
- This is a quarterly coil, not a random lower timeframe wiggle.
- Upside only makes sense after buyers clear the descending line.
- I do not want the middle of the range.
- The move I care about starts after the break holds.
⚡ What would excite me
- A real close through the falling resistance.
- Follow-through instead of an instant fade.
- The base staying untouched while price leaves the coil.
🛡 Where I step back
- A failed break back under the line kills the idea.
- A clean loss of the flat base flips the read.
- No hold means no trade for me.
🎯 My trade idea
- Bias: Long
- Trigger: break and hold over the falling resistance
- Invalidation: base loss or instant rejection
- Confidence: 63 percent
Would you wait for the break or are you already leaning in on TAO? 👇
Tell me the risk line you would actually respect here.
Not investment advice - research on your own! 🚀
$TAO
154
·
--
Bullish
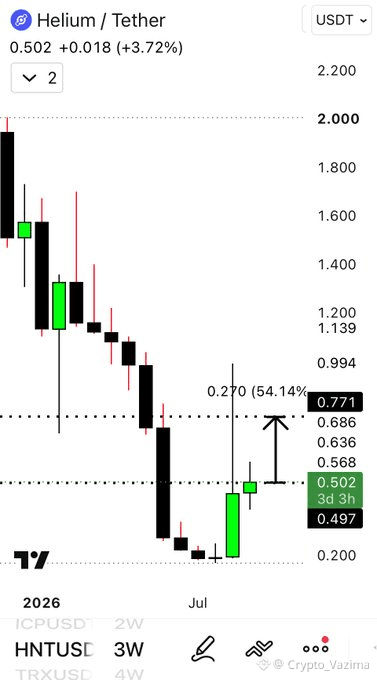
HNT Just Woke Up and the 50X Map Is Still Open 🔥
This chart has my attention because the first target is already drawn, and the bigger DePIN story is still sitting in the background. I like the energy, but I am not buying the whole 50X speech yet.
🔥 Why I am watching
- DePIN name, small-cap list, token №24.
- 50X from the bear bottom is the big claim.
- First checkpoint is the 54% push toward 0.771.
- Update chart is near 0.502 after the earlier 0.95 share.
🚀 The part that matters
- Old map used a 177M market cap and a 1.7B picture at 9.15.
- That share already said wait for a pullback because it was running.
- Price is lower now, so the pullback note actually showed up.
- I still want 0.771 respected before I treat the long path as active.
👀 Where I stay patient
- No clean hold near 0.502, no interest from me.
- A push into 0.771 is the confirmation I want.
- Failure back toward 0.200 kills the first-target idea.
- The 50X line can wait. The chart has to earn it.
🎯 My trade idea
- Bias: Long
- Trigger: bounce holds and 0.771 comes into play
- Target: 0.771 first
- Invalidation: back under the 0.200 base
- Confidence: 61 percent
Would you wait for 0.771 or are you already dreaming the 50X? 👇
Tell me the confirmation you need before you touch it.
Not investment advice - research on your own! 🚀
$HNT
HNT Just Woke Up and the 50X Map Is Still Open 🔥
This chart has my attention because the first target is already drawn, and the bigger DePIN story is still sitting in the background. I like the energy, but I am not buying the whole 50X speech yet.
🔥 Why I am watching
- DePIN name, small-cap list, token №24.
- 50X from the bear bottom is the big claim.
- First checkpoint is the 54% push toward 0.771.
- Update chart is near 0.502 after the earlier 0.95 share.
🚀 The part that matters
- Old map used a 177M market cap and a 1.7B picture at 9.15.
- That share already said wait for a pullback because it was running.
- Price is lower now, so the pullback note actually showed up.
- I still want 0.771 respected before I treat the long path as active.
👀 Where I stay patient
- No clean hold near 0.502, no interest from me.
- A push into 0.771 is the confirmation I want.
- Failure back toward 0.200 kills the first-target idea.
- The 50X line can wait. The chart has to earn it.
🎯 My trade idea
- Bias: Long
- Trigger: bounce holds and 0.771 comes into play
- Target: 0.771 first
- Invalidation: back under the 0.200 base
- Confidence: 61 percent
Would you wait for 0.771 or are you already dreaming the 50X? 👇
Tell me the confirmation you need before you touch it.
Not investment advice - research on your own! 🚀
$HNT
This chart has my attention because the first target is already drawn, and the bigger DePIN story is still sitting in the background. I like the energy, but I am not buying the whole 50X speech yet.
🔥 Why I am watching
- DePIN name, small-cap list, token №24.
- 50X from the bear bottom is the big claim.
- First checkpoint is the 54% push toward 0.771.
- Update chart is near 0.502 after the earlier 0.95 share.
🚀 The part that matters
- Old map used a 177M market cap and a 1.7B picture at 9.15.
- That share already said wait for a pullback because it was running.
- Price is lower now, so the pullback note actually showed up.
- I still want 0.771 respected before I treat the long path as active.
👀 Where I stay patient
- No clean hold near 0.502, no interest from me.
- A push into 0.771 is the confirmation I want.
- Failure back toward 0.200 kills the first-target idea.
- The 50X line can wait. The chart has to earn it.
🎯 My trade idea
- Bias: Long
- Trigger: bounce holds and 0.771 comes into play
- Target: 0.771 first
- Invalidation: back under the 0.200 base
- Confidence: 61 percent
Would you wait for 0.771 or are you already dreaming the 50X? 👇
Tell me the confirmation you need before you touch it.
Not investment advice - research on your own! 🚀
$HNT
3
·
--
Bullish
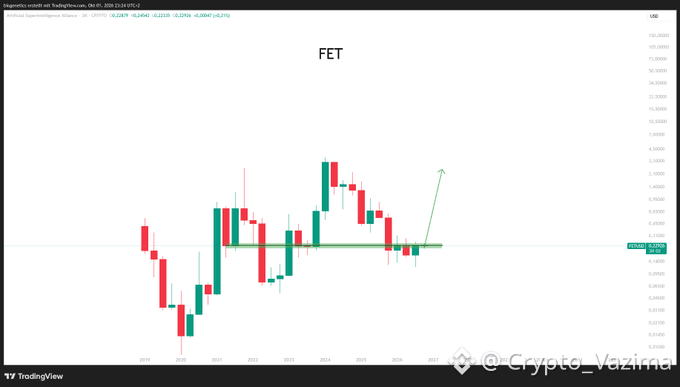
FET Could Go Boom If Buyers Refuse to Lose This Floor
This is the kind of chart that looks boring until it is not. FET is back on a long-term line near 0.23, the cool-down has already done a lot of work, and the simple message is that the next boom can load right here.
🔥 Why I am watching
- Price is not lost in the middle of nowhere.
- It is sitting on a horizontal floor that has mattered for years.
- The drop from the 2024 high has cooled into this same zone.
- The upside path on the chart is the whole idea: expansion off support.
🚀 The reaction I want
- Buyers defend the line instead of giving it away.
- The base stops drifting and starts lifting.
- The first push holds, so this is not just another bounce that dies.
- Momentum shows up as distance from the floor, not hope.
🛡 Where I step back
- I do not chase a break under the floor.
- A clean loss of this support kills the simple long idea for me.
- No hold, no boom story.
- I would rather miss the first candle than buy a broken base.
🎯 My trade idea
- Bias: Long
- Trigger: defended support plus expansion away from the line
- Invalidation: clean loss of the long-term floor
- Confidence: 63 percent
Would you buy the base or wait for the first real lift? 👇
Drop the confirmation that would make you trust this FET floor.
Not investment advice - research on your own! 🚀
$FET
{future}(FETUSDT)
FET Could Go Boom If Buyers Refuse to Lose This Floor
This is the kind of chart that looks boring until it is not. FET is back on a long-term line near 0.23, the cool-down has already done a lot of work, and the simple message is that the next boom can load right here.
🔥 Why I am watching
- Price is not lost in the middle of nowhere.
- It is sitting on a horizontal floor that has mattered for years.
- The drop from the 2024 high has cooled into this same zone.
- The upside path on the chart is the whole idea: expansion off support.
🚀 The reaction I want
- Buyers defend the line instead of giving it away.
- The base stops drifting and starts lifting.
- The first push holds, so this is not just another bounce that dies.
- Momentum shows up as distance from the floor, not hope.
🛡 Where I step back
- I do not chase a break under the floor.
- A clean loss of this support kills the simple long idea for me.
- No hold, no boom story.
- I would rather miss the first candle than buy a broken base.
🎯 My trade idea
- Bias: Long
- Trigger: defended support plus expansion away from the line
- Invalidation: clean loss of the long-term floor
- Confidence: 63 percent
Would you buy the base or wait for the first real lift? 👇
Drop the confirmation that would make you trust this FET floor.
Not investment advice - research on your own! 🚀
$FET
This is the kind of chart that looks boring until it is not. FET is back on a long-term line near 0.23, the cool-down has already done a lot of work, and the simple message is that the next boom can load right here.
🔥 Why I am watching
- Price is not lost in the middle of nowhere.
- It is sitting on a horizontal floor that has mattered for years.
- The drop from the 2024 high has cooled into this same zone.
- The upside path on the chart is the whole idea: expansion off support.
🚀 The reaction I want
- Buyers defend the line instead of giving it away.
- The base stops drifting and starts lifting.
- The first push holds, so this is not just another bounce that dies.
- Momentum shows up as distance from the floor, not hope.
🛡 Where I step back
- I do not chase a break under the floor.
- A clean loss of this support kills the simple long idea for me.
- No hold, no boom story.
- I would rather miss the first candle than buy a broken base.
🎯 My trade idea
- Bias: Long
- Trigger: defended support plus expansion away from the line
- Invalidation: clean loss of the long-term floor
- Confidence: 63 percent
Would you buy the base or wait for the first real lift? 👇
Drop the confirmation that would make you trust this FET floor.
Not investment advice - research on your own! 🚀
$FET
171
·
--
Bullish
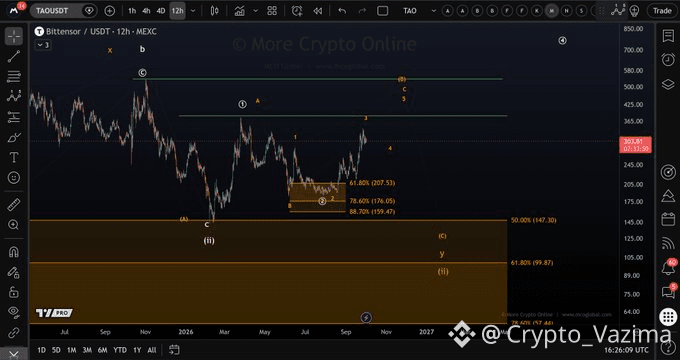
TAO Buyers Are Walking Straight Into the Next Wall 🔥
This bounce looks alive, but alive is not the same as confirmed. TAO near 304 is pressing into the next resistance, and that is where excitement usually gets tested.
🔥 Why I am watching
- The 12h push is real, but it is still under resistance.
- Buyers defended the fib pocket at 207.53, 176.05, and 159.47.
- That hold built the bounce. It does not clear the next ceiling.
- A higher resistance line is still waiting above this one.
🚀 The reaction I want
- A clean hold above the next resistance.
- No instant rejection back into the range.
- Follow-through that keeps the recovery intact.
- If that fails, the hype cools fast.
👀 The part that matters
- The dip zone did its job already.
- The next job belongs to resistance.
- Lose the bounce toward 207 and the story weakens.
- The deeper band near 147.30 only matters if this push fails hard.
🎯 My trade idea
- Bias: Wait
- Trigger: resistance break and hold
- Invalidation: rejection that sends price back toward 207
- Confidence: 61 percent
I like the story only after the wall gives way. Until then, I am watching, not chasing.
Does this resistance reject TAO or finally let it through? 👇
Tell me the signal that would make you act.
Not investment advice - research on your own! 🚀
$TAO
{future}(TAOUSDT)
TAO Buyers Are Walking Straight Into the Next Wall 🔥
This bounce looks alive, but alive is not the same as confirmed. TAO near 304 is pressing into the next resistance, and that is where excitement usually gets tested.
🔥 Why I am watching
- The 12h push is real, but it is still under resistance.
- Buyers defended the fib pocket at 207.53, 176.05, and 159.47.
- That hold built the bounce. It does not clear the next ceiling.
- A higher resistance line is still waiting above this one.
🚀 The reaction I want
- A clean hold above the next resistance.
- No instant rejection back into the range.
- Follow-through that keeps the recovery intact.
- If that fails, the hype cools fast.
👀 The part that matters
- The dip zone did its job already.
- The next job belongs to resistance.
- Lose the bounce toward 207 and the story weakens.
- The deeper band near 147.30 only matters if this push fails hard.
🎯 My trade idea
- Bias: Wait
- Trigger: resistance break and hold
- Invalidation: rejection that sends price back toward 207
- Confidence: 61 percent
I like the story only after the wall gives way. Until then, I am watching, not chasing.
Does this resistance reject TAO or finally let it through? 👇
Tell me the signal that would make you act.
Not investment advice - research on your own! 🚀
$TAO
This bounce looks alive, but alive is not the same as confirmed. TAO near 304 is pressing into the next resistance, and that is where excitement usually gets tested.
🔥 Why I am watching
- The 12h push is real, but it is still under resistance.
- Buyers defended the fib pocket at 207.53, 176.05, and 159.47.
- That hold built the bounce. It does not clear the next ceiling.
- A higher resistance line is still waiting above this one.
🚀 The reaction I want
- A clean hold above the next resistance.
- No instant rejection back into the range.
- Follow-through that keeps the recovery intact.
- If that fails, the hype cools fast.
👀 The part that matters
- The dip zone did its job already.
- The next job belongs to resistance.
- Lose the bounce toward 207 and the story weakens.
- The deeper band near 147.30 only matters if this push fails hard.
🎯 My trade idea
- Bias: Wait
- Trigger: resistance break and hold
- Invalidation: rejection that sends price back toward 207
- Confidence: 61 percent
I like the story only after the wall gives way. Until then, I am watching, not chasing.
Does this resistance reject TAO or finally let it through? 👇
Tell me the signal that would make you act.
Not investment advice - research on your own! 🚀
$TAO
108
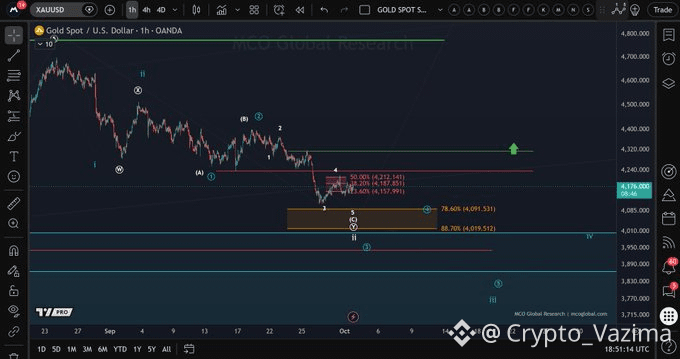
XAUUSD Looks Ready to Turn, But Resistance Is Still Winning 🔥
This is the annoying part of a deep gold pullback. Wave ii can end any moment, and still there is no green light while resistance holds.
🔥 Why I am watching
- The pullback is already deep enough to be done.
- Sellers have not lost the overhead levels yet.
- Every resistance is still doing its job.
- 4,252 is the first hint the low is actually in.
🚀 The flip I want
Hope is not the trigger. A move through 4,252 is. Until that prints, this is still a waiting game, not a victory lap for buyers.
👀 The part that matters
1. Watch 4,252 first.
2. Need a hold, not just a wick through it.
3. If resistance rejects again, I stay out.
💧 Execution angle
I would rather miss the first bounce than buy a pullback that still cannot clear resistance. The interesting part starts only after 4,252 stops being a ceiling.
🎯 My trade idea
- Bias: Wait
- Trigger: 4,252 reclaim as proof the low is in
- Invalidation: Continued rejection while resistance holds
- Confidence: 60 percent until buyers clear that level
Are you calling the gold low now, or only after 4,252? 👇
Tell me the exact signal that would get you long here.
Not investment advice - research on your own! 🚀
$XAUT
{future}(XAUTUSDT)
XAUUSD Looks Ready to Turn, But Resistance Is Still Winning 🔥
This is the annoying part of a deep gold pullback. Wave ii can end any moment, and still there is no green light while resistance holds.
🔥 Why I am watching
- The pullback is already deep enough to be done.
- Sellers have not lost the overhead levels yet.
- Every resistance is still doing its job.
- 4,252 is the first hint the low is actually in.
🚀 The flip I want
Hope is not the trigger. A move through 4,252 is. Until that prints, this is still a waiting game, not a victory lap for buyers.
👀 The part that matters
1. Watch 4,252 first.
2. Need a hold, not just a wick through it.
3. If resistance rejects again, I stay out.
💧 Execution angle
I would rather miss the first bounce than buy a pullback that still cannot clear resistance. The interesting part starts only after 4,252 stops being a ceiling.
🎯 My trade idea
- Bias: Wait
- Trigger: 4,252 reclaim as proof the low is in
- Invalidation: Continued rejection while resistance holds
- Confidence: 60 percent until buyers clear that level
Are you calling the gold low now, or only after 4,252? 👇
Tell me the exact signal that would get you long here.
Not investment advice - research on your own! 🚀
$XAUT
This is the annoying part of a deep gold pullback. Wave ii can end any moment, and still there is no green light while resistance holds.
🔥 Why I am watching
- The pullback is already deep enough to be done.
- Sellers have not lost the overhead levels yet.
- Every resistance is still doing its job.
- 4,252 is the first hint the low is actually in.
🚀 The flip I want
Hope is not the trigger. A move through 4,252 is. Until that prints, this is still a waiting game, not a victory lap for buyers.
👀 The part that matters
1. Watch 4,252 first.
2. Need a hold, not just a wick through it.
3. If resistance rejects again, I stay out.
💧 Execution angle
I would rather miss the first bounce than buy a pullback that still cannot clear resistance. The interesting part starts only after 4,252 stops being a ceiling.
🎯 My trade idea
- Bias: Wait
- Trigger: 4,252 reclaim as proof the low is in
- Invalidation: Continued rejection while resistance holds
- Confidence: 60 percent until buyers clear that level
Are you calling the gold low now, or only after 4,252? 👇
Tell me the exact signal that would get you long here.
Not investment advice - research on your own! 🚀
$XAUT
1
177
·
--
Bullish
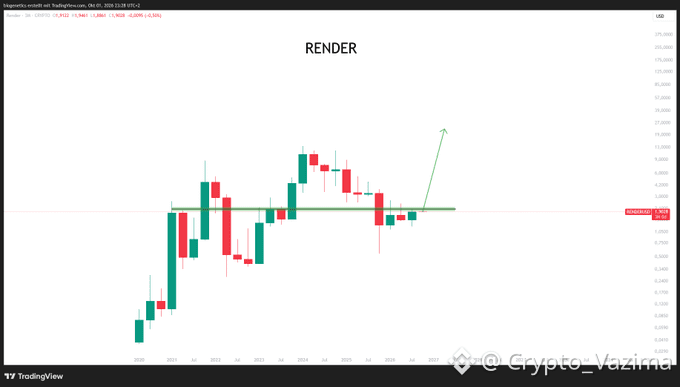
RENDER Still Looks Like a Sit-Tight Chart to Me 🔥
This is the kind of chart that tests patience more than skill. RENDER pulled back to a long-term line, and the higher timeframe still points up if you can sit still.
🔥 Why I am watching
- Around 1.90, price is parked near a multi-year horizontal.
- The big run already happened once, then the market gave most of it back.
- A green projection points higher, but the real message is hold, not hunt.
- I do not want to turn a quarterly idea into a daily chase.
🚀 The part that matters
- Boring can be bullish when the higher timeframe has not broken.
- The mistake is treating every red quarter like the thesis died.
- The other mistake is buying just because an arrow points up.
🎯 My trade idea
- Bias: Hold
- Trigger: price keeps the long horizontal intact
- Entry logic: no fresh chase while it is still under the line
- Invalidation: decisive loss of that line and no fast reclaim
- Confidence: 63 percent
🛡 Where I step back
- I step back if the long line fails and stays lost.
- I also step back from adding if this is only hope, not structure.
- No confirmation, no new trade. Holding is not the same as forcing size.
Are you holding RENDER or still waiting for a cleaner entry? 👇
Tell me if patience is your plan too.
Not investment advice - research on your own! 🚀
$RENDER
{future}(RENDERUSDT)
RENDER Still Looks Like a Sit-Tight Chart to Me 🔥
This is the kind of chart that tests patience more than skill. RENDER pulled back to a long-term line, and the higher timeframe still points up if you can sit still.
🔥 Why I am watching
- Around 1.90, price is parked near a multi-year horizontal.
- The big run already happened once, then the market gave most of it back.
- A green projection points higher, but the real message is hold, not hunt.
- I do not want to turn a quarterly idea into a daily chase.
🚀 The part that matters
- Boring can be bullish when the higher timeframe has not broken.
- The mistake is treating every red quarter like the thesis died.
- The other mistake is buying just because an arrow points up.
🎯 My trade idea
- Bias: Hold
- Trigger: price keeps the long horizontal intact
- Entry logic: no fresh chase while it is still under the line
- Invalidation: decisive loss of that line and no fast reclaim
- Confidence: 63 percent
🛡 Where I step back
- I step back if the long line fails and stays lost.
- I also step back from adding if this is only hope, not structure.
- No confirmation, no new trade. Holding is not the same as forcing size.
Are you holding RENDER or still waiting for a cleaner entry? 👇
Tell me if patience is your plan too.
Not investment advice - research on your own! 🚀
$RENDER
This is the kind of chart that tests patience more than skill. RENDER pulled back to a long-term line, and the higher timeframe still points up if you can sit still.
🔥 Why I am watching
- Around 1.90, price is parked near a multi-year horizontal.
- The big run already happened once, then the market gave most of it back.
- A green projection points higher, but the real message is hold, not hunt.
- I do not want to turn a quarterly idea into a daily chase.
🚀 The part that matters
- Boring can be bullish when the higher timeframe has not broken.
- The mistake is treating every red quarter like the thesis died.
- The other mistake is buying just because an arrow points up.
🎯 My trade idea
- Bias: Hold
- Trigger: price keeps the long horizontal intact
- Entry logic: no fresh chase while it is still under the line
- Invalidation: decisive loss of that line and no fast reclaim
- Confidence: 63 percent
🛡 Where I step back
- I step back if the long line fails and stays lost.
- I also step back from adding if this is only hope, not structure.
- No confirmation, no new trade. Holding is not the same as forcing size.
Are you holding RENDER or still waiting for a cleaner entry? 👇
Tell me if patience is your plan too.
Not investment advice - research on your own! 🚀
$RENDER
73
·
--
Bullish
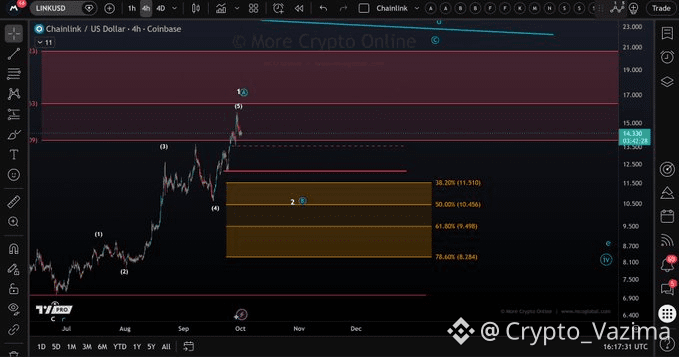
LINK Wave Top Is Not Real Until 13.50 Fails ⚠️
This is the kind of chart that tempts people to call a top too early. I am not doing that. LINK still needs a break below 13.50 before a wave 1/A top is actually signaled.
🔥 Why I am watching
- Price is still hovering near 14.23, right above 13.50.
- The note is clear: 13.50 is the line that signals the top.
- Until that break lands, the upside structure is not finished on this read.
- The deeper area that still matters is 8.28 to 11.50.
🚀 The part that can flip it
- A clean move under 13.50 is the signal, not a small wick.
- If that break holds, the wave 1/A top case gets real.
- If buyers reclaim 13.50 fast, the top call stays weak.
- That is why I am not chasing either side here.
🛡 Where I step back
- I step back from the top idea if 13.50 keeps holding.
- I also do not treat support as lost while 8.28 to 11.50 is untouched.
- The fib marks inside that zone sit at 11.51, 10.46, 9.50, and 8.28.
- Hope is not a trigger. The break is.
🎯 My trade idea
- Bias: Wait
- Trigger: break and hold below 13.50
- Zone if it drops: 8.28 to 11.50
- Invalidation: reclaim of 13.50 kills the top signal
- Confidence: 60 percent this is a confirmation chart, not a chase
Would you call the top now, or only after 13.50 breaks? 👇
Tell me the confirmation you need before you lean either way.
Not investment advice - research on your own! 🚀
$LINK
{future}(LINKUSDT)
LINK Wave Top Is Not Real Until 13.50 Fails ⚠️
This is the kind of chart that tempts people to call a top too early. I am not doing that. LINK still needs a break below 13.50 before a wave 1/A top is actually signaled.
🔥 Why I am watching
- Price is still hovering near 14.23, right above 13.50.
- The note is clear: 13.50 is the line that signals the top.
- Until that break lands, the upside structure is not finished on this read.
- The deeper area that still matters is 8.28 to 11.50.
🚀 The part that can flip it
- A clean move under 13.50 is the signal, not a small wick.
- If that break holds, the wave 1/A top case gets real.
- If buyers reclaim 13.50 fast, the top call stays weak.
- That is why I am not chasing either side here.
🛡 Where I step back
- I step back from the top idea if 13.50 keeps holding.
- I also do not treat support as lost while 8.28 to 11.50 is untouched.
- The fib marks inside that zone sit at 11.51, 10.46, 9.50, and 8.28.
- Hope is not a trigger. The break is.
🎯 My trade idea
- Bias: Wait
- Trigger: break and hold below 13.50
- Zone if it drops: 8.28 to 11.50
- Invalidation: reclaim of 13.50 kills the top signal
- Confidence: 60 percent this is a confirmation chart, not a chase
Would you call the top now, or only after 13.50 breaks? 👇
Tell me the confirmation you need before you lean either way.
Not investment advice - research on your own! 🚀
$LINK
This is the kind of chart that tempts people to call a top too early. I am not doing that. LINK still needs a break below 13.50 before a wave 1/A top is actually signaled.
🔥 Why I am watching
- Price is still hovering near 14.23, right above 13.50.
- The note is clear: 13.50 is the line that signals the top.
- Until that break lands, the upside structure is not finished on this read.
- The deeper area that still matters is 8.28 to 11.50.
🚀 The part that can flip it
- A clean move under 13.50 is the signal, not a small wick.
- If that break holds, the wave 1/A top case gets real.
- If buyers reclaim 13.50 fast, the top call stays weak.
- That is why I am not chasing either side here.
🛡 Where I step back
- I step back from the top idea if 13.50 keeps holding.
- I also do not treat support as lost while 8.28 to 11.50 is untouched.
- The fib marks inside that zone sit at 11.51, 10.46, 9.50, and 8.28.
- Hope is not a trigger. The break is.
🎯 My trade idea
- Bias: Wait
- Trigger: break and hold below 13.50
- Zone if it drops: 8.28 to 11.50
- Invalidation: reclaim of 13.50 kills the top signal
- Confidence: 60 percent this is a confirmation chart, not a chase
Would you call the top now, or only after 13.50 breaks? 👇
Tell me the confirmation you need before you lean either way.
Not investment advice - research on your own! 🚀
$LINK
51
·
--
Bullish
VVV Top Plan Pace Just Got a Lot Faster 🔥
This is the kind of usage shift that makes me sit up. The top tier is not lagging. It is leading.
🚀 The pace shift
- In June, a Max signup showed up about every 2 hours 42 minutes.
- In September, that gap shrank to about every 81 minutes.
- Daily Max signups went from 8.9 to 17.7, almost a double.
- Pro+ climbed 64 percent, from 81.7 to 133.9 a day.
- Pro still grew, up 59 percent to 1,783 a day, but it was the slowest of the three.
👀 The part that matters
- People are not only joining the cheap plan.
- The 68 dollar and 200 dollar tiers are accelerating harder.
- The count is tied to buy-and-burn on new subscriptions, so usage and token flow are linked.
- That is why the mix matters more than a raw user headline.
🛡 Where I step back
- I change my view if Max slips back toward the June cadence.
- I also step back if Pro+ stops outrunning the base plan.
- No fresh growth, no chase from me.
🎯 My trade idea
- Bias: Long
- Trigger: next read still shows Max and Pro+ leading the growth
- Invalidation: top-tier pace fades back toward June
- Confidence: 64 percent
Does faster Max growth change how you see VVV, or not yet? 👇
Tell me the signup pace that would make you pay attention.
Not investment advice - research on your own! 🚀
$VVV
{alpha}(84530xacfe6019ed1a7dc6f7b508c02d1b04ec88cc21bf)
VVV Top Plan Pace Just Got a Lot Faster 🔥
This is the kind of usage shift that makes me sit up. The top tier is not lagging. It is leading.
🚀 The pace shift
- In June, a Max signup showed up about every 2 hours 42 minutes.
- In September, that gap shrank to about every 81 minutes.
- Daily Max signups went from 8.9 to 17.7, almost a double.
- Pro+ climbed 64 percent, from 81.7 to 133.9 a day.
- Pro still grew, up 59 percent to 1,783 a day, but it was the slowest of the three.
👀 The part that matters
- People are not only joining the cheap plan.
- The 68 dollar and 200 dollar tiers are accelerating harder.
- The count is tied to buy-and-burn on new subscriptions, so usage and token flow are linked.
- That is why the mix matters more than a raw user headline.
🛡 Where I step back
- I change my view if Max slips back toward the June cadence.
- I also step back if Pro+ stops outrunning the base plan.
- No fresh growth, no chase from me.
🎯 My trade idea
- Bias: Long
- Trigger: next read still shows Max and Pro+ leading the growth
- Invalidation: top-tier pace fades back toward June
- Confidence: 64 percent
Does faster Max growth change how you see VVV, or not yet? 👇
Tell me the signup pace that would make you pay attention.
Not investment advice - research on your own! 🚀
$VVV
This is the kind of usage shift that makes me sit up. The top tier is not lagging. It is leading.
🚀 The pace shift
- In June, a Max signup showed up about every 2 hours 42 minutes.
- In September, that gap shrank to about every 81 minutes.
- Daily Max signups went from 8.9 to 17.7, almost a double.
- Pro+ climbed 64 percent, from 81.7 to 133.9 a day.
- Pro still grew, up 59 percent to 1,783 a day, but it was the slowest of the three.
👀 The part that matters
- People are not only joining the cheap plan.
- The 68 dollar and 200 dollar tiers are accelerating harder.
- The count is tied to buy-and-burn on new subscriptions, so usage and token flow are linked.
- That is why the mix matters more than a raw user headline.
🛡 Where I step back
- I change my view if Max slips back toward the June cadence.
- I also step back if Pro+ stops outrunning the base plan.
- No fresh growth, no chase from me.
🎯 My trade idea
- Bias: Long
- Trigger: next read still shows Max and Pro+ leading the growth
- Invalidation: top-tier pace fades back toward June
- Confidence: 64 percent
Does faster Max growth change how you see VVV, or not yet? 👇
Tell me the signup pace that would make you pay attention.
Not investment advice - research on your own! 🚀
$VVV
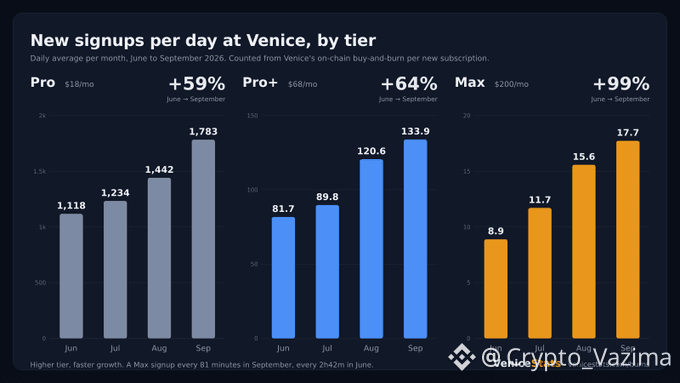
1
253
Crowd Hate on ETH and XRP Got Loud Fast 🔥
The October open did not show up with hope. It showed up with a crowd that suddenly sounds done with ETH and XRP.
🔥 Why I am watching
- ETH social ratio dropped to 0.89 bullish comments per bearish comment.
- Lowest ETH reading since June 7.
- XRP is colder at 0.67, lowest since August 17.
- Under 1.0, bearish talk is the majority.
🚀 The part that hits
When everyone is sure the next move is down, a chunk of the scared selling can already be behind us. Quiet fear has often been a better backdrop than the obvious dip-buy party. That is the only reason this mood shift has my attention.
⚡ Crowd check
- Commentary is unusually one-sided on both names.
- That is an emotion extreme, not a confirmed reversal.
- I want patience here, not a hero entry.
🛡 Where I step back
No guaranteed bounce here. If the sell narrative gets louder and price keeps breaking, I stay out. Fear by itself is not my entry.
🎯 My trade idea
- Bias: Wait
- Trigger: crowd stays negative while price holds a base
- Invalidation: fresh breakdown with no buyer response
- Confidence: 60 percent this is early, not actionable yet
Would you fade this crowd or stay flat until price agrees? 👇
Tell me the invalidation you would actually respect.
Not investment advice - research on your own! 🚀
$ETH $XRP
Crowd Hate on ETH and XRP Got Loud Fast 🔥
The October open did not show up with hope. It showed up with a crowd that suddenly sounds done with ETH and XRP.
🔥 Why I am watching
- ETH social ratio dropped to 0.89 bullish comments per bearish comment.
- Lowest ETH reading since June 7.
- XRP is colder at 0.67, lowest since August 17.
- Under 1.0, bearish talk is the majority.
🚀 The part that hits
When everyone is sure the next move is down, a chunk of the scared selling can already be behind us. Quiet fear has often been a better backdrop than the obvious dip-buy party. That is the only reason this mood shift has my attention.
⚡ Crowd check
- Commentary is unusually one-sided on both names.
- That is an emotion extreme, not a confirmed reversal.
- I want patience here, not a hero entry.
🛡 Where I step back
No guaranteed bounce here. If the sell narrative gets louder and price keeps breaking, I stay out. Fear by itself is not my entry.
🎯 My trade idea
- Bias: Wait
- Trigger: crowd stays negative while price holds a base
- Invalidation: fresh breakdown with no buyer response
- Confidence: 60 percent this is early, not actionable yet
Would you fade this crowd or stay flat until price agrees? 👇
Tell me the invalidation you would actually respect.
Not investment advice - research on your own! 🚀
$ETH $XRP
The October open did not show up with hope. It showed up with a crowd that suddenly sounds done with ETH and XRP.
🔥 Why I am watching
- ETH social ratio dropped to 0.89 bullish comments per bearish comment.
- Lowest ETH reading since June 7.
- XRP is colder at 0.67, lowest since August 17.
- Under 1.0, bearish talk is the majority.
🚀 The part that hits
When everyone is sure the next move is down, a chunk of the scared selling can already be behind us. Quiet fear has often been a better backdrop than the obvious dip-buy party. That is the only reason this mood shift has my attention.
⚡ Crowd check
- Commentary is unusually one-sided on both names.
- That is an emotion extreme, not a confirmed reversal.
- I want patience here, not a hero entry.
🛡 Where I step back
No guaranteed bounce here. If the sell narrative gets louder and price keeps breaking, I stay out. Fear by itself is not my entry.
🎯 My trade idea
- Bias: Wait
- Trigger: crowd stays negative while price holds a base
- Invalidation: fresh breakdown with no buyer response
- Confidence: 60 percent this is early, not actionable yet
Would you fade this crowd or stay flat until price agrees? 👇
Tell me the invalidation you would actually respect.
Not investment advice - research on your own! 🚀
$ETH $XRP
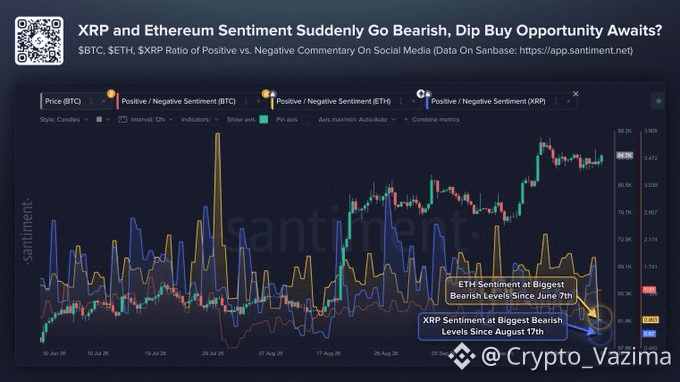
41
·
--
Bullish
GALA Could Keep Running If This Retest Holds 🔥
This is the kind of chart that wakes people up late. GALA broke the downtrend, came back to kiss it, and now every dip is being framed as a buy. I get the energy, but I still want the retest to prove it.
🚀 Why I am watching
- The long slide finally lost control of the trendline.
- Price retested that break instead of running away blindly.
- Near 0.00227, the chart is asking if buyers actually mean it.
- A clean hold here can turn a quiet chart into a catch-up move.
⚡ The part that matters
- The break is step one.
- The retest is step two.
- Holding that retest is what separates a real flip from a fakeout.
- If dips keep getting bought above the old line, the long idea stays alive.
🛡 Where I step back
- I am not chasing a green candle with no structure.
- A failed retest puts GALA back inside the old downtrend.
- If that line is lost, the buy-the-dip story is done for me.
- No hold, no trade.
🎯 My trade idea
- Bias: Long
- Trigger: retest holds and the next dip stays above the broken trendline
- Invalidation: close back under the broken trendline
- Confidence: 64 percent
Are you treating this GALA dip as a gift or still too early? 👇
Tell me the confirmation that would make you click buy.
Not investment advice - research on your own! 🚀
$GALA
{future}(GALAUSDT)
GALA Could Keep Running If This Retest Holds 🔥
This is the kind of chart that wakes people up late. GALA broke the downtrend, came back to kiss it, and now every dip is being framed as a buy. I get the energy, but I still want the retest to prove it.
🚀 Why I am watching
- The long slide finally lost control of the trendline.
- Price retested that break instead of running away blindly.
- Near 0.00227, the chart is asking if buyers actually mean it.
- A clean hold here can turn a quiet chart into a catch-up move.
⚡ The part that matters
- The break is step one.
- The retest is step two.
- Holding that retest is what separates a real flip from a fakeout.
- If dips keep getting bought above the old line, the long idea stays alive.
🛡 Where I step back
- I am not chasing a green candle with no structure.
- A failed retest puts GALA back inside the old downtrend.
- If that line is lost, the buy-the-dip story is done for me.
- No hold, no trade.
🎯 My trade idea
- Bias: Long
- Trigger: retest holds and the next dip stays above the broken trendline
- Invalidation: close back under the broken trendline
- Confidence: 64 percent
Are you treating this GALA dip as a gift or still too early? 👇
Tell me the confirmation that would make you click buy.
Not investment advice - research on your own! 🚀
$GALA
This is the kind of chart that wakes people up late. GALA broke the downtrend, came back to kiss it, and now every dip is being framed as a buy. I get the energy, but I still want the retest to prove it.
🚀 Why I am watching
- The long slide finally lost control of the trendline.
- Price retested that break instead of running away blindly.
- Near 0.00227, the chart is asking if buyers actually mean it.
- A clean hold here can turn a quiet chart into a catch-up move.
⚡ The part that matters
- The break is step one.
- The retest is step two.
- Holding that retest is what separates a real flip from a fakeout.
- If dips keep getting bought above the old line, the long idea stays alive.
🛡 Where I step back
- I am not chasing a green candle with no structure.
- A failed retest puts GALA back inside the old downtrend.
- If that line is lost, the buy-the-dip story is done for me.
- No hold, no trade.
🎯 My trade idea
- Bias: Long
- Trigger: retest holds and the next dip stays above the broken trendline
- Invalidation: close back under the broken trendline
- Confidence: 64 percent
Are you treating this GALA dip as a gift or still too early? 👇
Tell me the confirmation that would make you click buy.
Not investment advice - research on your own! 🚀
$GALA
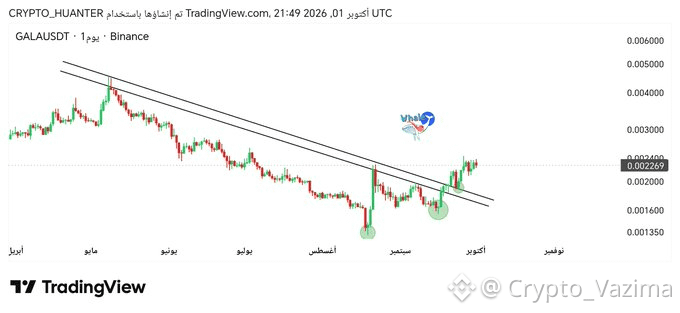
250
Log in to explore more content
Join global crypto users on Binance Square
⚡️ Get latest and useful information about crypto.
💬 Trusted by the world’s largest crypto exchange.
👍 Discover real insights from verified creators.
Email / Phone number