

NXT MOVE
4.1k Posts

NXT MOVE
Report
Block User
صانع محتوى.باحث في التحليل الفني ومتداول في طور التطوير، أشارك قراءتي للسوق، وأناقش الأفكار والصفقات وفق إدارة مخاطر واضحة. هدفي التعلم المستمر ومشاركة المعرفة.
Open Trade
High-Frequency Trader
3.1 Years
41 Following
16.7K+ Followers
5.4K+ Liked
Posts
Portfolio
All
Quotes
Videos
Live
PINNED
·
--
Bullish
Logical scenarios
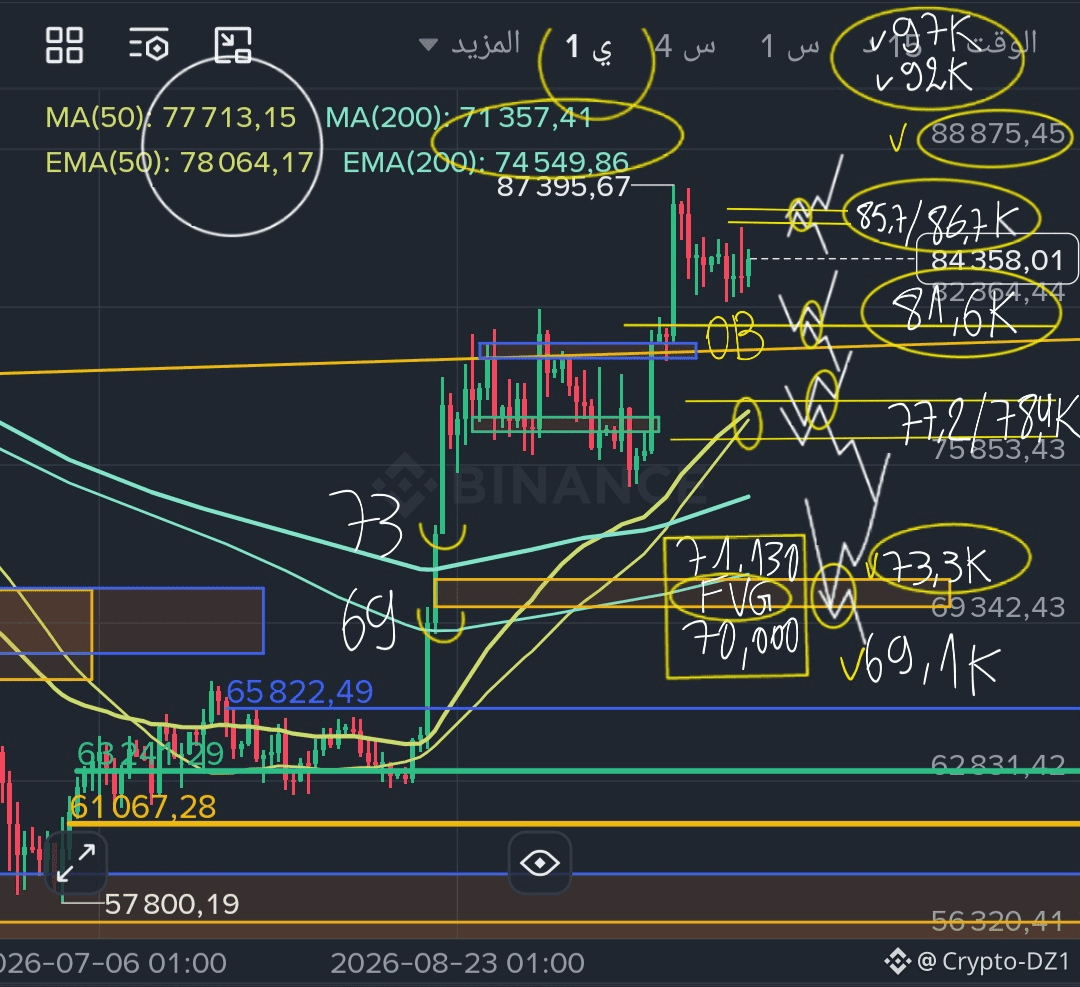
Uptrend: a breakout from 85.7–86.7K and holding above it, then the target at 88.9K, followed by 92K and then 97K.
Downtrend (corrective): breaking 81.6K opens the way toward 77.2–78.4K (the EMA50 zone), which is the first potential bounce level.
Deeper correction: breaking 77K leads to the 73.3K area, then the FVG between 70–71K, and below it 69.1K—this is a very strong demand zone because it marks the beginning of the original impulse.
Notes
The most suitable, lower-risk buy zones are at bounces around 81.6K or 77–78K, not chasing price near the top.
Losing 81.6K on a daily close is the first sign of weakness.
After the rise from 62K to around 87K, a pullback toward the EMA50 is healthy and expected, and it does not invalidate the trend.
This is educational technical analysis, not a buy or sell recommendation. I am not a financial advisor—manage risk and use a stop-loss.
Would you like me to set entry levels, a stop-loss, and targets for a specific scenario?
$BTC
{spot}(BTCUSDT)
#أعجبني
Logical scenarios
Uptrend: a breakout from 85.7–86.7K and holding above it, then the target at 88.9K, followed by 92K and then 97K.
Downtrend (corrective): breaking 81.6K opens the way toward 77.2–78.4K (the EMA50 zone), which is the first potential bounce level.
Deeper correction: breaking 77K leads to the 73.3K area, then the FVG between 70–71K, and below it 69.1K—this is a very strong demand zone because it marks the beginning of the original impulse.
Notes
The most suitable, lower-risk buy zones are at bounces around 81.6K or 77–78K, not chasing price near the top.
Losing 81.6K on a daily close is the first sign of weakness.
After the rise from 62K to around 87K, a pullback toward the EMA50 is healthy and expected, and it does not invalidate the trend.
This is educational technical analysis, not a buy or sell recommendation. I am not a financial advisor—manage risk and use a stop-loss.
Would you like me to set entry levels, a stop-loss, and targets for a specific scenario?
$BTC
#أعجبني
Uptrend: a breakout from 85.7–86.7K and holding above it, then the target at 88.9K, followed by 92K and then 97K.
Downtrend (corrective): breaking 81.6K opens the way toward 77.2–78.4K (the EMA50 zone), which is the first potential bounce level.
Deeper correction: breaking 77K leads to the 73.3K area, then the FVG between 70–71K, and below it 69.1K—this is a very strong demand zone because it marks the beginning of the original impulse.
Notes
The most suitable, lower-risk buy zones are at bounces around 81.6K or 77–78K, not chasing price near the top.
Losing 81.6K on a daily close is the first sign of weakness.
After the rise from 62K to around 87K, a pullback toward the EMA50 is healthy and expected, and it does not invalidate the trend.
This is educational technical analysis, not a buy or sell recommendation. I am not a financial advisor—manage risk and use a stop-loss.
Would you like me to set entry levels, a stop-loss, and targets for a specific scenario?
$BTC
#أعجبني
641
PINNED
·
--
Bullish
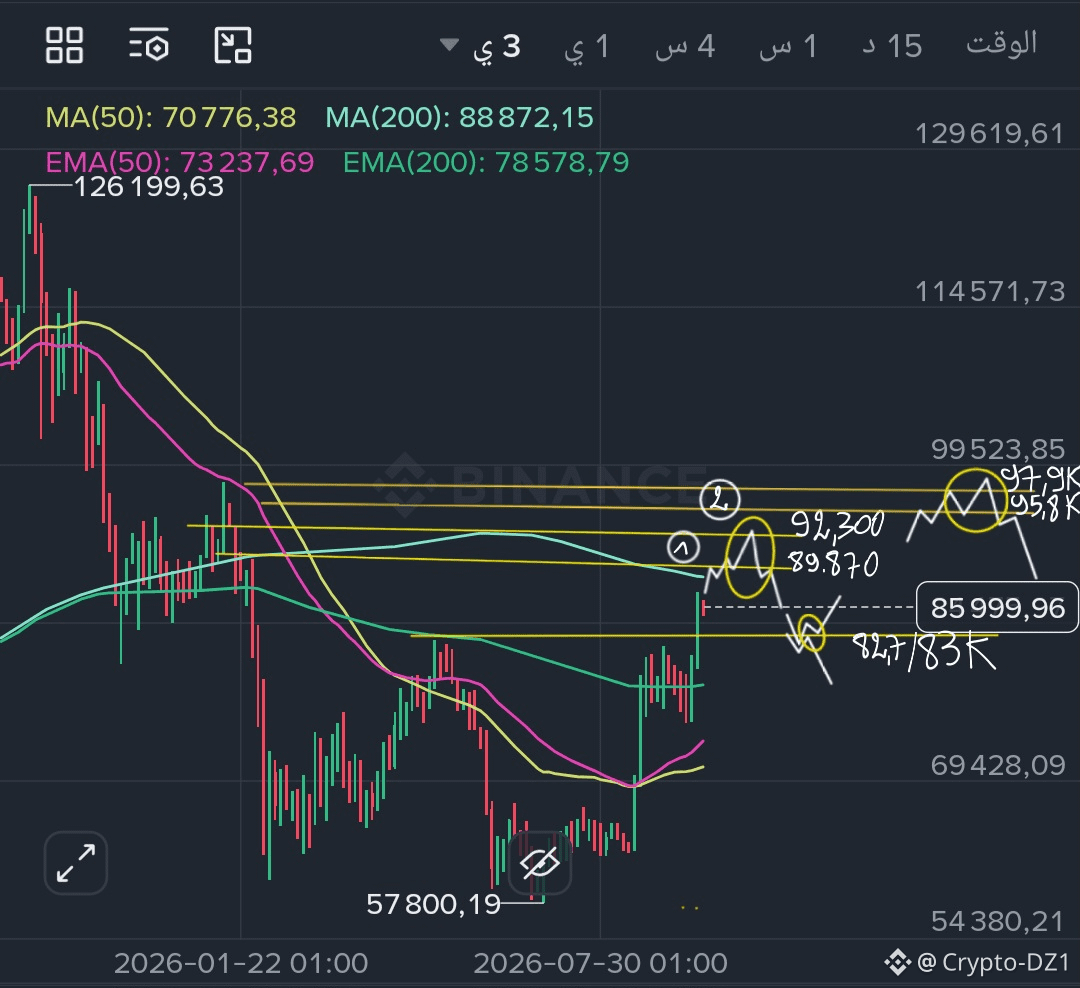
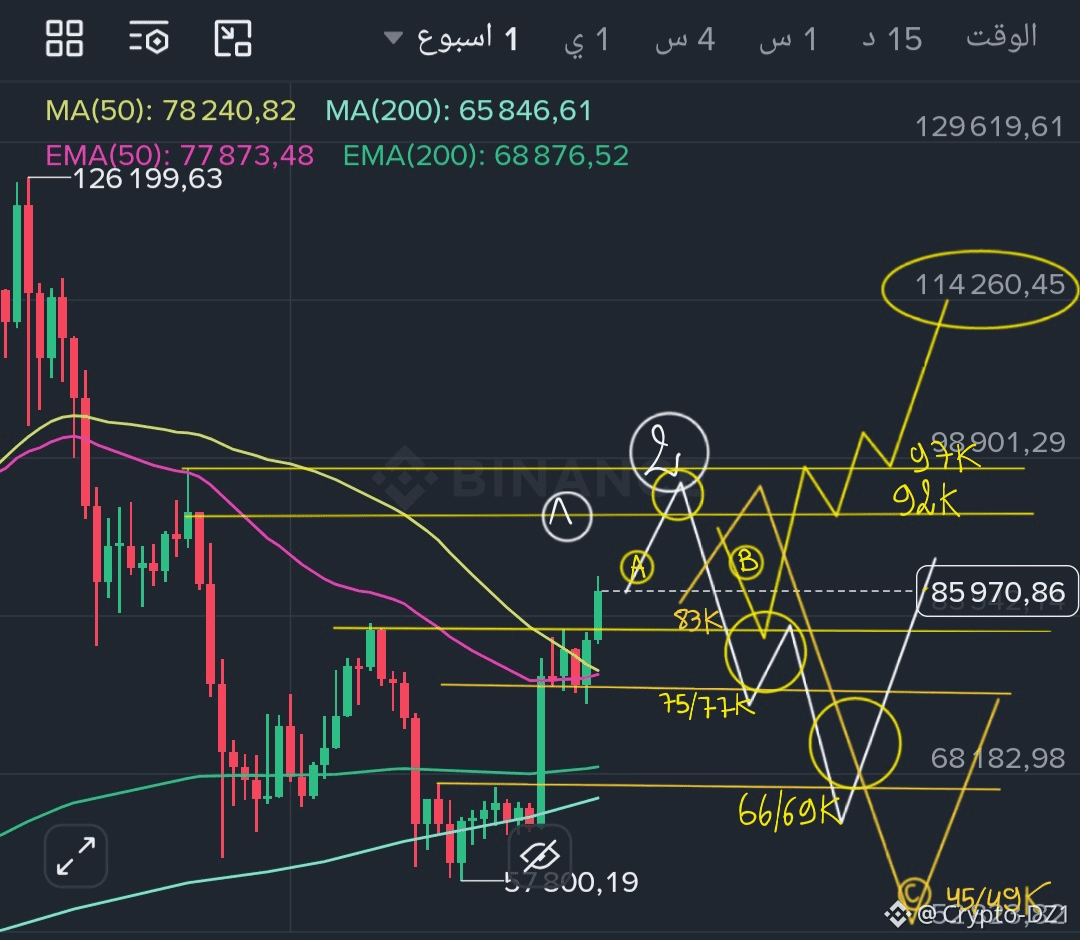
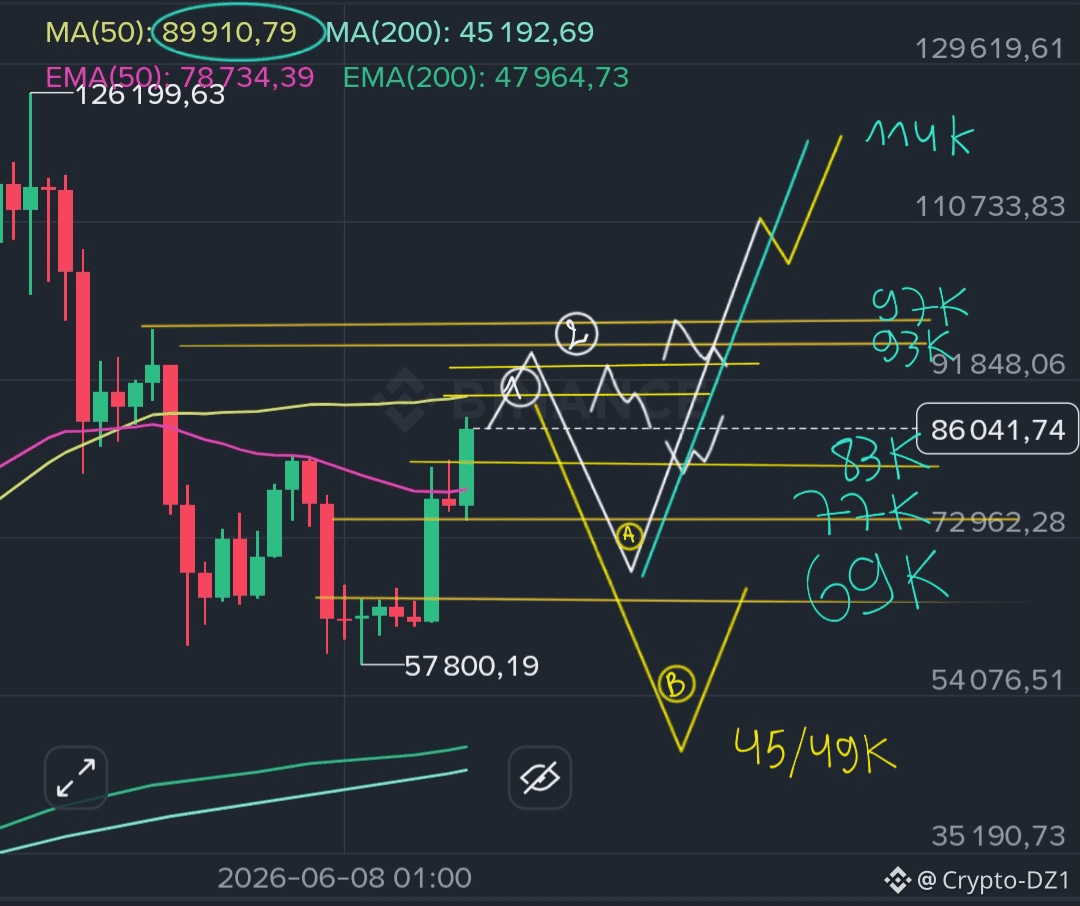
Simply after breaking 83,000, we target 93,000–97,000
or even 100,000
Retest
83,000
75,000–77,000
66,000–69,000
Big targets: 114,000
or forming a new bottom at 45,000–49,000
Now we monitor the formation of the local top from which the price rebounds.
Then, a correction of at least 30% from the new local top.
With that, we can determine the most likely area where the price will consolidate as support to continue the uptrend toward achieving new highs near 114,000.
With the possibility of a breakdown and formation of a new bottom from the same potential local top at the areas mentioned.
The content is not investment advice—do your own research
$BTC
Bitcoin closes a week above the 50-week moving average for the first time in 45 weeks.
According to Galaxy, this indicator has historically been linked to confirming bear-market bottoms.
Weekly close: $81,159
50-week moving average: $78,786
A historical signal with notable accuracy, but it does not guarantee the continuation of the rally... There must be the usual disclaimer paragraph
$USDC
Circle has minted $1.5 billion worth of USDC in a single day.
$1.5 billion in new stablecoins, and altseason fans are starting to regain hope
Simply after breaking 83,000, we target 93,000–97,000
or even 100,000
Retest
83,000
75,000–77,000
66,000–69,000
Big targets: 114,000
or forming a new bottom at 45,000–49,000
Now we monitor the formation of the local top from which the price rebounds.
Then, a correction of at least 30% from the new local top.
With that, we can determine the most likely area where the price will consolidate as support to continue the uptrend toward achieving new highs near 114,000.
With the possibility of a breakdown and formation of a new bottom from the same potential local top at the areas mentioned.
The content is not investment advice—do your own research
$BTC
Bitcoin closes a week above the 50-week moving average for the first time in 45 weeks.
According to Galaxy, this indicator has historically been linked to confirming bear-market bottoms.
Weekly close: $81,159
50-week moving average: $78,786
A historical signal with notable accuracy, but it does not guarantee the continuation of the rally... There must be the usual disclaimer paragraph
$USDC
Circle has minted $1.5 billion worth of USDC in a single day.
$1.5 billion in new stablecoins, and altseason fans are starting to regain hope
or even 100,000
Retest
83,000
75,000–77,000
66,000–69,000
Big targets: 114,000
or forming a new bottom at 45,000–49,000
Now we monitor the formation of the local top from which the price rebounds.
Then, a correction of at least 30% from the new local top.
With that, we can determine the most likely area where the price will consolidate as support to continue the uptrend toward achieving new highs near 114,000.
With the possibility of a breakdown and formation of a new bottom from the same potential local top at the areas mentioned.
The content is not investment advice—do your own research
$BTC
Bitcoin closes a week above the 50-week moving average for the first time in 45 weeks.
According to Galaxy, this indicator has historically been linked to confirming bear-market bottoms.
Weekly close: $81,159
50-week moving average: $78,786
A historical signal with notable accuracy, but it does not guarantee the continuation of the rally... There must be the usual disclaimer paragraph
$USDC
Circle has minted $1.5 billion worth of USDC in a single day.
$1.5 billion in new stablecoins, and altseason fans are starting to regain hope
189
·
--
Bullish
$BNB
{spot}(BNBUSDT)
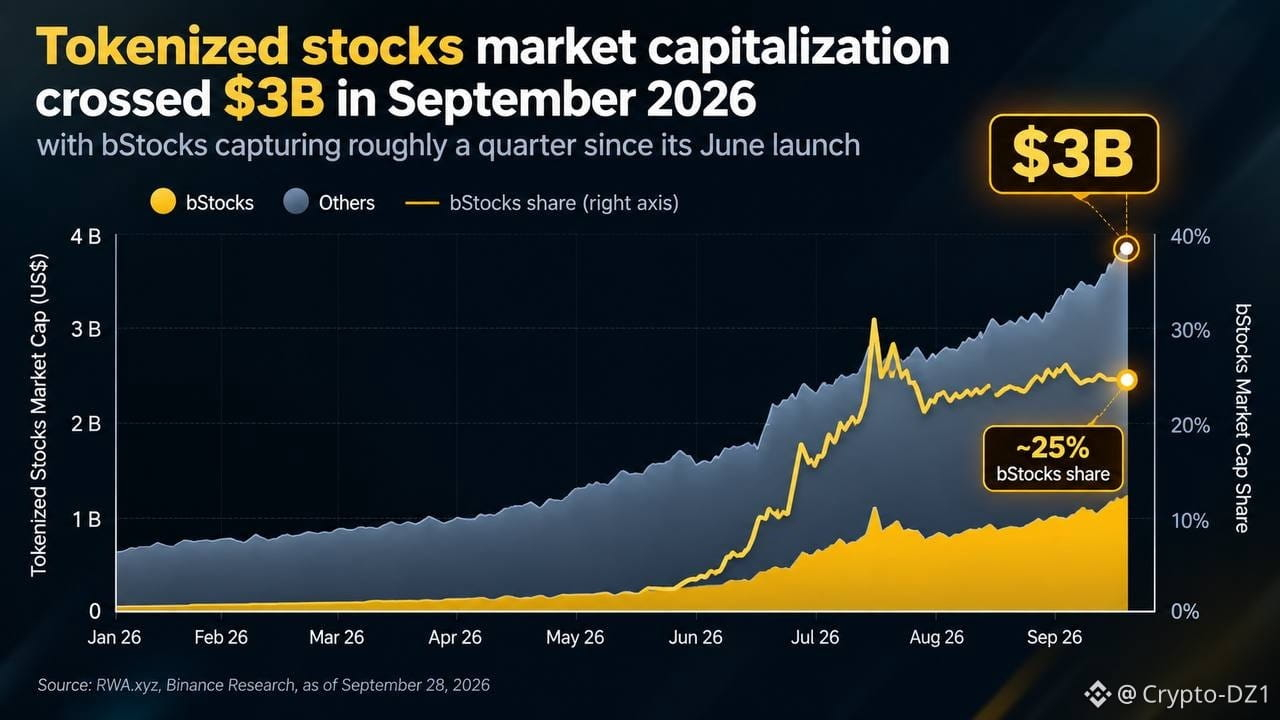
Tokenized assets surpassed $3 billion in September, and more than $100 billion in transfers were made on-chain during Q3, with BNB Chain leading by about $1 billion and 1.8M holders.
Citi: Expects BTC to reach $113K within the year.
$NEAR
{spot}(NEARUSDT)
Jadoodoo trader closed a NEAR deal with a profit of nearly $40K directly during a trading tournament in South Korea.
September breaches: $766.49M in losses across 55 hack operations, a significant increase compared to August.
$ETH
{spot}(ETHUSDT)
Arthur Hayes: Expects ETH to reach $10K before the end of the year.
Wall Street entered the blockchain… and the hackers entered ahead of them
$BNB
Tokenized assets surpassed $3 billion in September, and more than $100 billion in transfers were made on-chain during Q3, with BNB Chain leading by about $1 billion and 1.8M holders.
Citi: Expects BTC to reach $113K within the year.
$NEAR
Jadoodoo trader closed a NEAR deal with a profit of nearly $40K directly during a trading tournament in South Korea.
September breaches: $766.49M in losses across 55 hack operations, a significant increase compared to August.
$ETH
Arthur Hayes: Expects ETH to reach $10K before the end of the year.
Wall Street entered the blockchain… and the hackers entered ahead of them
Tokenized assets surpassed $3 billion in September, and more than $100 billion in transfers were made on-chain during Q3, with BNB Chain leading by about $1 billion and 1.8M holders.
Citi: Expects BTC to reach $113K within the year.
$NEAR
Jadoodoo trader closed a NEAR deal with a profit of nearly $40K directly during a trading tournament in South Korea.
September breaches: $766.49M in losses across 55 hack operations, a significant increase compared to August.
$ETH
Arthur Hayes: Expects ETH to reach $10K before the end of the year.
Wall Street entered the blockchain… and the hackers entered ahead of them
1
362
·
--
Bullish
$BTC
{spot}(BTCUSDT)
Saylor: The next ten years could be «gold fever» for Bitcoin.
BTC market value is currently around $3T, and could reach $120T if digital assets reach 10% of total global assets.
He expects long-term annual growth of 20–30%, with BTC-backed bank loans as the main driver in the coming years.
Saylor’s price outlook ages like his coffee: always optimistic, and without caffeine.
$ENA
{spot}(ENAUSDT)
Standard Chartered: Expects ENA to reach $2 by 2028—around 8× the current price of $0.25.
The scenario hinges on USDe growing from $4.9B to $40B, with 95% of revenues used to repurchase ENA after USDe surpasses $7.5B, plus institutional lending revenues via FalconX.
A bank expects 8×... somewhere, and a compliance officer who just suffered a heart attack.
$BTC
Saylor: The next ten years could be «gold fever» for Bitcoin.
BTC market value is currently around $3T, and could reach $120T if digital assets reach 10% of total global assets.
He expects long-term annual growth of 20–30%, with BTC-backed bank loans as the main driver in the coming years.
Saylor’s price outlook ages like his coffee: always optimistic, and without caffeine.
$ENA
Standard Chartered: Expects ENA to reach $2 by 2028—around 8× the current price of $0.25.
The scenario hinges on USDe growing from $4.9B to $40B, with 95% of revenues used to repurchase ENA after USDe surpasses $7.5B, plus institutional lending revenues via FalconX.
A bank expects 8×... somewhere, and a compliance officer who just suffered a heart attack.
Saylor: The next ten years could be «gold fever» for Bitcoin.
BTC market value is currently around $3T, and could reach $120T if digital assets reach 10% of total global assets.
He expects long-term annual growth of 20–30%, with BTC-backed bank loans as the main driver in the coming years.
Saylor’s price outlook ages like his coffee: always optimistic, and without caffeine.
$ENA
Standard Chartered: Expects ENA to reach $2 by 2028—around 8× the current price of $0.25.
The scenario hinges on USDe growing from $4.9B to $40B, with 95% of revenues used to repurchase ENA after USDe surpasses $7.5B, plus institutional lending revenues via FalconX.
A bank expects 8×... somewhere, and a compliance officer who just suffered a heart attack.
269
·
--
Bullish
#شارك_أفكارك_حول_BTC $BTC
{spot}(BTCUSDT)
The larger picture is relatively positive: in the near term, there is a dense sell ceiling that is hindering the upward move.
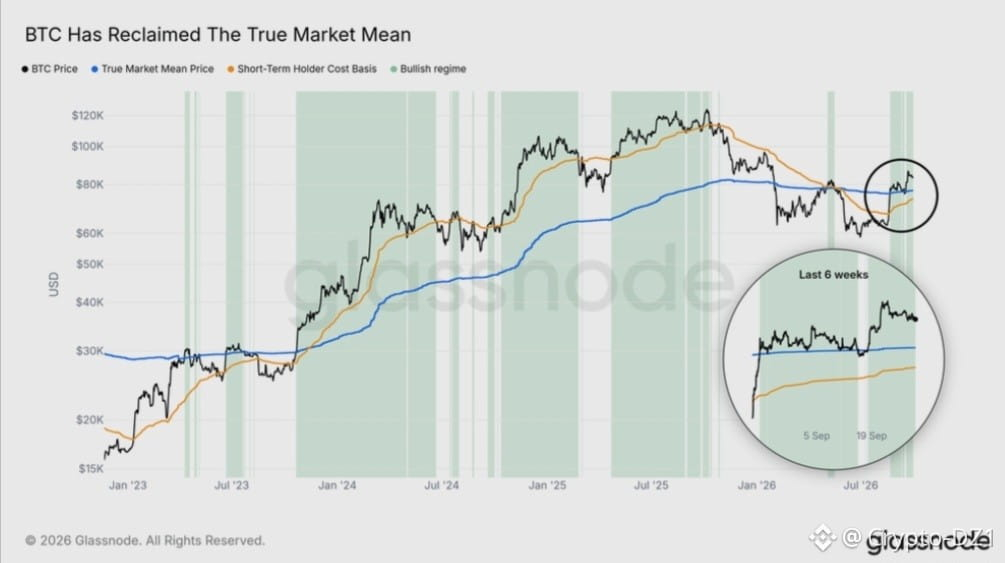
Figure 1 – Recovery of the Real Market Mean (True Market Mean):
- Bitcoin regained the blue line (around $77–78k) and has held above it during the last six weeks; this level is considered a dividing line between the up and down cycles.
- The price is also above the cost basis of short-term holders (orange, about $73–74k), and new green areas have appeared, indicating the return of the uptrend.
- Historically, holding above this mean supports continued upside, while breaking below it implies a return to bearish pressure (as happened in early 2026).
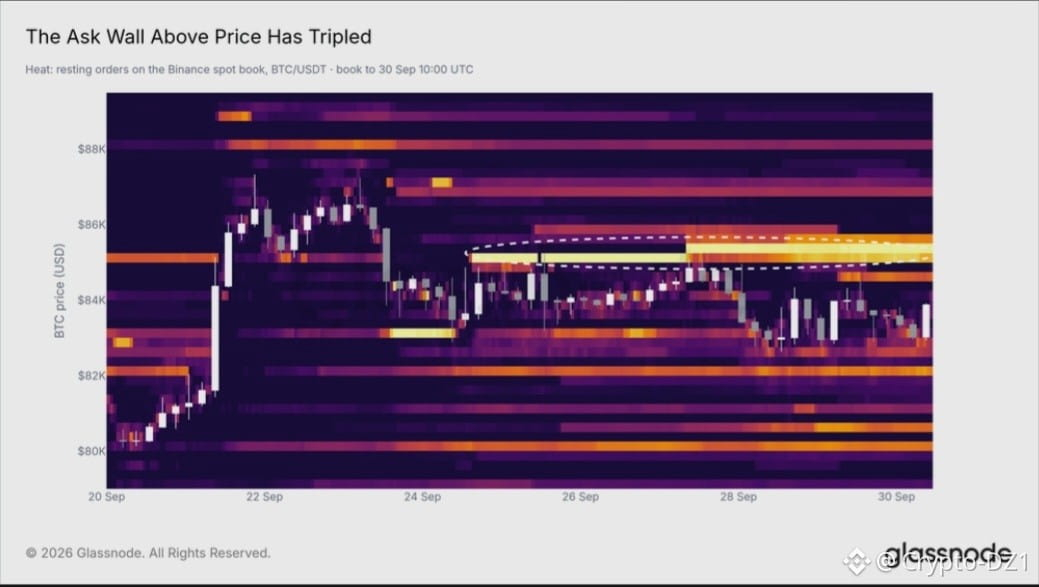
Figure 2 – Sell wall (Binance):
- Pending sell orders above the price have tripled; the heaviest concentration is around $85k and above up to about $86k.
- The price is moving in a tight range between $82.5k and $84.5k and has failed more than once to break the $85k area.
- Near support is visible at $83k, then at $82k (buy-order lines).
Combined read:
- **Bullish scenario:** a breakout and a firm close above $85–86k means the wall is absorbed, and it often paves the way toward $88k and higher.
- **Bearish/choppy scenario:** continued rejection at $85k could push the price back to test $82–83k; the most important larger support is the $77–78k region (the real mean).
- The wall could be real or spoof orders that get pulled as price approaches, so it should not be relied on by itself.
#شارك_أفكارك_حول_BTC $BTC
The larger picture is relatively positive: in the near term, there is a dense sell ceiling that is hindering the upward move.
Figure 1 – Recovery of the Real Market Mean (True Market Mean):
- Bitcoin regained the blue line (around $77–78k) and has held above it during the last six weeks; this level is considered a dividing line between the up and down cycles.
- The price is also above the cost basis of short-term holders (orange, about $73–74k), and new green areas have appeared, indicating the return of the uptrend.
- Historically, holding above this mean supports continued upside, while breaking below it implies a return to bearish pressure (as happened in early 2026).
Figure 2 – Sell wall (Binance):
- Pending sell orders above the price have tripled; the heaviest concentration is around $85k and above up to about $86k.
- The price is moving in a tight range between $82.5k and $84.5k and has failed more than once to break the $85k area.
- Near support is visible at $83k, then at $82k (buy-order lines).
Combined read:
- **Bullish scenario:** a breakout and a firm close above $85–86k means the wall is absorbed, and it often paves the way toward $88k and higher.
- **Bearish/choppy scenario:** continued rejection at $85k could push the price back to test $82–83k; the most important larger support is the $77–78k region (the real mean).
- The wall could be real or spoof orders that get pulled as price approaches, so it should not be relied on by itself.
The larger picture is relatively positive: in the near term, there is a dense sell ceiling that is hindering the upward move.
Figure 1 – Recovery of the Real Market Mean (True Market Mean):
- Bitcoin regained the blue line (around $77–78k) and has held above it during the last six weeks; this level is considered a dividing line between the up and down cycles.
- The price is also above the cost basis of short-term holders (orange, about $73–74k), and new green areas have appeared, indicating the return of the uptrend.
- Historically, holding above this mean supports continued upside, while breaking below it implies a return to bearish pressure (as happened in early 2026).
Figure 2 – Sell wall (Binance):
- Pending sell orders above the price have tripled; the heaviest concentration is around $85k and above up to about $86k.
- The price is moving in a tight range between $82.5k and $84.5k and has failed more than once to break the $85k area.
- Near support is visible at $83k, then at $82k (buy-order lines).
Combined read:
- **Bullish scenario:** a breakout and a firm close above $85–86k means the wall is absorbed, and it often paves the way toward $88k and higher.
- **Bearish/choppy scenario:** continued rejection at $85k could push the price back to test $82–83k; the most important larger support is the $77–78k region (the real mean).
- The wall could be real or spoof orders that get pulled as price approaches, so it should not be relied on by itself.
380
·
--
Bullish
$BTC
{spot}(BTCUSDT)
Glassnode Summary
ETF: Spot Bitcoin ETF inflows were around $1 billion per day on September 21 and 22, but later fell to $24 million on September 28.
Profit-taking: Still low compared to the 2024 and 2025 peaks, but long-term Bitcoin holders increased their selling activity, and their share of realized profits rose from 34% to 55%.
Resistance: There is a strong sell wall between $85,000–$85,500, and its size has roughly tripled. A sustained break above 85.5K would be an important signal.
Support:
Cost basis of short-term holders: $73.3K
True Market Mean: $77.2K, which is currently the most important support.
Trading volume: Low near the lows since the ETF launch, which suggests any upside move still has limited participation and high speculation.
Against equities: Over the last 30 sessions, Bitcoin outperformed the S&P 500 in more than half of the sessions, but during September 22–29 it dropped 2.9% versus 1.2% for the index.
Altcoins: They outperformed Bitcoin over the past month, but momentum stalled this week. Leverage remains low, which reduces the risk of a broad liquidation.
Conclusion
The bullish trend is still intact, but it needs confirmation.
A break above $85.5K + rising trading volume + a return of ETF inflows = a stronger expansion of the trend.
On the other hand, increased whale/long-holder selling or a daily close below $77.2K = a clear weakening of the current structure.
In short:
Support: $77.2K
Resistance: $85–85.5K
ETF: inflow decline
Volume: weak
Altcoins: stronger performance—just avoid excessive leverage.
$BTC
Glassnode Summary
ETF: Spot Bitcoin ETF inflows were around $1 billion per day on September 21 and 22, but later fell to $24 million on September 28.
Profit-taking: Still low compared to the 2024 and 2025 peaks, but long-term Bitcoin holders increased their selling activity, and their share of realized profits rose from 34% to 55%.
Resistance: There is a strong sell wall between $85,000–$85,500, and its size has roughly tripled. A sustained break above 85.5K would be an important signal.
Support:
Cost basis of short-term holders: $73.3K
True Market Mean: $77.2K, which is currently the most important support.
Trading volume: Low near the lows since the ETF launch, which suggests any upside move still has limited participation and high speculation.
Against equities: Over the last 30 sessions, Bitcoin outperformed the S&P 500 in more than half of the sessions, but during September 22–29 it dropped 2.9% versus 1.2% for the index.
Altcoins: They outperformed Bitcoin over the past month, but momentum stalled this week. Leverage remains low, which reduces the risk of a broad liquidation.
Conclusion
The bullish trend is still intact, but it needs confirmation.
A break above $85.5K + rising trading volume + a return of ETF inflows = a stronger expansion of the trend.
On the other hand, increased whale/long-holder selling or a daily close below $77.2K = a clear weakening of the current structure.
In short:
Support: $77.2K
Resistance: $85–85.5K
ETF: inflow decline
Volume: weak
Altcoins: stronger performance—just avoid excessive leverage.
Glassnode Summary
ETF: Spot Bitcoin ETF inflows were around $1 billion per day on September 21 and 22, but later fell to $24 million on September 28.
Profit-taking: Still low compared to the 2024 and 2025 peaks, but long-term Bitcoin holders increased their selling activity, and their share of realized profits rose from 34% to 55%.
Resistance: There is a strong sell wall between $85,000–$85,500, and its size has roughly tripled. A sustained break above 85.5K would be an important signal.
Support:
Cost basis of short-term holders: $73.3K
True Market Mean: $77.2K, which is currently the most important support.
Trading volume: Low near the lows since the ETF launch, which suggests any upside move still has limited participation and high speculation.
Against equities: Over the last 30 sessions, Bitcoin outperformed the S&P 500 in more than half of the sessions, but during September 22–29 it dropped 2.9% versus 1.2% for the index.
Altcoins: They outperformed Bitcoin over the past month, but momentum stalled this week. Leverage remains low, which reduces the risk of a broad liquidation.
Conclusion
The bullish trend is still intact, but it needs confirmation.
A break above $85.5K + rising trading volume + a return of ETF inflows = a stronger expansion of the trend.
On the other hand, increased whale/long-holder selling or a daily close below $77.2K = a clear weakening of the current structure.
In short:
Support: $77.2K
Resistance: $85–85.5K
ETF: inflow decline
Volume: weak
Altcoins: stronger performance—just avoid excessive leverage.
217
·
--
Bullish
$BTC
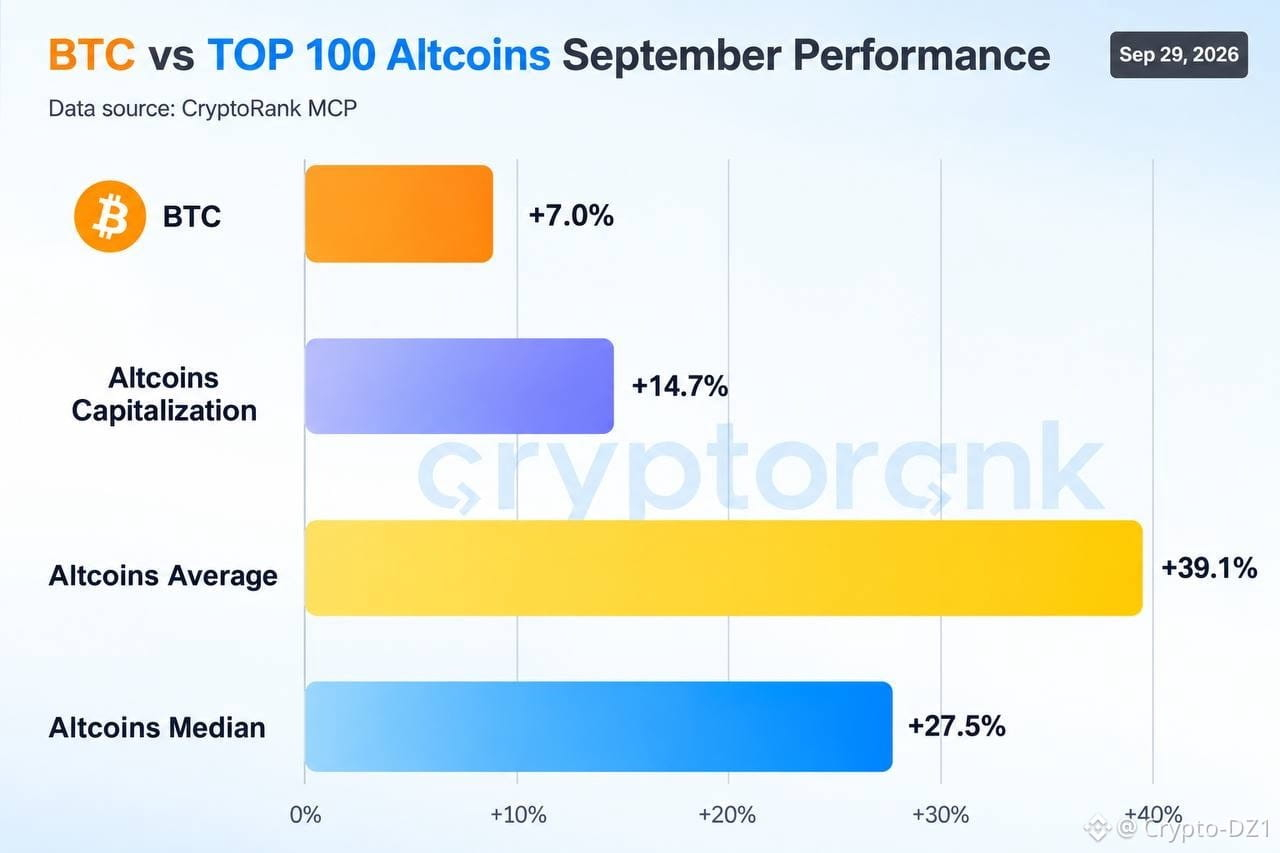
Alternative coins strongly outperformed Bitcoin in September
The leading alternative coins recorded mid-sized gains of 27.5%, while Bitcoin moved by only about 7%.
If you need a reason to call it Altseason, the market just gave you one.
BTC just watched while the alternative coins enjoyed everything.
{spot}(BTCUSDT)
$ETH
{spot}(ETHUSDT)
$BTC
Alternative coins strongly outperformed Bitcoin in September
The leading alternative coins recorded mid-sized gains of 27.5%, while Bitcoin moved by only about 7%.
If you need a reason to call it Altseason, the market just gave you one.
BTC just watched while the alternative coins enjoyed everything.
$ETH
Alternative coins strongly outperformed Bitcoin in September
The leading alternative coins recorded mid-sized gains of 27.5%, while Bitcoin moved by only about 7%.
If you need a reason to call it Altseason, the market just gave you one.
BTC just watched while the alternative coins enjoyed everything.
$ETH
1
194
·
--
Bullish
$BTC The old Bitcoin is moving
Coins that have been around for more than 6 months now make up 12.7% of the total trading volume in this cycle, compared to 6.8% in the previous cycle.
This does not necessarily mean their holders are selling, but it clearly indicates that long-term Bitcoin holders are moving their coins more than before.
Even the Diamond Hands’ hands are starting to stretch.
#NEAR
An old Ethereum investor is selling again
Eight years ago, he bought 3,000 ETH at $18.8 per coin, for a total of $56.5k.
And now he has sold another 1,000 ETH for $2.68 million, bringing the total he has sold to:
2,000 ETH for $6.19 million
Average selling price: $3,096
He still holds 1,000 ETH worth approximately $2.67 million.
His total profit is around $8.8 million — about a 156x return.
Turned $56k into a home and a near-and-present Twitter showcase.
#PAXG
Morgan Stanley opens a private lab for digital assets
The bank will test solutions related to:
Stablecoins
Tokenization of assets
Decentralized finance (DeFi)
And for Wall Street, this is another step indicating that blockchain has become part of the future of the financial system, not just a side industry.
Wall Street is building a crypto lab — and the next step might be inventing the wheel.
$ETH $BTW
$BTC The old Bitcoin is moving
Coins that have been around for more than 6 months now make up 12.7% of the total trading volume in this cycle, compared to 6.8% in the previous cycle.
This does not necessarily mean their holders are selling, but it clearly indicates that long-term Bitcoin holders are moving their coins more than before.
Even the Diamond Hands’ hands are starting to stretch.
#NEAR
An old Ethereum investor is selling again
Eight years ago, he bought 3,000 ETH at $18.8 per coin, for a total of $56.5k.
And now he has sold another 1,000 ETH for $2.68 million, bringing the total he has sold to:
2,000 ETH for $6.19 million
Average selling price: $3,096
He still holds 1,000 ETH worth approximately $2.67 million.
His total profit is around $8.8 million — about a 156x return.
Turned $56k into a home and a near-and-present Twitter showcase.
#PAXG
Morgan Stanley opens a private lab for digital assets
The bank will test solutions related to:
Stablecoins
Tokenization of assets
Decentralized finance (DeFi)
And for Wall Street, this is another step indicating that blockchain has become part of the future of the financial system, not just a side industry.
Wall Street is building a crypto lab — and the next step might be inventing the wheel.
$ETH $BTW
Coins that have been around for more than 6 months now make up 12.7% of the total trading volume in this cycle, compared to 6.8% in the previous cycle.
This does not necessarily mean their holders are selling, but it clearly indicates that long-term Bitcoin holders are moving their coins more than before.
Even the Diamond Hands’ hands are starting to stretch.
#NEAR
An old Ethereum investor is selling again
Eight years ago, he bought 3,000 ETH at $18.8 per coin, for a total of $56.5k.
And now he has sold another 1,000 ETH for $2.68 million, bringing the total he has sold to:
2,000 ETH for $6.19 million
Average selling price: $3,096
He still holds 1,000 ETH worth approximately $2.67 million.
His total profit is around $8.8 million — about a 156x return.
Turned $56k into a home and a near-and-present Twitter showcase.
#PAXG
Morgan Stanley opens a private lab for digital assets
The bank will test solutions related to:
Stablecoins
Tokenization of assets
Decentralized finance (DeFi)
And for Wall Street, this is another step indicating that blockchain has become part of the future of the financial system, not just a side industry.
Wall Street is building a crypto lab — and the next step might be inventing the wheel.
$ETH $BTW
463
·
--
Bullish
#شارك_أفكارك_حول_BTC $BTC
CZ announces an Altseason
Its expectations regarding when it will start:
«Soon»
The most accurate timeline in the crypto world.
Tom Lee says crypto is in a «bull market»
His take: the digital asset market has officially entered the bull market phase.
It seems Tom Lee’s announcement about a Bull Market has become almost a weekly event in crypto.
Launch of the first spot ETF for NEAR in the United States
Bitwise listed the NRR fund on the NYSE Arca exchange, allowing investors to get exposure to NEAR through a traditional brokerage account without needing a crypto wallet.
The fund also earns Staking rewards on NEAR, at about 5% annually according to Bitwise.
Wall Street has finally found a way to do Staking without touching a crypto wallet.
#NEAR #ETFNEAR
The White House blames the Democrats
The administration says the Democrats are the reason the Clarity Act hasn’t been passed yet.
Congress can’t agree on rules for regulating digital currencies, but it can certainly agree on shifting blame.
#ClarityAct
Morgan Stanley opens a private lab for digital assets
The bank will test solutions related to:
Stablecoins
Asset tokenization
DeFi decentralized finance
For Wall Street, this is another step indicating that blockchain has become part of the financial system’s future—not just a side sector.
Wall Street is building a crypto lab, and the next step is inventing the wheel.
{spot}(BTCUSDT)
$BNB
{spot}(BNBUSDT)
$ETH
{spot}(ETHUSDT)
#شارك_أفكارك_حول_BTC $BTC
CZ announces an Altseason
Its expectations regarding when it will start:
«Soon»
The most accurate timeline in the crypto world.
Tom Lee says crypto is in a «bull market»
His take: the digital asset market has officially entered the bull market phase.
It seems Tom Lee’s announcement about a Bull Market has become almost a weekly event in crypto.
Launch of the first spot ETF for NEAR in the United States
Bitwise listed the NRR fund on the NYSE Arca exchange, allowing investors to get exposure to NEAR through a traditional brokerage account without needing a crypto wallet.
The fund also earns Staking rewards on NEAR, at about 5% annually according to Bitwise.
Wall Street has finally found a way to do Staking without touching a crypto wallet.
#NEAR #ETFNEAR
The White House blames the Democrats
The administration says the Democrats are the reason the Clarity Act hasn’t been passed yet.
Congress can’t agree on rules for regulating digital currencies, but it can certainly agree on shifting blame.
#ClarityAct
Morgan Stanley opens a private lab for digital assets
The bank will test solutions related to:
Stablecoins
Asset tokenization
DeFi decentralized finance
For Wall Street, this is another step indicating that blockchain has become part of the financial system’s future—not just a side sector.
Wall Street is building a crypto lab, and the next step is inventing the wheel.
$BNB
$ETH
CZ announces an Altseason
Its expectations regarding when it will start:
«Soon»
The most accurate timeline in the crypto world.
Tom Lee says crypto is in a «bull market»
His take: the digital asset market has officially entered the bull market phase.
It seems Tom Lee’s announcement about a Bull Market has become almost a weekly event in crypto.
Launch of the first spot ETF for NEAR in the United States
Bitwise listed the NRR fund on the NYSE Arca exchange, allowing investors to get exposure to NEAR through a traditional brokerage account without needing a crypto wallet.
The fund also earns Staking rewards on NEAR, at about 5% annually according to Bitwise.
Wall Street has finally found a way to do Staking without touching a crypto wallet.
#NEAR #ETFNEAR
The White House blames the Democrats
The administration says the Democrats are the reason the Clarity Act hasn’t been passed yet.
Congress can’t agree on rules for regulating digital currencies, but it can certainly agree on shifting blame.
#ClarityAct
Morgan Stanley opens a private lab for digital assets
The bank will test solutions related to:
Stablecoins
Asset tokenization
DeFi decentralized finance
For Wall Street, this is another step indicating that blockchain has become part of the financial system’s future—not just a side sector.
Wall Street is building a crypto lab, and the next step is inventing the wheel.
$BNB
$ETH

1
1.9k
·
--
Bullish
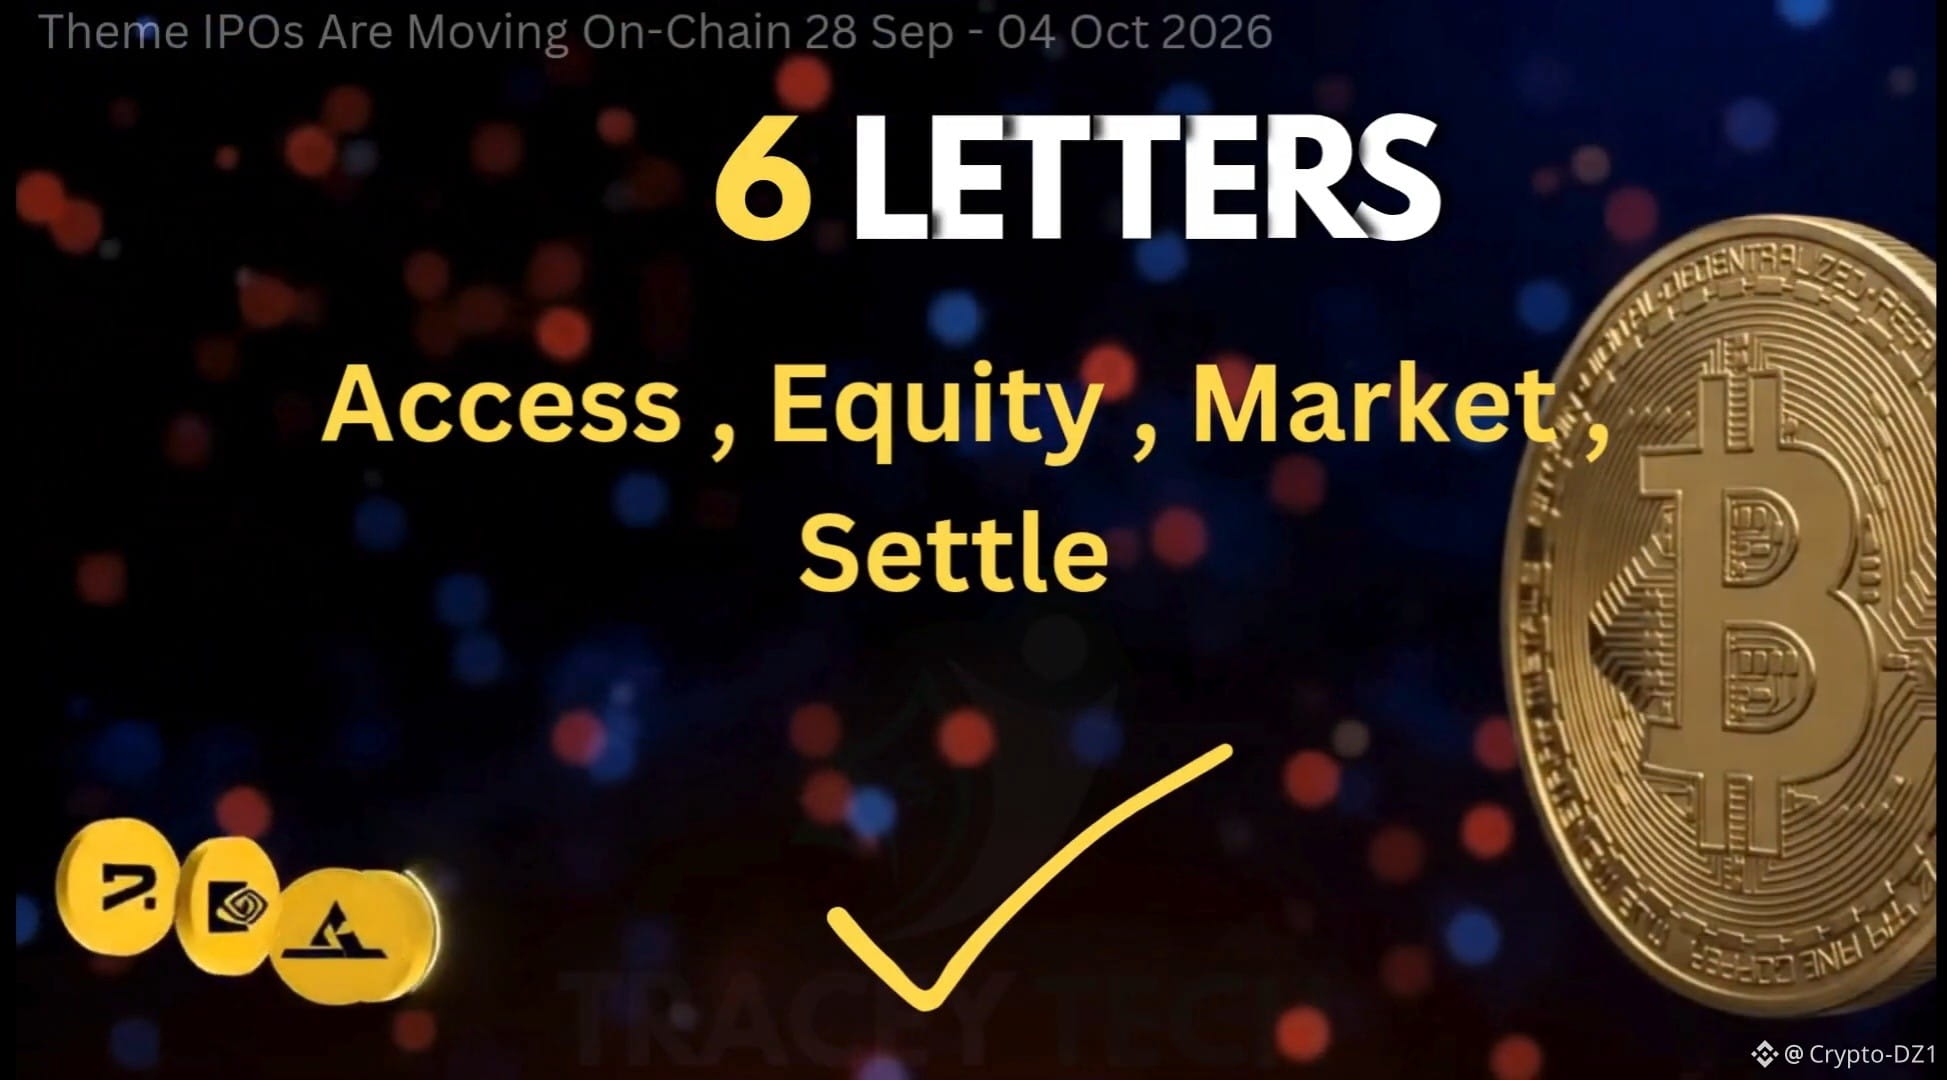
[https://www.binance.com/activity/word-of-the-day/IPOs-Are-Moving-On-Chain?ref=CPA_00J43UC4H1](https://www.binance.com/activity/word-of-the-day/IPOs-Are-Moving-On-Chain?ref=CPA_00J43UC4H1)
#شارك_أفكارك_حول_BTC $BTC
{spot}(BTCUSDT)
$BNB
{spot}(BNBUSDT)
$BTW
Made $13 from a Long trade on BTC… and now I want to buy the land
My friend asked me:
“What's the price of Planet Earth?”
I told him:
“I’ll buy it and become the king.” 😂
$13 profit from Bitcoin, but with a trillionaire’s confidence
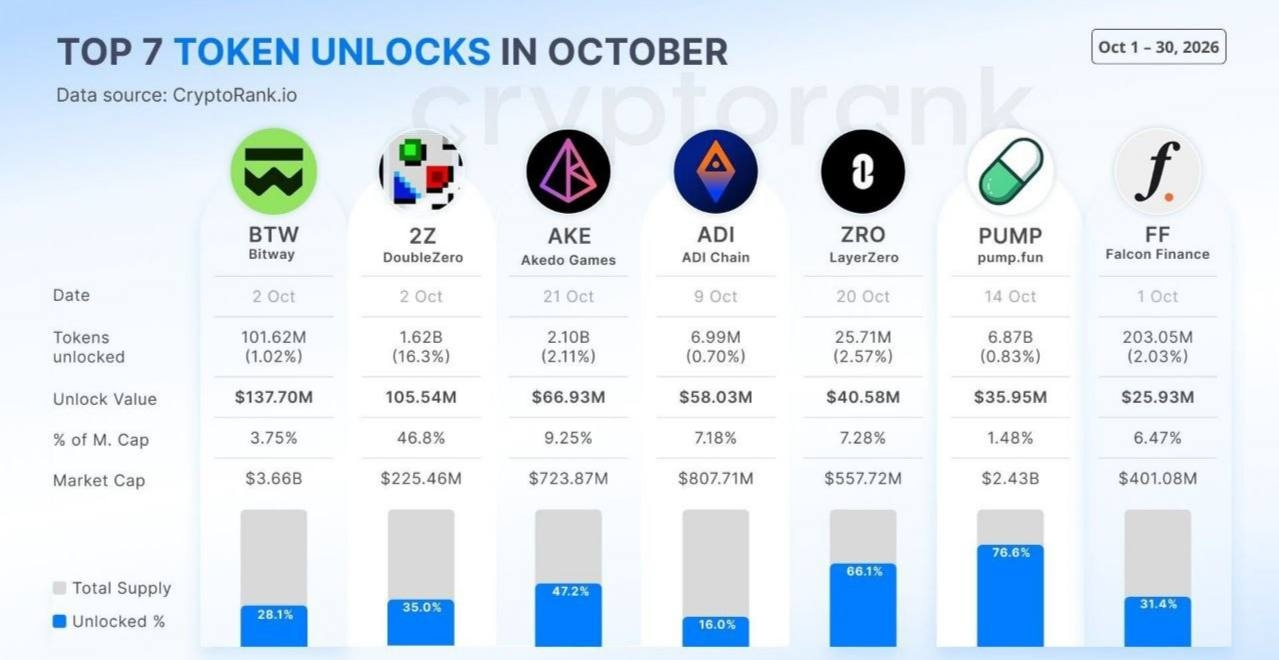
Unlocked Tokens worth more than $4.575 billion in October
Key Unlock operations mentioned:
⚫️ BTW — $137.70 million
⚫️ 2Z — $105.54 million
⚫️ AKE — $66.93 million
⚫️ ADI — $58.03 million
⚫️ ZRO — $40.58 million
⚫️ PUMP — $35.95 million
⚫️ FF — $25.93 million
📦 October brings “gifts”… but not necessarily the gifts coin holders were expecting 😊
Meaning, a new amount of tokens that were previously locked is being released, which could increase the circulating supply.
https://www.binance.com/activity/word-of-the-day/IPOs-Are-Moving-On-Chain?ref=CPA_00J43UC4H1
#شارك_أفكارك_حول_BTC $BTC
$BNB
$BTW
Made $13 from a Long trade on BTC… and now I want to buy the land
My friend asked me:
“What's the price of Planet Earth?”
I told him:
“I’ll buy it and become the king.” 😂
$13 profit from Bitcoin, but with a trillionaire’s confidence
Unlocked Tokens worth more than $4.575 billion in October
Key Unlock operations mentioned:
⚫️ BTW — $137.70 million
⚫️ 2Z — $105.54 million
⚫️ AKE — $66.93 million
⚫️ ADI — $58.03 million
⚫️ ZRO — $40.58 million
⚫️ PUMP — $35.95 million
⚫️ FF — $25.93 million
📦 October brings “gifts”… but not necessarily the gifts coin holders were expecting 😊
Meaning, a new amount of tokens that were previously locked is being released, which could increase the circulating supply.
#شارك_أفكارك_حول_BTC $BTC
$BNB
$BTW
Made $13 from a Long trade on BTC… and now I want to buy the land
My friend asked me:
“What's the price of Planet Earth?”
I told him:
“I’ll buy it and become the king.” 😂
$13 profit from Bitcoin, but with a trillionaire’s confidence
Unlocked Tokens worth more than $4.575 billion in October
Key Unlock operations mentioned:
⚫️ BTW — $137.70 million
⚫️ 2Z — $105.54 million
⚫️ AKE — $66.93 million
⚫️ ADI — $58.03 million
⚫️ ZRO — $40.58 million
⚫️ PUMP — $35.95 million
⚫️ FF — $25.93 million
📦 October brings “gifts”… but not necessarily the gifts coin holders were expecting 😊
Meaning, a new amount of tokens that were previously locked is being released, which could increase the circulating supply.
1
237
·
--
Bullish
$BTC
{spot}(BTCUSDT)
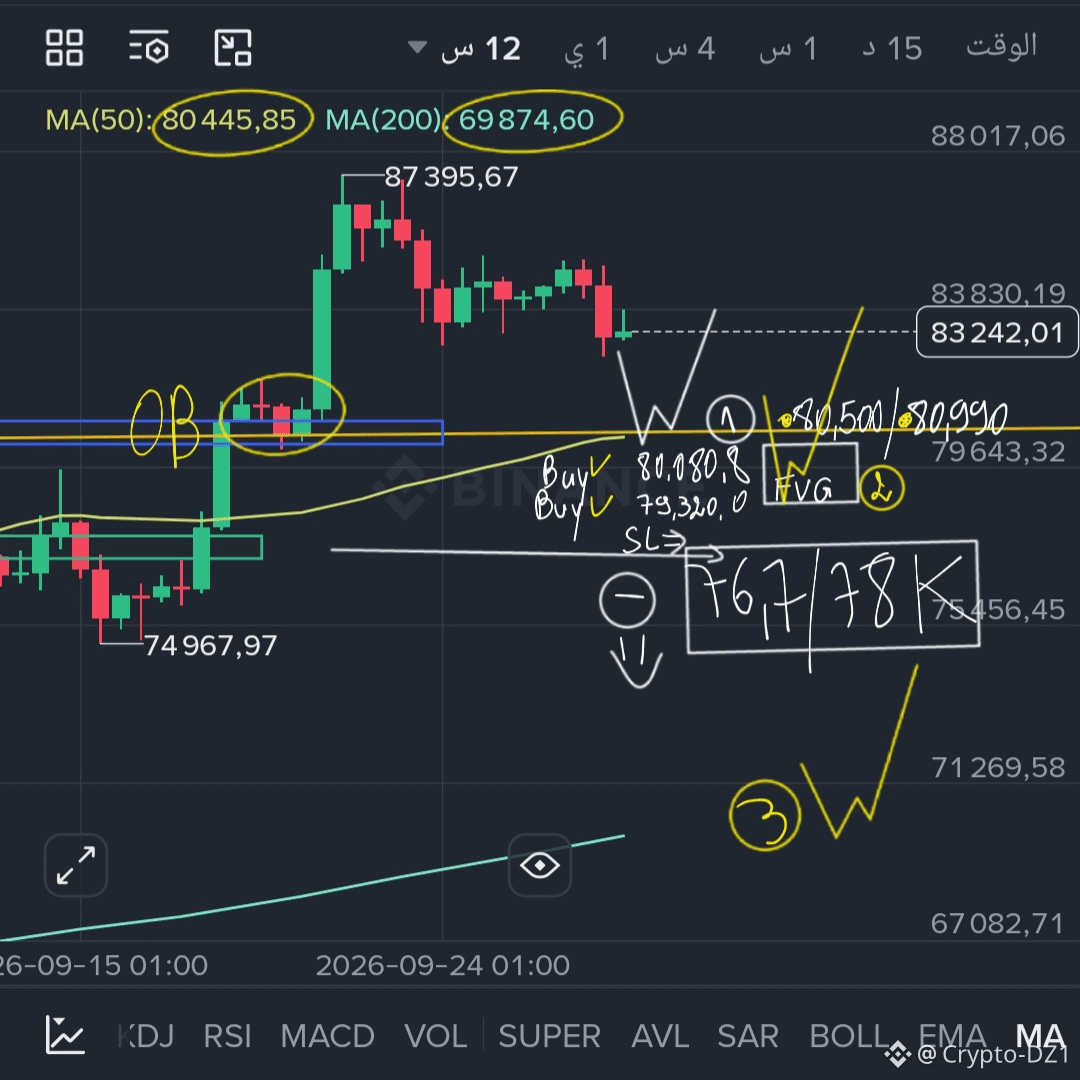
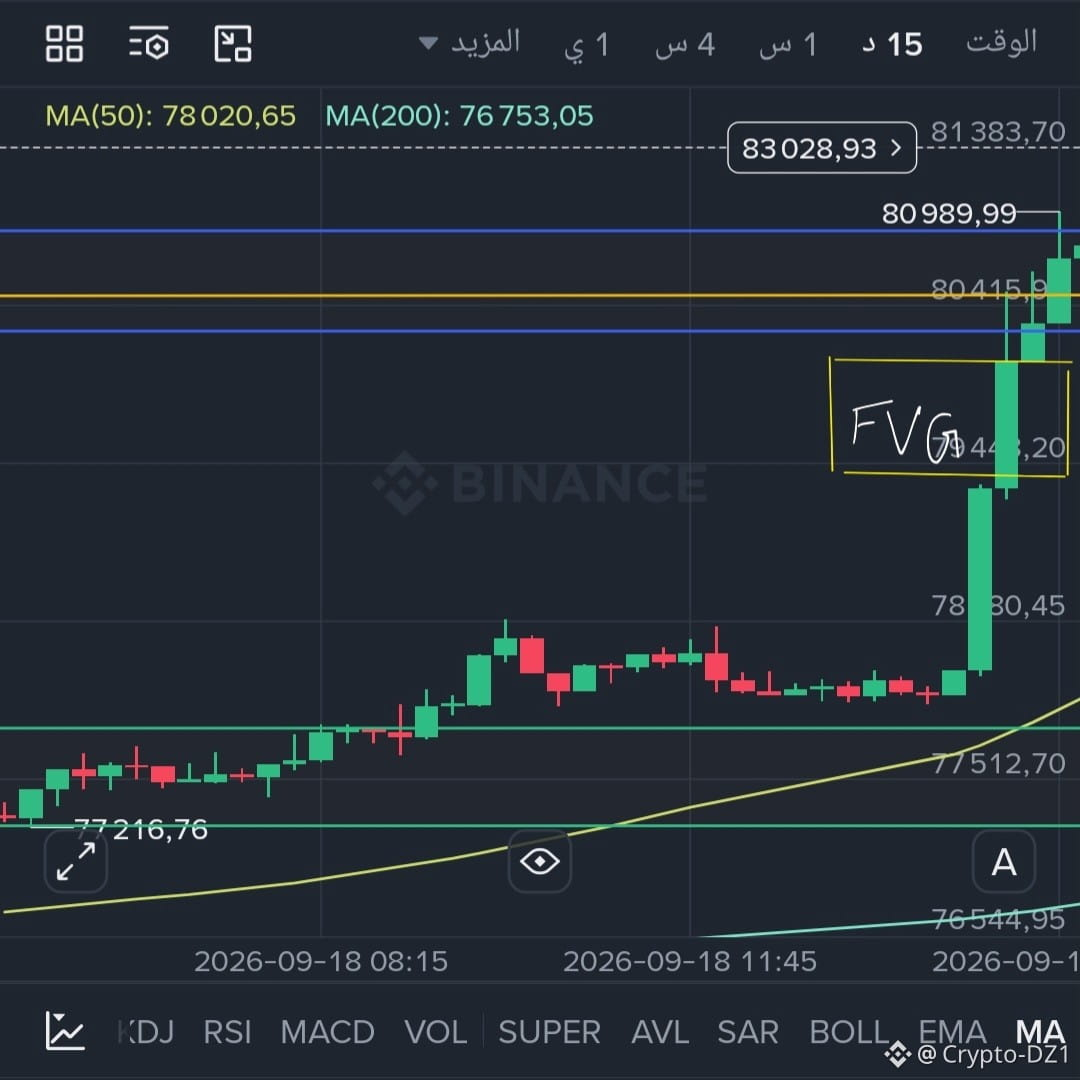
Owning a strong asset doesn’t guarantee keeping wealth; risk management, avoiding scam projects, and not risking all your capital are crucial factors.
The market didn’t take your money—your ideas and decisions—your “genius”—did.
Learn from someone who owned BTC
The content is not investment advice—do your own research
$BTC
Owning a strong asset doesn’t guarantee keeping wealth; risk management, avoiding scam projects, and not risking all your capital are crucial factors.
The market didn’t take your money—your ideas and decisions—your “genius”—did.
Learn from someone who owned BTC
The content is not investment advice—do your own research
Owning a strong asset doesn’t guarantee keeping wealth; risk management, avoiding scam projects, and not risking all your capital are crucial factors.
The market didn’t take your money—your ideas and decisions—your “genius”—did.
Learn from someone who owned BTC
The content is not investment advice—do your own research
2
421
·
--
Bullish
#شارك_أفكارك_حول_BTC
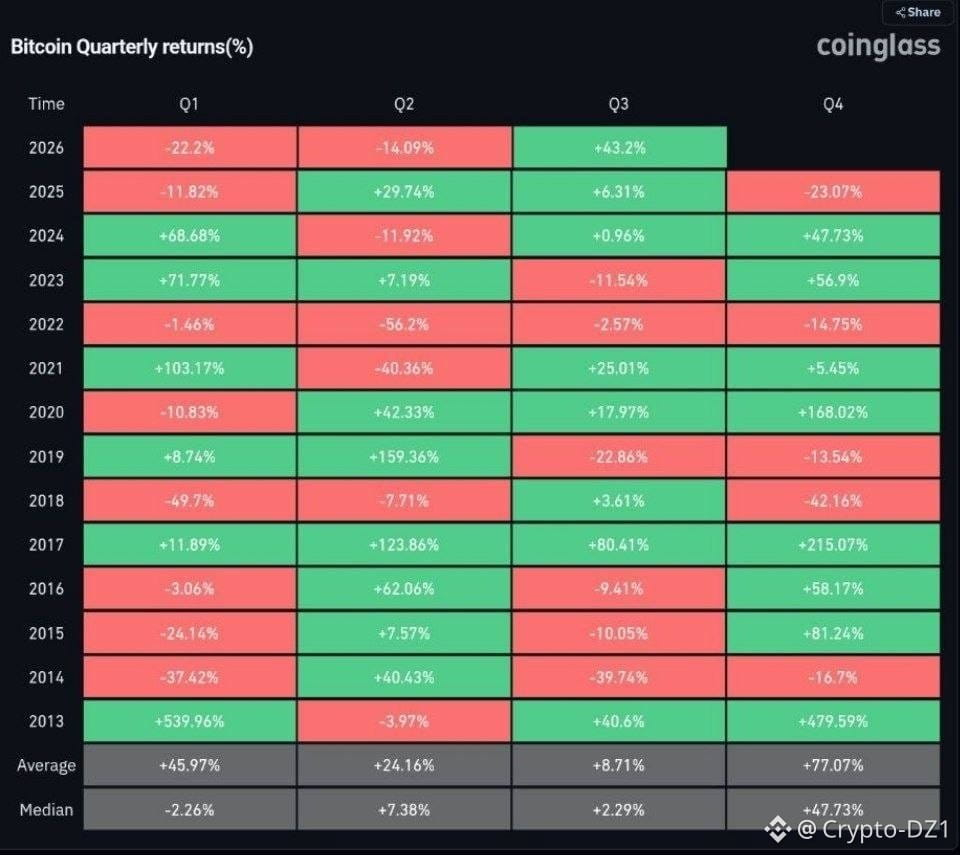
The Bitcoin currency is on the verge of achieving its second best performance in the third quarter ever.
$BTC
{spot}(BTCUSDT)
#شارك_أفكارك_حول_BTC
The Bitcoin currency is on the verge of achieving its second best performance in the third quarter ever.
$BTC
The Bitcoin currency is on the verge of achieving its second best performance in the third quarter ever.
$BTC
543
·
--
Bullish
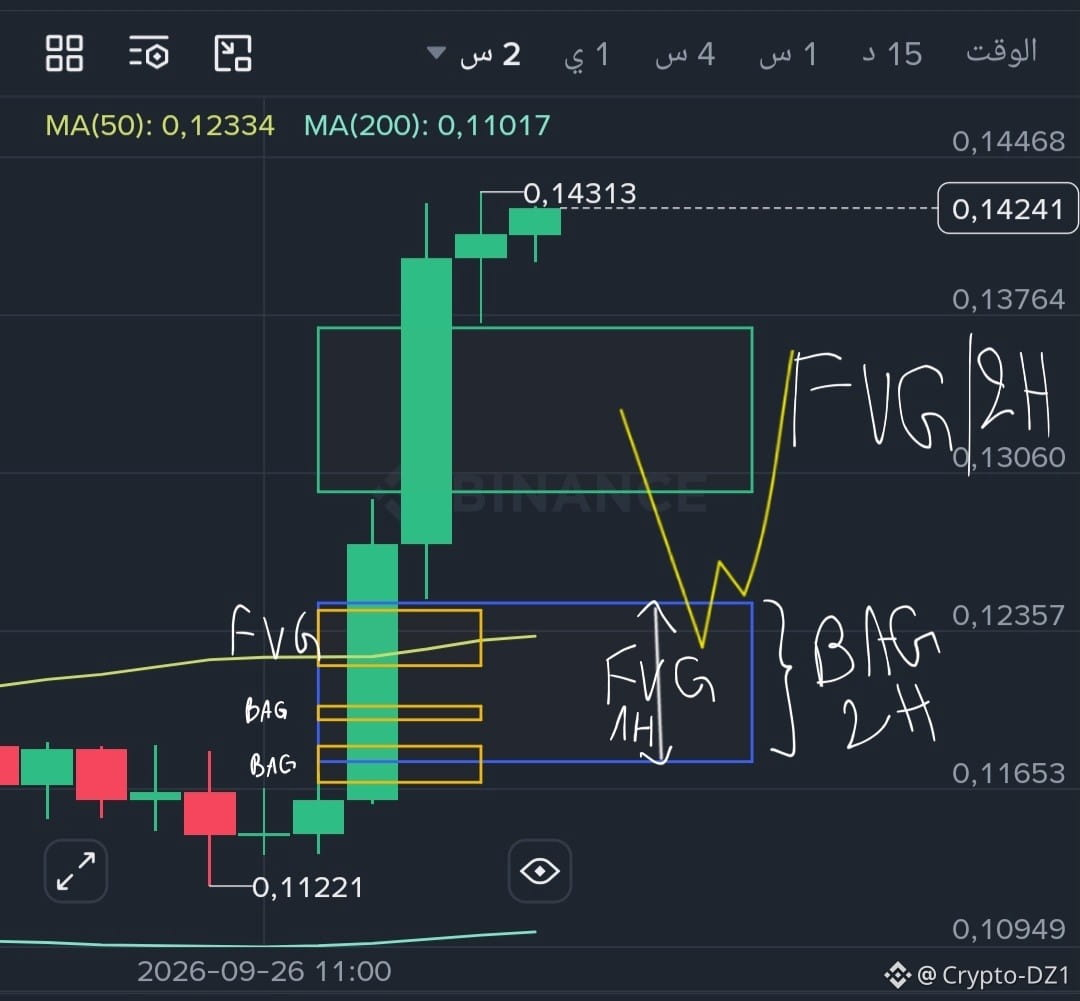
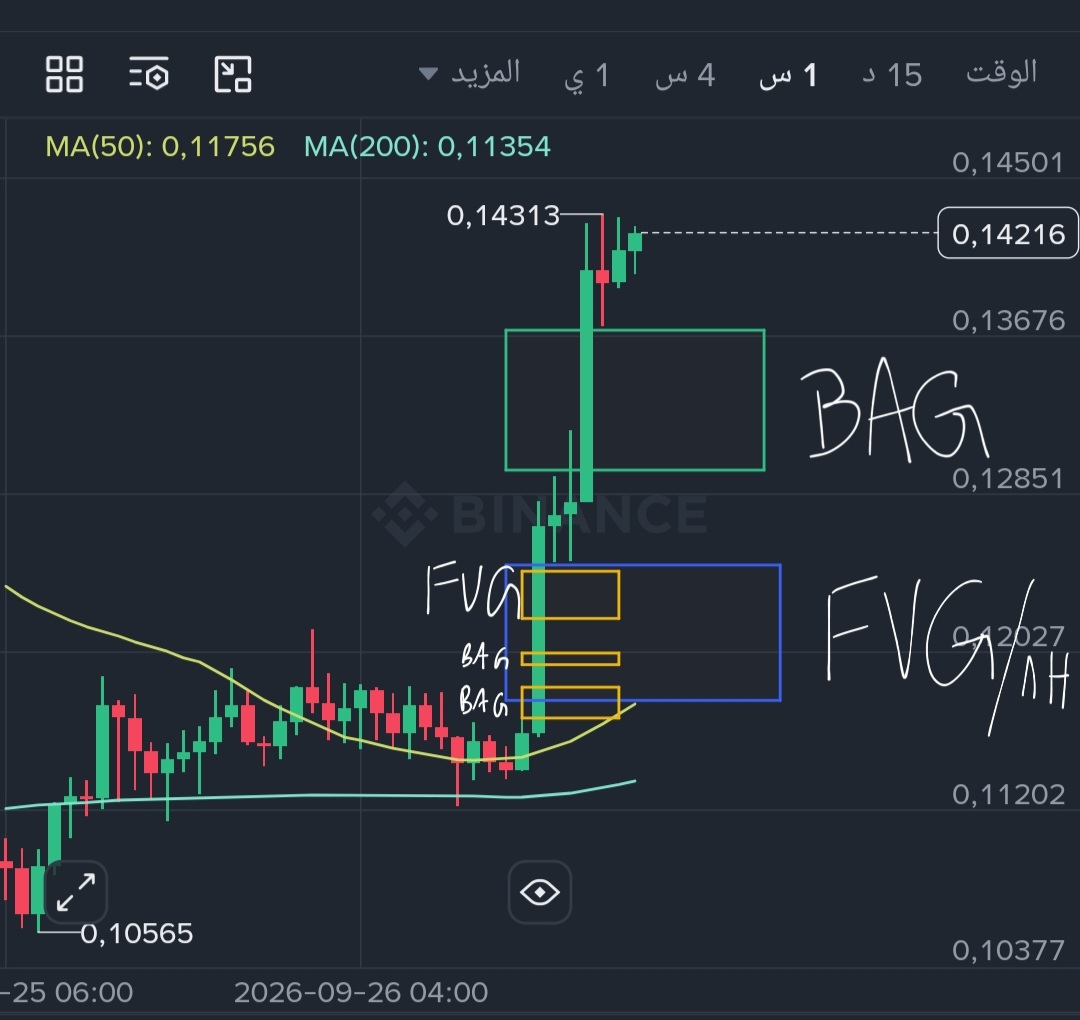
Risk Management
Capital Management
Don’t Chase the Price
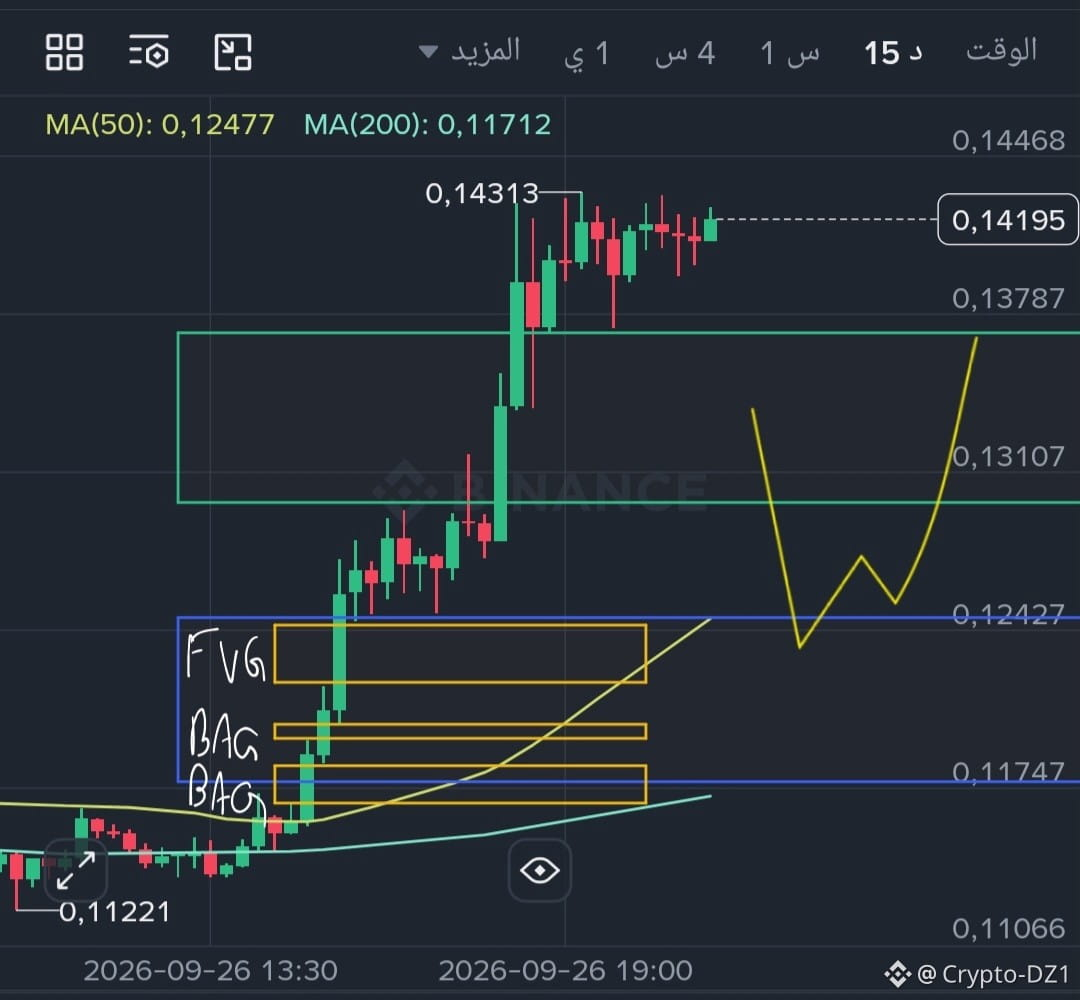
Re-testing
Educational Example
The content is not investment advice — do your own research
$MARSCOIN
{future}(MARSCOINUSDT)
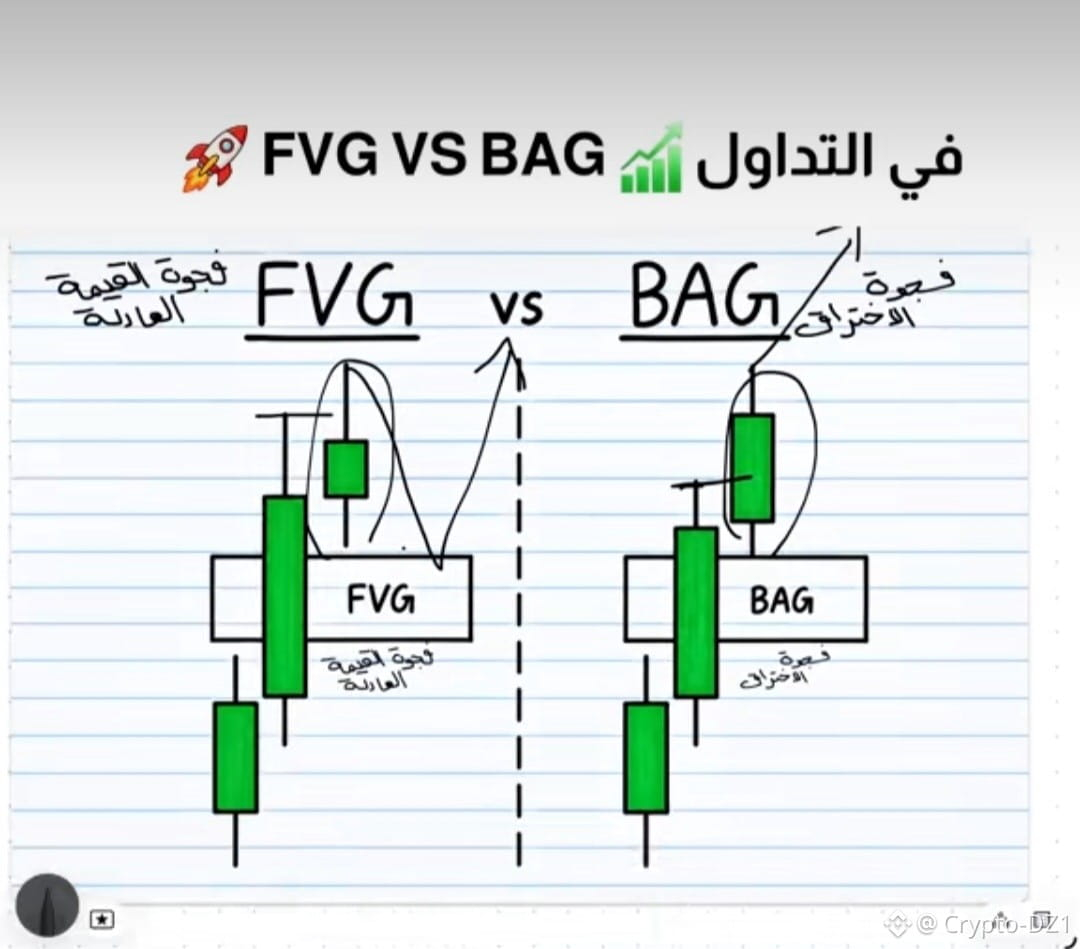
The Difference Between a Breakthrough Gap and a Fair Value Gap
Risk Management
Capital Management
Don’t Chase the Price
Re-testing
Educational Example
The content is not investment advice — do your own research
$MARSCOIN
The Difference Between a Breakthrough Gap and a Fair Value Gap
Capital Management
Don’t Chase the Price
Re-testing
Educational Example
The content is not investment advice — do your own research
$MARSCOIN
The Difference Between a Breakthrough Gap and a Fair Value Gap
1
688
·
--
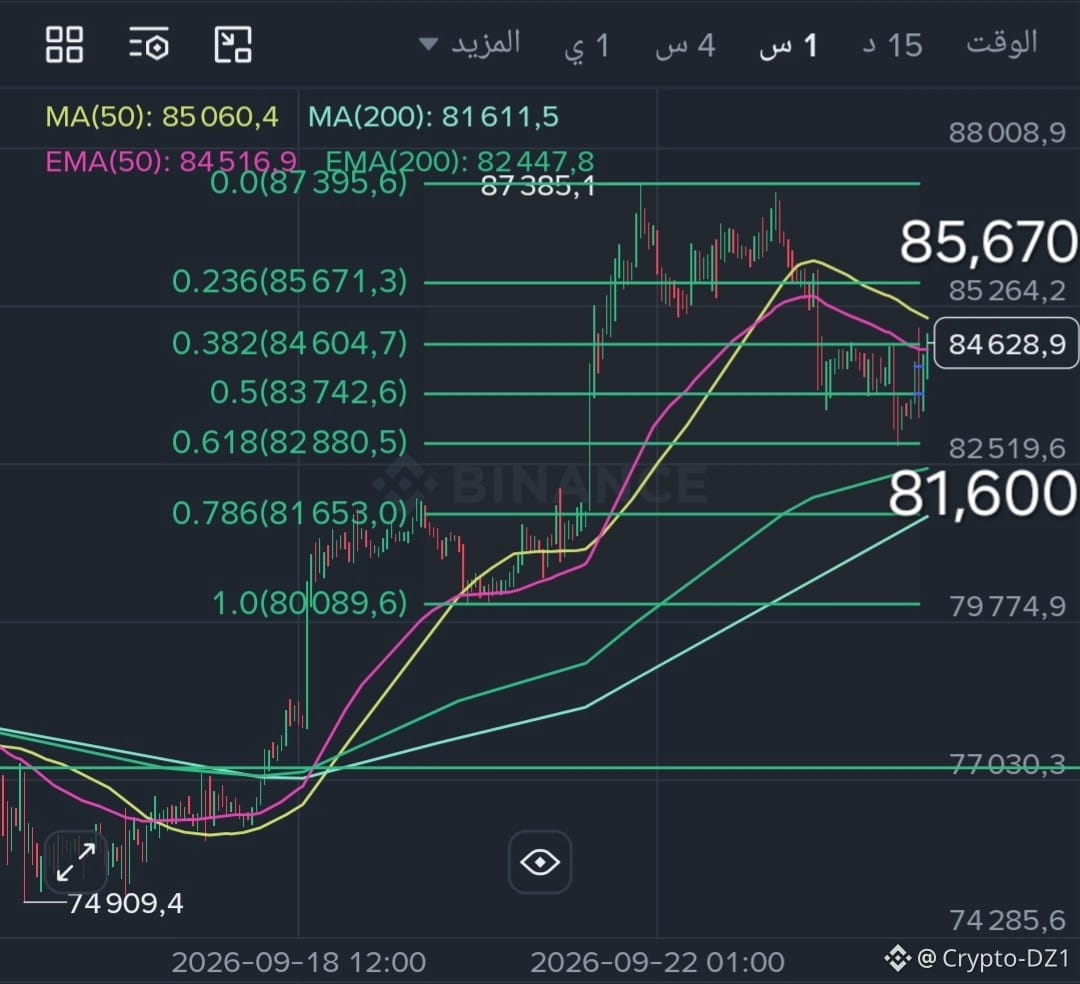
Bullish

475
·
--
Bullish
Slower ascent… greater accumulation.
The next Bitcoin bull wave could be the “most boring” yet
Higher cost of capital and rising institutional demand may lengthen the bull cycle, replacing the explosive spikes once driven by retail investors with slower, more stable accumulation.
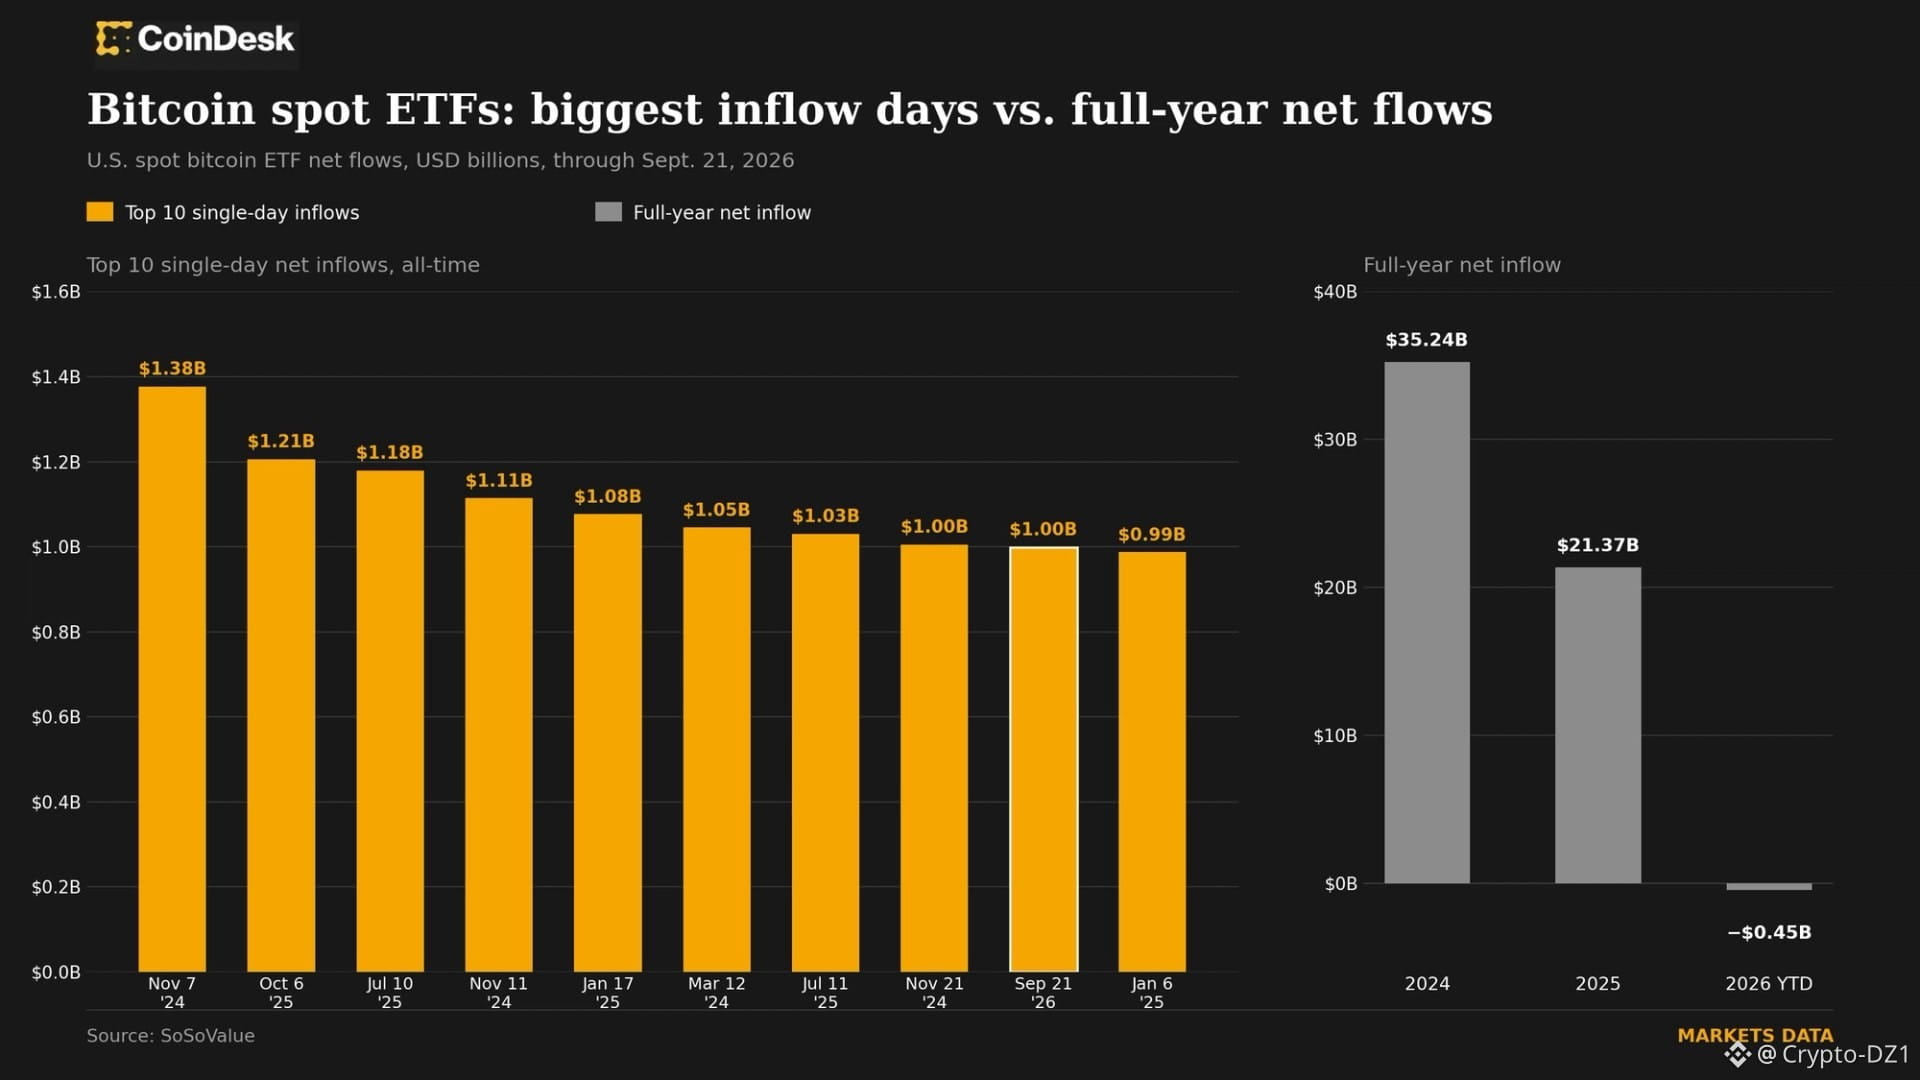
Bitcoin ETF inflows are approaching $1 billion in a single day, the ninth-largest since their launch.
🔸 IBIT: 381.37M$
🔸 ARKB: 289.12M$
🔸 FBTC: 238.84M$
BTC at $87,000 up 44% this quarter, but annual fund inflows are still negative by roughly $450M.
$BTC
{spot}(BTCUSDT)
#أعجبني
Slower ascent… greater accumulation.
The next Bitcoin bull wave could be the “most boring” yet
Higher cost of capital and rising institutional demand may lengthen the bull cycle, replacing the explosive spikes once driven by retail investors with slower, more stable accumulation.
Bitcoin ETF inflows are approaching $1 billion in a single day, the ninth-largest since their launch.
🔸 IBIT: 381.37M$
🔸 ARKB: 289.12M$
🔸 FBTC: 238.84M$
BTC at $87,000 up 44% this quarter, but annual fund inflows are still negative by roughly $450M.
$BTC
#أعجبني
The next Bitcoin bull wave could be the “most boring” yet
Higher cost of capital and rising institutional demand may lengthen the bull cycle, replacing the explosive spikes once driven by retail investors with slower, more stable accumulation.
Bitcoin ETF inflows are approaching $1 billion in a single day, the ninth-largest since their launch.
🔸 IBIT: 381.37M$
🔸 ARKB: 289.12M$
🔸 FBTC: 238.84M$
BTC at $87,000 up 44% this quarter, but annual fund inflows are still negative by roughly $450M.
$BTC
#أعجبني
1
1.8k
·
--
Bullish
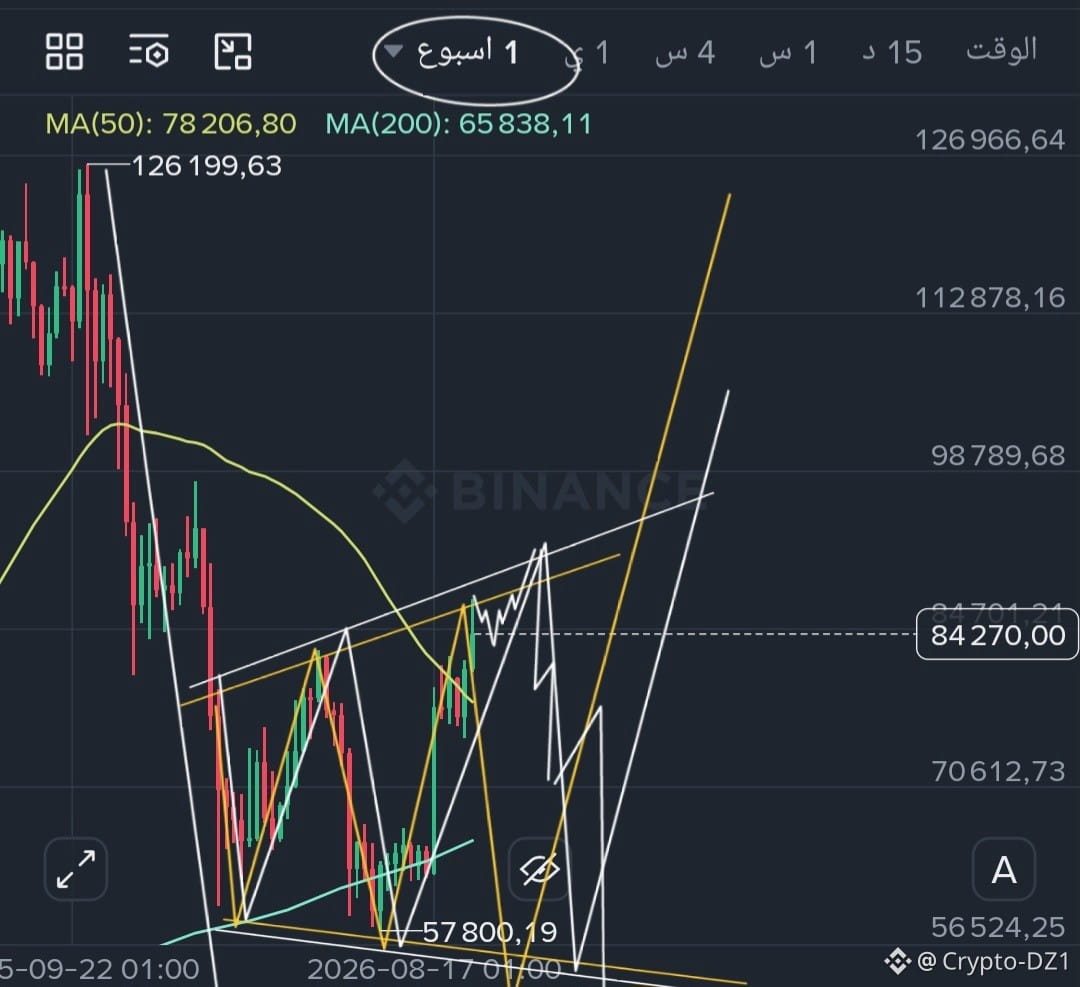
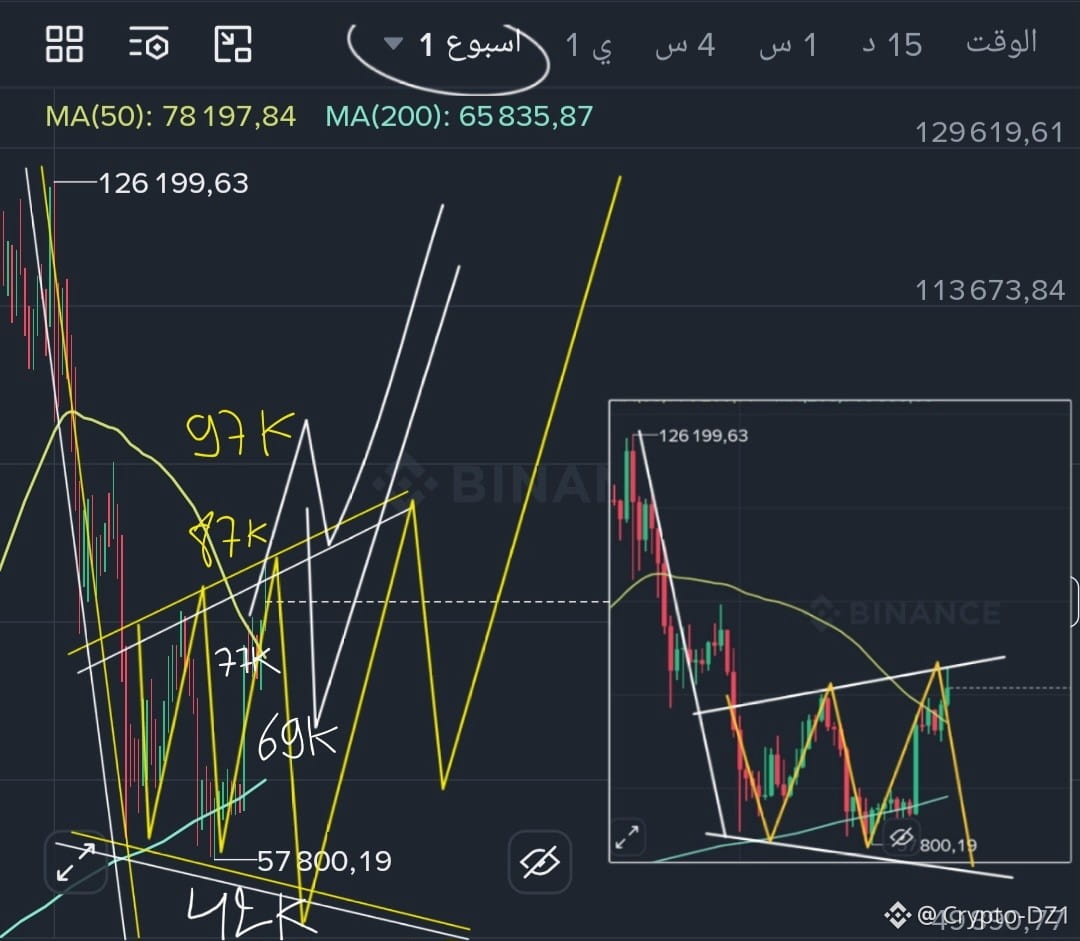
Expanding Flag (The Expanding Flag)
It is a pricing model that resembles a flag, but its lines move farther apart over time instead of coming closer—meaning the range of movement gradually becomes larger.
It consists of: higher highs + lower lows, so the movement appears widening.
It often indicates increased volatility and conflict between buyers and sellers.
A breakout from one end of the pattern may provide a signal about the direction of the next move.
In short:
> Expanding Flag = a widening volatility pattern, with its range increasing over time.
$BTC
{spot}(BTCUSDT)
#CFTC #CLARITY #BLOCKCHAIN #AI
The CFTC body does not wait for the CLARITY Act
Chairman Michael Selig says the regulator will use its current powers to set rules for the digital currency market if Congress fails to act.
He is also preparing for markets that operate 24/7 on the blockchain, supported by Blockchain and Artificial Intelligence (AI) technologies.
Congress discusses... and the crypto market continues to evolve.
#CLARITYACT
$BR
{future}(BRUSDT)
$PAXG
{spot}(PAXGUSDT)
Expanding Flag (The Expanding Flag)
It is a pricing model that resembles a flag, but its lines move farther apart over time instead of coming closer—meaning the range of movement gradually becomes larger.
It consists of: higher highs + lower lows, so the movement appears widening.
It often indicates increased volatility and conflict between buyers and sellers.
A breakout from one end of the pattern may provide a signal about the direction of the next move.
In short:
> Expanding Flag = a widening volatility pattern, with its range increasing over time.
$BTC
#CFTC #CLARITY #BLOCKCHAIN #AI
The CFTC body does not wait for the CLARITY Act
Chairman Michael Selig says the regulator will use its current powers to set rules for the digital currency market if Congress fails to act.
He is also preparing for markets that operate 24/7 on the blockchain, supported by Blockchain and Artificial Intelligence (AI) technologies.
Congress discusses... and the crypto market continues to evolve.
#CLARITYACT
$BR
$PAXG
It is a pricing model that resembles a flag, but its lines move farther apart over time instead of coming closer—meaning the range of movement gradually becomes larger.
It consists of: higher highs + lower lows, so the movement appears widening.
It often indicates increased volatility and conflict between buyers and sellers.
A breakout from one end of the pattern may provide a signal about the direction of the next move.
In short:
> Expanding Flag = a widening volatility pattern, with its range increasing over time.
$BTC
#CFTC #CLARITY #BLOCKCHAIN #AI
The CFTC body does not wait for the CLARITY Act
Chairman Michael Selig says the regulator will use its current powers to set rules for the digital currency market if Congress fails to act.
He is also preparing for markets that operate 24/7 on the blockchain, supported by Blockchain and Artificial Intelligence (AI) technologies.
Congress discusses... and the crypto market continues to evolve.
#CLARITYACT
$BR
$PAXG
666
·
--
Bullish
#شارك_أفكارك_حول_BTC $BTC
{spot}(BTCUSDT)
Bitcoin holders achieved $5.1 billion in net profits over the past week.
According to Glassnode, profit-taking is still relatively limited, and closer to late-2023 levels than the sharp conditions seen in the market at previous major peaks.
Profits are being taken, but excessive euphoria is no longer there.
#شارك_أفكارك_حول_BTC $BTC
Bitcoin holders achieved $5.1 billion in net profits over the past week.
According to Glassnode, profit-taking is still relatively limited, and closer to late-2023 levels than the sharp conditions seen in the market at previous major peaks.
Profits are being taken, but excessive euphoria is no longer there.
Bitcoin holders achieved $5.1 billion in net profits over the past week.
According to Glassnode, profit-taking is still relatively limited, and closer to late-2023 levels than the sharp conditions seen in the market at previous major peaks.
Profits are being taken, but excessive euphoria is no longer there.

487
·
--
Winds blow with what the ships do not desire.
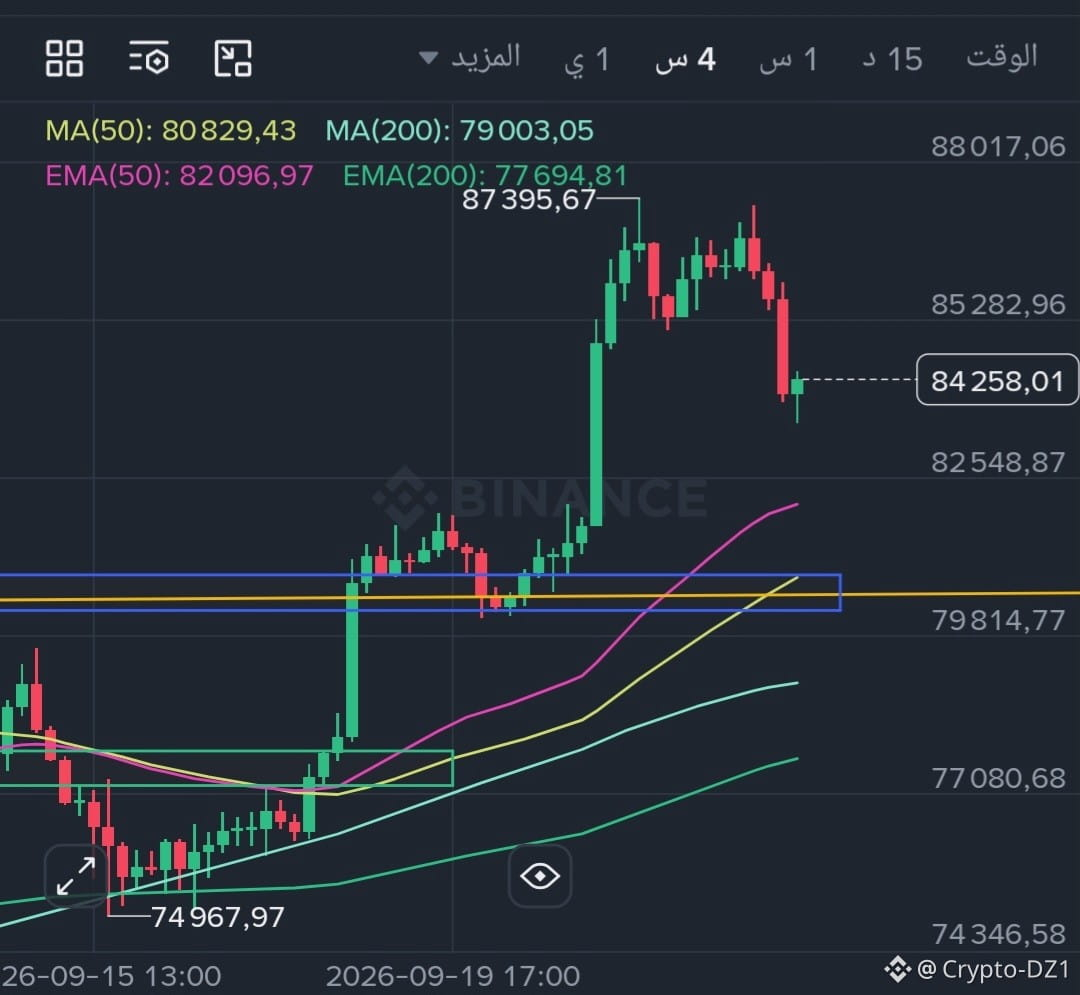
The price is currently above $77,000, and above the cost of short-term holders.
The main supply area for long-term holders: $84,000–$85,000.
The next important resistance: $96,700.
Important levels:
Support: $77,000.
Support/Critical level: $84,000.
Resistance: $95,000–$97,000.
Target/Main resistance on the chain: $96,700.
Holding above $84,000 keeps the path open toward $95,000–$97,000. But a return below $84,000 and then $77,000 will weaken this recovery.
$BTC
{spot}(BTCUSDT)
#LONGSQUEEZE Long Squeeze = buying positions pressure / liquidation of buying positions.
In trading: it occurs when the price drops sharply, forcing traders who entered long to close their positions, which increases selling pressure and the decline.
Winds blow with what the ships do not desire.
The price is currently above $77,000, and above the cost of short-term holders.
The main supply area for long-term holders: $84,000–$85,000.
The next important resistance: $96,700.
Important levels:
Support: $77,000.
Support/Critical level: $84,000.
Resistance: $95,000–$97,000.
Target/Main resistance on the chain: $96,700.
Holding above $84,000 keeps the path open toward $95,000–$97,000. But a return below $84,000 and then $77,000 will weaken this recovery.
$BTC
#LONGSQUEEZE Long Squeeze = buying positions pressure / liquidation of buying positions.
In trading: it occurs when the price drops sharply, forcing traders who entered long to close their positions, which increases selling pressure and the decline.
The price is currently above $77,000, and above the cost of short-term holders.
The main supply area for long-term holders: $84,000–$85,000.
The next important resistance: $96,700.
Important levels:
Support: $77,000.
Support/Critical level: $84,000.
Resistance: $95,000–$97,000.
Target/Main resistance on the chain: $96,700.
Holding above $84,000 keeps the path open toward $95,000–$97,000. But a return below $84,000 and then $77,000 will weaken this recovery.
$BTC
#LONGSQUEEZE Long Squeeze = buying positions pressure / liquidation of buying positions.
In trading: it occurs when the price drops sharply, forcing traders who entered long to close their positions, which increases selling pressure and the decline.

MUBARAK_CRYPTO11
·
--
[Ended] 🎙️ Not everything one desires is within reach
418 listens
1
1
193
·
--
Bullish
$BTC
{spot}(BTCUSDT)
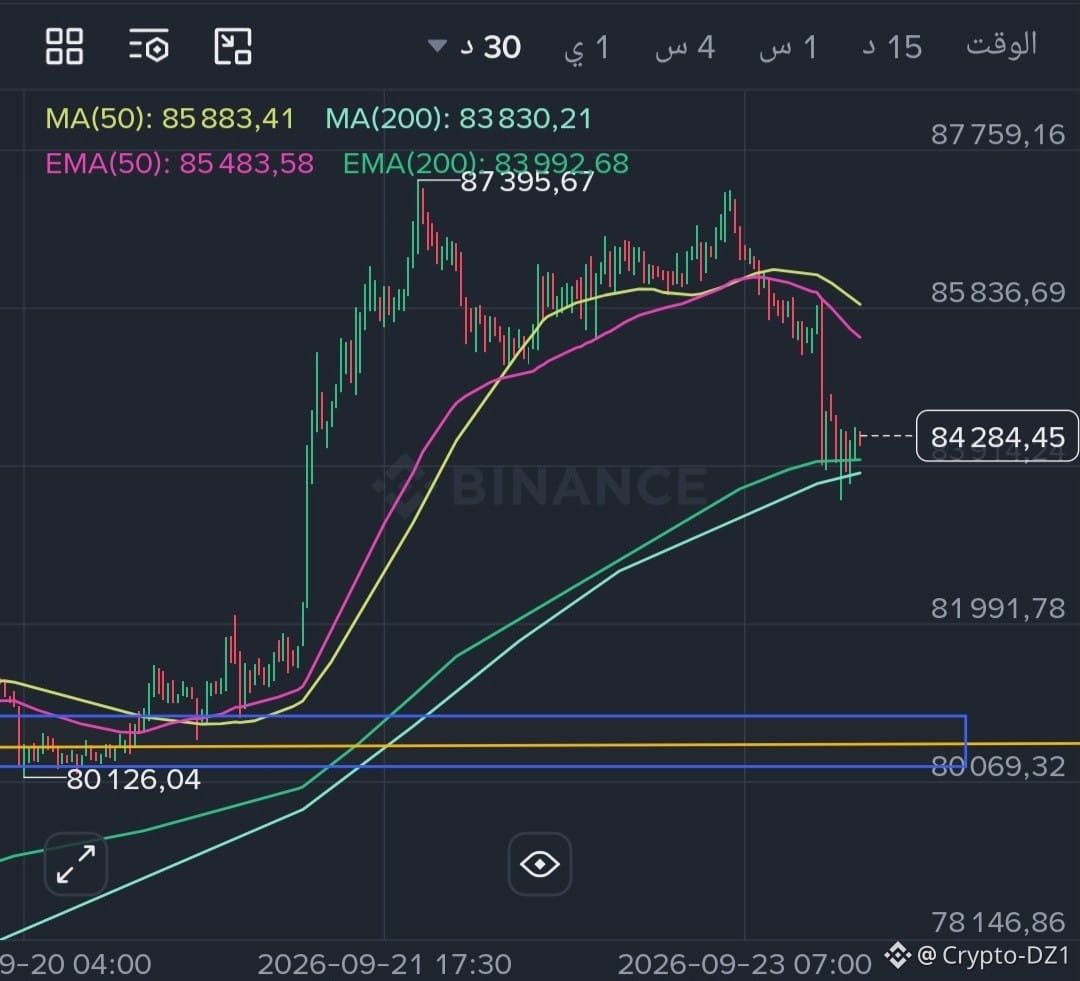
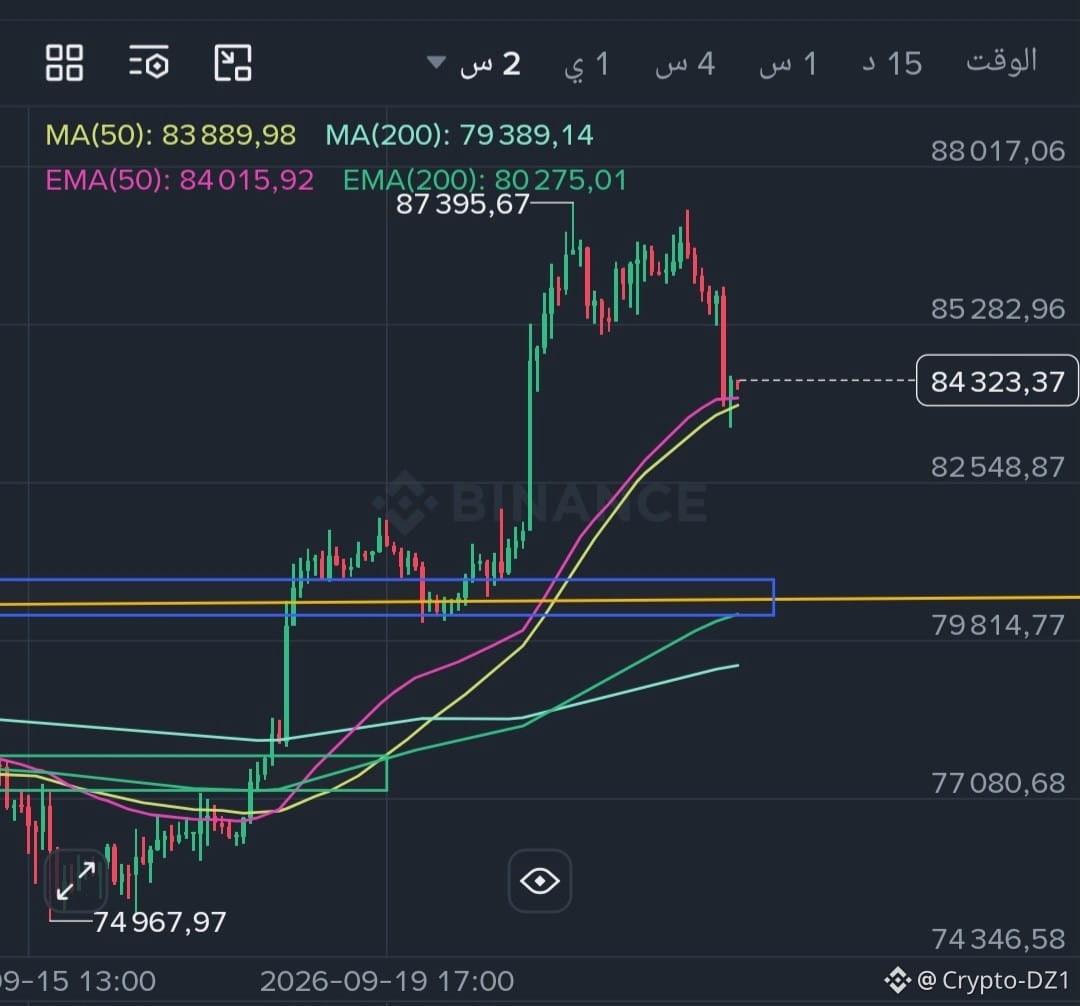
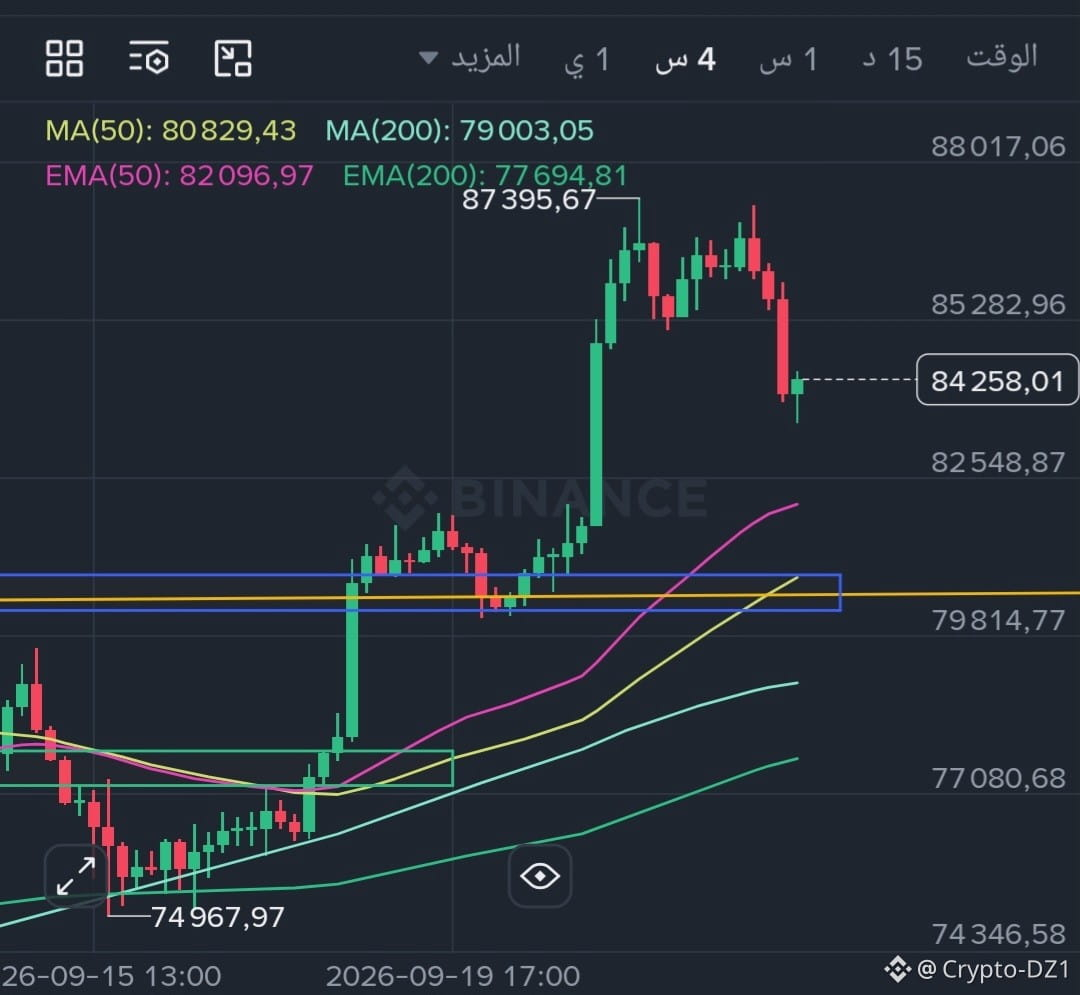
Bitcoin BTC/USDT analysis
Current price: ~84,300$ (-2.6% over the last 24 hours)
The price is now testing the critical **84,000$** level, which is also a key supply zone for long-term holders.
**Important levels:**
Support: 84,000$ then 80,000$ then 77,000$
Resistance: 87,400$ then 95,000–97,000$
**Scenarios:**
Holding above 84,000$ and breaking 87,400$ opens the way toward 95,000–97,000$
A 4-hour candle close below 83,800$ could move the price toward 80,000$ then 77,000$
The overall trend on the 4-hour timeframe is still bullish, but momentum has weakened on the smaller timeframes—it's best to wait for the candle close before making any decision.
This technical analysis is for information only and not financial advice. Follow risk management and set a stop-loss.
$BTC
Bitcoin BTC/USDT analysis
Current price: ~84,300$ (-2.6% over the last 24 hours)
The price is now testing the critical **84,000$** level, which is also a key supply zone for long-term holders.
**Important levels:**
Support: 84,000$ then 80,000$ then 77,000$
Resistance: 87,400$ then 95,000–97,000$
**Scenarios:**
Holding above 84,000$ and breaking 87,400$ opens the way toward 95,000–97,000$
A 4-hour candle close below 83,800$ could move the price toward 80,000$ then 77,000$
The overall trend on the 4-hour timeframe is still bullish, but momentum has weakened on the smaller timeframes—it's best to wait for the candle close before making any decision.
This technical analysis is for information only and not financial advice. Follow risk management and set a stop-loss.
Bitcoin BTC/USDT analysis
Current price: ~84,300$ (-2.6% over the last 24 hours)
The price is now testing the critical **84,000$** level, which is also a key supply zone for long-term holders.
**Important levels:**
Support: 84,000$ then 80,000$ then 77,000$
Resistance: 87,400$ then 95,000–97,000$
**Scenarios:**
Holding above 84,000$ and breaking 87,400$ opens the way toward 95,000–97,000$
A 4-hour candle close below 83,800$ could move the price toward 80,000$ then 77,000$
The overall trend on the 4-hour timeframe is still bullish, but momentum has weakened on the smaller timeframes—it's best to wait for the candle close before making any decision.
This technical analysis is for information only and not financial advice. Follow risk management and set a stop-loss.
125
·
--
Article
Glassnode – weekly summary
Bitcoin is surpassing key cost levelsGlassnode – weekly summary
Bitcoin is surpassing key cost levels
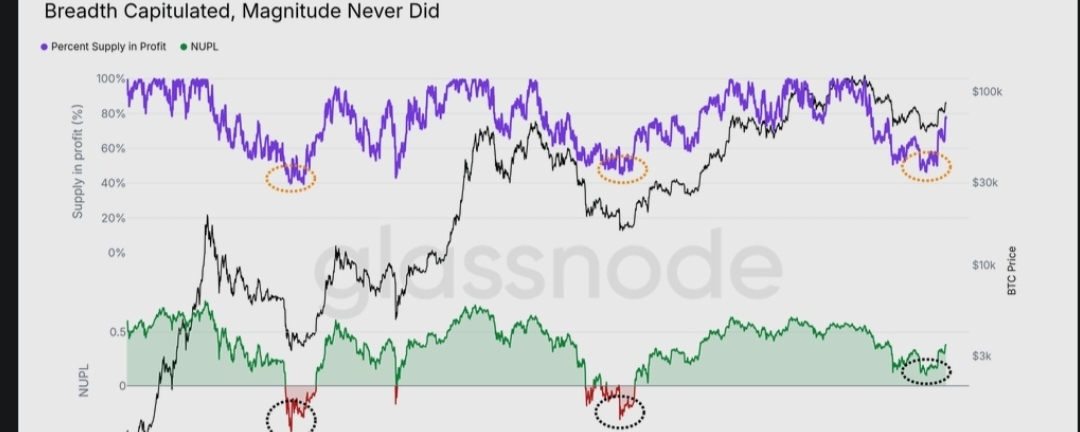
Bitcoin has surpassed the cost basis levels of holders that had been acting as resistance during 2026.
Bitcoin has not closed any day below the Realized Price during this cycle, unlike previous bear cycles.
The price is currently above the True Market Mean at $77,000 and above the short-term holders’ cost.
Glassnode – weekly summary Bitcoin is surpassing key cost levels
Glassnode – weekly summary
Bitcoin is surpassing key cost levels
Bitcoin has surpassed the cost basis levels of holders that had been acting as resistance during 2026.
Bitcoin has not closed any day below the Realized Price during this cycle, unlike previous bear cycles.
The price is currently above the True Market Mean at $77,000 and above the short-term holders’ cost.
Bitcoin is surpassing key cost levels
Bitcoin has surpassed the cost basis levels of holders that had been acting as resistance during 2026.
Bitcoin has not closed any day below the Realized Price during this cycle, unlike previous bear cycles.
The price is currently above the True Market Mean at $77,000 and above the short-term holders’ cost.
1
282
Log in to explore more content
Join global crypto users on Binance Square
⚡️ Get latest and useful information about crypto.
💬 Trusted by the world’s largest crypto exchange.
👍 Discover real insights from verified creators.
Email / Phone number