

0x_khm
41 Posts

0x_khm
Report
Block User
Crypt0 enthusiast \_(ツ)_/
6 Following
27 Followers
40 Liked
Posts
·
--
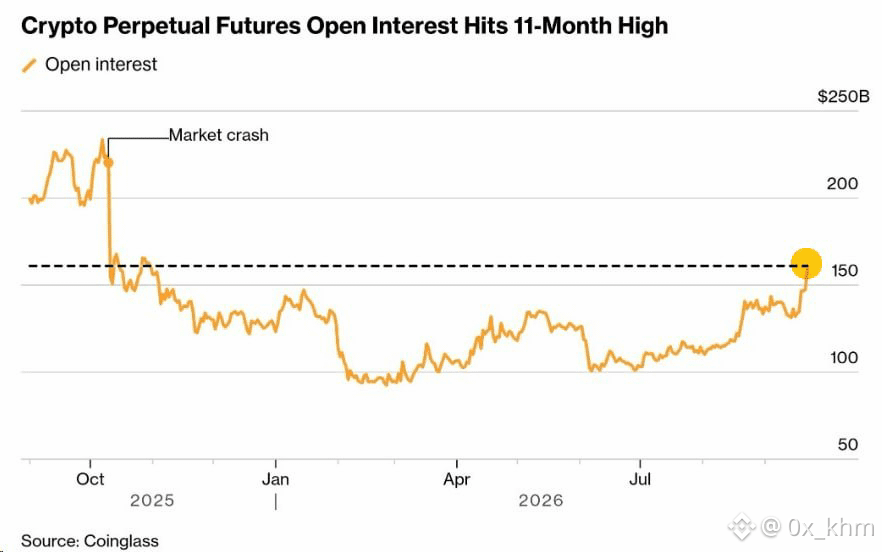
Open interest in crypto perpetual futures has risen to $160 billion—an 11-month high.
The market is once again heavily leveraged, meaning any sharp move could quickly trigger a wave of liquidations.
Open interest in crypto perpetual futures has risen to $160 billion—an 11-month high.
The market is once again heavily leveraged, meaning any sharp move could quickly trigger a wave of liquidations.
The market is once again heavily leveraged, meaning any sharp move could quickly trigger a wave of liquidations.
86
·
--
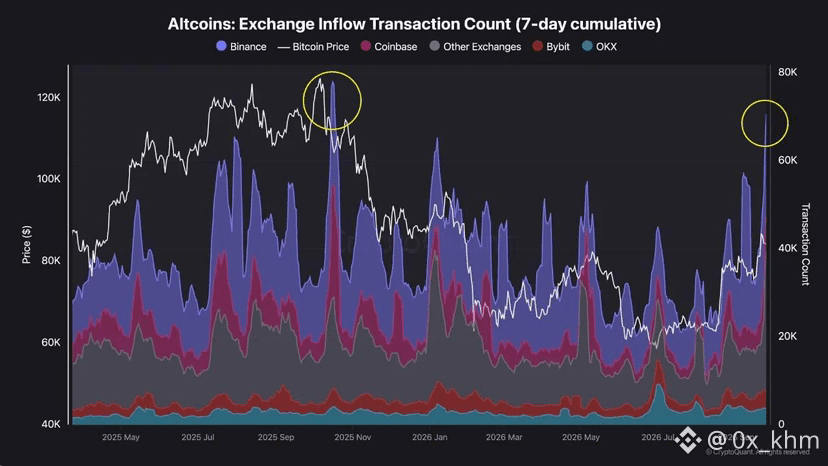
Altcoin deposits just tagged the October 2025 zone.
That's the 7-day inflow count, not dollar volume. More wallets sending alts to CEX after a clean run. That's usually holders lining up an exit, not fresh demand.
Makes sense. Market ran, some of the summer bags finally went green, and people take it. A pullback or even just a quiet week from here wouldn't be a surprise.
Not calling a top. Just not treating this spike as fuel for the next leg.
If you've been riding alts, this is the tape that says size the next add smaller — or wait for the dip those deposits are probably trying to sell into.
Fading this, or calling it noise?
Altcoin deposits just tagged the October 2025 zone.
That's the 7-day inflow count, not dollar volume. More wallets sending alts to CEX after a clean run. That's usually holders lining up an exit, not fresh demand.
Makes sense. Market ran, some of the summer bags finally went green, and people take it. A pullback or even just a quiet week from here wouldn't be a surprise.
Not calling a top. Just not treating this spike as fuel for the next leg.
If you've been riding alts, this is the tape that says size the next add smaller — or wait for the dip those deposits are probably trying to sell into.
Fading this, or calling it noise?
That's the 7-day inflow count, not dollar volume. More wallets sending alts to CEX after a clean run. That's usually holders lining up an exit, not fresh demand.
Makes sense. Market ran, some of the summer bags finally went green, and people take it. A pullback or even just a quiet week from here wouldn't be a surprise.
Not calling a top. Just not treating this spike as fuel for the next leg.
If you've been riding alts, this is the tape that says size the next add smaller — or wait for the dip those deposits are probably trying to sell into.
Fading this, or calling it noise?
1
215
·
--
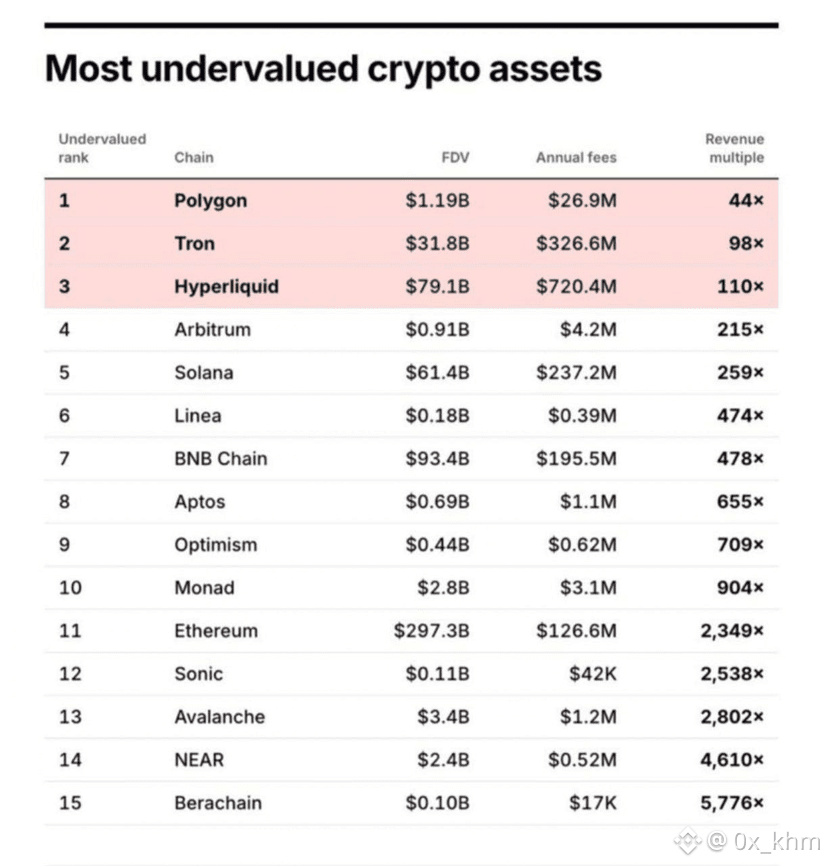
This is FDV / annual fees. Lower number = the market is paying less per dollar of chain revenue.
Cheapest three: $POL 44x, Tron 98x, $HYPE 110x. Most expensive three: Avalanche, $NEAR , Berachain.
Not a buy list. Fees on a chain and value that hits the token are two different things. If I’m using this as a first cut anyway, the four I’d actually open are $POL, $HYPE, $ARB and Linea.
The 44x vs 2,300x on $ETH is the part that needs an explanation, not a slogan.
Which name on this list actually captures the fees?
{spot}(NEARUSDT)
{spot}(HYPEUSDT)
{spot}(POLUSDT)
This is FDV / annual fees. Lower number = the market is paying less per dollar of chain revenue.
Cheapest three: $POL 44x, Tron 98x, $HYPE 110x. Most expensive three: Avalanche, $NEAR , Berachain.
Not a buy list. Fees on a chain and value that hits the token are two different things. If I’m using this as a first cut anyway, the four I’d actually open are $POL , $HYPE , $ARB and Linea.
The 44x vs 2,300x on $ETH is the part that needs an explanation, not a slogan.
Which name on this list actually captures the fees?
Cheapest three: $POL 44x, Tron 98x, $HYPE 110x. Most expensive three: Avalanche, $NEAR , Berachain.
Not a buy list. Fees on a chain and value that hits the token are two different things. If I’m using this as a first cut anyway, the four I’d actually open are $POL , $HYPE , $ARB and Linea.
The 44x vs 2,300x on $ETH is the part that needs an explanation, not a slogan.
Which name on this list actually captures the fees?
688
·
--
End of bear-market?
$BTC weekly close above $84k.
That’s another point on the board that the downtrend is actually flipping — not hopium, just how prior cycles stopped making lower highs.
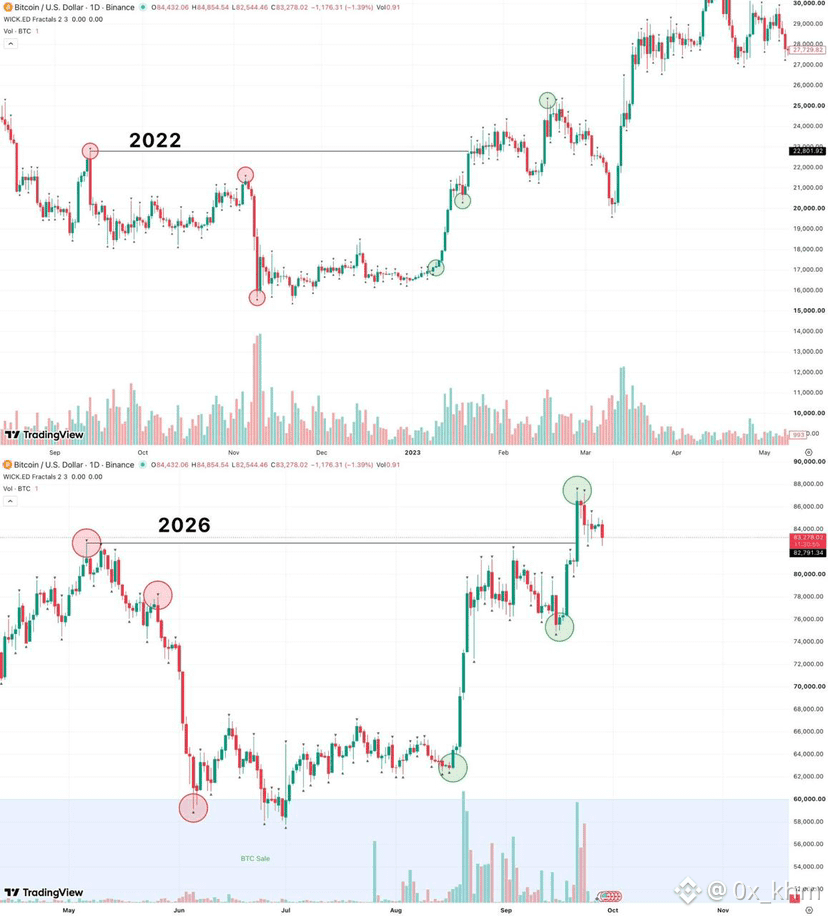
Same sequence every time: take out the last major high, hold above it, structure turns. After that the tape stops being “sell every bounce” and starts looking like grind-up, correct, grind-up.
2022 vs now is almost 1:1 on the daily. Same circled highs, same flush, same reclaim of the level that used to cap every rally.
Doesn’t mean a new ATH next week. A trend change is not a moon bag. It’s a staircase.
Those stairs are the add. Especially if you sat out the summer lows waiting for a print that never came. We’re in one of those pullbacks now — if it goes deeper, that’s the spot bid. $BTC first, then whatever you actually want to hold.
What level are you waiting on?
{spot}(BTCUSDT)
End of bear-market?
$BTC weekly close above $84k.
That’s another point on the board that the downtrend is actually flipping — not hopium, just how prior cycles stopped making lower highs.
Same sequence every time: take out the last major high, hold above it, structure turns. After that the tape stops being “sell every bounce” and starts looking like grind-up, correct, grind-up.
2022 vs now is almost 1:1 on the daily. Same circled highs, same flush, same reclaim of the level that used to cap every rally.
Doesn’t mean a new ATH next week. A trend change is not a moon bag. It’s a staircase.
Those stairs are the add. Especially if you sat out the summer lows waiting for a print that never came. We’re in one of those pullbacks now — if it goes deeper, that’s the spot bid. $BTC first, then whatever you actually want to hold.
What level are you waiting on?
$BTC weekly close above $84k.
That’s another point on the board that the downtrend is actually flipping — not hopium, just how prior cycles stopped making lower highs.
Same sequence every time: take out the last major high, hold above it, structure turns. After that the tape stops being “sell every bounce” and starts looking like grind-up, correct, grind-up.
2022 vs now is almost 1:1 on the daily. Same circled highs, same flush, same reclaim of the level that used to cap every rally.
Doesn’t mean a new ATH next week. A trend change is not a moon bag. It’s a staircase.
Those stairs are the add. Especially if you sat out the summer lows waiting for a print that never came. We’re in one of those pullbacks now — if it goes deeper, that’s the spot bid. $BTC first, then whatever you actually want to hold.
What level are you waiting on?
145
·
--
Treasuries bought the same week everyone else was selling.
Three prints, ~$284M:
Strategy — 1,665 $BTC for $142.7M at $85,681
Strive — 1,107 $BTC for $94.5M at $85,396 (stack now 27,462)
BitMine — 17,362 $ETH for $46.8M (stack now >6M ETH, book ~$17.2B with cash)
They did it into this tape: alt deposits on exchanges tagged the Oct 2025 high, miners stepped up $BTC sales, spot slipped under $83k.
Retail and miners were distributing. Corporate treasuries were the bid.
Same split I watched in April — panic on one side of the book, quiet size on the other.
Who’s right gets settled later. The gap between the two groups is just unusually clean right now.
Which side of this tape are you on?
{spot}(BTCUSDT)
Treasuries bought the same week everyone else was selling.
Three prints, ~$284M:
Strategy — 1,665 $BTC for $142.7M at $85,681
Strive — 1,107 $BTC for $94.5M at $85,396 (stack now 27,462)
BitMine — 17,362 $ETH for $46.8M (stack now >6M ETH, book ~$17.2B with cash)
They did it into this tape: alt deposits on exchanges tagged the Oct 2025 high, miners stepped up $BTC sales, spot slipped under $83k.
Retail and miners were distributing. Corporate treasuries were the bid.
Same split I watched in April — panic on one side of the book, quiet size on the other.
Who’s right gets settled later. The gap between the two groups is just unusually clean right now.
Which side of this tape are you on?
Three prints, ~$284M:
Strategy — 1,665 $BTC for $142.7M at $85,681
Strive — 1,107 $BTC for $94.5M at $85,396 (stack now 27,462)
BitMine — 17,362 $ETH for $46.8M (stack now >6M ETH, book ~$17.2B with cash)
They did it into this tape: alt deposits on exchanges tagged the Oct 2025 high, miners stepped up $BTC sales, spot slipped under $83k.
Retail and miners were distributing. Corporate treasuries were the bid.
Same split I watched in April — panic on one side of the book, quiet size on the other.
Who’s right gets settled later. The gap between the two groups is just unusually clean right now.
Which side of this tape are you on?
136
·
--
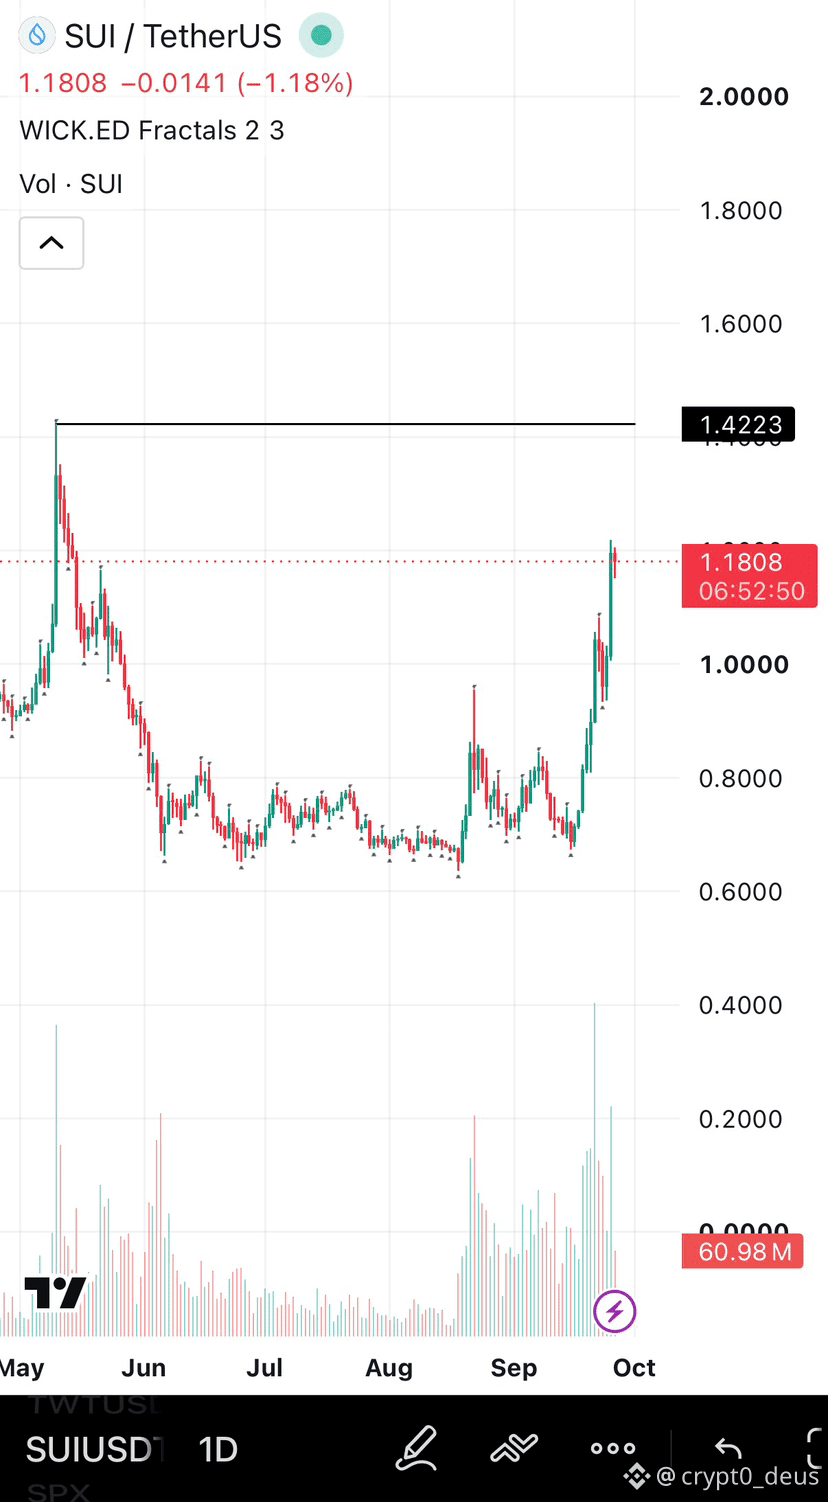
$SUI left the range this week. May high is still untouched.
A lot of alts already took that print. SUI hasn’t. Cap on the screen is $1.18, line overhead is $1.42 — about 21% if the same break happens here.
Volume has to keep coming into alts or this is just a range reclaim. Stops under the break. DYOR.
Does SUI tag May — or does the bid rotate before it gets there?
{future}(SUIUSDT)
$SUI left the range this week. May high is still untouched.
A lot of alts already took that print. SUI hasn’t. Cap on the screen is $1.18, line overhead is $1.42 — about 21% if the same break happens here.
Volume has to keep coming into alts or this is just a range reclaim. Stops under the break. DYOR.
Does SUI tag May — or does the bid rotate before it gets there?
A lot of alts already took that print. SUI hasn’t. Cap on the screen is $1.18, line overhead is $1.42 — about 21% if the same break happens here.
Volume has to keep coming into alts or this is just a range reclaim. Stops under the break. DYOR.
Does SUI tag May — or does the bid rotate before it gets there?
200
·
--
Tape is locally risk-on. That’s not a mood. That’s the book.
Spot $BTC ETFs just printed the fattest day of 2026 — ~$999M on Monday, another ~$715M Tuesday. Alts are paying, shorts keep getting lifted. First leg was the mainstream narratives. Second leg is memes and mid-caps joining.
How long it lasts is a political question as much as a chart one. One read: crypto and equities get held bid into the midterms so that audience still has something to vote with. We’ll see. Until then you trade what’s on the screen.
Chart still needs this week to close above $82.9k. That’s the next confirmation on the structure break from yesterday.
{spot}(BTCUSDT)
Tape is locally risk-on. That’s not a mood. That’s the book.
Spot $BTC ETFs just printed the fattest day of 2026 — ~$999M on Monday, another ~$715M Tuesday. Alts are paying, shorts keep getting lifted. First leg was the mainstream narratives. Second leg is memes and mid-caps joining.
How long it lasts is a political question as much as a chart one. One read: crypto and equities get held bid into the midterms so that audience still has something to vote with. We’ll see. Until then you trade what’s on the screen.
Chart still needs this week to close above $82.9k. That’s the next confirmation on the structure break from yesterday.
Spot $BTC ETFs just printed the fattest day of 2026 — ~$999M on Monday, another ~$715M Tuesday. Alts are paying, shorts keep getting lifted. First leg was the mainstream narratives. Second leg is memes and mid-caps joining.
How long it lasts is a political question as much as a chart one. One read: crypto and equities get held bid into the midterms so that audience still has something to vote with. We’ll see. Until then you trade what’s on the screen.
Chart still needs this week to close above $82.9k. That’s the next confirmation on the structure break from yesterday.
270
·
--
Start of the BULL MARKET? 🐂
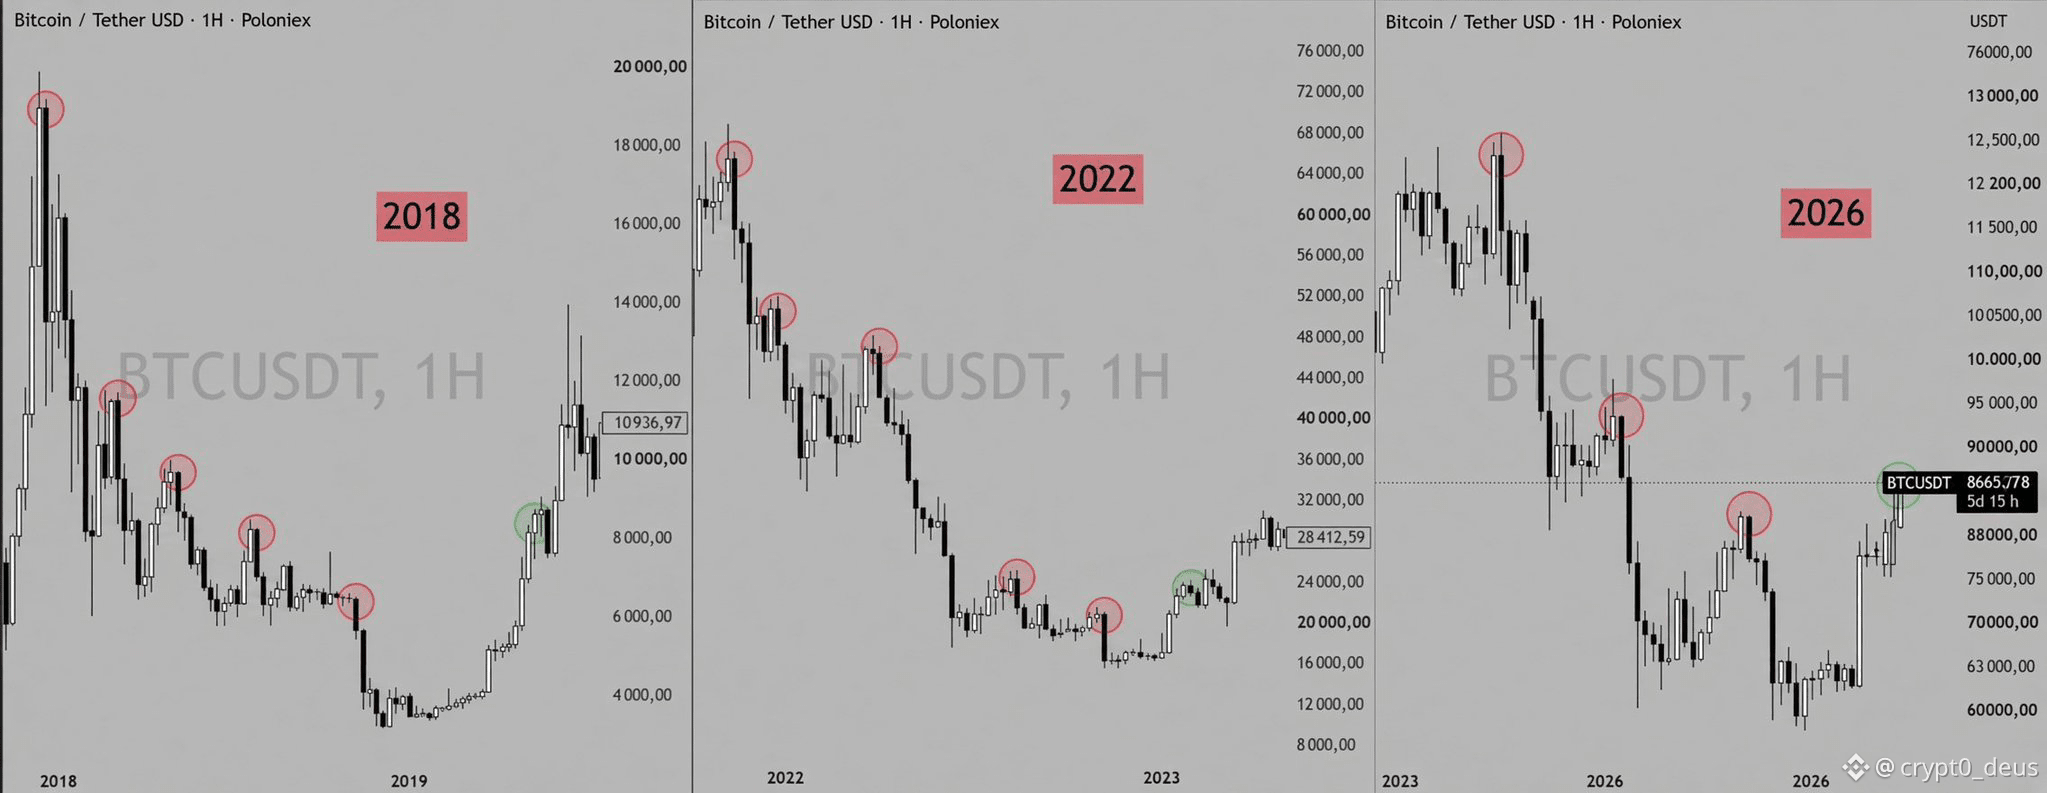
$BTC $86k. May high at $82.9k is gone.
From October 2025 the tape was a clean downtrend: every bounce printed a lower high. That structure just broke. First time the previous high got taken out.
This is the same break that marked the end of prior bears. Strip the headlines, the macro stack, the mood. On the chart we’re walking into a new cycle.
If the pattern holds, the high-$50s print was the low. Corrections still come. Those are the discounts.
You treating $86k as confirmation — or waiting for the first throwback to fade it?
{future}(BTCUSDT)
Start of the BULL MARKET? 🐂
$BTC $86k. May high at $82.9k is gone.
From October 2025 the tape was a clean downtrend: every bounce printed a lower high. That structure just broke. First time the previous high got taken out.
This is the same break that marked the end of prior bears. Strip the headlines, the macro stack, the mood. On the chart we’re walking into a new cycle.
If the pattern holds, the high-$50s print was the low. Corrections still come. Those are the discounts.
You treating $86k as confirmation — or waiting for the first throwback to fade it?
$BTC $86k. May high at $82.9k is gone.
From October 2025 the tape was a clean downtrend: every bounce printed a lower high. That structure just broke. First time the previous high got taken out.
This is the same break that marked the end of prior bears. Strip the headlines, the macro stack, the mood. On the chart we’re walking into a new cycle.
If the pattern holds, the high-$50s print was the low. Corrections still come. Those are the discounts.
You treating $86k as confirmation — or waiting for the first throwback to fade it?
318
·
--
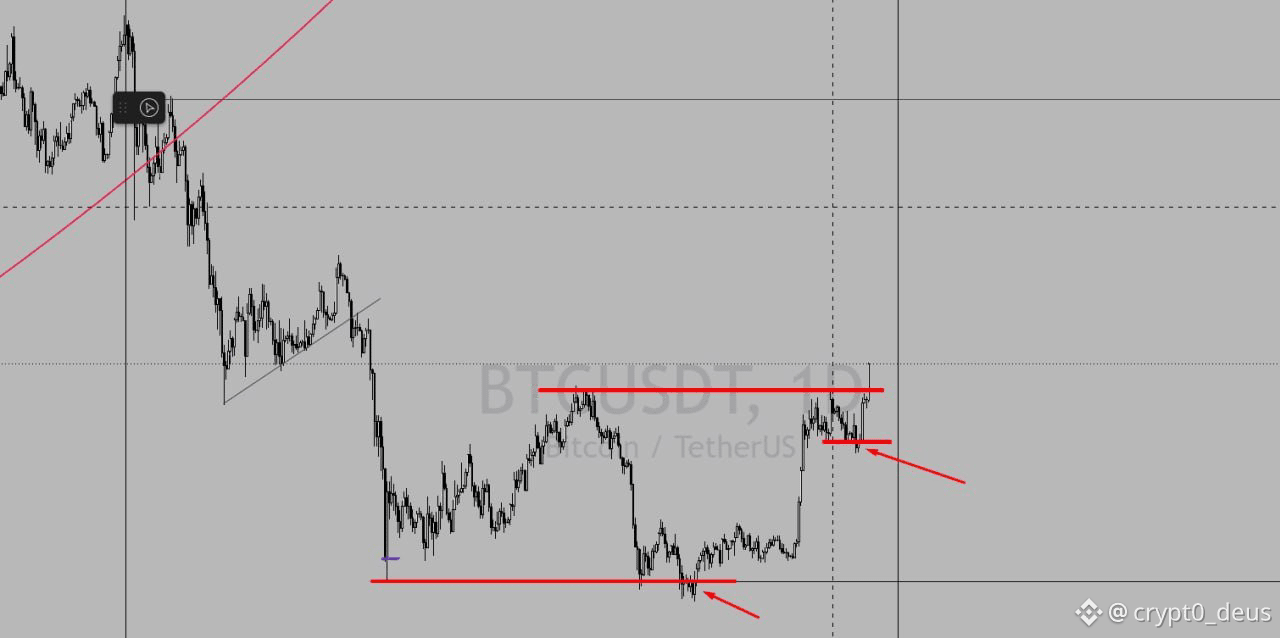
On the chart it actually looks clean.
Throw out the fundamental noise and the daily is saying a bull market can start from here. Chart doesn’t lie. Best process is still the same: trust the structure, park the emotions, the headlines, the macro story.
Only-chart, this is by the book. Classic reversal. Trend trying to start.
The timeline is still scared. Nobody wants to tap. Last-cycle PTSD plus a year of bad tape — the market “only takes,” it doesn’t give. That’s the mood.
Oct 10 is close. Anniversary of the day that zeroed most of the book and opened the bear. A year later people forgot a tape can also print a holiday. That’s when you zoom out and believe the chart, not the feed.
If this is the end of the bear, on the candles it was the easy one. Emotionally it wasn’t. TikTok and Instagram loaded so much apathy that in under a year most of the timeline changed niches.
Ready to come back?
On the chart it actually looks clean.
Throw out the fundamental noise and the daily is saying a bull market can start from here. Chart doesn’t lie. Best process is still the same: trust the structure, park the emotions, the headlines, the macro story.
Only-chart, this is by the book. Classic reversal. Trend trying to start.
The timeline is still scared. Nobody wants to tap. Last-cycle PTSD plus a year of bad tape — the market “only takes,” it doesn’t give. That’s the mood.
Oct 10 is close. Anniversary of the day that zeroed most of the book and opened the bear. A year later people forgot a tape can also print a holiday. That’s when you zoom out and believe the chart, not the feed.
If this is the end of the bear, on the candles it was the easy one. Emotionally it wasn’t. TikTok and Instagram loaded so much apathy that in under a year most of the timeline changed niches.
Ready to come back?
Throw out the fundamental noise and the daily is saying a bull market can start from here. Chart doesn’t lie. Best process is still the same: trust the structure, park the emotions, the headlines, the macro story.
Only-chart, this is by the book. Classic reversal. Trend trying to start.
The timeline is still scared. Nobody wants to tap. Last-cycle PTSD plus a year of bad tape — the market “only takes,” it doesn’t give. That’s the mood.
Oct 10 is close. Anniversary of the day that zeroed most of the book and opened the bear. A year later people forgot a tape can also print a holiday. That’s when you zoom out and believe the chart, not the feed.
If this is the end of the bear, on the candles it was the easy one. Emotionally it wasn’t. TikTok and Instagram loaded so much apathy that in under a year most of the timeline changed niches.
Ready to come back?
189
·
--
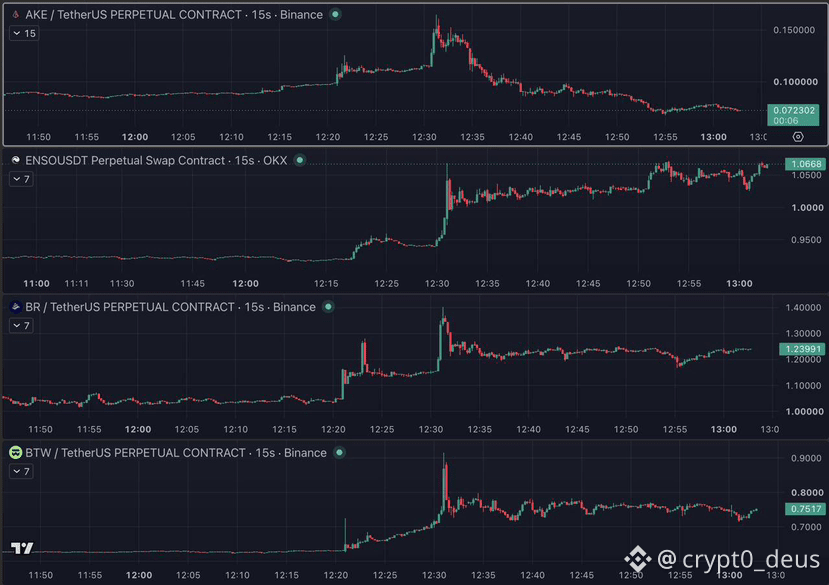
When liquidations start printing, they rarely stay on one pair.
Same 15s window. $AKE , $ENSO, $BR, $BTW — four perps, one vertical. That’s not four separate stories. That’s one book getting force-closed.
Traders run the same side across a handful of contracts. One name trips margin, the engine sells (or buys) the rest of the book, and you get a chain reaction that looks like “everything is pumping.” It isn’t. It’s inventory being dumped into the tape.
If you trade mid-caps on perps, watch the cluster, not the candle.
Which of these prints was a real bid — and which was just the liquidation engine?
{future}(AKEUSDT)
{future}(BTWUSDT)
When liquidations start printing, they rarely stay on one pair.
Same 15s window. $AKE , $ENSO, $BR, $BTW — four perps, one vertical. That’s not four separate stories. That’s one book getting force-closed.
Traders run the same side across a handful of contracts. One name trips margin, the engine sells (or buys) the rest of the book, and you get a chain reaction that looks like “everything is pumping.” It isn’t. It’s inventory being dumped into the tape.
If you trade mid-caps on perps, watch the cluster, not the candle.
Which of these prints was a real bid — and which was just the liquidation engine?
Same 15s window. $AKE , $ENSO, $BR, $BTW — four perps, one vertical. That’s not four separate stories. That’s one book getting force-closed.
Traders run the same side across a handful of contracts. One name trips margin, the engine sells (or buys) the rest of the book, and you get a chain reaction that looks like “everything is pumping.” It isn’t. It’s inventory being dumped into the tape.
If you trade mid-caps on perps, watch the cluster, not the candle.
Which of these prints was a real bid — and which was just the liquidation engine?
711
·
--
$BTC next stop $83k?
Tape is running on short fuel. Another ~$500M flushed in 24h, mostly shorts. The Aug–Sep squeeze has been a razor. Hard to remember a cleaner one.
Setups are everywhere if you want them: crime for scalp, plus the live metas — Privacy, L2, RWA — where a green exit is not a secret.
On Bitcoin the level that matters is the May high at $83k. Fourth tap. Could get tagged in the next few days.
Reaction decides the tape. Hold it and the trend stays on. Reject it and you get a cooldown.
You fading the fourth test, or waiting for acceptance?
{future}(BTCUSDT)
$BTC next stop $83k?
Tape is running on short fuel. Another ~$500M flushed in 24h, mostly shorts. The Aug–Sep squeeze has been a razor. Hard to remember a cleaner one.
Setups are everywhere if you want them: crime for scalp, plus the live metas — Privacy, L2, RWA — where a green exit is not a secret.
On Bitcoin the level that matters is the May high at $83k. Fourth tap. Could get tagged in the next few days.
Reaction decides the tape. Hold it and the trend stays on. Reject it and you get a cooldown.
You fading the fourth test, or waiting for acceptance?
Tape is running on short fuel. Another ~$500M flushed in 24h, mostly shorts. The Aug–Sep squeeze has been a razor. Hard to remember a cleaner one.
Setups are everywhere if you want them: crime for scalp, plus the live metas — Privacy, L2, RWA — where a green exit is not a secret.
On Bitcoin the level that matters is the May high at $83k. Fourth tap. Could get tagged in the next few days.
Reaction decides the tape. Hold it and the trend stays on. Reject it and you get a cooldown.
You fading the fourth test, or waiting for acceptance?
641
·
--
$HBAR
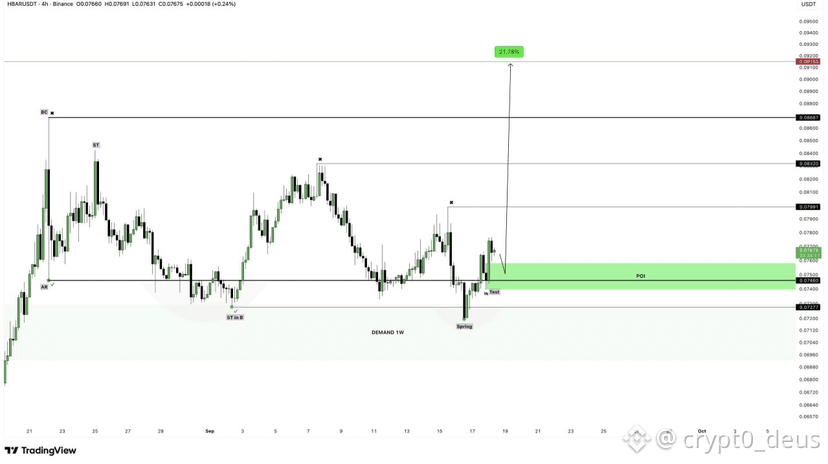
Within the current range, distinct signs of a Type 1 Wyckoff re-accumulation can be traced.
The expected test of the newly formed Order Block will, with high probability, lead to a further acceleration of upside price action, which will provide a quality opportunity to look for a reversal setup and open a long position with ~21.78% upside potential.
$HBAR
Within the current range, distinct signs of a Type 1 Wyckoff re-accumulation can be traced.
The expected test of the newly formed Order Block will, with high probability, lead to a further acceleration of upside price action, which will provide a quality opportunity to look for a reversal setup and open a long position with ~21.78% upside potential.
Within the current range, distinct signs of a Type 1 Wyckoff re-accumulation can be traced.
The expected test of the newly formed Order Block will, with high probability, lead to a further acceleration of upside price action, which will provide a quality opportunity to look for a reversal setup and open a long position with ~21.78% upside potential.
365
·
--
$BTC isn’t trending. It’s printing the same bar twice.
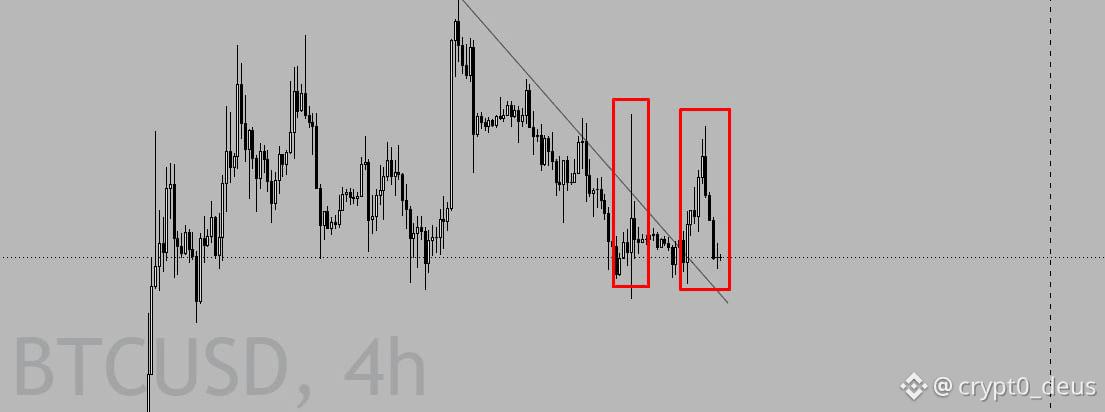
Rally → dump. Rally → dump. Same level on the 4H. That’s not a breakout attempt. That’s failed follow-through.
Yesterday bid on higher CLARITY odds. Today offered them back when the odds faded. The chart is tracking implied probability, not a new regime.
Base case: another delay. If cloture actually clears, you’ll see it immediately — impulse across the board, no debate. I’m not leaning that way.
This looks like the ETF tape. A stack of delays and half-news, a slow grind higher, and the real stamp hits after $BTC has already done 50–70% of the move off the low.
The law doesn’t start the trend. It arrives when the trend is already obvious.
If they punt today, are you still treating the next headline as a buy — or as liquidity?
{spot}(BTCUSDT)
$BTC isn’t trending. It’s printing the same bar twice.
Rally → dump. Rally → dump. Same level on the 4H. That’s not a breakout attempt. That’s failed follow-through.
Yesterday bid on higher CLARITY odds. Today offered them back when the odds faded. The chart is tracking implied probability, not a new regime.
Base case: another delay. If cloture actually clears, you’ll see it immediately — impulse across the board, no debate. I’m not leaning that way.
This looks like the ETF tape. A stack of delays and half-news, a slow grind higher, and the real stamp hits after $BTC has already done 50–70% of the move off the low.
The law doesn’t start the trend. It arrives when the trend is already obvious.
If they punt today, are you still treating the next headline as a buy — or as liquidity?
Rally → dump. Rally → dump. Same level on the 4H. That’s not a breakout attempt. That’s failed follow-through.
Yesterday bid on higher CLARITY odds. Today offered them back when the odds faded. The chart is tracking implied probability, not a new regime.
Base case: another delay. If cloture actually clears, you’ll see it immediately — impulse across the board, no debate. I’m not leaning that way.
This looks like the ETF tape. A stack of delays and half-news, a slow grind higher, and the real stamp hits after $BTC has already done 50–70% of the move off the low.
The law doesn’t start the trend. It arrives when the trend is already obvious.
If they punt today, are you still treating the next headline as a buy — or as liquidity?
1
1
104
·
--
Is this the last chance to buy cheaper?
Nobody thinks this tape goes up forever. After a local overheat the market has to cool off — a lot of metrics are already at highs, and I wrote about that.
The only real question is how long and how deep the cooldown gets.
Macro is not clean: labor is cooling, inflation is rising, Treasury yields are rising, US debt growth is accelerating. Stack that together and it can actually push the Fed to hike next week.
And even if CLARITY passes — and there are still a lot of questions around it — the main risk sits in equities. A hard fund drawdown can drag crypto with it.
So you need a plan for more than one path.
If we do get a proper correction, this might be the last window to buy $BTC lower for anyone who skipped the last one.
What’s your invalidation if it doesn’t cool?
{spot}(BTCUSDT)
Is this the last chance to buy cheaper?
Nobody thinks this tape goes up forever. After a local overheat the market has to cool off — a lot of metrics are already at highs, and I wrote about that.
The only real question is how long and how deep the cooldown gets.
Macro is not clean: labor is cooling, inflation is rising, Treasury yields are rising, US debt growth is accelerating. Stack that together and it can actually push the Fed to hike next week.
And even if CLARITY passes — and there are still a lot of questions around it — the main risk sits in equities. A hard fund drawdown can drag crypto with it.
So you need a plan for more than one path.
If we do get a proper correction, this might be the last window to buy $BTC lower for anyone who skipped the last one.
What’s your invalidation if it doesn’t cool?
Nobody thinks this tape goes up forever. After a local overheat the market has to cool off — a lot of metrics are already at highs, and I wrote about that.
The only real question is how long and how deep the cooldown gets.
Macro is not clean: labor is cooling, inflation is rising, Treasury yields are rising, US debt growth is accelerating. Stack that together and it can actually push the Fed to hike next week.
And even if CLARITY passes — and there are still a lot of questions around it — the main risk sits in equities. A hard fund drawdown can drag crypto with it.
So you need a plan for more than one path.
If we do get a proper correction, this might be the last window to buy $BTC lower for anyone who skipped the last one.
What’s your invalidation if it doesn’t cool?

5
1
332
·
--
BTC, ETH, SOL, $BNB and HYPE
are what will make you rich in 2027.
BTC, ETH, SOL, $BNB and HYPE
are what will make you rich in 2027.
are what will make you rich in 2027.
117
·
--
We’ll be buying more $BTC and other assets soon.
For me, at this stage, everything happening on a weekly timeframe is just noise.
There’s no point getting excited about a 10% rise.
Quietly accumulating a position—that makes sense.
A re-test of the lows is also a real possibility.
We also need to keep the "Covid-20" pattern in mind—and given the situation in the Middle East and the Strait of Hormuz, it makes sense to rebalance from BTC to stablecoins as much as you can afford.
We’ll be buying more $BTC and other assets soon.
For me, at this stage, everything happening on a weekly timeframe is just noise.
There’s no point getting excited about a 10% rise.
Quietly accumulating a position—that makes sense.
A re-test of the lows is also a real possibility.
We also need to keep the "Covid-20" pattern in mind—and given the situation in the Middle East and the Strait of Hormuz, it makes sense to rebalance from BTC to stablecoins as much as you can afford.
For me, at this stage, everything happening on a weekly timeframe is just noise.
There’s no point getting excited about a 10% rise.
Quietly accumulating a position—that makes sense.
A re-test of the lows is also a real possibility.
We also need to keep the "Covid-20" pattern in mind—and given the situation in the Middle East and the Strait of Hormuz, it makes sense to rebalance from BTC to stablecoins as much as you can afford.
89
·
--
Save this and take action!
If you don't know where Bitcoin's bottom will be, don't worry—no one can know that.
But I’ll help you make sure you don't miss that moment.
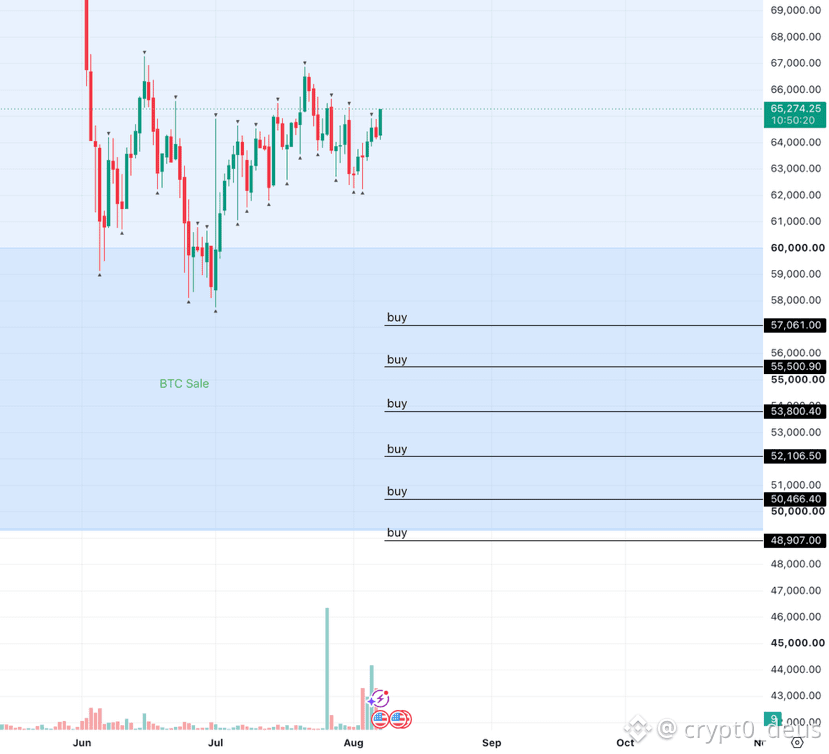
Go ahead and set buy limit orders at the following levels:
-57 061.0
-55 500.9
-53 800.4
-52 106.5
-50 466.4
-48 907.0
You'll be grateful to me soon
#Bitcoin
#BTC
Save this and take action!
If you don't know where Bitcoin's bottom will be, don't worry—no one can know that.
But I’ll help you make sure you don't miss that moment.
Go ahead and set buy limit orders at the following levels:
-57 061.0
-55 500.9
-53 800.4
-52 106.5
-50 466.4
-48 907.0
You'll be grateful to me soon
#Bitcoin
#BTC
If you don't know where Bitcoin's bottom will be, don't worry—no one can know that.
But I’ll help you make sure you don't miss that moment.
Go ahead and set buy limit orders at the following levels:
-57 061.0
-55 500.9
-53 800.4
-52 106.5
-50 466.4
-48 907.0
You'll be grateful to me soon
#Bitcoin
#BTC
93
·
--
Here is the plan for today:
At the open, I’m looking for a test of the 63,400 level. If there is strong selling pressure there, I’ll expect the price to drop below 62k.
However, if we simply sweep 63,400 and close above the previous week's VAL, I’ll look for long positions targeting the previous month's VAN.
Regarding limit orders, there are currently large walls around the 62k mark, so I don’t expect a sharp sell-off. I think we’ll simply trade off these major limit levels this week. Major liquidation clusters are at 62k and 67k.
Here is the plan for today:
At the open, I’m looking for a test of the 63,400 level. If there is strong selling pressure there, I’ll expect the price to drop below 62k.
However, if we simply sweep 63,400 and close above the previous week's VAL, I’ll look for long positions targeting the previous month's VAN.
Regarding limit orders, there are currently large walls around the 62k mark, so I don’t expect a sharp sell-off. I think we’ll simply trade off these major limit levels this week. Major liquidation clusters are at 62k and 67k.
At the open, I’m looking for a test of the 63,400 level. If there is strong selling pressure there, I’ll expect the price to drop below 62k.
However, if we simply sweep 63,400 and close above the previous week's VAL, I’ll look for long positions targeting the previous month's VAN.
Regarding limit orders, there are currently large walls around the 62k mark, so I don’t expect a sharp sell-off. I think we’ll simply trade off these major limit levels this week. Major liquidation clusters are at 62k and 67k.
109
·
--
Get ready for max pain / fud / fear 😨
Saylor saga is gaining momentum, the spiral is twisting
Saylor 26 = Luna 22 ?
$BTC
Get ready for max pain / fud / fear 😨
Saylor saga is gaining momentum, the spiral is twisting
Saylor 26 = Luna 22 ?
$BTC
Saylor saga is gaining momentum, the spiral is twisting
Saylor 26 = Luna 22 ?
$BTC

138
·
--
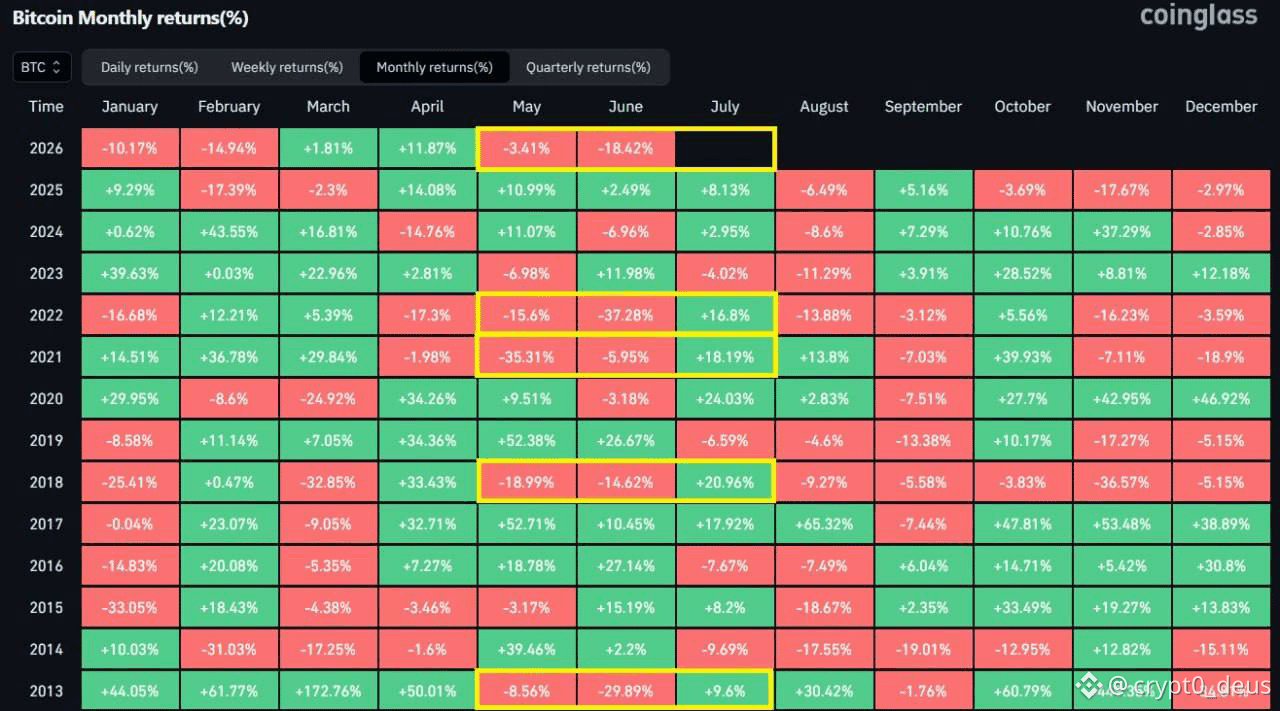
Here is another interesting observation regarding July: every time $BTC closed May and June in the red, July ended in the green.
Here is another interesting observation regarding July: every time $BTC closed May and June in the red, July ended in the green.
114
Log in to explore more content
Join global crypto users on Binance Square
⚡️ Get latest and useful information about crypto.
💬 Trusted by the world’s largest crypto exchange.
👍 Discover real insights from verified creators.
Email / Phone number
Trending Topics
KoreaProposesTokenizingStocksAndBonds
592 views
68 Discussing
#koreaproposestokenizingstocksandbonds
🚨 JUST IN: 🇰🇷 South Korea proposes tokenizing stocks & bonds! 🔥
Traditional financial assets are moving deeper into the blockchain era.
📈 Stocks could become tokenized
💵 Bonds could move on-chain
🌐 Faster, programmable settlement becomes possible
⚡️ Tokenized assets could unlock new market infrastructure
The race to bring RWAs on-chain is getting bigger.
👀 Which blockchain do you think could benefit most from this trend?
#RWA #Tokenization #crypto
Faizan Crypto Learner
·0 Likes
·11 views
MetaMaskExitsLidoValidatorsAfterSecurityIncident
56,085 views
825 Discussing
MicronBeatsEarningsLiftsGuidance
33,929 views
626 Discussing