
Chumba Money
7.3k Posts

Chumba Money
 Square Verified
Report
Block User
Research & Analysis | Crypto Education | Chumba Labs Dev

Top Voices

Level 2 Creator
1 Following
49.8K+ Followers
18.1K+ Liked
2 Badges
Posts
All
Quotes
·
--
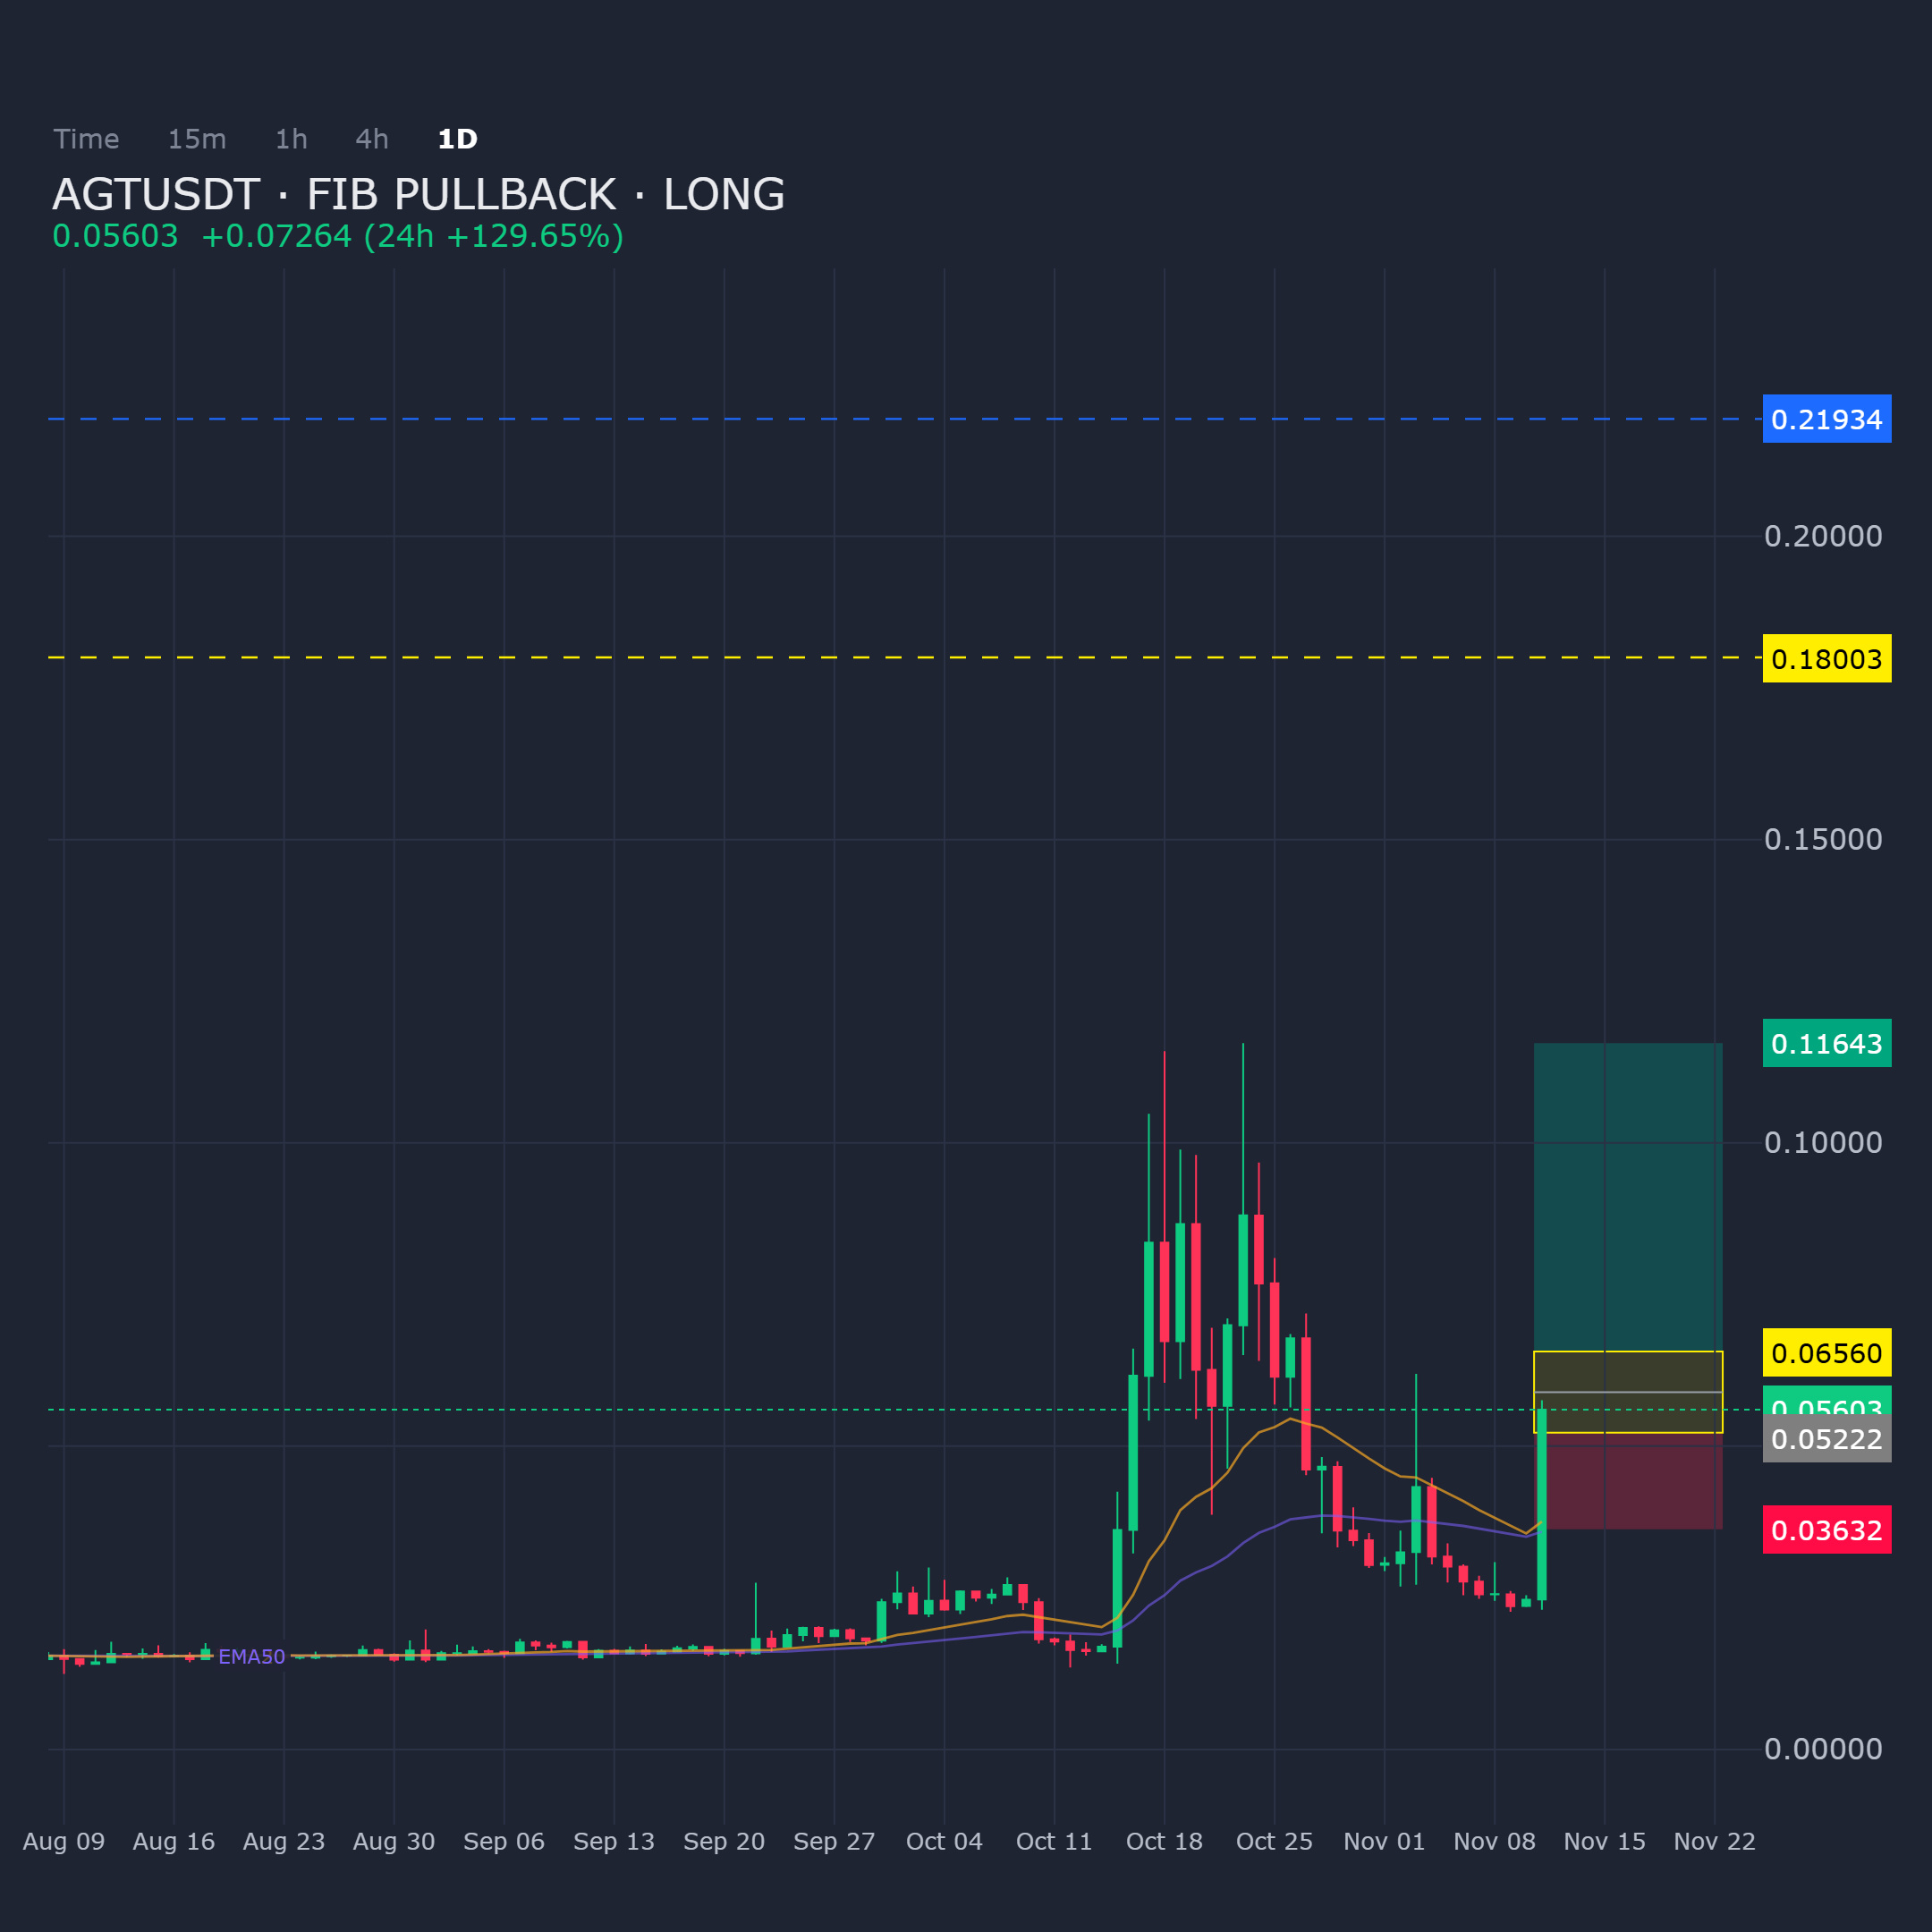
AGTUSDT on the daily chart is retracing into a key demand zone following a prior leg higher. The bias remains long as long as this pullback area holds structure.
Entry: 0.05222 - 0.065598
Targets: TP1: 0.116435, TP2: 0.180032, TP3: 0.219343
Stop Loss: 0.036315
$AGT
AGTUSDT on the daily chart is retracing into a key demand zone following a prior leg higher. The bias remains long as long as this pullback area holds structure.
Entry: 0.05222 - 0.065598
Targets: TP1: 0.116435, TP2: 0.180032, TP3: 0.219343
Stop Loss: 0.036315
$AGT
Entry: 0.05222 - 0.065598
Targets: TP1: 0.116435, TP2: 0.180032, TP3: 0.219343
Stop Loss: 0.036315
$AGT
28
·
--
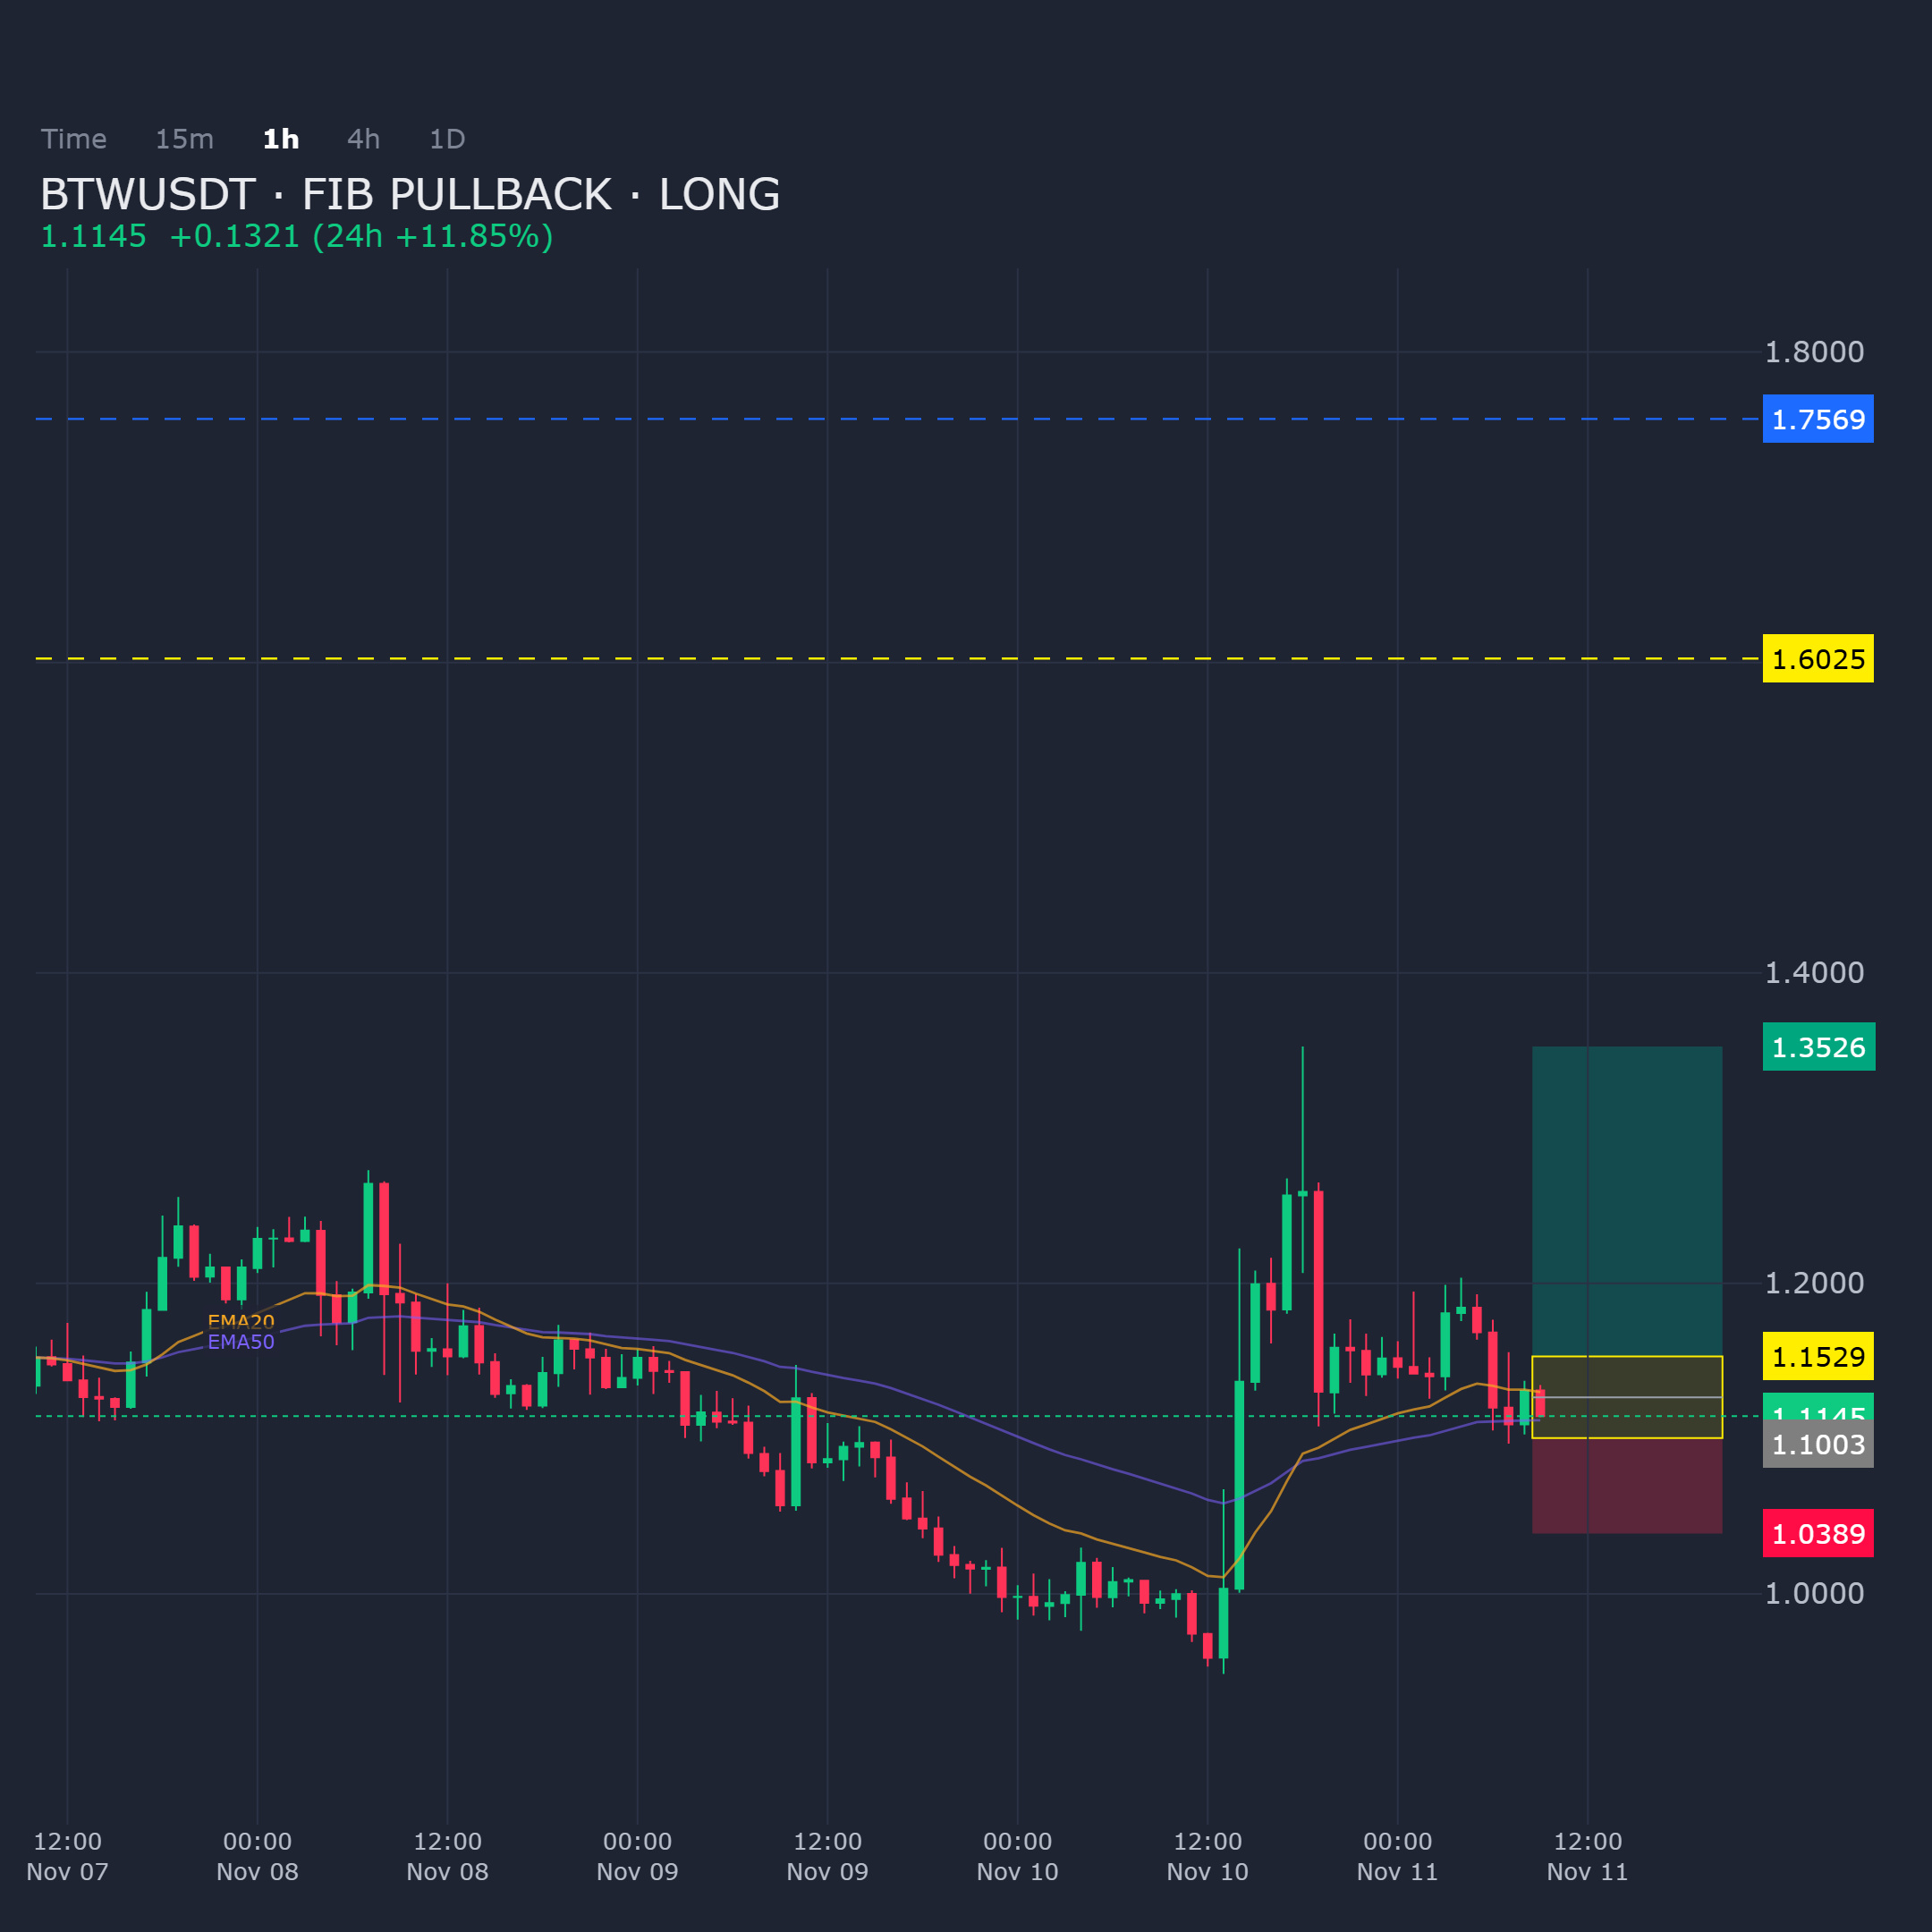
BTWUSDT on the 1H is holding structure into demand with a Fib pullback setup favoring the long side.
Entry: 1.1003 - 1.1529
Targets: TP1: 1.3526, TP2: 1.6025, TP3: 1.7569
Stop Loss: 1.0389
$BTW
BTWUSDT on the 1H is holding structure into demand with a Fib pullback setup favoring the long side.
Entry: 1.1003 - 1.1529
Targets: TP1: 1.3526, TP2: 1.6025, TP3: 1.7569
Stop Loss: 1.0389
$BTW
Entry: 1.1003 - 1.1529
Targets: TP1: 1.3526, TP2: 1.6025, TP3: 1.7569
Stop Loss: 1.0389
$BTW
29
·
--
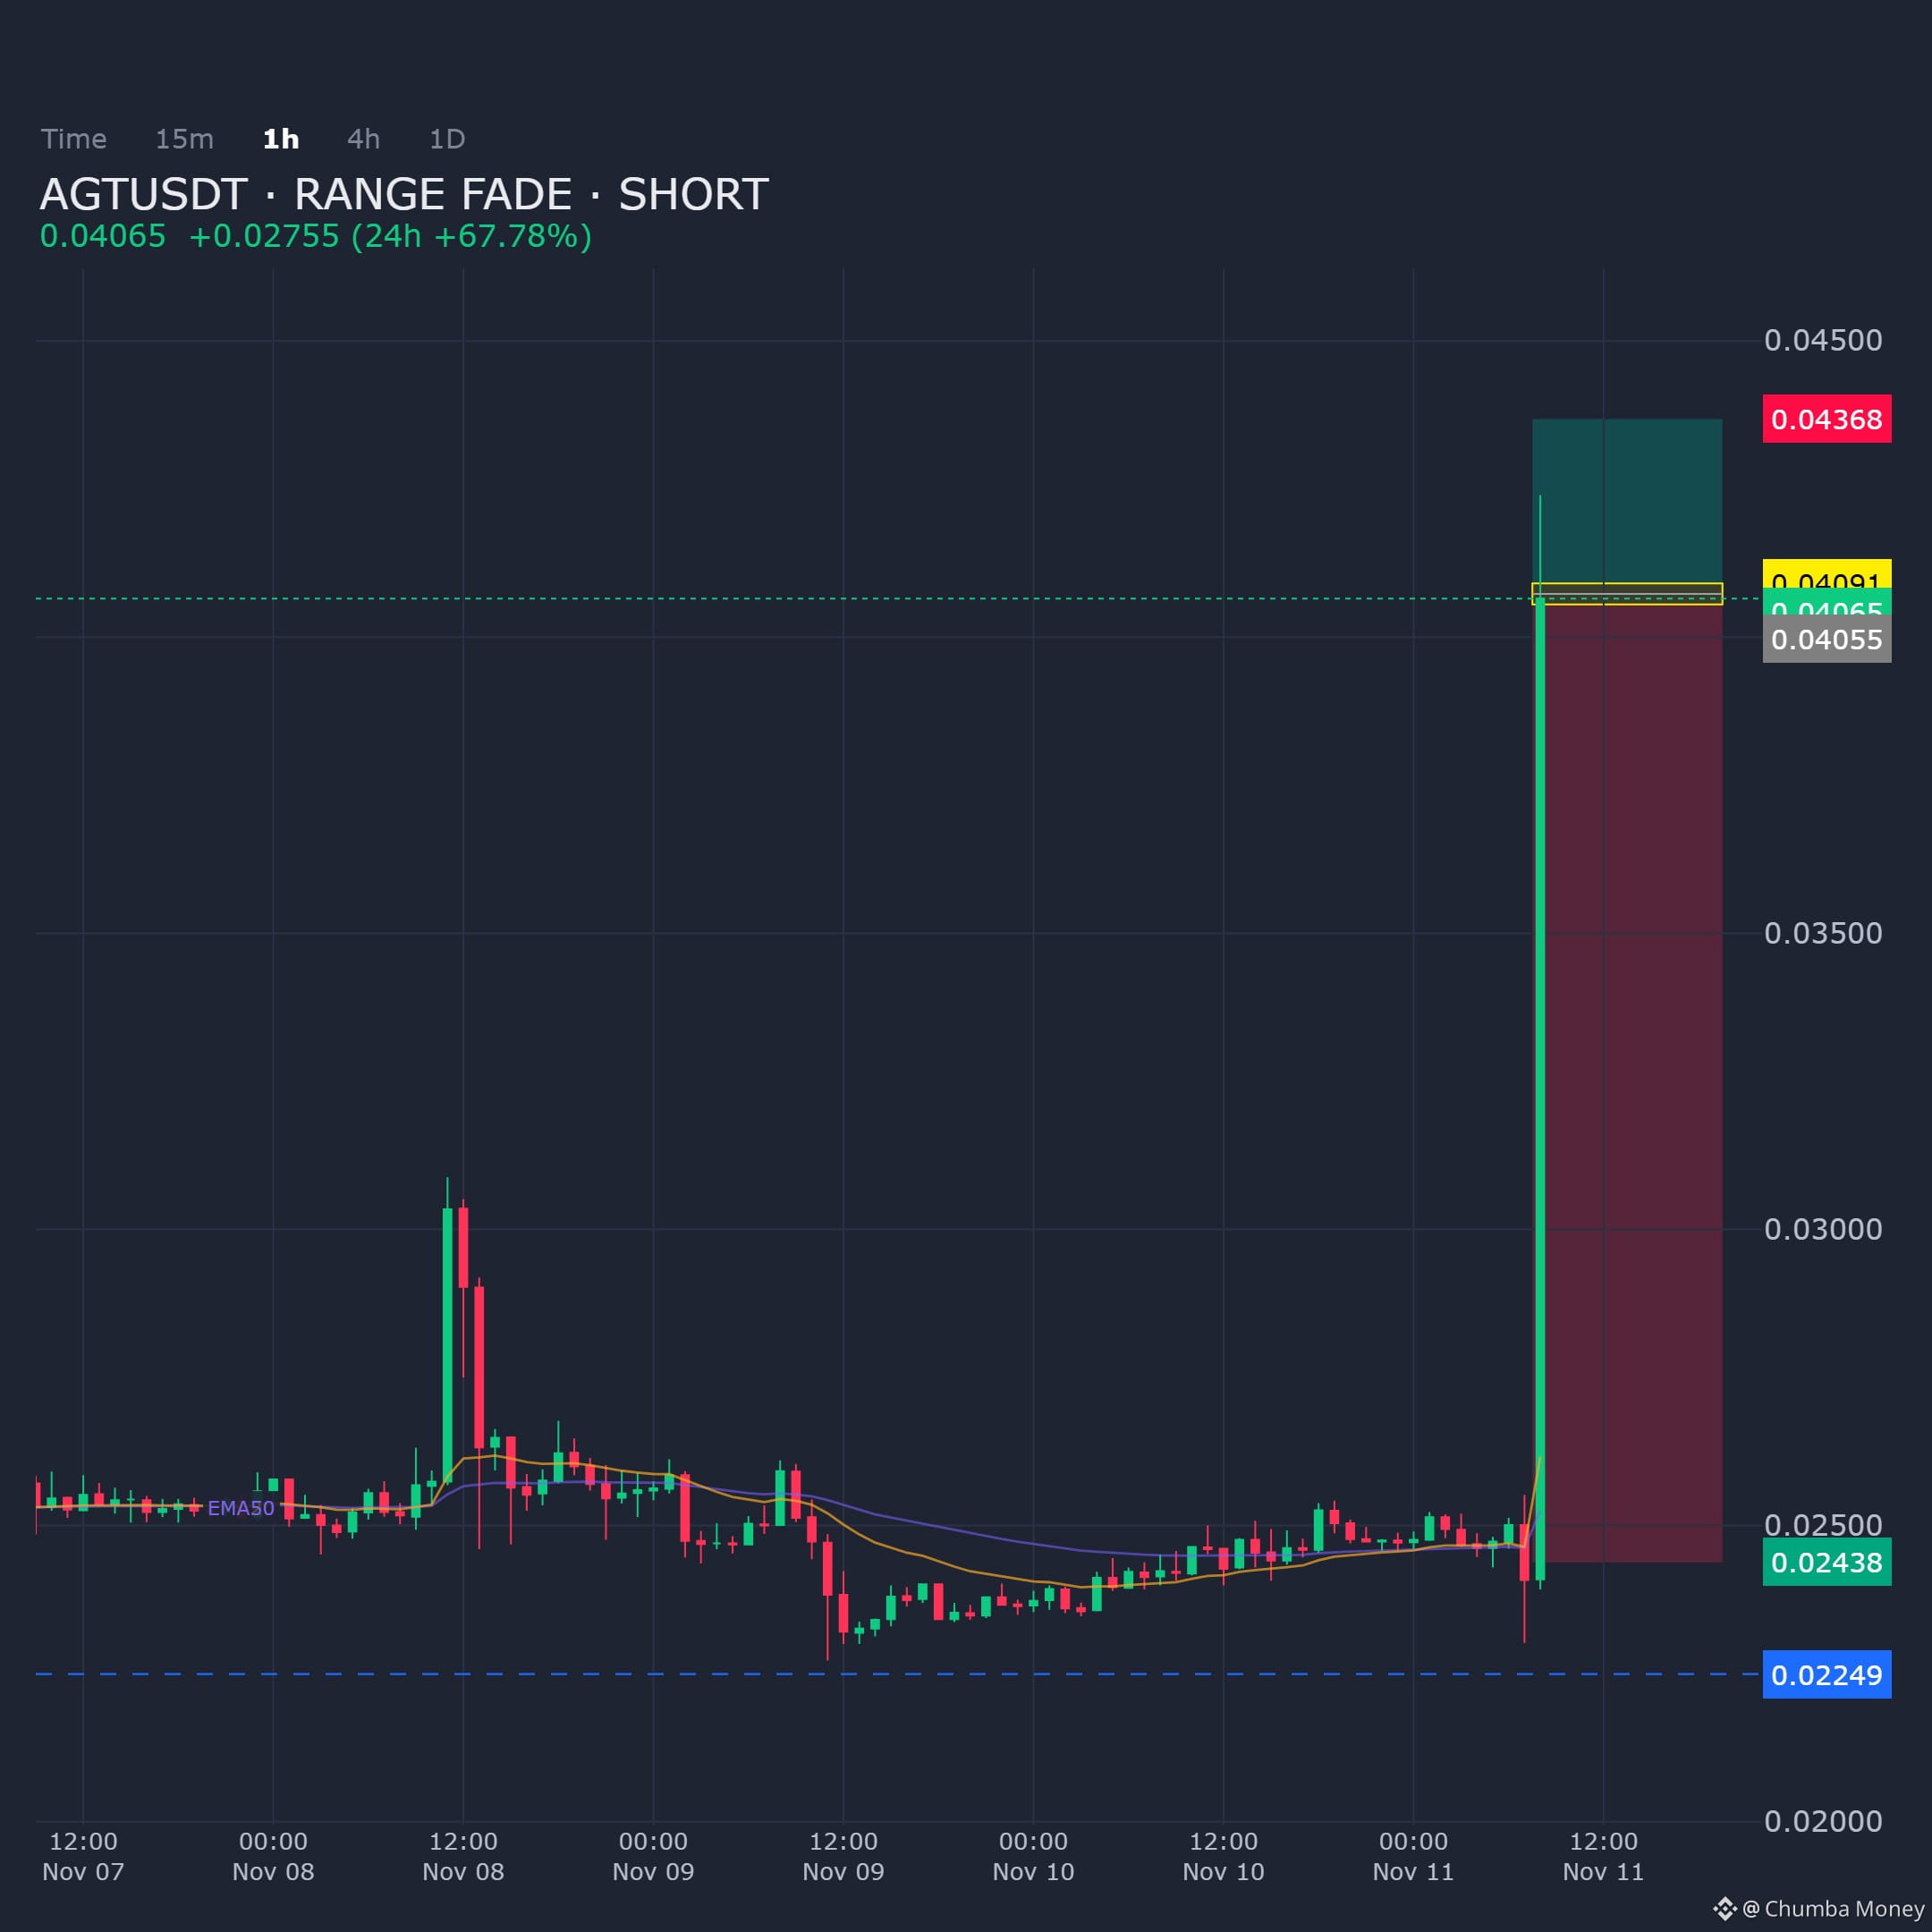
AGTUSDT on the 1H chart is entering a resistance zone, supporting a range fade bias with downside targets ahead.
Entry: 0.040553 - 0.040909
Targets: TP1: 0.02438, TP2: 0.023218, TP3: 0.022493
Stop Loss: 0.043684
$AGT
AGTUSDT on the 1H chart is entering a resistance zone, supporting a range fade bias with downside targets ahead.
Entry: 0.040553 - 0.040909
Targets: TP1: 0.02438, TP2: 0.023218, TP3: 0.022493
Stop Loss: 0.043684
$AGT
Entry: 0.040553 - 0.040909
Targets: TP1: 0.02438, TP2: 0.023218, TP3: 0.022493
Stop Loss: 0.043684
$AGT
22
·
--
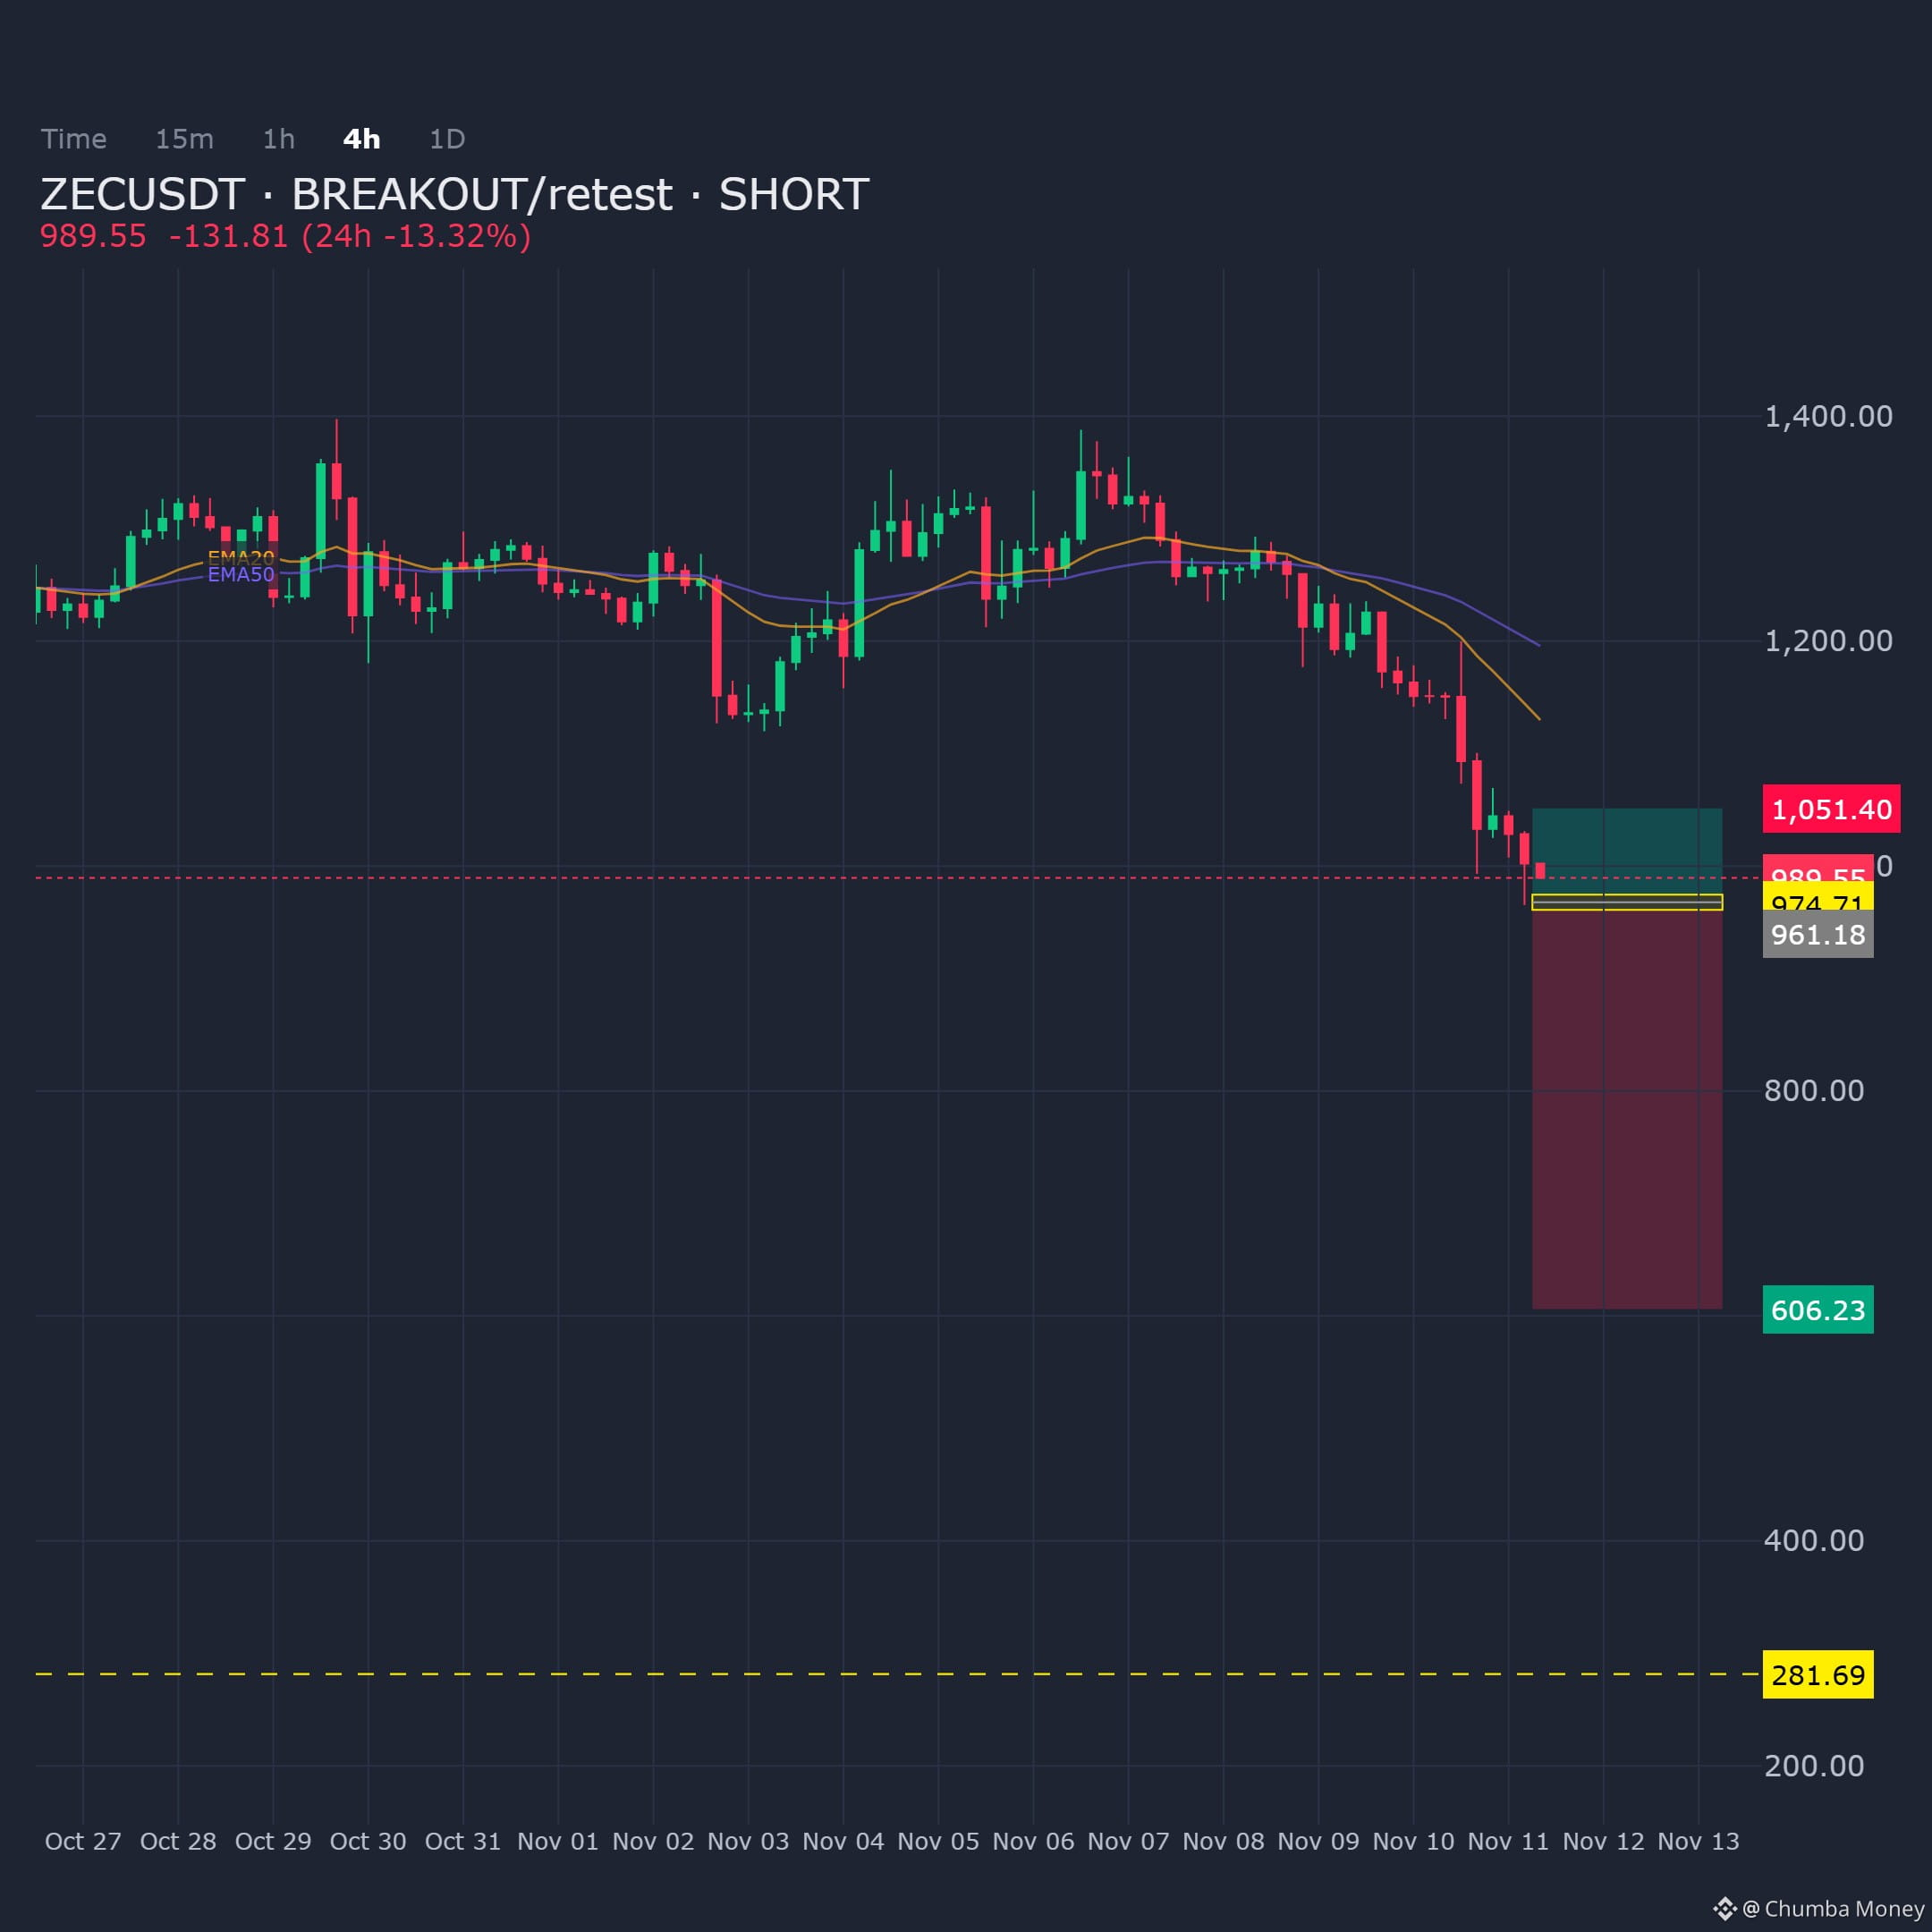
ZECUSDT is testing a 4H supply zone with a short bias on the breakout/retest structure.
Entry: 961.18 - 974.71
Targets: TP1: 606.23, TP2: 281.69, TP3: 281.69
Stop Loss: 1051.4
$ZEC
ZECUSDT is testing a 4H supply zone with a short bias on the breakout/retest structure.
Entry: 961.18 - 974.71
Targets: TP1: 606.23, TP2: 281.69, TP3: 281.69
Stop Loss: 1051.4
$ZEC
Entry: 961.18 - 974.71
Targets: TP1: 606.23, TP2: 281.69, TP3: 281.69
Stop Loss: 1051.4
$ZEC
11
·
--
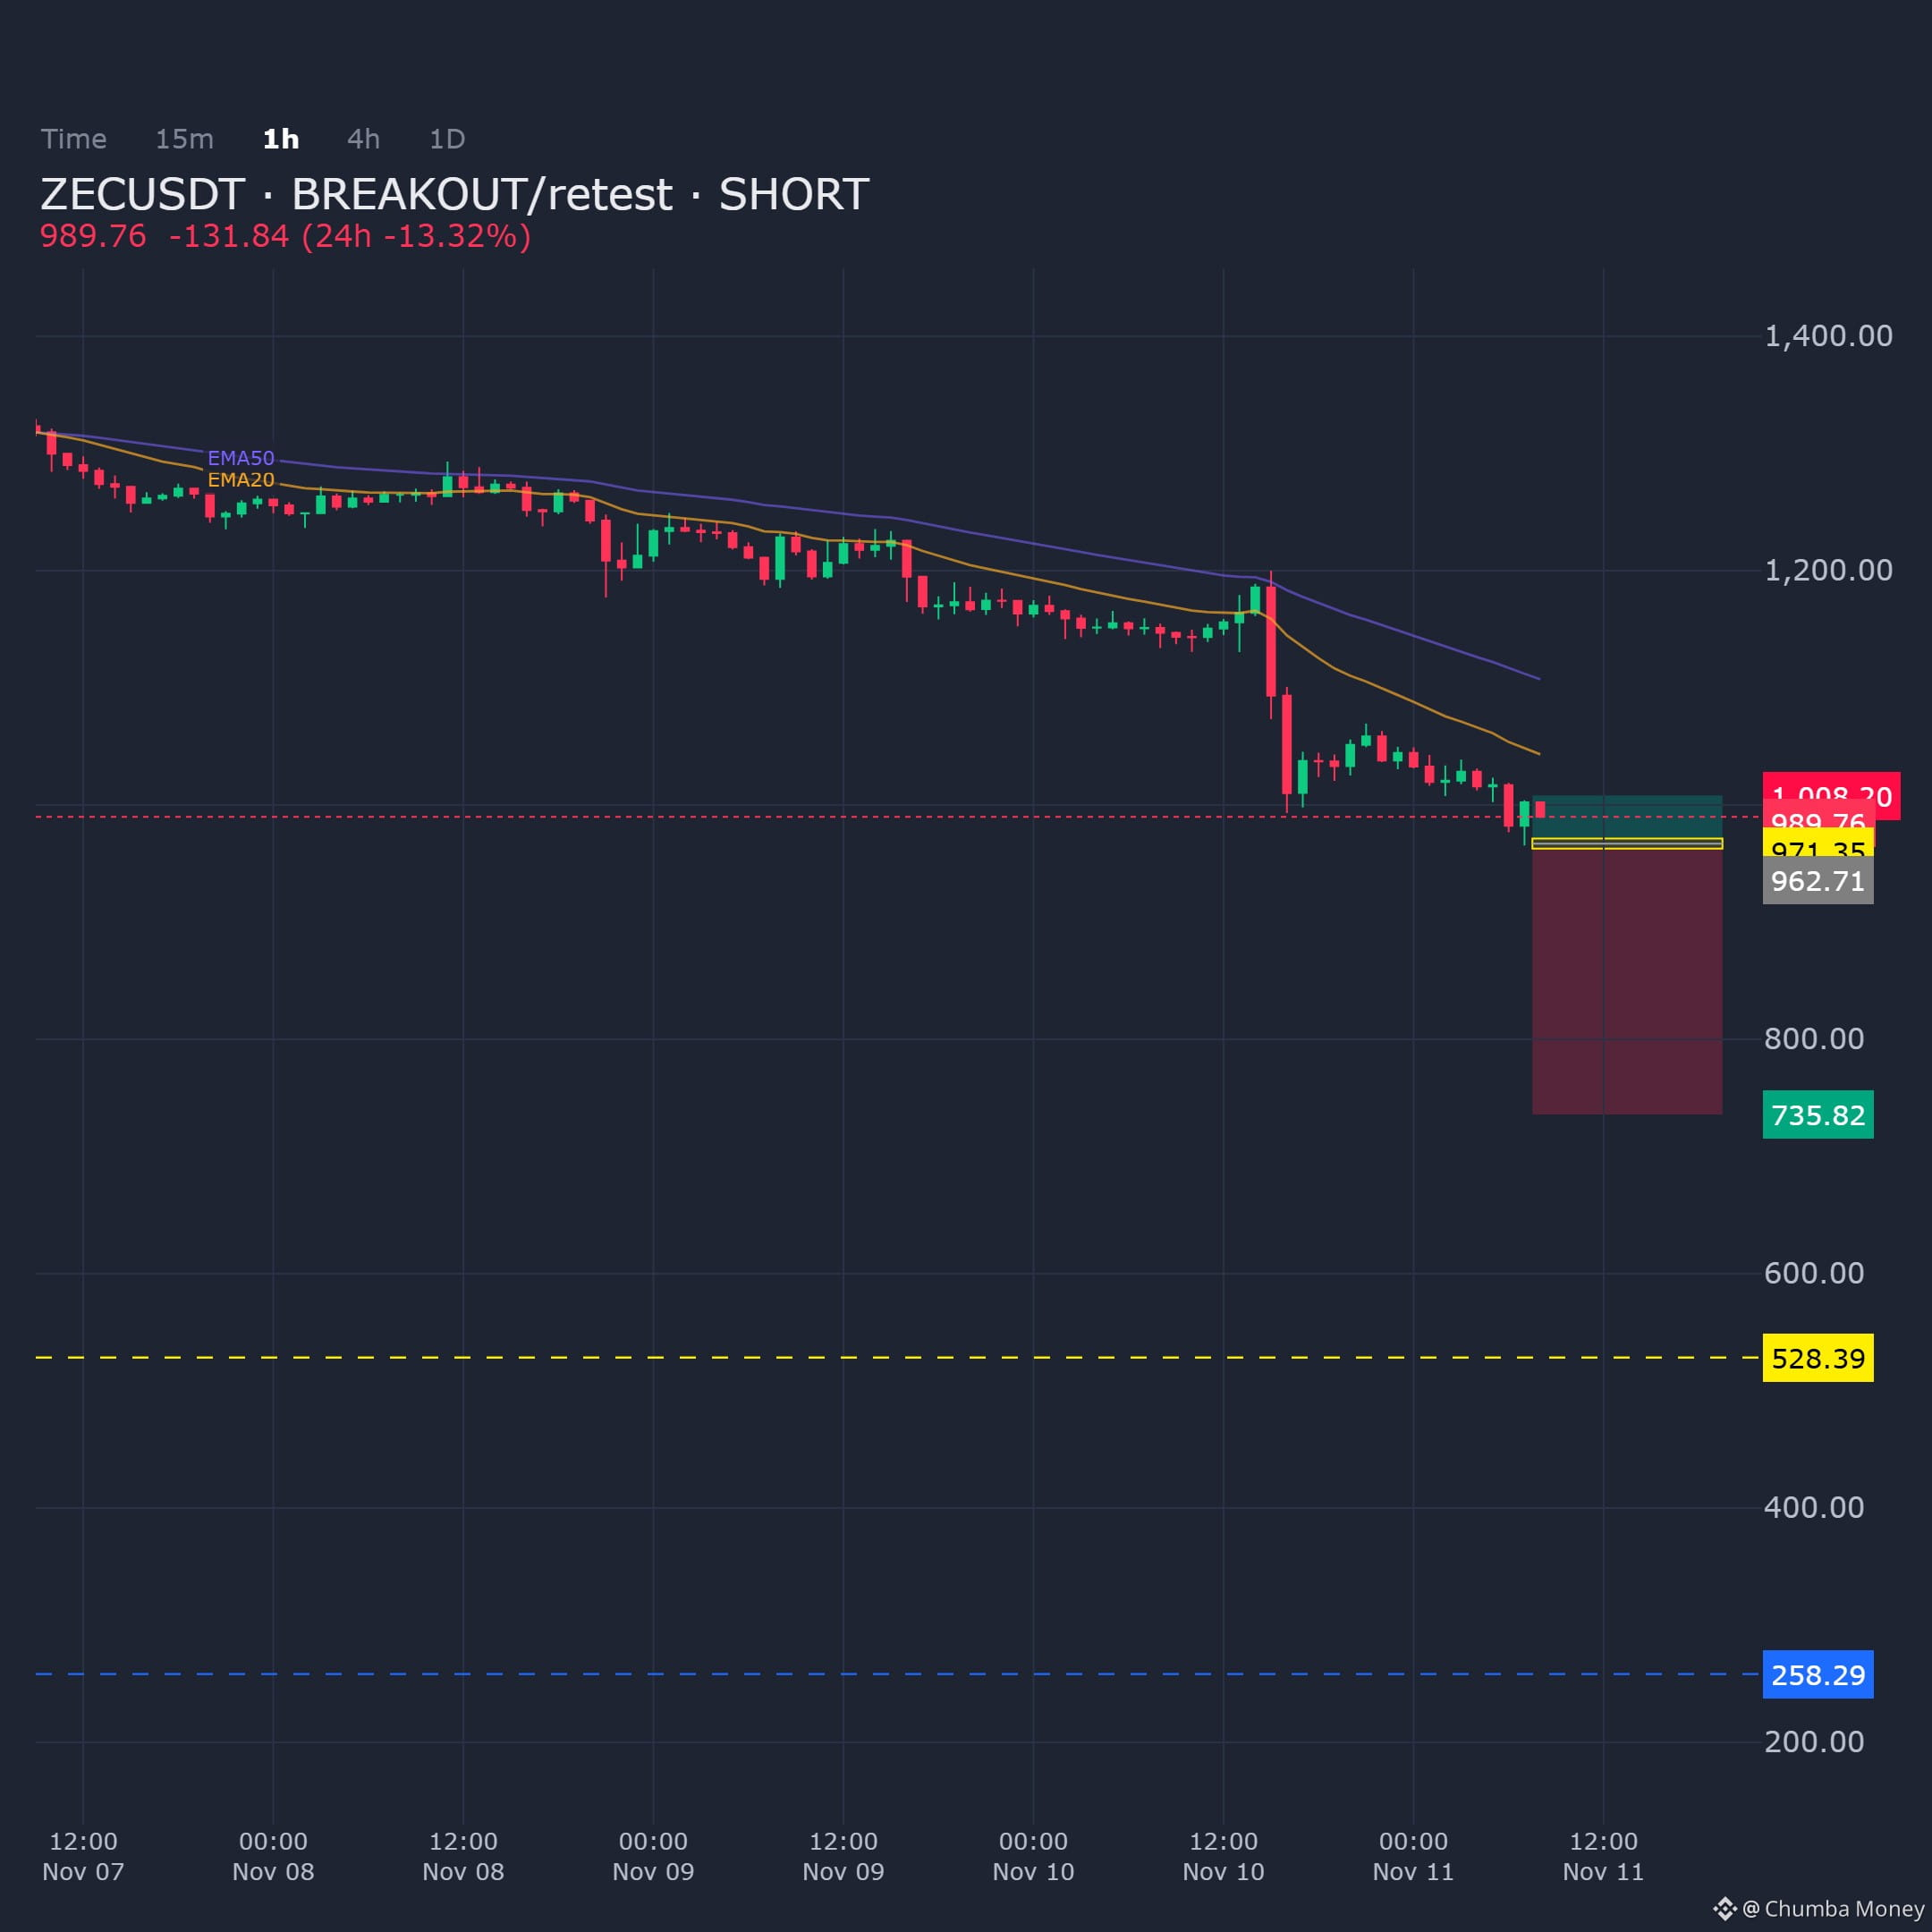
ZECUSDT is approaching the 1H supply zone after pushing into resistance, maintaining a short bias on a breakout/retest structure.
Entry: 962.71 - 971.35
Targets: TP1: 735.82, TP2: 528.39, TP3: 258.29
Stop Loss: 1008.2
$ZEC
ZECUSDT is approaching the 1H supply zone after pushing into resistance, maintaining a short bias on a breakout/retest structure.
Entry: 962.71 - 971.35
Targets: TP1: 735.82, TP2: 528.39, TP3: 258.29
Stop Loss: 1008.2
$ZEC
Entry: 962.71 - 971.35
Targets: TP1: 735.82, TP2: 528.39, TP3: 258.29
Stop Loss: 1008.2
$ZEC
23
·
--
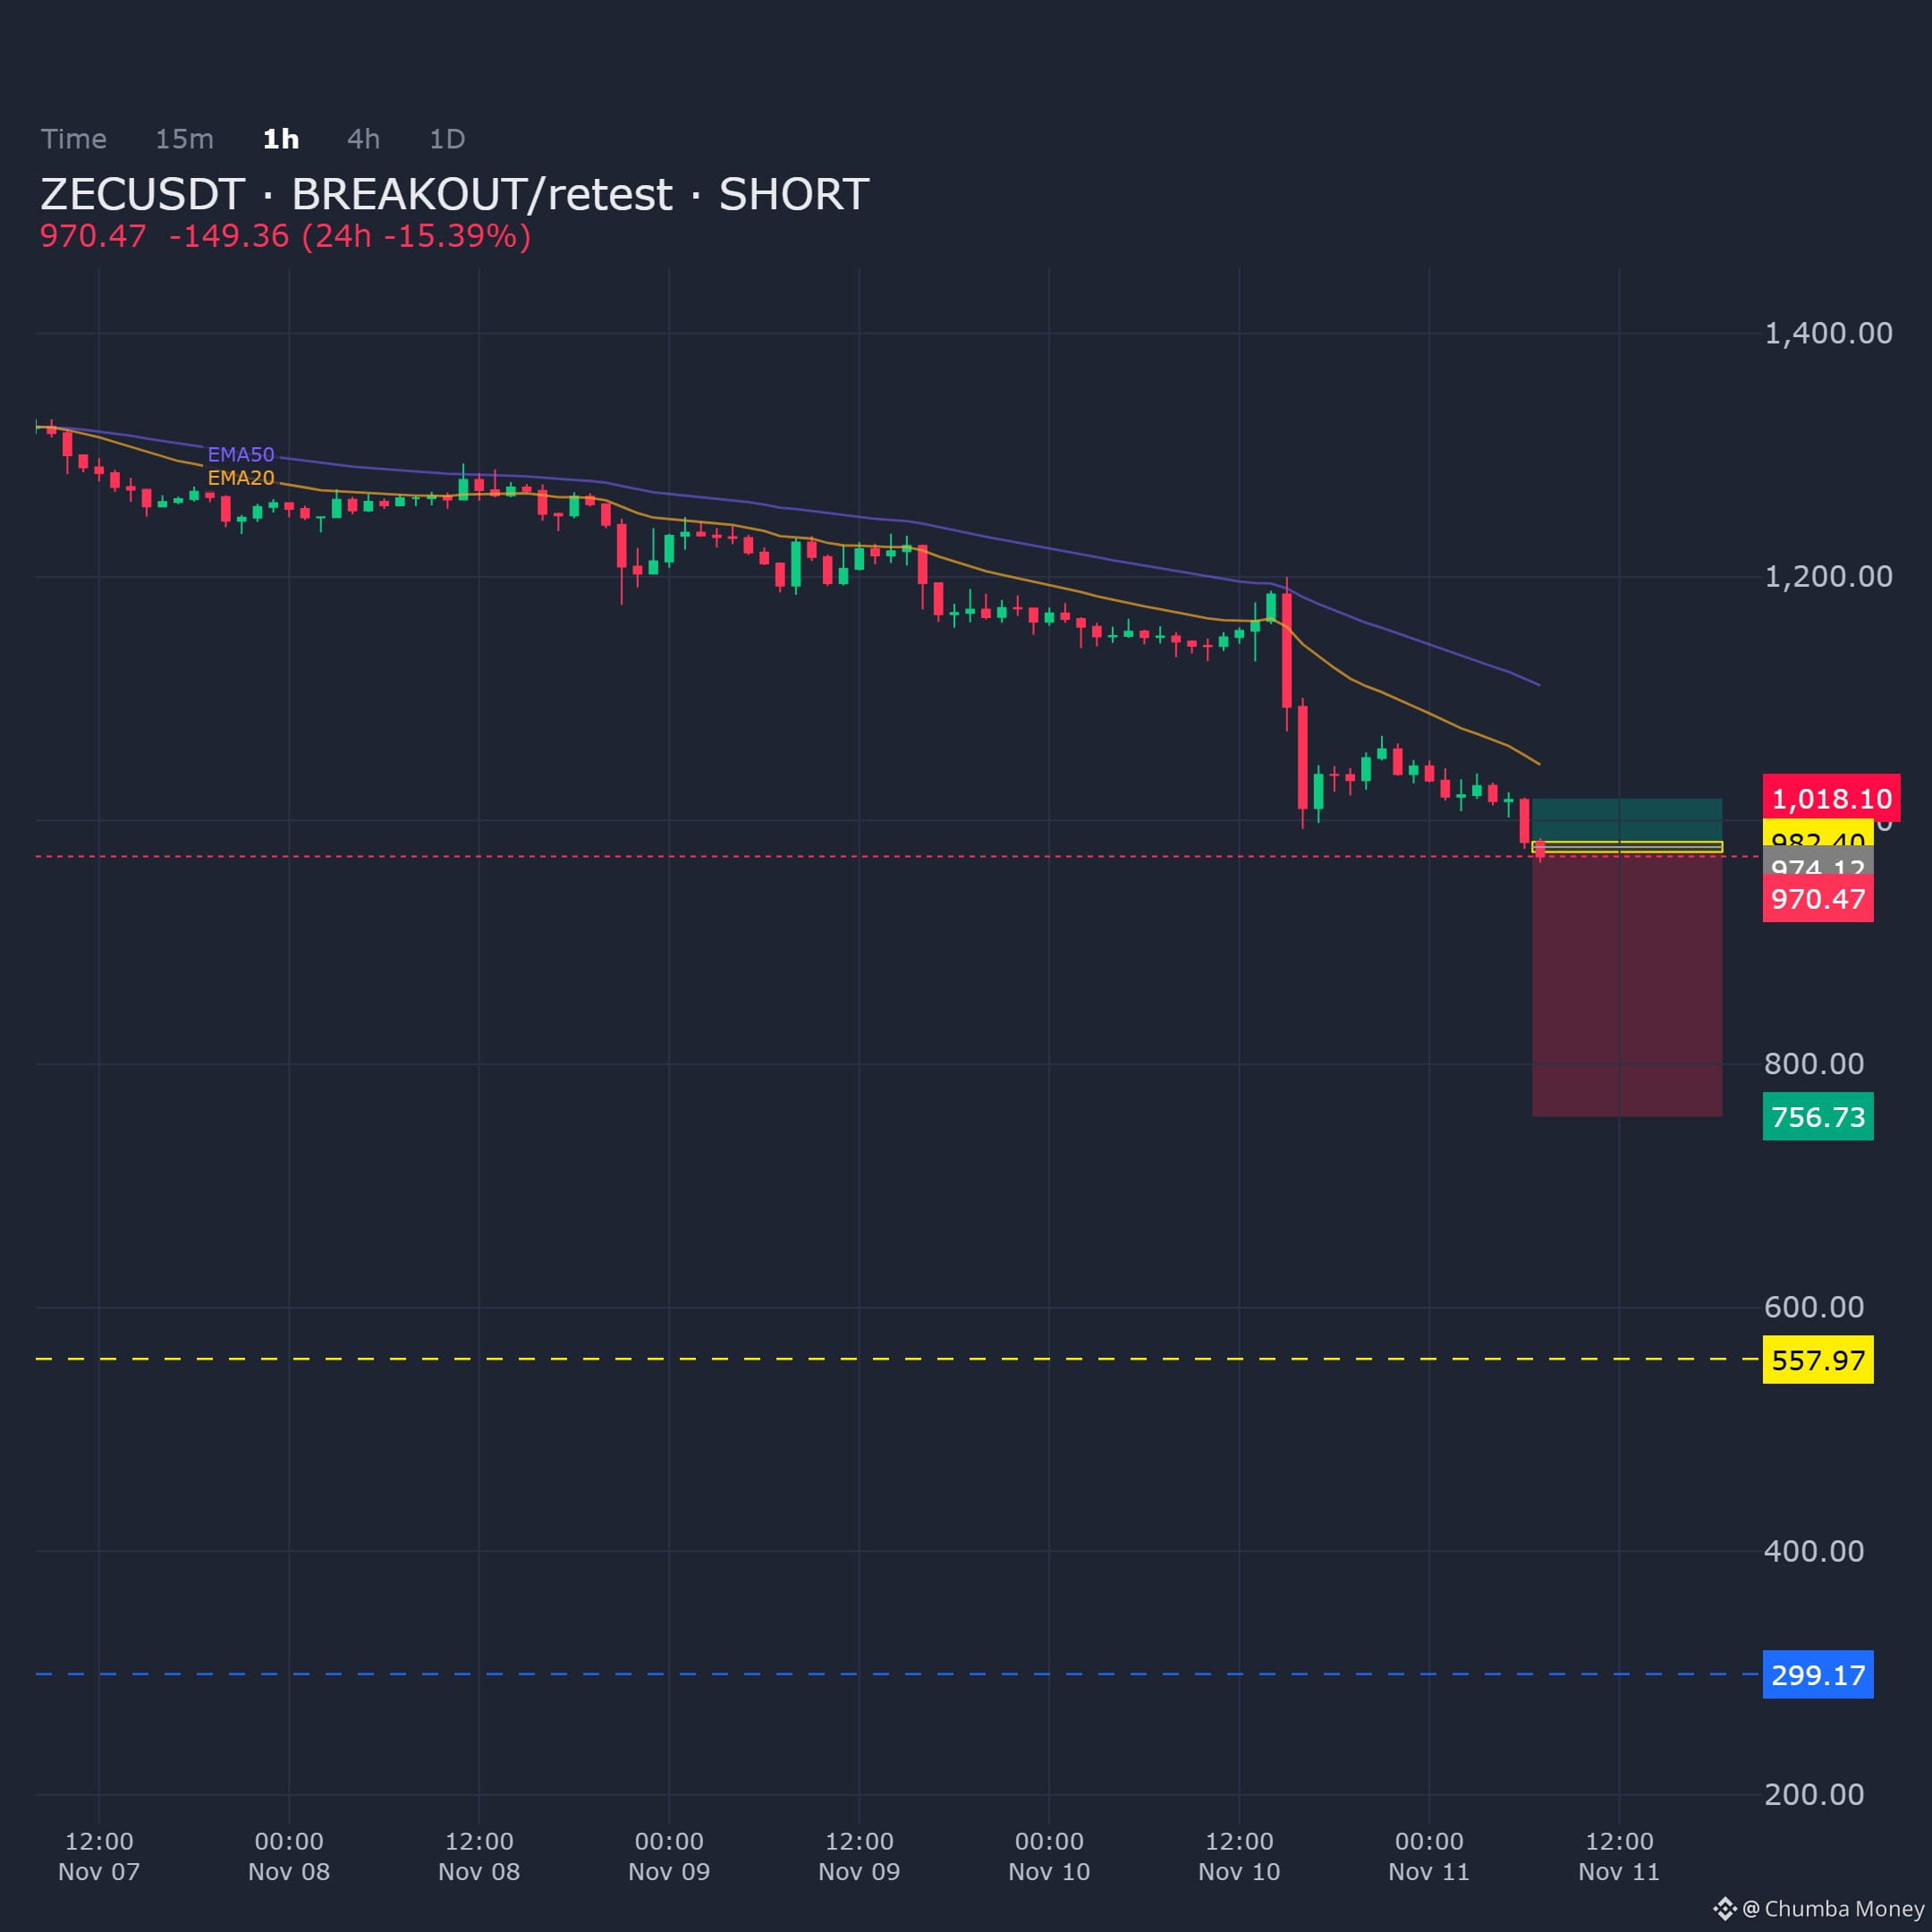
ZEC/USDT on the 1H chart shows price pushing into a supply zone, keeping the short bias intact from this resistance area.
Entry: 974.12 - 982.4
Targets: TP1: 756.73, TP2: 557.97, TP3: 299.17
Stop Loss: 1018.1
$ZEC
ZEC/USDT on the 1H chart shows price pushing into a supply zone, keeping the short bias intact from this resistance area.
Entry: 974.12 - 982.4
Targets: TP1: 756.73, TP2: 557.97, TP3: 299.17
Stop Loss: 1018.1
$ZEC
Entry: 974.12 - 982.4
Targets: TP1: 756.73, TP2: 557.97, TP3: 299.17
Stop Loss: 1018.1
$ZEC
15
·
--
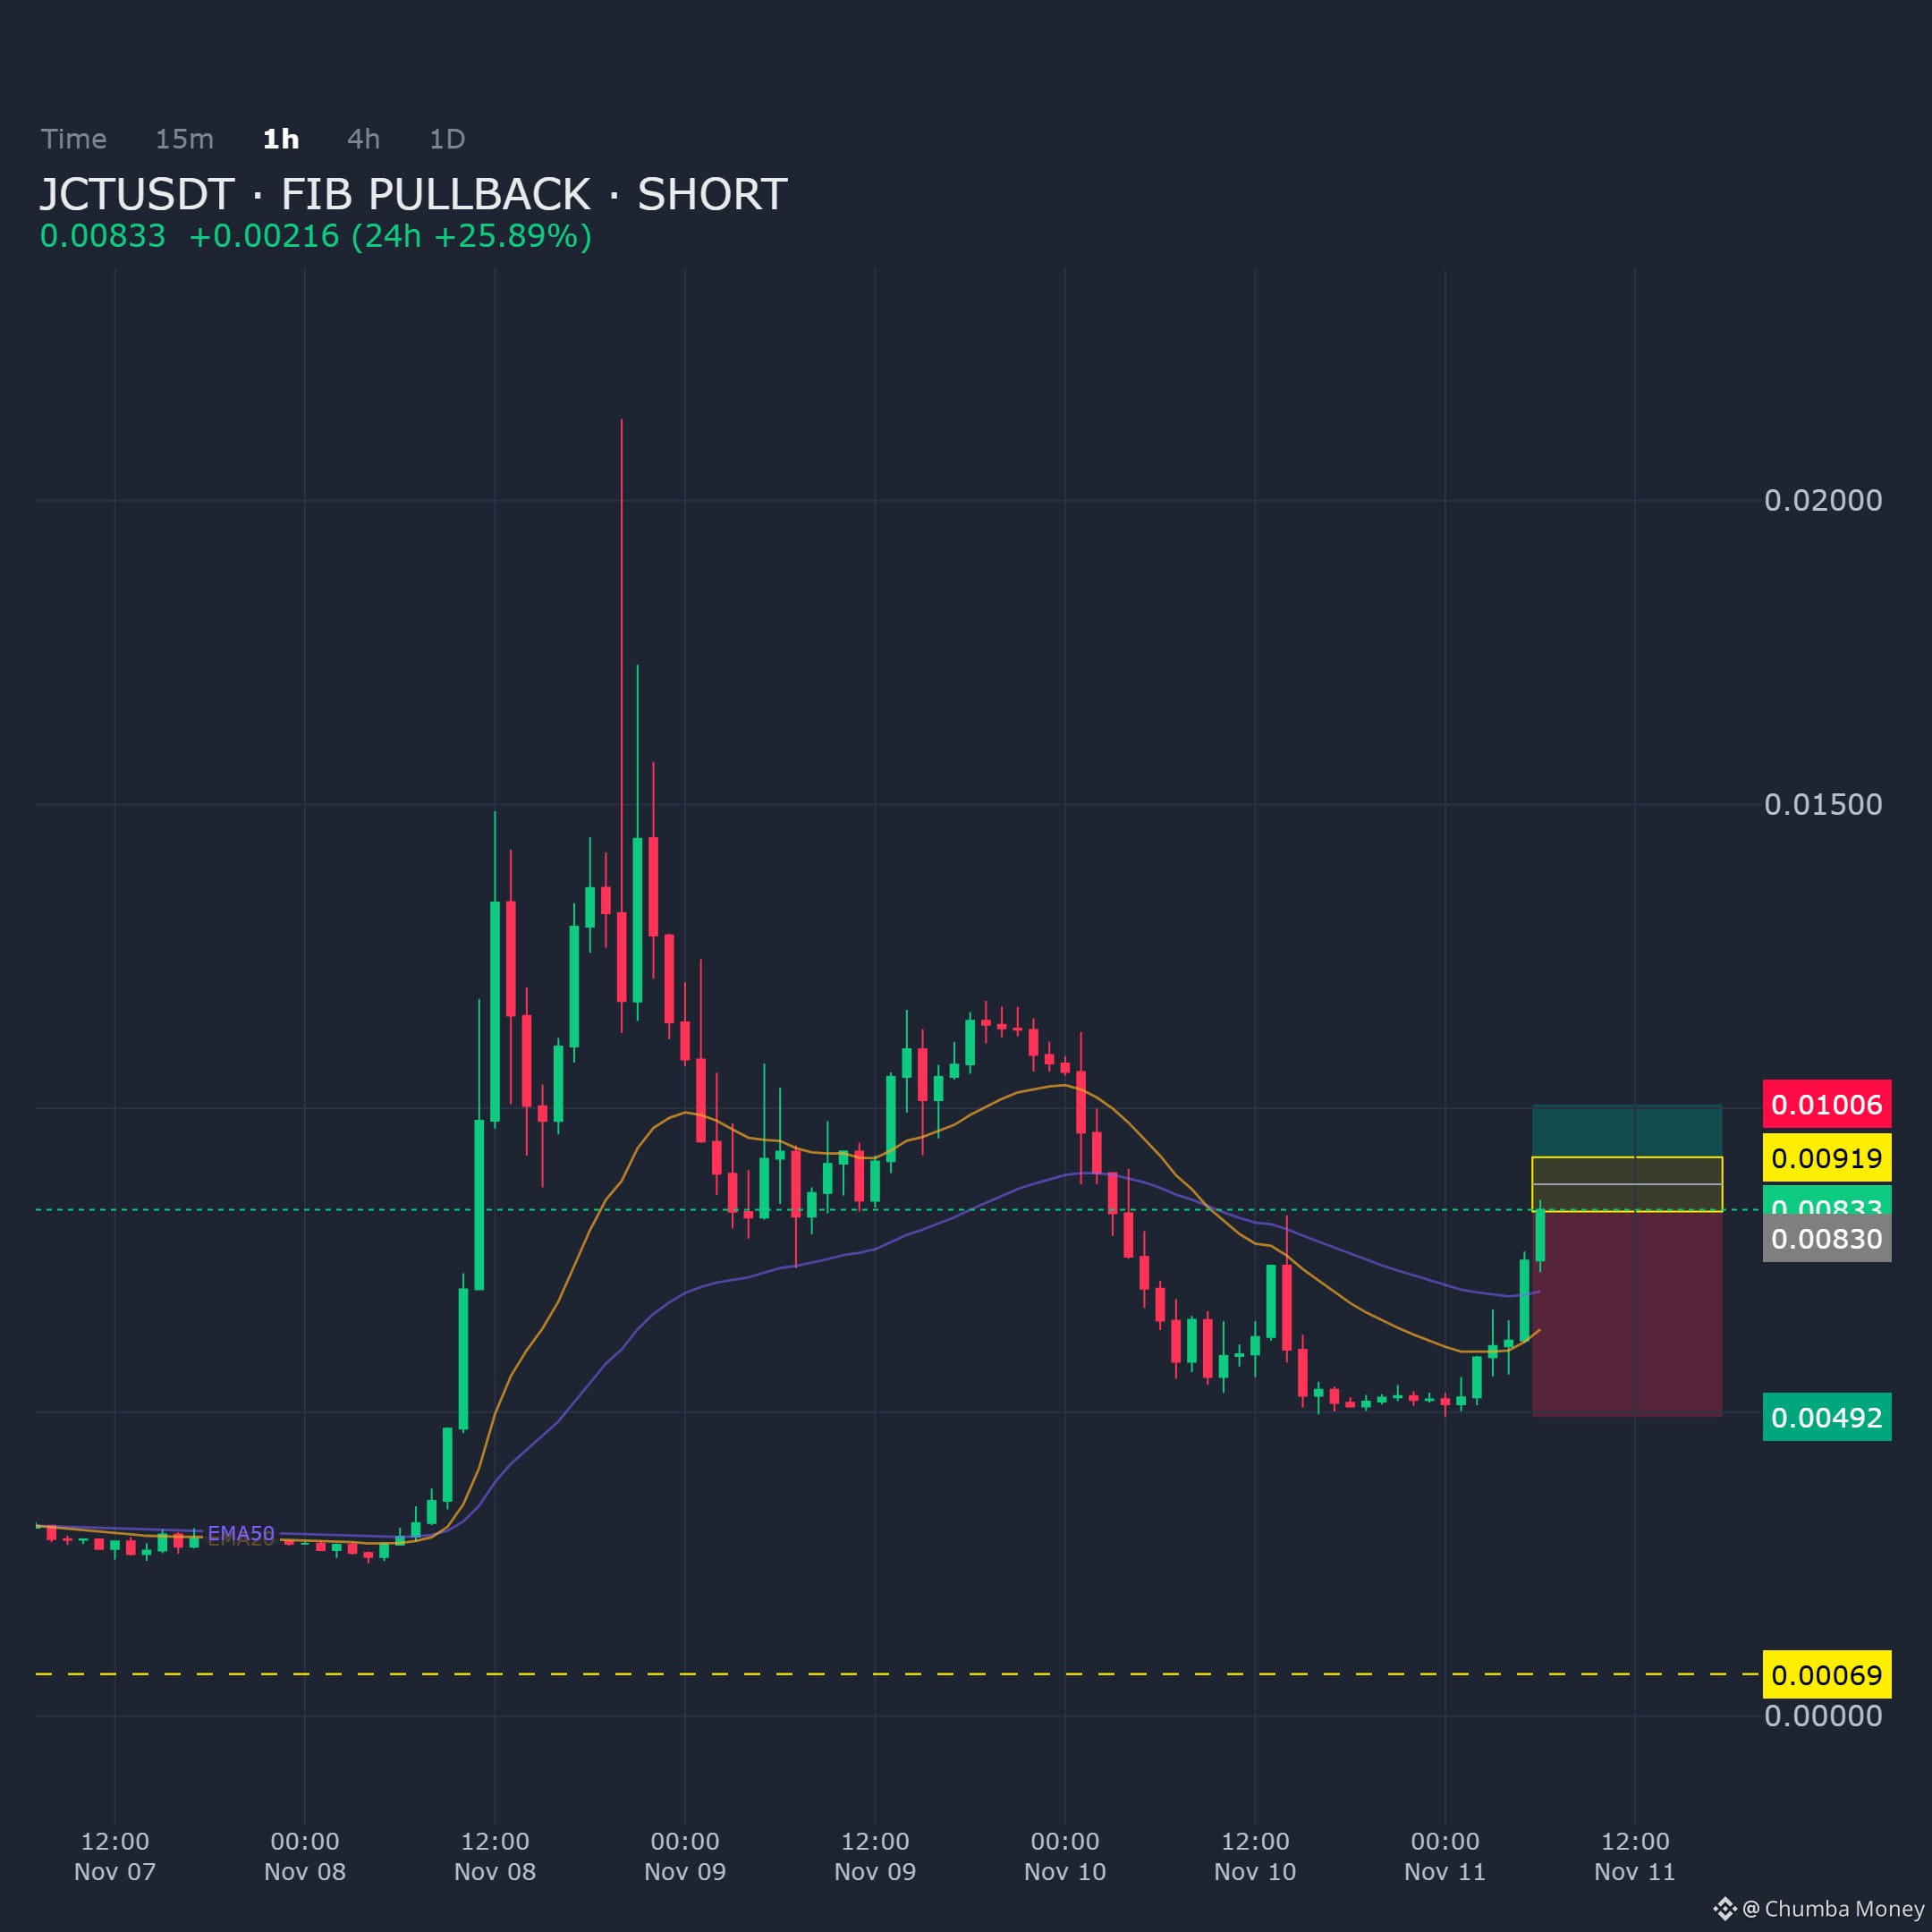
JCTUSDT on the 1H chart shows price stretched into supply after a Fib pullback, setting up a short bias from this resistance zone.
Entry: 0.008303 - 0.009194
Targets: TP1: 0.004921, TP2: 0.00069, TP3: 0.00069
Stop Loss: 0.010064
$JCT
JCTUSDT on the 1H chart shows price stretched into supply after a Fib pullback, setting up a short bias from this resistance zone.
Entry: 0.008303 - 0.009194
Targets: TP1: 0.004921, TP2: 0.00069, TP3: 0.00069
Stop Loss: 0.010064
$JCT
Entry: 0.008303 - 0.009194
Targets: TP1: 0.004921, TP2: 0.00069, TP3: 0.00069
Stop Loss: 0.010064
$JCT
40
·
--

Article
ACROSS PROTOCOL DOMAIN HIJACK PRICES INFRASTRUCTURE RISK TOO LOWAcross Protocol restored its website after hackers hijacked its domain through a social engineering attack against registrar Namecheap. Users were redirected to a phishing site while the team regained control. That is the observable fact. The interpretation is more consequential: a cross-chain bridge is only as secure as its weakest off-chain dependency, and domain infrastructure is rarely priced into token valuation.
Across sits in the intent-based bridging narrative, competing with LayerZero, Wormhole, and Hyperlane for cross-chain flow. The market tends to price bridges on transaction volume, total value locked, and token incentives. It rarely discounts for registrar compromise, DNS hijacking, or social engineering of infrastructure providers. The Across incident suggests that gap may be too wide.
The catalyst to watch is whether users migrate to bridges with stronger operational security, multisig domain controls, or registrar locks after this event. If bridge volume shifts measurably toward competitors with public security audits of their off-chain infrastructure, the market is beginning to price operational risk. Another catalyst is any disclosure of user fund losses from the phishing site; even a small number could trigger reputational repricing across the intent-based bridge sector.
The risks are asymmetric. A domain hijack does not necessarily imply smart contract vulnerability, yet users cannot distinguish the two in real time. If phishing victims appear, Across could face liquidity outflows regardless of contract integrity. Conversely, if no funds are lost and the protocol resumes normal volume quickly, the market may treat the event as isolated noise, reinforcing the current underpricing of infrastructure risk.
A falsifier would be sustained bridge volume growth for Across alongside unchanged token performance after the restoration. That would indicate the incident had no material effect on user behavior or valuation. A counter-falsifier would be volume migration to competitors with no corresponding smart contract issues at Across, signaling that operational security is becoming a competitive differentiator.
Macro context matters. BTC is down 1.30% over 24 hours and ETH down 2.62%, with total market cap down roughly 4%. Risk assets are under pressure, which amplifies the impact of any security narrative. In this environment, investors are less likely to forgive operational lapses, even when contracts remain intact.
The takeaway is that cross-chain infrastructure risk is underpriced relative to smart contract risk. Domain and registrar security should be treated as part of the threat model for bridge protocols, not as an afterthought. Investors should ask whether a bridge’s off-chain dependencies are as resilient as its on-chain code before allocating capital.
ACROSS PROTOCOL DOMAIN HIJACK PRICES INFRASTRUCTURE RISK TOO LOW
Across Protocol restored its website after hackers hijacked its domain through a social engineering attack against registrar Namecheap. Users were redirected to a phishing site while the team regained control. That is the observable fact. The interpretation is more consequential: a cross-chain bridge is only as secure as its weakest off-chain dependency, and domain infrastructure is rarely priced into token valuation.
Across sits in the intent-based bridging narrative, competing with LayerZero, Wormhole, and Hyperlane for cross-chain flow. The market tends to price bridges on transaction volume, total value locked, and token incentives. It rarely discounts for registrar compromise, DNS hijacking, or social engineering of infrastructure providers. The Across incident suggests that gap may be too wide.
The catalyst to watch is whether users migrate to bridges with stronger operational security, multisig domain controls, or registrar locks after this event. If bridge volume shifts measurably toward competitors with public security audits of their off-chain infrastructure, the market is beginning to price operational risk. Another catalyst is any disclosure of user fund losses from the phishing site; even a small number could trigger reputational repricing across the intent-based bridge sector.
The risks are asymmetric. A domain hijack does not necessarily imply smart contract vulnerability, yet users cannot distinguish the two in real time. If phishing victims appear, Across could face liquidity outflows regardless of contract integrity. Conversely, if no funds are lost and the protocol resumes normal volume quickly, the market may treat the event as isolated noise, reinforcing the current underpricing of infrastructure risk.
A falsifier would be sustained bridge volume growth for Across alongside unchanged token performance after the restoration. That would indicate the incident had no material effect on user behavior or valuation. A counter-falsifier would be volume migration to competitors with no corresponding smart contract issues at Across, signaling that operational security is becoming a competitive differentiator.
Macro context matters. BTC is down 1.30% over 24 hours and ETH down 2.62%, with total market cap down roughly 4%. Risk assets are under pressure, which amplifies the impact of any security narrative. In this environment, investors are less likely to forgive operational lapses, even when contracts remain intact.
The takeaway is that cross-chain infrastructure risk is underpriced relative to smart contract risk. Domain and registrar security should be treated as part of the threat model for bridge protocols, not as an afterthought. Investors should ask whether a bridge’s off-chain dependencies are as resilient as its on-chain code before allocating capital.
Across sits in the intent-based bridging narrative, competing with LayerZero, Wormhole, and Hyperlane for cross-chain flow. The market tends to price bridges on transaction volume, total value locked, and token incentives. It rarely discounts for registrar compromise, DNS hijacking, or social engineering of infrastructure providers. The Across incident suggests that gap may be too wide.
The catalyst to watch is whether users migrate to bridges with stronger operational security, multisig domain controls, or registrar locks after this event. If bridge volume shifts measurably toward competitors with public security audits of their off-chain infrastructure, the market is beginning to price operational risk. Another catalyst is any disclosure of user fund losses from the phishing site; even a small number could trigger reputational repricing across the intent-based bridge sector.
The risks are asymmetric. A domain hijack does not necessarily imply smart contract vulnerability, yet users cannot distinguish the two in real time. If phishing victims appear, Across could face liquidity outflows regardless of contract integrity. Conversely, if no funds are lost and the protocol resumes normal volume quickly, the market may treat the event as isolated noise, reinforcing the current underpricing of infrastructure risk.
A falsifier would be sustained bridge volume growth for Across alongside unchanged token performance after the restoration. That would indicate the incident had no material effect on user behavior or valuation. A counter-falsifier would be volume migration to competitors with no corresponding smart contract issues at Across, signaling that operational security is becoming a competitive differentiator.
Macro context matters. BTC is down 1.30% over 24 hours and ETH down 2.62%, with total market cap down roughly 4%. Risk assets are under pressure, which amplifies the impact of any security narrative. In this environment, investors are less likely to forgive operational lapses, even when contracts remain intact.
The takeaway is that cross-chain infrastructure risk is underpriced relative to smart contract risk. Domain and registrar security should be treated as part of the threat model for bridge protocols, not as an afterthought. Investors should ask whether a bridge’s off-chain dependencies are as resilient as its on-chain code before allocating capital.
16
·
--
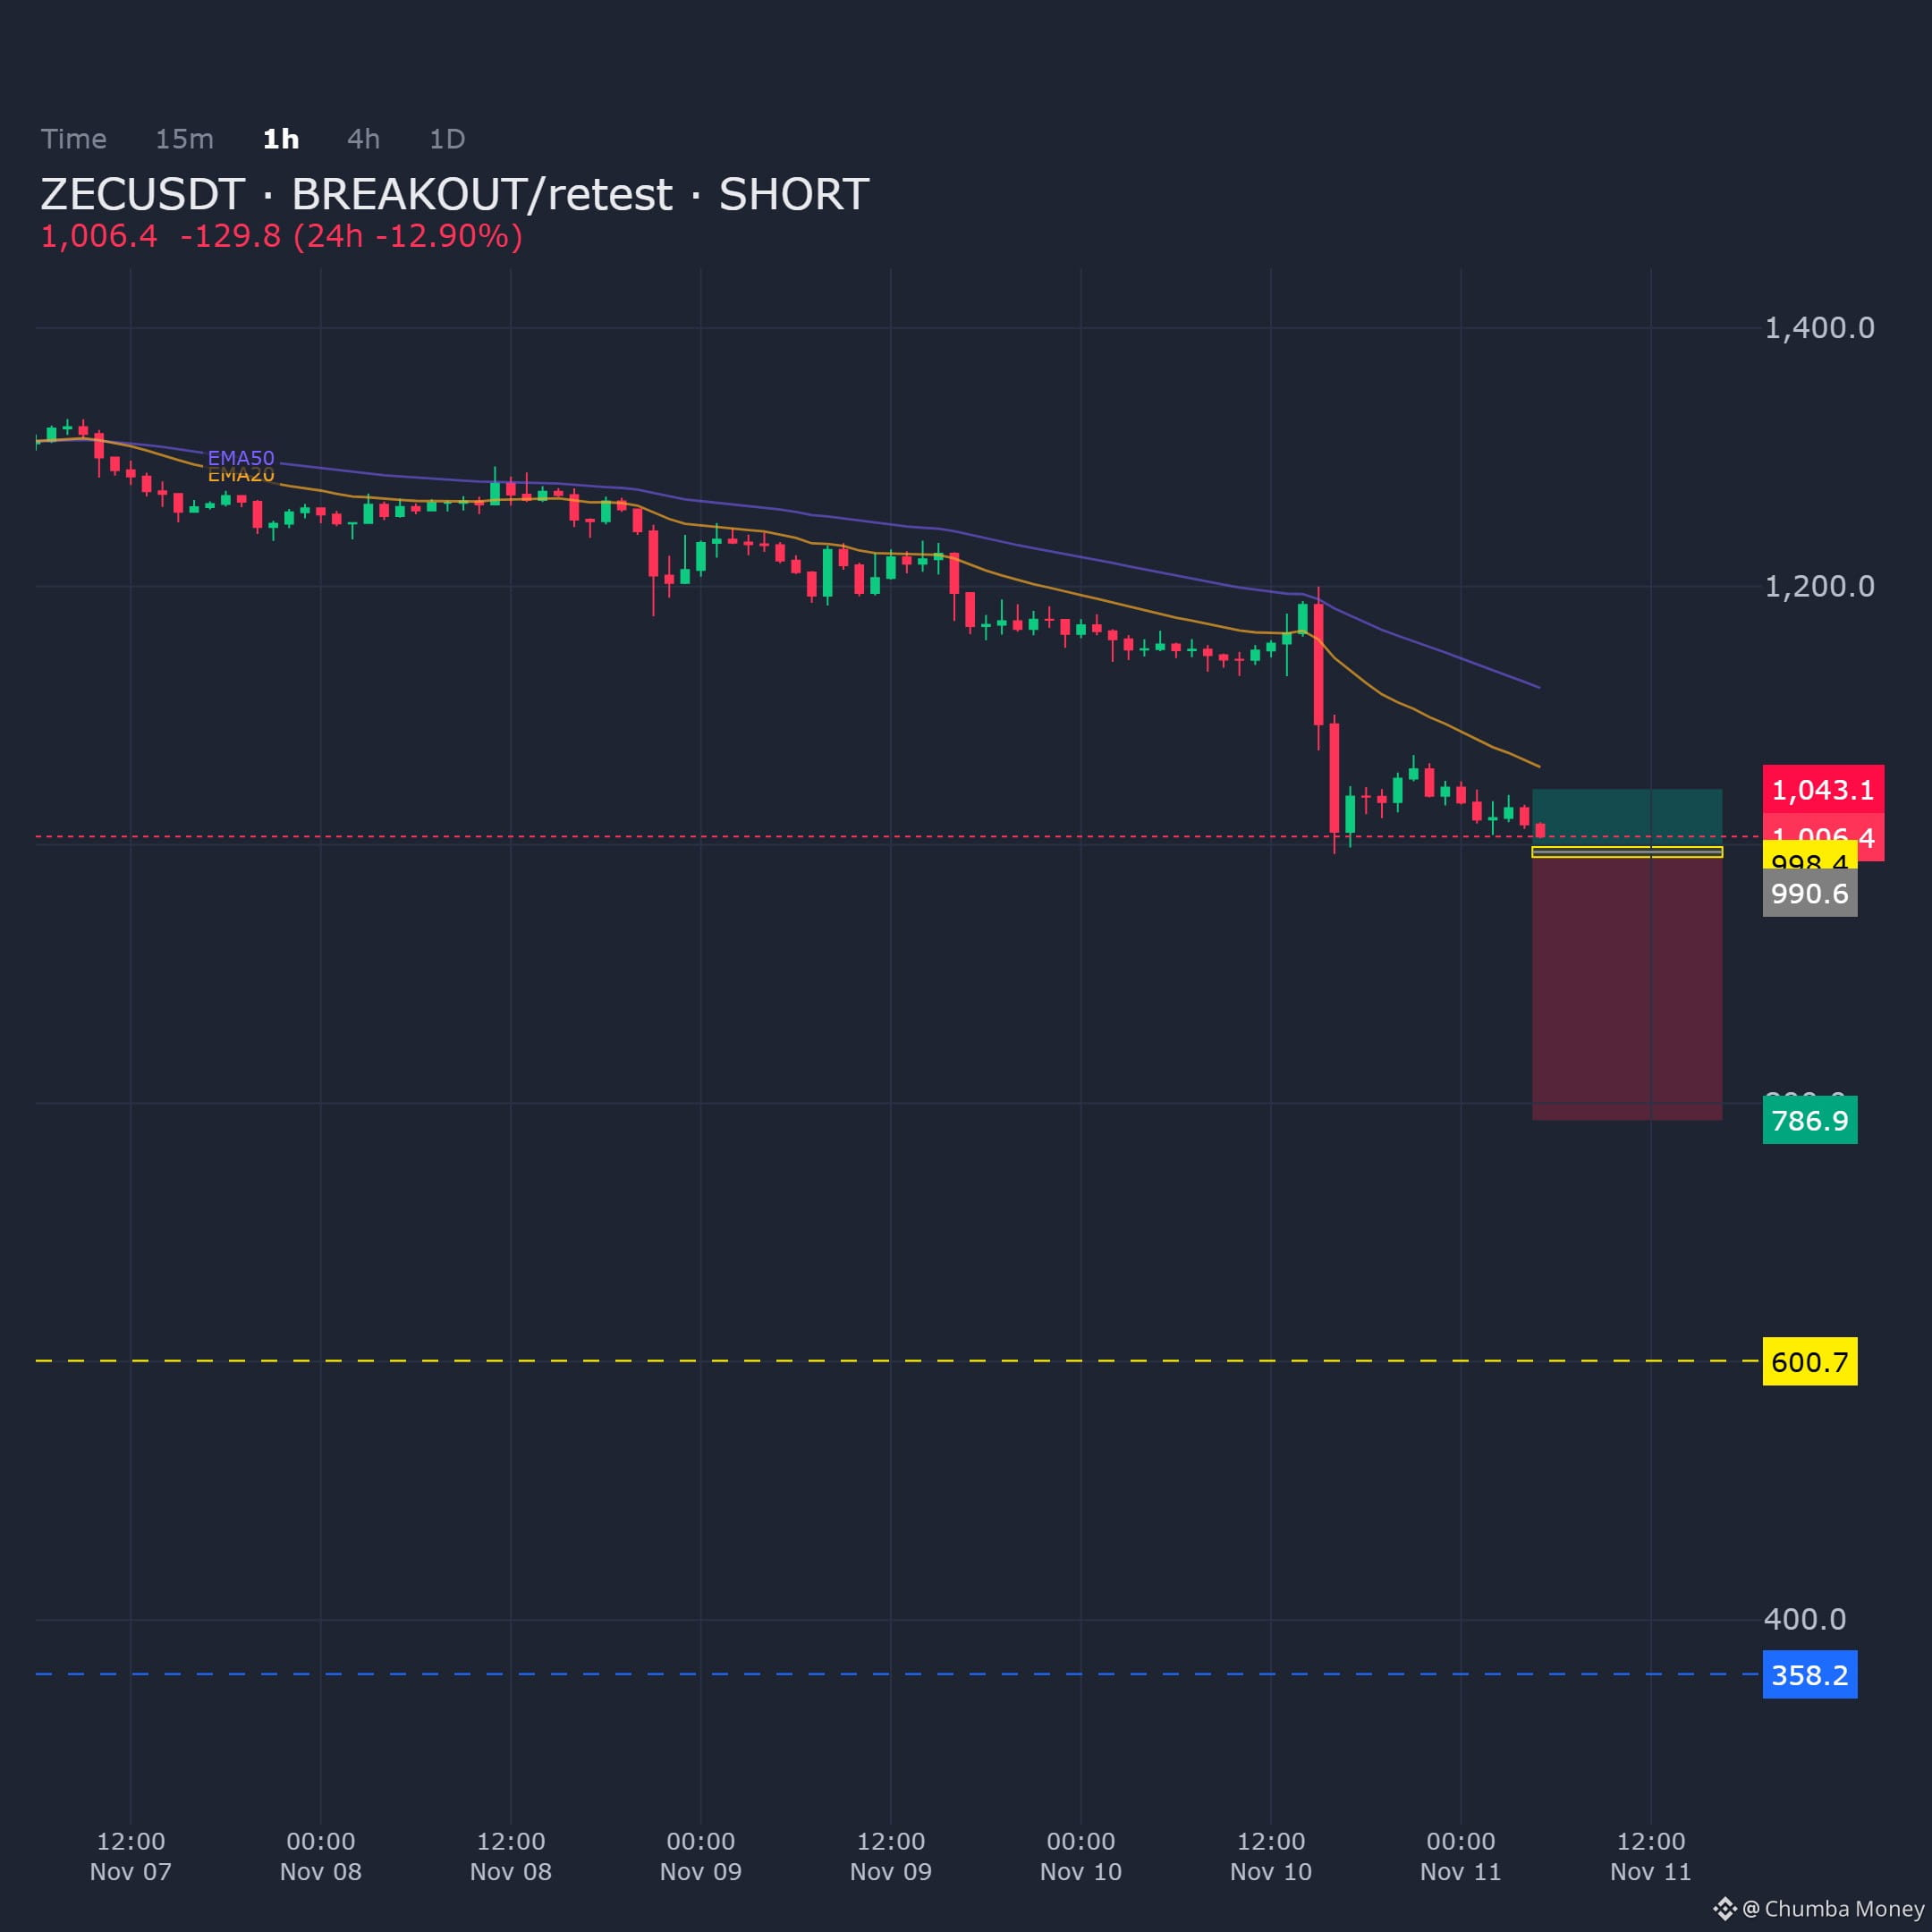
ZECUSDT on the 1H chart is testing supply with a short bias remaining intact from this area. Structure suggests a retest before further downside.
Entry: 990.6 - 998.35
Targets: TP1: 786.9, TP2: 600.67, TP3: 358.18
Stop Loss: 1043.1
$ZEC
ZECUSDT on the 1H chart is testing supply with a short bias remaining intact from this area. Structure suggests a retest before further downside.
Entry: 990.6 - 998.35
Targets: TP1: 786.9, TP2: 600.67, TP3: 358.18
Stop Loss: 1043.1
$ZEC
Entry: 990.6 - 998.35
Targets: TP1: 786.9, TP2: 600.67, TP3: 358.18
Stop Loss: 1043.1
$ZEC
40
·
--
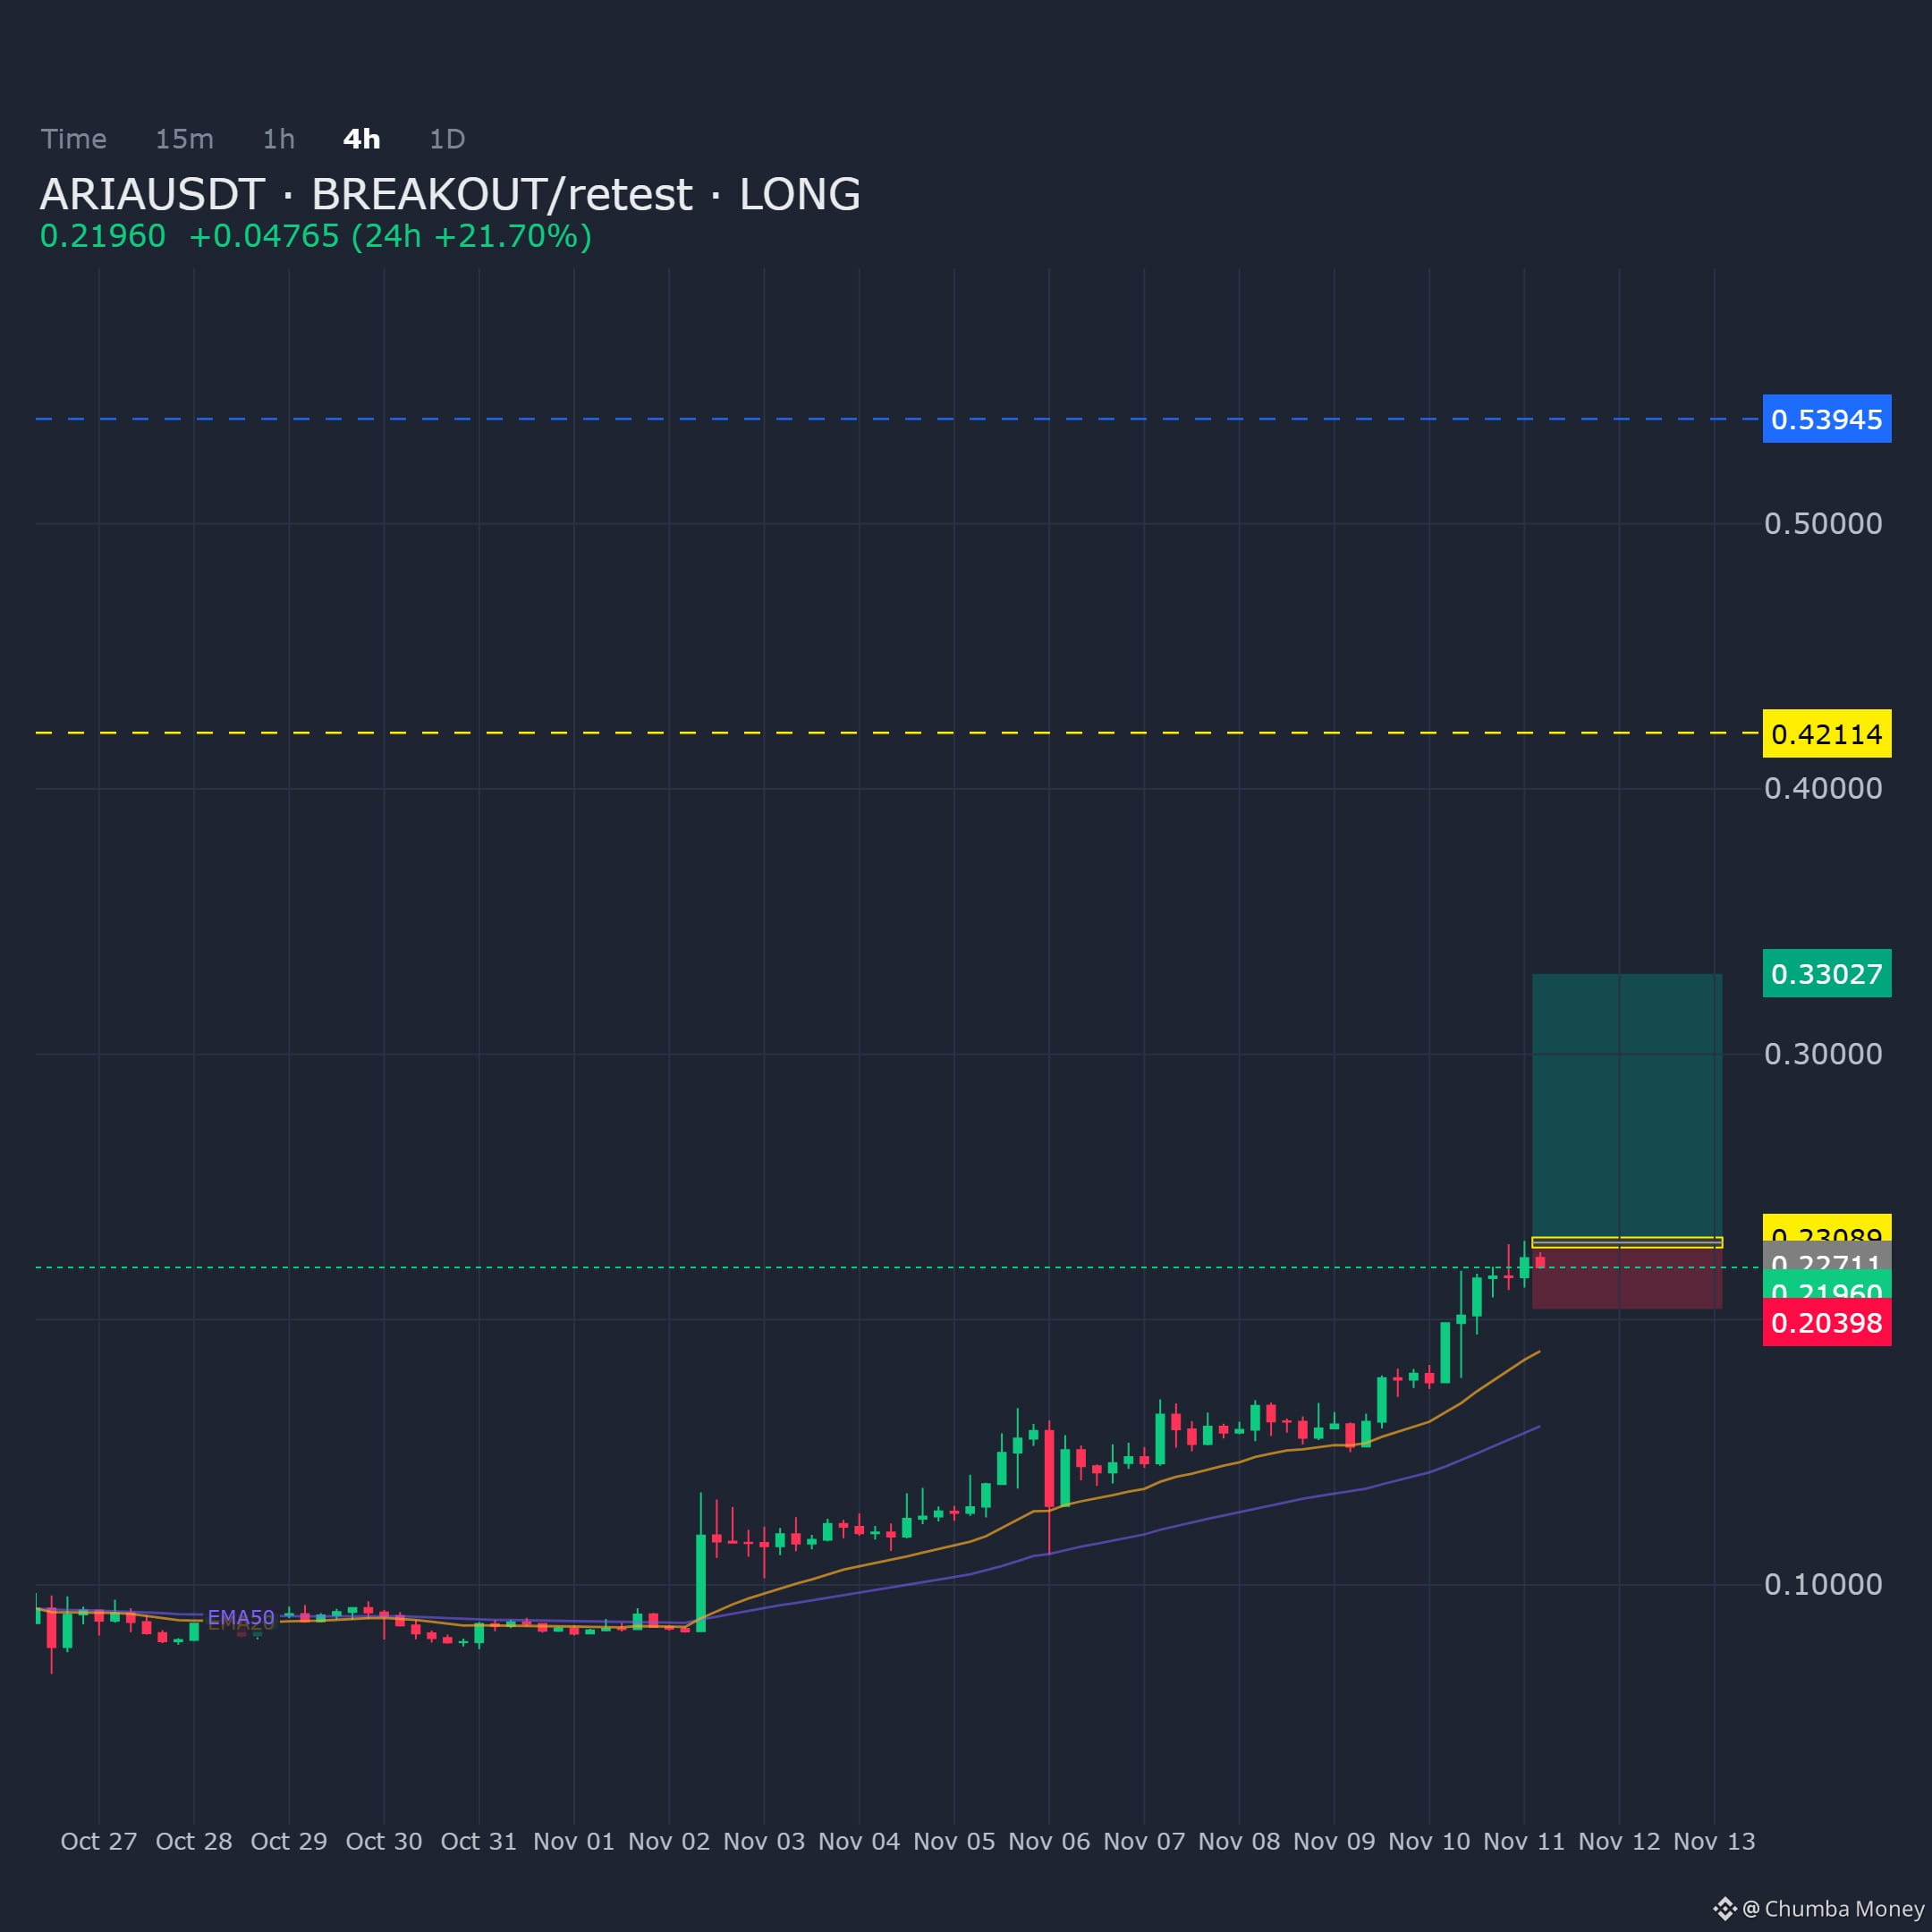
ARIAUSDT on the 4H is approaching a structured breakout zone with retest confluence supporting a long bias. The setup defines clear entry parameters before the next leg.
Entry: 0.227107 - 0.230893
Targets: TP1: 0.330273, TP2: 0.421136, TP3: 0.539446
Stop Loss: 0.203979
$ARIA
ARIAUSDT on the 4H is approaching a structured breakout zone with retest confluence supporting a long bias. The setup defines clear entry parameters before the next leg.
Entry: 0.227107 - 0.230893
Targets: TP1: 0.330273, TP2: 0.421136, TP3: 0.539446
Stop Loss: 0.203979
$ARIA
Entry: 0.227107 - 0.230893
Targets: TP1: 0.330273, TP2: 0.421136, TP3: 0.539446
Stop Loss: 0.203979
$ARIA
37
·
--
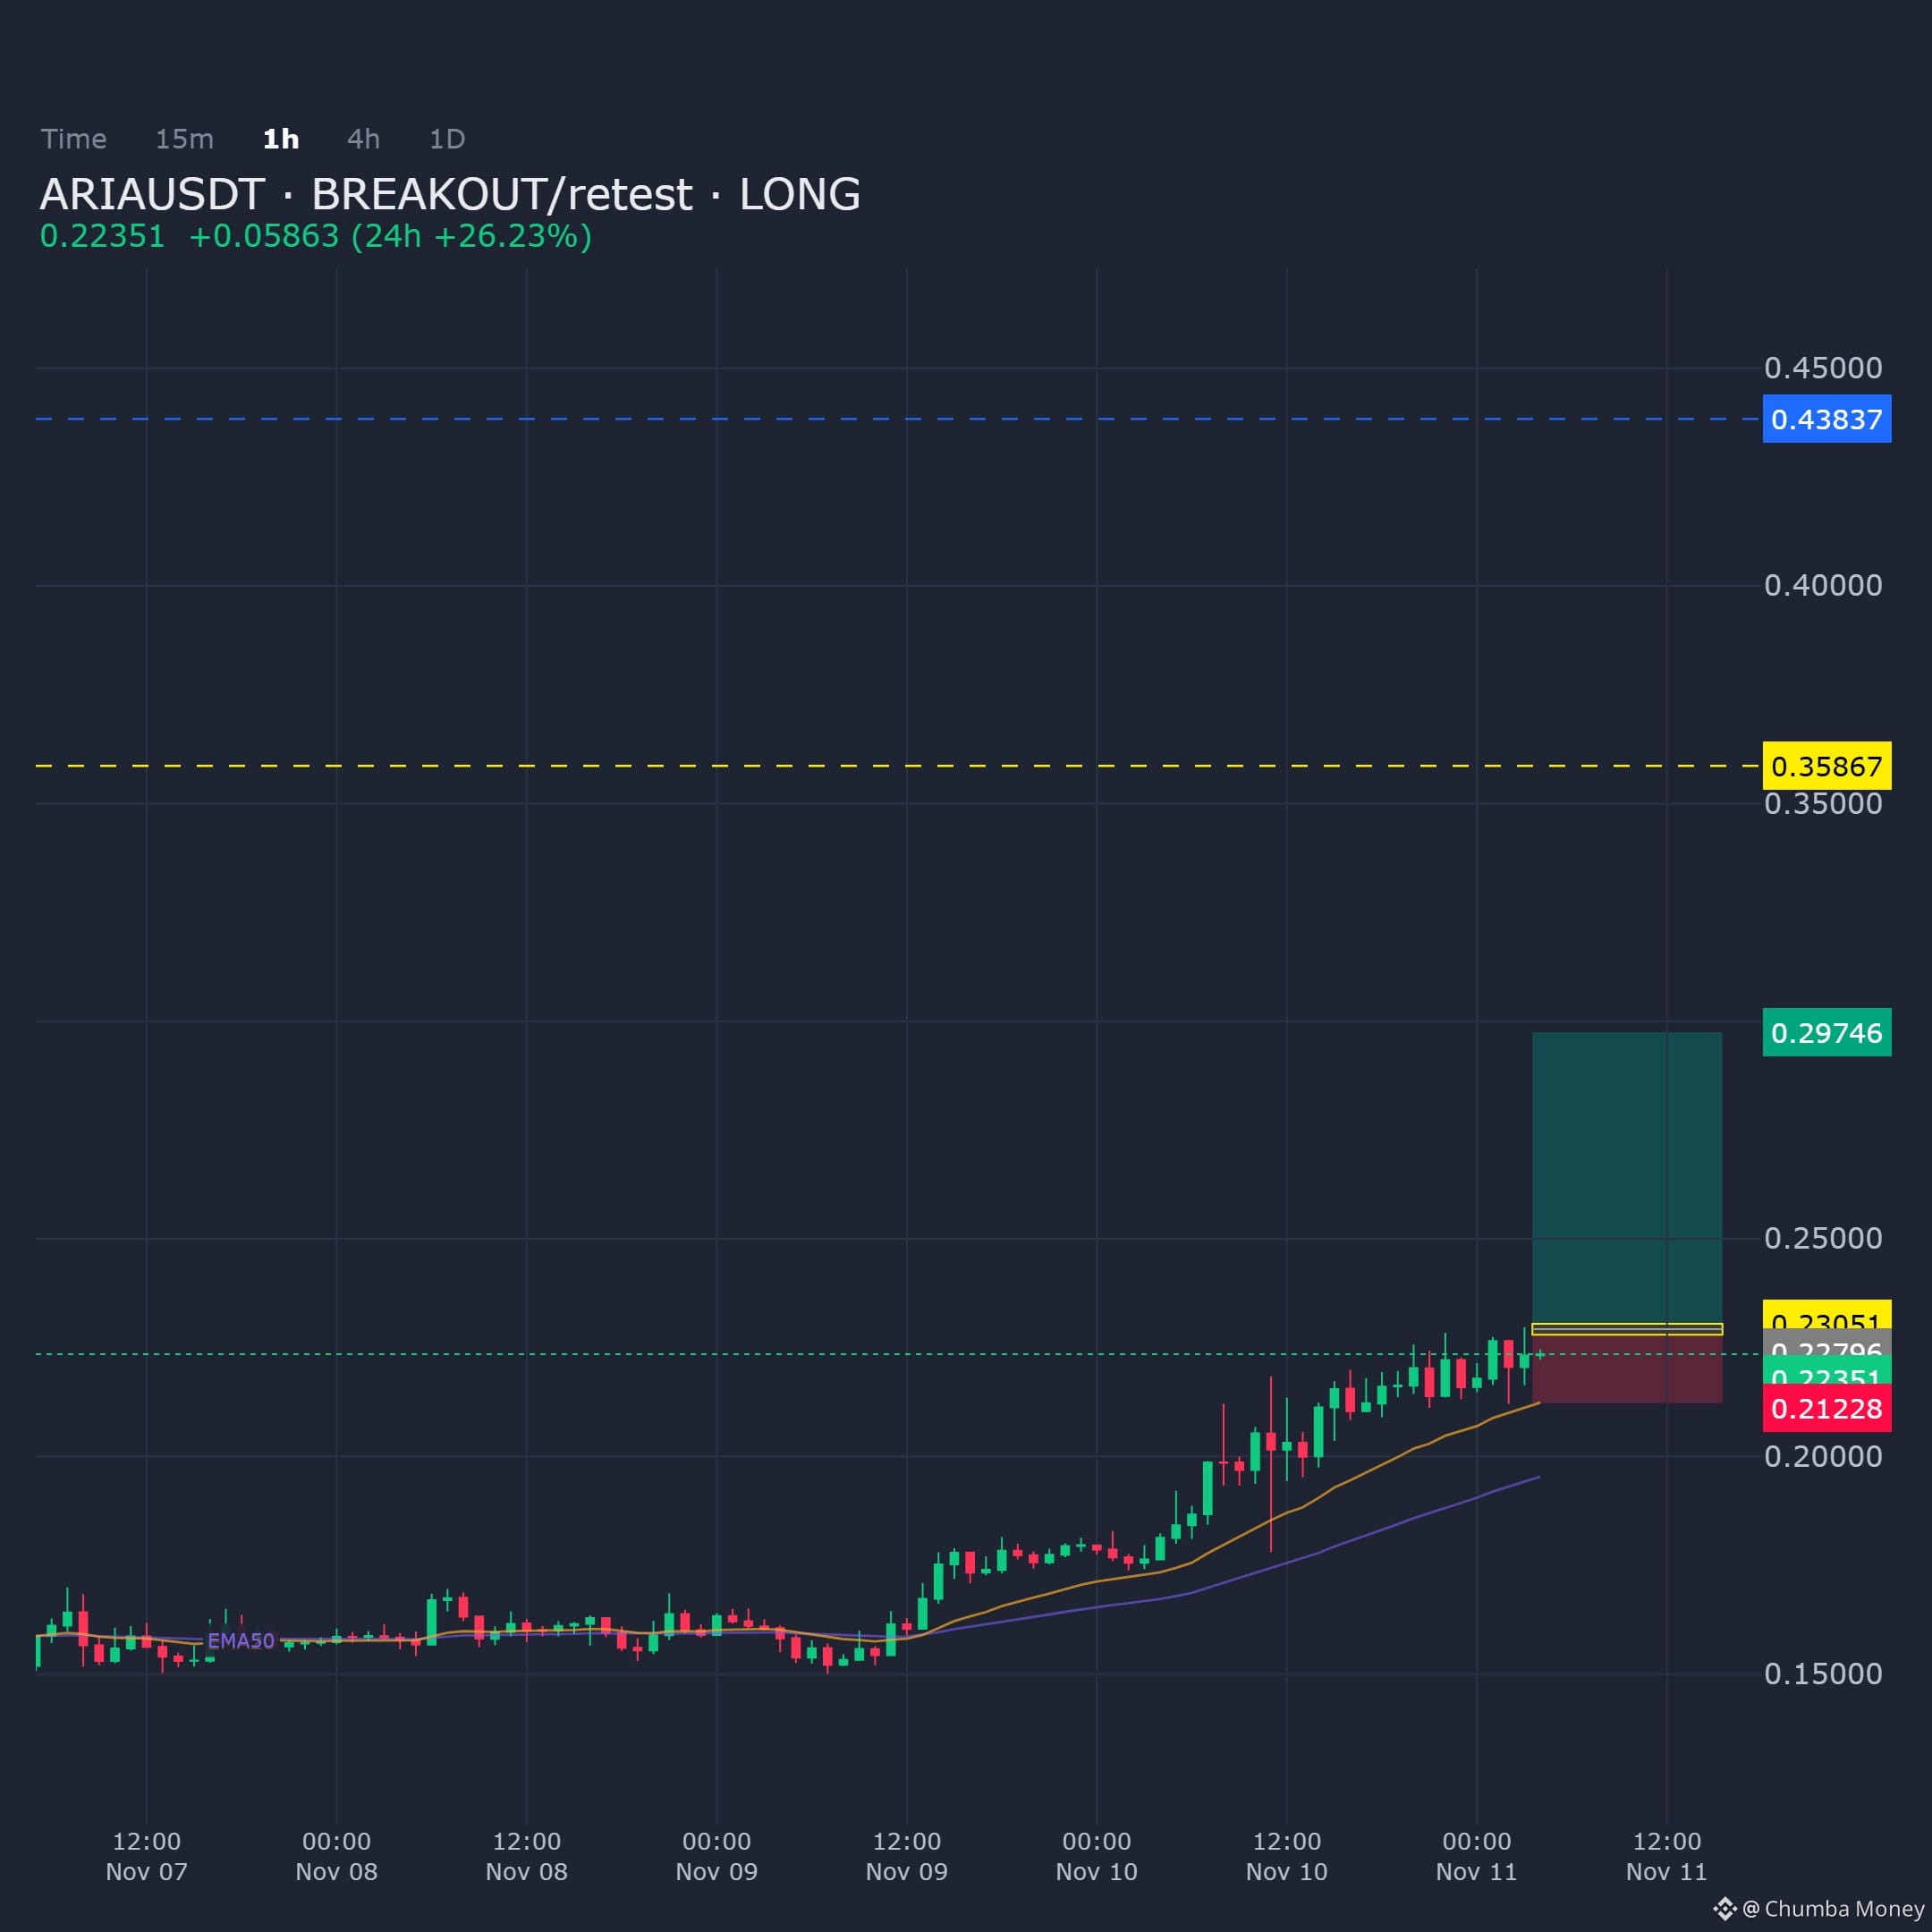
ARIAUSDT on the 1H frame is forming a long bias via a breakout and retest structure. Price action respects the demand zone, suggesting a defined move toward resistance levels.
Entry: 0.227957 - 0.230507
Targets: TP1: 0.297455, TP2: 0.358665, TP3: 0.438365
Stop Loss: 0.212277
$ARIA
ARIAUSDT on the 1H frame is forming a long bias via a breakout and retest structure. Price action respects the demand zone, suggesting a defined move toward resistance levels.
Entry: 0.227957 - 0.230507
Targets: TP1: 0.297455, TP2: 0.358665, TP3: 0.438365
Stop Loss: 0.212277
$ARIA
Entry: 0.227957 - 0.230507
Targets: TP1: 0.297455, TP2: 0.358665, TP3: 0.438365
Stop Loss: 0.212277
$ARIA
38
·
--
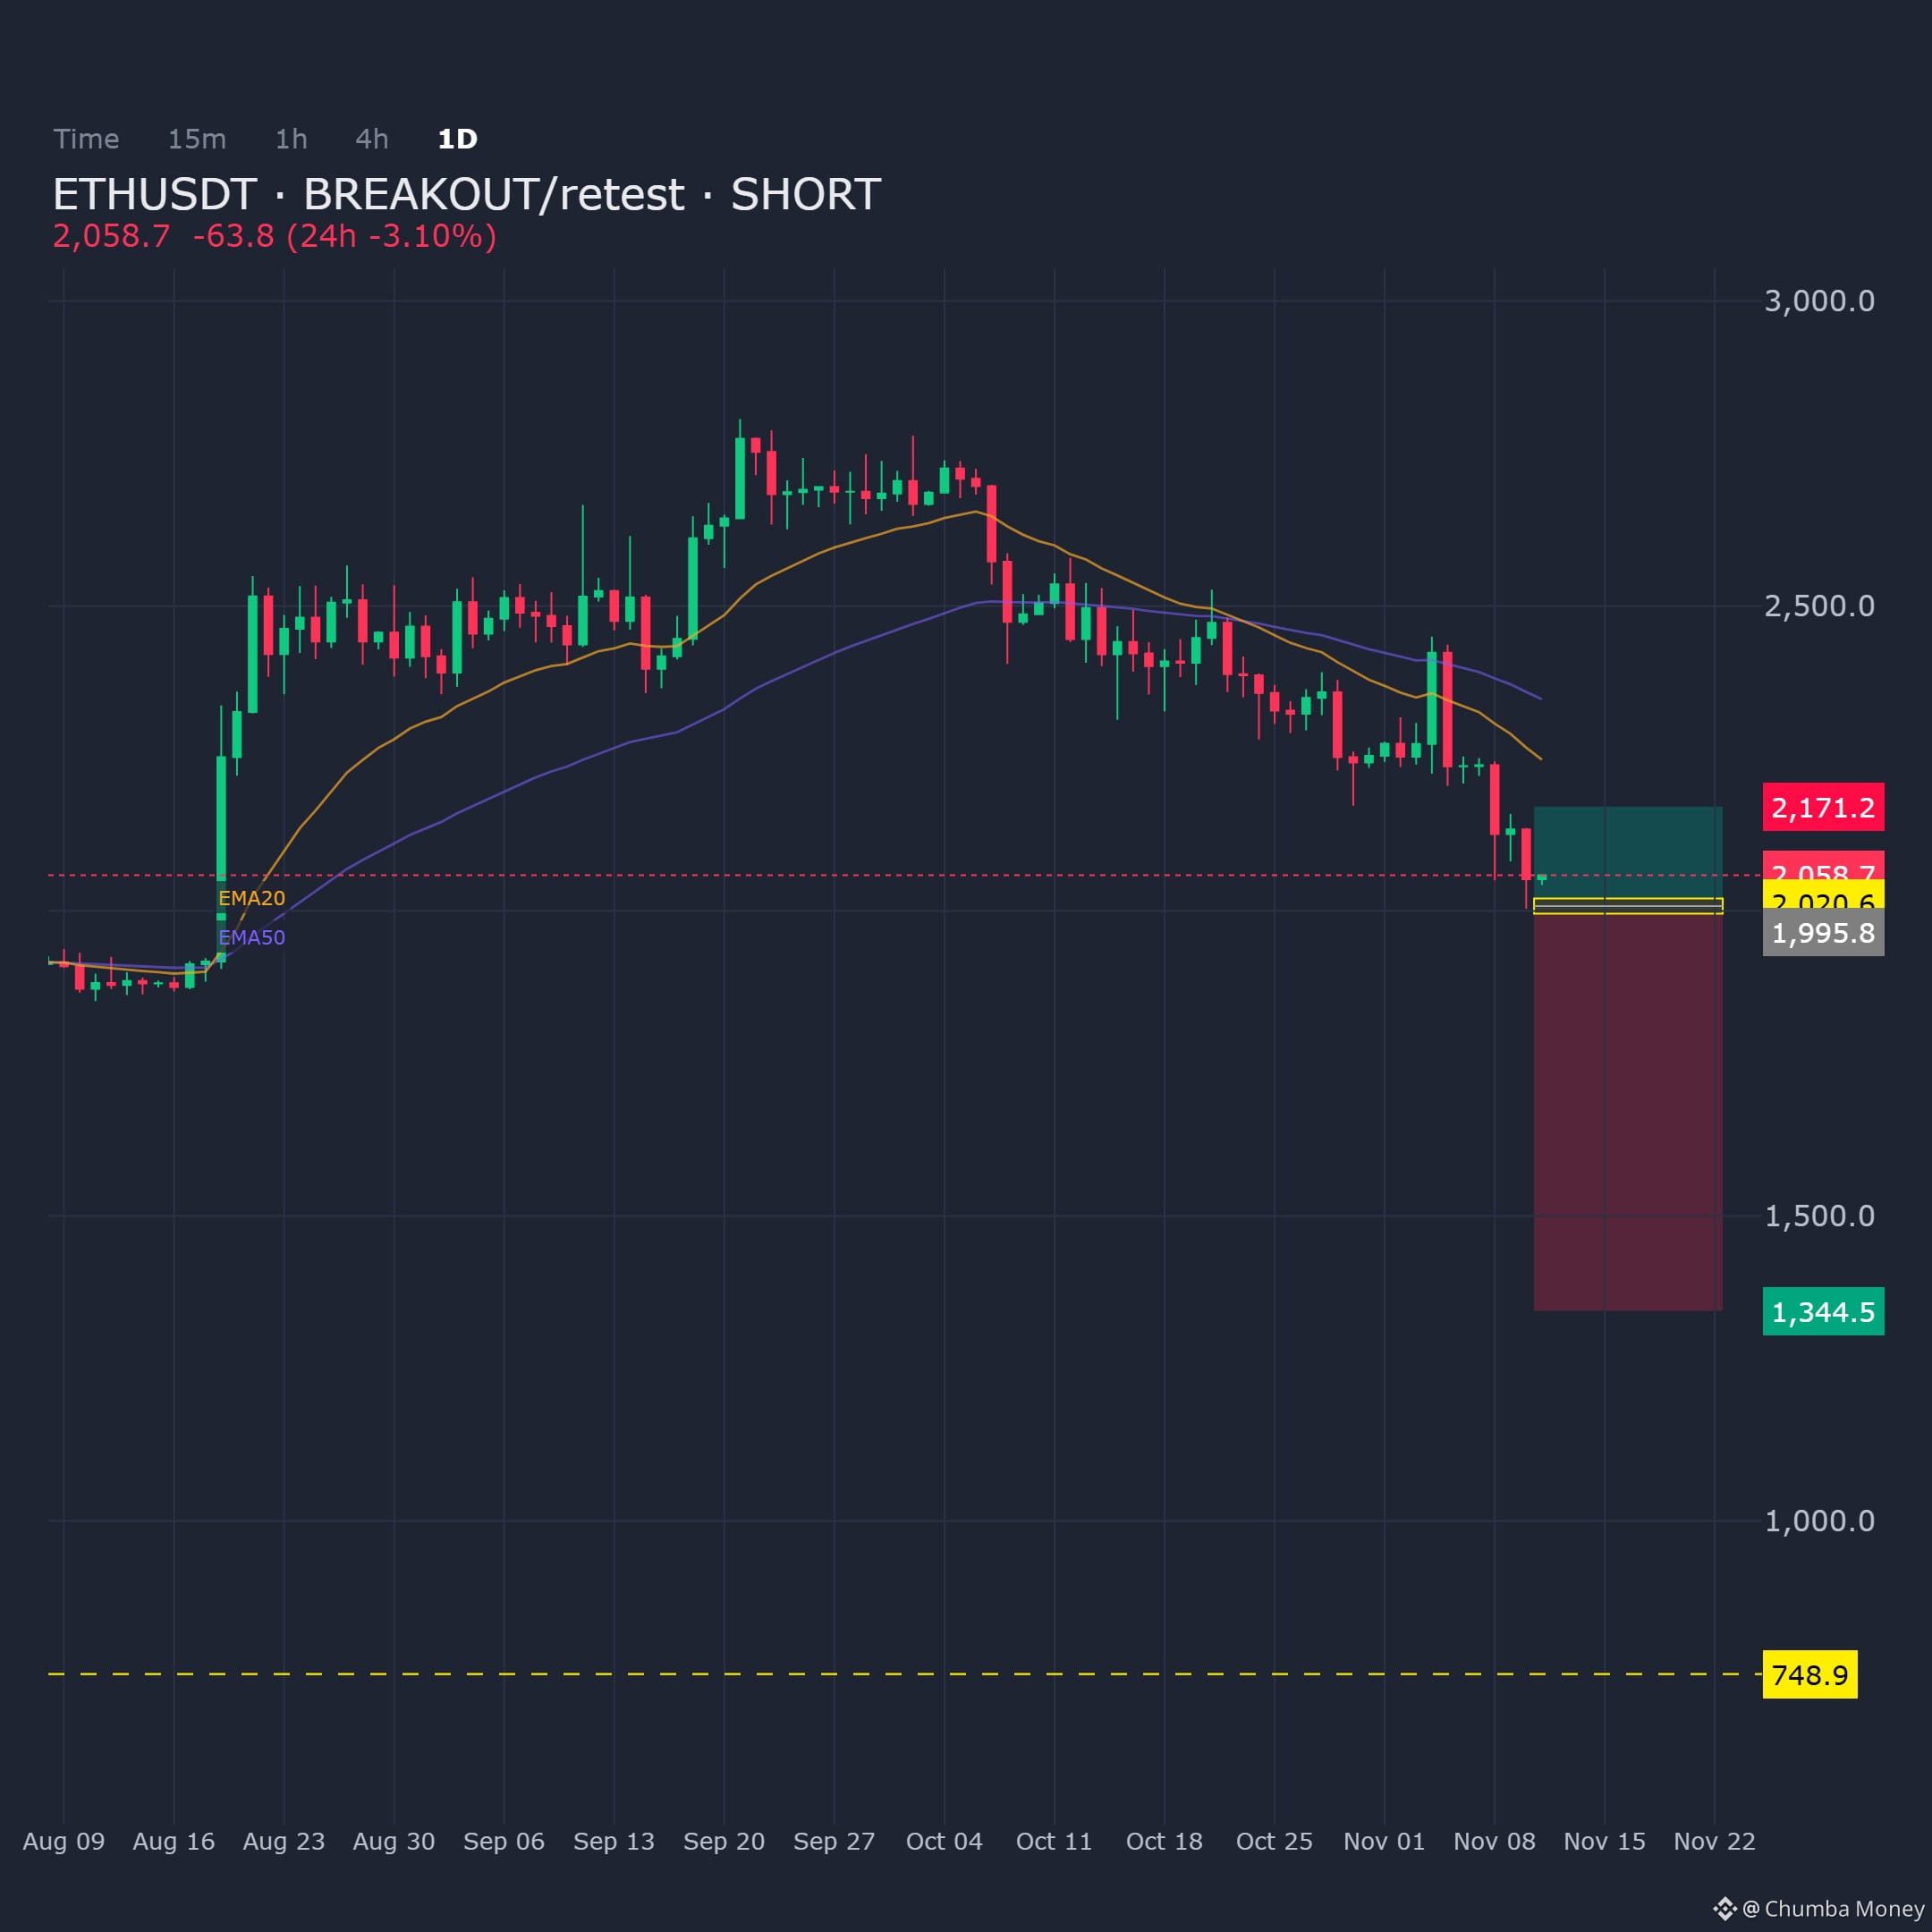
ETHUSDT Daily shows momentum weakening at resistance, setting up a short from the breakout-retest zone.
Entry: 1995.8 - 2020.6
Targets: TP1: 1344.5, TP2: 748.92, TP3: 748.92
Stop Loss: 2171.2
$ETH
ETHUSDT Daily shows momentum weakening at resistance, setting up a short from the breakout-retest zone.
Entry: 1995.8 - 2020.6
Targets: TP1: 1344.5, TP2: 748.92, TP3: 748.92
Stop Loss: 2171.2
$ETH
Entry: 1995.8 - 2020.6
Targets: TP1: 1344.5, TP2: 748.92, TP3: 748.92
Stop Loss: 2171.2
$ETH
44
·
--
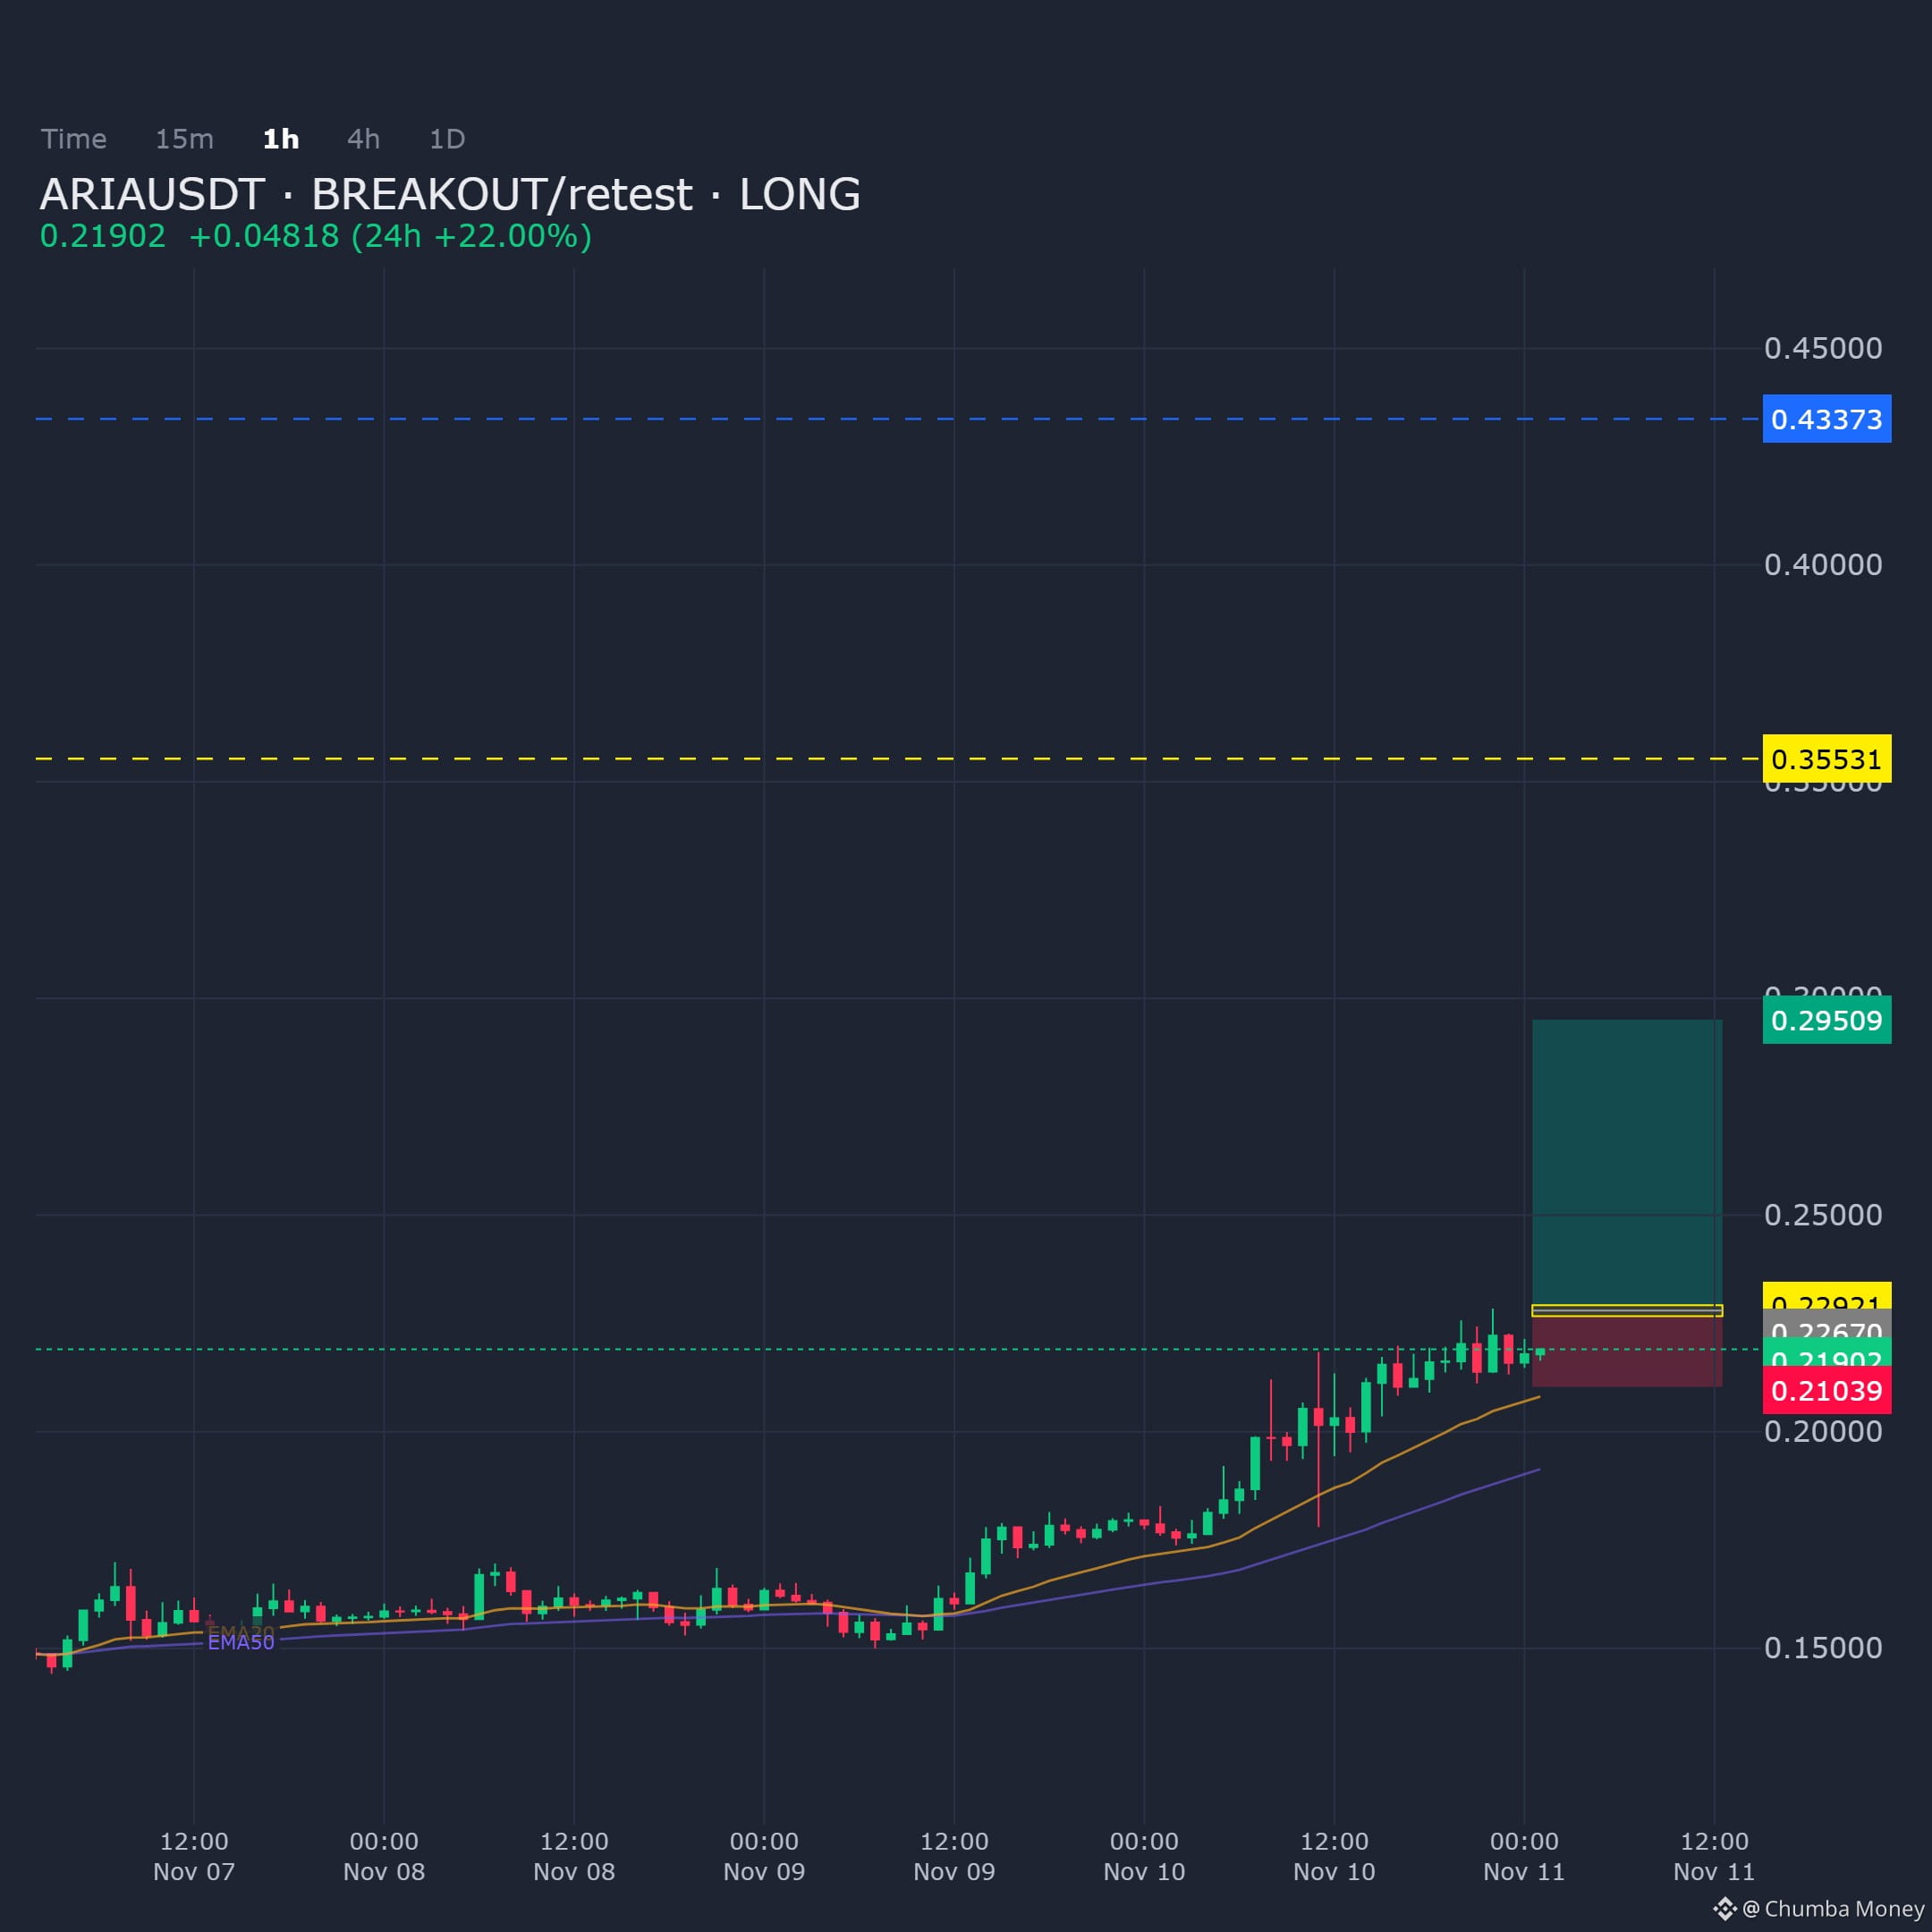
ARIAUSDT on the 1H chart is structuring a bullish breakout-retest scenario, with bias leaning long as price converges on a key confluence zone.
Entry: 0.226705 - 0.229214
Targets: TP1: 0.295087, TP2: 0.355314, TP3: 0.433734
Stop Loss: 0.21039
$ARIA
ARIAUSDT on the 1H chart is structuring a bullish breakout-retest scenario, with bias leaning long as price converges on a key confluence zone.
Entry: 0.226705 - 0.229214
Targets: TP1: 0.295087, TP2: 0.355314, TP3: 0.433734
Stop Loss: 0.21039
$ARIA
Entry: 0.226705 - 0.229214
Targets: TP1: 0.295087, TP2: 0.355314, TP3: 0.433734
Stop Loss: 0.21039
$ARIA
66
·
--
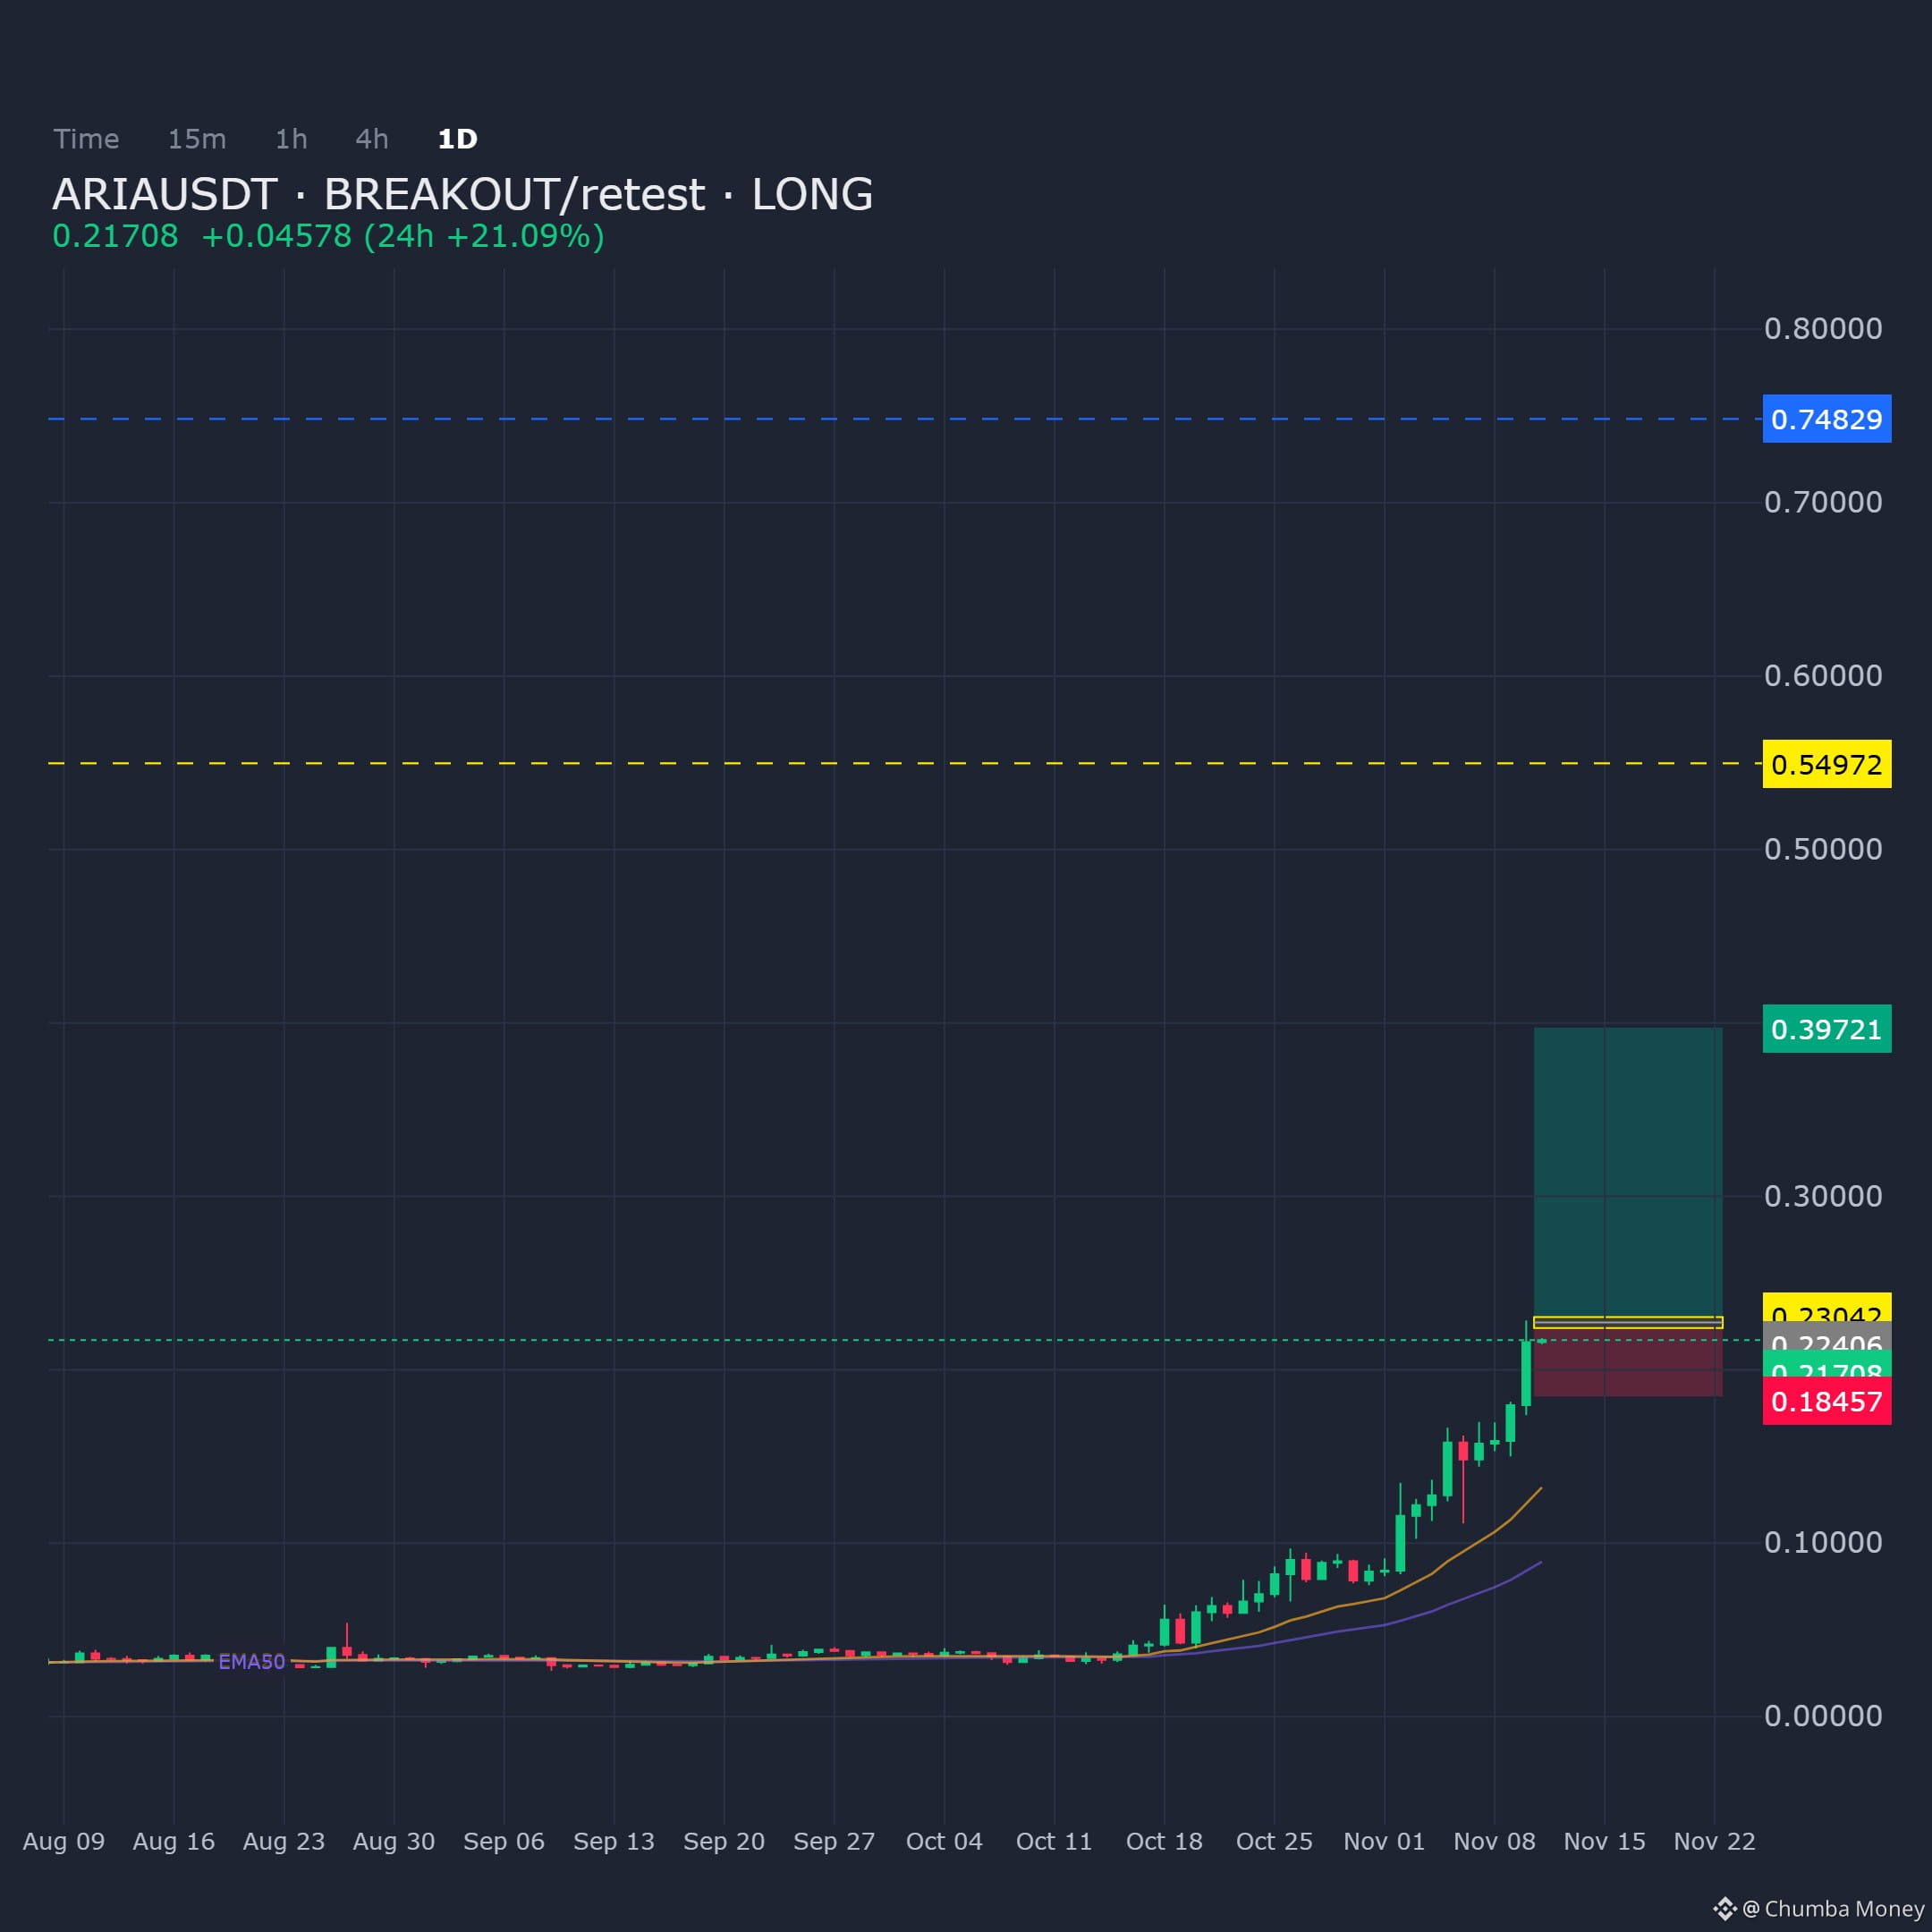
ARIAUSDT on the Daily is showing confluence for a long bias via a breakout/retest structure. The key demand zone is now being monitored for entry.
Entry: 0.224061 - 0.230416
Targets: TP1: 0.397215, TP2: 0.549716, TP3: 0.748286
Stop Loss: 0.18457
$ARIA
ARIAUSDT on the Daily is showing confluence for a long bias via a breakout/retest structure. The key demand zone is now being monitored for entry.
Entry: 0.224061 - 0.230416
Targets: TP1: 0.397215, TP2: 0.549716, TP3: 0.748286
Stop Loss: 0.18457
$ARIA
Entry: 0.224061 - 0.230416
Targets: TP1: 0.397215, TP2: 0.549716, TP3: 0.748286
Stop Loss: 0.18457
$ARIA
78
·
--
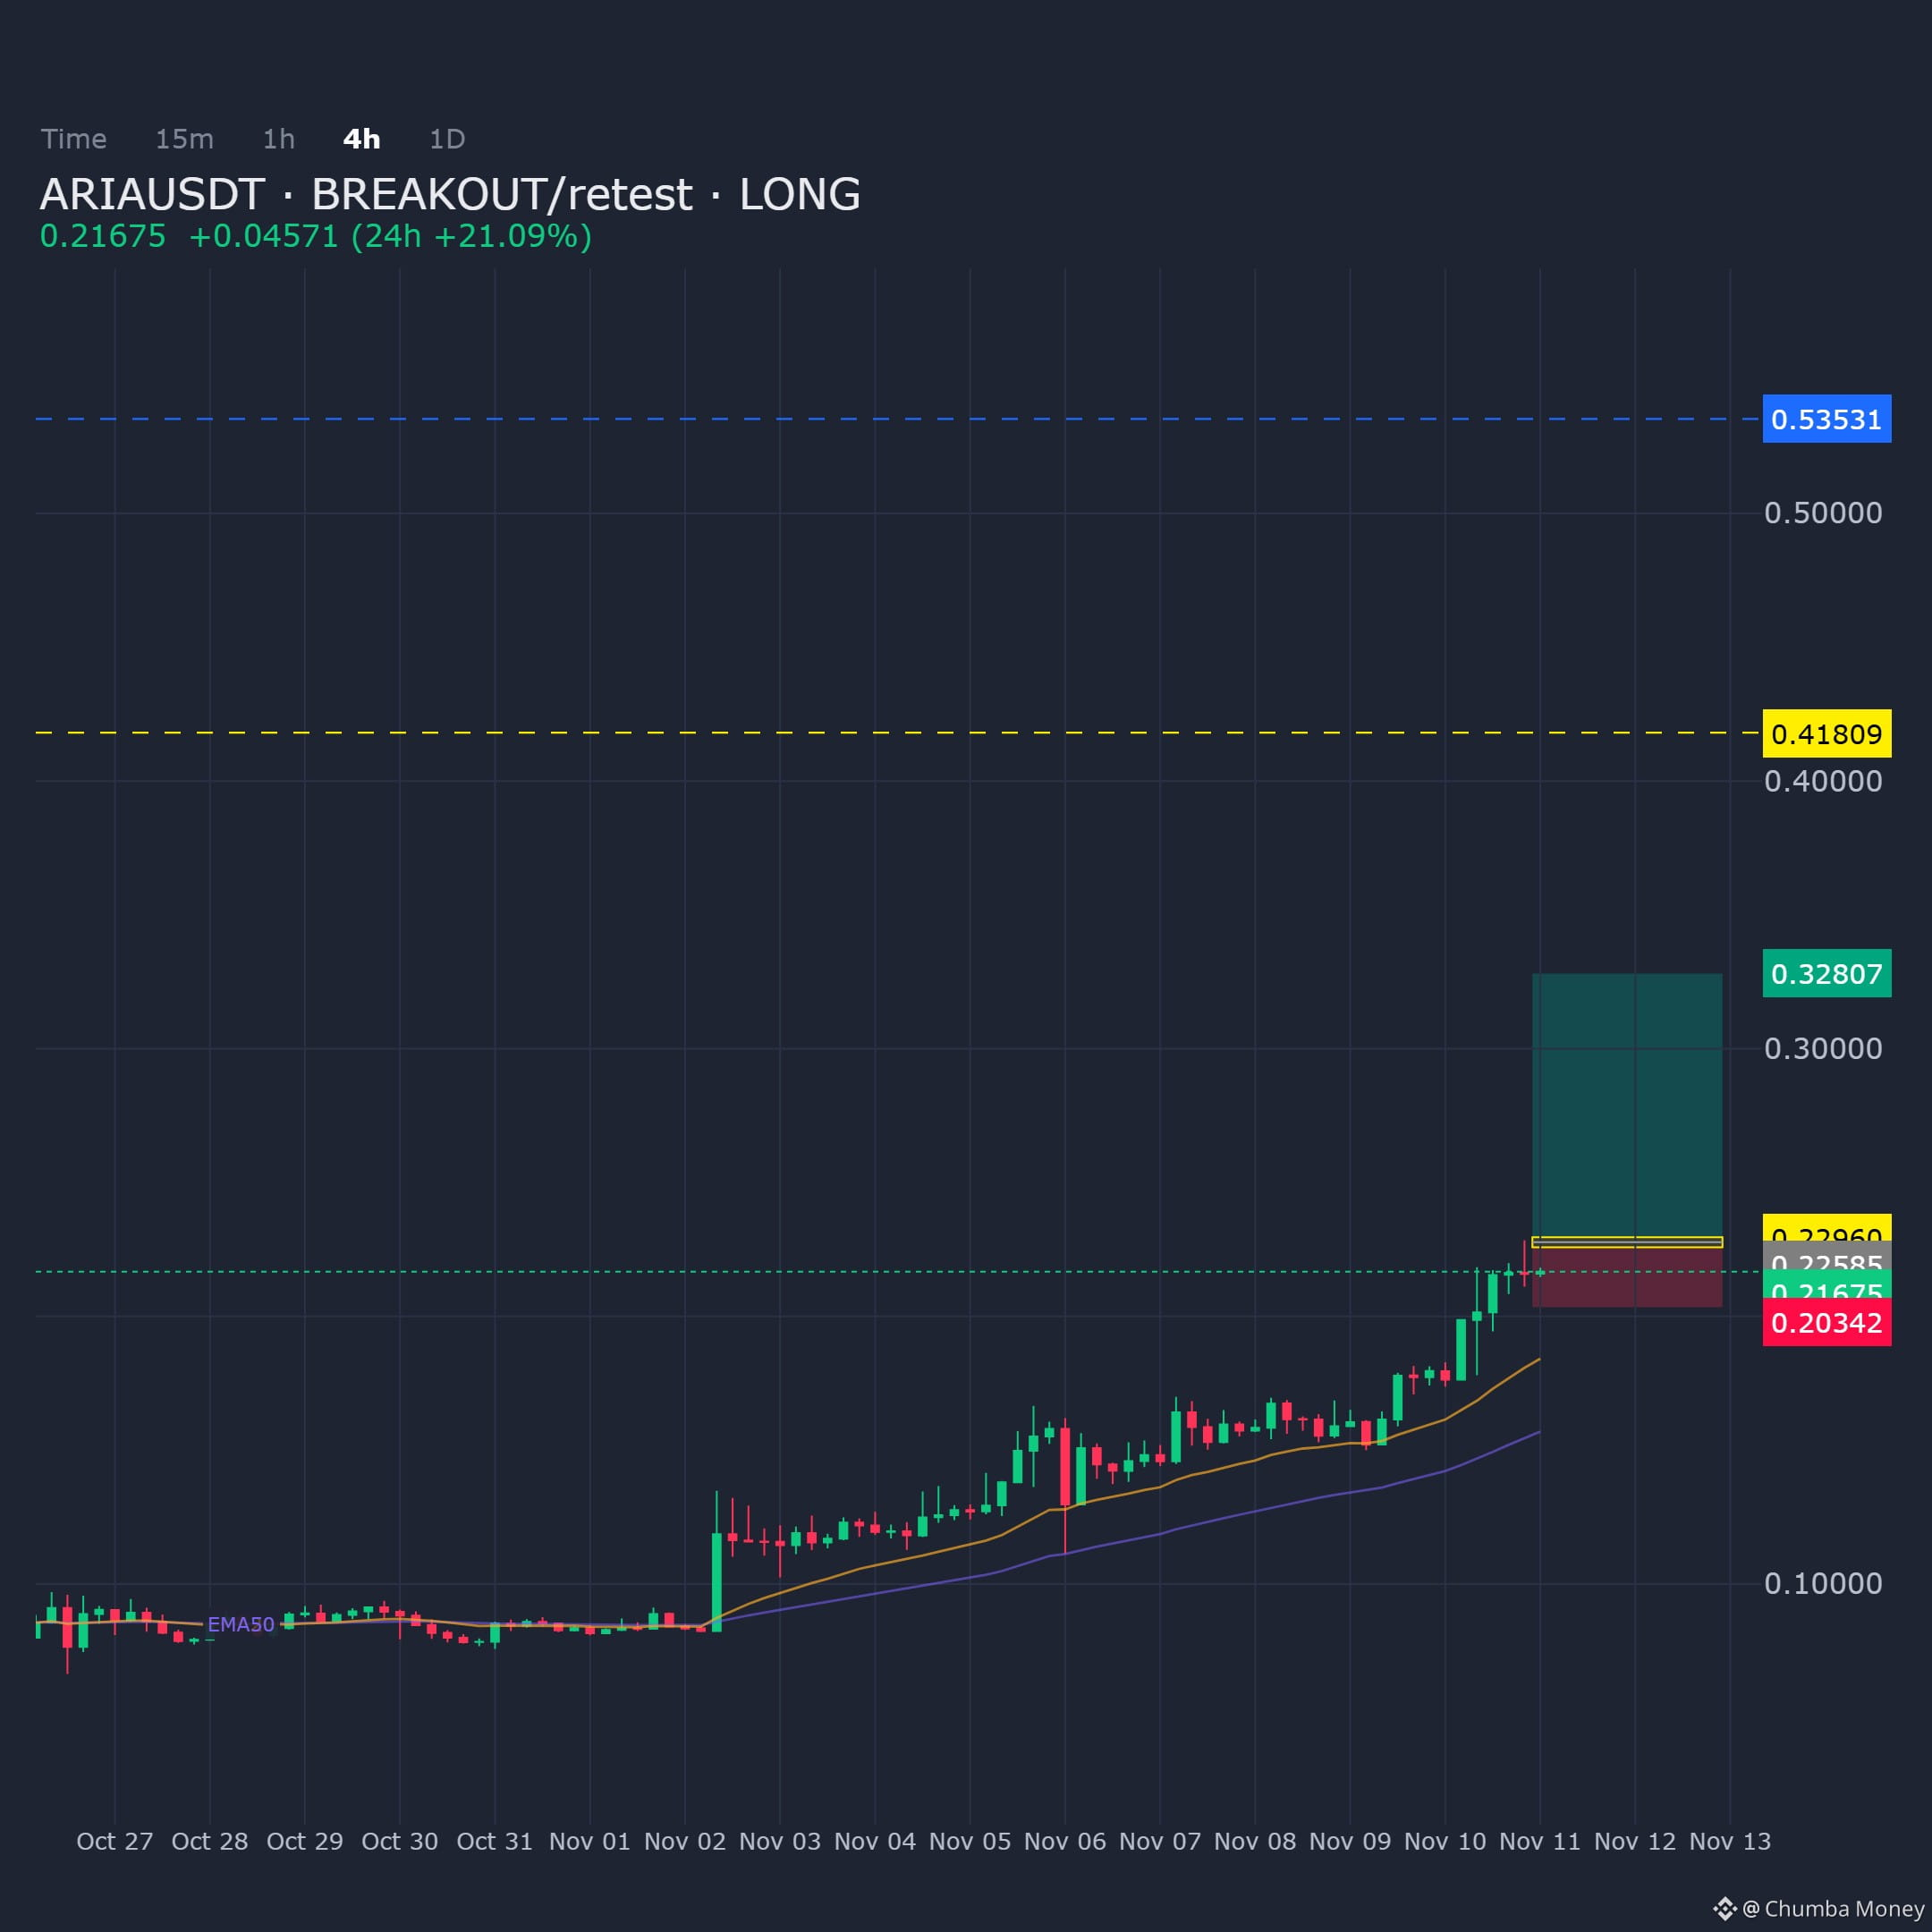
ARIAUSDT on the 4H chart. Bullish bias after price reclaimed the breakout structure; waiting for the retest to confirm support before entry.
Entry: 0.225851 - 0.229602
Targets: TP1: 0.328067, TP2: 0.418092, TP3: 0.535312
Stop Loss: 0.203423
$ARIA
ARIAUSDT on the 4H chart. Bullish bias after price reclaimed the breakout structure; waiting for the retest to confirm support before entry.
Entry: 0.225851 - 0.229602
Targets: TP1: 0.328067, TP2: 0.418092, TP3: 0.535312
Stop Loss: 0.203423
$ARIA
Entry: 0.225851 - 0.229602
Targets: TP1: 0.328067, TP2: 0.418092, TP3: 0.535312
Stop Loss: 0.203423
$ARIA
116
·
--
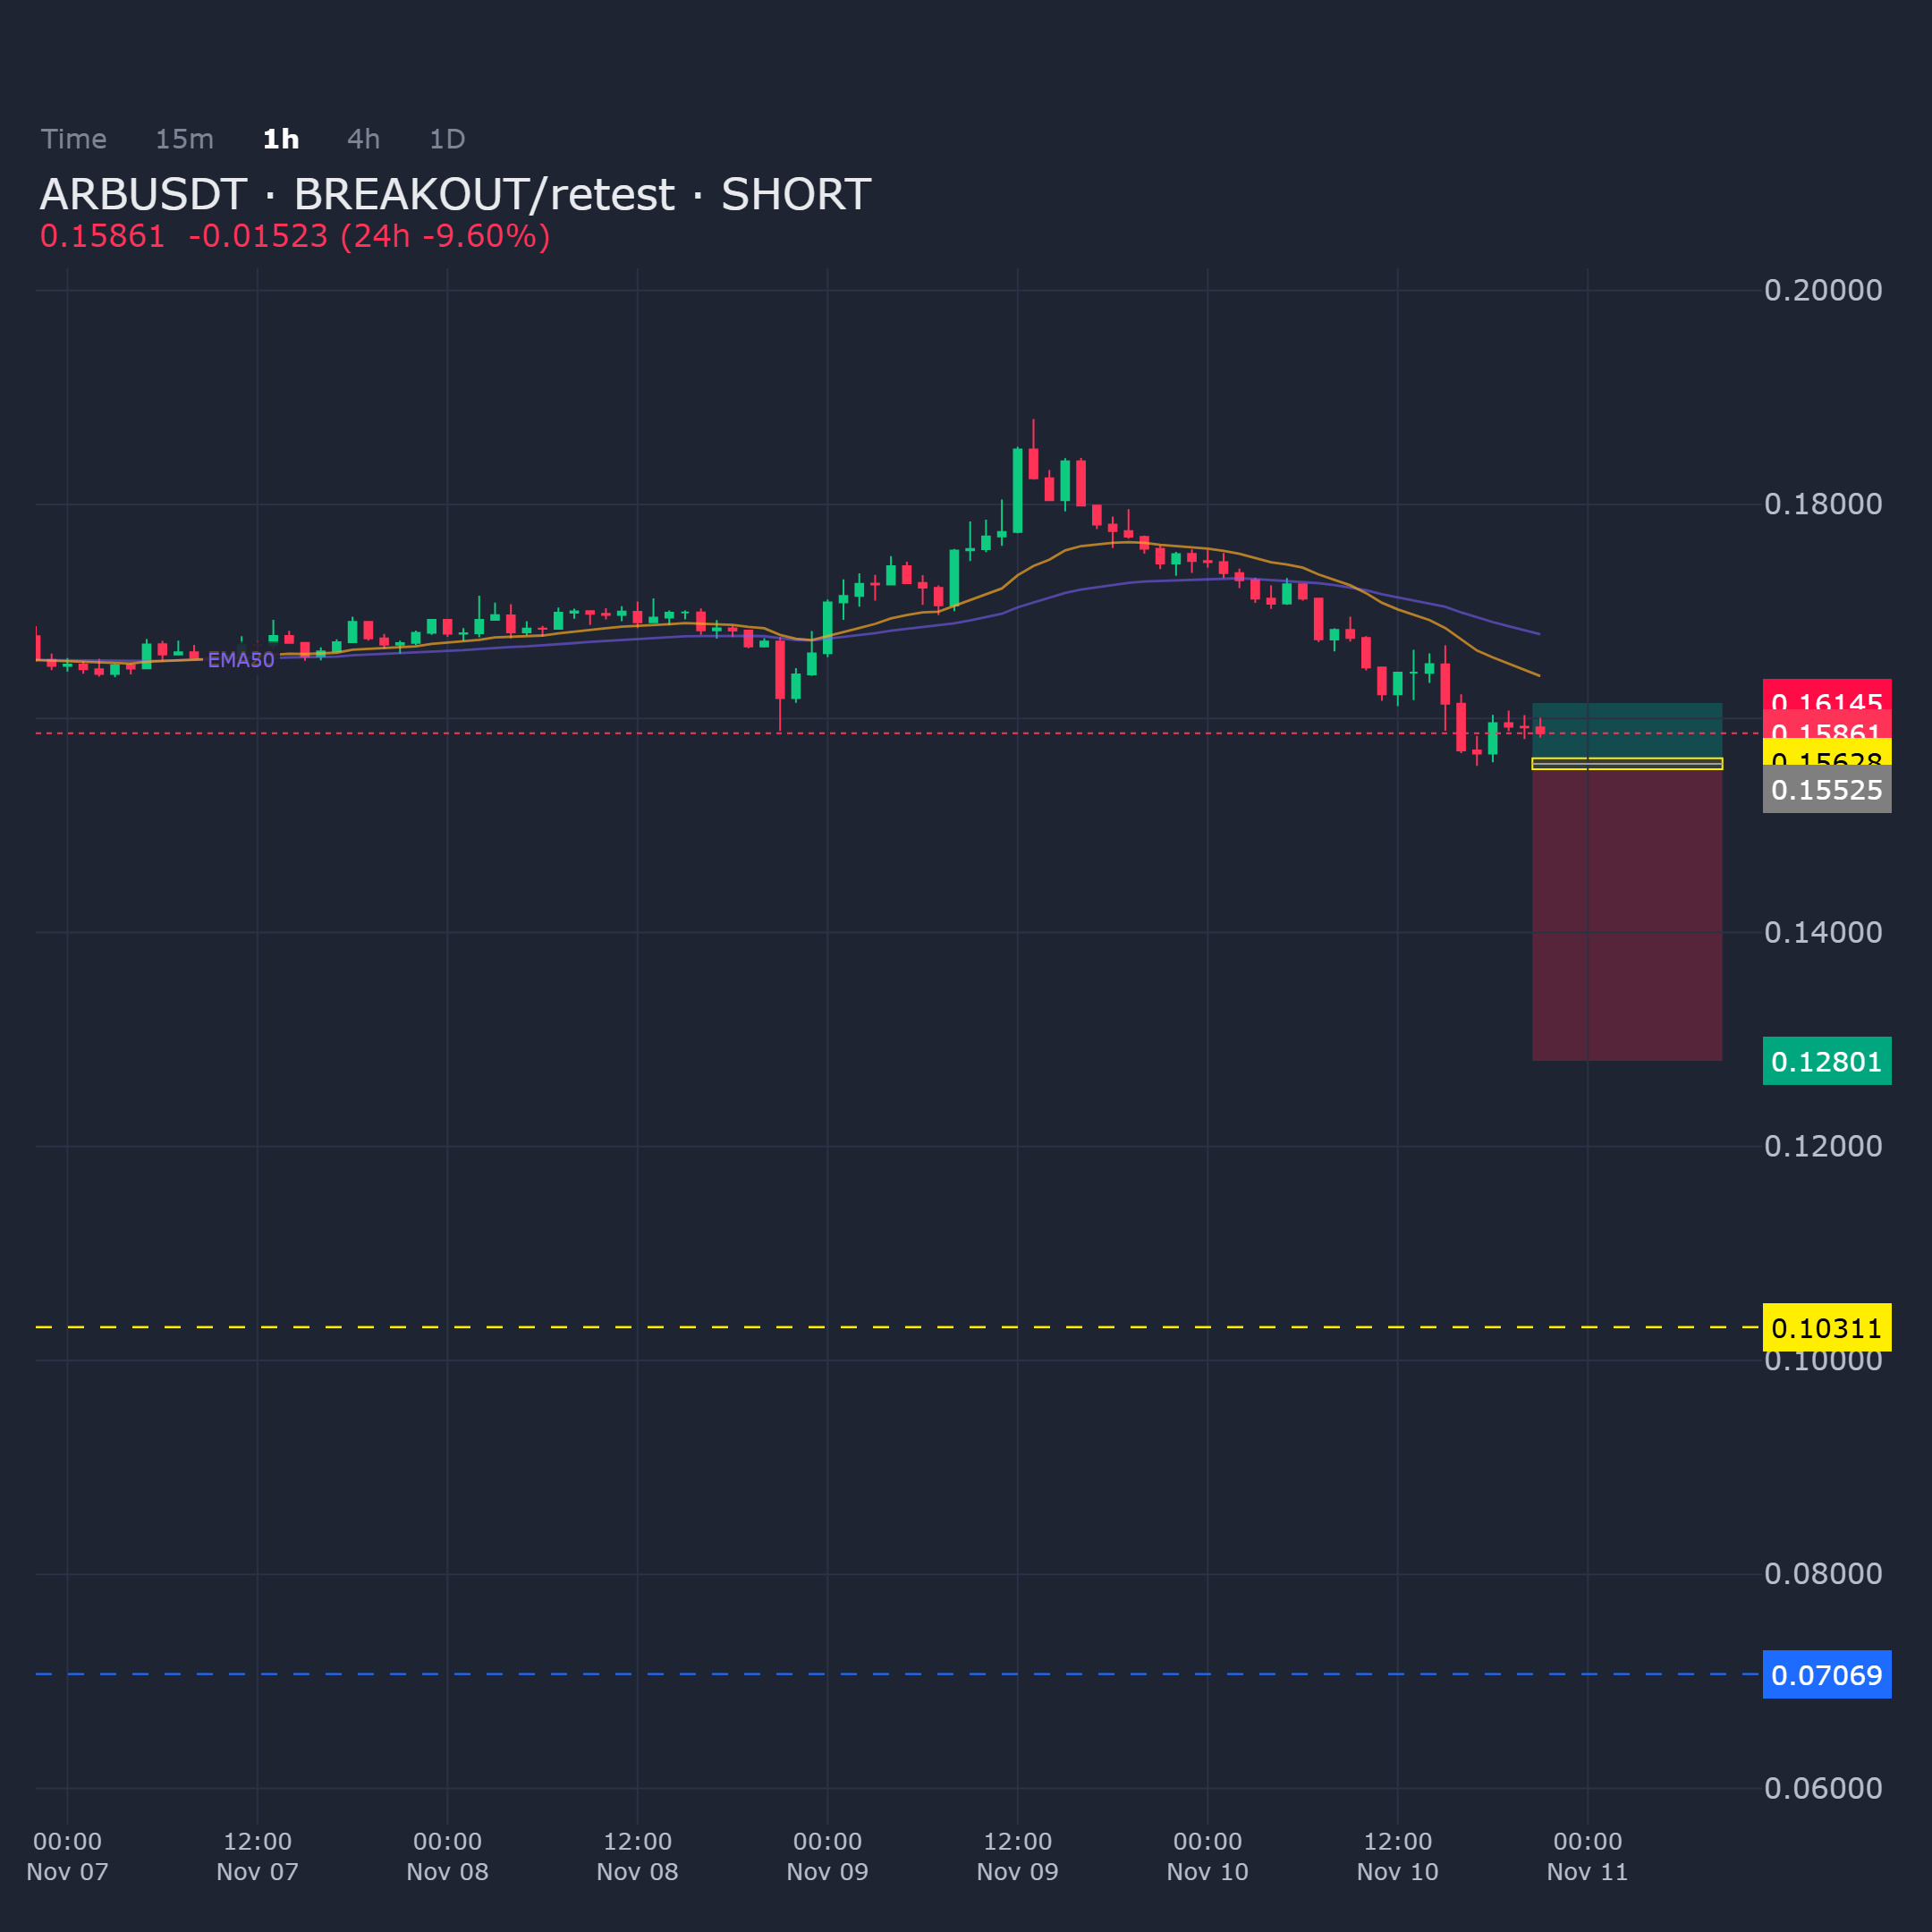
ARBUSDT on the 1H chart is losing momentum at resistance. Fade into a short with the retest completion as confirmation.
Entry: 0.155246 - 0.156283
Targets: TP1: 0.128013, TP2: 0.103114, TP3: 0.070694
Stop Loss: 0.161451
$ARB
ARBUSDT on the 1H chart is losing momentum at resistance. Fade into a short with the retest completion as confirmation.
Entry: 0.155246 - 0.156283
Targets: TP1: 0.128013, TP2: 0.103114, TP3: 0.070694
Stop Loss: 0.161451
$ARB
Entry: 0.155246 - 0.156283
Targets: TP1: 0.128013, TP2: 0.103114, TP3: 0.070694
Stop Loss: 0.161451
$ARB
40
·
--
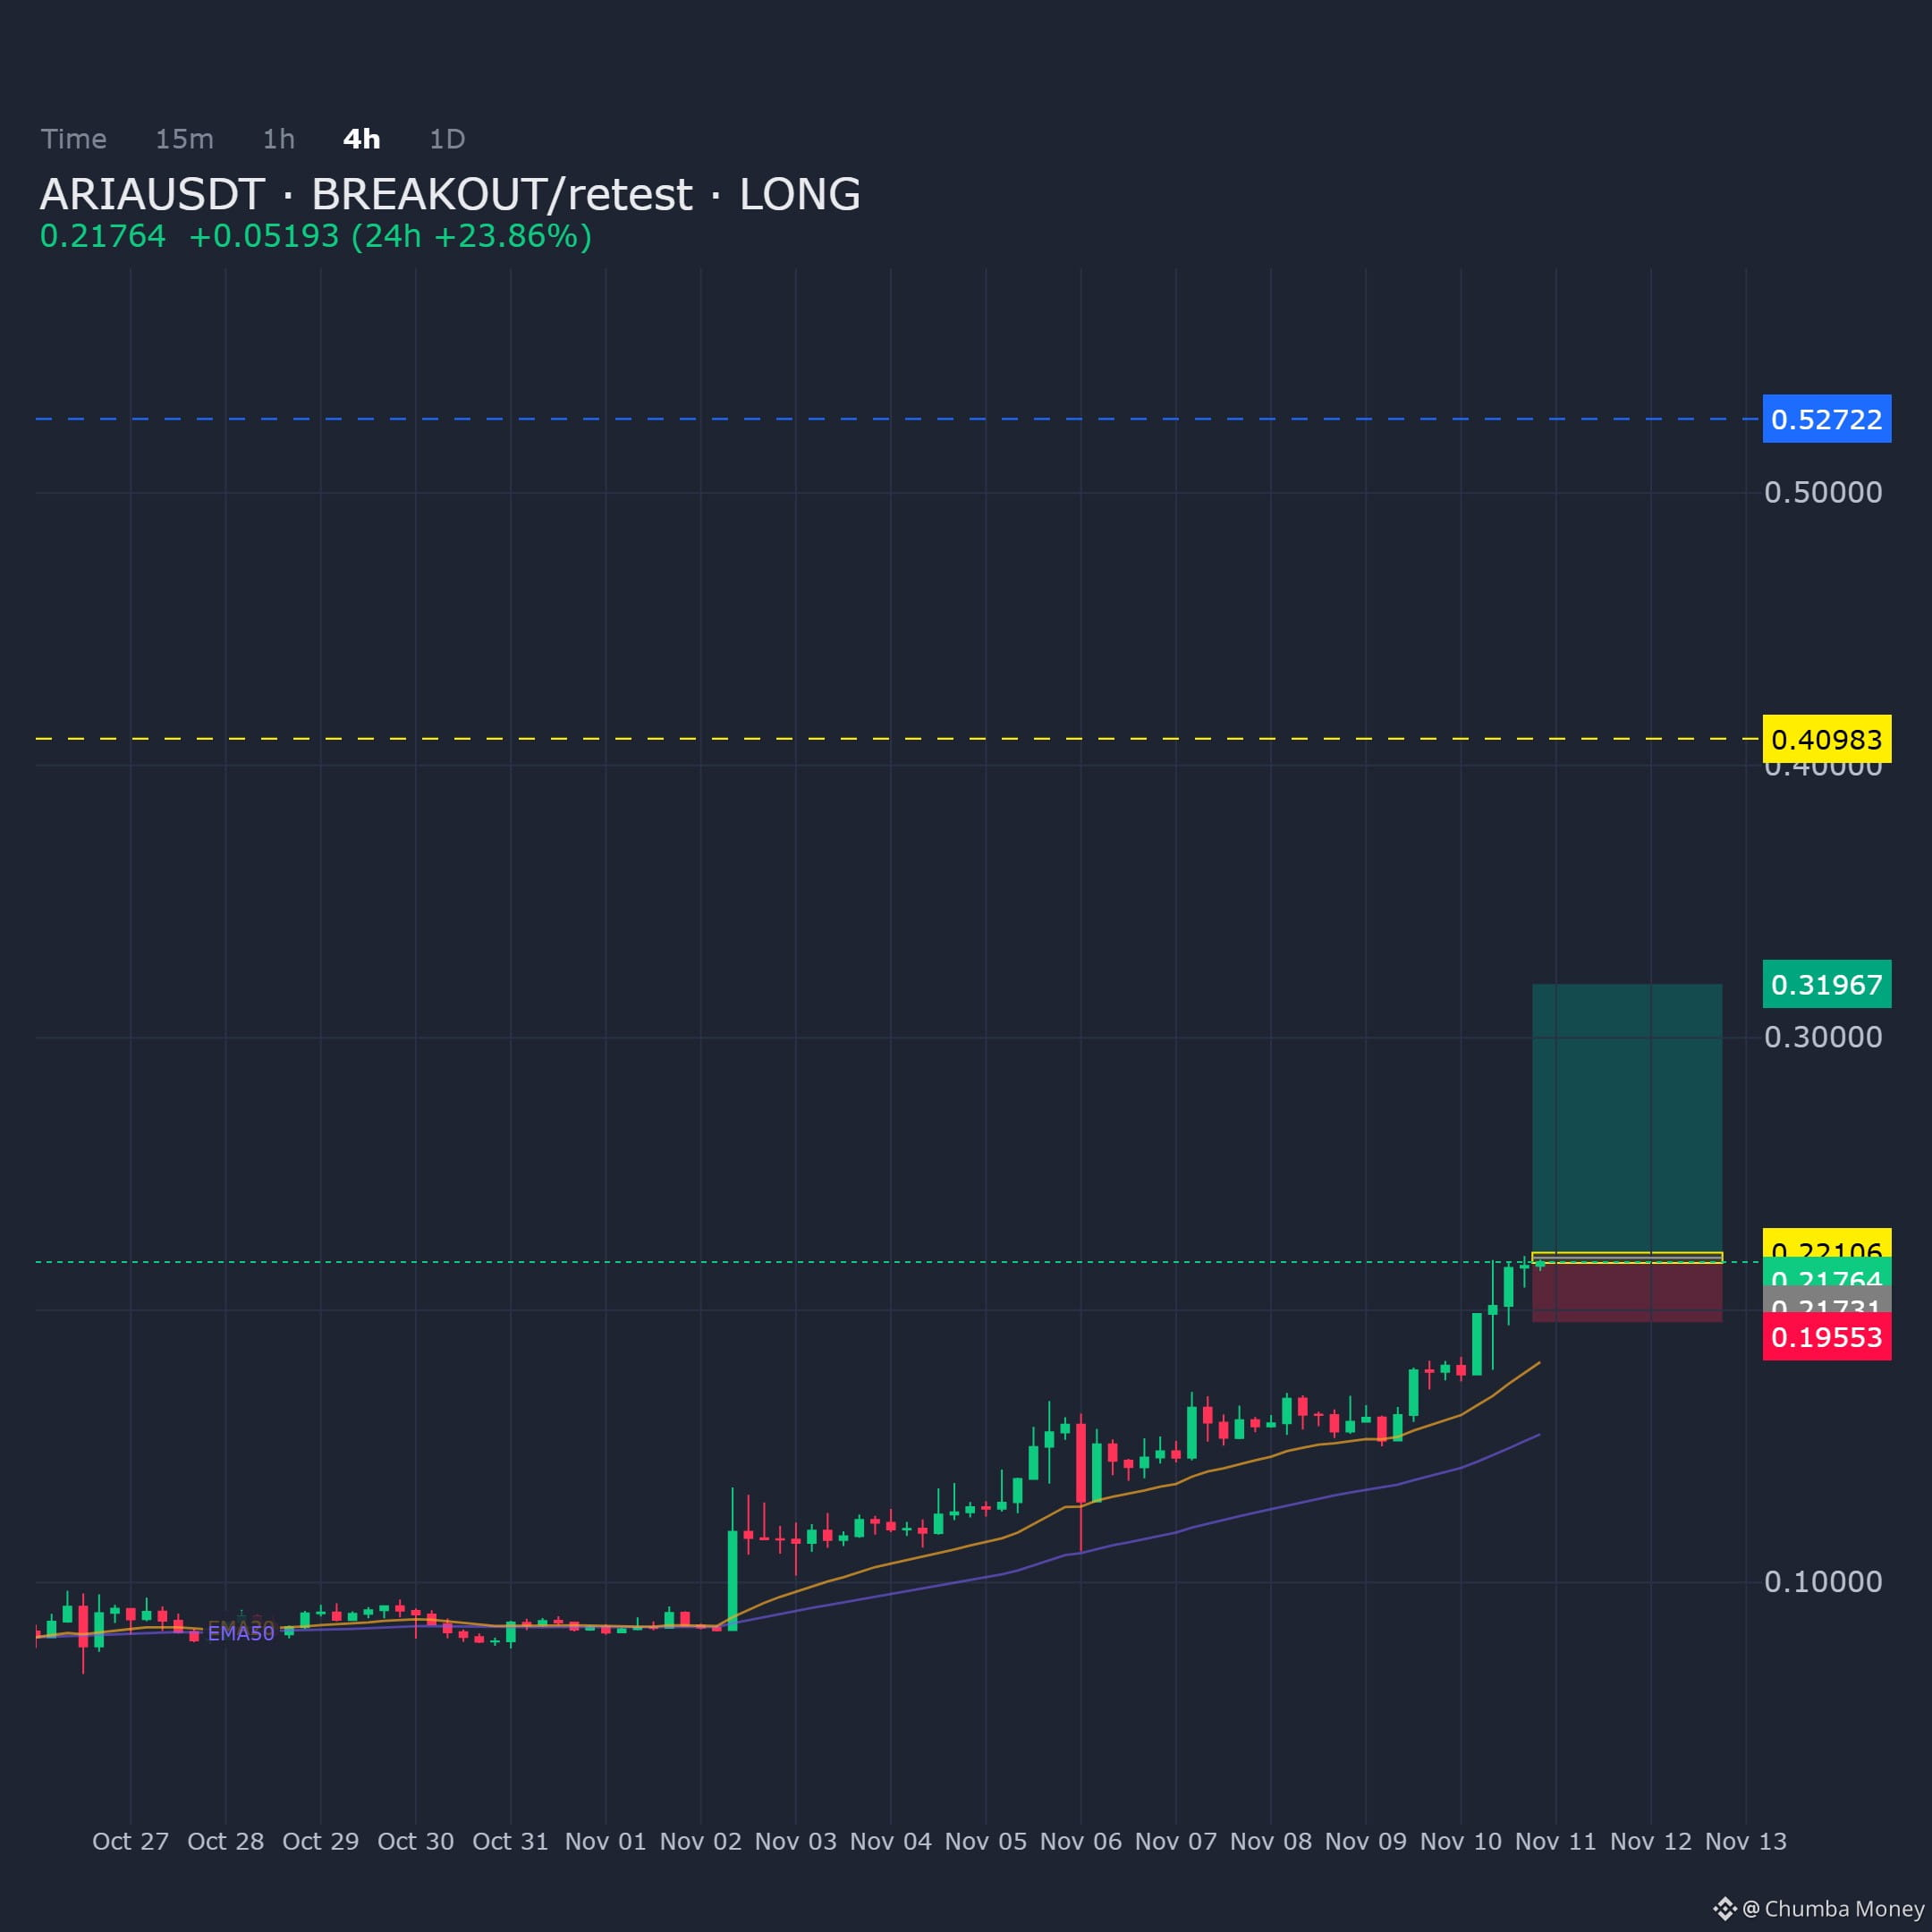
ARIAUSDT on the 4H chart is approaching a key breakout zone, with a retest likely to confirm upward momentum.
Entry: 0.217307 - 0.221064
Targets: TP1: 0.319671, TP2: 0.409827, TP3: 0.527217
Stop Loss: 0.195532
$ARIA
ARIAUSDT on the 4H chart is approaching a key breakout zone, with a retest likely to confirm upward momentum.
Entry: 0.217307 - 0.221064
Targets: TP1: 0.319671, TP2: 0.409827, TP3: 0.527217
Stop Loss: 0.195532
$ARIA
Entry: 0.217307 - 0.221064
Targets: TP1: 0.319671, TP2: 0.409827, TP3: 0.527217
Stop Loss: 0.195532
$ARIA
53
·
--
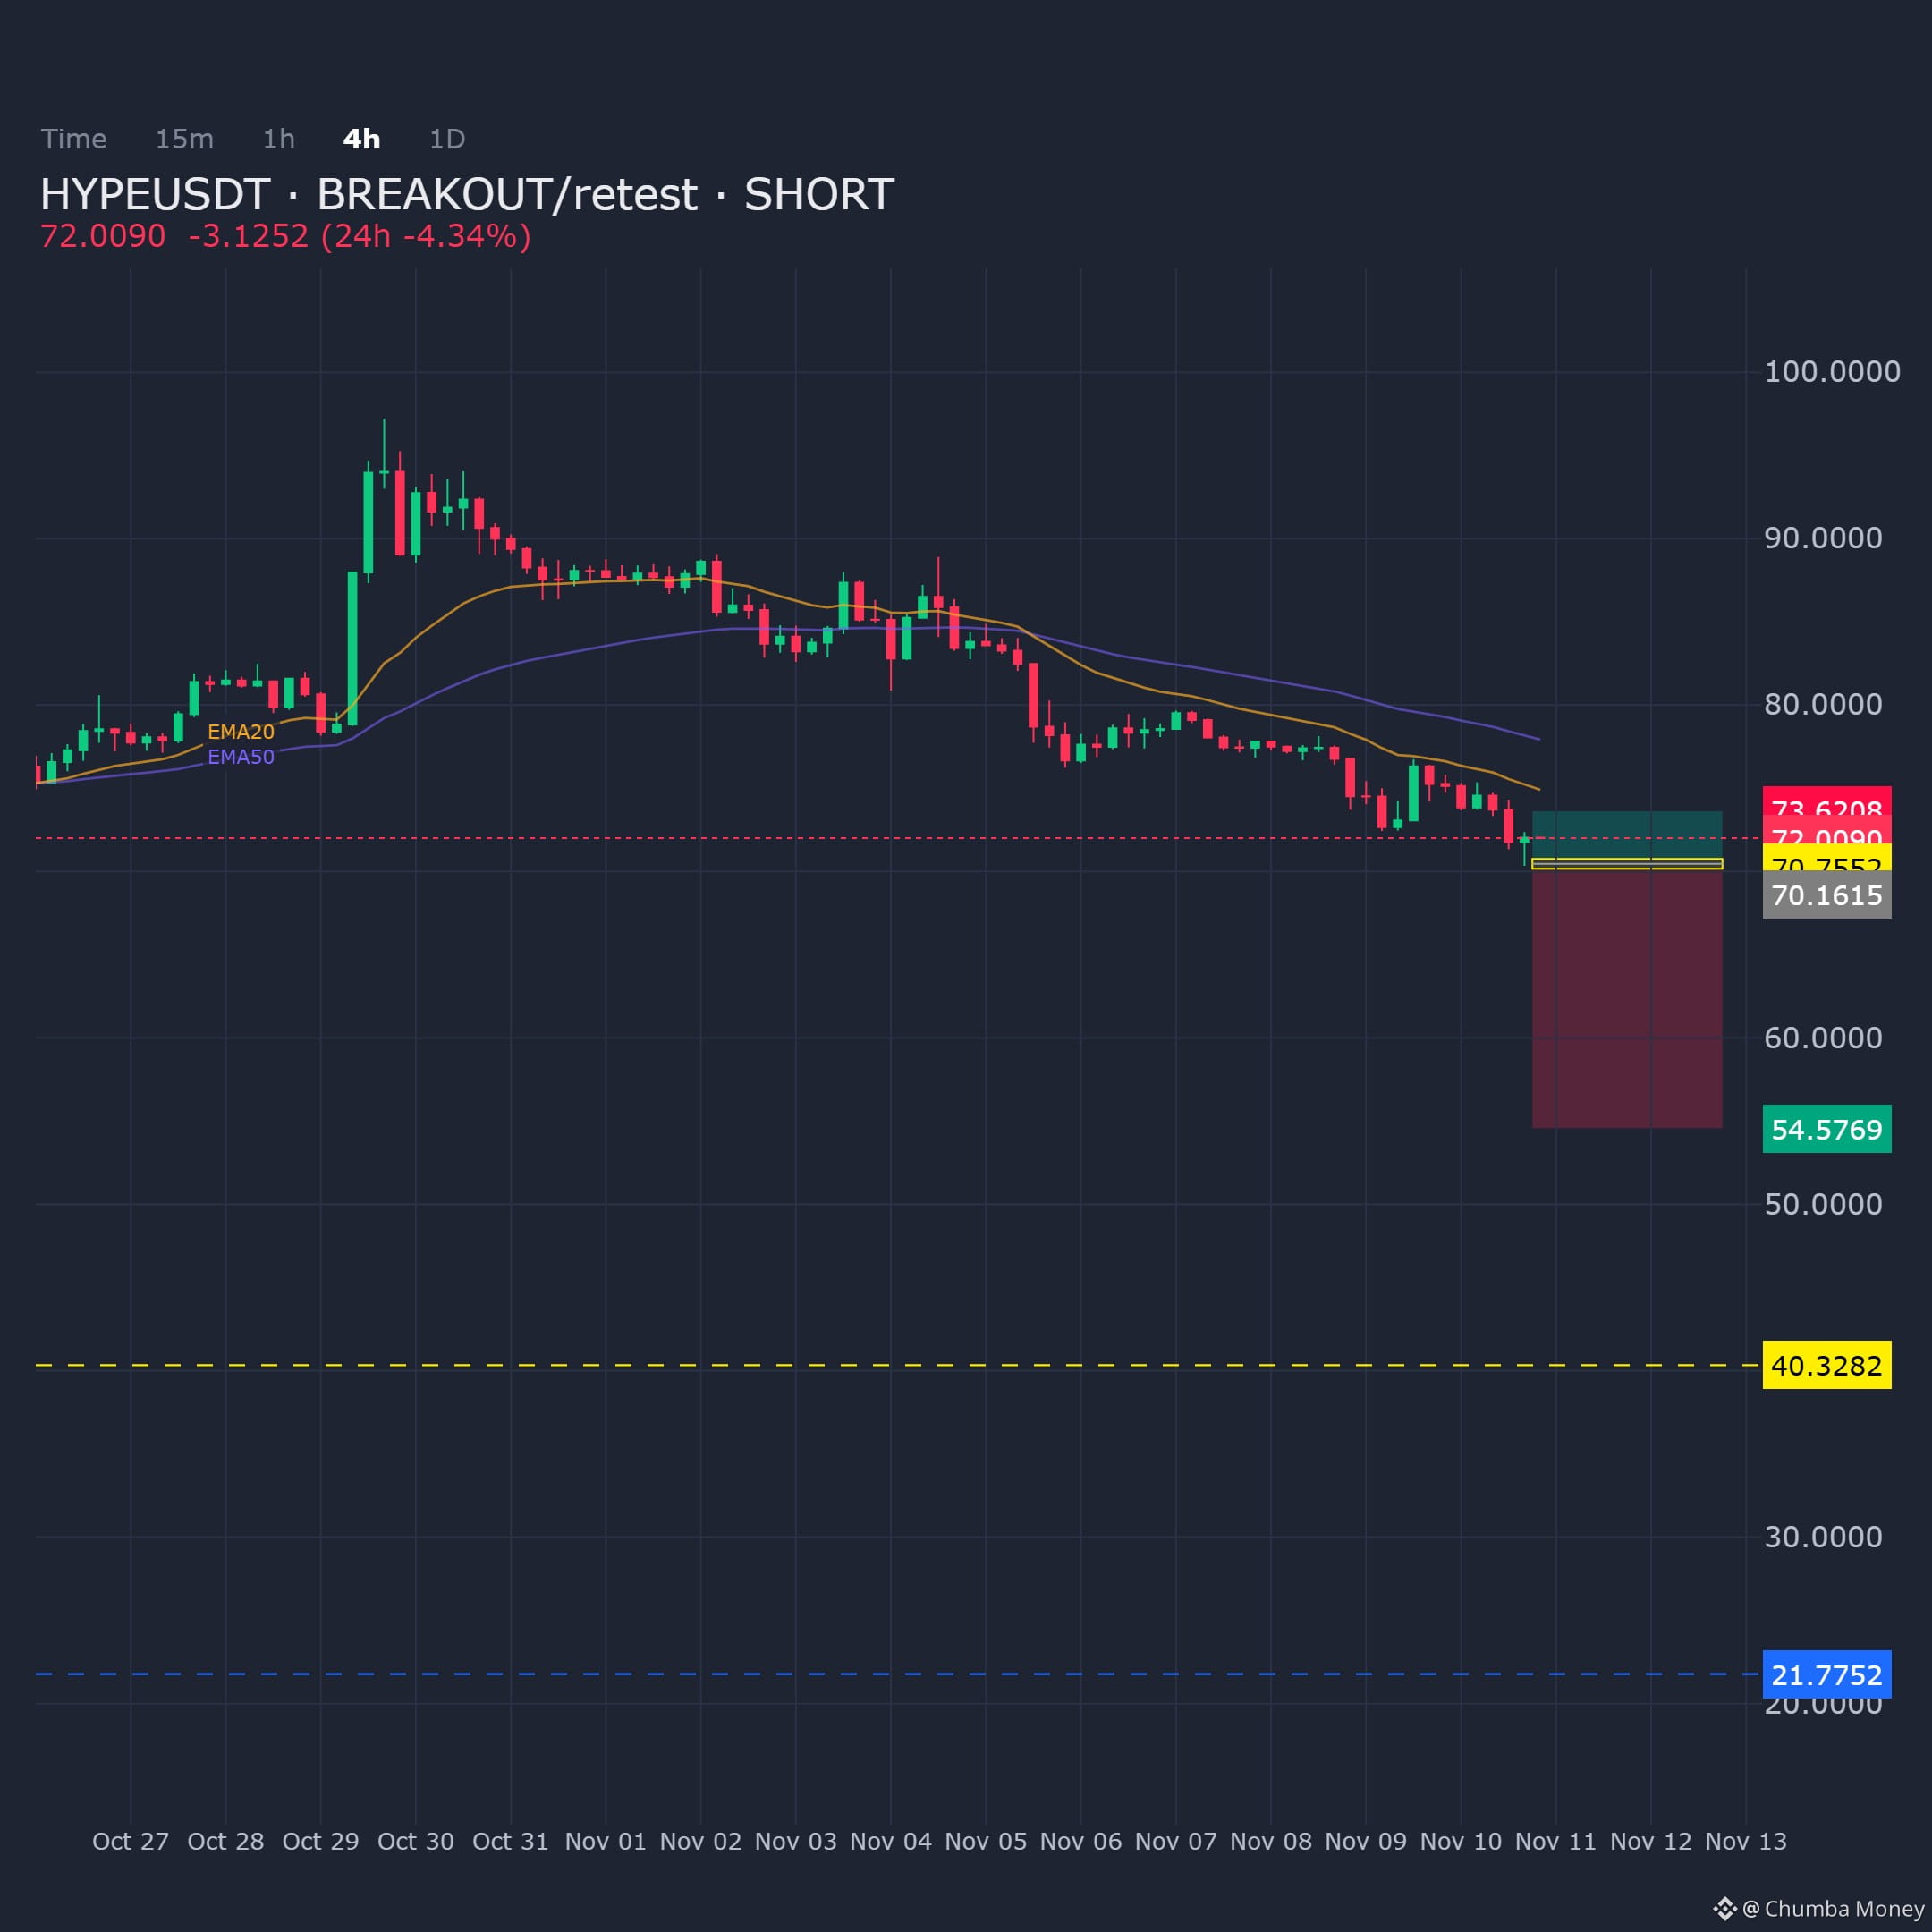
HYPEUSDT (4H) is testing local resistance with bearish momentum setups forming on the retest. A lower-timeframe breakout fail suggests rejection for a short bias.
Entry: 70.1615 - 70.7552
Targets: TP1: 54.5769, TP2: 40.3282, TP3: 21.7752
Stop Loss: 73.6208
$HYPE
HYPEUSDT (4H) is testing local resistance with bearish momentum setups forming on the retest. A lower-timeframe breakout fail suggests rejection for a short bias.
Entry: 70.1615 - 70.7552
Targets: TP1: 54.5769, TP2: 40.3282, TP3: 21.7752
Stop Loss: 73.6208
$HYPE
Entry: 70.1615 - 70.7552
Targets: TP1: 54.5769, TP2: 40.3282, TP3: 21.7752
Stop Loss: 73.6208
$HYPE
32
·
--
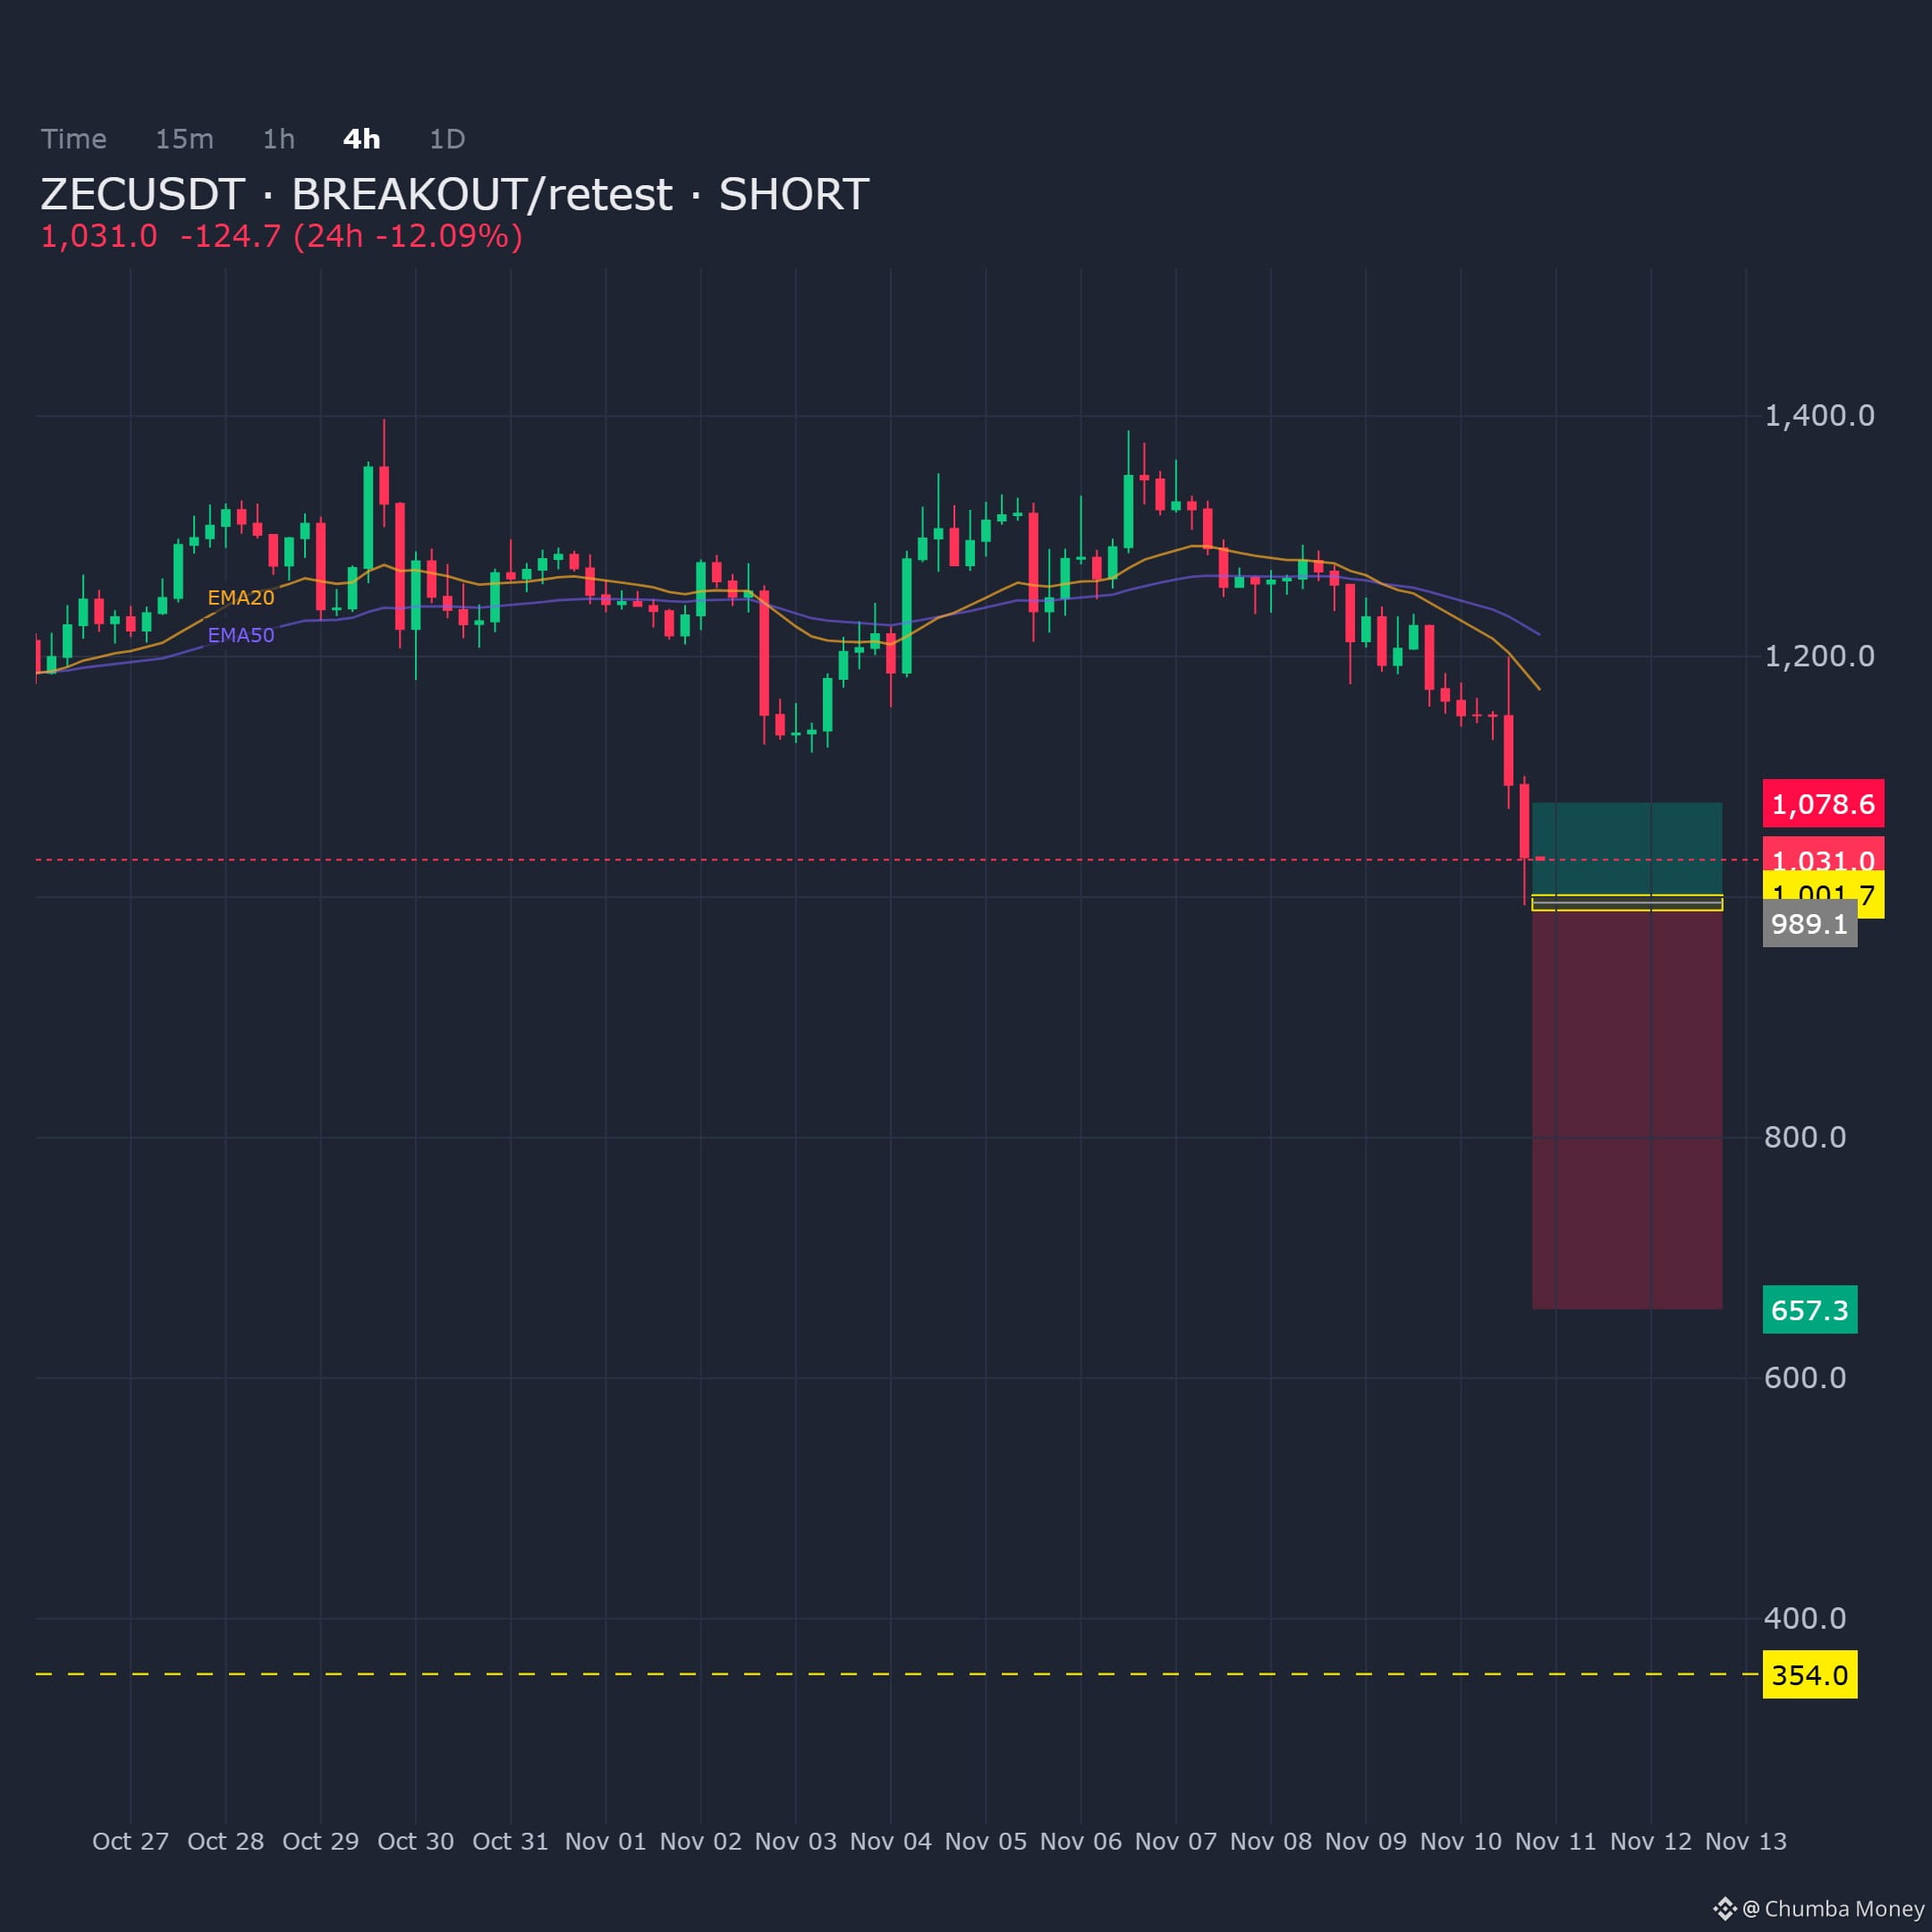
ZECUSDT on the 4H timeframe shows price pushing into supply with a short bias retained from this area.
Entry: 989.07 - 1001.7
Targets: TP1: 657.3, TP2: 353.97, TP3: 353.97
Stop Loss: 1078.6
$ZEC
ZECUSDT on the 4H timeframe shows price pushing into supply with a short bias retained from this area.
Entry: 989.07 - 1001.7
Targets: TP1: 657.3, TP2: 353.97, TP3: 353.97
Stop Loss: 1078.6
$ZEC
Entry: 989.07 - 1001.7
Targets: TP1: 657.3, TP2: 353.97, TP3: 353.97
Stop Loss: 1078.6
$ZEC
53
·
--
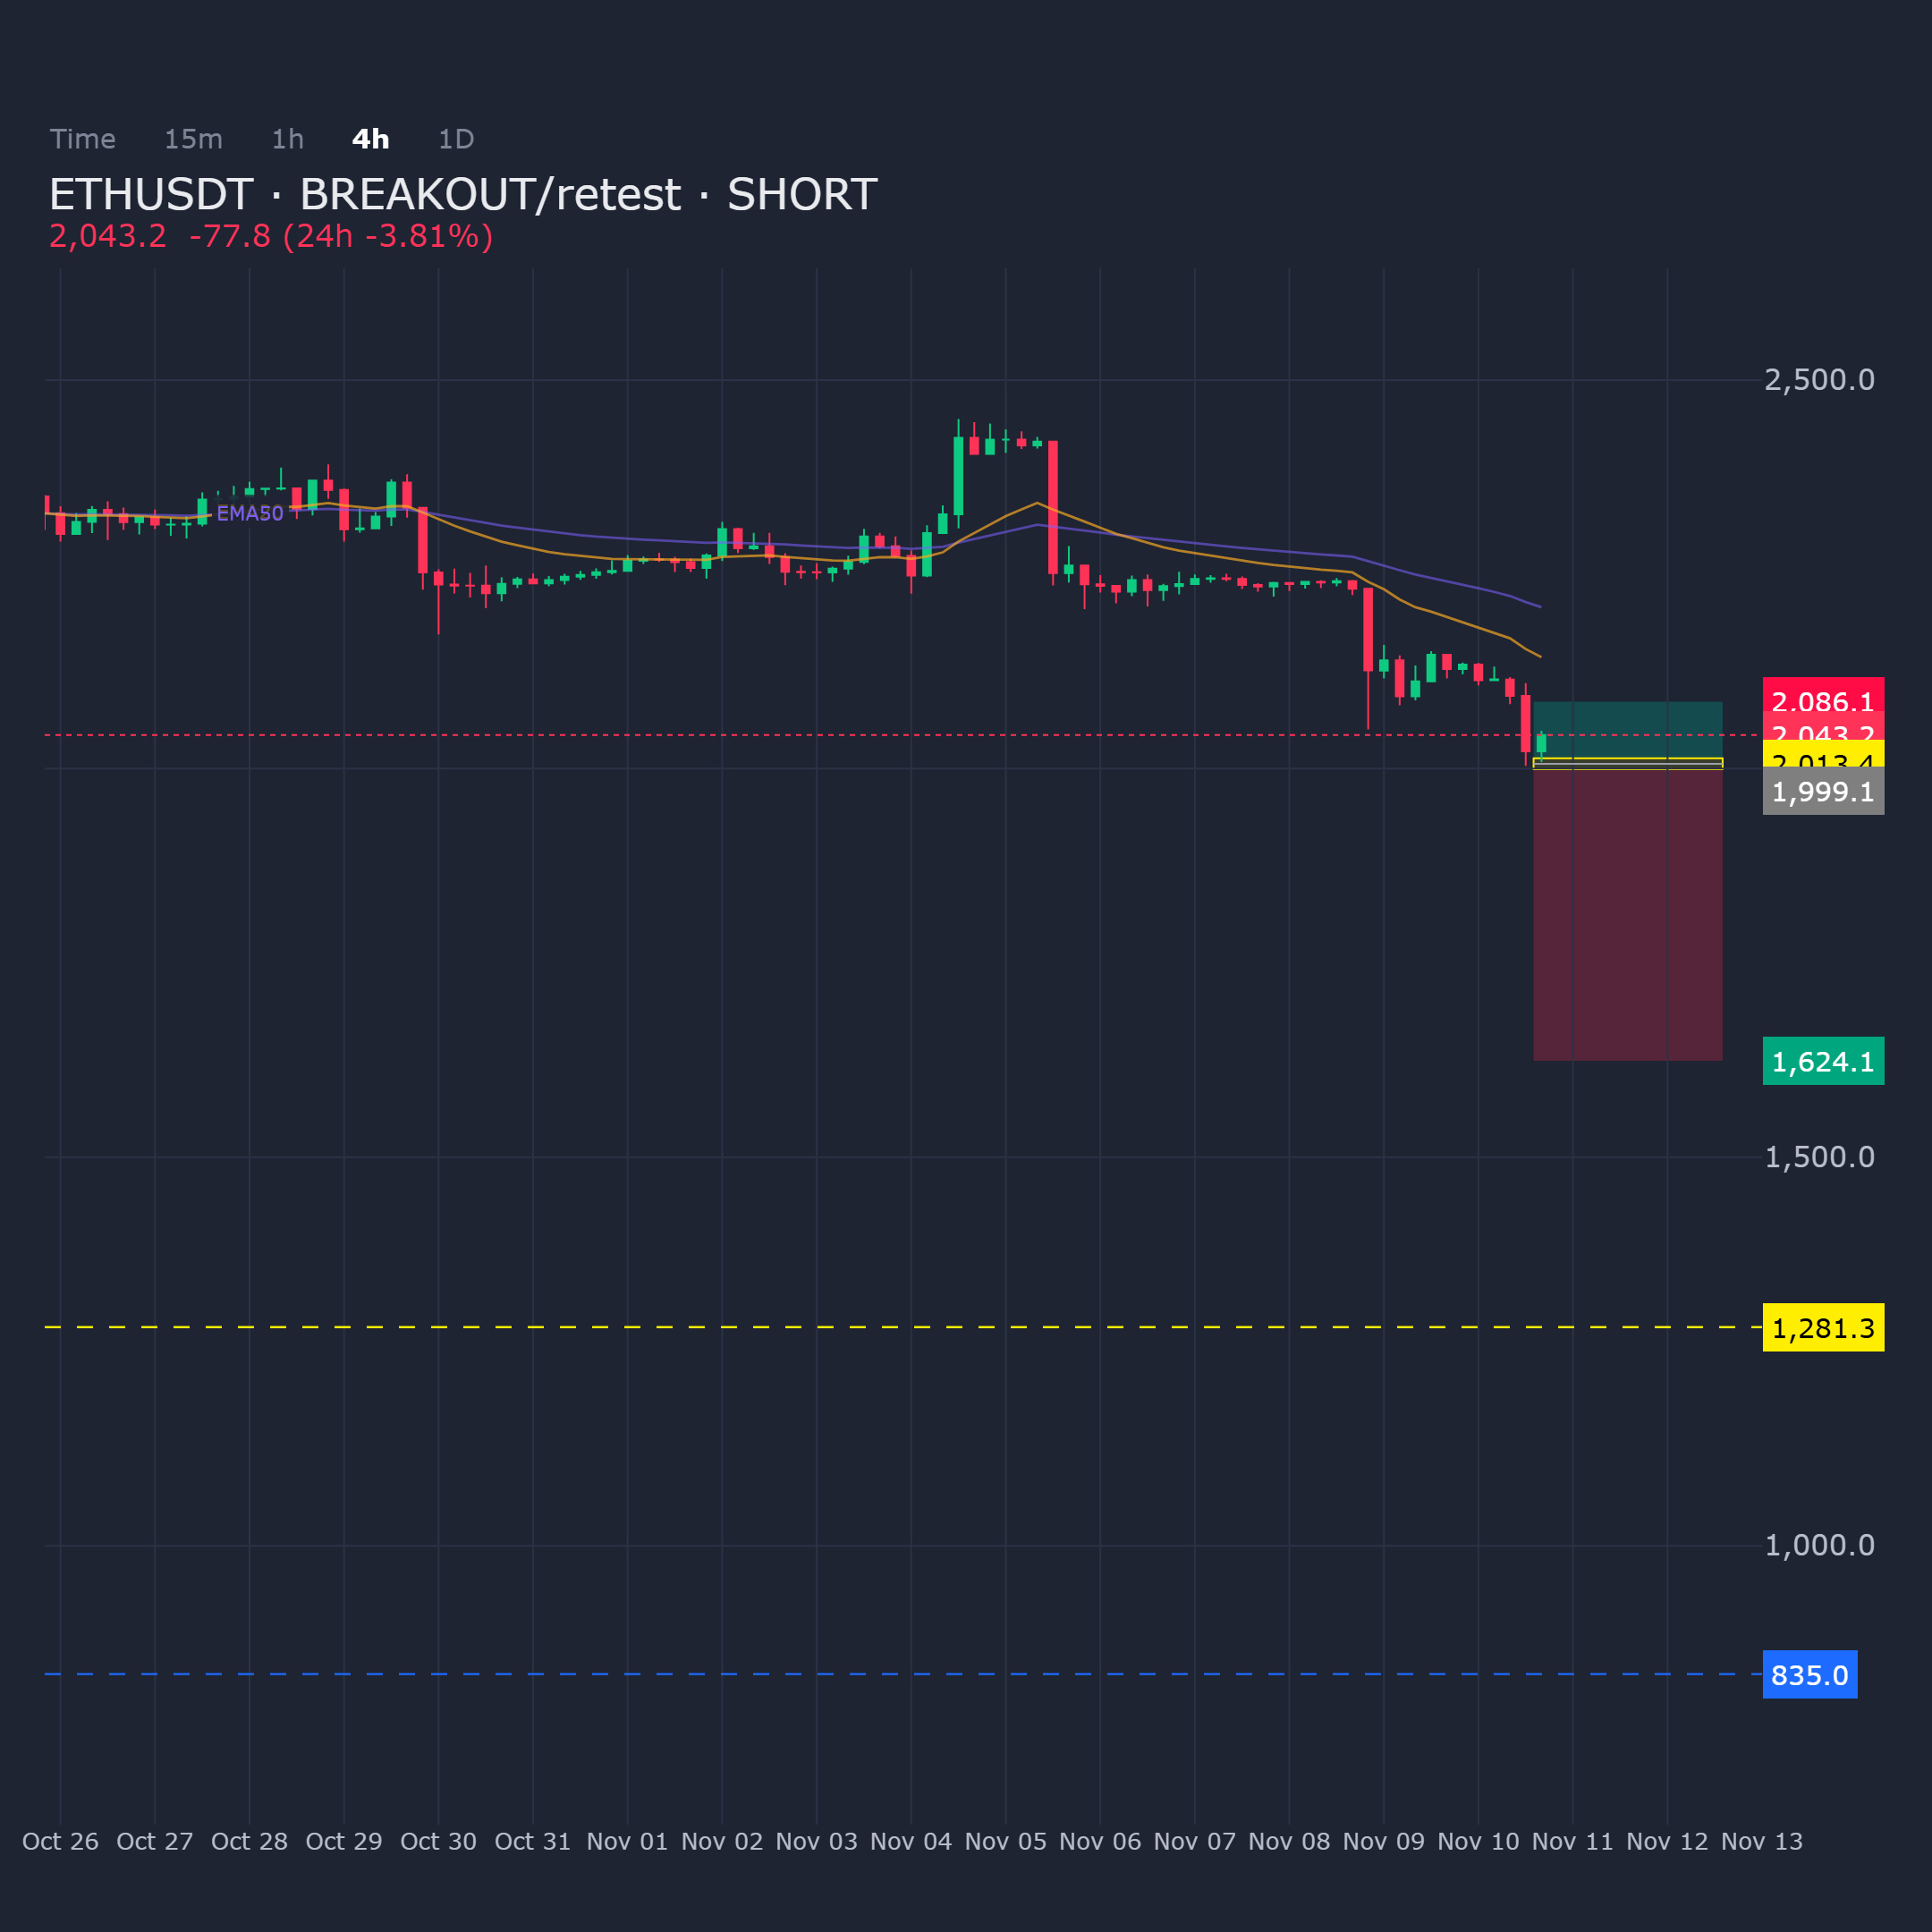
ETHUSDT on the 4H is showing exhaustion at resistance, framing a short opportunity on a breakout followed by retest.
Entry: 1999.1 - 2013.4
Targets: TP1: 1624.1, TP2: 1281.3, TP3: 834.95
Stop Loss: 2086.1
$ETH
ETHUSDT on the 4H is showing exhaustion at resistance, framing a short opportunity on a breakout followed by retest.
Entry: 1999.1 - 2013.4
Targets: TP1: 1624.1, TP2: 1281.3, TP3: 834.95
Stop Loss: 2086.1
$ETH
Entry: 1999.1 - 2013.4
Targets: TP1: 1624.1, TP2: 1281.3, TP3: 834.95
Stop Loss: 2086.1
$ETH
45
Log in to explore more content
Join global crypto users on Binance Square
⚡️ Get latest and useful information about crypto.
💬 Trusted by the world’s largest crypto exchange.
👍 Discover real insights from verified creators.
Email / Phone number
Trending Topics
HotCPIDecemberHikePriced
160,663 views
1,795 Discussing
CPI Market Watch | US CPI Rises 0.4% in October, Hotter Than 0.3% Forecast
Binance News
·28 Likes
·42.3k views
StrategyFaces$2.8BSelloffRiskFromMSCIRemoval
894 views
23 Discussing
AnthropicRejectsIPODelayValuationinQuestion
267,624 views
2,296 Discussing