

Mr_chosen1
1.2k Posts

Mr_chosen1
Report
Block User
2 Following
65 Followers
476 Liked
Posts
All
Quotes
·
--
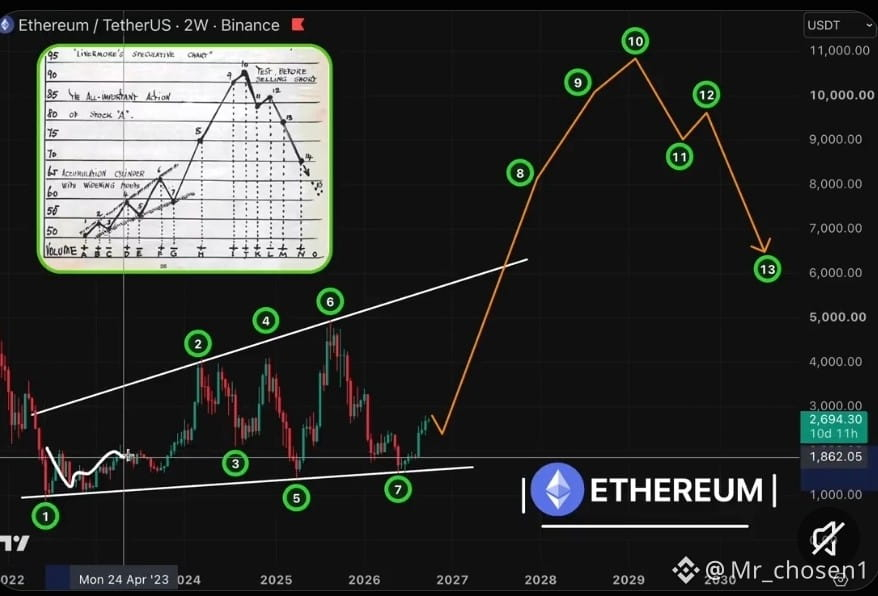
🚨 $ETH JUST ENDED A 5-YEAR ACCUMULATION PHASE
Since 2022, Ethereum has been chopping inside one giant range
7 key touches. Every pump got sold, every dump got bought and range kept widening
This is Jesse Livermore's "Accumulation Cylinder with Widening Mouth", the exact setup that comes right before a full markup phase
Point 7 at ~$1,500 was the final shakeout
Retail capitulated, whales were loading bags
Now $ETH is back at $2,700 and the cylinder is complete
My 2026-2029 macro roadmap:
1. Small pullback to $2,300-$2,400
2. Reclaim of the $4,950 ATH
3. Breakout from the cylinder at ~$6,000
4. Markup to $8,000+
5. Cycle top at $10,000-$11,000
The longer the base, the harder the move
4.5 years of accumulation won't end with a +30% bounce
Most will wait for "confirmation" and FOMO in at $5K
Don't be their exit liquidity
Turn notifications on so you don't miss my next major call
🚨 $ETH JUST ENDED A 5-YEAR ACCUMULATION PHASE
Since 2022, Ethereum has been chopping inside one giant range
7 key touches. Every pump got sold, every dump got bought and range kept widening
This is Jesse Livermore's "Accumulation Cylinder with Widening Mouth", the exact setup that comes right before a full markup phase
Point 7 at ~$1,500 was the final shakeout
Retail capitulated, whales were loading bags
Now $ETH is back at $2,700 and the cylinder is complete
My 2026-2029 macro roadmap:
1. Small pullback to $2,300-$2,400
2. Reclaim of the $4,950 ATH
3. Breakout from the cylinder at ~$6,000
4. Markup to $8,000+
5. Cycle top at $10,000-$11,000
The longer the base, the harder the move
4.5 years of accumulation won't end with a +30% bounce
Most will wait for "confirmation" and FOMO in at $5K
Don't be their exit liquidity
Turn notifications on so you don't miss my next major call
Since 2022, Ethereum has been chopping inside one giant range
7 key touches. Every pump got sold, every dump got bought and range kept widening
This is Jesse Livermore's "Accumulation Cylinder with Widening Mouth", the exact setup that comes right before a full markup phase
Point 7 at ~$1,500 was the final shakeout
Retail capitulated, whales were loading bags
Now $ETH is back at $2,700 and the cylinder is complete
My 2026-2029 macro roadmap:
1. Small pullback to $2,300-$2,400
2. Reclaim of the $4,950 ATH
3. Breakout from the cylinder at ~$6,000
4. Markup to $8,000+
5. Cycle top at $10,000-$11,000
The longer the base, the harder the move
4.5 years of accumulation won't end with a +30% bounce
Most will wait for "confirmation" and FOMO in at $5K
Don't be their exit liquidity
Turn notifications on so you don't miss my next major call
8
·
--
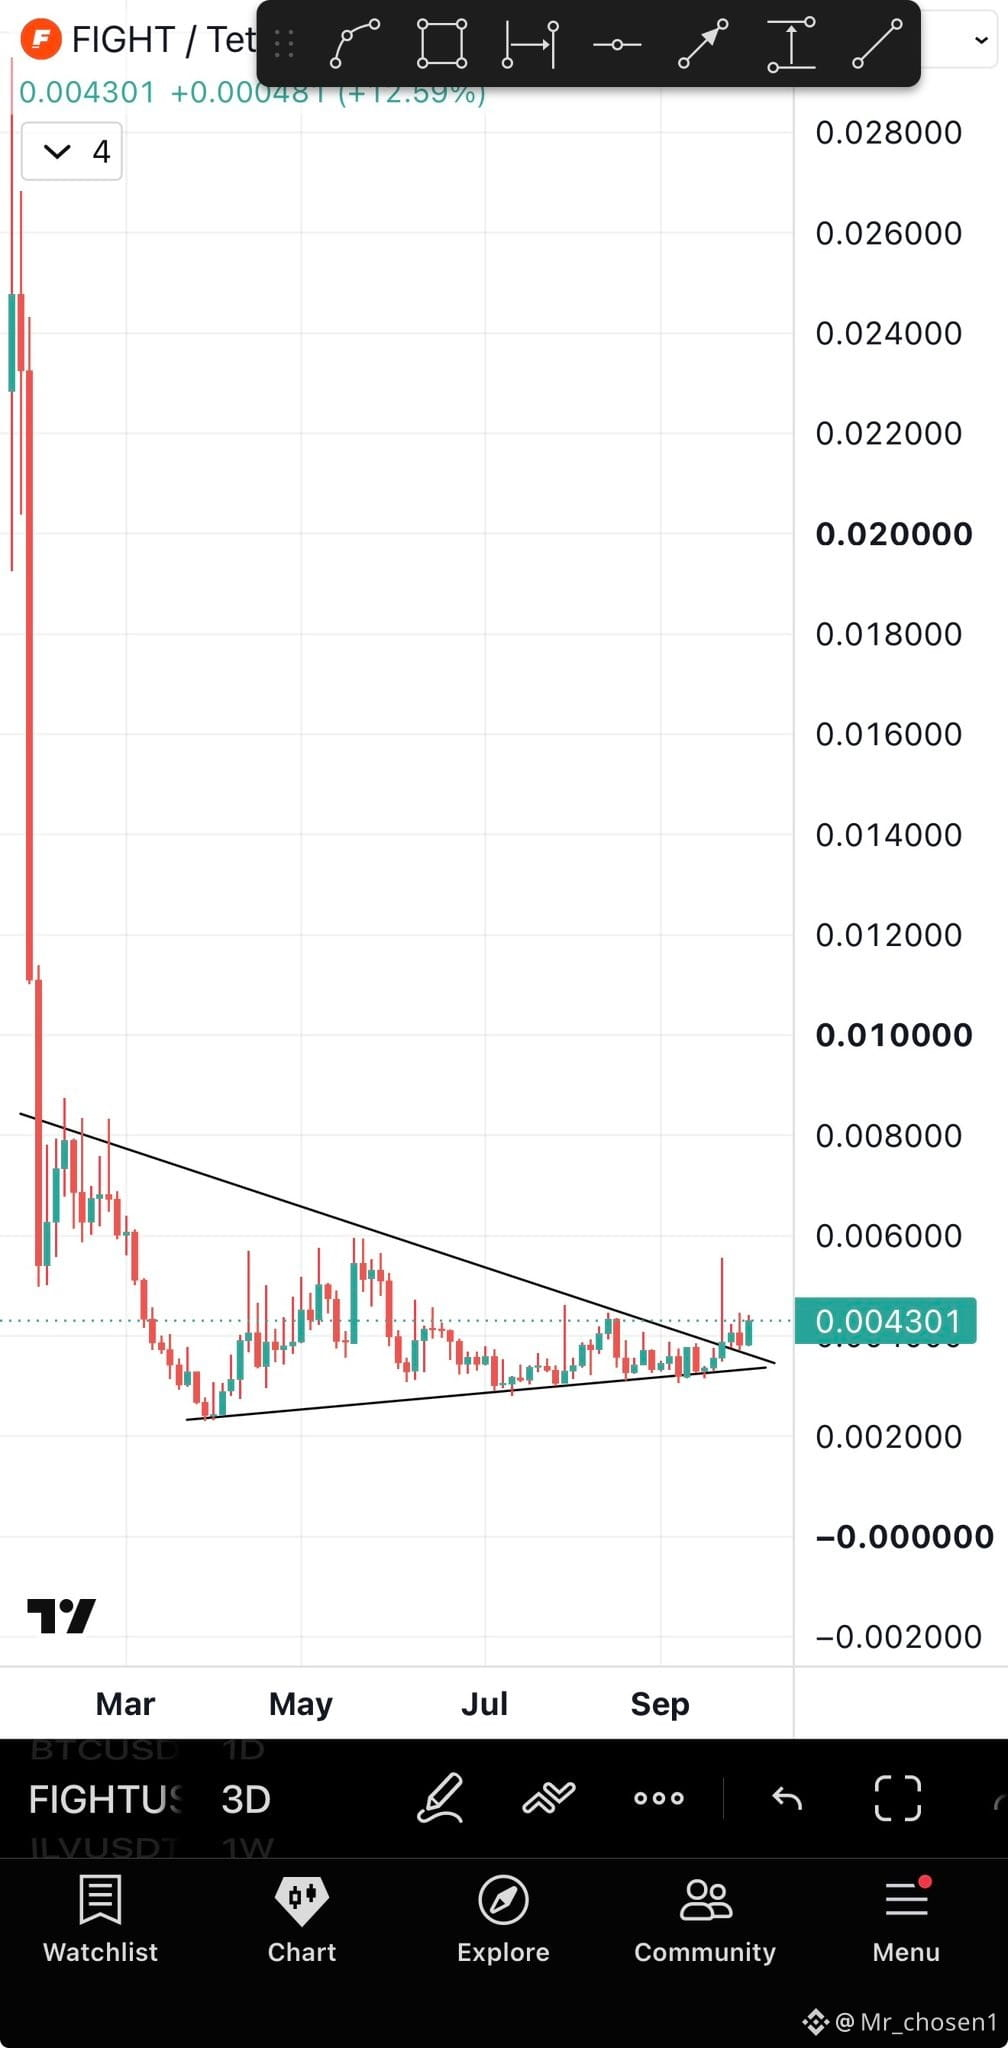
$FIGHT is my next best highest potential play to follow ALICE which gave us 80% within 3 days of entry.
Both follow the gaming narrative & also have the exact same chart and price action.
It’s only a matter of time of time before FIGHT explodes 50-100% from here.
$FIGHT
{future}(FIGHTUSDT)
$FIGHT is my next best highest potential play to follow ALICE which gave us 80% within 3 days of entry.
Both follow the gaming narrative & also have the exact same chart and price action.
It’s only a matter of time of time before FIGHT explodes 50-100% from here.
$FIGHT
Both follow the gaming narrative & also have the exact same chart and price action.
It’s only a matter of time of time before FIGHT explodes 50-100% from here.
$FIGHT
2
·
--
$BTC
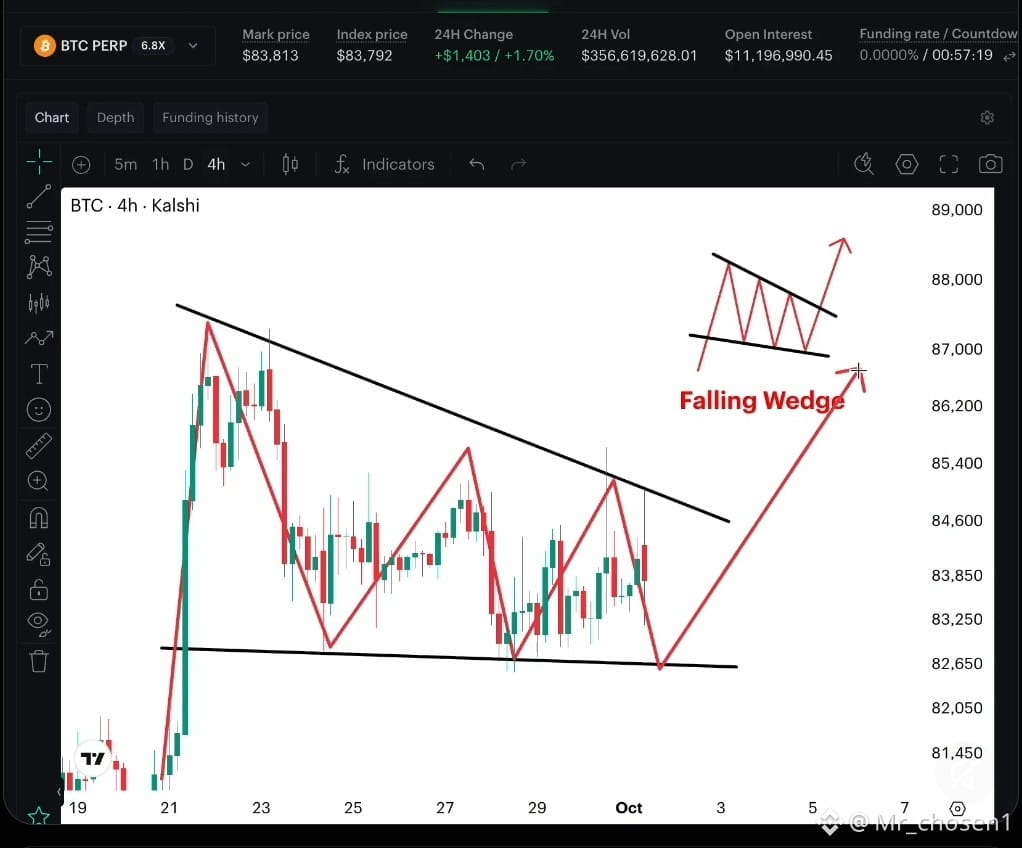
Pretty textbook falling wedge pattern forming here
Waiting for another sweep of 87K soon.
$BTC
{spot}(BTCUSDT)
$BTC
Pretty textbook falling wedge pattern forming here
Waiting for another sweep of 87K soon.
$BTC
Pretty textbook falling wedge pattern forming here
Waiting for another sweep of 87K soon.
$BTC
11
·
--
DeFi has started to gain traction.
Was looking at new alts and found $TART, a DEX on BNB Chain which has swap, staking, and an OTC desk, all in one place.
They also have a separate fee that funds a weekly buyback and burn, decided by a community vote.
Looking at the chart, #TART is forming a bullish falling wedge here.
A breakout above $2.1M level could trigger a rally.
DeFi has started to gain traction.
Was looking at new alts and found $TART, a DEX on BNB Chain which has swap, staking, and an OTC desk, all in one place.
They also have a separate fee that funds a weekly buyback and burn, decided by a community vote.
Looking at the chart, #TART is forming a bullish falling wedge here.
A breakout above $2.1M level could trigger a rally.
Was looking at new alts and found $TART, a DEX on BNB Chain which has swap, staking, and an OTC desk, all in one place.
They also have a separate fee that funds a weekly buyback and burn, decided by a community vote.
Looking at the chart, #TART is forming a bullish falling wedge here.
A breakout above $2.1M level could trigger a rally.
2
·
--
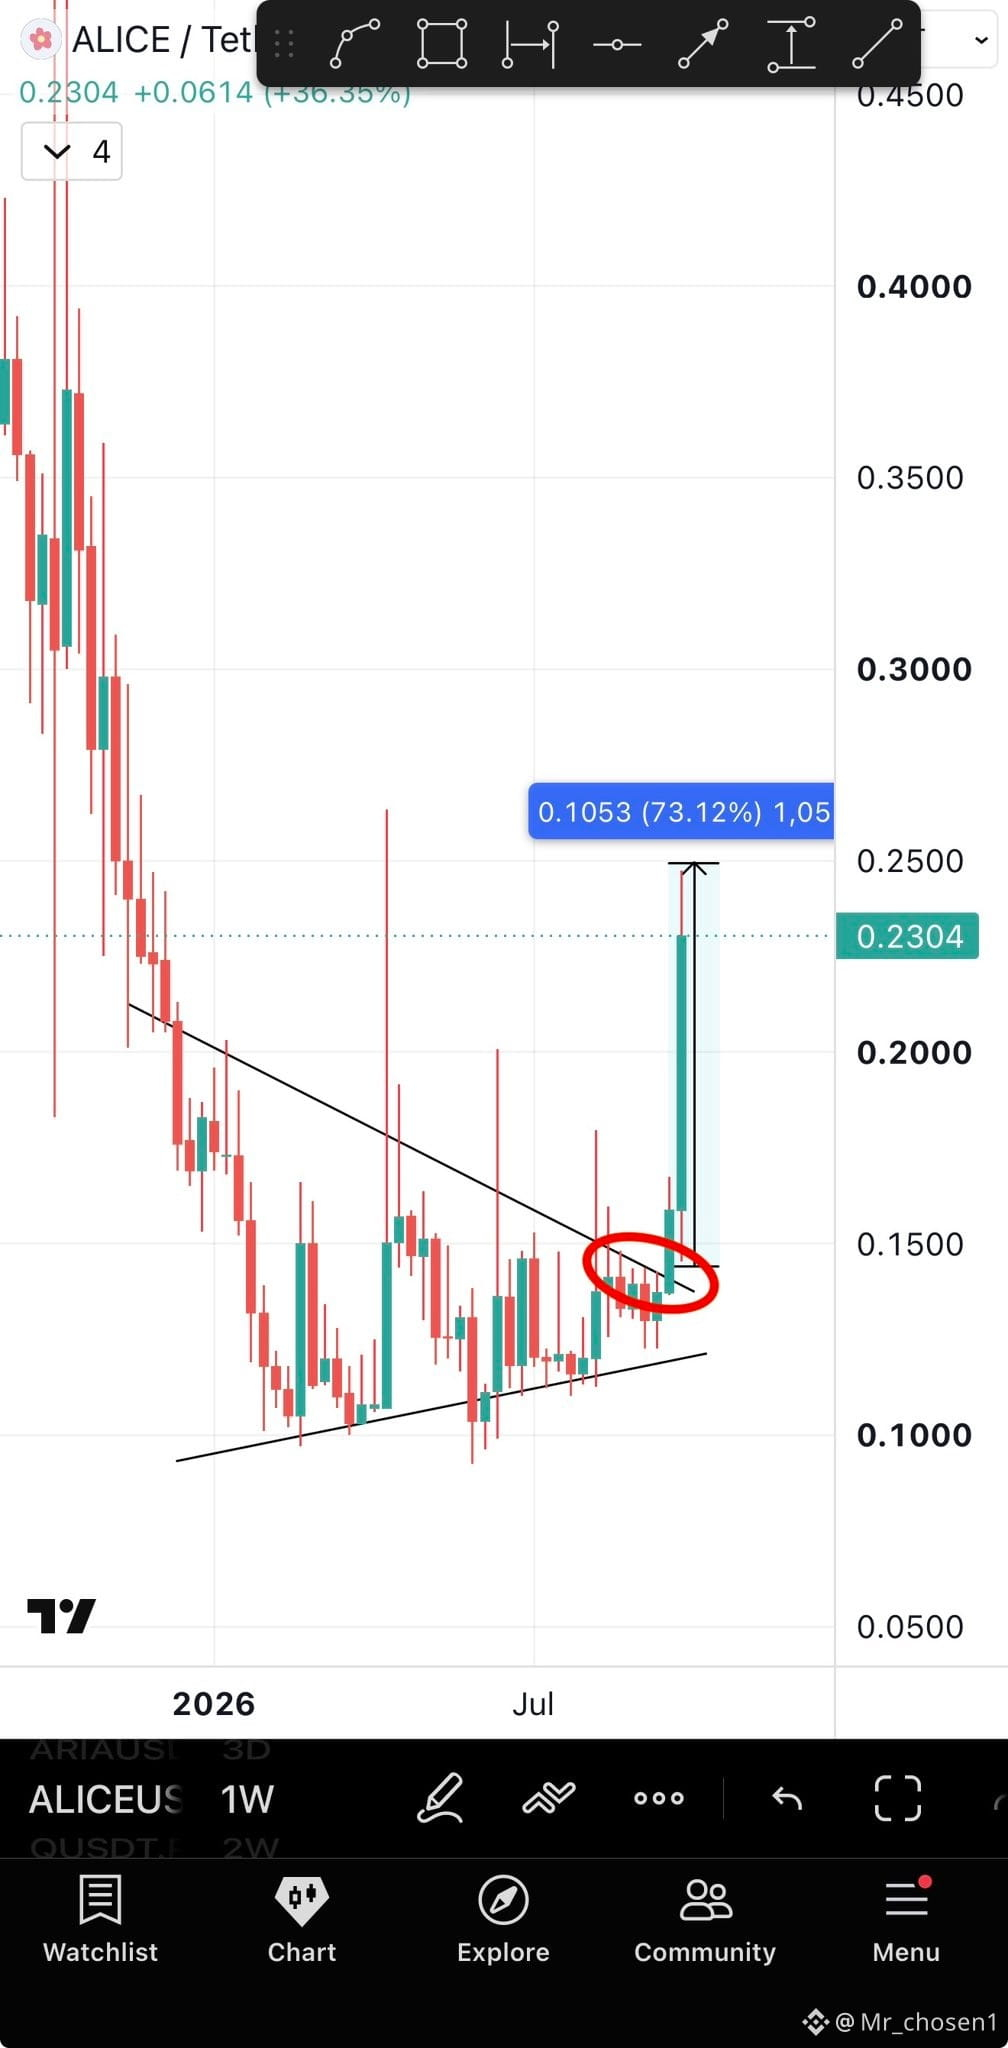
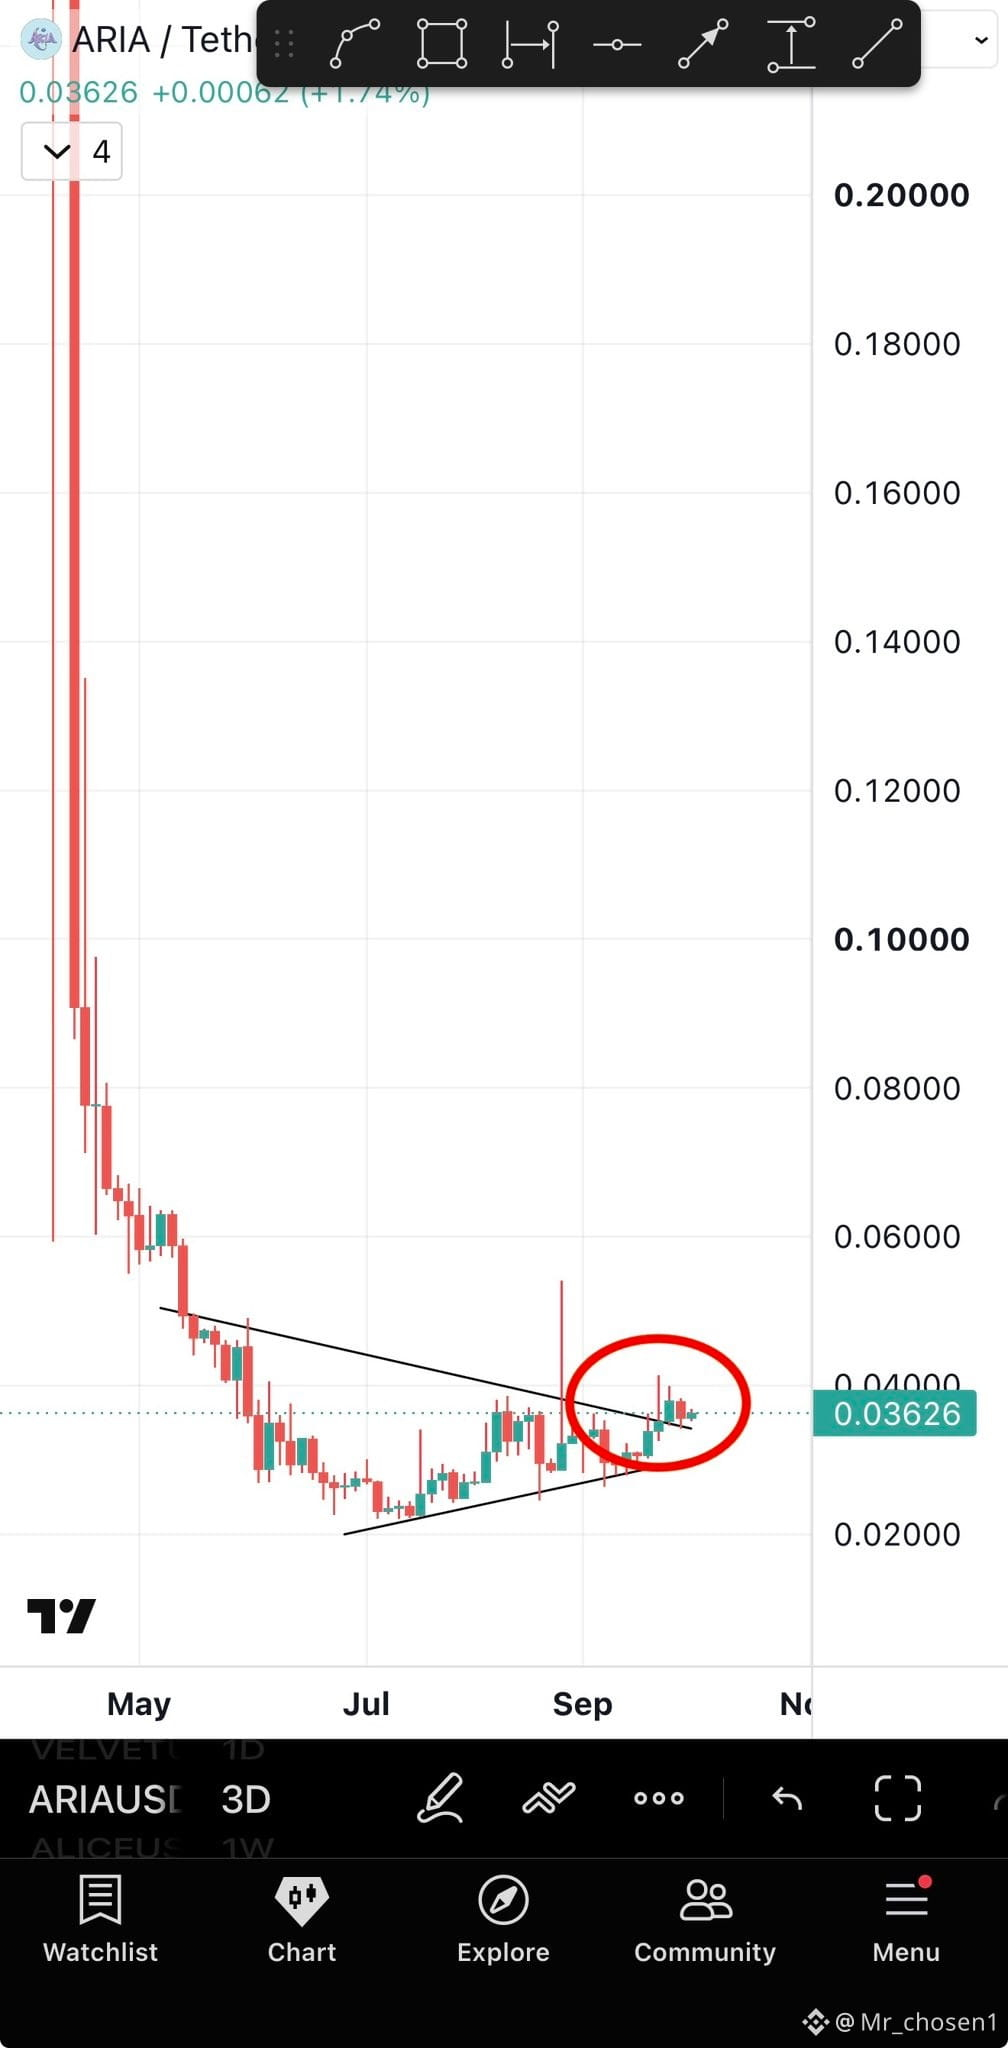
Some people fear retests but I am here to teach you that retests are the best buying opportunities.
Look at the retest entry I shared for you on $ALICE . It’s now up 75% from there.
Now the same thing is happening with $ARIA , it’s still on the retest and is just bouncing from there. A little bit of time and we will see a big explosive candle similar to what Alice is doing today.
You just need to focus, not jump around, & have patience. YOU WILL PRINT.
Some people fear retests but I am here to teach you that retests are the best buying opportunities.
Look at the retest entry I shared for you on $ALICE . It’s now up 75% from there.
Now the same thing is happening with $ARIA , it’s still on the retest and is just bouncing from there. A little bit of time and we will see a big explosive candle similar to what Alice is doing today.
You just need to focus, not jump around, & have patience. YOU WILL PRINT.
Look at the retest entry I shared for you on $ALICE . It’s now up 75% from there.
Now the same thing is happening with $ARIA , it’s still on the retest and is just bouncing from there. A little bit of time and we will see a big explosive candle similar to what Alice is doing today.
You just need to focus, not jump around, & have patience. YOU WILL PRINT.
1
16
·
--
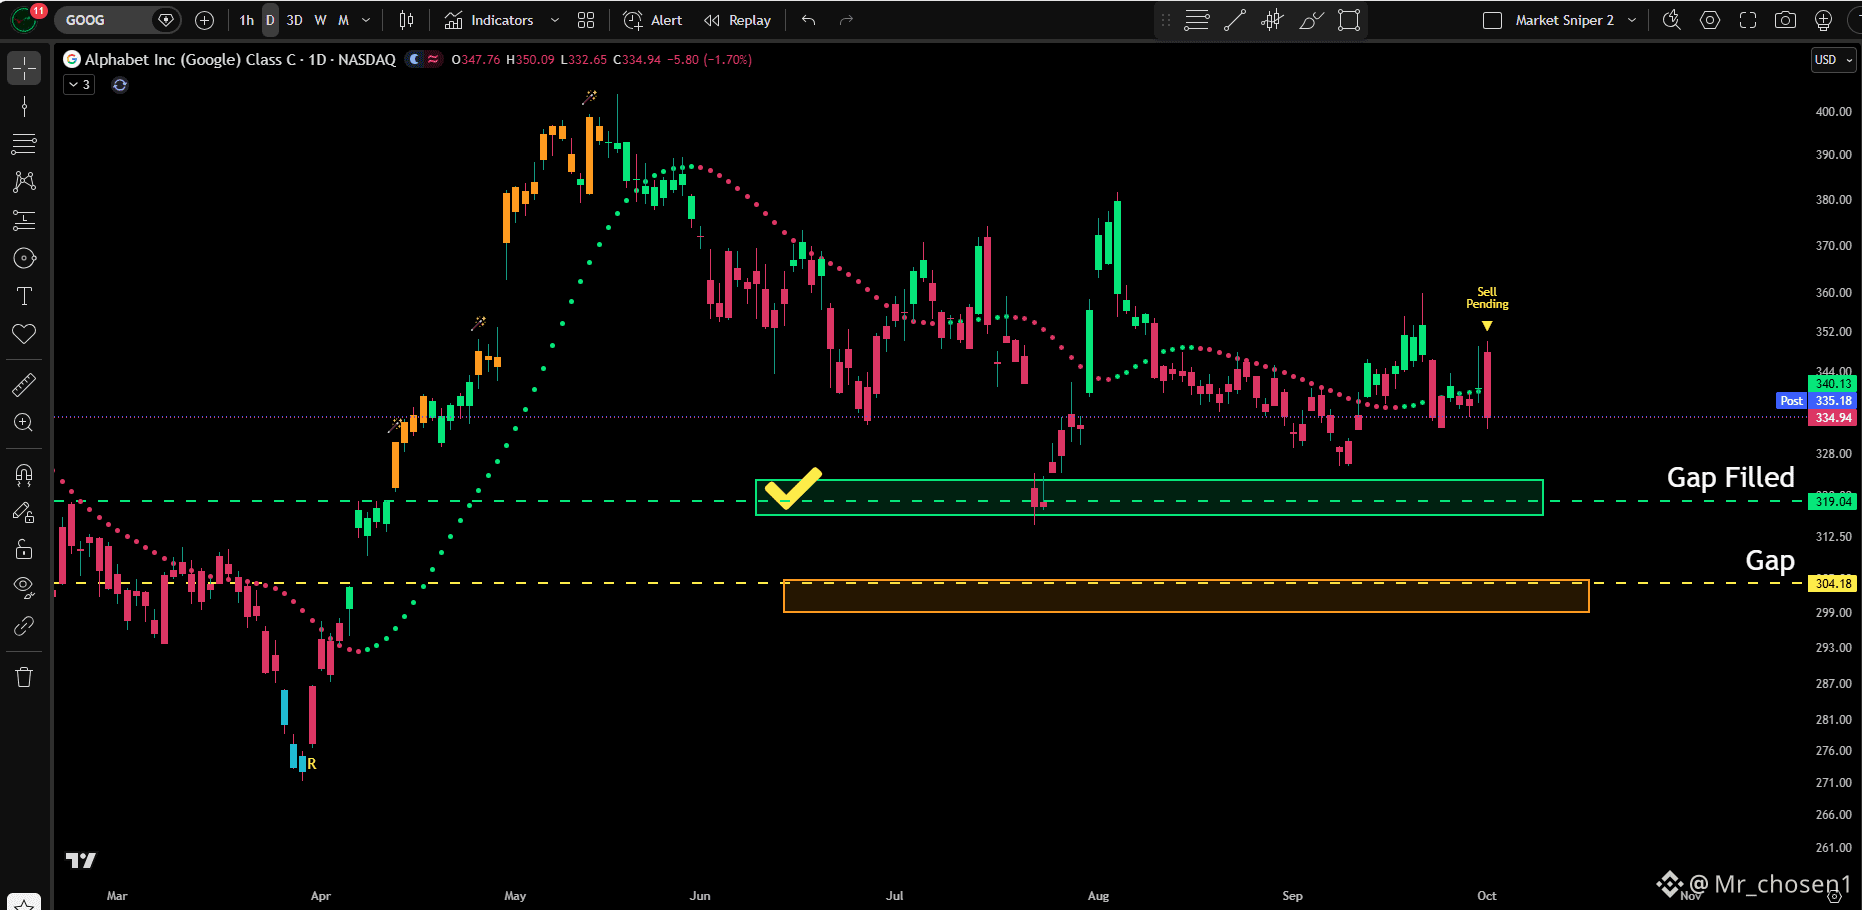
$GOOGL just closed with another sell signal on the daily chart.
Also happened to be a bearish engulfing candle.
Four of five targets have been hit so far.
$GOOGL
{future}(GOOGLUSDT)
$GOOGL just closed with another sell signal on the daily chart.
Also happened to be a bearish engulfing candle.
Four of five targets have been hit so far.
$GOOGL
Also happened to be a bearish engulfing candle.
Four of five targets have been hit so far.
$GOOGL
5
·
--
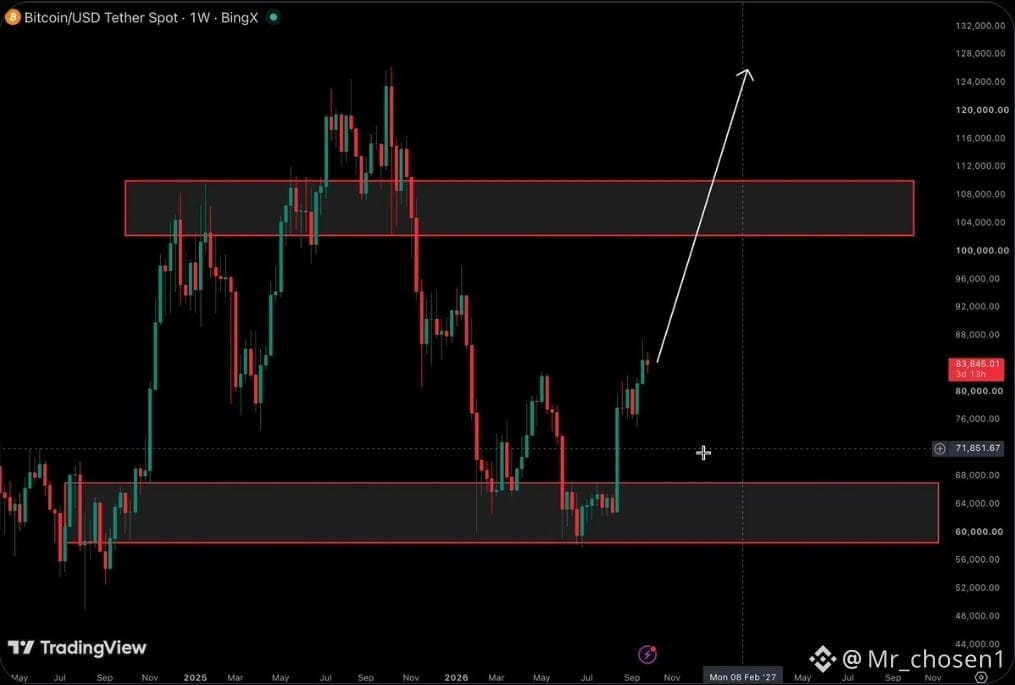
$BTC looks like it’s cooking up the most disrespectful move possible
Shake everyone out around the lows, reclaim the range, then casually walk straight into that $105K–110K levels
Nothing to see here
Just normal market structure
$BTC
{spot}(BTCUSDT)
$BTC looks like it’s cooking up the most disrespectful move possible
Shake everyone out around the lows, reclaim the range, then casually walk straight into that $105K–110K levels
Nothing to see here
Just normal market structure
$BTC
Shake everyone out around the lows, reclaim the range, then casually walk straight into that $105K–110K levels
Nothing to see here
Just normal market structure
$BTC
7
·
--
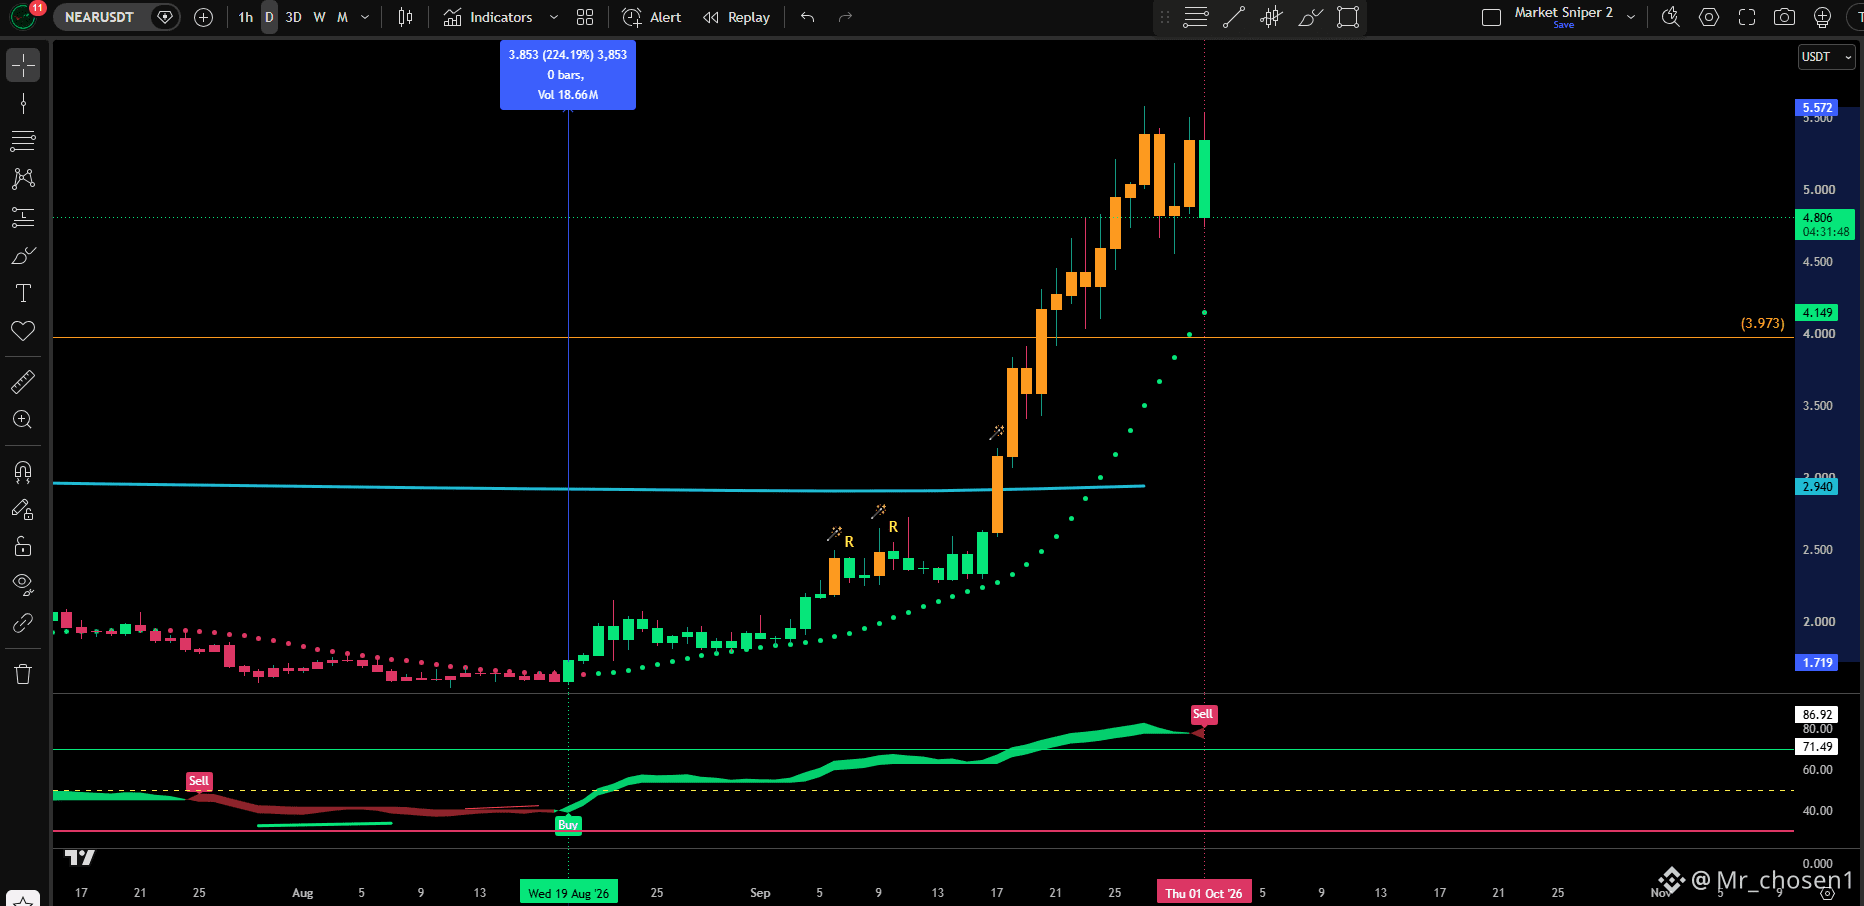
$NEAR was ultra bullish for 15 consecutive days.
From buy signal to top wick: +224%
Pending RSI sell signal suggests a consolidation.
$NEAR
{spot}(NEARUSDT)
$NEAR was ultra bullish for 15 consecutive days.
From buy signal to top wick: +224%
Pending RSI sell signal suggests a consolidation.
$NEAR
From buy signal to top wick: +224%
Pending RSI sell signal suggests a consolidation.
$NEAR
9
·
--
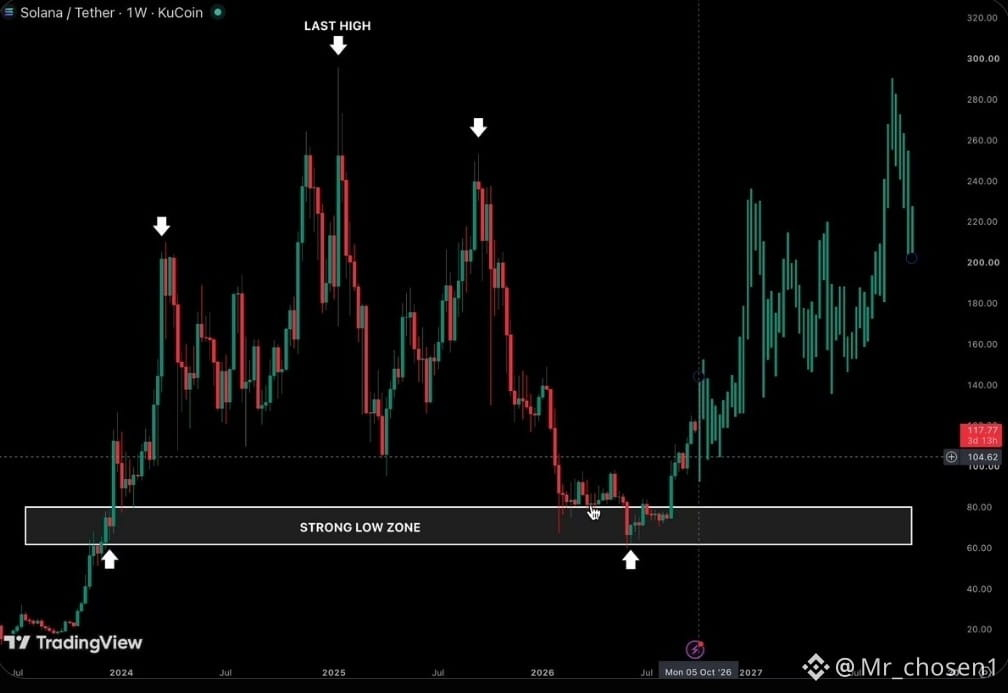
$SOL weekly chart is getting disrespectful.
$60–80 strong demand zone held.
Now we’re back above $100 and sol is starting to look like it wants another crime.
SOL degens know what happens next.
I swear this market teaches the same lesson every cycle.
The trenches never change.
$SOL
{spot}(SOLUSDT)
$SOL weekly chart is getting disrespectful.
$60–80 strong demand zone held.
Now we’re back above $100 and sol is starting to look like it wants another crime.
SOL degens know what happens next.
I swear this market teaches the same lesson every cycle.
The trenches never change.
$SOL
$60–80 strong demand zone held.
Now we’re back above $100 and sol is starting to look like it wants another crime.
SOL degens know what happens next.
I swear this market teaches the same lesson every cycle.
The trenches never change.
$SOL
13
·
--
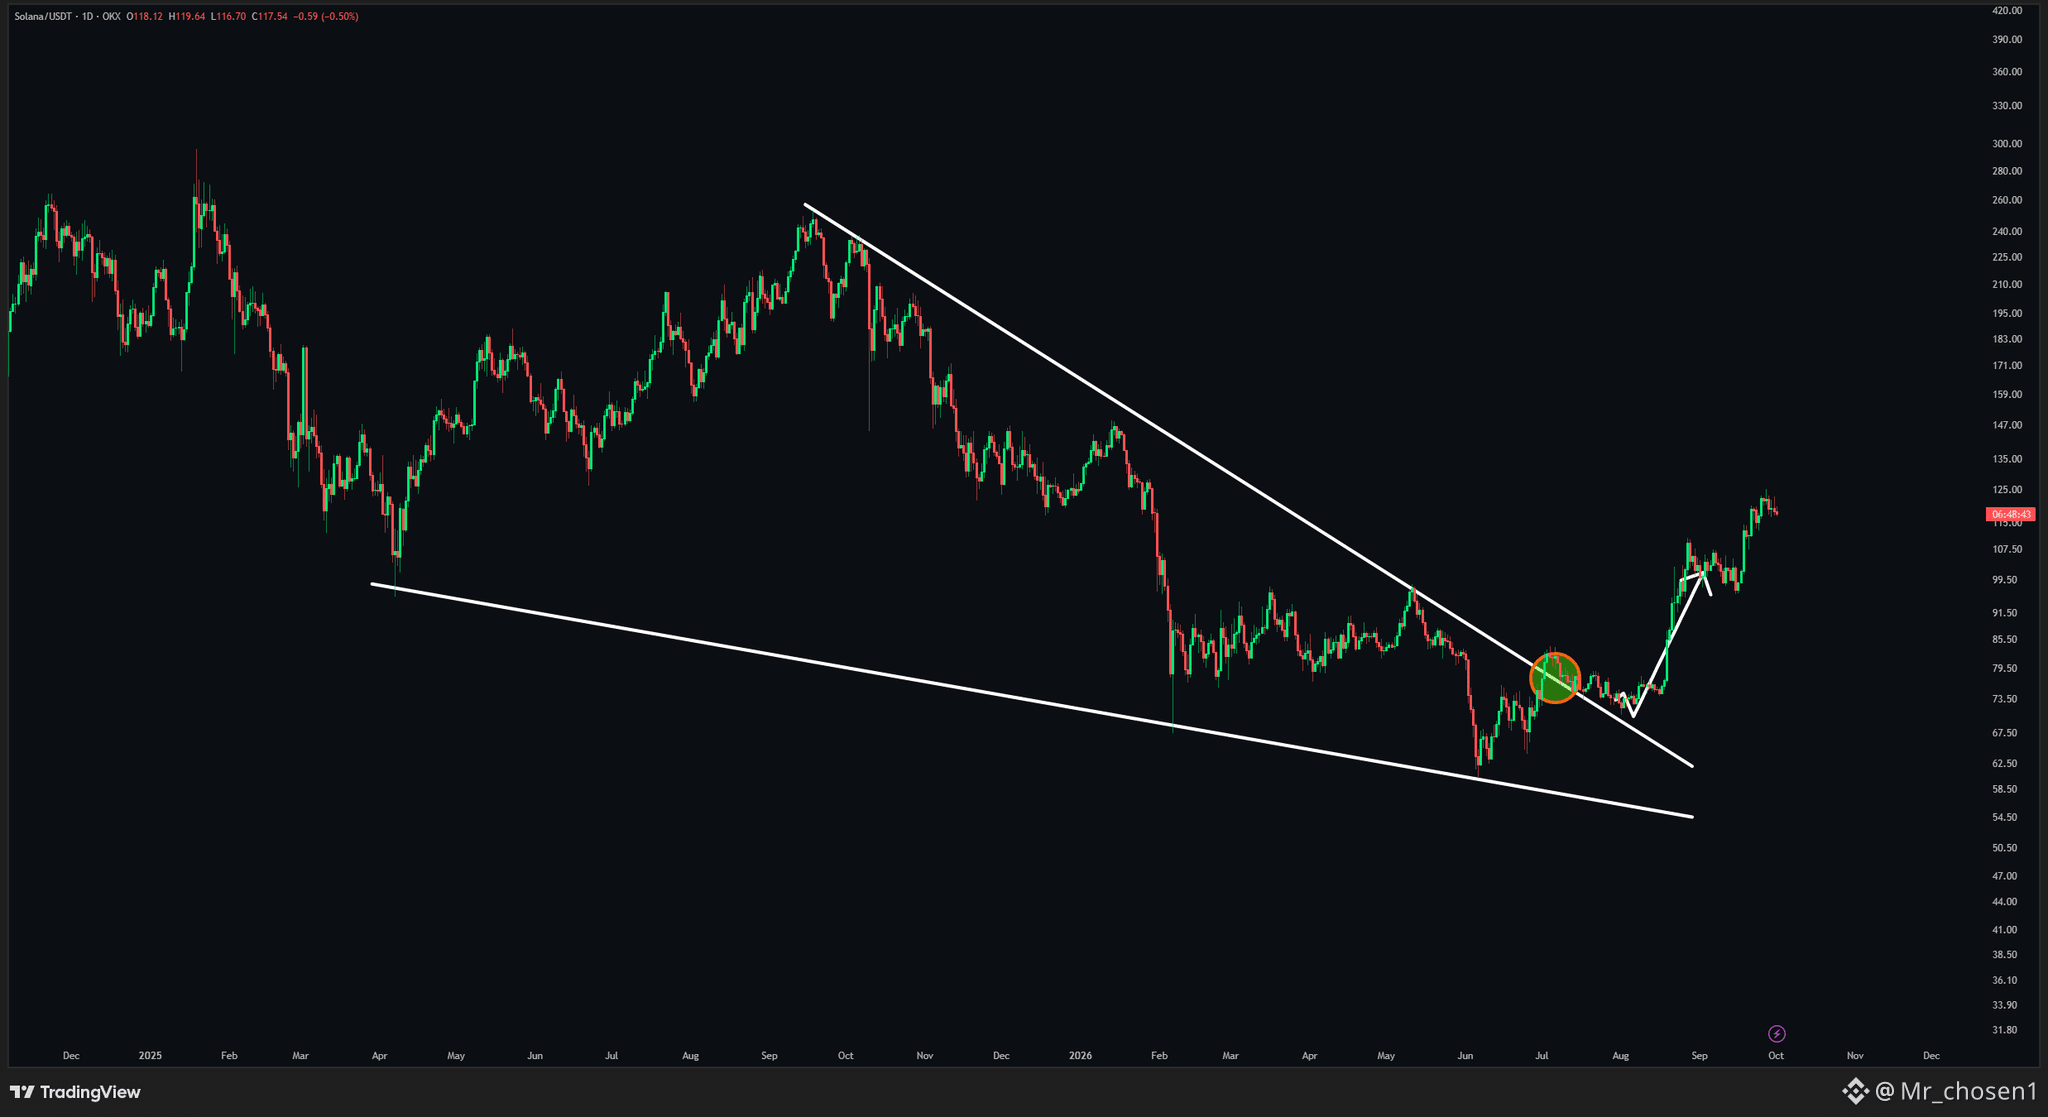
SOL JUST CONFIRMED A MAJOR MACRO BREAKOUT. 👀🚀
$SOL broke above the multi-month descending trendline and successfully flipped it into support.
BREAKOUT ✅
RETEST ✅
SUPPORT FLIP ✅
SOL is now trading around $117, with the next major area near $120+.
MACRO STRUCTURE IS TURNING BULLISH. 🔥
$SOL
{spot}(SOLUSDT)
SOL JUST CONFIRMED A MAJOR MACRO BREAKOUT. 👀🚀
$SOL broke above the multi-month descending trendline and successfully flipped it into support.
BREAKOUT ✅
RETEST ✅
SUPPORT FLIP ✅
SOL is now trading around $117, with the next major area near $120+.
MACRO STRUCTURE IS TURNING BULLISH. 🔥
$SOL
$SOL broke above the multi-month descending trendline and successfully flipped it into support.
BREAKOUT ✅
RETEST ✅
SUPPORT FLIP ✅
SOL is now trading around $117, with the next major area near $120+.
MACRO STRUCTURE IS TURNING BULLISH. 🔥
$SOL
7
·
--
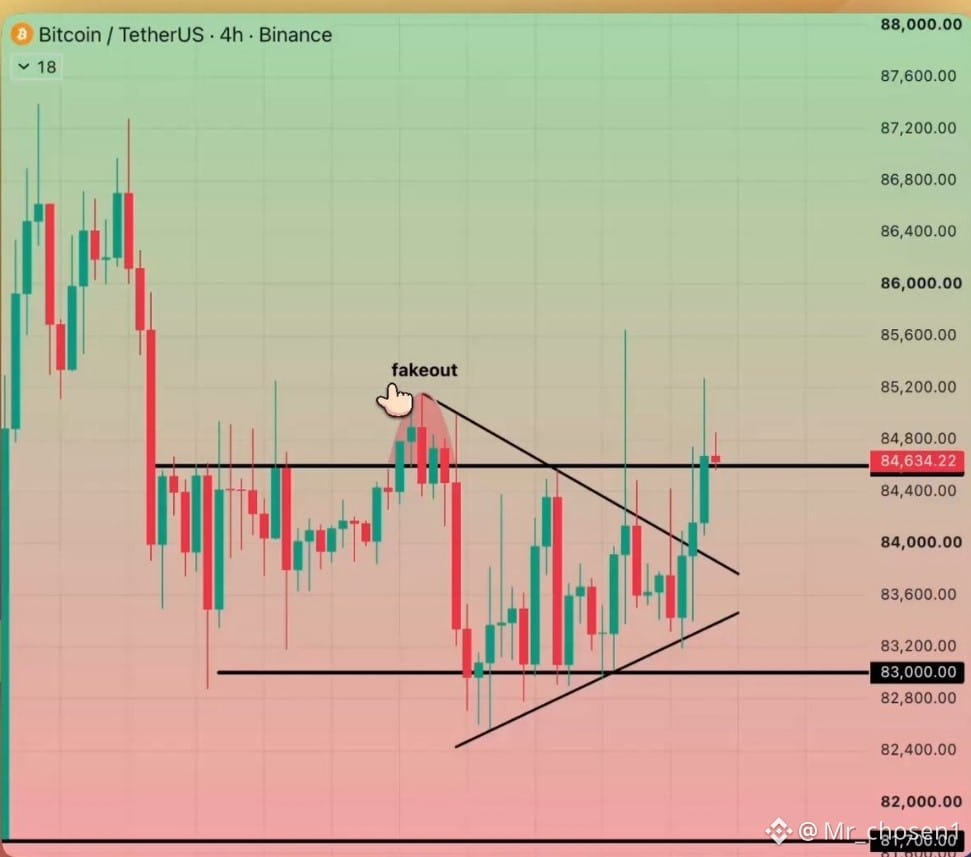
SEND IT $BTC
triangle breakout confirmed. now only this cursed 84.6k resistance left that's been stalling us for a week
just look at how relentlessly bulls defended 83k - not a single close below, pure absorption and continuous higher lows
haven't we earned this pump by now?SEND IT $BTC
triangle breakout confirmed. now only this cursed 84.6k resistance left that's been stalling us for a week
just look at how relentlessly bulls defended 83k - not a single close below, pure absorption and continuous higher lows
haven't we earned this pump by now?
$BTC
{spot}(BTCUSDT)
SEND IT $BTC
triangle breakout confirmed. now only this cursed 84.6k resistance left that's been stalling us for a week
just look at how relentlessly bulls defended 83k - not a single close below, pure absorption and continuous higher lows
haven't we earned this pump by now?SEND IT $BTC
triangle breakout confirmed. now only this cursed 84.6k resistance left that's been stalling us for a week
just look at how relentlessly bulls defended 83k - not a single close below, pure absorption and continuous higher lows
haven't we earned this pump by now?
$BTC
triangle breakout confirmed. now only this cursed 84.6k resistance left that's been stalling us for a week
just look at how relentlessly bulls defended 83k - not a single close below, pure absorption and continuous higher lows
haven't we earned this pump by now?SEND IT $BTC
triangle breakout confirmed. now only this cursed 84.6k resistance left that's been stalling us for a week
just look at how relentlessly bulls defended 83k - not a single close below, pure absorption and continuous higher lows
haven't we earned this pump by now?
$BTC
14
·
--
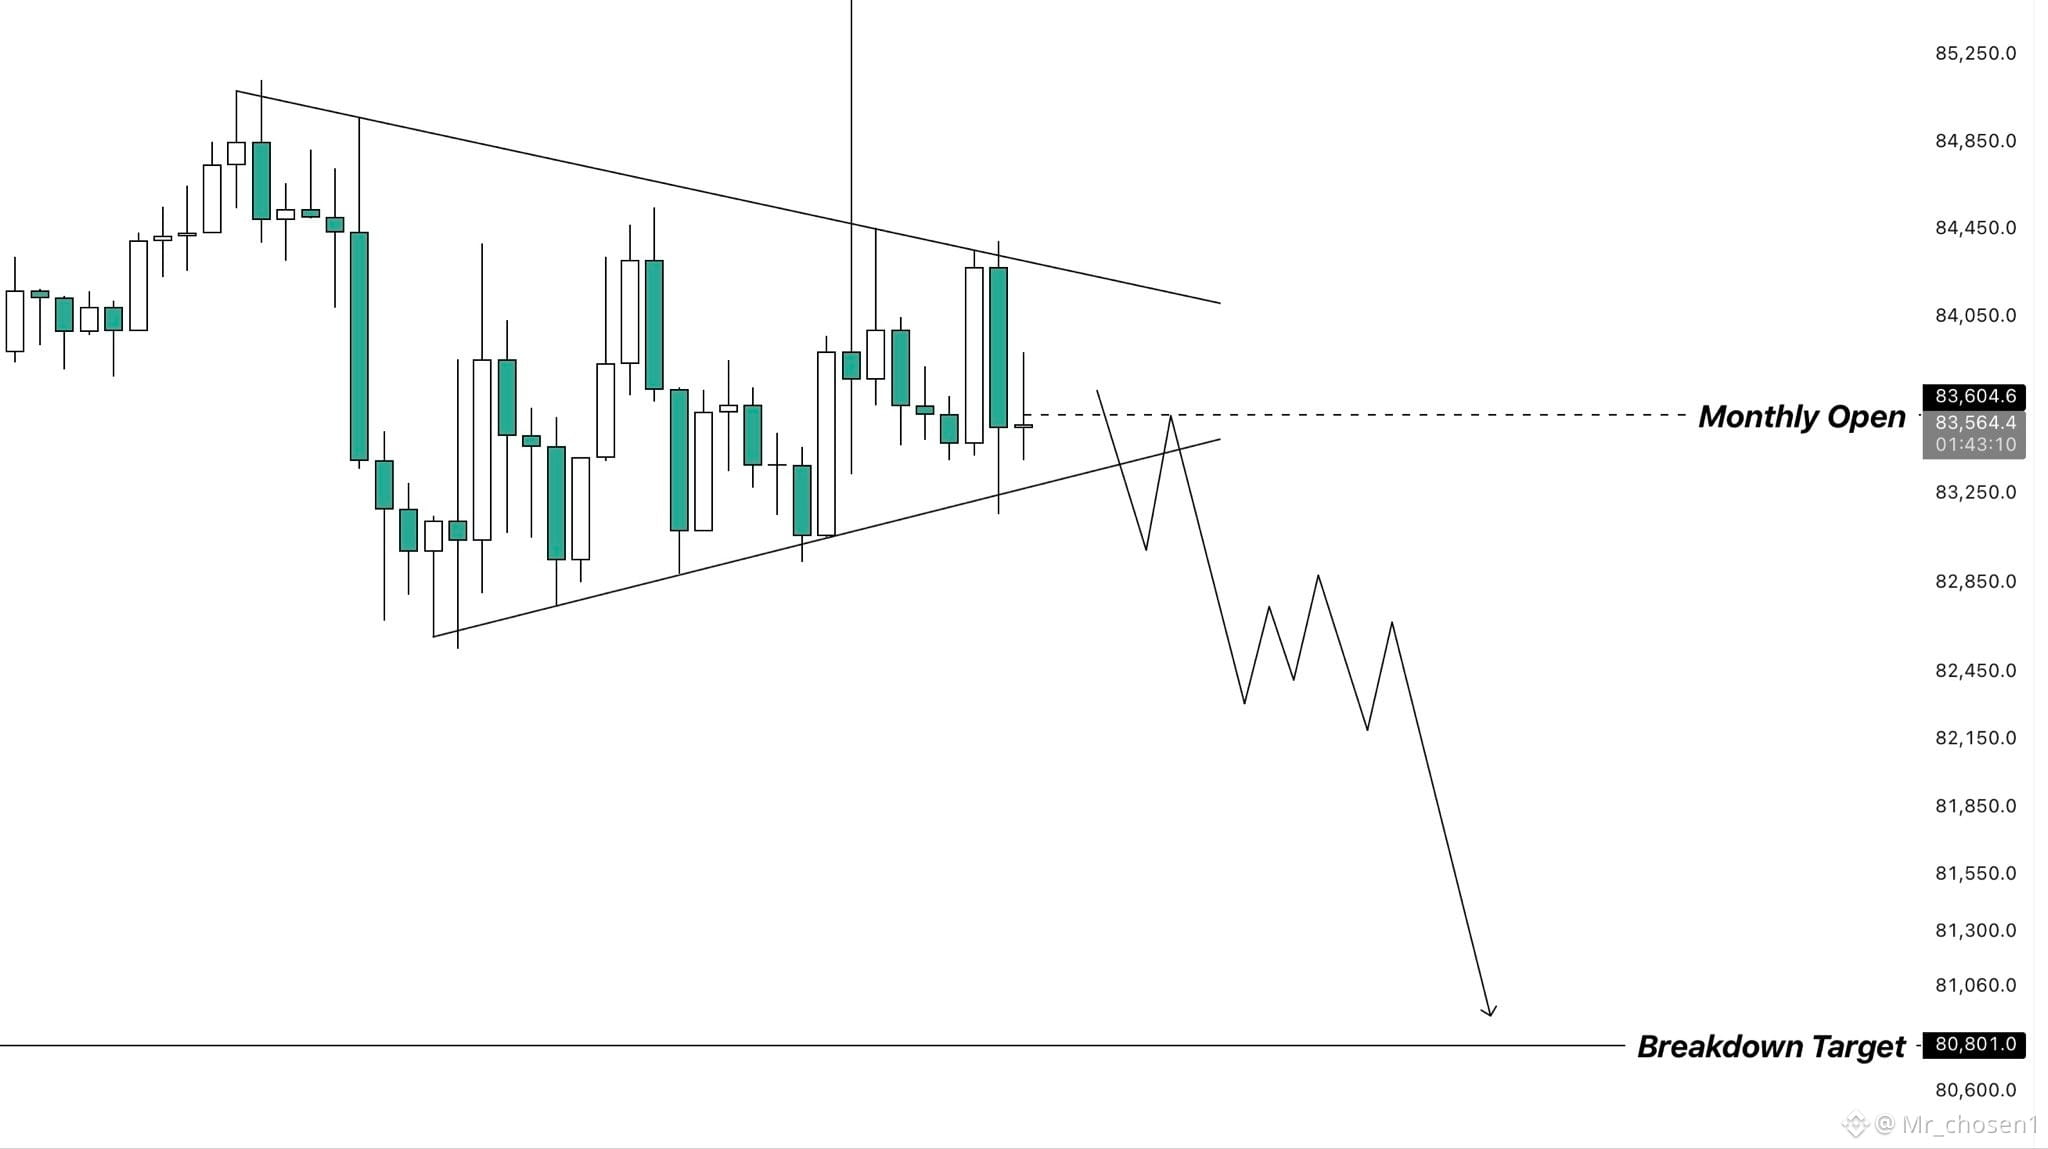
$BTC
Price is currently compressing inside a symmetrical triangle.
With the range getting increasingly tight, we should see a decisive breakout sometime soon.
For now, I favor a break to the downside, as yesterday’s attempt to push higher failed and instead turned into a liquidity sweep.
Since then, we’ve seen a strong rejection, fueled by aggressive spot selling that continues to put additional pressure on buyers.
If the lower boundary gives way, the projected breakdown target sits around $80.8k.
That would also bring BTC directly into the area where my next bids for another long are placed.
For now, I’m simply waiting for price to confirm a breakout into either direction.
$BTC
{spot}(BTCUSDT)
$BTC
Price is currently compressing inside a symmetrical triangle.
With the range getting increasingly tight, we should see a decisive breakout sometime soon.
For now, I favor a break to the downside, as yesterday’s attempt to push higher failed and instead turned into a liquidity sweep.
Since then, we’ve seen a strong rejection, fueled by aggressive spot selling that continues to put additional pressure on buyers.
If the lower boundary gives way, the projected breakdown target sits around $80.8k.
That would also bring BTC directly into the area where my next bids for another long are placed.
For now, I’m simply waiting for price to confirm a breakout into either direction.
$BTC
Price is currently compressing inside a symmetrical triangle.
With the range getting increasingly tight, we should see a decisive breakout sometime soon.
For now, I favor a break to the downside, as yesterday’s attempt to push higher failed and instead turned into a liquidity sweep.
Since then, we’ve seen a strong rejection, fueled by aggressive spot selling that continues to put additional pressure on buyers.
If the lower boundary gives way, the projected breakdown target sits around $80.8k.
That would also bring BTC directly into the area where my next bids for another long are placed.
For now, I’m simply waiting for price to confirm a breakout into either direction.
$BTC
3
·
--
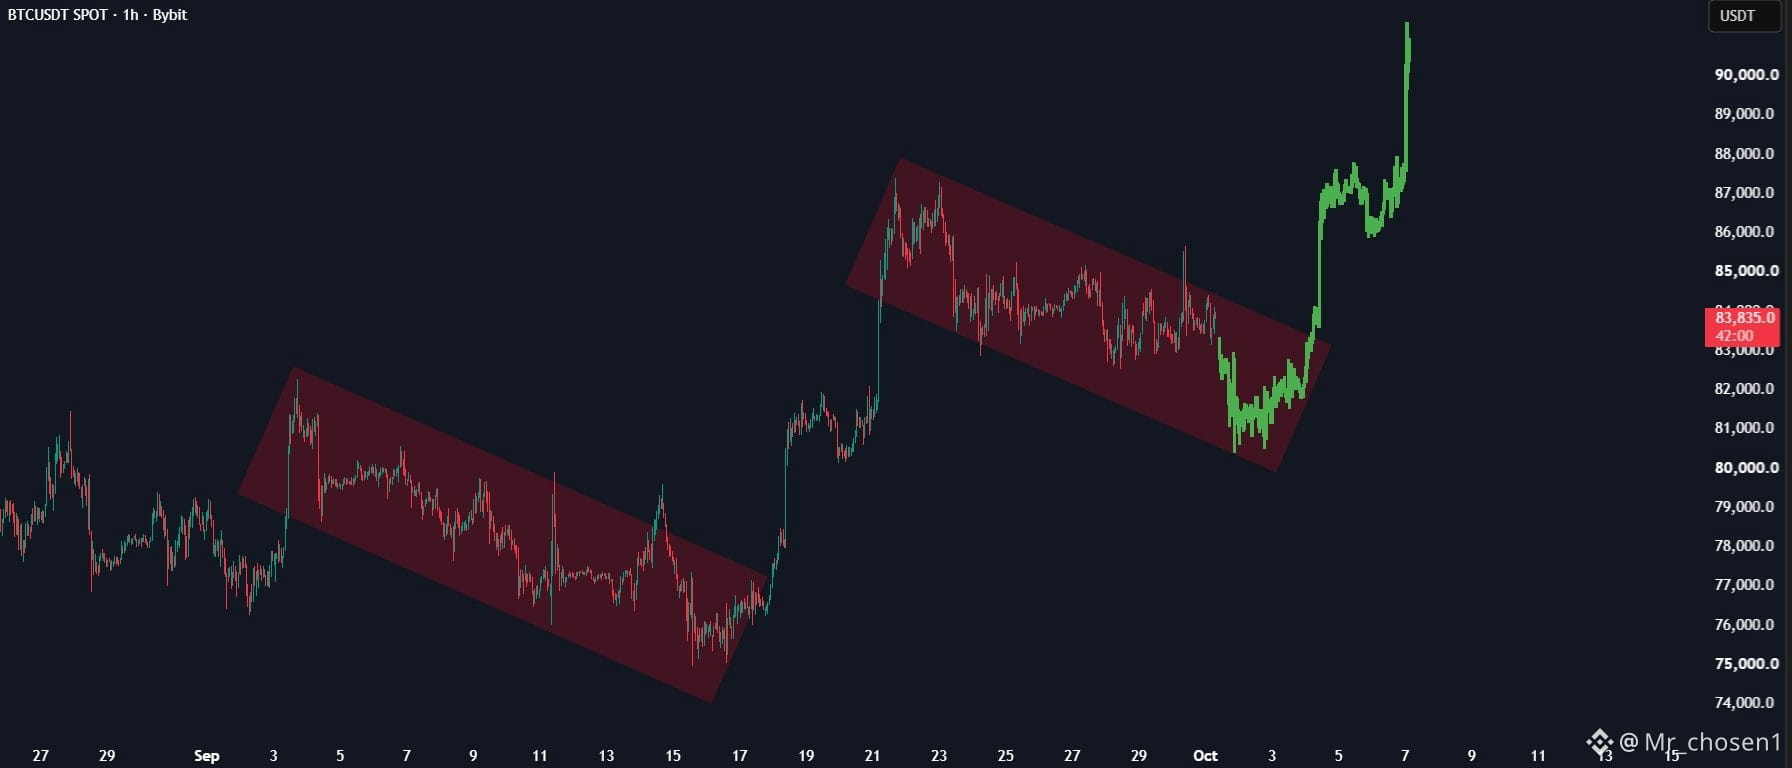
Bitcoin is back at the same setup that sparked the last move.
$BTC broke a descending channel before and pushed higher.
A similar channel is forming again, with price testing the upper trendline.
Now we wait for the break.
$BTC
{spot}(BTCUSDT)
Bitcoin is back at the same setup that sparked the last move.
$BTC broke a descending channel before and pushed higher.
A similar channel is forming again, with price testing the upper trendline.
Now we wait for the break.
$BTC
$BTC broke a descending channel before and pushed higher.
A similar channel is forming again, with price testing the upper trendline.
Now we wait for the break.
$BTC
11
·
--
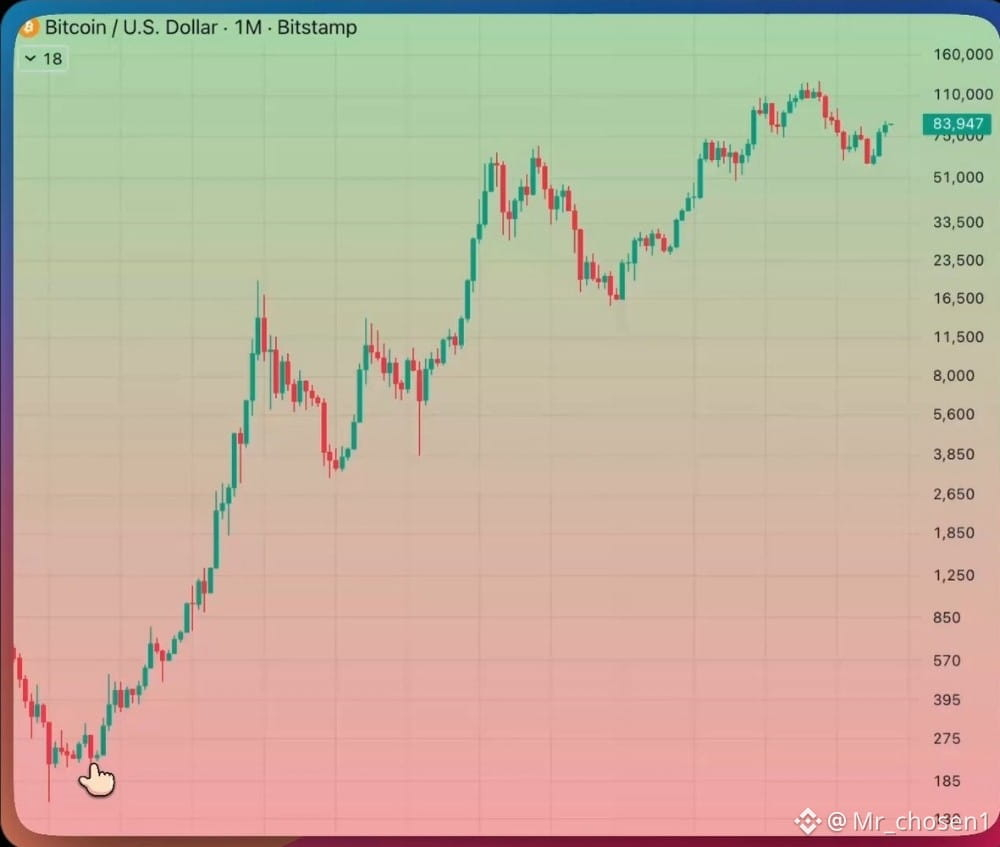
3 CONSECUTIVE GREEN MONTHS ON BTC
you simply don’t see this in a bear market
historically, every single time Bitcoin printed 3 green monthly candles after a macro downtrend, the cycle bottom was locked in
It didn’t always mean immediate parabolic expansion, but $BTC essentially never traded below the close of that 3rd green monthly candle again. the Covid crash was the only outlier, and even that was just a wick
is anyone still seriously waiting for 50k or lower to start buying?
$BTC
{spot}(BTCUSDT)
3 CONSECUTIVE GREEN MONTHS ON BTC
you simply don’t see this in a bear market
historically, every single time Bitcoin printed 3 green monthly candles after a macro downtrend, the cycle bottom was locked in
It didn’t always mean immediate parabolic expansion, but $BTC essentially never traded below the close of that 3rd green monthly candle again. the Covid crash was the only outlier, and even that was just a wick
is anyone still seriously waiting for 50k or lower to start buying?
$BTC
you simply don’t see this in a bear market
historically, every single time Bitcoin printed 3 green monthly candles after a macro downtrend, the cycle bottom was locked in
It didn’t always mean immediate parabolic expansion, but $BTC essentially never traded below the close of that 3rd green monthly candle again. the Covid crash was the only outlier, and even that was just a wick
is anyone still seriously waiting for 50k or lower to start buying?
$BTC
10
·
--
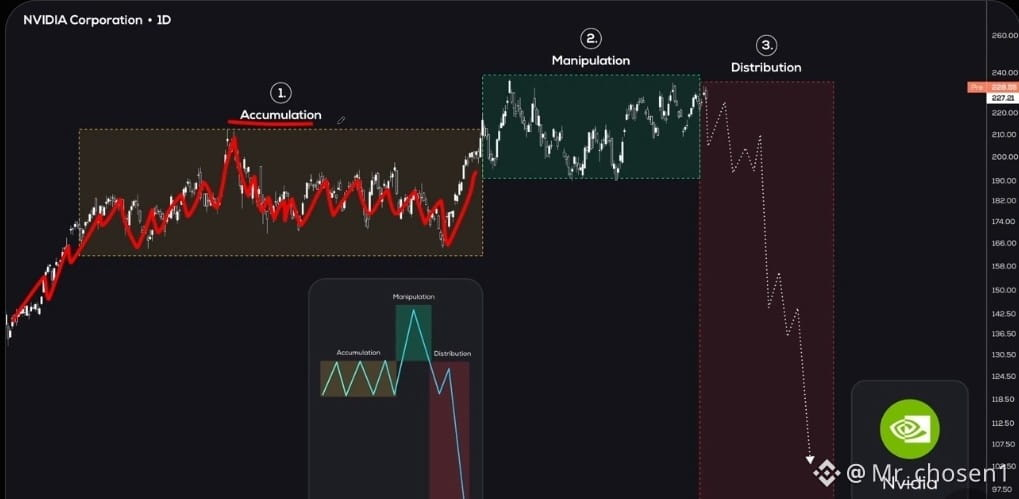
🚨 WARNING: ALL $NVDA HOLDERS BE EXTREMELY CAREFUL RIGHT NOW
This stock has had an unmeasurable rally this cycle... which historically results in 1 way:
A fat brutal correction crash.
Which is the exact pattern $NVDA is flashing right now and it is already in the very late stages.
The manipulation phase is the final fakeout before the real brutal crash.
This isn't a definitive outcome. But it's worth watching.
🚨 WARNING: ALL $NVDA HOLDERS BE EXTREMELY CAREFUL RIGHT NOW
This stock has had an unmeasurable rally this cycle... which historically results in 1 way:
A fat brutal correction crash.
Which is the exact pattern $NVDA is flashing right now and it is already in the very late stages.
The manipulation phase is the final fakeout before the real brutal crash.
This isn't a definitive outcome. But it's worth watching.
This stock has had an unmeasurable rally this cycle... which historically results in 1 way:
A fat brutal correction crash.
Which is the exact pattern $NVDA is flashing right now and it is already in the very late stages.
The manipulation phase is the final fakeout before the real brutal crash.
This isn't a definitive outcome. But it's worth watching.
5
·
--
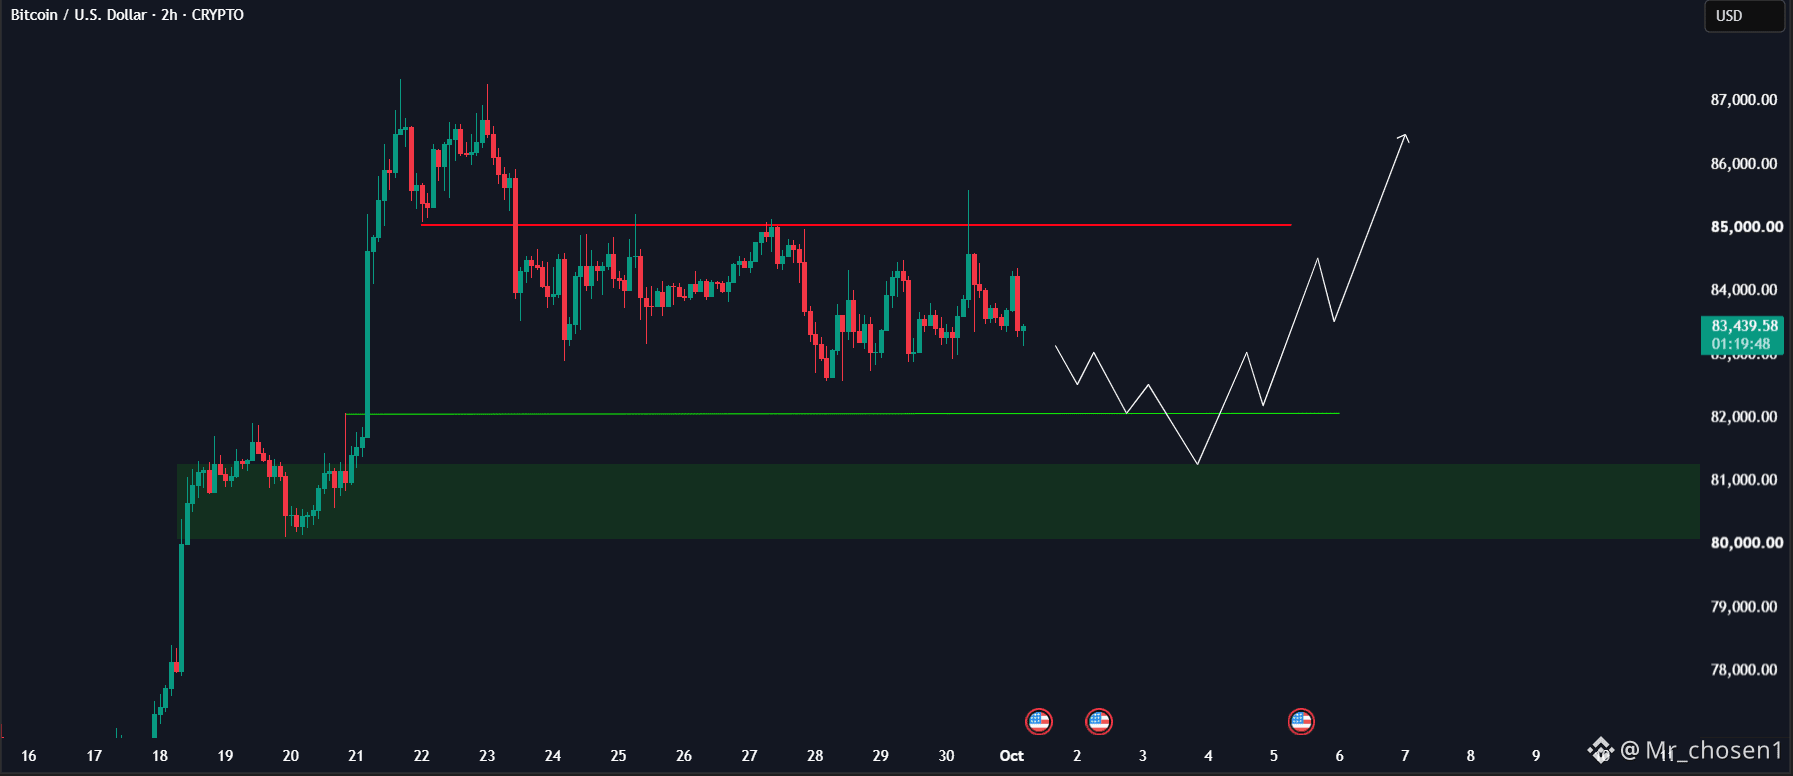
Bitcoin is stuck between support and resistance.
$BTC is holding the range, but every push higher keeps getting rejected at the same resistance.
A clean breakout would open the next move higher. Lose support, and the structure weakens.
$BTC
{spot}(BTCUSDT)
Bitcoin is stuck between support and resistance.
$BTC is holding the range, but every push higher keeps getting rejected at the same resistance.
A clean breakout would open the next move higher. Lose support, and the structure weakens.
$BTC
$BTC is holding the range, but every push higher keeps getting rejected at the same resistance.
A clean breakout would open the next move higher. Lose support, and the structure weakens.
$BTC
5
·
--
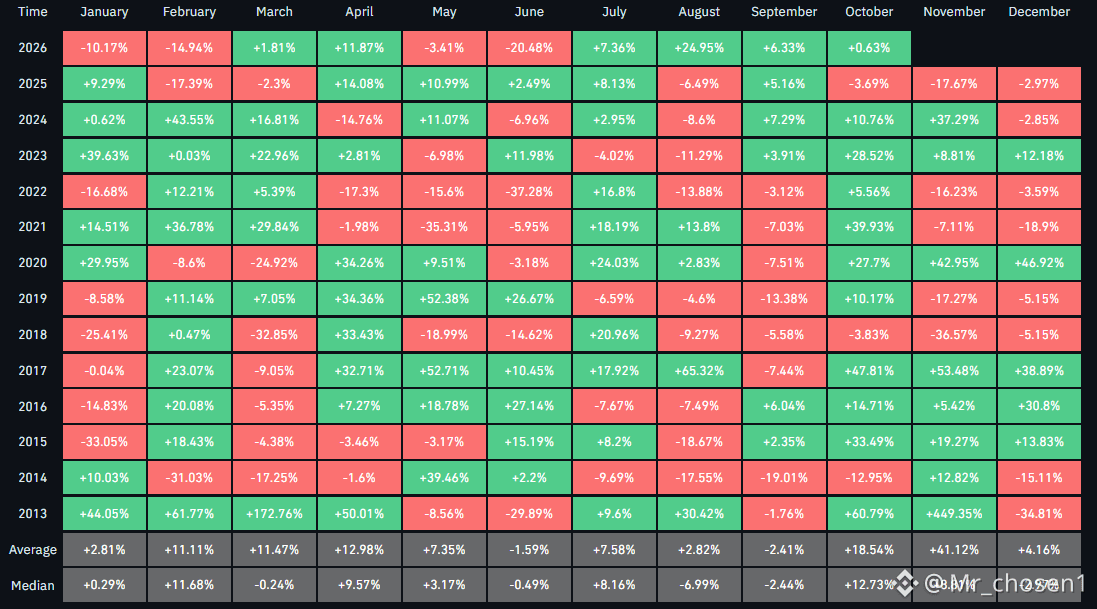
$BTC Price on October 1:
2010: $0.06
2011: $5
2012: $12
2013: $144
2014: $391
2015: $238
2016: $614
2017: $4,404
2018: $6,590
2019: $8,343
2020: $10,623
2021: $48,117
2022: $19,312
2023: $27,984
2024: $60,837
2025: $118,649
2026: $83,500
$BTC
{spot}(BTCUSDT)
$BTC Price on October 1:
2010: $0.06
2011: $5
2012: $12
2013: $144
2014: $391
2015: $238
2016: $614
2017: $4,404
2018: $6,590
2019: $8,343
2020: $10,623
2021: $48,117
2022: $19,312
2023: $27,984
2024: $60,837
2025: $118,649
2026: $83,500
$BTC
2010: $0.06
2011: $5
2012: $12
2013: $144
2014: $391
2015: $238
2016: $614
2017: $4,404
2018: $6,590
2019: $8,343
2020: $10,623
2021: $48,117
2022: $19,312
2023: $27,984
2024: $60,837
2025: $118,649
2026: $83,500
$BTC
10
·
--
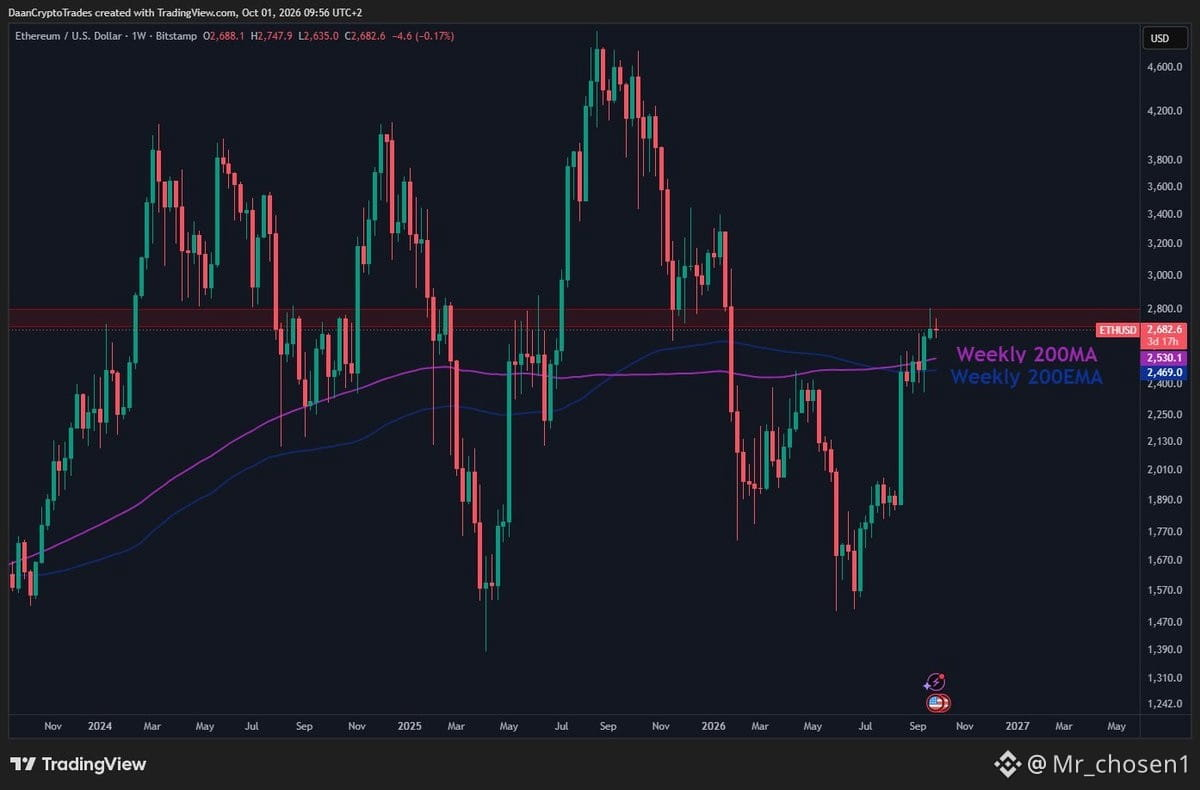
$ETH Now stuck between its Weekly 200MA/EMA and $2.8K horizontal level.
This horizontal area has played a critical role in ETH's price action for 2-3 years now. Acting as a strong support & resistance many times.
So keep an eye on the weekly closes around this region.
$ETH
{spot}(ETHUSDT)
$ETH Now stuck between its Weekly 200MA/EMA and $2.8K horizontal level.
This horizontal area has played a critical role in ETH's price action for 2-3 years now. Acting as a strong support & resistance many times.
So keep an eye on the weekly closes around this region.
$ETH
This horizontal area has played a critical role in ETH's price action for 2-3 years now. Acting as a strong support & resistance many times.
So keep an eye on the weekly closes around this region.
$ETH
1
·
--
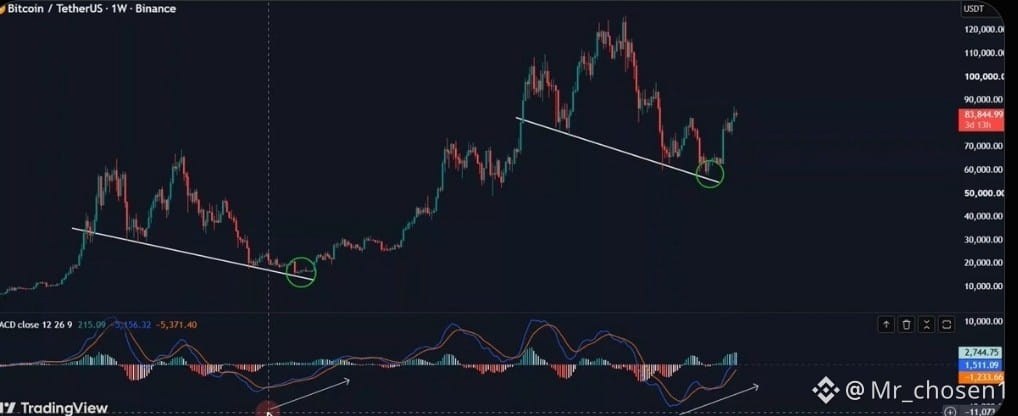
$BTC has broken its descending trendline, while MACD is turning up from deeply negative territory at the same time.
The same combination appeared around the 2022–2023 cycle bottom before the larger move higher.
Price and momentum are now moving together.
Now we watch the follow-through.
$BTC
{spot}(BTCUSDT)
$BTC has broken its descending trendline, while MACD is turning up from deeply negative territory at the same time.
The same combination appeared around the 2022–2023 cycle bottom before the larger move higher.
Price and momentum are now moving together.
Now we watch the follow-through.
$BTC
The same combination appeared around the 2022–2023 cycle bottom before the larger move higher.
Price and momentum are now moving together.
Now we watch the follow-through.
$BTC
5
·
--
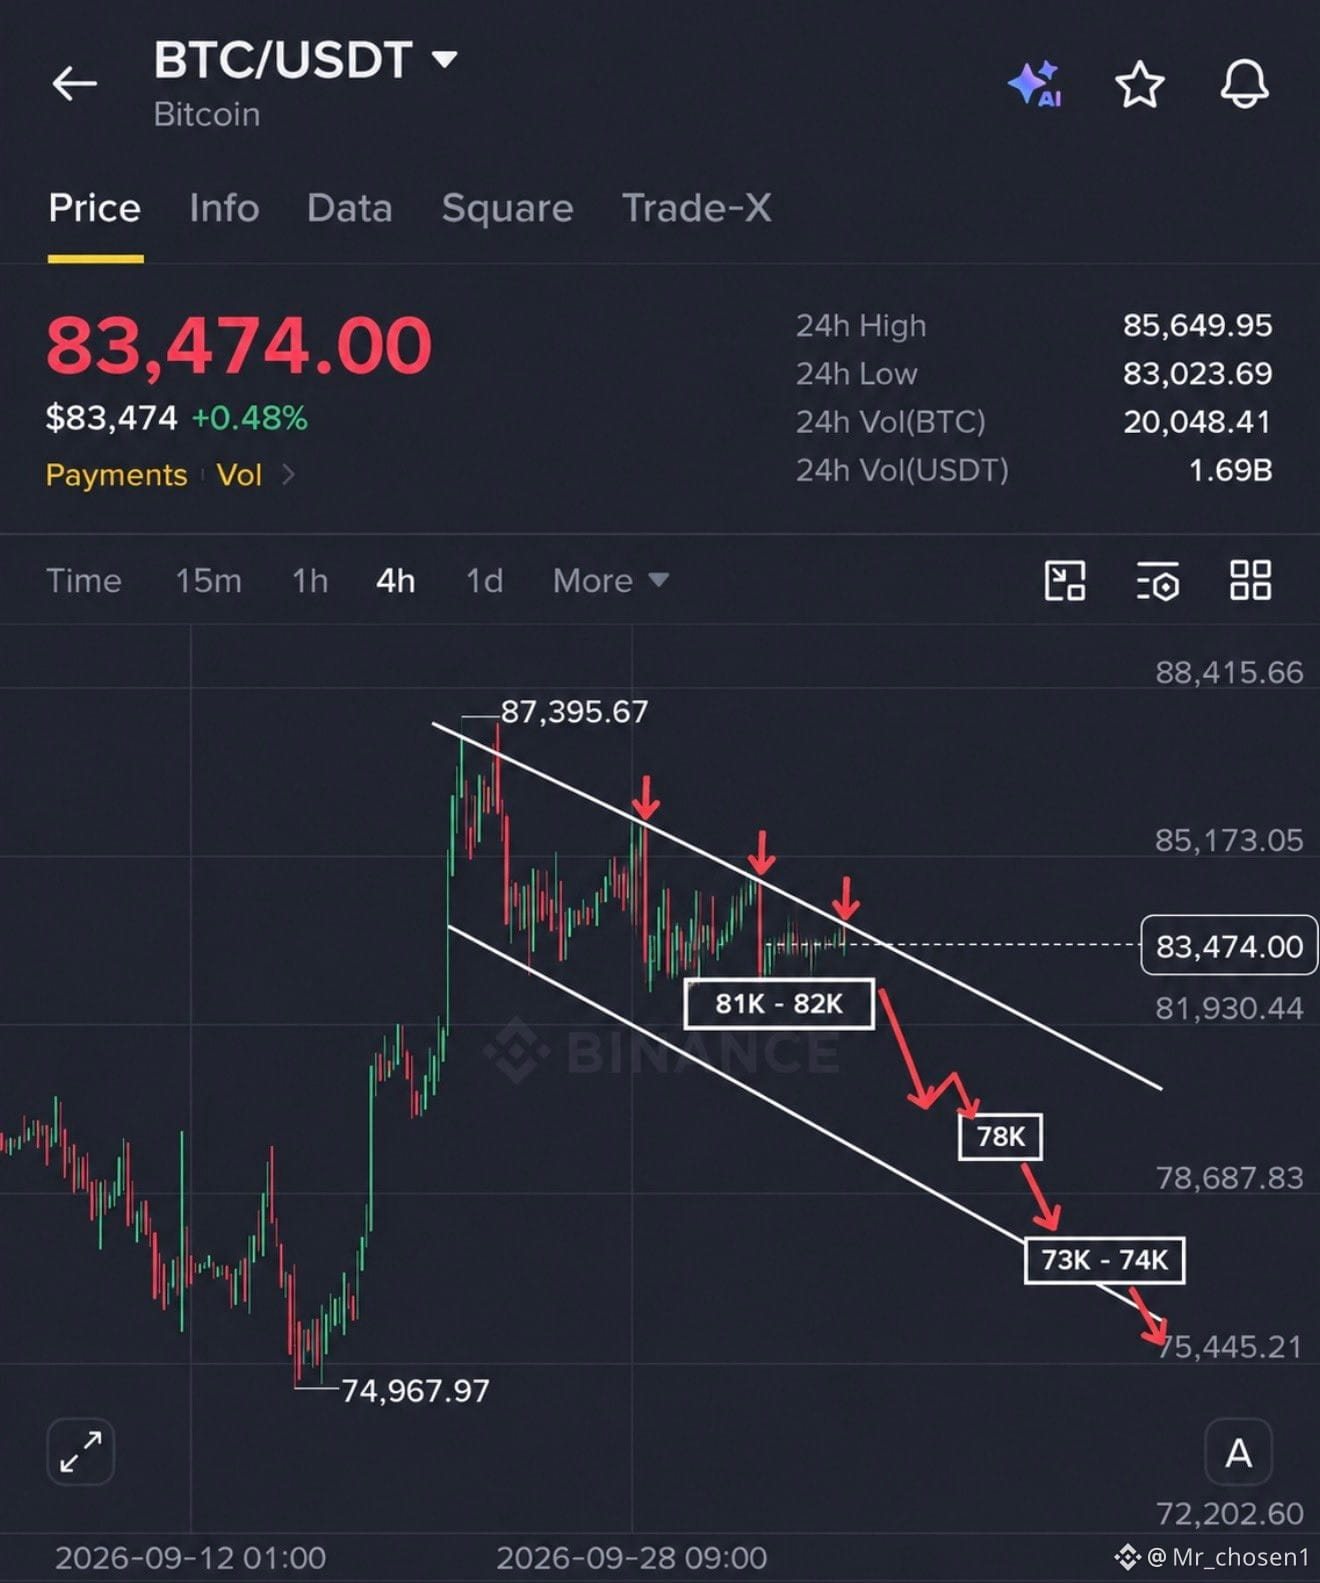
$BTC is still following the same bearish path I shared before.
I am still holding my short.
BTC got rejected hard from $87.3K and now the 4H chart is making lower highs inside this channel.
Next important level is $81K–$82K. Once this breaks, BTC will dump to $78K very fast, and after that $73K–$74K.
$BTC will follow this path: $85K → $82K → $78K → $72K → $62K → $90K+
These small pumps are just trapping more buyers before the next leg down.
Don’t become exit liquidity. Bookmark this chart and compare it later.
$BTC is still following the same bearish path I shared before.
I am still holding my short.
BTC got rejected hard from $87.3K and now the 4H chart is making lower highs inside this channel.
Next important level is $81K–$82K. Once this breaks, BTC will dump to $78K very fast, and after that $73K–$74K.
$BTC will follow this path: $85K → $82K → $78K → $72K → $62K → $90K+
These small pumps are just trapping more buyers before the next leg down.
Don’t become exit liquidity. Bookmark this chart and compare it later.
I am still holding my short.
BTC got rejected hard from $87.3K and now the 4H chart is making lower highs inside this channel.
Next important level is $81K–$82K. Once this breaks, BTC will dump to $78K very fast, and after that $73K–$74K.
$BTC will follow this path: $85K → $82K → $78K → $72K → $62K → $90K+
These small pumps are just trapping more buyers before the next leg down.
Don’t become exit liquidity. Bookmark this chart and compare it later.
2
Log in to explore more content
Join global crypto users on Binance Square
⚡️ Get latest and useful information about crypto.
💬 Trusted by the world’s largest crypto exchange.
👍 Discover real insights from verified creators.
Email / Phone number
Trending Topics
EtherGains70.9%InQ3
172,260 views
1,177 Discussing
One of the best third quarters in history 💰
September closed out last night, and with it, the quarter. For the quarter, BTC is up 42%—the second-best Q3 on record. ETH had a record-breaking Q3 overall, up 70%.
Looking at the chart, things are still looking good: we’re holding support, but we’re testing it more and more often. Plus, ETF momentum is weakening — inflows are gradually declining, and yesterday saw outflows for the first time in a long while.
Yes, historically, October has been a good month for crypto — it’s not called “Uptober” for nothing. But it’s also one of the most volatile months. Last year, for example, we managed to hit a new all-time high (ATH) and experience a flash crash.
🚀 High Accuracy Trades.
$BTC
$ETH
$SOL
#EtherGains70.9%InQ3 #DollarIndexHitsHighestSinceMay2025 #CFTCSubmitsTwoEventContractRulesToWhiteHouse #MicronBeatsEarningsLiftsGuidance
Knowledge is Power
·0 Likes
·250 views
TreasuryLetsStatesFileStablecoinCertificationsEarly
11,064 views
91 Discussing
US10YearYieldNears5.3%
158,283 views
1,159 Discussing