

资管舵
4.8k Posts

资管舵
Report
Block User
加密圈“K线甄嬛传观众”BTC涨了我秒变“多头贵妃”,跌了直接“冷宫待诏”,实盘操作主打“割肉是不可能的,嘴硬才是本命”,#币圈精神状态良好 #亏麻但嘴硬

BNB Holder
Frequent Trader
7.7 Years
361 Following
554 Followers
6.3K+ Liked
Posts
All
Quotes
Videos
·
--
# 【Big Short Creator Speaks Again】Burry Says a Market Drop Is Needed to Stop AI Giants’ IPOs—How Should Risk Assets Be Viewed?
The movie *The Big Short*’s real-life prototype and well-known short seller Michael Burry has fired up again this week, with his sights set directly on the AI bubble.
On X, he said plainly: "For the benefit of mankind, the market should drop sharply in order to stop the IPOs of OpenAI and Anthropic." His logic is straightforward—once the two companies go public, they will pull in tens of trillions of dollars and ultimately "ruin that money," and that is just the minimum damage.
A few hard data points:
- Anthropic’s prospectus discloses that over the next few years it plans to pour **$518 billion** into cloud and infrastructure, with last year’s net loss of nearly **$42 billion**; the IPO is expected to come after the U.S. midterm elections in November.
- **OpenAI** has already pushed its IPO to next year.
- Burry has shifted his main AI stock shorts into **put options**, betting that AI trading will either reverse or he can profit from a move **next summer**; some of his moves are also intended to reduce taxes.
His core skepticism: can massive data-center investment generate enough returns? And in his view, the warnings from OpenAI and Anthropic about "slowing down AI development" are "self-serving"—in essence, a way to manufacture momentum for the IPO.
**Objective implications for the crypto market:**
The correlation between BTC and the Nasdaq/AI-chain remains high. If AI trading truly peaks and then falls back, risk assets overall face repricing, with securities that carry high valuations and long-end interest rate sensitivity likely hit first. This echoes our prior bearish logic for SPCX (SpaceX IPO)—"high valuations + interest-rate suppression"—from the same root. However, Burry’s timing call (next summer) is more medium-term, and the resilience of the AI narrative should not be underestimated; short-term extrapolation is not advisable.
**Conclusion:** AI de-leveraging is one of the key macro variables in the second half of 2026 worth monitoring continuously, but it does not constitute an immediate trading signal.
#BinanceSquare #AI泡沫 #MichaelBurry #宏观观察 #Crypto market
⚠️ The above content is for information collation and market opinion sharing only, and does not constitute any investment advice. NFA.
# 【Big Short Creator Speaks Again】Burry Says a Market Drop Is Needed to Stop AI Giants’ IPOs—How Should Risk Assets Be Viewed?
The movie *The Big Short*’s real-life prototype and well-known short seller Michael Burry has fired up again this week, with his sights set directly on the AI bubble.
On X, he said plainly: "For the benefit of mankind, the market should drop sharply in order to stop the IPOs of OpenAI and Anthropic." His logic is straightforward—once the two companies go public, they will pull in tens of trillions of dollars and ultimately "ruin that money," and that is just the minimum damage.
A few hard data points:
- Anthropic’s prospectus discloses that over the next few years it plans to pour **$518 billion** into cloud and infrastructure, with last year’s net loss of nearly **$42 billion**; the IPO is expected to come after the U.S. midterm elections in November.
- **OpenAI** has already pushed its IPO to next year.
- Burry has shifted his main AI stock shorts into **put options**, betting that AI trading will either reverse or he can profit from a move **next summer**; some of his moves are also intended to reduce taxes.
His core skepticism: can massive data-center investment generate enough returns? And in his view, the warnings from OpenAI and Anthropic about "slowing down AI development" are "self-serving"—in essence, a way to manufacture momentum for the IPO.
**Objective implications for the crypto market:**
The correlation between BTC and the Nasdaq/AI-chain remains high. If AI trading truly peaks and then falls back, risk assets overall face repricing, with securities that carry high valuations and long-end interest rate sensitivity likely hit first. This echoes our prior bearish logic for SPCX (SpaceX IPO)—"high valuations + interest-rate suppression"—from the same root. However, Burry’s timing call (next summer) is more medium-term, and the resilience of the AI narrative should not be underestimated; short-term extrapolation is not advisable.
**Conclusion:** AI de-leveraging is one of the key macro variables in the second half of 2026 worth monitoring continuously, but it does not constitute an immediate trading signal.
#BinanceSquare #AI泡沫 #MichaelBurry #宏观观察 #Crypto market
⚠️ The above content is for information collation and market opinion sharing only, and does not constitute any investment advice. NFA.
The movie *The Big Short*’s real-life prototype and well-known short seller Michael Burry has fired up again this week, with his sights set directly on the AI bubble.
On X, he said plainly: "For the benefit of mankind, the market should drop sharply in order to stop the IPOs of OpenAI and Anthropic." His logic is straightforward—once the two companies go public, they will pull in tens of trillions of dollars and ultimately "ruin that money," and that is just the minimum damage.
A few hard data points:
- Anthropic’s prospectus discloses that over the next few years it plans to pour **$518 billion** into cloud and infrastructure, with last year’s net loss of nearly **$42 billion**; the IPO is expected to come after the U.S. midterm elections in November.
- **OpenAI** has already pushed its IPO to next year.
- Burry has shifted his main AI stock shorts into **put options**, betting that AI trading will either reverse or he can profit from a move **next summer**; some of his moves are also intended to reduce taxes.
His core skepticism: can massive data-center investment generate enough returns? And in his view, the warnings from OpenAI and Anthropic about "slowing down AI development" are "self-serving"—in essence, a way to manufacture momentum for the IPO.
**Objective implications for the crypto market:**
The correlation between BTC and the Nasdaq/AI-chain remains high. If AI trading truly peaks and then falls back, risk assets overall face repricing, with securities that carry high valuations and long-end interest rate sensitivity likely hit first. This echoes our prior bearish logic for SPCX (SpaceX IPO)—"high valuations + interest-rate suppression"—from the same root. However, Burry’s timing call (next summer) is more medium-term, and the resilience of the AI narrative should not be underestimated; short-term extrapolation is not advisable.
**Conclusion:** AI de-leveraging is one of the key macro variables in the second half of 2026 worth monitoring continuously, but it does not constitute an immediate trading signal.
#BinanceSquare #AI泡沫 #MichaelBurry #宏观观察 #Crypto market
⚠️ The above content is for information collation and market opinion sharing only, and does not constitute any investment advice. NFA.
72
·
--
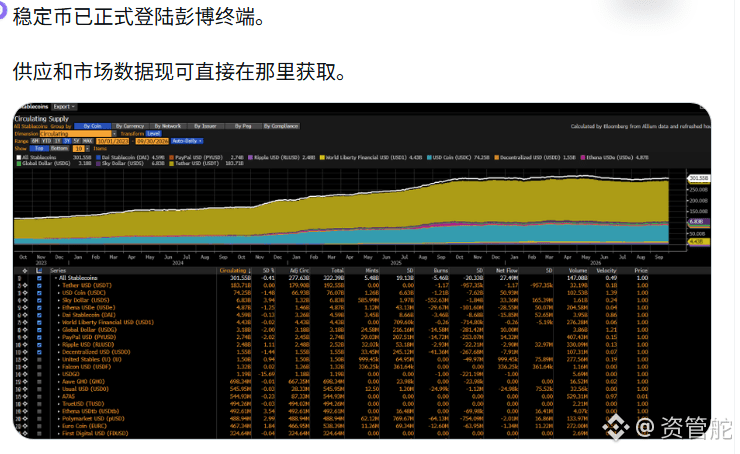
The stablecoin data has officially entered the Bloomberg terminal.
Previously, if you wanted to see stablecoin supply, you had to go to a blockchain explorer or a third-party data site and piece the numbers together yourself. Now you can pull it up directly in the terminal. USDT is circulating at about $181 billion, and USDC at about $74 billion. The circulating scales and issuance/increase schedules from different issuers are laid out side by side on a single screen—right in the same interface as stocks, foreign exchange, and commodities.
This step is not a light one. The Bloomberg terminal is a standard tool in traditional finance. Hundreds of thousands of financial professionals around the world watch it every day to make decisions. By bringing stablecoin data into this system, it effectively treats stablecoins as a bona fide asset class to be tracked—fully entering the mainstream financial data view.
For the crypto market, stablecoin supply itself is one of the most important leading indicators of liquidity. Before incremental capital moves in, you often see stablecoins expand their balance sheets first. When traditional institutions are monitoring the markets, they can spot this trend curve at a glance, and stablecoin penetration into traditional capital will only accelerate.
$ETH #稳定币 #彭博终端 #机构采用
The stablecoin data has officially entered the Bloomberg terminal.
Previously, if you wanted to see stablecoin supply, you had to go to a blockchain explorer or a third-party data site and piece the numbers together yourself. Now you can pull it up directly in the terminal. USDT is circulating at about $181 billion, and USDC at about $74 billion. The circulating scales and issuance/increase schedules from different issuers are laid out side by side on a single screen—right in the same interface as stocks, foreign exchange, and commodities.
This step is not a light one. The Bloomberg terminal is a standard tool in traditional finance. Hundreds of thousands of financial professionals around the world watch it every day to make decisions. By bringing stablecoin data into this system, it effectively treats stablecoins as a bona fide asset class to be tracked—fully entering the mainstream financial data view.
For the crypto market, stablecoin supply itself is one of the most important leading indicators of liquidity. Before incremental capital moves in, you often see stablecoins expand their balance sheets first. When traditional institutions are monitoring the markets, they can spot this trend curve at a glance, and stablecoin penetration into traditional capital will only accelerate.
$ETH #稳定币 #彭博终端 #机构采用
Previously, if you wanted to see stablecoin supply, you had to go to a blockchain explorer or a third-party data site and piece the numbers together yourself. Now you can pull it up directly in the terminal. USDT is circulating at about $181 billion, and USDC at about $74 billion. The circulating scales and issuance/increase schedules from different issuers are laid out side by side on a single screen—right in the same interface as stocks, foreign exchange, and commodities.
This step is not a light one. The Bloomberg terminal is a standard tool in traditional finance. Hundreds of thousands of financial professionals around the world watch it every day to make decisions. By bringing stablecoin data into this system, it effectively treats stablecoins as a bona fide asset class to be tracked—fully entering the mainstream financial data view.
For the crypto market, stablecoin supply itself is one of the most important leading indicators of liquidity. Before incremental capital moves in, you often see stablecoins expand their balance sheets first. When traditional institutions are monitoring the markets, they can spot this trend curve at a glance, and stablecoin penetration into traditional capital will only accelerate.
$ETH #稳定币 #彭博终端 #机构采用
177
·
--
"The Big Short"’s Michael Burry is firing again. This time, he has told the market it should fall sharply, to stop the IPOs of OpenAI and Anthropic. His rationale is very straightforward: these companies will siphon off tens of trillions of dollars, and AI infrastructure spending is even more frightening. In Anthropic’s prospectus, it says it plans to invest $51.8 billion over the next few years, and last year its net loss was nearly $42 billion.
This veteran who made his name in 2008 by shorting subprime mortgages has recently been repeatedly warning about an AI bubble. He’s now betting on a reversal around next summer from both sides—shorting stocks and buying put options.
For crypto, it’s two sides of the same coin. Over the past two years, the AI narrative has been crypto’s toughest line. From AI agents to all kinds of token concepts related to AI, everything has been driven by the same expectation. The higher the valuations of AI companies and the fuller the story, the greater the imagination space for crypto on that side. But once the AI equity bubble is punctured, risk appetite is the first thing that gets hit. Crypto’s AI track will be tested in tandem, and even the broader altcoin sentiment will have to shake.
But from another angle, the more Burry goes bearish, the more AI is pushed to the forefront—and in the long run, it may actually help extend the life of this cross-narrative. Bubble talk isn’t a buy-or-sell instruction; it’s more like an emotional thermometer, telling you how much of your position is staked on the story of "AI will always go up." What you really need to guard against is boosting leverage to the max when the story is at its fullest. Whether Burry’s bearishness is right is something time will decide.
"The Big Short"’s Michael Burry is firing again. This time, he has told the market it should fall sharply, to stop the IPOs of OpenAI and Anthropic. His rationale is very straightforward: these companies will siphon off tens of trillions of dollars, and AI infrastructure spending is even more frightening. In Anthropic’s prospectus, it says it plans to invest $51.8 billion over the next few years, and last year its net loss was nearly $42 billion.
This veteran who made his name in 2008 by shorting subprime mortgages has recently been repeatedly warning about an AI bubble. He’s now betting on a reversal around next summer from both sides—shorting stocks and buying put options.
For crypto, it’s two sides of the same coin. Over the past two years, the AI narrative has been crypto’s toughest line. From AI agents to all kinds of token concepts related to AI, everything has been driven by the same expectation. The higher the valuations of AI companies and the fuller the story, the greater the imagination space for crypto on that side. But once the AI equity bubble is punctured, risk appetite is the first thing that gets hit. Crypto’s AI track will be tested in tandem, and even the broader altcoin sentiment will have to shake.
But from another angle, the more Burry goes bearish, the more AI is pushed to the forefront—and in the long run, it may actually help extend the life of this cross-narrative. Bubble talk isn’t a buy-or-sell instruction; it’s more like an emotional thermometer, telling you how much of your position is staked on the story of "AI will always go up." What you really need to guard against is boosting leverage to the max when the story is at its fullest. Whether Burry’s bearishness is right is something time will decide.
This veteran who made his name in 2008 by shorting subprime mortgages has recently been repeatedly warning about an AI bubble. He’s now betting on a reversal around next summer from both sides—shorting stocks and buying put options.
For crypto, it’s two sides of the same coin. Over the past two years, the AI narrative has been crypto’s toughest line. From AI agents to all kinds of token concepts related to AI, everything has been driven by the same expectation. The higher the valuations of AI companies and the fuller the story, the greater the imagination space for crypto on that side. But once the AI equity bubble is punctured, risk appetite is the first thing that gets hit. Crypto’s AI track will be tested in tandem, and even the broader altcoin sentiment will have to shake.
But from another angle, the more Burry goes bearish, the more AI is pushed to the forefront—and in the long run, it may actually help extend the life of this cross-narrative. Bubble talk isn’t a buy-or-sell instruction; it’s more like an emotional thermometer, telling you how much of your position is staked on the story of "AI will always go up." What you really need to guard against is boosting leverage to the max when the story is at its fullest. Whether Burry’s bearishness is right is something time will decide.

39
·
--
Article
Global oil prices surge, with Brent back above $100/barrelGlobal oil prices surge straight up: Brent has regained $100/barrel, with the latest quote at $100.118/barrel, up 2.13% on the day. WTI’s gain has widened to 2%, trading at $92.261/barrel. In the early market action, capital reacted first to this move.
Yields on long-end government bonds in Europe and the U.S. continue to climb: the UK 30-year yield has risen above 6% for the first time since 1998. The U.S. 10-year yield is at 5.33%, a new high since 2002; the 30-year yield is at 5.677%, continuing to retest the 2002 peak, and has risen for eight consecutive trading days. The rates market is pricing in the long end with the view that “inflation isn’t going to ease that quickly.” Oil prices and long bonds are two key tests for inflation—one gauges the cost of real goods, and the other gauges yields.
Global oil prices surge, with Brent back above $100/barrel
Global oil prices surge straight up: Brent has regained $100/barrel, with the latest quote at $100.118/barrel, up 2.13% on the day. WTI’s gain has widened to 2%, trading at $92.261/barrel. In the early market action, capital reacted first to this move.
Yields on long-end government bonds in Europe and the U.S. continue to climb: the UK 30-year yield has risen above 6% for the first time since 1998. The U.S. 10-year yield is at 5.33%, a new high since 2002; the 30-year yield is at 5.677%, continuing to retest the 2002 peak, and has risen for eight consecutive trading days. The rates market is pricing in the long end with the view that “inflation isn’t going to ease that quickly.” Oil prices and long bonds are two key tests for inflation—one gauges the cost of real goods, and the other gauges yields.
Yields on long-end government bonds in Europe and the U.S. continue to climb: the UK 30-year yield has risen above 6% for the first time since 1998. The U.S. 10-year yield is at 5.33%, a new high since 2002; the 30-year yield is at 5.677%, continuing to retest the 2002 peak, and has risen for eight consecutive trading days. The rates market is pricing in the long end with the view that “inflation isn’t going to ease that quickly.” Oil prices and long bonds are two key tests for inflation—one gauges the cost of real goods, and the other gauges yields.
255
·
--
Bitcoin was never simply a straight upward climb. Looking back over a few market cycles, after every major surge there follows a soul-crushing, confidence-testing plunge—drawdowns of 30%, 50%, and even deeper are not uncommon in its history. This kind of deep pullback isn’t the market “breaking”; it’s the norm for high-volatility assets: the faster it rises, the harder it tends to fall back. What you should really ask isn’t “will it go down,” but how much buffer you’ve set aside for such drawdowns—position sizing, cash flow, and stop-loss levels. That matters far more than trying to guess the top or the bottom. History won’t repeat mechanically, but the rule of “high volatility leading to deeper drawdowns” will likely still hold.
Bitcoin was never simply a straight upward climb. Looking back over a few market cycles, after every major surge there follows a soul-crushing, confidence-testing plunge—drawdowns of 30%, 50%, and even deeper are not uncommon in its history. This kind of deep pullback isn’t the market “breaking”; it’s the norm for high-volatility assets: the faster it rises, the harder it tends to fall back. What you should really ask isn’t “will it go down,” but how much buffer you’ve set aside for such drawdowns—position sizing, cash flow, and stop-loss levels. That matters far more than trying to guess the top or the bottom. History won’t repeat mechanically, but the rule of “high volatility leading to deeper drawdowns” will likely still hold.

1
199
·
--
Throughout the ages, the steadiest business is collecting rent.
In the old days, landlords collected rent from land.
Later, department stores collected rent from their space.
On Taobao, JD.com, and Pinduoduo, they collect rent from online storefront space.
And on Douyin and Kuaishou, they collect rent from traffic locations.
On the surface, they look like tech companies, but in essence they’re all top-tier landlords.
Times change, but the core logic never does. People with vision and courage will set up their plans in advance.
By occupying scarce prime locations and controlling traffic entry points, they keep charging rent.
Throughout the ages, the steadiest business is collecting rent.
In the old days, landlords collected rent from land.
Later, department stores collected rent from their space.
On Taobao, JD.com, and Pinduoduo, they collect rent from online storefront space.
And on Douyin and Kuaishou, they collect rent from traffic locations.
On the surface, they look like tech companies, but in essence they’re all top-tier landlords.
Times change, but the core logic never does. People with vision and courage will set up their plans in advance.
By occupying scarce prime locations and controlling traffic entry points, they keep charging rent.
In the old days, landlords collected rent from land.
Later, department stores collected rent from their space.
On Taobao, JD.com, and Pinduoduo, they collect rent from online storefront space.
And on Douyin and Kuaishou, they collect rent from traffic locations.
On the surface, they look like tech companies, but in essence they’re all top-tier landlords.
Times change, but the core logic never does. People with vision and courage will set up their plans in advance.
By occupying scarce prime locations and controlling traffic entry points, they keep charging rent.
82
·
--
Binance Pay is now integrated with PayPal merchants across Japan. As the official slogan puts it—your passport determines whether you’re a tourist, while your payment method determines whether you’re a local; spending crypto assets in Japan is just like being a local. In the past, you had to convert your coins into fiat before you could spend; now, at the store, you can just scan the code to pay, skipping the in-between step. A slogan is a slogan—only what can be truly implemented counts.
#股票财报季 $MOVR
{future}(MOVRUSDT)
Binance Pay is now integrated with PayPal merchants across Japan. As the official slogan puts it—your passport determines whether you’re a tourist, while your payment method determines whether you’re a local; spending crypto assets in Japan is just like being a local. In the past, you had to convert your coins into fiat before you could spend; now, at the store, you can just scan the code to pay, skipping the in-between step. A slogan is a slogan—only what can be truly implemented counts.
#股票财报季 $MOVR
#股票财报季 $MOVR

130
·
--
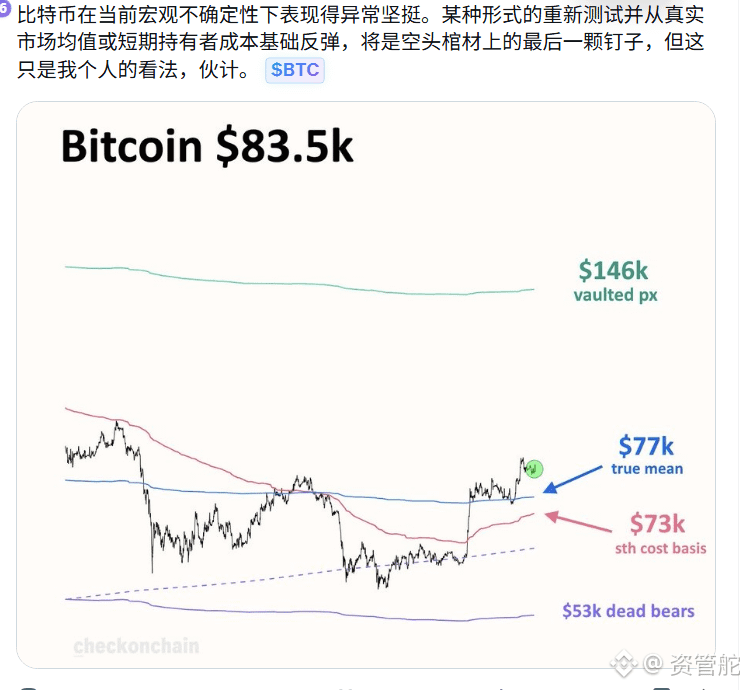
BTC is now $83.5k. The chart shows four lines: the true market average at $77k, the short-term holder cost at $73k, the lower bearish zone at $53k, and the top at $146k. The speaker says that if the pullback can hold above the first two moving averages, it’s “the last nail on the coffin of the bears.” The talk is exciting, but the lines were drawn by someone else and the position is your own—whether those averages hold or not is still up to the market.
BTC is now $83.5k. The chart shows four lines: the true market average at $77k, the short-term holder cost at $73k, the lower bearish zone at $53k, and the top at $146k. The speaker says that if the pullback can hold above the first two moving averages, it’s “the last nail on the coffin of the bears.” The talk is exciting, but the lines were drawn by someone else and the position is your own—whether those averages hold or not is still up to the market.
60
·
--
Nikkei 225 rose 2% today, closing at 68,098.29 points. South Korea’s KOSPI opened lower but flipped to green, up slightly 0.02% to 6,839.61. The numbers aren’t huge, but the direction is clear—Asia-Pacific risk appetite is showing signs of recovery.
To understand how this market relates to crypto, you have to look at the local user base. South Korean retail traders are among the most active crypto participants globally. Local exchange trading volumes often exceed those of large-cap stocks, and the ups and downs of the kimchi premium tend to be more sensitive than the stock index. In Japan as well, crypto holdings are similarly large—when the Nikkei strengthens, it often reflects local capital’s risk appetite opening up.
So when markets in Korea and Japan turn from falling to rising, the underlying cause is likely the same group of people loosening the purse strings, and wallet activity may follow suit faster. But this is only emotion-driven transmission, not a definitive signal. The logic behind stock and crypto price action isn’t the same: equities are driven by corporate earnings and exchange rates, while crypto is driven by liquidity and narratives. Treating a single bullish candle as proof that crypto is about to take off can easily lead to overinterpretation.
A more reliable approach is to read this kind of tape as a “sentiment thermometer,” not as a buy/sell instruction. What really matters is the main storyline—U.S. dollar liquidity and interest rates.
$ETH #日韩股市 #市场情绪 #Asia crypto participation
Nikkei 225 rose 2% today, closing at 68,098.29 points. South Korea’s KOSPI opened lower but flipped to green, up slightly 0.02% to 6,839.61. The numbers aren’t huge, but the direction is clear—Asia-Pacific risk appetite is showing signs of recovery.
To understand how this market relates to crypto, you have to look at the local user base. South Korean retail traders are among the most active crypto participants globally. Local exchange trading volumes often exceed those of large-cap stocks, and the ups and downs of the kimchi premium tend to be more sensitive than the stock index. In Japan as well, crypto holdings are similarly large—when the Nikkei strengthens, it often reflects local capital’s risk appetite opening up.
So when markets in Korea and Japan turn from falling to rising, the underlying cause is likely the same group of people loosening the purse strings, and wallet activity may follow suit faster. But this is only emotion-driven transmission, not a definitive signal. The logic behind stock and crypto price action isn’t the same: equities are driven by corporate earnings and exchange rates, while crypto is driven by liquidity and narratives. Treating a single bullish candle as proof that crypto is about to take off can easily lead to overinterpretation.
A more reliable approach is to read this kind of tape as a “sentiment thermometer,” not as a buy/sell instruction. What really matters is the main storyline—U.S. dollar liquidity and interest rates.
$ETH #日韩股市 #市场情绪 #Asia crypto participation
To understand how this market relates to crypto, you have to look at the local user base. South Korean retail traders are among the most active crypto participants globally. Local exchange trading volumes often exceed those of large-cap stocks, and the ups and downs of the kimchi premium tend to be more sensitive than the stock index. In Japan as well, crypto holdings are similarly large—when the Nikkei strengthens, it often reflects local capital’s risk appetite opening up.
So when markets in Korea and Japan turn from falling to rising, the underlying cause is likely the same group of people loosening the purse strings, and wallet activity may follow suit faster. But this is only emotion-driven transmission, not a definitive signal. The logic behind stock and crypto price action isn’t the same: equities are driven by corporate earnings and exchange rates, while crypto is driven by liquidity and narratives. Treating a single bullish candle as proof that crypto is about to take off can easily lead to overinterpretation.
A more reliable approach is to read this kind of tape as a “sentiment thermometer,” not as a buy/sell instruction. What really matters is the main storyline—U.S. dollar liquidity and interest rates.
$ETH #日韩股市 #市场情绪 #Asia crypto participation
110
·
--
US stocks closed on Wednesday: the Dow fell by more than 400 points. The S&P 500 closed slightly lower, while the Nasdaq edged up. Midday market moves were shaken by inflation data, but the selloff was largely unwound into the close.
The real highlight isn’t the rise or fall of the indexes—it’s interest rates. August PCE year-over-year came in at 3.4%, below expectations, and the probability of an October rate hike fell to around 37%. But the yield on the 10-year U.S. Treasury was pushed above 5.3%, reaching the highest level since May 2002.
Long-end yields staying at elevated levels act as the same anchor weighing on all risk assets. The crypto market doesn’t have earnings seasons or dot plots to watch, but the “well” of dollar liquidity is shared by all assets. Every time U.S. Treasury yields step higher, the discount rate for global capital rises as well—assets with zero or minimal cash flow, like Bitcoin, are often hit first.
With data relatively mild and rates hanging high, bulls and bears are tangled up. In such a situation, more important than guessing direction is understanding how sensitive your positions are to interest rates. When rates hover at high levels, crypto must rely more on its own narrative and real liquidity conditions to hold up—outside support is limited.
$COTI #美股收盘 #美债收益率 #宏观流动性
US stocks closed on Wednesday: the Dow fell by more than 400 points. The S&P 500 closed slightly lower, while the Nasdaq edged up. Midday market moves were shaken by inflation data, but the selloff was largely unwound into the close.
The real highlight isn’t the rise or fall of the indexes—it’s interest rates. August PCE year-over-year came in at 3.4%, below expectations, and the probability of an October rate hike fell to around 37%. But the yield on the 10-year U.S. Treasury was pushed above 5.3%, reaching the highest level since May 2002.
Long-end yields staying at elevated levels act as the same anchor weighing on all risk assets. The crypto market doesn’t have earnings seasons or dot plots to watch, but the “well” of dollar liquidity is shared by all assets. Every time U.S. Treasury yields step higher, the discount rate for global capital rises as well—assets with zero or minimal cash flow, like Bitcoin, are often hit first.
With data relatively mild and rates hanging high, bulls and bears are tangled up. In such a situation, more important than guessing direction is understanding how sensitive your positions are to interest rates. When rates hover at high levels, crypto must rely more on its own narrative and real liquidity conditions to hold up—outside support is limited.
$COTI #美股收盘 #美债收益率 #宏观流动性
The real highlight isn’t the rise or fall of the indexes—it’s interest rates. August PCE year-over-year came in at 3.4%, below expectations, and the probability of an October rate hike fell to around 37%. But the yield on the 10-year U.S. Treasury was pushed above 5.3%, reaching the highest level since May 2002.
Long-end yields staying at elevated levels act as the same anchor weighing on all risk assets. The crypto market doesn’t have earnings seasons or dot plots to watch, but the “well” of dollar liquidity is shared by all assets. Every time U.S. Treasury yields step higher, the discount rate for global capital rises as well—assets with zero or minimal cash flow, like Bitcoin, are often hit first.
With data relatively mild and rates hanging high, bulls and bears are tangled up. In such a situation, more important than guessing direction is understanding how sensitive your positions are to interest rates. When rates hover at high levels, crypto must rely more on its own narrative and real liquidity conditions to hold up—outside support is limited.
$COTI #美股收盘 #美债收益率 #宏观流动性

222
·
--
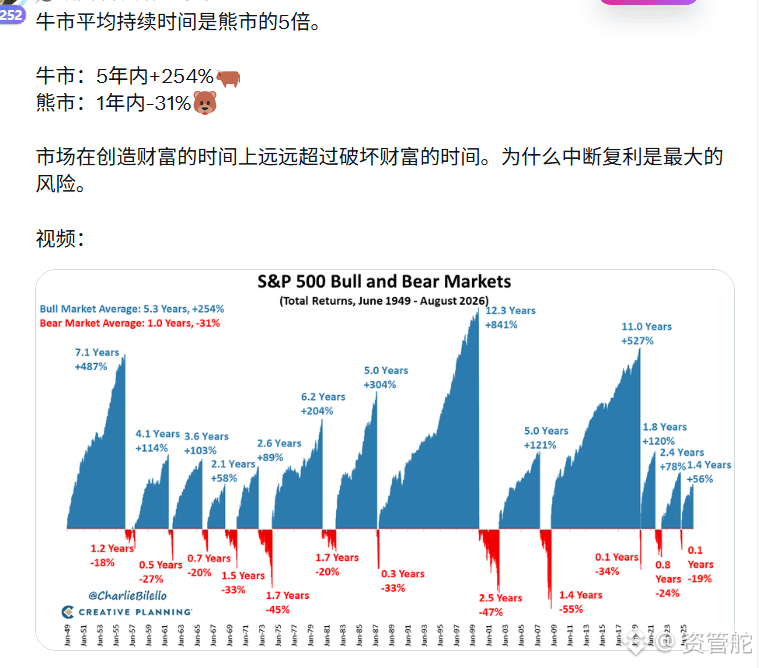
Here’s the S&P 500 data from nearly 77 years. In bull markets, the average cycle lasts 5.3 years and gains +254%. In bear markets, the average cycle lasts only 1 year and falls 31%.
The time it takes to build wealth is far longer than the time it takes to destroy it.
Those who truly lose big money are often the ones who exit at the bottom and cut the compounding chain themselves.
Crypto markets are even more volatile—bulls and bears are more extreme, but the logic is the same. If you can hold on, time will stand on your side.
$COTI #复利 #市场周期 #long-termism
Here’s the S&P 500 data from nearly 77 years. In bull markets, the average cycle lasts 5.3 years and gains +254%. In bear markets, the average cycle lasts only 1 year and falls 31%.
The time it takes to build wealth is far longer than the time it takes to destroy it.
Those who truly lose big money are often the ones who exit at the bottom and cut the compounding chain themselves.
Crypto markets are even more volatile—bulls and bears are more extreme, but the logic is the same. If you can hold on, time will stand on your side.
$COTI #复利 #市场周期 #long-termism
The time it takes to build wealth is far longer than the time it takes to destroy it.
Those who truly lose big money are often the ones who exit at the bottom and cut the compounding chain themselves.
Crypto markets are even more volatile—bulls and bears are more extreme, but the logic is the same. If you can hold on, time will stand on your side.
$COTI #复利 #市场周期 #long-termism
1
256
·
--
Article
Korean stock market opens lower; the other screen is also being watchedKorea’s KOSPI index opened lower today, down 0.3%, to 6814.49 points. It headed down as soon as the market opened.
The sentence itself means little. But in Korea, it carries different weight. South Korea is one of the most active retail crypto markets globally. The local exchanges’ daily trading volume can sometimes outpace that of the main board. When sentiment in the stock market turns cold, risk appetite shrinks, and actions in people’s wallets slow down accordingly.
The other end is macro. Rate-hike expectations and the strength of the US dollar hit first: they hit the won exchange rate, then transmit to the stock market, and only then do they reach the local crypto screen. The chain is long, but each link is connected.
Korean stock market opens lower; the other screen is also being watched
Korea’s KOSPI index opened lower today, down 0.3%, to 6814.49 points. It headed down as soon as the market opened.
The sentence itself means little. But in Korea, it carries different weight. South Korea is one of the most active retail crypto markets globally. The local exchanges’ daily trading volume can sometimes outpace that of the main board. When sentiment in the stock market turns cold, risk appetite shrinks, and actions in people’s wallets slow down accordingly.
The other end is macro. Rate-hike expectations and the strength of the US dollar hit first: they hit the won exchange rate, then transmit to the stock market, and only then do they reach the local crypto screen. The chain is long, but each link is connected.
The sentence itself means little. But in Korea, it carries different weight. South Korea is one of the most active retail crypto markets globally. The local exchanges’ daily trading volume can sometimes outpace that of the main board. When sentiment in the stock market turns cold, risk appetite shrinks, and actions in people’s wallets slow down accordingly.
The other end is macro. Rate-hike expectations and the strength of the US dollar hit first: they hit the won exchange rate, then transmit to the stock market, and only then do they reach the local crypto screen. The chain is long, but each link is connected.
1
190
·
--
Shanghai Bund Building: 100 years ago it was worth 100 gold ingots (each 1,000 grams)
This year, the Shanghai Bund Building is still worth 100 gold ingots
Shanghai Bund Building: 100 years ago it was worth 100 gold ingots (each 1,000 grams)
This year, the Shanghai Bund Building is still worth 100 gold ingots
This year, the Shanghai Bund Building is still worth 100 gold ingots
1
253
·
--
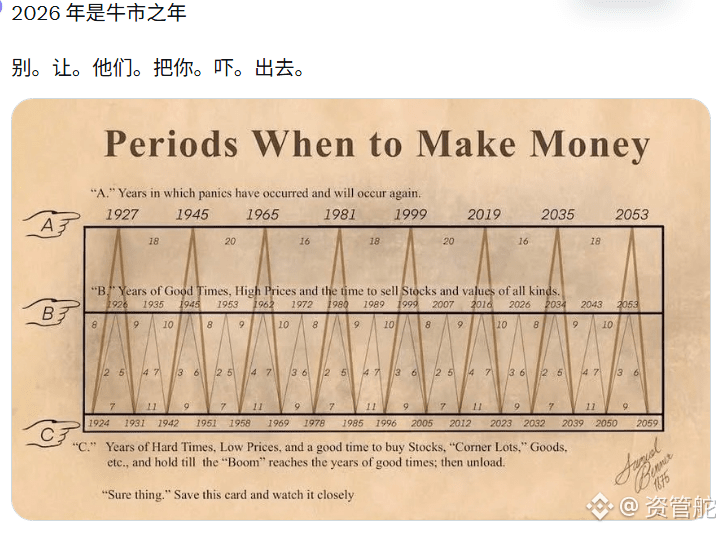
In 1875, the farmer Benner drew this periodic table. The panic years come around about once every 18 years. 2019 has just passed, and the next one is said to fall in 2035. In 2026, it lands in the B band; the word he marked was “good harvest season” and “high price range.” The intended message was a reminder to sell in batches.
It’s been 150 years, and the chart is still being passed around. Bitcoin’s four-year cycle is often used to be cross-checked with it. There are many people who get scared out, but few who truly hold to the cycle. Don’t let them scare you out. The second half of that is just as important—don’t let the market shake you into letting go.
$COTI #周期 #市场情绪 #Bitcoin
In 1875, the farmer Benner drew this periodic table. The panic years come around about once every 18 years. 2019 has just passed, and the next one is said to fall in 2035. In 2026, it lands in the B band; the word he marked was “good harvest season” and “high price range.” The intended message was a reminder to sell in batches.
It’s been 150 years, and the chart is still being passed around. Bitcoin’s four-year cycle is often used to be cross-checked with it. There are many people who get scared out, but few who truly hold to the cycle. Don’t let them scare you out. The second half of that is just as important—don’t let the market shake you into letting go.
$COTI #周期 #市场情绪 #Bitcoin
It’s been 150 years, and the chart is still being passed around. Bitcoin’s four-year cycle is often used to be cross-checked with it. There are many people who get scared out, but few who truly hold to the cycle. Don’t let them scare you out. The second half of that is just as important—don’t let the market shake you into letting go.
$COTI #周期 #市场情绪 #Bitcoin
565
·
--
An ordinary person’s list of high-quality assets—extremely realistic:
1. The core: saving money, sleeping, and exercising.
2. The blacklist: don’t start a business, don’t open a store, don’t smoke or drink, don’t stay up late, don’t gamble.
3. Asset side: US stocks, dividends, gold, government bonds. A practical vehicle: a secondhand oil car. A must-have: secondhand real estate.
4. On the mind: don’t get addicted to grand narratives—just focus on the everyday basics of life: food, cooking oil, and salt.
An ordinary person’s list of high-quality assets—extremely realistic:
1. The core: saving money, sleeping, and exercising.
2. The blacklist: don’t start a business, don’t open a store, don’t smoke or drink, don’t stay up late, don’t gamble.
3. Asset side: US stocks, dividends, gold, government bonds. A practical vehicle: a secondhand oil car. A must-have: secondhand real estate.
4. On the mind: don’t get addicted to grand narratives—just focus on the everyday basics of life: food, cooking oil, and salt.
1. The core: saving money, sleeping, and exercising.
2. The blacklist: don’t start a business, don’t open a store, don’t smoke or drink, don’t stay up late, don’t gamble.
3. Asset side: US stocks, dividends, gold, government bonds. A practical vehicle: a secondhand oil car. A must-have: secondhand real estate.
4. On the mind: don’t get addicted to grand narratives—just focus on the everyday basics of life: food, cooking oil, and salt.
XAU-0.64%
AGGETF-0.67%
2
235
·
--
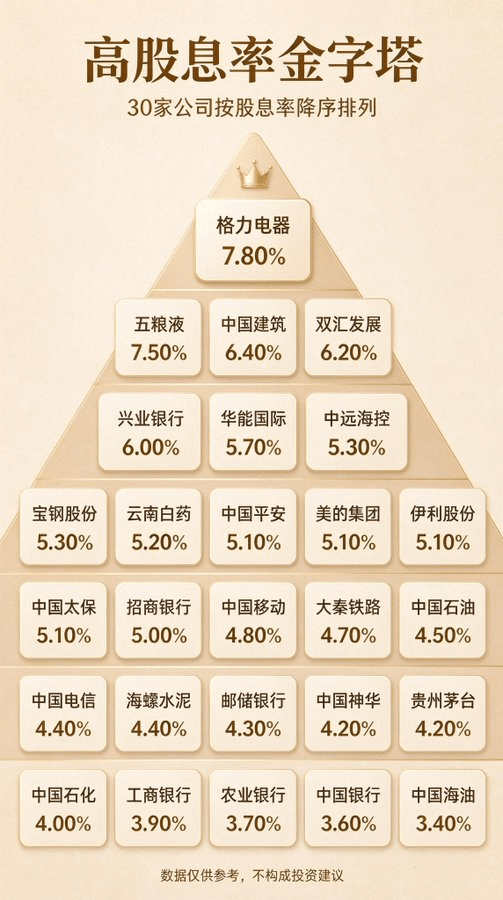
High dividend-producing materials $MOVR
{future}(MOVRUSDT)
High dividend-producing materials $MOVR
1
91
·
--

Article
Nickel: the leverage for the energy transitionLiqin Resources today listed on the Shenzhen Stock Exchange. It is a leading company in the entire nickel industry chain, with operations in both A-share and H-share markets. From 2023 to 2025, revenue rose from RMB 21.2 billion to RMB 40.2 billion, and attributable net profit increased from RMB 1.05 billion to RMB 2.86 billion. In the first three quarters of 2026, net profit is expected to grow another 54% to 59%.
What drives the growth? Nickel is a core material for new-energy vehicle batteries and energy storage. The demand curve for electric vehicles and grid energy storage hasn’t fallen, so upstream resources’ pricing power is firmly in its hands. Nickel ore in Indonesia and the Philippines is even “gripping” the global supply chain’s neck.
This is related to encryption. AI computing power is exploding, and data centers’ electricity consumption is rising exponentially. Energy storage and grid expansion have become unavoidable bottlenecks. Metals like nickel, essentially, are the underlying chips for the energy transition.
Nickel: the leverage for the energy transition
Liqin Resources today listed on the Shenzhen Stock Exchange. It is a leading company in the entire nickel industry chain, with operations in both A-share and H-share markets. From 2023 to 2025, revenue rose from RMB 21.2 billion to RMB 40.2 billion, and attributable net profit increased from RMB 1.05 billion to RMB 2.86 billion. In the first three quarters of 2026, net profit is expected to grow another 54% to 59%.
What drives the growth? Nickel is a core material for new-energy vehicle batteries and energy storage. The demand curve for electric vehicles and grid energy storage hasn’t fallen, so upstream resources’ pricing power is firmly in its hands. Nickel ore in Indonesia and the Philippines is even “gripping” the global supply chain’s neck.
This is related to encryption. AI computing power is exploding, and data centers’ electricity consumption is rising exponentially. Energy storage and grid expansion have become unavoidable bottlenecks. Metals like nickel, essentially, are the underlying chips for the energy transition.
What drives the growth? Nickel is a core material for new-energy vehicle batteries and energy storage. The demand curve for electric vehicles and grid energy storage hasn’t fallen, so upstream resources’ pricing power is firmly in its hands. Nickel ore in Indonesia and the Philippines is even “gripping” the global supply chain’s neck.
This is related to encryption. AI computing power is exploding, and data centers’ electricity consumption is rising exponentially. Energy storage and grid expansion have become unavoidable bottlenecks. Metals like nickel, essentially, are the underlying chips for the energy transition.
2
364
·
--
The three worst disaster areas with the most severe domestic inventory backlog:
1. Gasoline-powered cars;
2. Commercial housing;
3. Women of eligible age.#股票财报季 $MOVR
{future}(MOVRUSDT)
The three worst disaster areas with the most severe domestic inventory backlog:
1. Gasoline-powered cars;
2. Commercial housing;
3. Women of eligible age.#股票财报季 $MOVR
1. Gasoline-powered cars;
2. Commercial housing;
3. Women of eligible age.#股票财报季 $MOVR
1
23
·
--
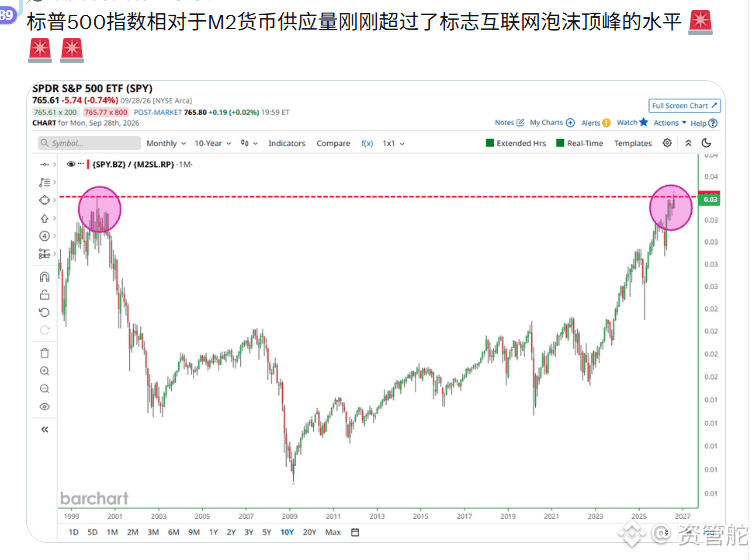
The S&P 500’s ratio relative to M2 money supply just nudged above the level of the 2000 internet bubble peak. This is an intuitive yardstick for how expensive valuations have become.
The last time it reached this point, Nasdaq took fifteen years to regain lost ground.
But this time there’s a different variable. M2 itself is re-expanding, the liquidity pool is getting bigger, so a rising ratio doesn’t necessarily signal bubble conditions. In expensive U.S. stocks, money still needs somewhere to go. Scarce assets with a fixed total supply are naturally candidates for this repricing.
When valuations hit extreme levels, markets can sometimes keep running a bit longer. Still, history is there, and at this point the margin for error is very low.
#标普500 #M2 #valuation
The S&P 500’s ratio relative to M2 money supply just nudged above the level of the 2000 internet bubble peak. This is an intuitive yardstick for how expensive valuations have become.
The last time it reached this point, Nasdaq took fifteen years to regain lost ground.
But this time there’s a different variable. M2 itself is re-expanding, the liquidity pool is getting bigger, so a rising ratio doesn’t necessarily signal bubble conditions. In expensive U.S. stocks, money still needs somewhere to go. Scarce assets with a fixed total supply are naturally candidates for this repricing.
When valuations hit extreme levels, markets can sometimes keep running a bit longer. Still, history is there, and at this point the margin for error is very low.
#标普500 #M2 #valuation
The last time it reached this point, Nasdaq took fifteen years to regain lost ground.
But this time there’s a different variable. M2 itself is re-expanding, the liquidity pool is getting bigger, so a rising ratio doesn’t necessarily signal bubble conditions. In expensive U.S. stocks, money still needs somewhere to go. Scarce assets with a fixed total supply are naturally candidates for this repricing.
When valuations hit extreme levels, markets can sometimes keep running a bit longer. Still, history is there, and at this point the margin for error is very low.
#标普500 #M2 #valuation
1
44
·
--

Article
AI Drug Discovery: Big Players Bet BigRoche has recently laid its cards on the table: it plans to build an in-house AI laboratory, aiming for “AI independence” in drug discovery. The remaining $2.4 billion in R&D funds will be reallocated, with at most 20 new molecular entities to be advanced by 2030. By the end of 2024, Target Nexus will participate in 80% of research decision-making. Success rates in Phase 3 trials are expected to jump from 65% to above 80%.
It’s not just Roche. Anthropic sets up wet labs, Novo Nordisk uses Claude, and Eli Lilly pushes an AI drug-discovery platform. Big players are collectively moving AI from a supporting tool toward the foundation of R&D.
What does encryption have to do with this? AI agents control real-world devices and run dry/wet closed-loop processes—this is exactly the real-world mapping of the DePIN and AI agent narrative. Traditional capital is putting heavy bets on the idea that “AI isn’t a bubble,” adding fuel to the “AI is not a bubble” argument. The AI sector is itself an important piece of this crypto cycle.
AI Drug Discovery: Big Players Bet Big
Roche has recently laid its cards on the table: it plans to build an in-house AI laboratory, aiming for “AI independence” in drug discovery. The remaining $2.4 billion in R&D funds will be reallocated, with at most 20 new molecular entities to be advanced by 2030. By the end of 2024, Target Nexus will participate in 80% of research decision-making. Success rates in Phase 3 trials are expected to jump from 65% to above 80%.
It’s not just Roche. Anthropic sets up wet labs, Novo Nordisk uses Claude, and Eli Lilly pushes an AI drug-discovery platform. Big players are collectively moving AI from a supporting tool toward the foundation of R&D.
What does encryption have to do with this? AI agents control real-world devices and run dry/wet closed-loop processes—this is exactly the real-world mapping of the DePIN and AI agent narrative. Traditional capital is putting heavy bets on the idea that “AI isn’t a bubble,” adding fuel to the “AI is not a bubble” argument. The AI sector is itself an important piece of this crypto cycle.
It’s not just Roche. Anthropic sets up wet labs, Novo Nordisk uses Claude, and Eli Lilly pushes an AI drug-discovery platform. Big players are collectively moving AI from a supporting tool toward the foundation of R&D.
What does encryption have to do with this? AI agents control real-world devices and run dry/wet closed-loop processes—this is exactly the real-world mapping of the DePIN and AI agent narrative. Traditional capital is putting heavy bets on the idea that “AI isn’t a bubble,” adding fuel to the “AI is not a bubble” argument. The AI sector is itself an important piece of this crypto cycle.
8
Log in to explore more content
Join global crypto users on Binance Square
⚡️ Get latest and useful information about crypto.
💬 Trusted by the world’s largest crypto exchange.
👍 Discover real insights from verified creators.
Email / Phone number
Trending Topics
EtherGains70.9%InQ3
1,521 views
105 Discussing
#ethergains70.9%inq3
🚀 ETH Shatters Expectations with a Massive 70.9% Q3 Rally—Is Altseason Finally Here?🔥
Ethereum (ETH) just wrapped up one of the most explosive third quarters in its history, locking in a massive +70.9% gain! After a brutal first half of the year (Q1: -29.2% | Q2: -25.2%), ETH completely flipped the script, defying macro headwinds, rising Treasury yields, and a surging US Dollar Index.
$ETH
Institutional Inflows & Spot ETFs Acceleration 🏦
Spot Ethereum ETFs and corporate treasury allocations saw sustained net inflows throughout the quarter. Wall Street's institutional appetite for ETH as a yield-bearing, utility-driven asset has reached new record highs.
ETH Outperforms Bitcoin in Q3 ⚔️
While Bitcoin ($BTC) had a solid quarter, Ethereum significantly outpaced it. This strength is reigniting market discussions around an incoming Altseason, as capital historical flows from BTC into high-cap altcoins following major ETH breakouts.
$ZEC
Staking Dynamics & Supply Shock 🔒
Defi activity and Layer-2 expansion continue to lock up vast amounts of ETH. With staking yields remaining attractive and total supply held on centralized exchanges steadily dropping, market liquidity for physical ETH remains tight.
📊 Technical Landscape & What’s Next for Q4
Key Resistance Watch: ETH recently pushed past local highs around $2,775, with traders eyeing the psychological $3,000 zone as the primary Q4 target.
Macro Risk Factor: Keep an eye on short-position spikes on derivative exchanges and broader Fed monetary policy updates, as leverage wipeouts can create short-term volatility following quarterly closes.
💬 What do you think? Will Ethereum hit $3,000+ in Q4, or are we due for a short-term consolidation before the next leg up? Drop your predictions below! 👇
#US10YearYieldNears5.3% #Ethereum #ETH
Lily星星
·1 Likes
·53 views
US10YearYieldNears5.3%
29,389 views
347 Discussing
DollarIndexHitsHighestSinceMay2025
786 views
67 Discussing