
BN大菜猪
441 Posts

BN大菜猪
Report
Block User
Open Trade

BNB Holder
Occasional Trader
5.7 Years
9 Following
58 Followers
30 Liked
Posts
Portfolio
·
--
Article
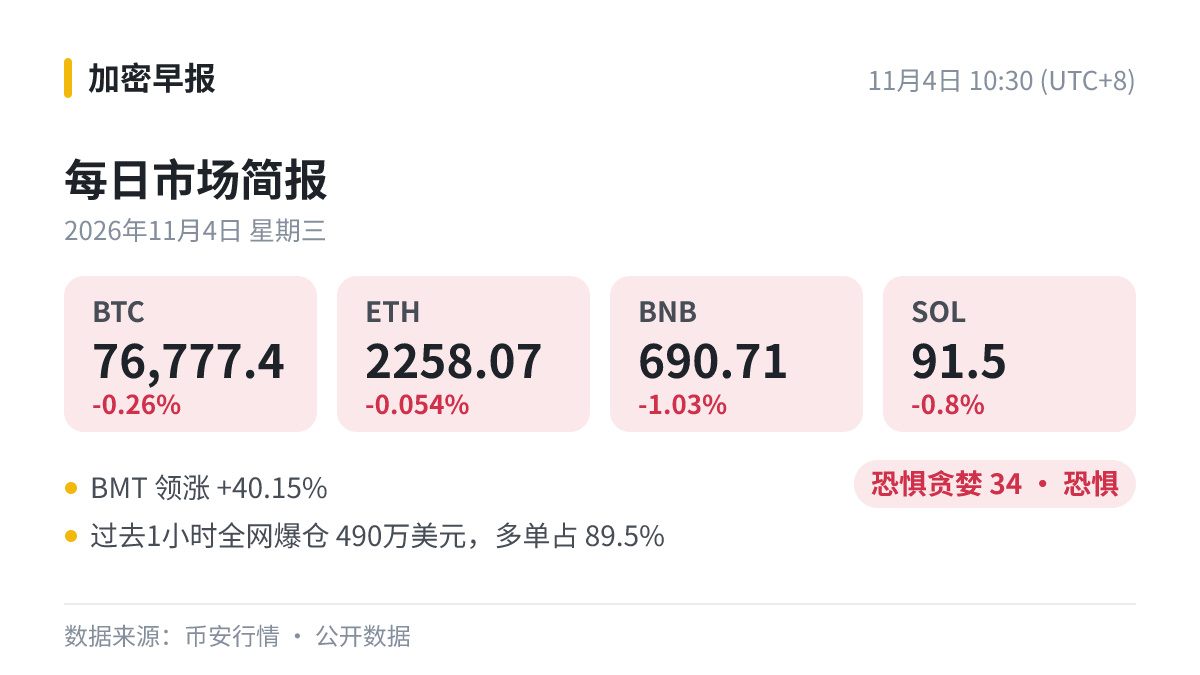
A look around this morning, November 4: BMT is the biggest gainerTop story today:
Bitcoin miners' October revenue hit $1.215 billion, an 11-month high, while the hash price fell 17.54% over the month
Read this first, then compare it with the market to see whether prices have factored in the news.
Market overview:
$BTC 76,777.4 (-0.26%)
$ETH 2258.07 (-0.054%)
BNB 690.71 (-1.03%)
SOL 91.5 (-0.8%)
The market is moving sideways, with bulls and bears both waiting for a signal.
What's being discussed on the plaza:
#BTC #币安
Sentiment and flows:
Fear & Greed Index: 34 (Fear), up 8 from yesterday
$4.9 million in liquidations across the market over the past hour, 89.5% of them from long positions
A look around this morning, November 4: BMT is the biggest gainer
Top story today:
Bitcoin miners' October revenue hit $1.215 billion, an 11-month high, while the hash price fell 17.54% over the month
Read this first, then compare it with the market to see whether prices have factored in the news.
Market overview:
$BTC 76,777.4 (-0.26%)
$ETH 2258.07 (-0.054%)
BNB 690.71 (-1.03%)
SOL 91.5 (-0.8%)
The market is moving sideways, with bulls and bears both waiting for a signal.
What's being discussed on the plaza:
#BTC #币安
Sentiment and flows:
Fear & Greed Index: 34 (Fear), up 8 from yesterday
$4.9 million in liquidations across the market over the past hour, 89.5% of them from long positions
Bitcoin miners' October revenue hit $1.215 billion, an 11-month high, while the hash price fell 17.54% over the month
Read this first, then compare it with the market to see whether prices have factored in the news.
Market overview:
$BTC 76,777.4 (-0.26%)
$ETH 2258.07 (-0.054%)
BNB 690.71 (-1.03%)
SOL 91.5 (-0.8%)
The market is moving sideways, with bulls and bears both waiting for a signal.
What's being discussed on the plaza:
#BTC #币安
Sentiment and flows:
Fear & Greed Index: 34 (Fear), up 8 from yesterday
$4.9 million in liquidations across the market over the past hour, 89.5% of them from long positions
40
·
--
Someone asked: How do you assess how concentrated a particular coin’s holdings are?
My answer: Before looking at the holdings of major holders, first exclude addresses belonging to liquidity pools, burn addresses, exchange wallets, and locked-token contracts. You can check major holder addresses in real time on a block explorer. When major holders transfer tokens to an exchange, it’s often seen as a sign they may be preparing to sell, though it doesn’t necessarily mean they’ll actually sell.
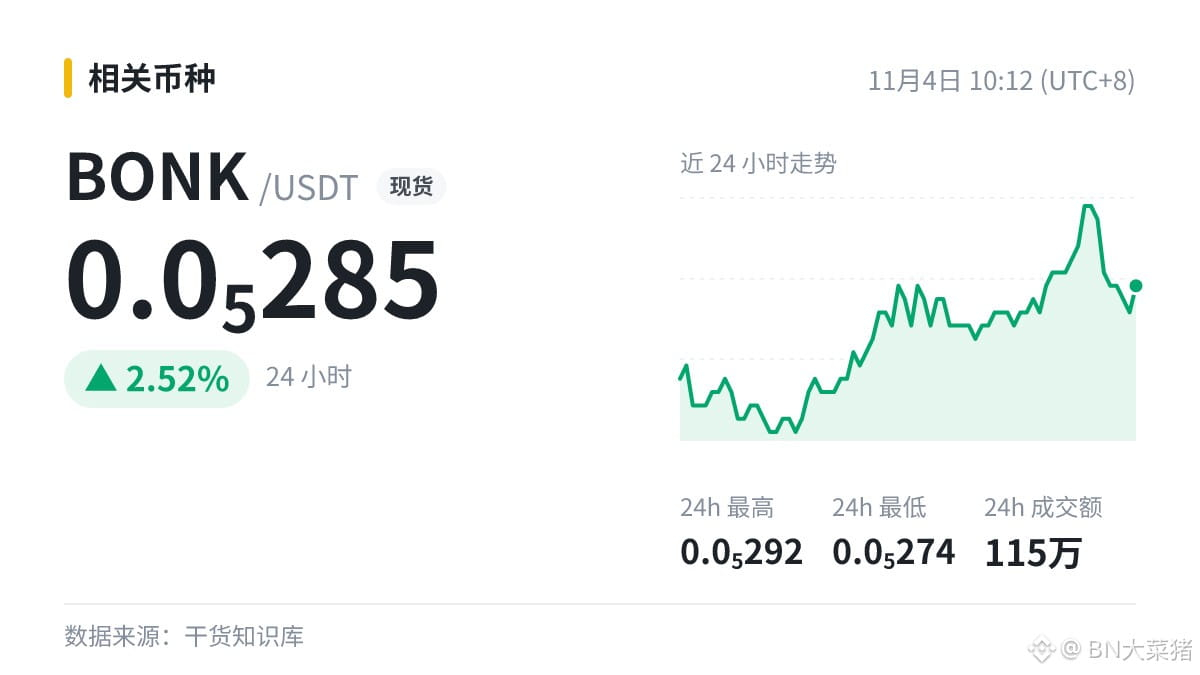
$BONK 0.0₅285 (+2.52%)
If you know someone who’s just getting into crypto, feel free to send this to them.
Someone asked: How do you assess how concentrated a particular coin’s holdings are?
My answer: Before looking at the holdings of major holders, first exclude addresses belonging to liquidity pools, burn addresses, exchange wallets, and locked-token contracts. You can check major holder addresses in real time on a block explorer. When major holders transfer tokens to an exchange, it’s often seen as a sign they may be preparing to sell, though it doesn’t necessarily mean they’ll actually sell.
$BONK 0.0₅285 (+2.52%)
If you know someone who’s just getting into crypto, feel free to send this to them.
My answer: Before looking at the holdings of major holders, first exclude addresses belonging to liquidity pools, burn addresses, exchange wallets, and locked-token contracts. You can check major holder addresses in real time on a block explorer. When major holders transfer tokens to an exchange, it’s often seen as a sign they may be preparing to sell, though it doesn’t necessarily mean they’ll actually sell.
$BONK 0.0₅285 (+2.52%)
If you know someone who’s just getting into crypto, feel free to send this to them.
52
·
--
Vitalik warns of the risks of AI security and social media manipulation!
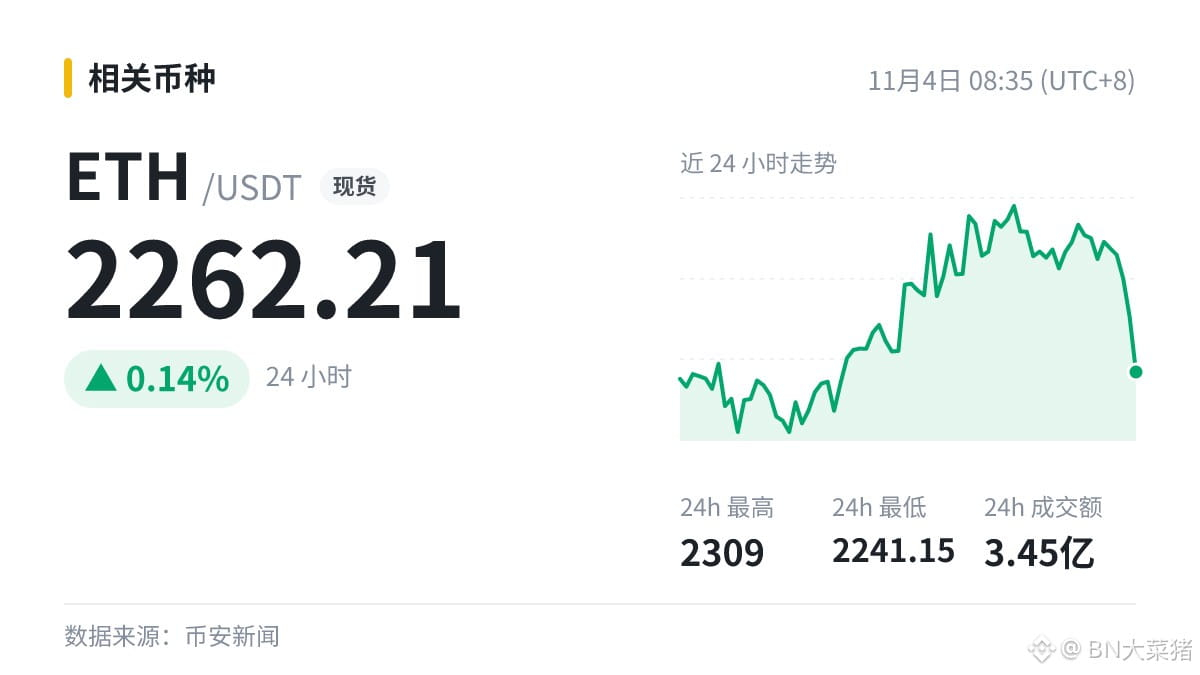
$ETH (24h +0.14%). No rush to call it bullish or bearish; either way, volatility may be a bit higher.
Are you going to make a move?
Vitalik warns of the risks of AI security and social media manipulation!
$ETH (24h +0.14%). No rush to call it bullish or bearish; either way, volatility may be a bit higher.
Are you going to make a move?
$ETH (24h +0.14%). No rush to call it bullish or bearish; either way, volatility may be a bit higher.
Are you going to make a move?
65
·
--
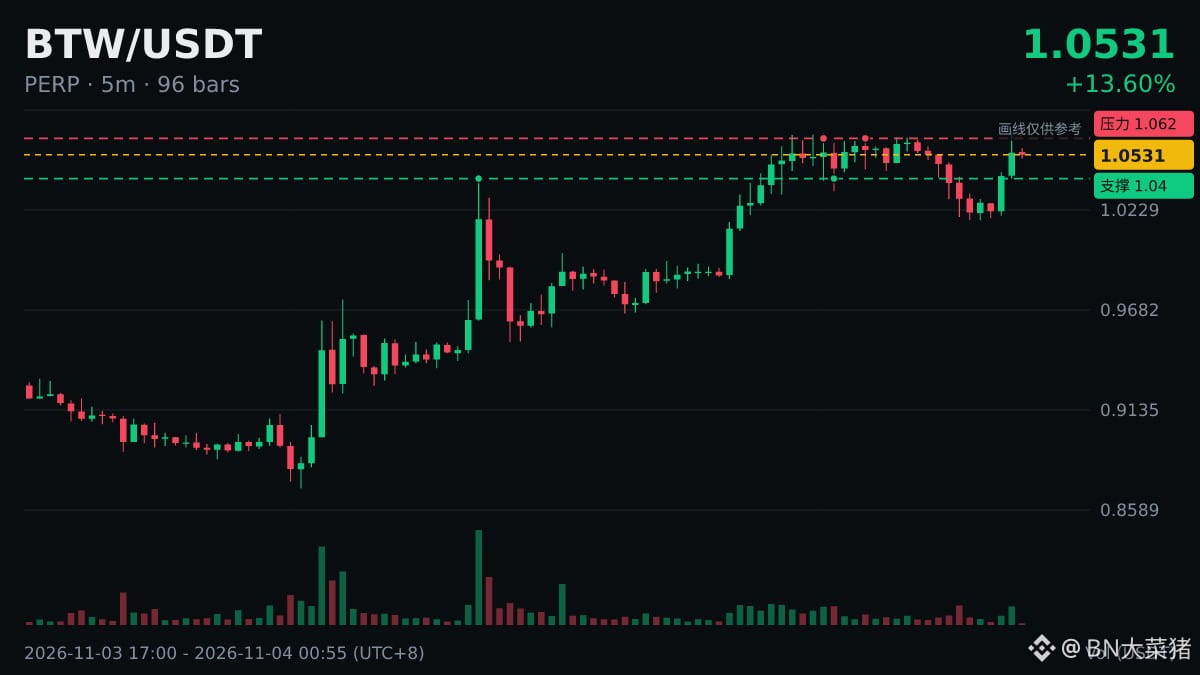
The candlestick body matters more than the wick: a steady close shows the direction is real.
Here’s one right in front of us: $BTW 5-minute surge of 3.41% to 1.0536.
The candlestick body matters more than the wick: a steady close shows the direction is real.
Here’s one right in front of us: $BTW 5-minute surge of 3.41% to 1.0536.
Here’s one right in front of us: $BTW 5-minute surge of 3.41% to 1.0536.
6
·
--
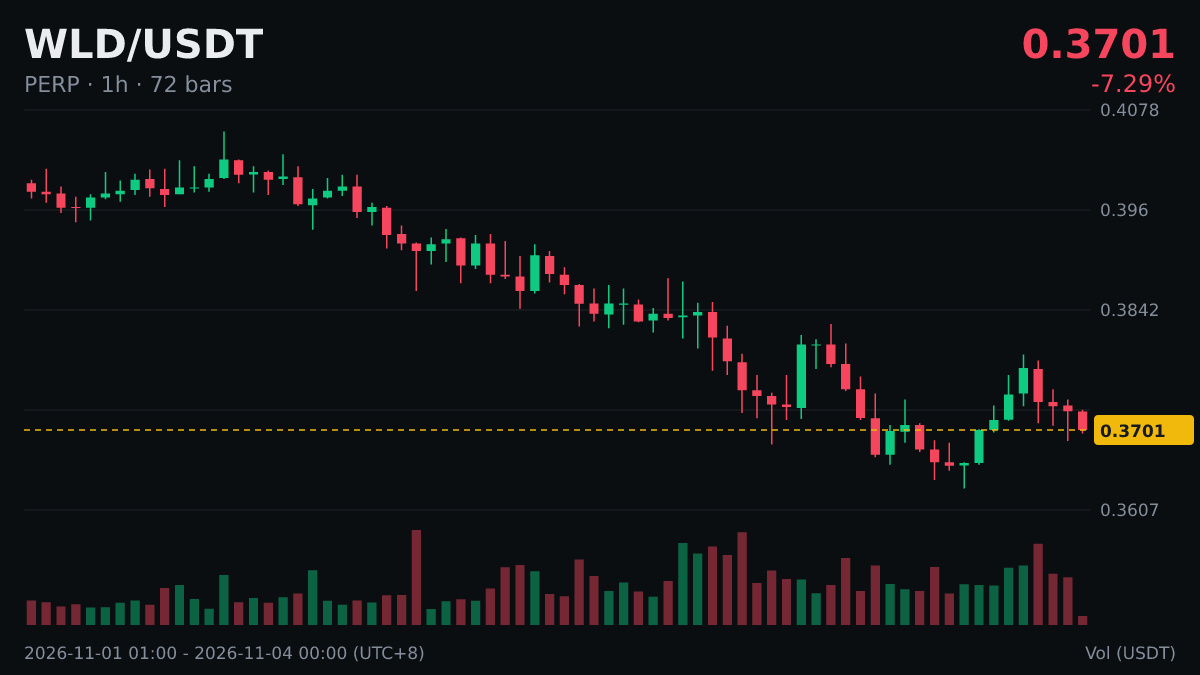
“DeepSeek Agent Tutorial for Beginners” (Episode 20) | $WLD in the AI concept sector, 14.16 million traded in 24 hours
Let's compare prices before and after it appeared in trending searches to see whether it really drove the price up. Data has no bias; emotions can be misleading, so let's look at the data first.
“DeepSeek Agent Tutorial for Beginners” (Episode 20) | $WLD in the AI concept sector, 14.16 million traded in 24 hours
Let's compare prices before and after it appeared in trending searches to see whether it really drove the price up. Data has no bias; emotions can be misleading, so let's look at the data first.
Let's compare prices before and after it appeared in trending searches to see whether it really drove the price up. Data has no bias; emotions can be misleading, so let's look at the data first.
·
--
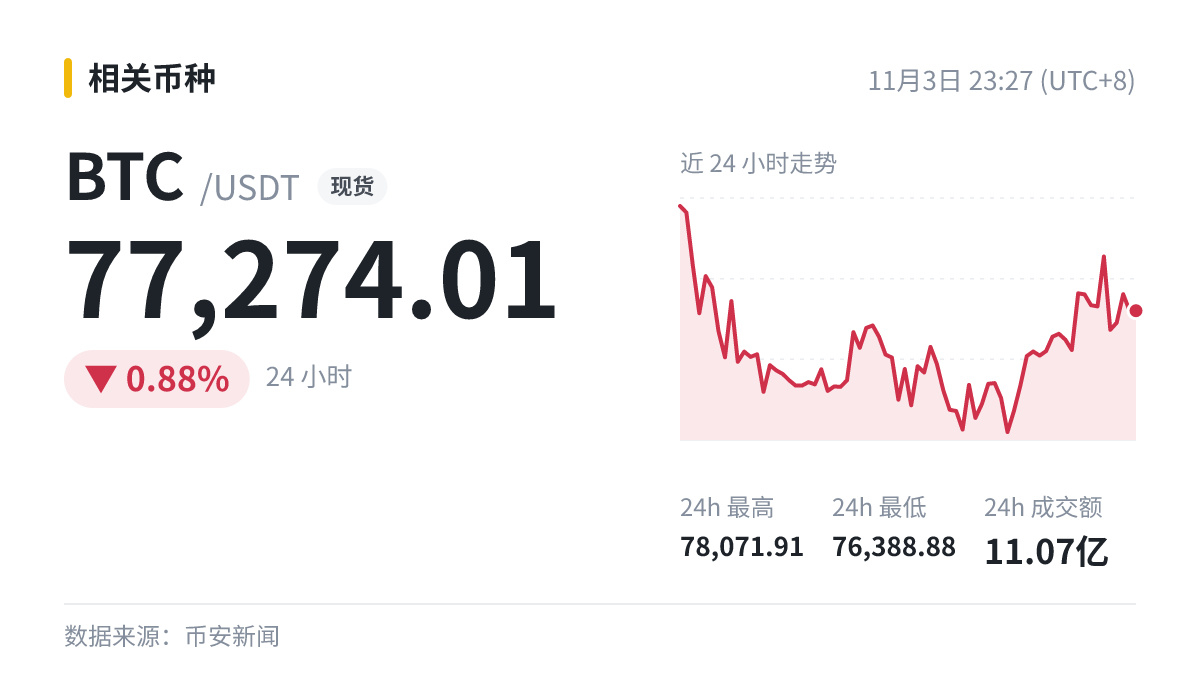
23:27 Flash update just seen: The 10-year U.S. Treasury yield rose 5.36 basis points to 4.948%
Dollar-related pricing indicators like this tend to weigh on risk assets when they strengthen, and vice versa when they fall.
$BTC latest: 77274.01.
23:27 Flash update just seen: The 10-year U.S. Treasury yield rose 5.36 basis points to 4.948%
Dollar-related pricing indicators like this tend to weigh on risk assets when they strengthen, and vice versa when they fall.
$BTC latest: 77274.01.
Dollar-related pricing indicators like this tend to weigh on risk assets when they strengthen, and vice versa when they fall.
$BTC latest: 77274.01.
BTC-0.12%
TLTETF-0.20%
1
·
--
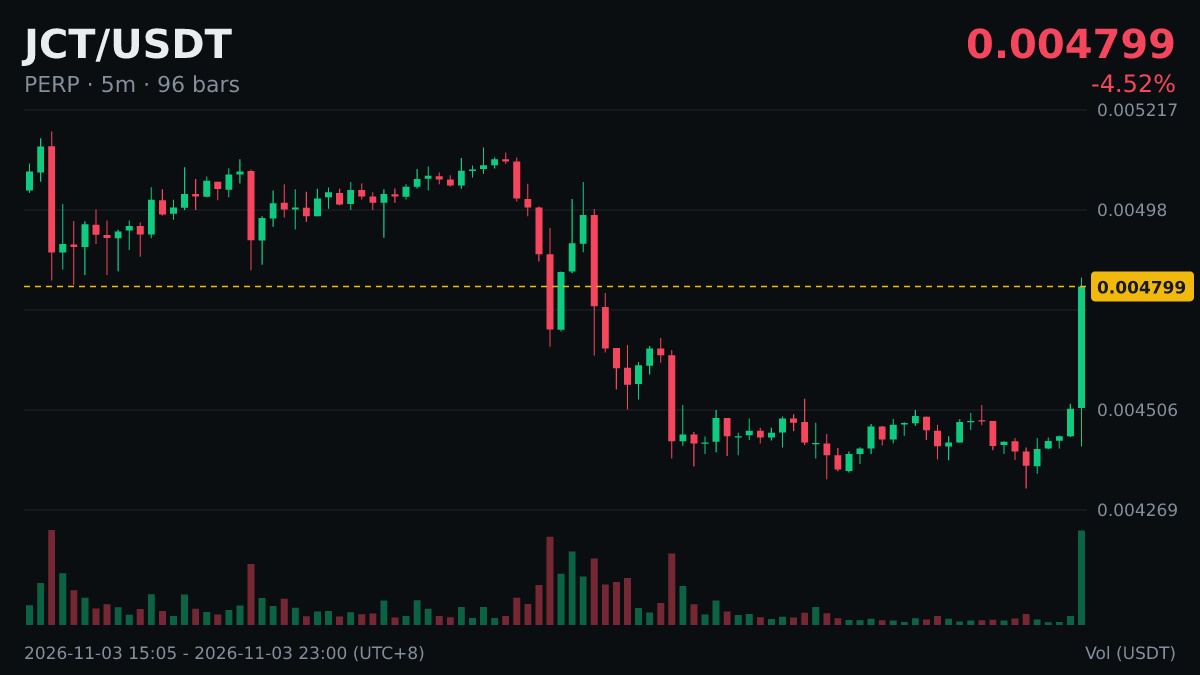
It's taking off, folks! $JCT 5 minutes, up 6.08%, at 0.004795.
Intraday strength doesn't mean the broader trend has changed; the daily chart structure should be considered too.
It's taking off, folks! $JCT 5 minutes, up 6.08%, at 0.004795.
Intraday strength doesn't mean the broader trend has changed; the daily chart structure should be considered too.
Intraday strength doesn't mean the broader trend has changed; the daily chart structure should be considered too.
1
·
--
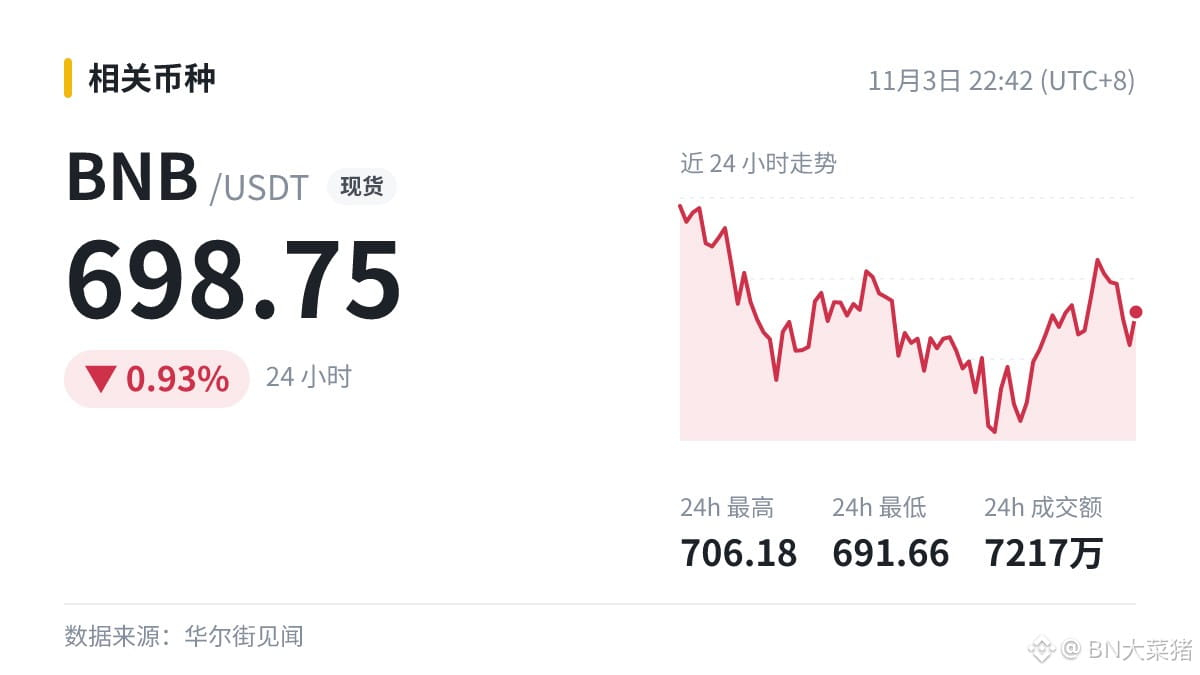
To be honest, what concerns me most right now is this: Binance has contacted several independent security firms regarding a follow-up assessment.
Personally, I don't think the impact will be significant—just take it as a reference.
What do you think of $BNB 's trend?
To be honest, what concerns me most right now is this: Binance has contacted several independent security firms regarding a follow-up assessment.
Personally, I don't think the impact will be significant—just take it as a reference.
What do you think of $BNB 's trend?
Personally, I don't think the impact will be significant—just take it as a reference.
What do you think of $BNB 's trend?
·
--
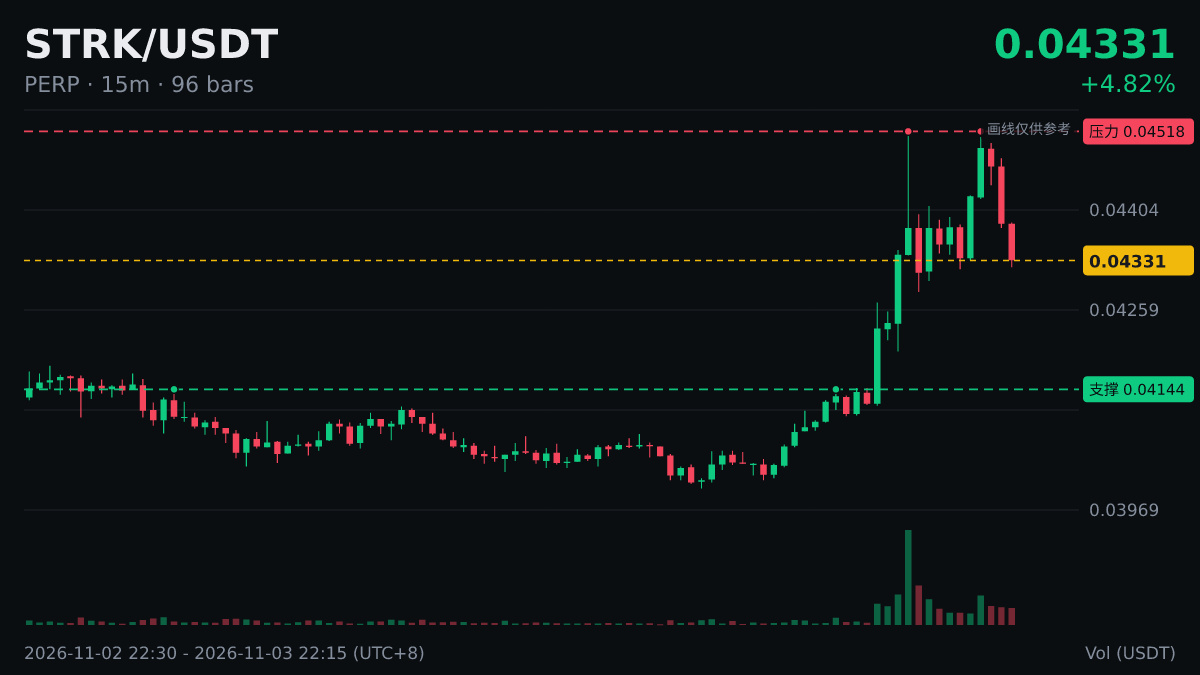
Volume Surge Notes|$STRK
1-hour trading value: 5.63 million, 3.7 times the average; down 0.76%.
High volatility means the potential upside is matched by the potential drawdown.
Volume Surge Notes|$STRK
1-hour trading value: 5.63 million, 3.7 times the average; down 0.76%.
High volatility means the potential upside is matched by the potential drawdown.
1-hour trading value: 5.63 million, 3.7 times the average; down 0.76%.
High volatility means the potential upside is matched by the potential drawdown.
4
·
--
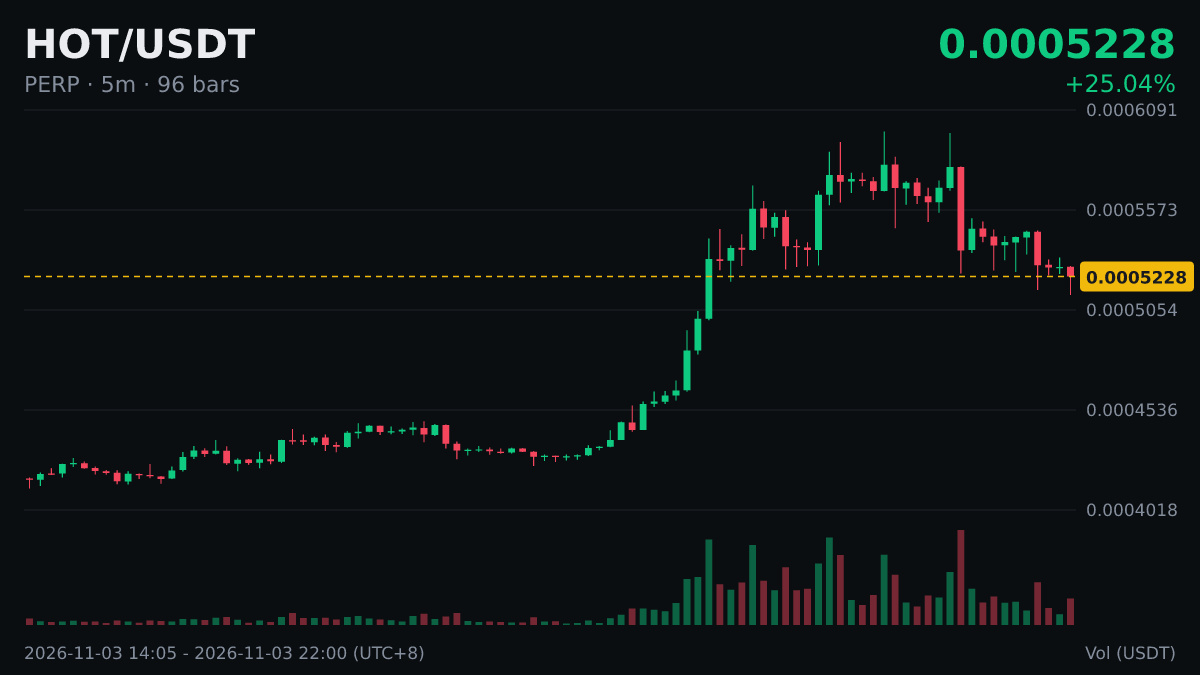
$HOT 1 hours -7.61%, at 0.000524.
When it’s falling fast, don’t rush to bet on a rebound.
$HOT 1 hours -7.61%, at 0.000524.
When it’s falling fast, don’t rush to bet on a rebound.
When it’s falling fast, don’t rush to bet on a rebound.
·
--
Take a look
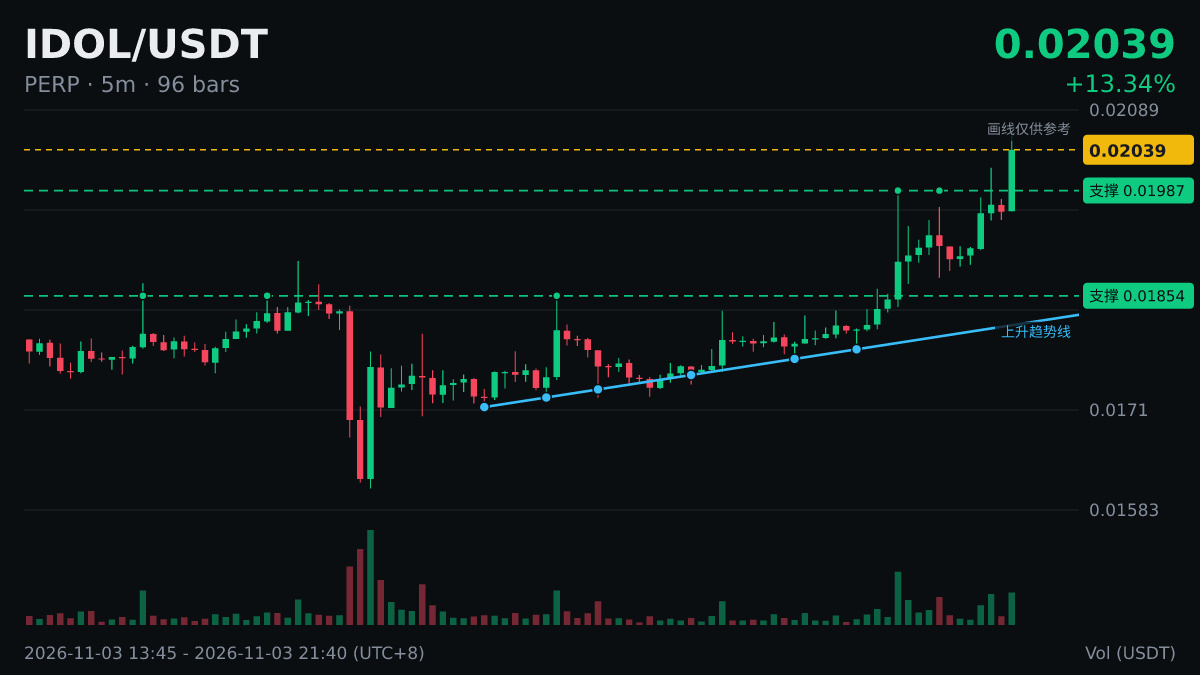
$IDOL 1 hours and it went straight up +10.15%
Current price: 0.02042. Are the shorts still alive?
That wick was brutal. Short-term sentiment is running hot, so think about your stop-loss before chasing. If you missed the move, drop a 1.
Take a look
$IDOL 1 hours and it went straight up +10.15%
Current price: 0.02042. Are the shorts still alive?
That wick was brutal. Short-term sentiment is running hot, so think about your stop-loss before chasing. If you missed the move, drop a 1.
$IDOL 1 hours and it went straight up +10.15%
Current price: 0.02042. Are the shorts still alive?
That wick was brutal. Short-term sentiment is running hot, so think about your stop-loss before chasing. If you missed the move, drop a 1.
2
·
--
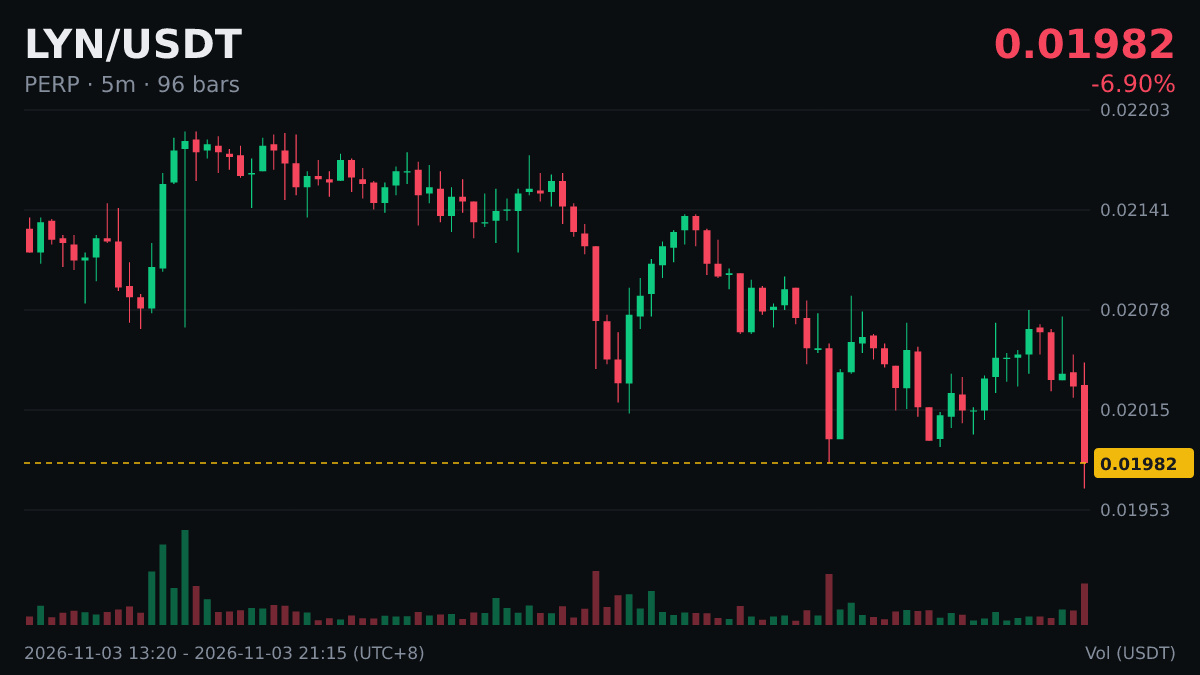
Are funds dumping $LYN ? Down 2.15% in 5 minutes, currently at 0.01971.
Watching where the money is flowing is much more useful than predicting whether prices will rise or fall.
Are funds dumping $LYN ? Down 2.15% in 5 minutes, currently at 0.01971.
Watching where the money is flowing is much more useful than predicting whether prices will rise or fall.
Watching where the money is flowing is much more useful than predicting whether prices will rise or fall.
1
·
--
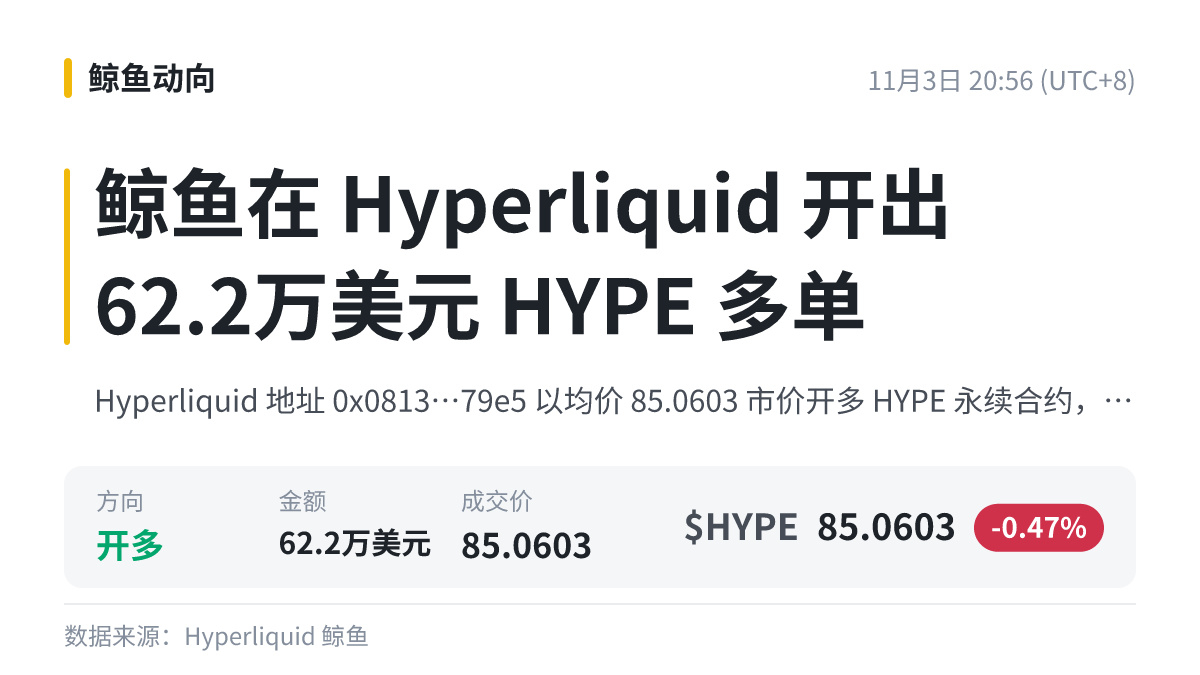
A whale opened a $622,000 long position on Hyperliquid in $HYPE at a price of 85.0603.
The three stages of watching from the sidelines: Wow — envy — quietly opening the calculator and realizing you're short by several zeros.
Did your stop-loss hold? Tell the truth in the comments.
A whale opened a $622,000 long position on Hyperliquid in $HYPE at a price of 85.0603.
The three stages of watching from the sidelines: Wow — envy — quietly opening the calculator and realizing you're short by several zeros.
Did your stop-loss hold? Tell the truth in the comments.
The three stages of watching from the sidelines: Wow — envy — quietly opening the calculator and realizing you're short by several zeros.
Did your stop-loss hold? Tell the truth in the comments.
1
·
--
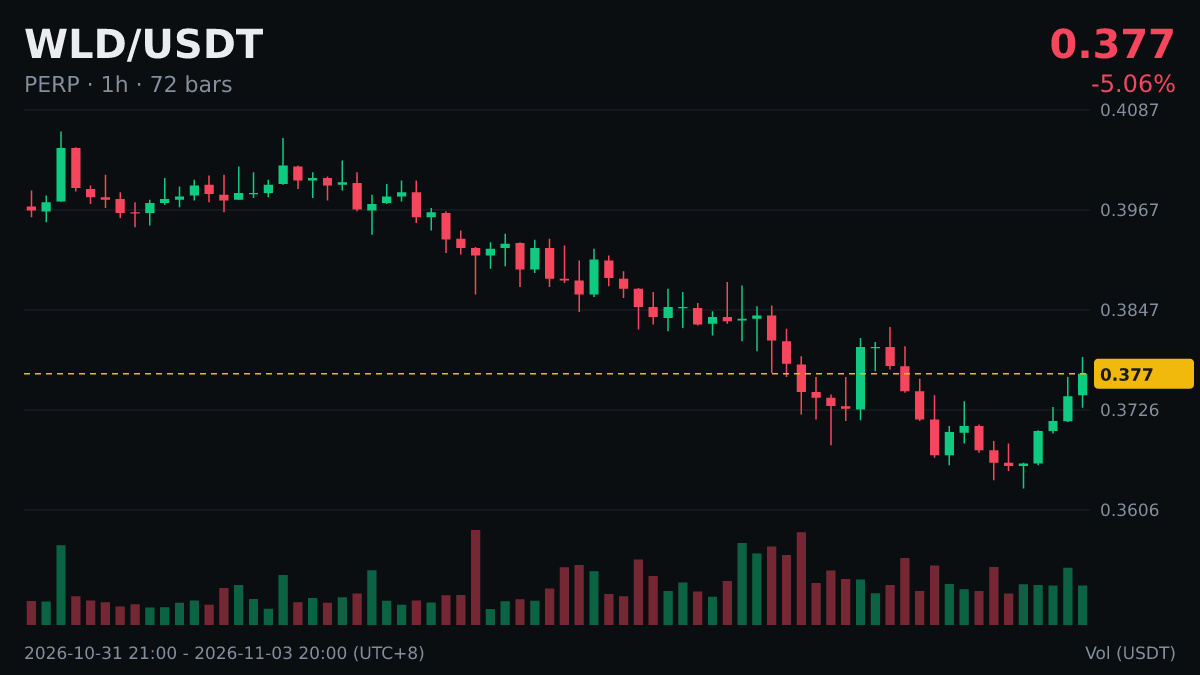
Hot Topic Watch: “Tokens are becoming the water, electricity, and coal of the AI era”
I’d assess this connection in terms of how strong it is: for a sector-wide rally, the leading coin needs to be able to lift the others; it’s hard for a single coin to gain strength on its own.
$WLD Current price: 0.3771. Vote in the comments: up or down?
Hot Topic Watch: “Tokens are becoming the water, electricity, and coal of the AI era”
I’d assess this connection in terms of how strong it is: for a sector-wide rally, the leading coin needs to be able to lift the others; it’s hard for a single coin to gain strength on its own.
$WLD Current price: 0.3771. Vote in the comments: up or down?
I’d assess this connection in terms of how strong it is: for a sector-wide rally, the leading coin needs to be able to lift the others; it’s hard for a single coin to gain strength on its own.
$WLD Current price: 0.3771. Vote in the comments: up or down?
6
·
--
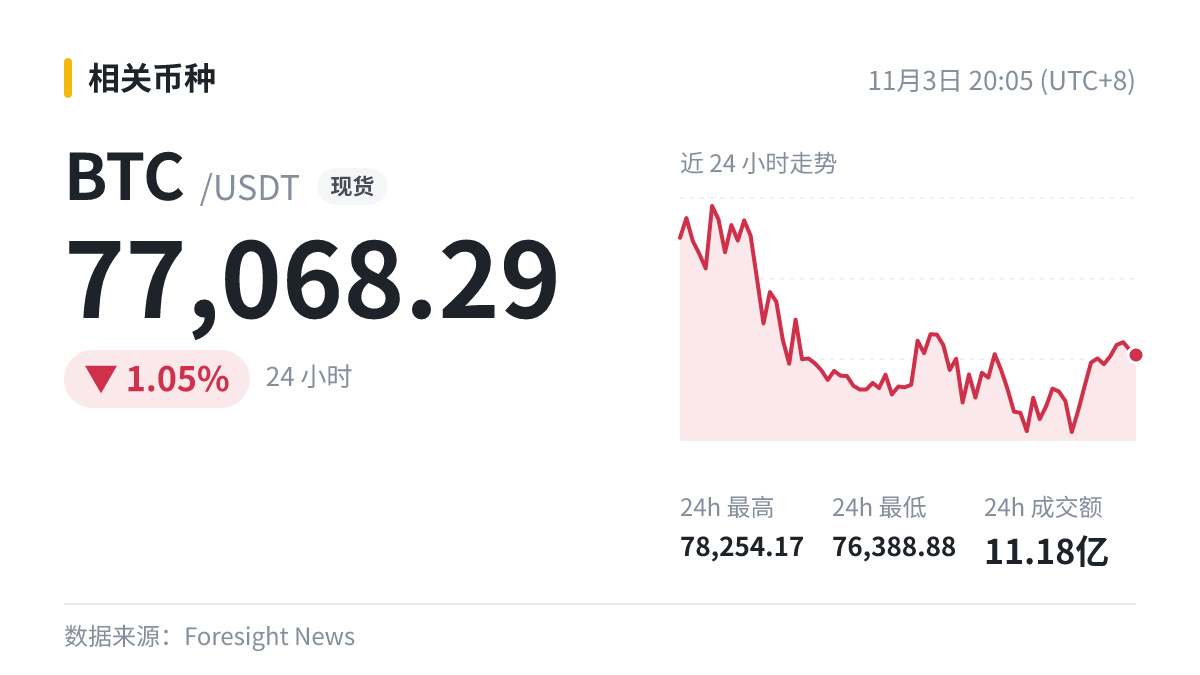
$BTC Fundamental update: People’s Bank of China Governor Pan Gongsheng and Central Bank of Oman Governor Ahmed signed a Memorandum of Understanding on Strengthening Cooperation in Digital Payments and Central Bank Digital Currencies.
Technically, watch whether the 24-hour high of 78254.17 can be reclaimed and whether the low of 76388.88 can hold. News drives sentiment; price levels set the pace.
$BTC Fundamental update: People’s Bank of China Governor Pan Gongsheng and Central Bank of Oman Governor Ahmed signed a Memorandum of Understanding on Strengthening Cooperation in Digital Payments and Central Bank Digital Currencies.
Technically, watch whether the 24-hour high of 78254.17 can be reclaimed and whether the low of 76388.88 can hold. News drives sentiment; price levels set the pace.
Technically, watch whether the 24-hour high of 78254.17 can be reclaimed and whether the low of 76388.88 can hold. News drives sentiment; price levels set the pace.
7
·
--
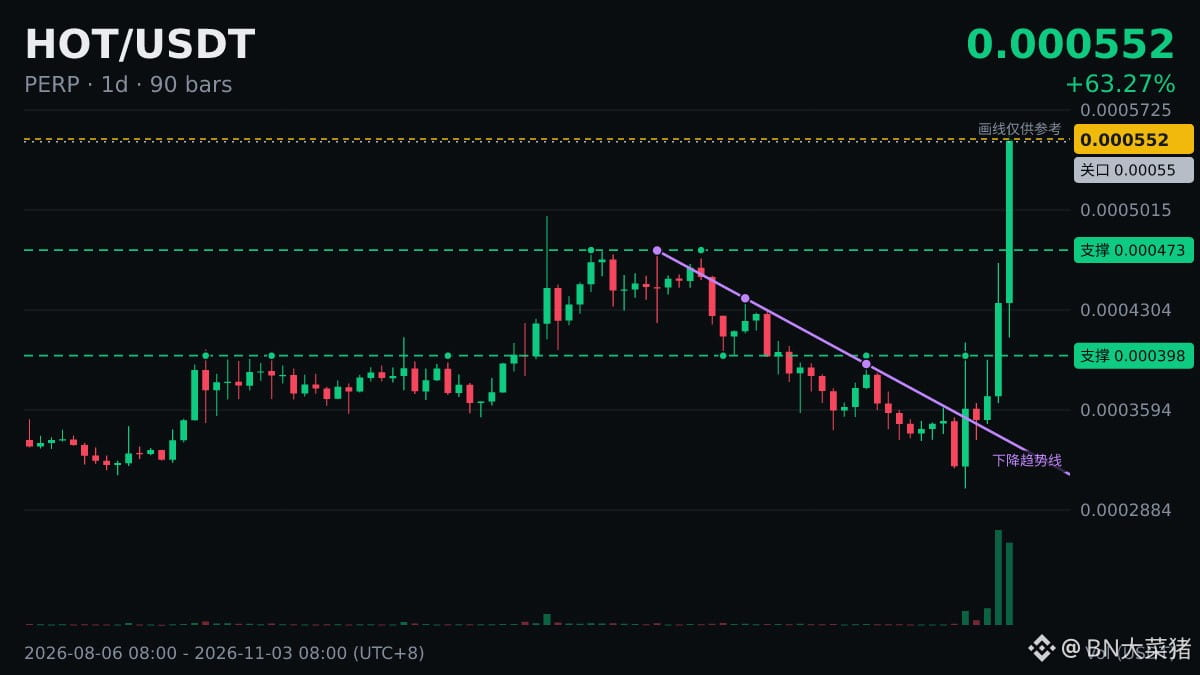
$HOT Daily RSI is 76.6, in overbought territory.
Let’s unpack what this number means.
RSI 50 is often seen as the dividing line between strength and weakness: staying above 50 indicates that upward momentum is dominant, while staying below it suggests the opposite.
RSI is calculated from historical prices, so it reflects price movements that have already happened; it can’t tell you what to do next.
It’s safer to look for confirmation from several indicators rather than relying on just one, but even more signals can’t provide a definite answer.
$HOT Daily RSI is 76.6, in overbought territory.
Let’s unpack what this number means.
RSI 50 is often seen as the dividing line between strength and weakness: staying above 50 indicates that upward momentum is dominant, while staying below it suggests the opposite.
RSI is calculated from historical prices, so it reflects price movements that have already happened; it can’t tell you what to do next.
It’s safer to look for confirmation from several indicators rather than relying on just one, but even more signals can’t provide a definite answer.
Let’s unpack what this number means.
RSI 50 is often seen as the dividing line between strength and weakness: staying above 50 indicates that upward momentum is dominant, while staying below it suggests the opposite.
RSI is calculated from historical prices, so it reflects price movements that have already happened; it can’t tell you what to do next.
It’s safer to look for confirmation from several indicators rather than relying on just one, but even more signals can’t provide a definite answer.
·
--
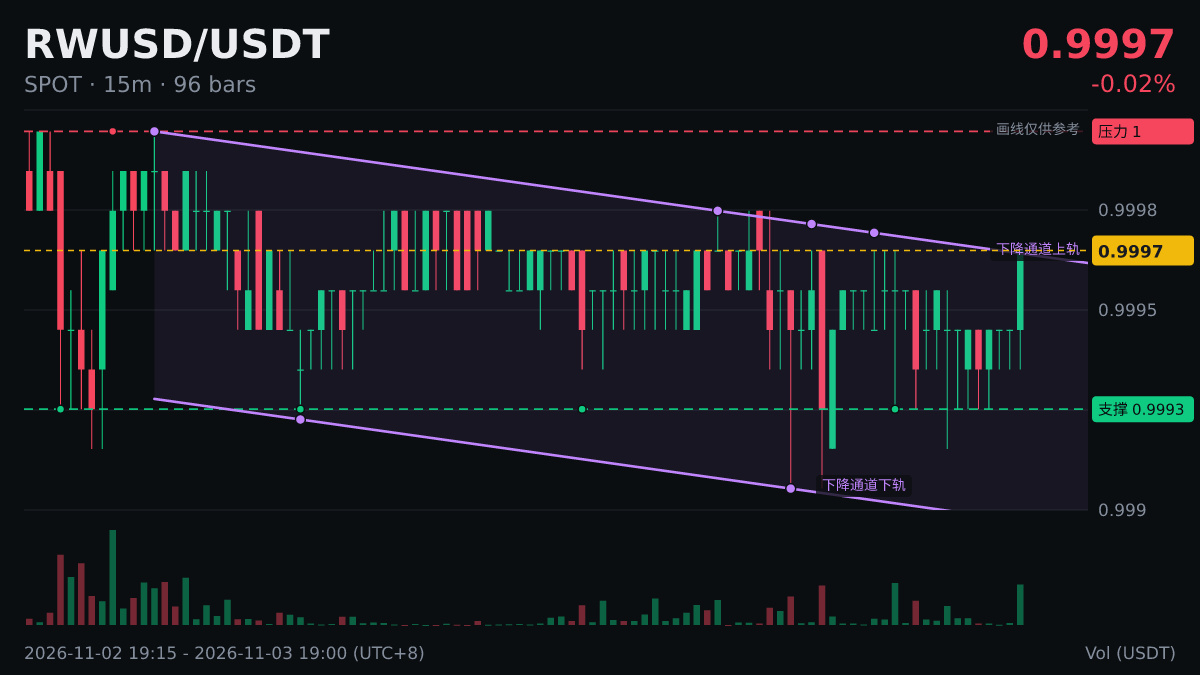
Volume surged 23.1-fold over $RWUSD 5 minutes, with $1.24 million traded. The price was basically unchanged, at 0.9997.
Divergence between volume and price often signals increased turnover as the market awaits a directional move. Leave a comment and share your view.
#RWUSD
Volume surged 23.1-fold over $RWUSD 5 minutes, with $1.24 million traded. The price was basically unchanged, at 0.9997.
Divergence between volume and price often signals increased turnover as the market awaits a directional move. Leave a comment and share your view.
#RWUSD
Divergence between volume and price often signals increased turnover as the market awaits a directional move. Leave a comment and share your view.
#RWUSD
3
·
--
The data only shows the current situation; you still have to draw your own conclusions.
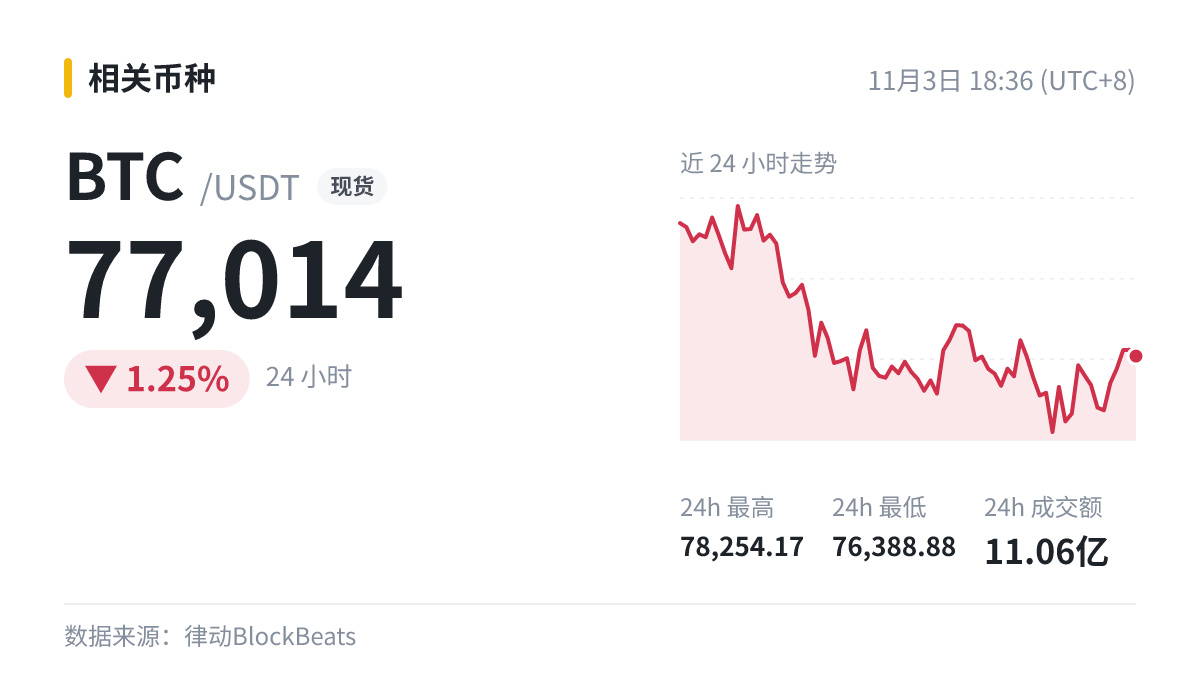
For example, this item: A trader went long on crude oil with 10x leverage on Hyperliquid, with a position size of $148 million, $BTC 24h -1.25%, and a trading volume of $1.106 billion.
It looks like good news on the surface, but it’s worth taking another look to see whether the original text included any caveats.
The data only shows the current situation; you still have to draw your own conclusions.
For example, this item: A trader went long on crude oil with 10x leverage on Hyperliquid, with a position size of $148 million, $BTC 24h -1.25%, and a trading volume of $1.106 billion.
It looks like good news on the surface, but it’s worth taking another look to see whether the original text included any caveats.
For example, this item: A trader went long on crude oil with 10x leverage on Hyperliquid, with a position size of $148 million, $BTC 24h -1.25%, and a trading volume of $1.106 billion.
It looks like good news on the surface, but it’s worth taking another look to see whether the original text included any caveats.
·
--
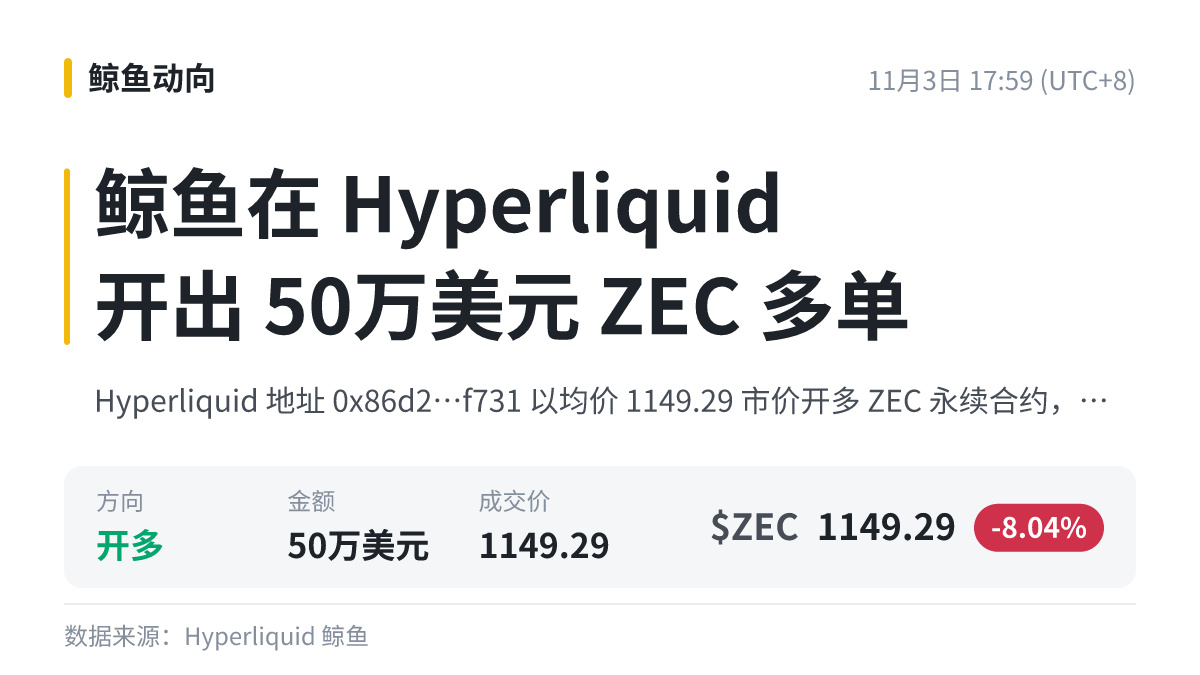
I just saw a whale go long $500,000 worth of $ZEC on Hyperliquid.
The whale's position is way bigger than ours.
I just saw a whale go long $500,000 worth of $ZEC on Hyperliquid.
The whale's position is way bigger than ours.
The whale's position is way bigger than ours.
3
·
--
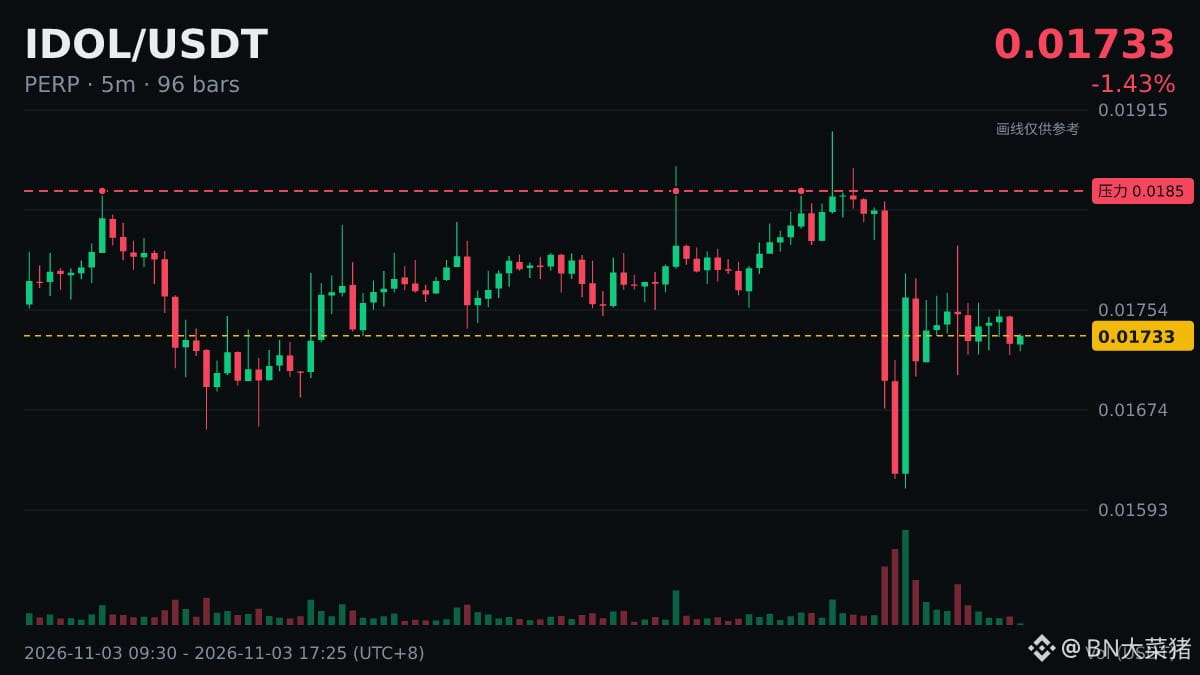
Are major players pushing $IDOL ?
Up 6.02% in 1 hour, with 24-hour trading volume at $252 million. At this pace, it’s usually a sign of a surge in aggressive buying.
The momentum is still fairly measured. Keep an eye on whether large orders continue to come in.
Share your prediction in the comments, and check back in a few days to see how it turns out.
Are major players pushing $IDOL ?
Up 6.02% in 1 hour, with 24-hour trading volume at $252 million. At this pace, it’s usually a sign of a surge in aggressive buying.
The momentum is still fairly measured. Keep an eye on whether large orders continue to come in.
Share your prediction in the comments, and check back in a few days to see how it turns out.
Up 6.02% in 1 hour, with 24-hour trading volume at $252 million. At this pace, it’s usually a sign of a surge in aggressive buying.
The momentum is still fairly measured. Keep an eye on whether large orders continue to come in.
Share your prediction in the comments, and check back in a few days to see how it turns out.
Log in to explore more content
Join global crypto users on Binance Square
⚡️ Get latest and useful information about crypto.
💬 Trusted by the world’s largest crypto exchange.
👍 Discover real insights from verified creators.
Email / Phone number
Trending Topics
USMidterms-WhatAreMarketsExpecting?
3,583 views
118 Discussing
UBS: Rising Democratic 'Blue Wave' Expectations Deepen Market Risk Aversion
Binance News
·0 Likes
·546 views
USOctoberNFP-AreRateCutsStillPossible
196,032 views
1,480 Discussing
AMDBeatsExpectations-AINarrativeContinues
612 views
55 Discussing