
dharztrend
1.1k Posts

dharztrend
Report
Block User
BTC trader focused on price action, market structure, and disciplined trading. Sharing Bitcoin chart analysis with clear entry points, stop loss, and take profi
Open Trade
Frequent Trader
4.9 Years
360 Following
486 Followers
1.5K+ Liked
Posts
Portfolio
All
Quotes
Videos
·
--
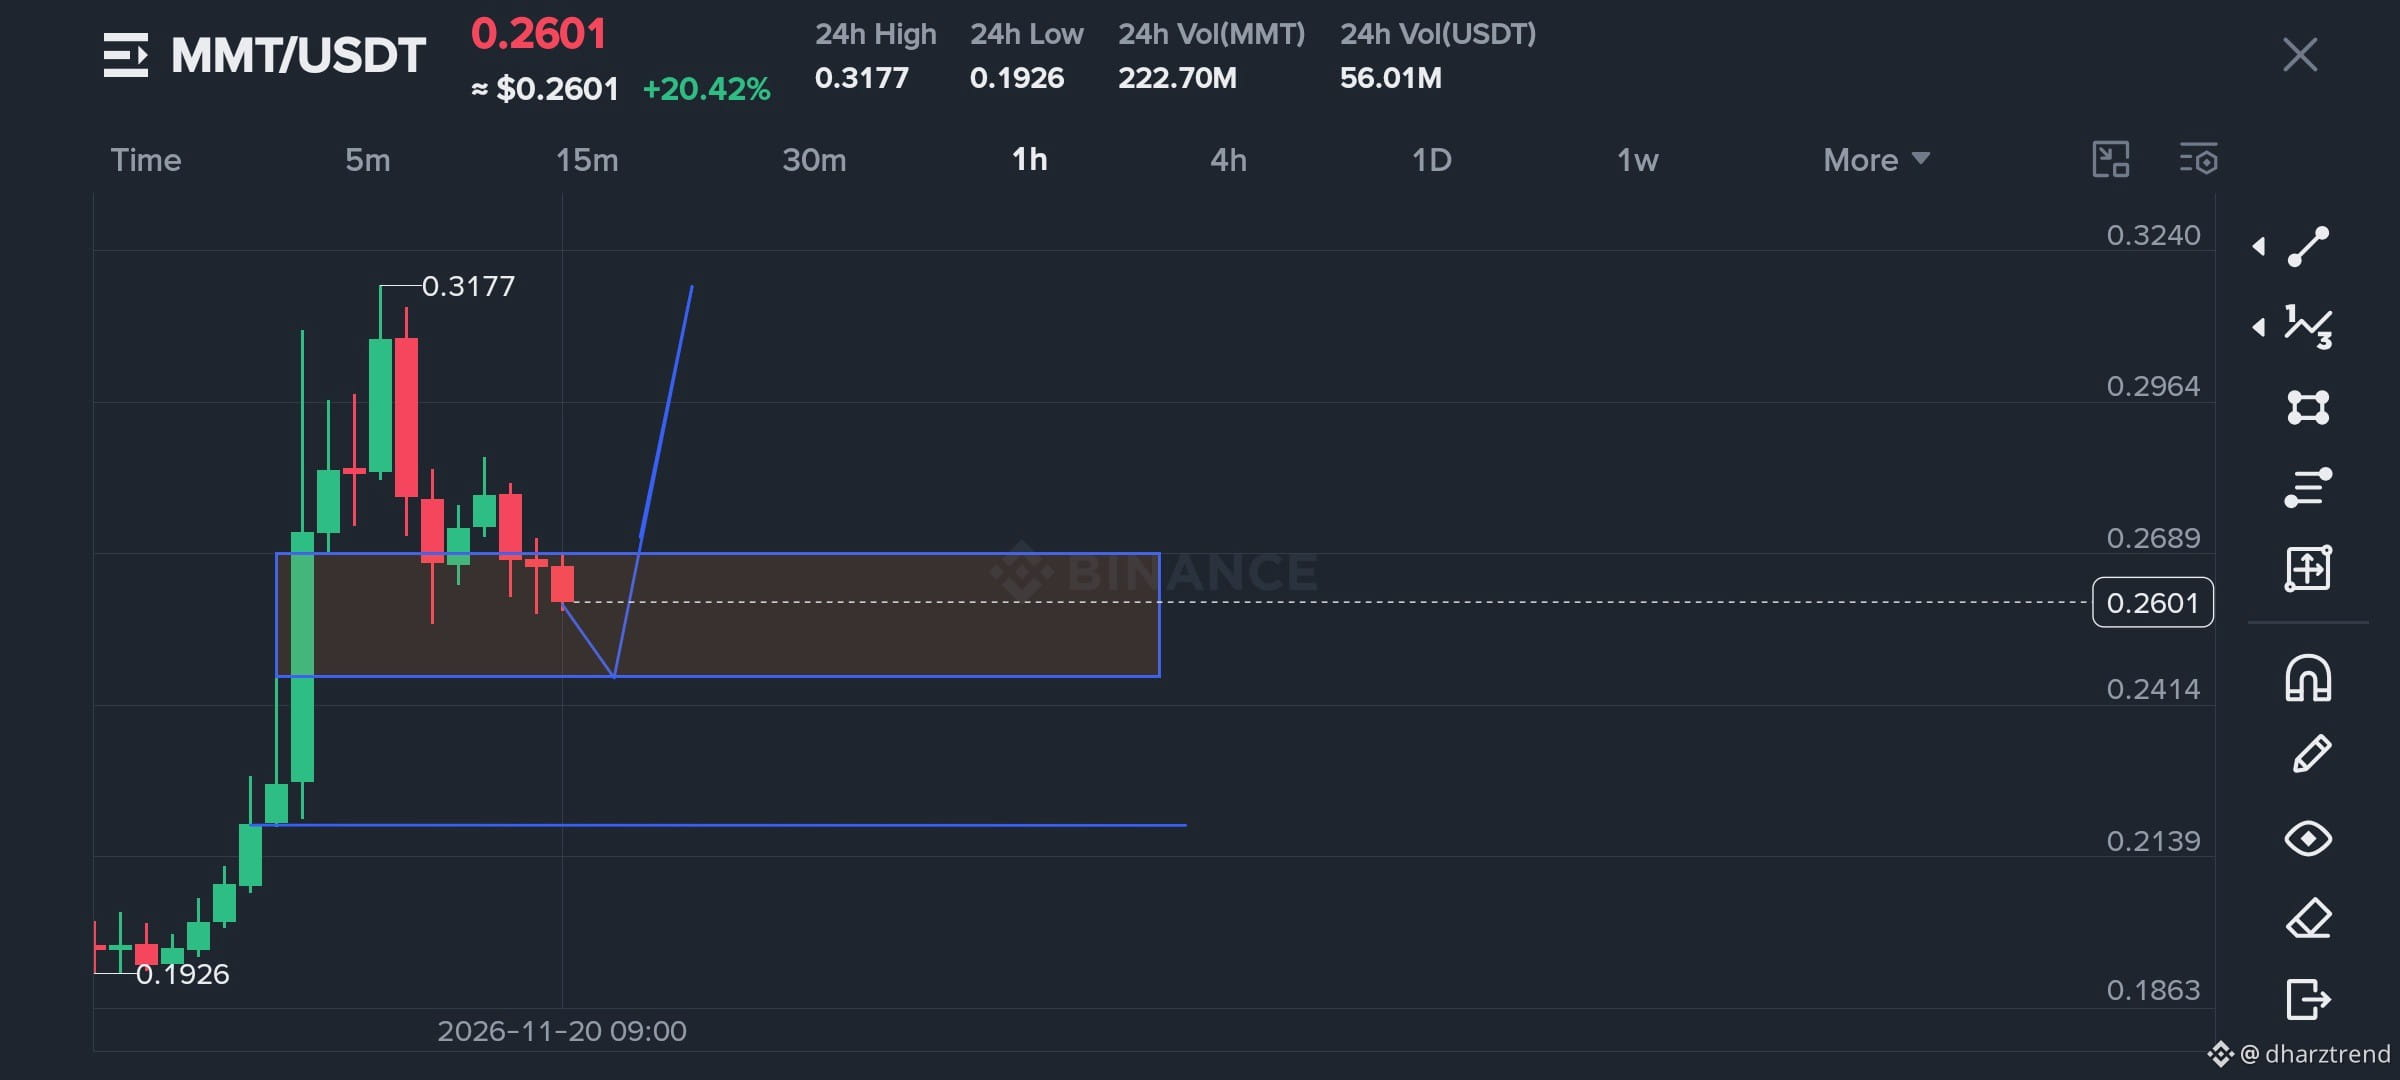
$MMT just pumped hard 🔥
From 0.1926 → 0.3177, now sitting at 0.2601 (+20%).
Strong volume and clean structure. Key zone right now is 0.24–0.27.
Watching for the next move. What’s your take?$MMT
{future}(MMTUSDT)
$MMT just pumped hard 🔥
From 0.1926 → 0.3177, now sitting at 0.2601 (+20%).
Strong volume and clean structure. Key zone right now is 0.24–0.27.
Watching for the next move. What’s your take?$MMT
From 0.1926 → 0.3177, now sitting at 0.2601 (+20%).
Strong volume and clean structure. Key zone right now is 0.24–0.27.
Watching for the next move. What’s your take?$MMT
188
·
--
Simple Bias:
Reclaim of lower FVG → possible fill of upper FVG + liquidity grab
Failure to reclaim → continuation lower
What’s your take? Are you waiting for the FVG fill or looking for a short if it rejects again?
$JCT
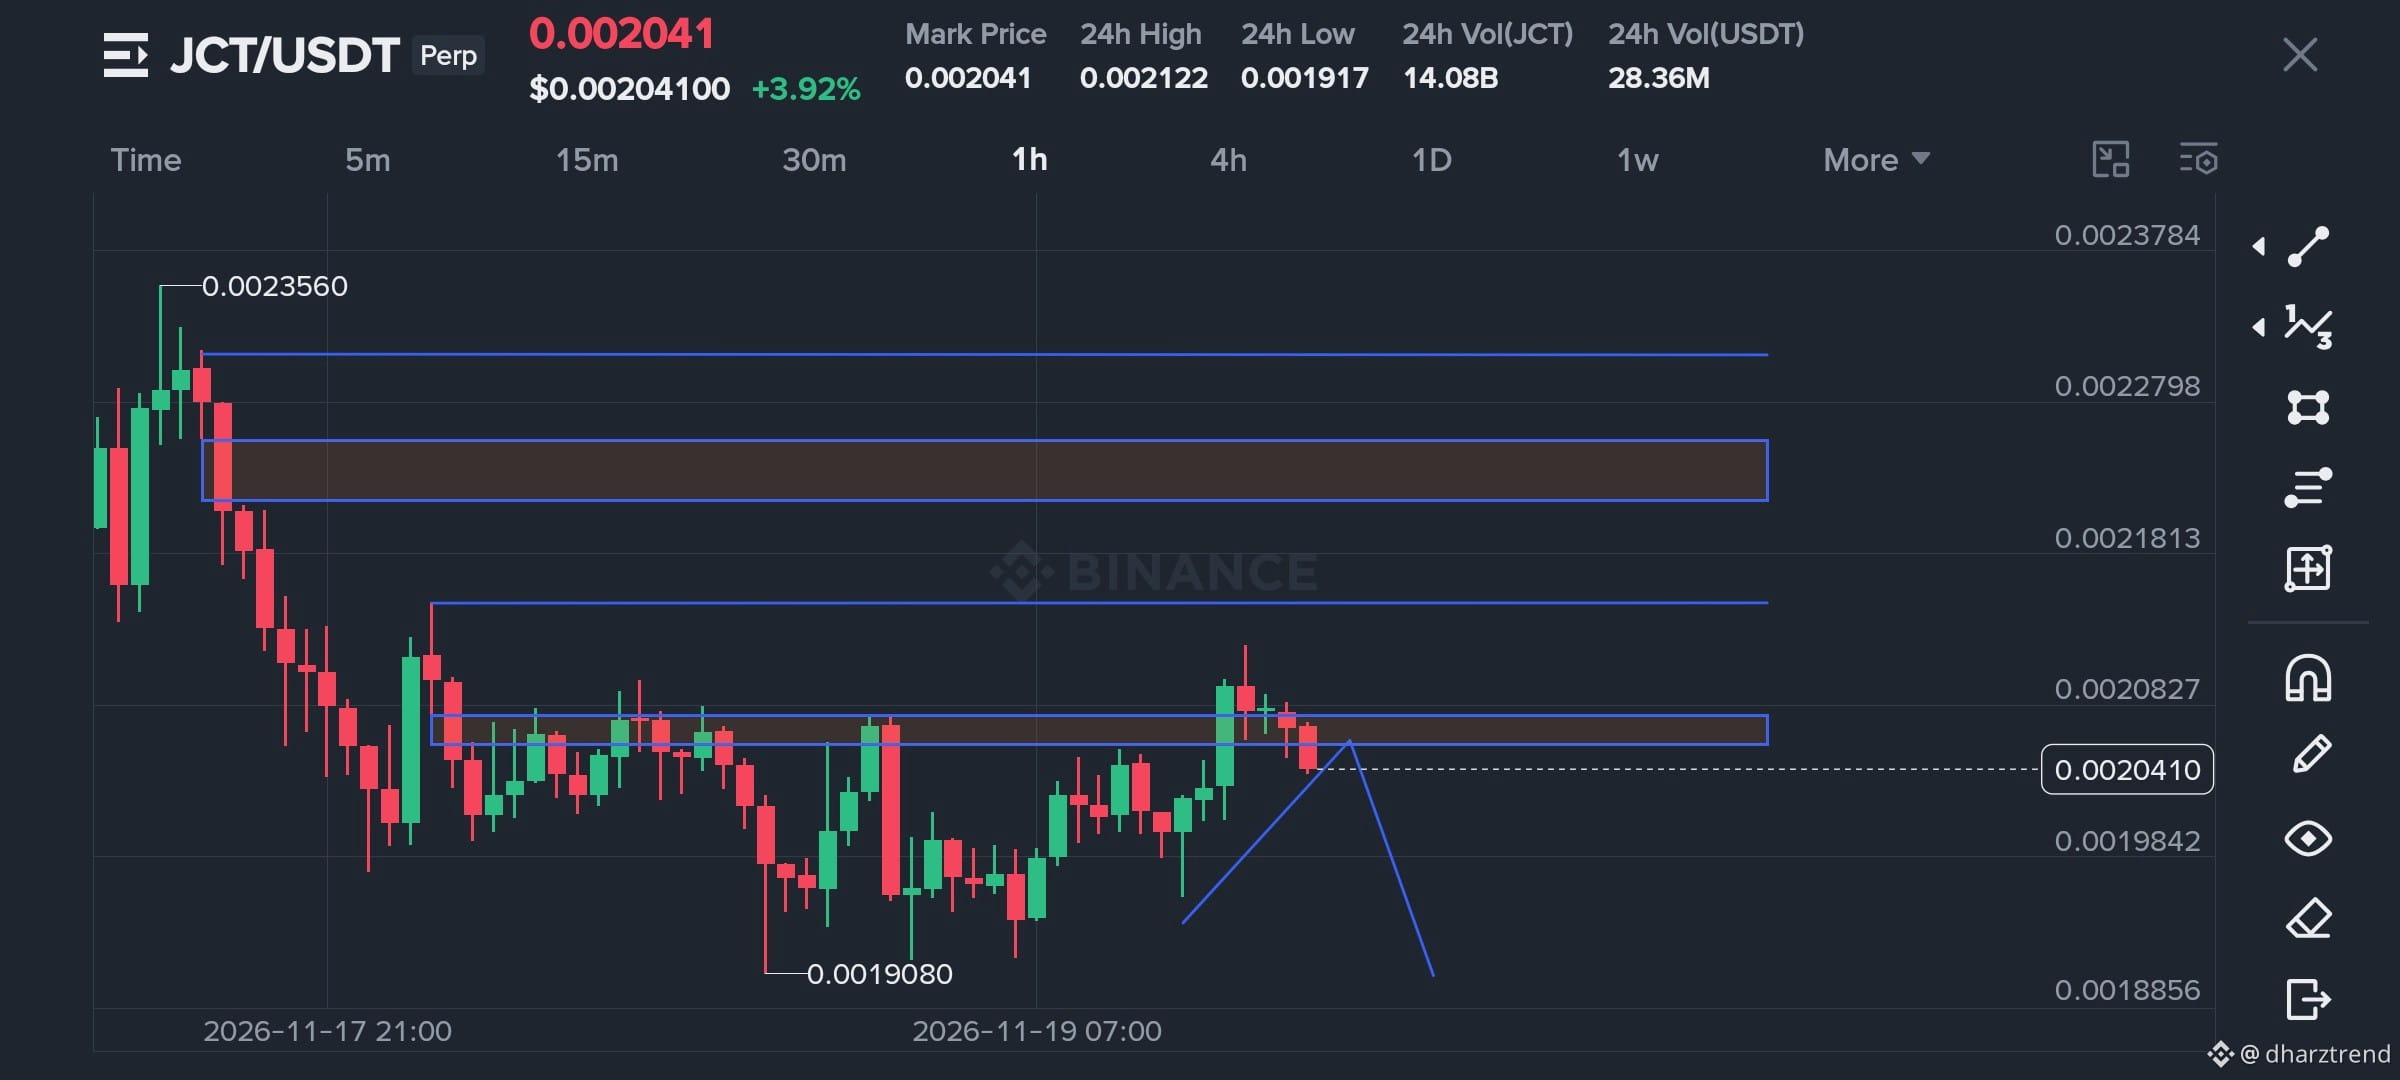
Not financial advice. Just pure chart observation.$JCTUSDT – Fair Value Gap + Liquidity Above
Looking at the current 1H chart of $JCT.
Current price: 0.002041 (+3.92%)
Chart Structure:
The upper blue line = Liquidity (equal highs / stop cluster)
The brown shaded box below it = Fair Value Gap (FVG)
There’s also a lower FVG around the 0.00208 area
Price previously swept / reacted near the upper liquidity zone then left an imbalance (FVG). Currently, price is trading below the lower FVG.
Key Levels to Watch:
Upper Liquidity: ~0.00228 area
Upper FVG: the brown box below the liquidity
Lower FVG: around 0.00208
Price is currently sitting under the lower FVG. If it reclaims and closes above the lower FVG with strength, it can target the upper FVG then the liquidity above.
If it continues to reject and stays below the lower FVG, we might see further downside.$JCT
{future}(JCTUSDT)
Simple Bias:
Reclaim of lower FVG → possible fill of upper FVG + liquidity grab
Failure to reclaim → continuation lower
What’s your take? Are you waiting for the FVG fill or looking for a short if it rejects again?
$JCT
Not financial advice. Just pure chart observation.$JCTUSDT – Fair Value Gap + Liquidity Above
Looking at the current 1H chart of $JCT .
Current price: 0.002041 (+3.92%)
Chart Structure:
The upper blue line = Liquidity (equal highs / stop cluster)
The brown shaded box below it = Fair Value Gap (FVG)
There’s also a lower FVG around the 0.00208 area
Price previously swept / reacted near the upper liquidity zone then left an imbalance (FVG). Currently, price is trading below the lower FVG.
Key Levels to Watch:
Upper Liquidity: ~0.00228 area
Upper FVG: the brown box below the liquidity
Lower FVG: around 0.00208
Price is currently sitting under the lower FVG. If it reclaims and closes above the lower FVG with strength, it can target the upper FVG then the liquidity above.
If it continues to reject and stays below the lower FVG, we might see further downside.$JCT
Reclaim of lower FVG → possible fill of upper FVG + liquidity grab
Failure to reclaim → continuation lower
What’s your take? Are you waiting for the FVG fill or looking for a short if it rejects again?
$JCT
Not financial advice. Just pure chart observation.$JCTUSDT – Fair Value Gap + Liquidity Above
Looking at the current 1H chart of $JCT .
Current price: 0.002041 (+3.92%)
Chart Structure:
The upper blue line = Liquidity (equal highs / stop cluster)
The brown shaded box below it = Fair Value Gap (FVG)
There’s also a lower FVG around the 0.00208 area
Price previously swept / reacted near the upper liquidity zone then left an imbalance (FVG). Currently, price is trading below the lower FVG.
Key Levels to Watch:
Upper Liquidity: ~0.00228 area
Upper FVG: the brown box below the liquidity
Lower FVG: around 0.00208
Price is currently sitting under the lower FVG. If it reclaims and closes above the lower FVG with strength, it can target the upper FVG then the liquidity above.
If it continues to reject and stays below the lower FVG, we might see further downside.$JCT
610
·
--
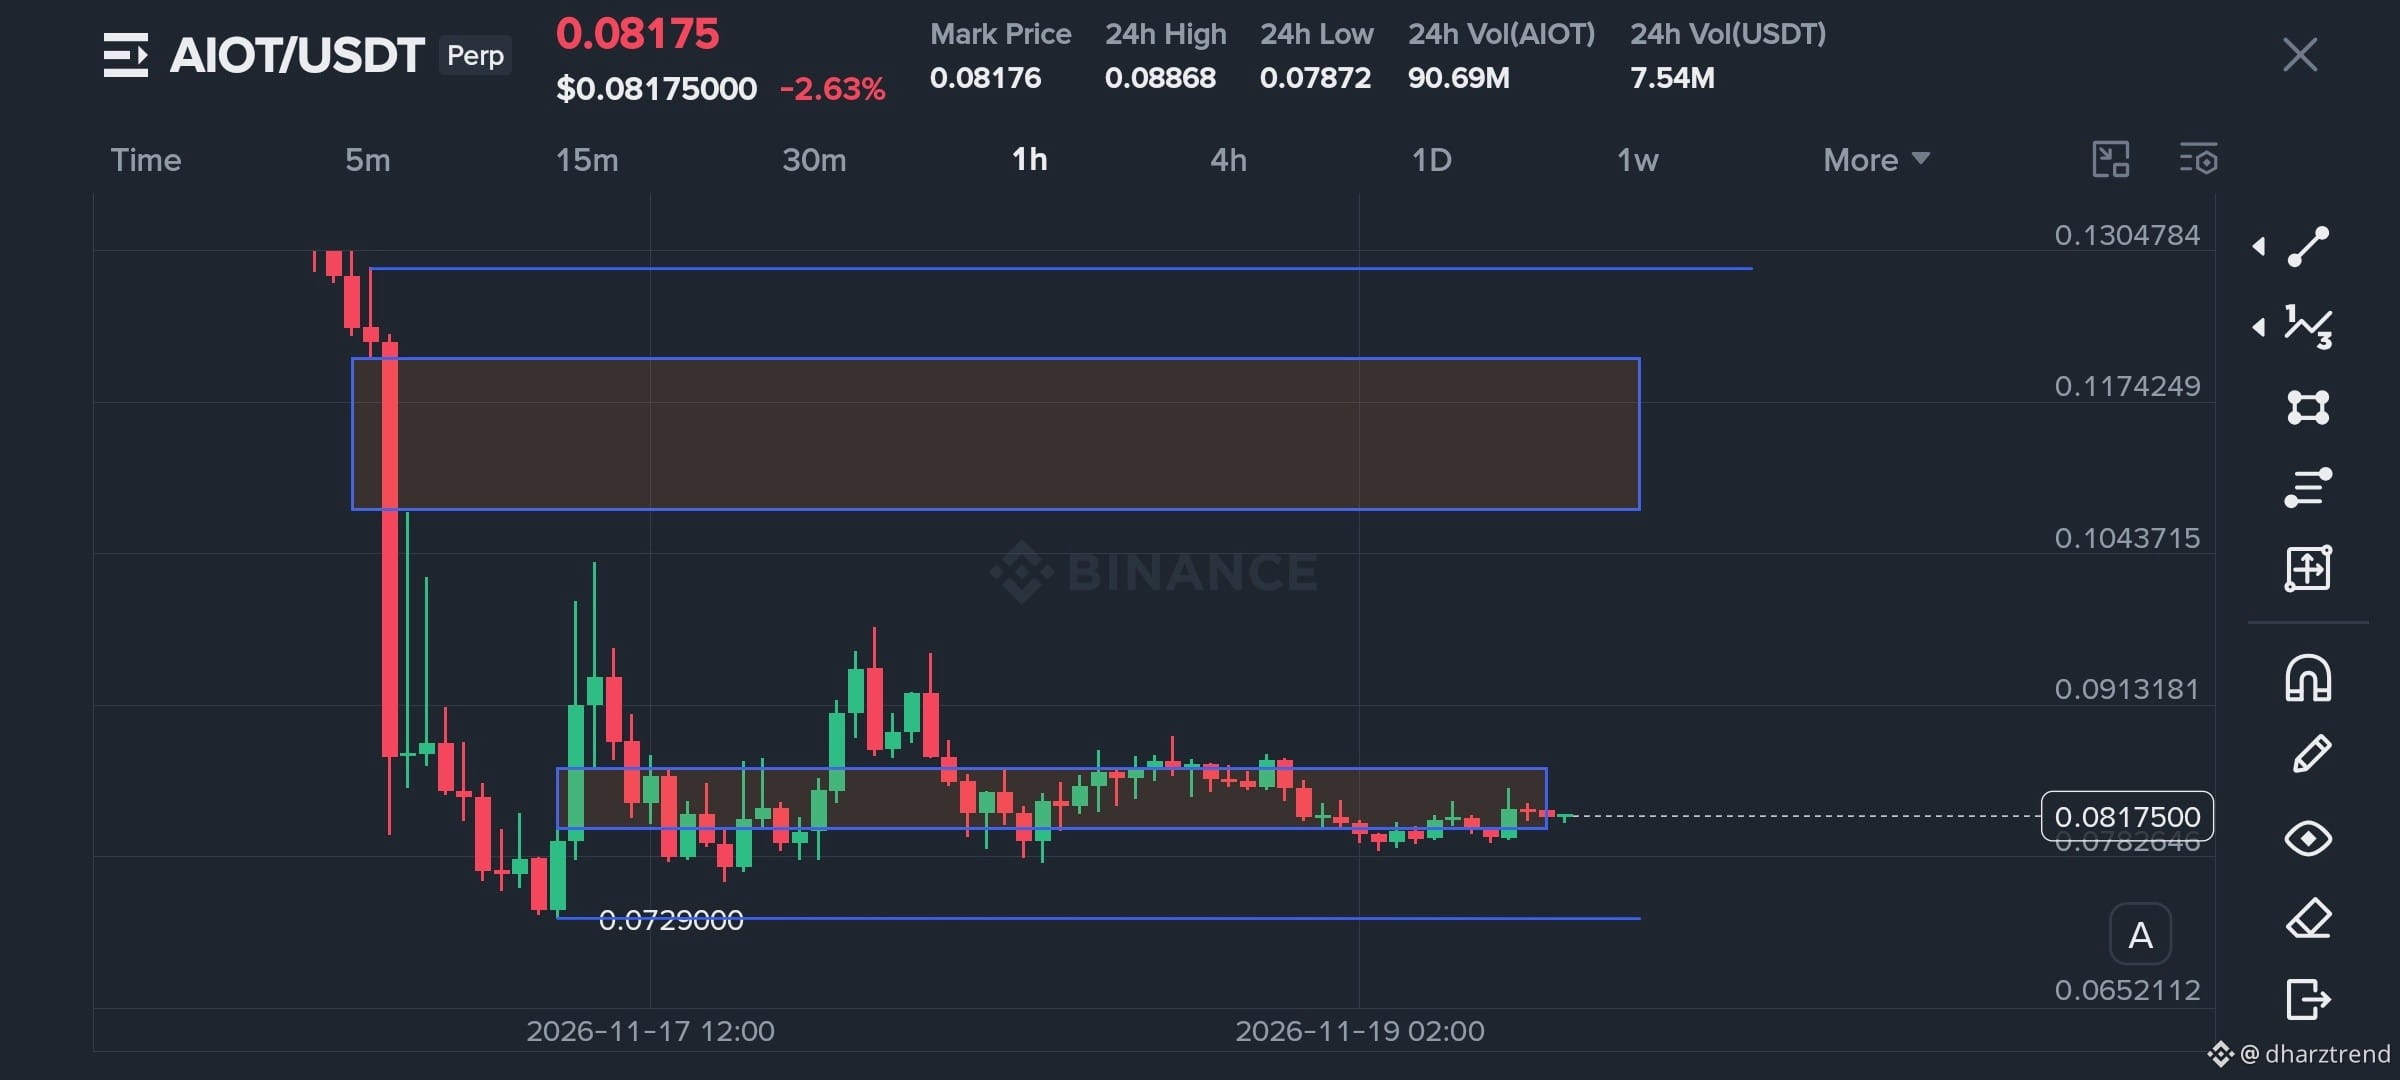
AIOT/USDT Technical Update
Current Price: $0.08175 (-2.63%)
After the big dump last Nov 17, AIOT has been consolidating sideways for almost 2 days. Notice the clean range it formed:
Upper resistance zone (blue box): ~0.117 – 0.130
Lower demand zone (blue box): ~0.078 – 0.084
Strong support sitting at 0.0729
Price is currently testing the lower part of the range. Volume is still decent (90M+ AIOT), so the range is still valid.
Possible scenarios:
Bullish – Break and close above the current consolidation → next target is the mid-range then the upper blue box.
Bearish – Clean break below 0.078 → 0.0729 becomes the next major support.
For now, the structure is still range-bound. Waiting for a clear breakout with volume.
What’s your bias on AIOT? Long or short from here?$AIOT
AIOT/USDT Technical Update
Current Price: $0.08175 (-2.63%)
After the big dump last Nov 17, AIOT has been consolidating sideways for almost 2 days. Notice the clean range it formed:
Upper resistance zone (blue box): ~0.117 – 0.130
Lower demand zone (blue box): ~0.078 – 0.084
Strong support sitting at 0.0729
Price is currently testing the lower part of the range. Volume is still decent (90M+ AIOT), so the range is still valid.
Possible scenarios:
Bullish – Break and close above the current consolidation → next target is the mid-range then the upper blue box.
Bearish – Clean break below 0.078 → 0.0729 becomes the next major support.
For now, the structure is still range-bound. Waiting for a clear breakout with volume.
What’s your bias on AIOT? Long or short from here?$AIOT
Current Price: $0.08175 (-2.63%)
After the big dump last Nov 17, AIOT has been consolidating sideways for almost 2 days. Notice the clean range it formed:
Upper resistance zone (blue box): ~0.117 – 0.130
Lower demand zone (blue box): ~0.078 – 0.084
Strong support sitting at 0.0729
Price is currently testing the lower part of the range. Volume is still decent (90M+ AIOT), so the range is still valid.
Possible scenarios:
Bullish – Break and close above the current consolidation → next target is the mid-range then the upper blue box.
Bearish – Clean break below 0.078 → 0.0729 becomes the next major support.
For now, the structure is still range-bound. Waiting for a clear breakout with volume.
What’s your bias on AIOT? Long or short from here?$AIOT
286
·
--
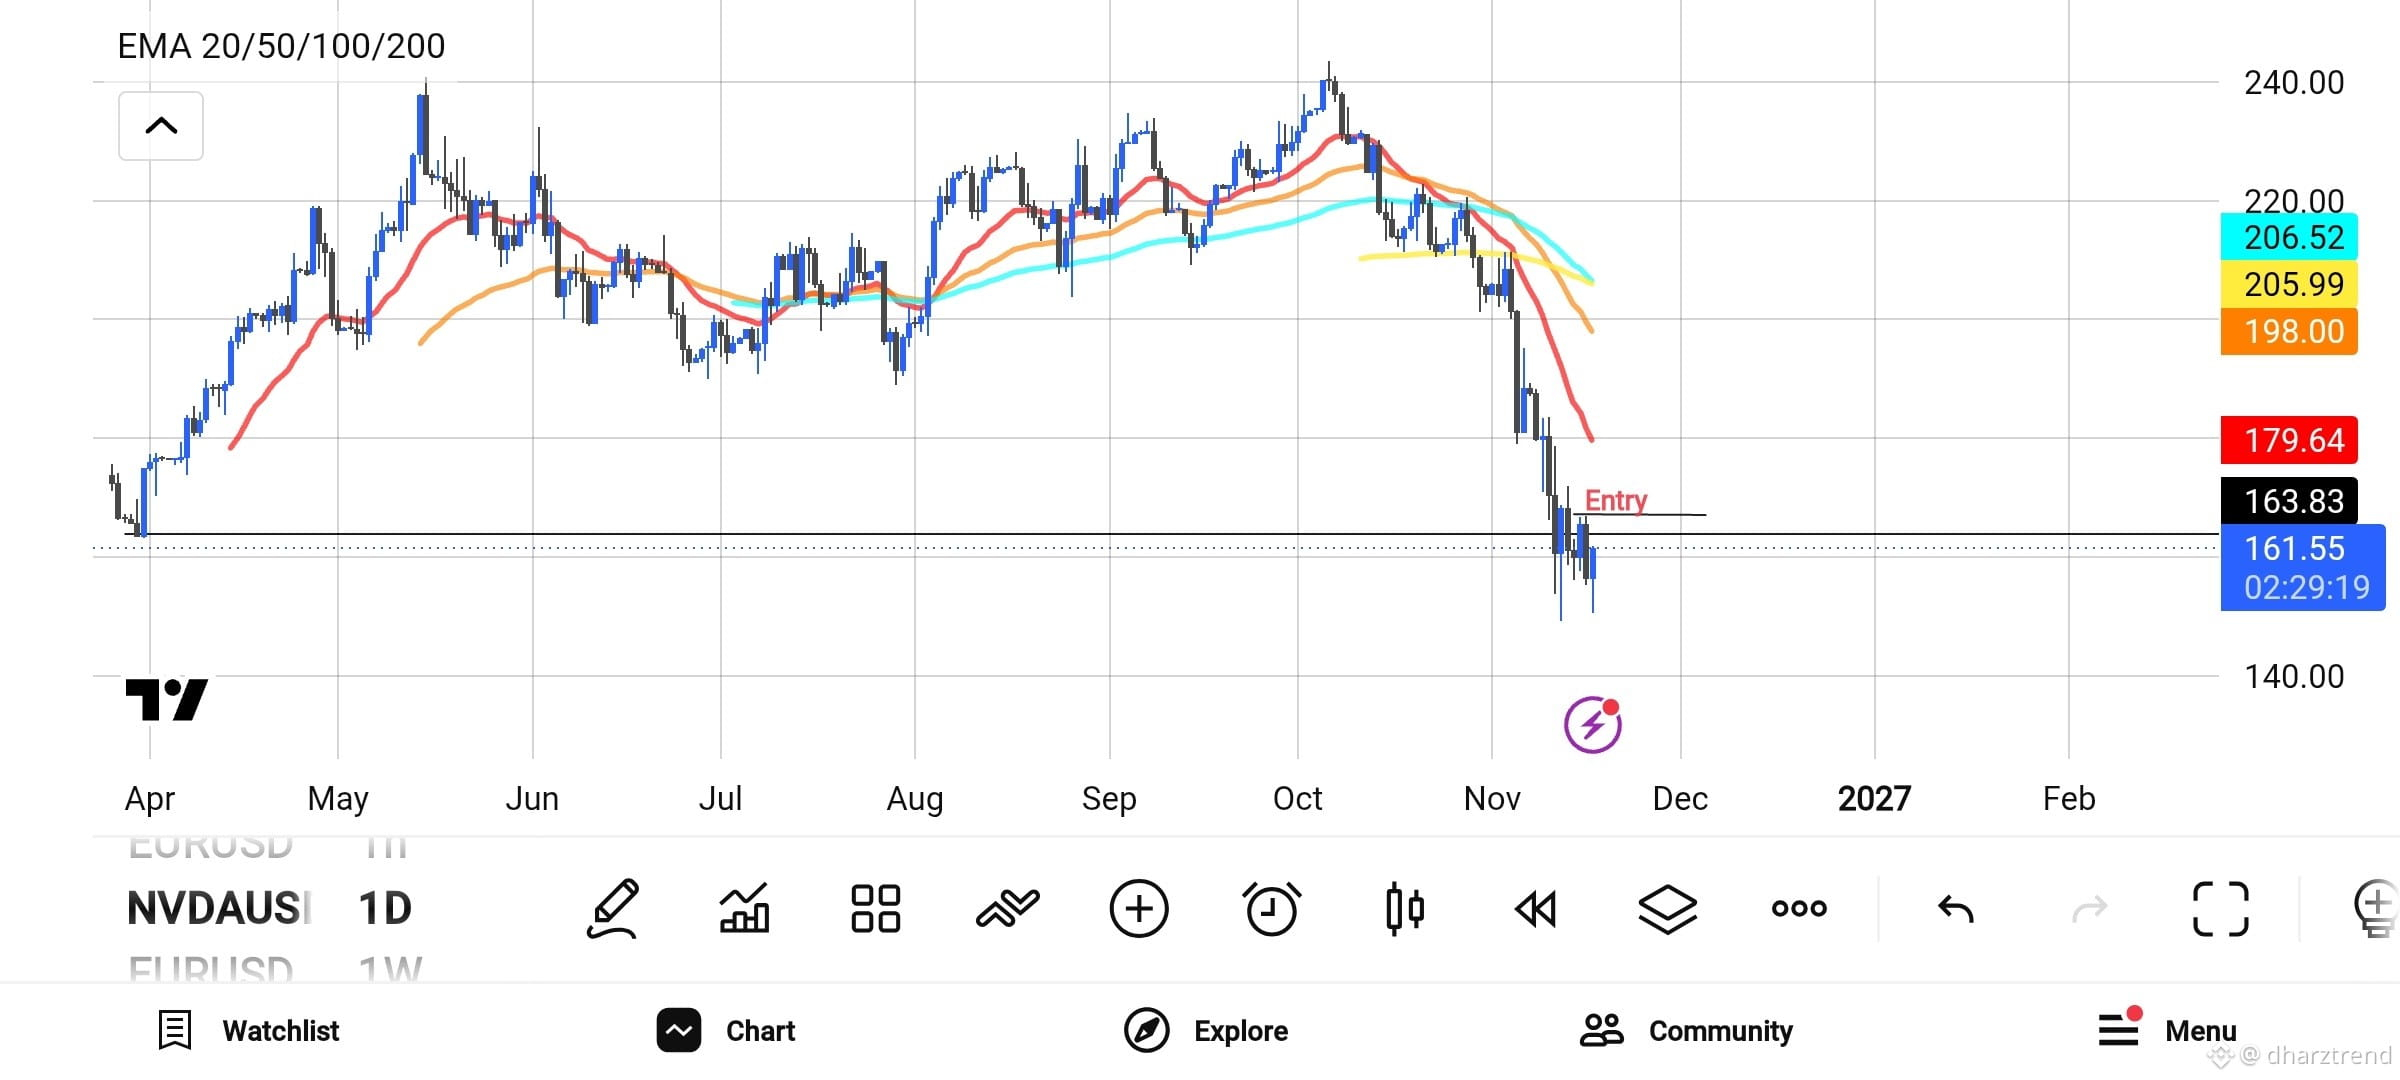
**NVDA Sharp Drop – Entry Opportunity After the Crash? 📉🔥**
Just looked at the NVDA daily chart and the recent move is crazy.
From the October highs near 240, we just saw a brutal sell-off that sliced through all the major EMAs (20/50/100/200). Price is now trading around the 161–164 zone.
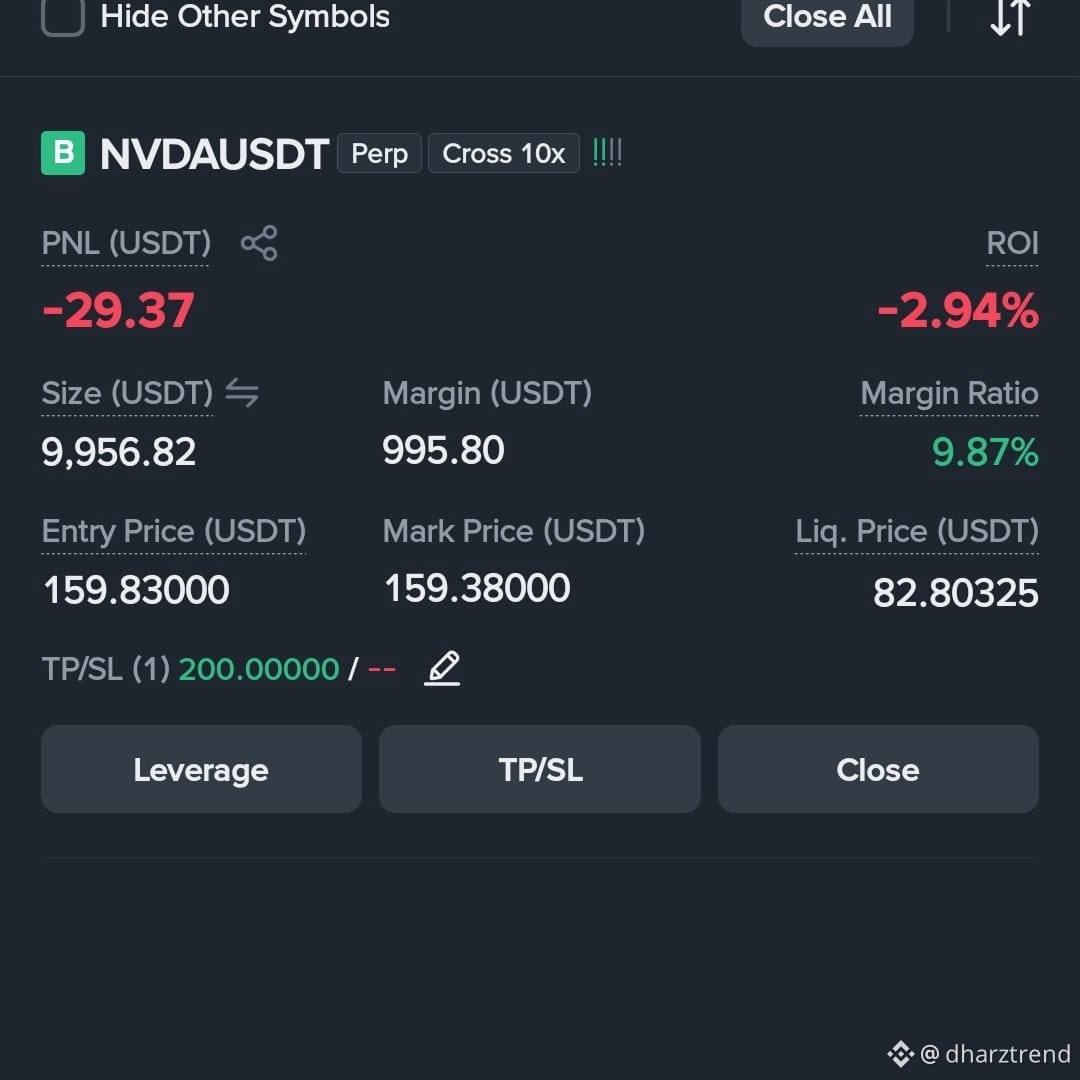
I marked an **Entry** near 163.83 after the sharp drop. Here’s why I’m watching this level:
- Price finally found some buying interest after the free-fall
- We’re sitting just above the psychological 160 level
- All EMAs are still overhead and sloping down — this is still a bearish structure, so this is not a “buy and hold”
- If it holds above 160–158, we could see a relief bounce toward 175–180 (previous support / EMA200 area)
- If it breaks 158 hard, next support is much lower
This is a high-risk, high-reward short-term setup. Risk management is everything here.
What’s your take? Are you buying the dip or waiting for more confirmation?
#NVDA #Trading #Binance #WriteToEarn $NVDA
{future}(NVDAUSDT)
**NVDA Sharp Drop – Entry Opportunity After the Crash? 📉🔥**
Just looked at the NVDA daily chart and the recent move is crazy.
From the October highs near 240, we just saw a brutal sell-off that sliced through all the major EMAs (20/50/100/200). Price is now trading around the 161–164 zone.
I marked an **Entry** near 163.83 after the sharp drop. Here’s why I’m watching this level:
- Price finally found some buying interest after the free-fall
- We’re sitting just above the psychological 160 level
- All EMAs are still overhead and sloping down — this is still a bearish structure, so this is not a “buy and hold”
- If it holds above 160–158, we could see a relief bounce toward 175–180 (previous support / EMA200 area)
- If it breaks 158 hard, next support is much lower
This is a high-risk, high-reward short-term setup. Risk management is everything here.
What’s your take? Are you buying the dip or waiting for more confirmation?
#NVDA #Trading #Binance #WriteToEarn $NVDA
Just looked at the NVDA daily chart and the recent move is crazy.
From the October highs near 240, we just saw a brutal sell-off that sliced through all the major EMAs (20/50/100/200). Price is now trading around the 161–164 zone.
I marked an **Entry** near 163.83 after the sharp drop. Here’s why I’m watching this level:
- Price finally found some buying interest after the free-fall
- We’re sitting just above the psychological 160 level
- All EMAs are still overhead and sloping down — this is still a bearish structure, so this is not a “buy and hold”
- If it holds above 160–158, we could see a relief bounce toward 175–180 (previous support / EMA200 area)
- If it breaks 158 hard, next support is much lower
This is a high-risk, high-reward short-term setup. Risk management is everything here.
What’s your take? Are you buying the dip or waiting for more confirmation?
#NVDA #Trading #Binance #WriteToEarn $NVDA
67
·
--
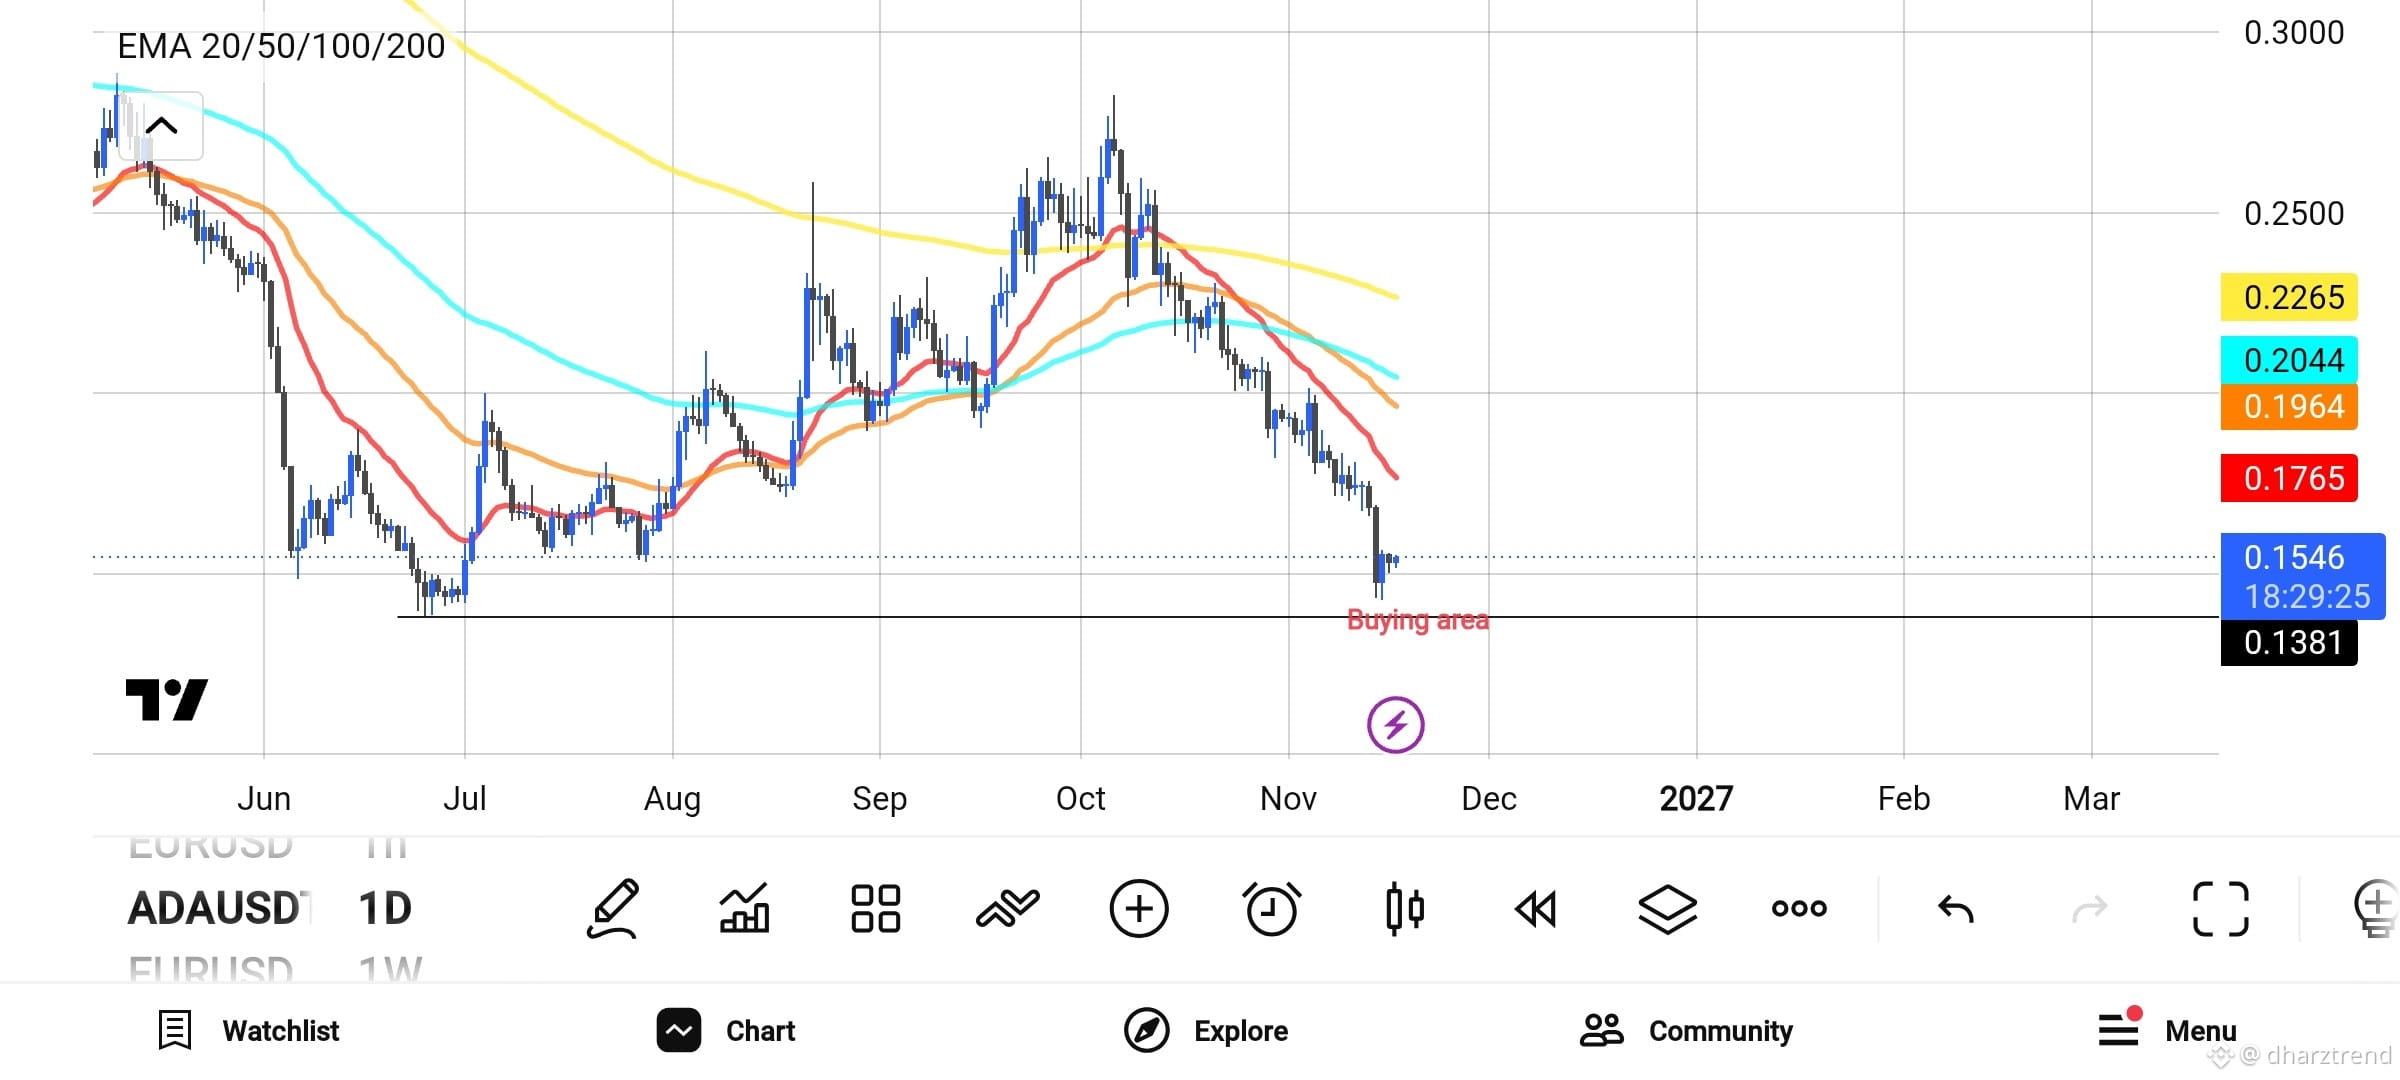
📊 ADAUSDT: Is Cardano Approaching a Potential Buying Opportunity?
Cardano (ADA) is currently showing a bearish trend on the 1D timeframe.
Looking at the chart:
🔴 Price is trading below EMA 20, 50, 100, and 200, indicating strong bearish pressure.
📉 The EMAs are aligned bearishly, suggesting that sellers are still in control.
🟢 However, price is approaching an important support zone around $0.1381, which could become a potential buying area.
My Trading Outlook:
I'm watching this support zone closely. If buyers step in and price shows a strong bullish reversal with confirmation, ADA could present a potential buying opportunity.
But if the support breaks, further downside is possible.
Remember: A buying zone is not an automatic buy signal. Wait for confirmation before entering the market.
Patience and risk management always come first.
What do you think? Will ADA bounce from this support, or will sellers push the price lower?
#ADA #Cardano #ADAUSDT #CryptoTrading #TechnicalAnalysis $ADA
{spot}(ADAUSDT)
📊 ADAUSDT: Is Cardano Approaching a Potential Buying Opportunity?
Cardano (ADA) is currently showing a bearish trend on the 1D timeframe.
Looking at the chart:
🔴 Price is trading below EMA 20, 50, 100, and 200, indicating strong bearish pressure.
📉 The EMAs are aligned bearishly, suggesting that sellers are still in control.
🟢 However, price is approaching an important support zone around $0.1381, which could become a potential buying area.
My Trading Outlook:
I'm watching this support zone closely. If buyers step in and price shows a strong bullish reversal with confirmation, ADA could present a potential buying opportunity.
But if the support breaks, further downside is possible.
Remember: A buying zone is not an automatic buy signal. Wait for confirmation before entering the market.
Patience and risk management always come first.
What do you think? Will ADA bounce from this support, or will sellers push the price lower?
#ADA #Cardano #ADAUSDT #CryptoTrading #TechnicalAnalysis $ADA
Cardano (ADA) is currently showing a bearish trend on the 1D timeframe.
Looking at the chart:
🔴 Price is trading below EMA 20, 50, 100, and 200, indicating strong bearish pressure.
📉 The EMAs are aligned bearishly, suggesting that sellers are still in control.
🟢 However, price is approaching an important support zone around $0.1381, which could become a potential buying area.
My Trading Outlook:
I'm watching this support zone closely. If buyers step in and price shows a strong bullish reversal with confirmation, ADA could present a potential buying opportunity.
But if the support breaks, further downside is possible.
Remember: A buying zone is not an automatic buy signal. Wait for confirmation before entering the market.
Patience and risk management always come first.
What do you think? Will ADA bounce from this support, or will sellers push the price lower?
#ADA #Cardano #ADAUSDT #CryptoTrading #TechnicalAnalysis $ADA
2
342
·
--
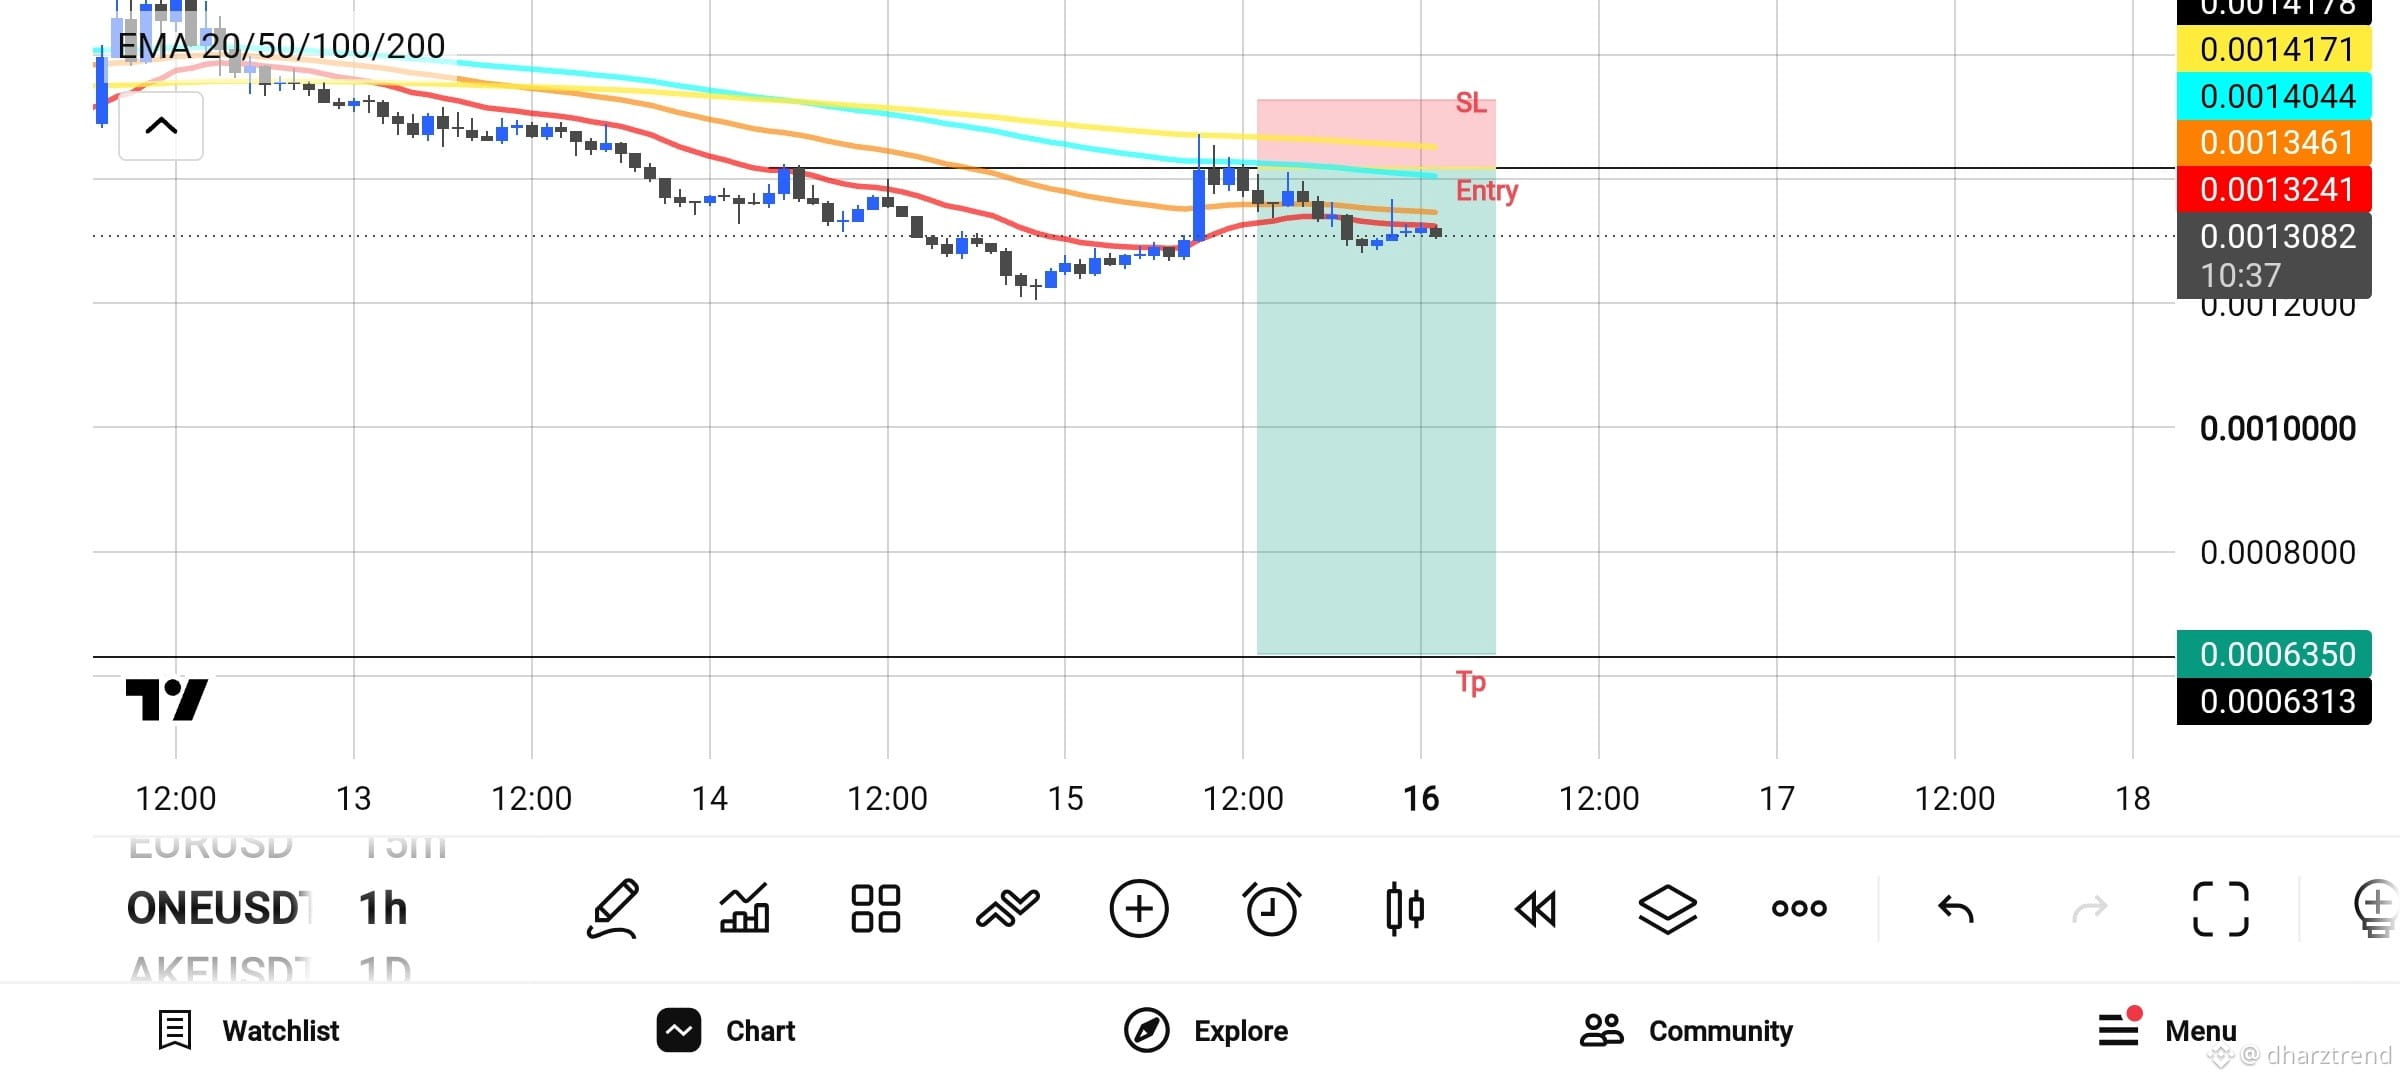
ONEUSDT – Bearish Momentum Still in Play?
ONEUSDT is showing signs of bearish continuation on the 1H timeframe.
Here are the key observations:
- Price remains below the EMA 20, 50, 100, and 200.
- The EMAs are aligned bearishly, suggesting strong downward momentum.
- Price attempted a short-term recovery but faced resistance around the EMA zone.
- Sellers are still showing strength as price struggles to reclaim the moving averages.
My Trading Setup:
- Direction: SHORT
- Entry: 0.0013241
- Stop Loss: 0.0014171
- Take Profit: 0.0006350
My Strategy: Follow the trend, wait for confirmation, and never chase the market.
Remember: A trading setup is only a possibility, not a guaranteed outcome. Always manage your risk and protect your capital.
#ONEUSDT #CryptoTrading #TechnicalAnalysis #PriceAction #Binance $ONE
{future}(ONEUSDT)
ONEUSDT – Bearish Momentum Still in Play?
ONEUSDT is showing signs of bearish continuation on the 1H timeframe.
Here are the key observations:
- Price remains below the EMA 20, 50, 100, and 200.
- The EMAs are aligned bearishly, suggesting strong downward momentum.
- Price attempted a short-term recovery but faced resistance around the EMA zone.
- Sellers are still showing strength as price struggles to reclaim the moving averages.
My Trading Setup:
- Direction: SHORT
- Entry: 0.0013241
- Stop Loss: 0.0014171
- Take Profit: 0.0006350
My Strategy: Follow the trend, wait for confirmation, and never chase the market.
Remember: A trading setup is only a possibility, not a guaranteed outcome. Always manage your risk and protect your capital.
#ONEUSDT #CryptoTrading #TechnicalAnalysis #PriceAction #Binance $ONE
ONEUSDT is showing signs of bearish continuation on the 1H timeframe.
Here are the key observations:
- Price remains below the EMA 20, 50, 100, and 200.
- The EMAs are aligned bearishly, suggesting strong downward momentum.
- Price attempted a short-term recovery but faced resistance around the EMA zone.
- Sellers are still showing strength as price struggles to reclaim the moving averages.
My Trading Setup:
- Direction: SHORT
- Entry: 0.0013241
- Stop Loss: 0.0014171
- Take Profit: 0.0006350
My Strategy: Follow the trend, wait for confirmation, and never chase the market.
Remember: A trading setup is only a possibility, not a guaranteed outcome. Always manage your risk and protect your capital.
#ONEUSDT #CryptoTrading #TechnicalAnalysis #PriceAction #Binance $ONE
2
518
·
--
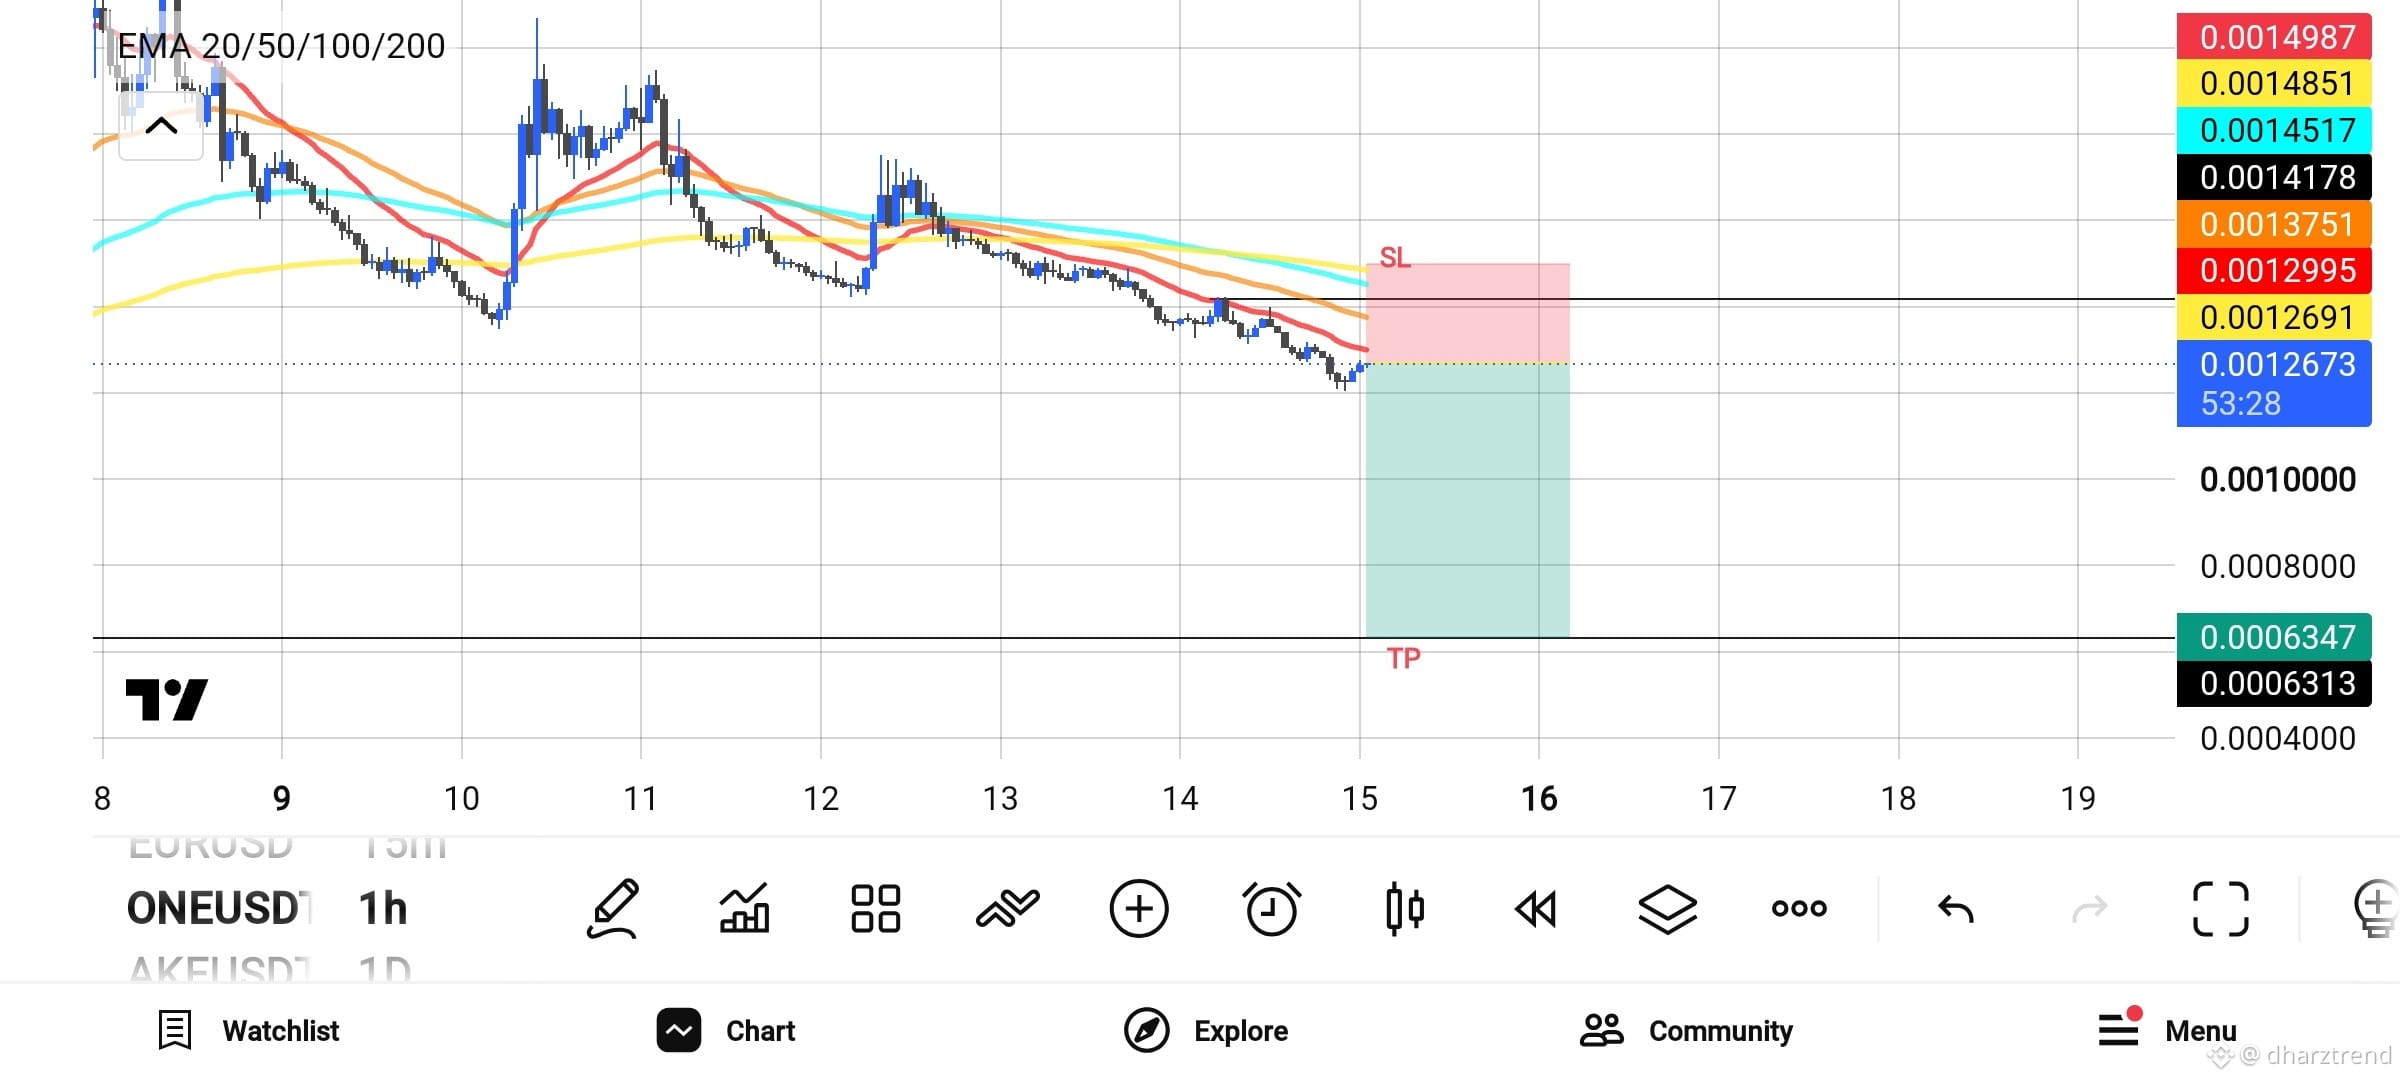
ONEUSDT – Bearish Momentum Continues 📉
ONEUSDT is showing a clear bearish structure on the 1-hour timeframe.
Price continues to form lower highs and lower lows, while the EMA 20, 50, 100, and 200 are positioned above the current price. This suggests that sellers remain in control.
My Trading Setup:
- Direction: SHORT
- Entry: Around 0.0012673
- Stop Loss: 0.0012995
- Take Profit: 0.0006347
What I'm Watching:
I want to see a pullback toward the EMA resistance area followed by bearish confirmation before considering an entry.
No need to chase the price. Patience and proper risk management are essential.
Remember: This is a technical analysis idea, not financial advice. Always manage your risk.
#ONEUSDT #CryptoTrading #TechnicalAnalysis #Binance #priceaction $ONE
{future}(ONEUSDT)
ONEUSDT – Bearish Momentum Continues 📉
ONEUSDT is showing a clear bearish structure on the 1-hour timeframe.
Price continues to form lower highs and lower lows, while the EMA 20, 50, 100, and 200 are positioned above the current price. This suggests that sellers remain in control.
My Trading Setup:
- Direction: SHORT
- Entry: Around 0.0012673
- Stop Loss: 0.0012995
- Take Profit: 0.0006347
What I'm Watching:
I want to see a pullback toward the EMA resistance area followed by bearish confirmation before considering an entry.
No need to chase the price. Patience and proper risk management are essential.
Remember: This is a technical analysis idea, not financial advice. Always manage your risk.
#ONEUSDT #CryptoTrading #TechnicalAnalysis #Binance #priceaction $ONE
ONEUSDT is showing a clear bearish structure on the 1-hour timeframe.
Price continues to form lower highs and lower lows, while the EMA 20, 50, 100, and 200 are positioned above the current price. This suggests that sellers remain in control.
My Trading Setup:
- Direction: SHORT
- Entry: Around 0.0012673
- Stop Loss: 0.0012995
- Take Profit: 0.0006347
What I'm Watching:
I want to see a pullback toward the EMA resistance area followed by bearish confirmation before considering an entry.
No need to chase the price. Patience and proper risk management are essential.
Remember: This is a technical analysis idea, not financial advice. Always manage your risk.
#ONEUSDT #CryptoTrading #TechnicalAnalysis #Binance #priceaction $ONE
1
573
·
--
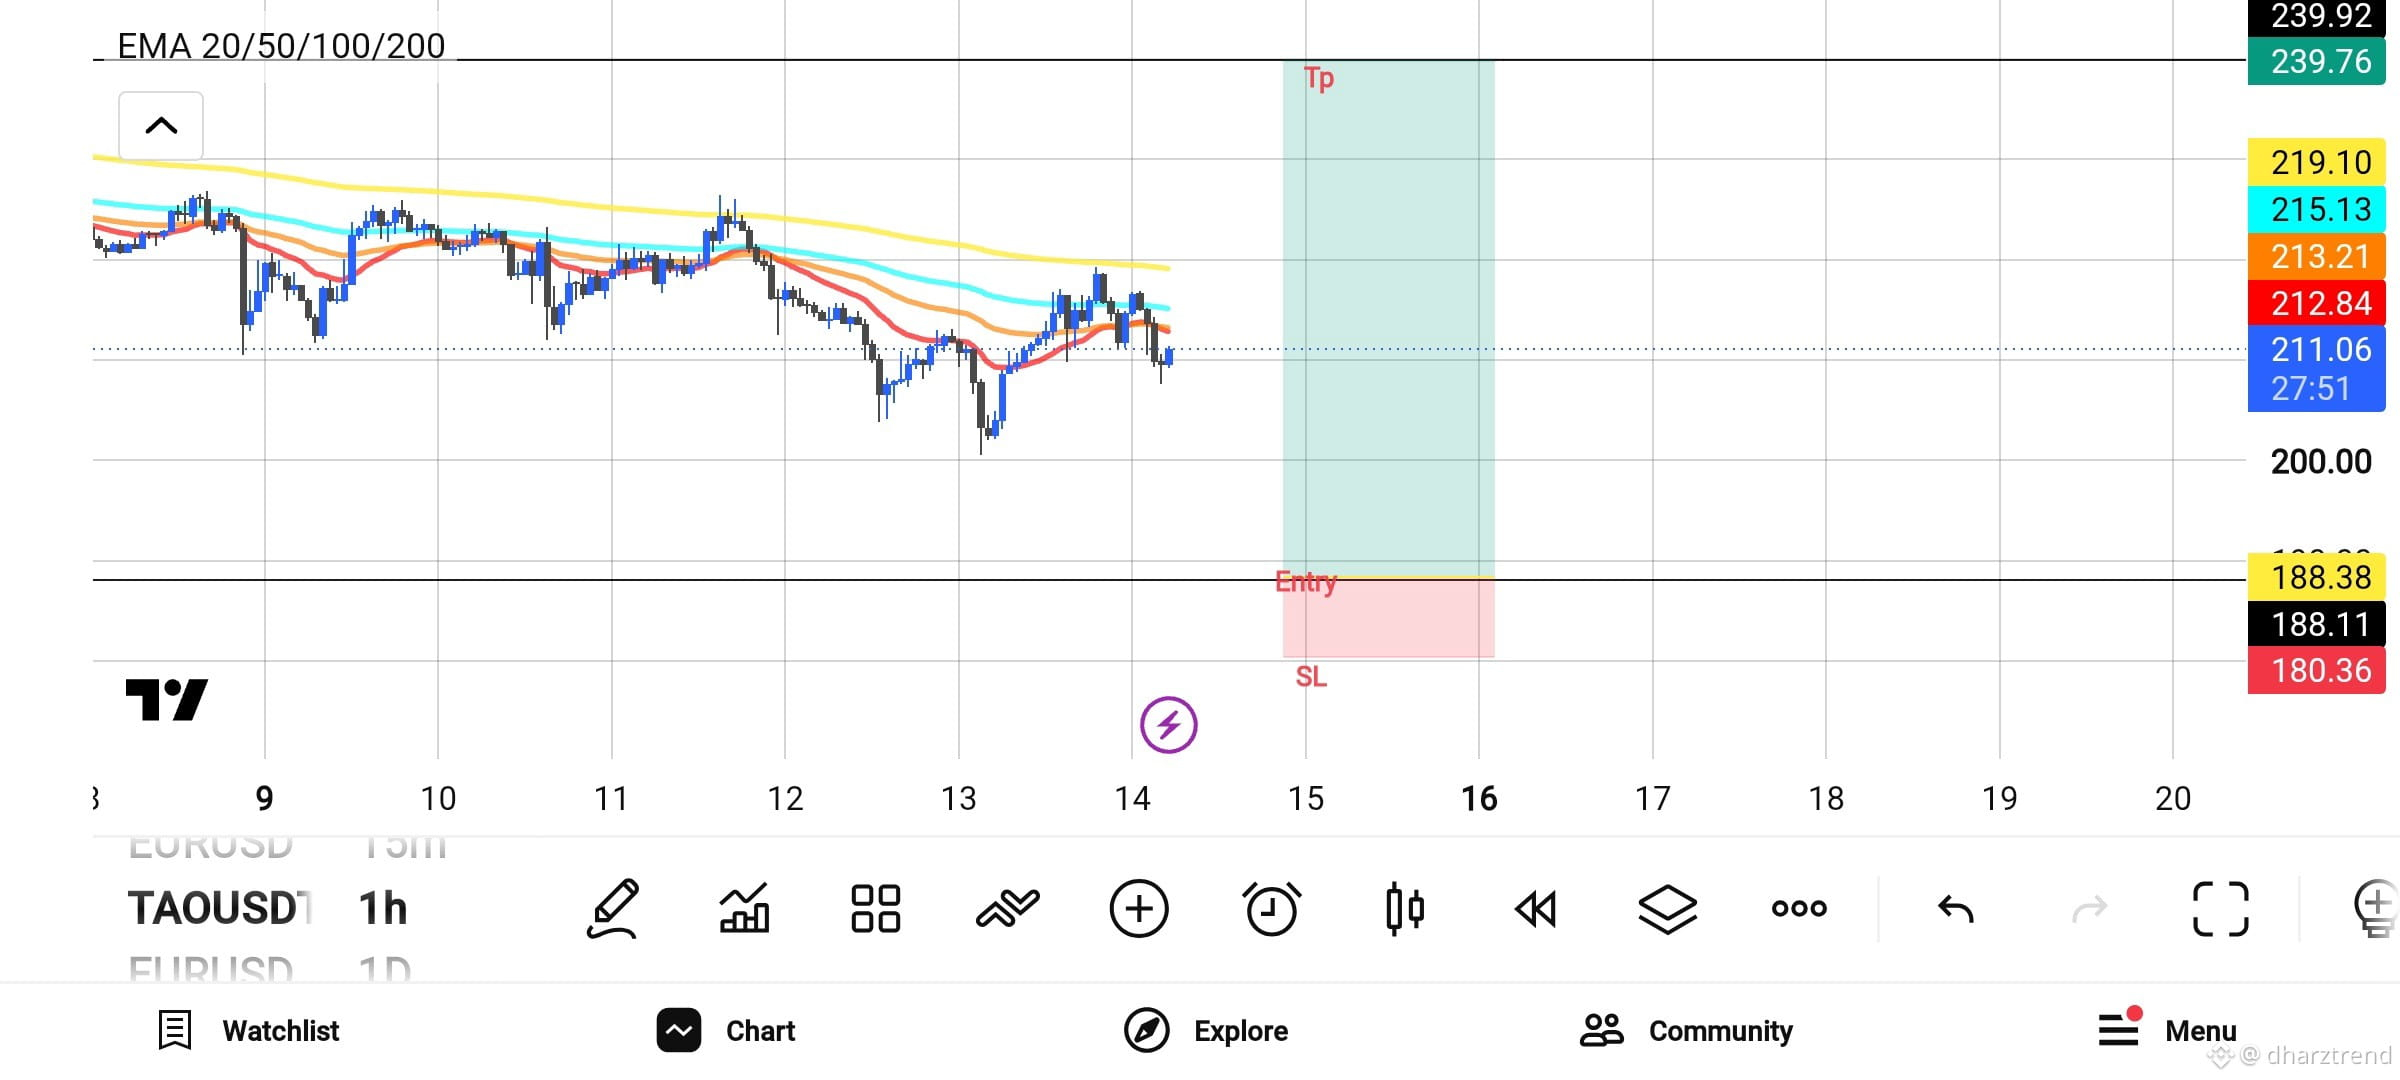
📊 TAO/USDT – Waiting for a Better Buying Opportunity
Looking at the 1H chart, TAO is currently trading below the EMA 20, 50, 100, and 200, showing that bearish pressure is still present.
I'm watching these important levels:
🟢 Potential Entry: $188.38
🔴 Stop Loss: $180.36
🎯 Take Profit: $239.76
My strategy is to wait for price to reach the planned demand area before considering a long position.
I'm not rushing into a trade. I want to see a clear reaction and confirmation before entering.
Patience is part of the strategy. Protecting capital comes first.
What's your outlook on TAO? Are you waiting for a bullish reversal or expecting more downside?
#TAO #TAOUSDT #CryptoTrading #TechnicalAnalysis #EMA #BİNANCE $TAO
{future}(TAOUSDT)
📊 TAO/USDT – Waiting for a Better Buying Opportunity
Looking at the 1H chart, TAO is currently trading below the EMA 20, 50, 100, and 200, showing that bearish pressure is still present.
I'm watching these important levels:
🟢 Potential Entry: $188.38
🔴 Stop Loss: $180.36
🎯 Take Profit: $239.76
My strategy is to wait for price to reach the planned demand area before considering a long position.
I'm not rushing into a trade. I want to see a clear reaction and confirmation before entering.
Patience is part of the strategy. Protecting capital comes first.
What's your outlook on TAO? Are you waiting for a bullish reversal or expecting more downside?
#TAO #TAOUSDT #CryptoTrading #TechnicalAnalysis #EMA #BİNANCE $TAO
Looking at the 1H chart, TAO is currently trading below the EMA 20, 50, 100, and 200, showing that bearish pressure is still present.
I'm watching these important levels:
🟢 Potential Entry: $188.38
🔴 Stop Loss: $180.36
🎯 Take Profit: $239.76
My strategy is to wait for price to reach the planned demand area before considering a long position.
I'm not rushing into a trade. I want to see a clear reaction and confirmation before entering.
Patience is part of the strategy. Protecting capital comes first.
What's your outlook on TAO? Are you waiting for a bullish reversal or expecting more downside?
#TAO #TAOUSDT #CryptoTrading #TechnicalAnalysis #EMA #BİNANCE $TAO
1
381
·
--
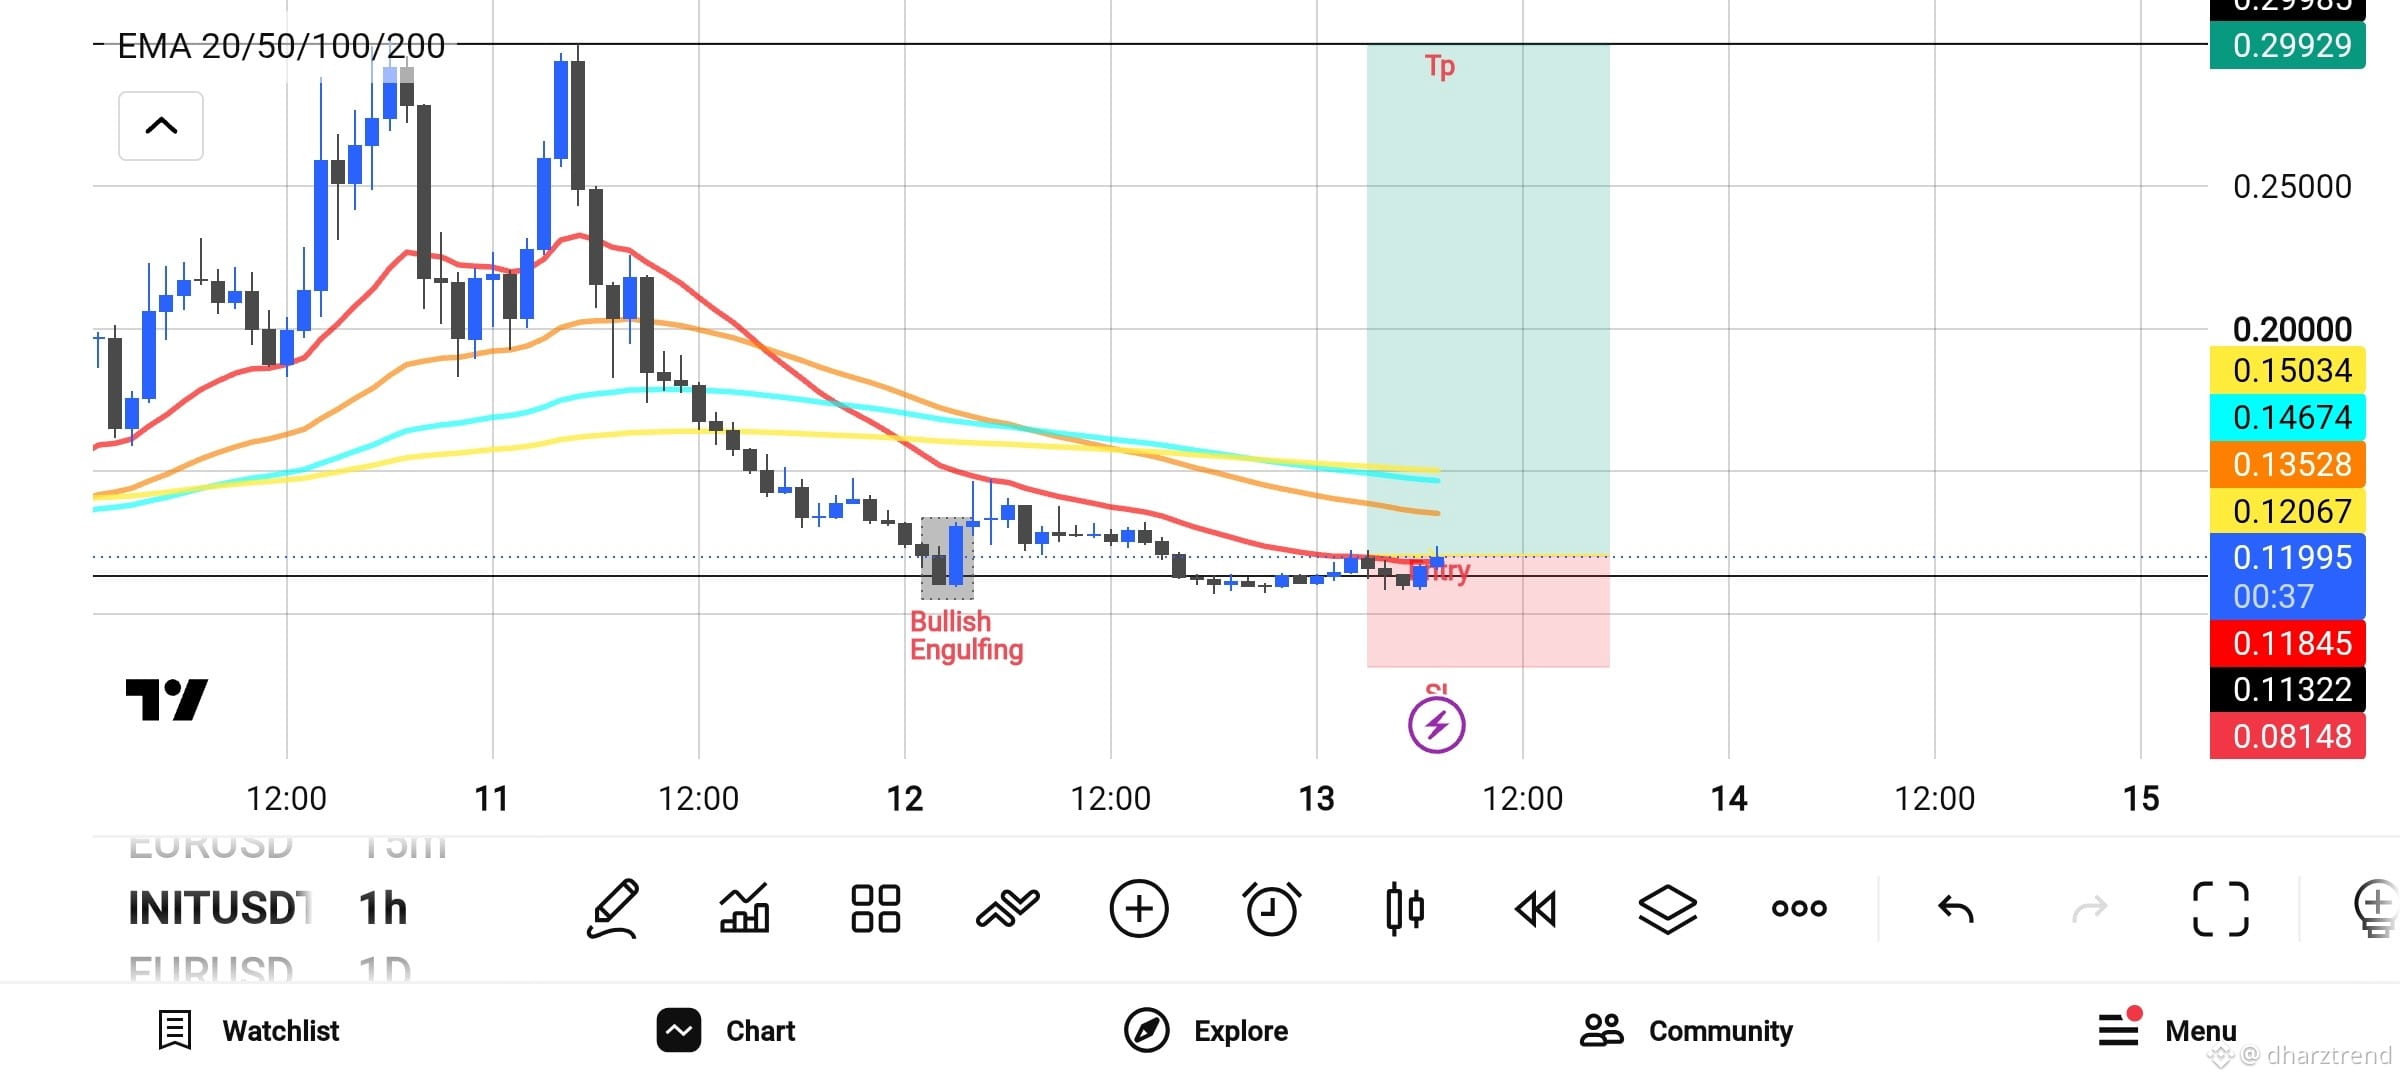
INITUSDT: Is a Bullish Reversal Possible? 📊
INITUSDT is showing a possible bullish reaction after a prolonged downtrend.
On the 1H timeframe, a Bullish Engulfing candle has appeared near the support area, suggesting a possible short-term recovery.
However, price is still below EMA 20, 50, 100, and 200. The overall trend remains bearish.
Key things to watch:
- Bullish confirmation above resistance.
- Price reclaiming EMA 20.
- Strong buying volume.
A Bullish Engulfing candle does not guarantee a reversal. Confirmation is always important before entering a trade.
What do you think? Can INITUSDT reverse its downtrend?
#INITUSDT #CryptoAnalysis #TechnicalAnalysis #Binance #trading $INIT
{future}(INITUSDT)
INITUSDT: Is a Bullish Reversal Possible? 📊
INITUSDT is showing a possible bullish reaction after a prolonged downtrend.
On the 1H timeframe, a Bullish Engulfing candle has appeared near the support area, suggesting a possible short-term recovery.
However, price is still below EMA 20, 50, 100, and 200. The overall trend remains bearish.
Key things to watch:
- Bullish confirmation above resistance.
- Price reclaiming EMA 20.
- Strong buying volume.
A Bullish Engulfing candle does not guarantee a reversal. Confirmation is always important before entering a trade.
What do you think? Can INITUSDT reverse its downtrend?
#INITUSDT #CryptoAnalysis #TechnicalAnalysis #Binance #trading $INIT
INITUSDT is showing a possible bullish reaction after a prolonged downtrend.
On the 1H timeframe, a Bullish Engulfing candle has appeared near the support area, suggesting a possible short-term recovery.
However, price is still below EMA 20, 50, 100, and 200. The overall trend remains bearish.
Key things to watch:
- Bullish confirmation above resistance.
- Price reclaiming EMA 20.
- Strong buying volume.
A Bullish Engulfing candle does not guarantee a reversal. Confirmation is always important before entering a trade.
What do you think? Can INITUSDT reverse its downtrend?
#INITUSDT #CryptoAnalysis #TechnicalAnalysis #Binance #trading $INIT
3
910
·
--
$AGT Technical Update (1H)
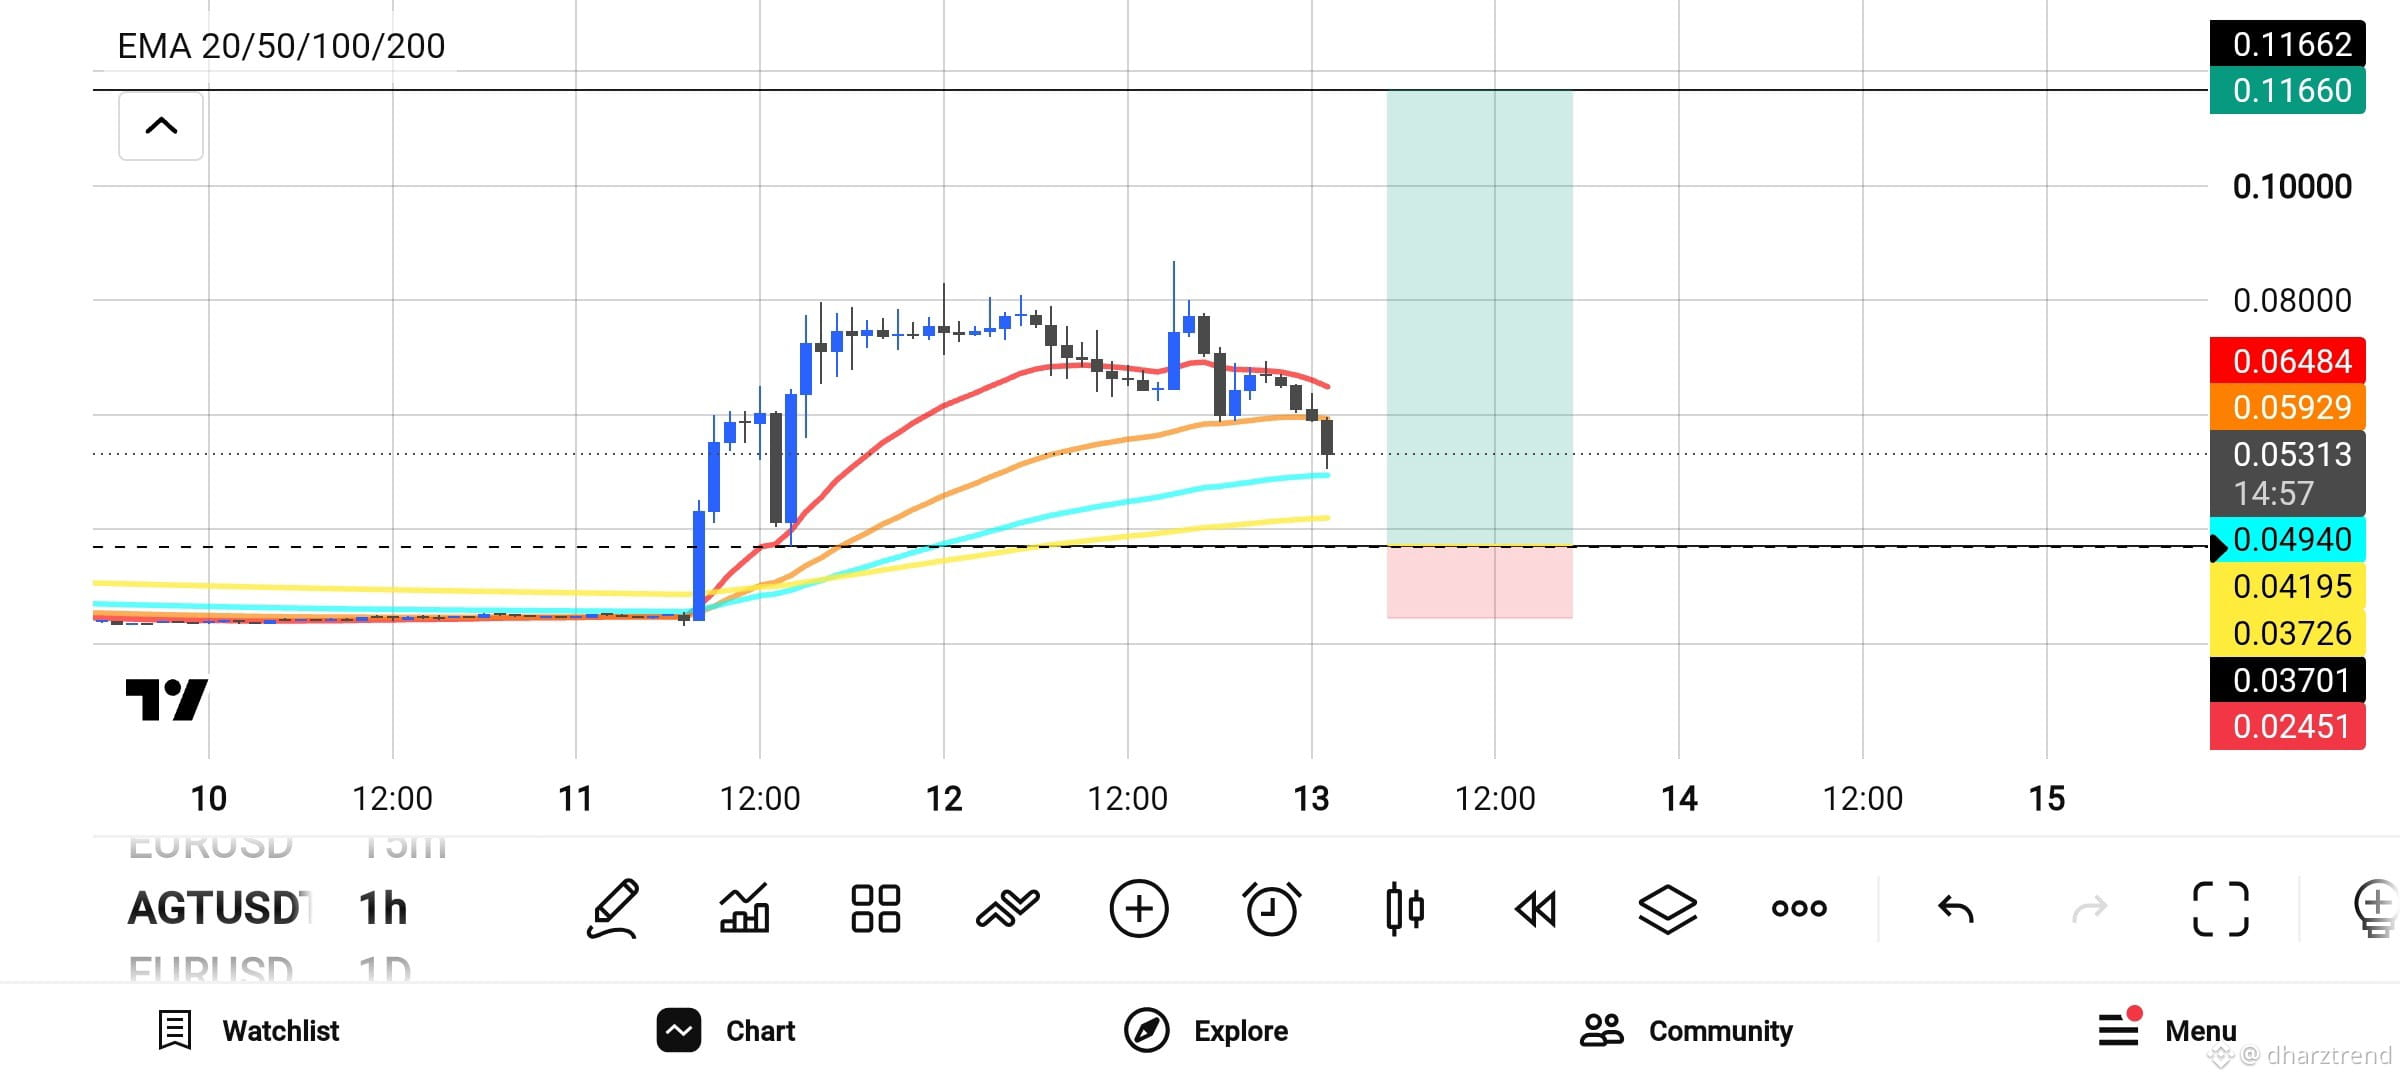
After a powerful breakout on Nov 11–12 that took $AGT from the 0.02–0.03 zone all the way above 0.08, the price is now correcting.
Key observations from the 1H chart:
Price made a clear impulsive move higher and is now retracing.
It is currently trading around the 0.053 area.
The 20 EMA (red) is sloping down and acting as resistance near 0.064–0.065.
The 50 EMA (orange) is around 0.059.
The 100 EMA (cyan) is sitting near current price (~0.053).
The 200 EMA (yellow) is lower around the 0.041–0.042 zone.
Structure:
The recent high failed to hold and price is now testing lower EMAs. The green vertical zone shows the previous strong impulse, while the current pink zone highlights the ongoing pullback.
Possible scenarios:
Bullish continuation:
If price holds above the 100 EMA / 0.049–0.053 zone and reclaims the 50 EMA, we could see another push toward 0.065–0.070 and potentially retest the previous highs.
Bearish continuation:
A clean break and close below 0.049–0.050 with volume could open the door toward the 200 EMA (around 0.041–0.037).
Summary:
had a strong parabolic move and is now in a healthy pullback phase. Watch the 0.053–0.049 support zone closely. Holding this area keeps the short-term bullish structure intact. Losing it shifts the bias more neutral-to-bearish in the near term.
What are you watching on — bounce from current levels or further correction?$AGT
{future}(AGTUSDT)
$AGT Technical Update (1H)
After a powerful breakout on Nov 11–12 that took $AGT from the 0.02–0.03 zone all the way above 0.08, the price is now correcting.
Key observations from the 1H chart:
Price made a clear impulsive move higher and is now retracing.
It is currently trading around the 0.053 area.
The 20 EMA (red) is sloping down and acting as resistance near 0.064–0.065.
The 50 EMA (orange) is around 0.059.
The 100 EMA (cyan) is sitting near current price (~0.053).
The 200 EMA (yellow) is lower around the 0.041–0.042 zone.
Structure:
The recent high failed to hold and price is now testing lower EMAs. The green vertical zone shows the previous strong impulse, while the current pink zone highlights the ongoing pullback.
Possible scenarios:
Bullish continuation:
If price holds above the 100 EMA / 0.049–0.053 zone and reclaims the 50 EMA, we could see another push toward 0.065–0.070 and potentially retest the previous highs.
Bearish continuation:
A clean break and close below 0.049–0.050 with volume could open the door toward the 200 EMA (around 0.041–0.037).
Summary:
had a strong parabolic move and is now in a healthy pullback phase. Watch the 0.053–0.049 support zone closely. Holding this area keeps the short-term bullish structure intact. Losing it shifts the bias more neutral-to-bearish in the near term.
What are you watching on — bounce from current levels or further correction?$AGT
After a powerful breakout on Nov 11–12 that took $AGT from the 0.02–0.03 zone all the way above 0.08, the price is now correcting.
Key observations from the 1H chart:
Price made a clear impulsive move higher and is now retracing.
It is currently trading around the 0.053 area.
The 20 EMA (red) is sloping down and acting as resistance near 0.064–0.065.
The 50 EMA (orange) is around 0.059.
The 100 EMA (cyan) is sitting near current price (~0.053).
The 200 EMA (yellow) is lower around the 0.041–0.042 zone.
Structure:
The recent high failed to hold and price is now testing lower EMAs. The green vertical zone shows the previous strong impulse, while the current pink zone highlights the ongoing pullback.
Possible scenarios:
Bullish continuation:
If price holds above the 100 EMA / 0.049–0.053 zone and reclaims the 50 EMA, we could see another push toward 0.065–0.070 and potentially retest the previous highs.
Bearish continuation:
A clean break and close below 0.049–0.050 with volume could open the door toward the 200 EMA (around 0.041–0.037).
Summary:
had a strong parabolic move and is now in a healthy pullback phase. Watch the 0.053–0.049 support zone closely. Holding this area keeps the short-term bullish structure intact. Losing it shifts the bias more neutral-to-bearish in the near term.
What are you watching on — bounce from current levels or further correction?$AGT
2
345
·
--
SOXL 15M | Bullish Reversal Setup 📈
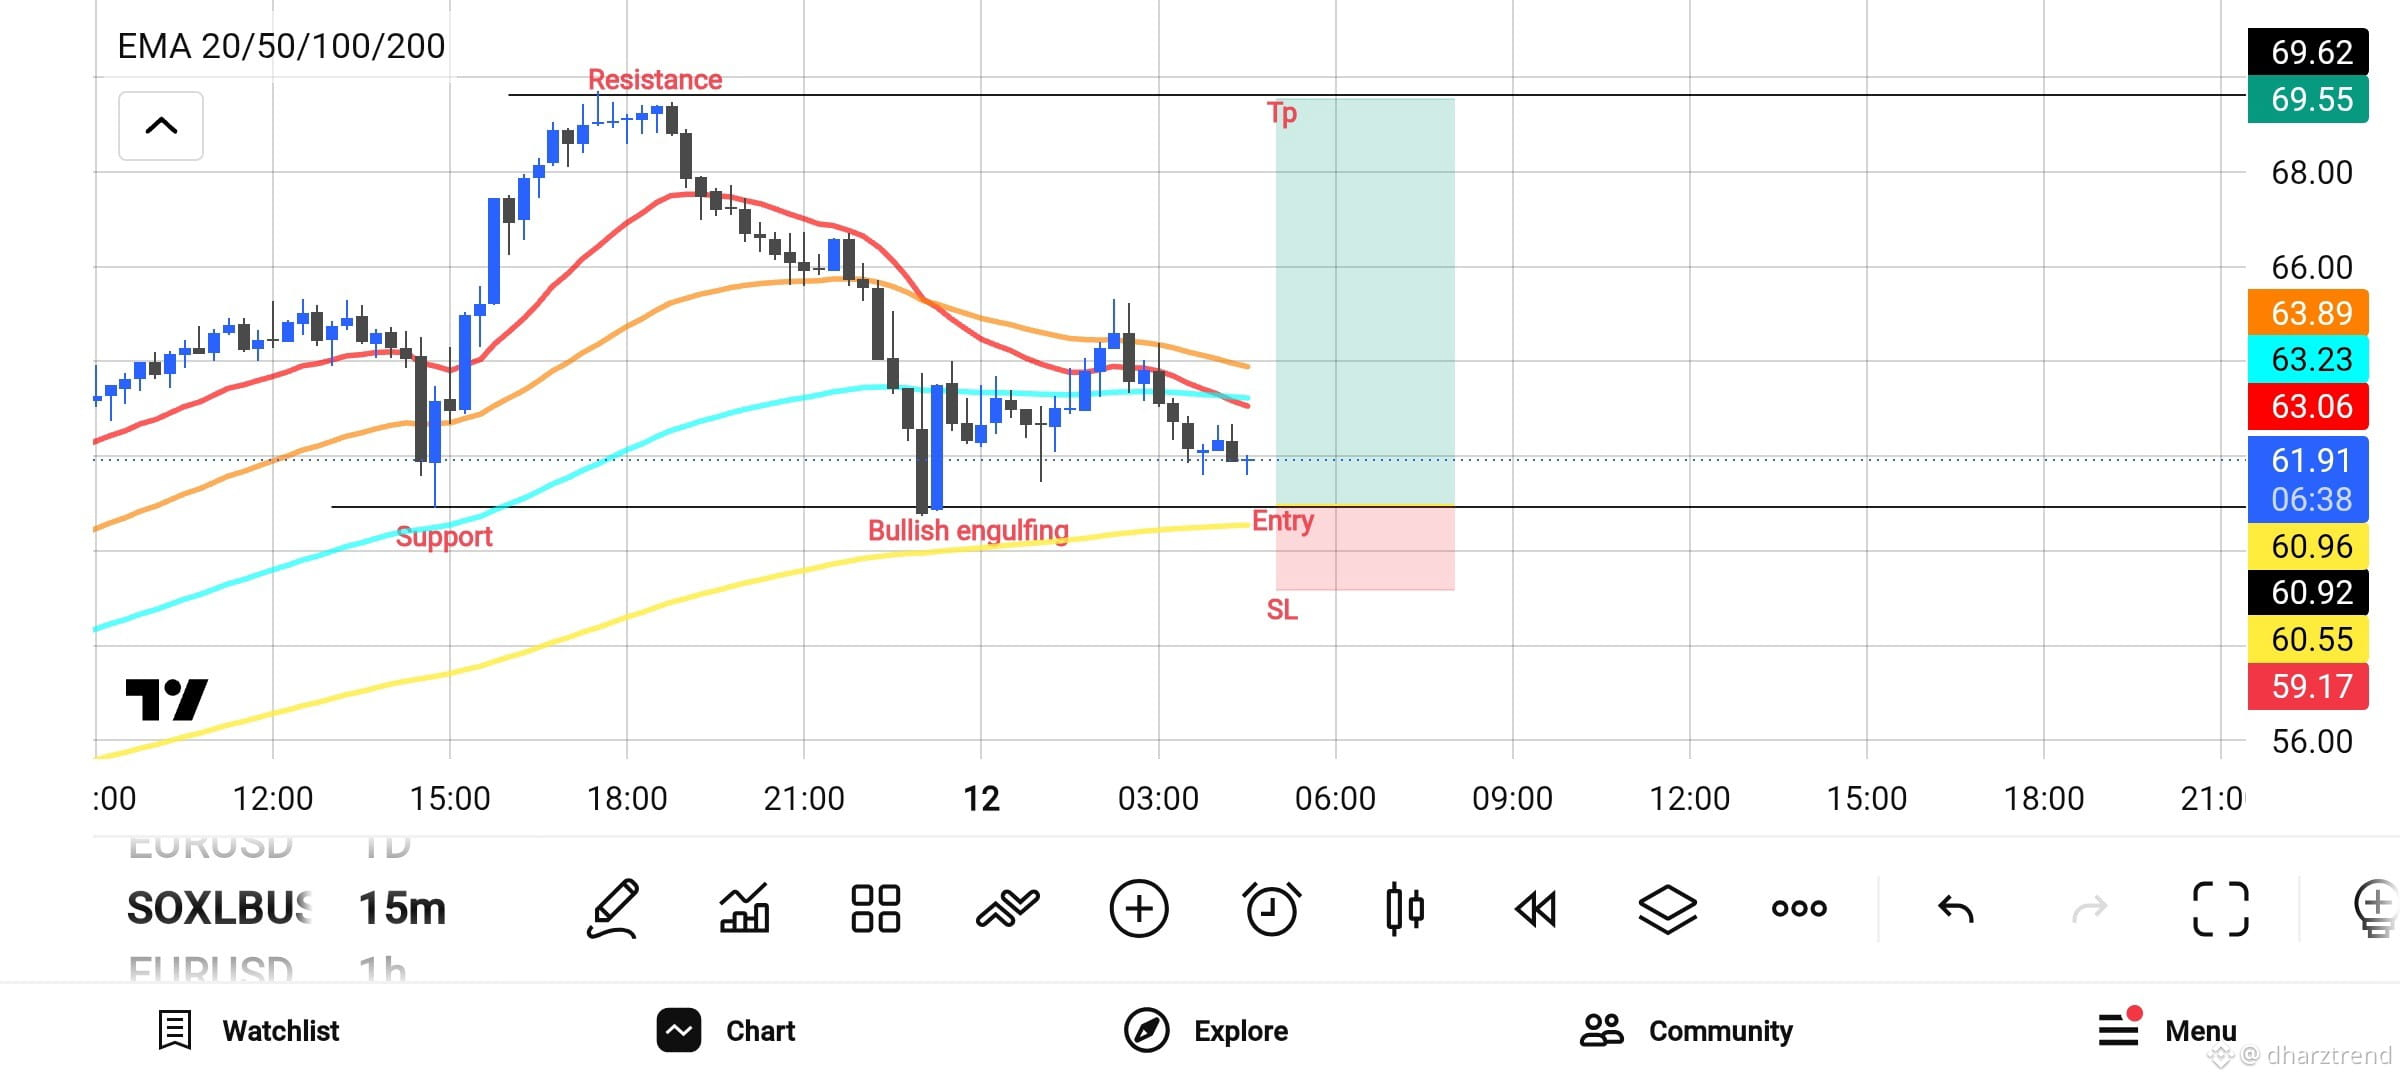
Price is approaching a major support zone around 60.92, where buyers previously stepped in.
A bullish engulfing candle appeared near support, suggesting a possible shift in short-term market momentum.
Key Levels:
- Support: 60.92
- Entry: 60.92
- Stop Loss: 59.17
- Take Profit: 69.55
- Resistance: 69.62
My Trading Perspective:
I'm watching how price reacts around support before considering a long position.
However, the EMAs are still showing bearish pressure, so confirmation is important before entering.
Remember: Wait for confirmation. Protect your capital. Never force a trade.
#SOXL #TechnicalAnalysis #PriceAction #BullishEngulfing #tradingStrategy $SOXLB
{spot}(SOXLBUSDT)
SOXL 15M | Bullish Reversal Setup 📈
Price is approaching a major support zone around 60.92, where buyers previously stepped in.
A bullish engulfing candle appeared near support, suggesting a possible shift in short-term market momentum.
Key Levels:
- Support: 60.92
- Entry: 60.92
- Stop Loss: 59.17
- Take Profit: 69.55
- Resistance: 69.62
My Trading Perspective:
I'm watching how price reacts around support before considering a long position.
However, the EMAs are still showing bearish pressure, so confirmation is important before entering.
Remember: Wait for confirmation. Protect your capital. Never force a trade.
#SOXL #TechnicalAnalysis #PriceAction #BullishEngulfing #tradingStrategy $SOXLB
Price is approaching a major support zone around 60.92, where buyers previously stepped in.
A bullish engulfing candle appeared near support, suggesting a possible shift in short-term market momentum.
Key Levels:
- Support: 60.92
- Entry: 60.92
- Stop Loss: 59.17
- Take Profit: 69.55
- Resistance: 69.62
My Trading Perspective:
I'm watching how price reacts around support before considering a long position.
However, the EMAs are still showing bearish pressure, so confirmation is important before entering.
Remember: Wait for confirmation. Protect your capital. Never force a trade.
#SOXL #TechnicalAnalysis #PriceAction #BullishEngulfing #tradingStrategy $SOXLB
3
267
·
--
TUTUSDT: Is a Bullish Reversal Coming?
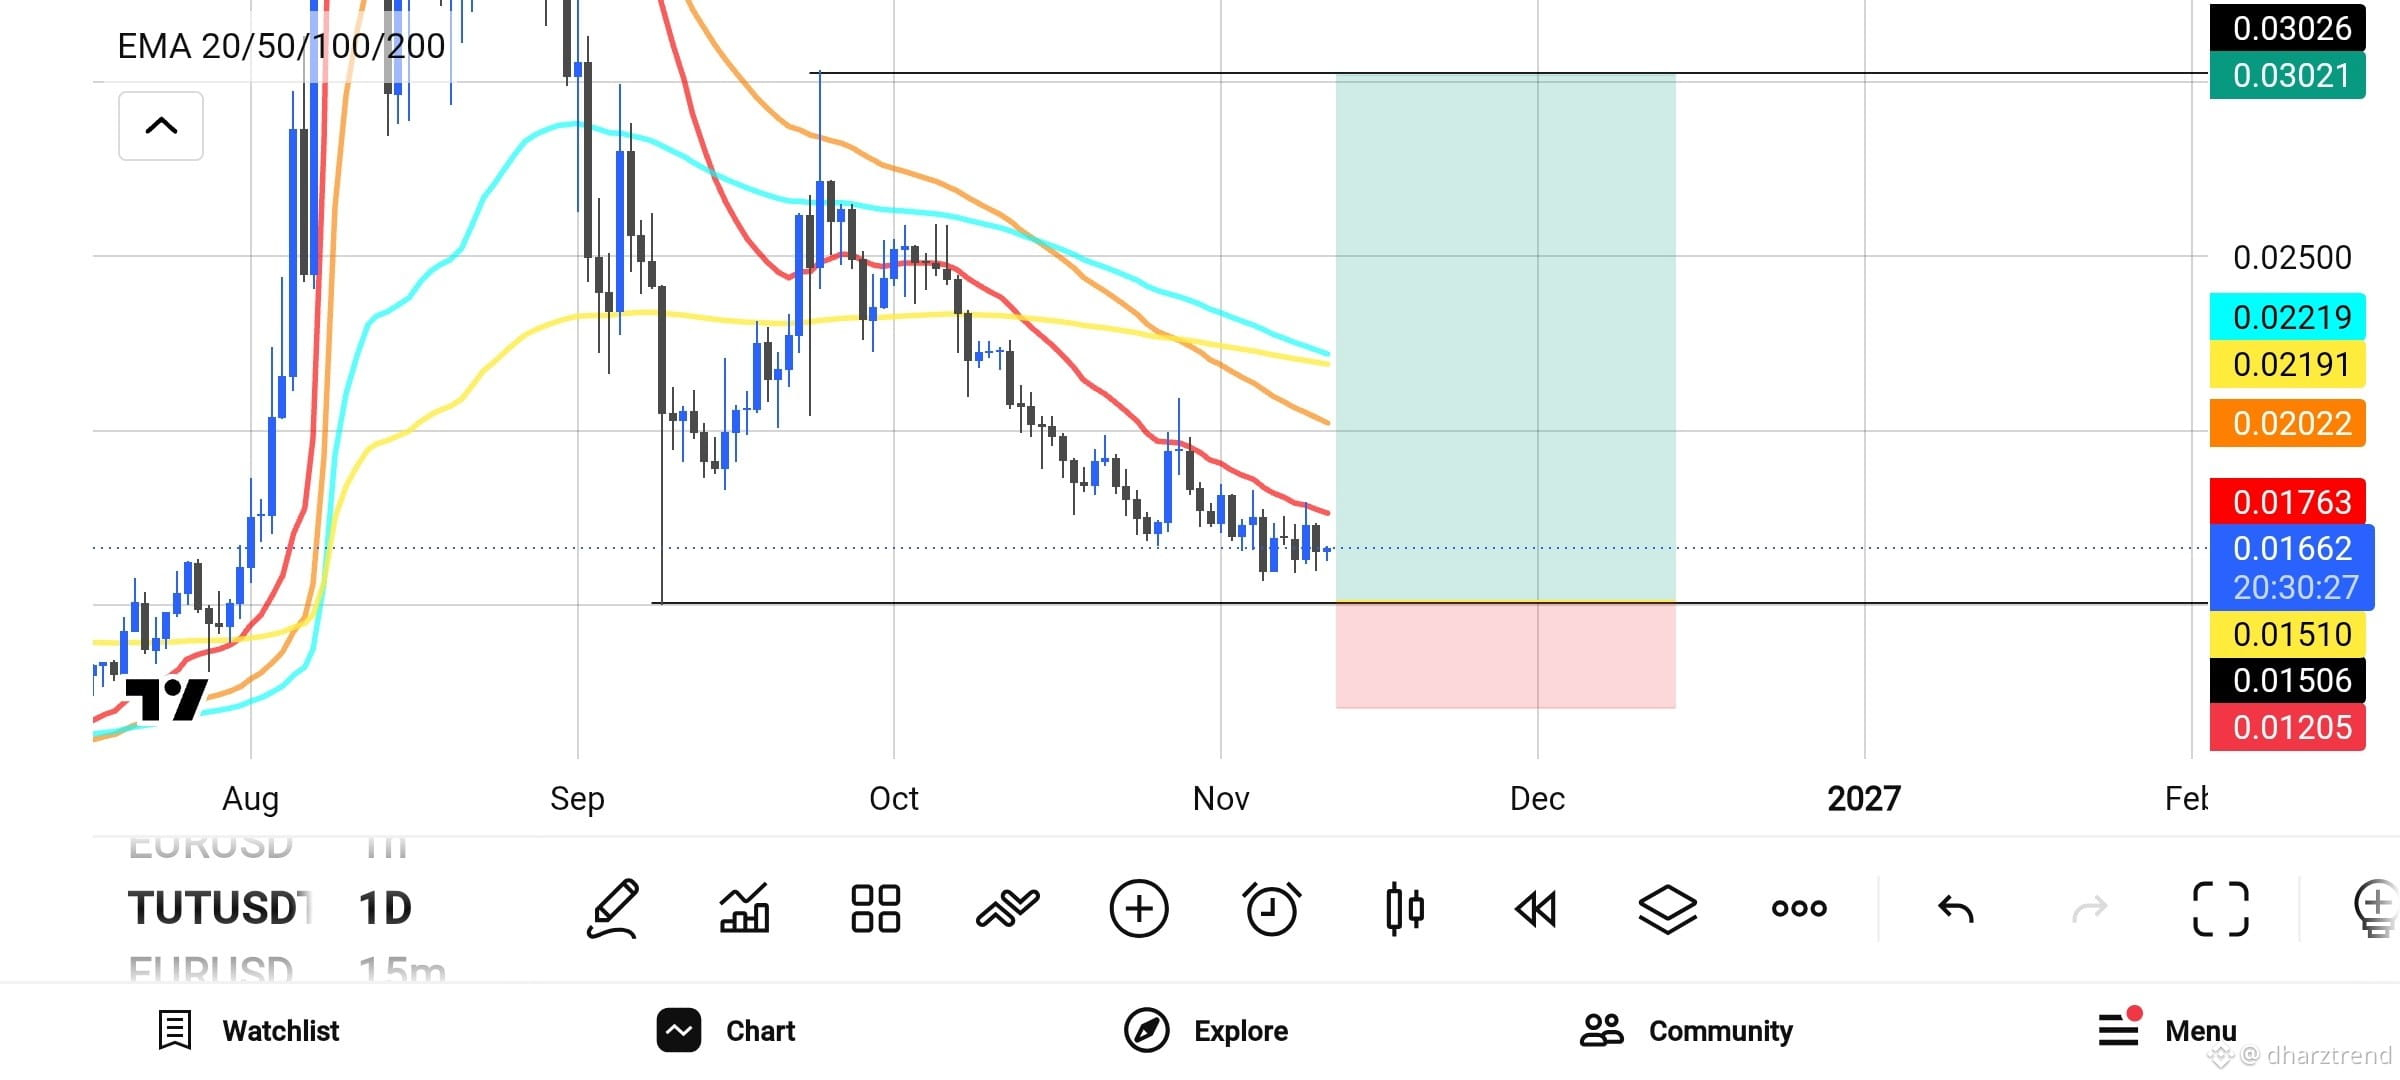
Looking at the Daily (1D) timeframe, TUTUSDT is still showing a bearish market structure.
📉 Technical Overview:
- Current Price: 0.01662
- EMA 20: 0.01763
- EMA 50: 0.02022
- EMA 100: 0.02191
- EMA 200: 0.02219
The price is trading below all major EMAs, indicating that sellers are still in control.
Key Levels to Watch:
- Support: 0.01510
- Resistance: 0.01763
- Next Resistance: 0.02022
- Major Resistance: 0.02219
My Trading Outlook:
A strong bounce from the 0.01510 support zone could signal a potential recovery.
However, a confirmed break below support may lead to further downside.
I'll be watching for a strong bullish candle and a reclaim of EMA 20 before considering a possible trend reversal.
Patience is key. Wait for confirmation, not prediction.
#TUTUSDT #CryptoAnalysis #TechnicalAnalysis #Binance #priceaction $TUT
{future}(TUTUSDT)
TUTUSDT: Is a Bullish Reversal Coming?
Looking at the Daily (1D) timeframe, TUTUSDT is still showing a bearish market structure.
📉 Technical Overview:
- Current Price: 0.01662
- EMA 20: 0.01763
- EMA 50: 0.02022
- EMA 100: 0.02191
- EMA 200: 0.02219
The price is trading below all major EMAs, indicating that sellers are still in control.
Key Levels to Watch:
- Support: 0.01510
- Resistance: 0.01763
- Next Resistance: 0.02022
- Major Resistance: 0.02219
My Trading Outlook:
A strong bounce from the 0.01510 support zone could signal a potential recovery.
However, a confirmed break below support may lead to further downside.
I'll be watching for a strong bullish candle and a reclaim of EMA 20 before considering a possible trend reversal.
Patience is key. Wait for confirmation, not prediction.
#TUTUSDT #CryptoAnalysis #TechnicalAnalysis #Binance #priceaction $TUT
Looking at the Daily (1D) timeframe, TUTUSDT is still showing a bearish market structure.
📉 Technical Overview:
- Current Price: 0.01662
- EMA 20: 0.01763
- EMA 50: 0.02022
- EMA 100: 0.02191
- EMA 200: 0.02219
The price is trading below all major EMAs, indicating that sellers are still in control.
Key Levels to Watch:
- Support: 0.01510
- Resistance: 0.01763
- Next Resistance: 0.02022
- Major Resistance: 0.02219
My Trading Outlook:
A strong bounce from the 0.01510 support zone could signal a potential recovery.
However, a confirmed break below support may lead to further downside.
I'll be watching for a strong bullish candle and a reclaim of EMA 20 before considering a possible trend reversal.
Patience is key. Wait for confirmation, not prediction.
#TUTUSDT #CryptoAnalysis #TechnicalAnalysis #Binance #priceaction $TUT
612
·
--
FROM BEARISH PRESSURE TO BULLISH MOMENTUM: THE POWER OF PRICE ACTION
The market doesn't always give you a perfect entry. Sometimes, you just need to understand what the candles are telling you.
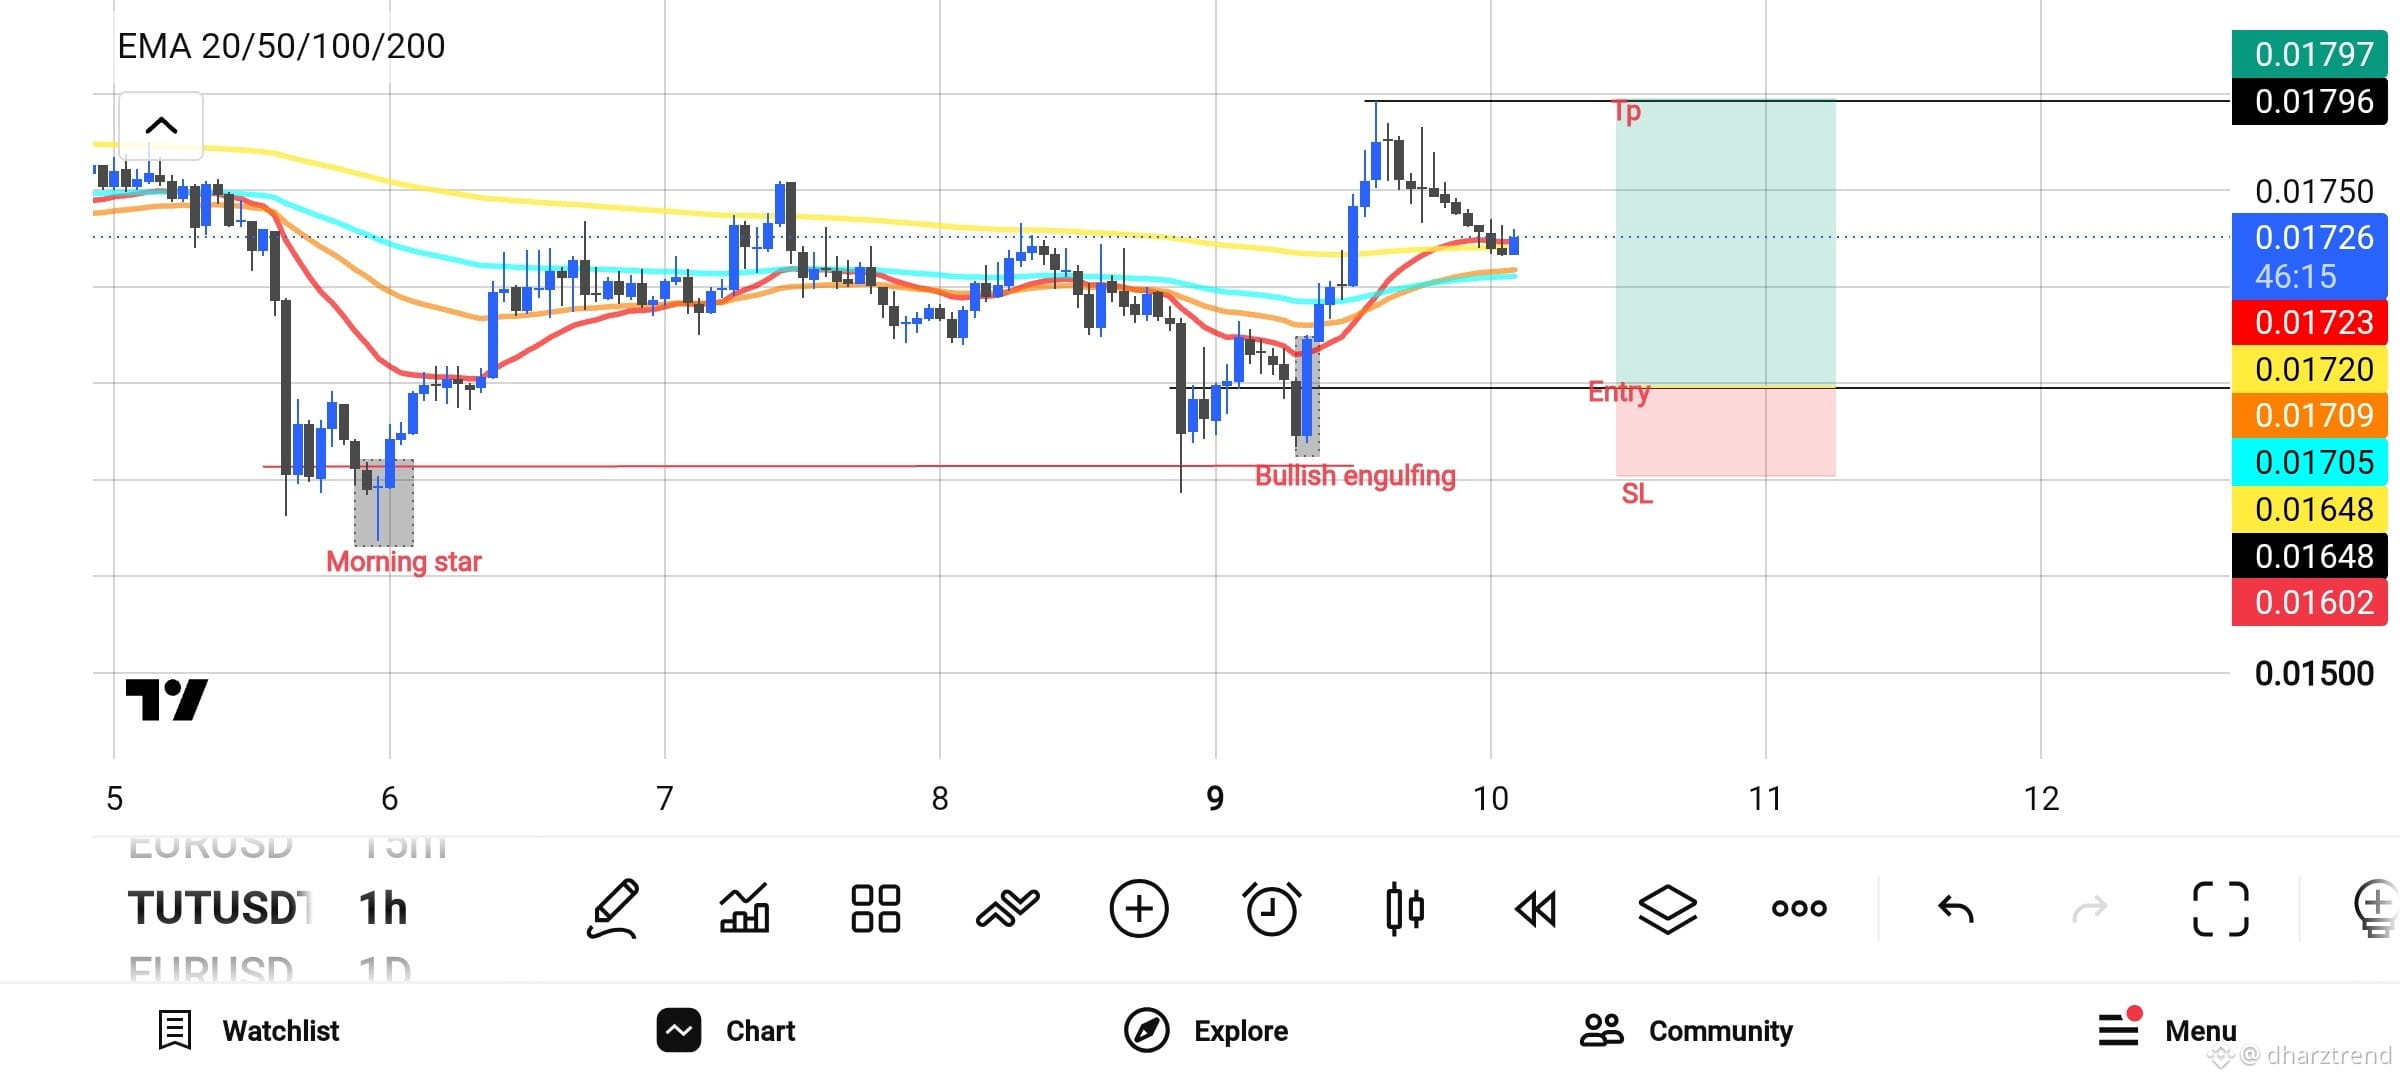
Looking at the TUTUSDT 1H chart, there are three important signals worth watching:
1. Morning Star – An early indication that selling pressure may be weakening.
2. Bullish Engulfing – Buyers stepped in and showed strong bullish momentum.
3. EMA 20/50/100/200 – Used to evaluate trend direction and dynamic support and resistance.
My Trading Plan:
- Entry: 0.01720
- Take Profit: 0.01796
- Stop Loss: Around 0.01648
The idea is simple: wait for confirmation, identify a logical entry, and always define your risk before entering a trade.
Remember: A strong trader doesn't chase every green candle. A strong trader waits for a setup with a clear trading plan.
Trade the setup, not the emotion.
#TUTUSDT #PriceAction #CandlestickPatterns #EMA #Binance #CryptoTrading #tradingStrategy $TUT
{future}(TUTUSDT)
FROM BEARISH PRESSURE TO BULLISH MOMENTUM: THE POWER OF PRICE ACTION
The market doesn't always give you a perfect entry. Sometimes, you just need to understand what the candles are telling you.
Looking at the TUTUSDT 1H chart, there are three important signals worth watching:
1. Morning Star – An early indication that selling pressure may be weakening.
2. Bullish Engulfing – Buyers stepped in and showed strong bullish momentum.
3. EMA 20/50/100/200 – Used to evaluate trend direction and dynamic support and resistance.
My Trading Plan:
- Entry: 0.01720
- Take Profit: 0.01796
- Stop Loss: Around 0.01648
The idea is simple: wait for confirmation, identify a logical entry, and always define your risk before entering a trade.
Remember: A strong trader doesn't chase every green candle. A strong trader waits for a setup with a clear trading plan.
Trade the setup, not the emotion.
#TUTUSDT #PriceAction #CandlestickPatterns #EMA #Binance #CryptoTrading #tradingStrategy $TUT
The market doesn't always give you a perfect entry. Sometimes, you just need to understand what the candles are telling you.
Looking at the TUTUSDT 1H chart, there are three important signals worth watching:
1. Morning Star – An early indication that selling pressure may be weakening.
2. Bullish Engulfing – Buyers stepped in and showed strong bullish momentum.
3. EMA 20/50/100/200 – Used to evaluate trend direction and dynamic support and resistance.
My Trading Plan:
- Entry: 0.01720
- Take Profit: 0.01796
- Stop Loss: Around 0.01648
The idea is simple: wait for confirmation, identify a logical entry, and always define your risk before entering a trade.
Remember: A strong trader doesn't chase every green candle. A strong trader waits for a setup with a clear trading plan.
Trade the setup, not the emotion.
#TUTUSDT #PriceAction #CandlestickPatterns #EMA #Binance #CryptoTrading #tradingStrategy $TUT
1
446
·
--
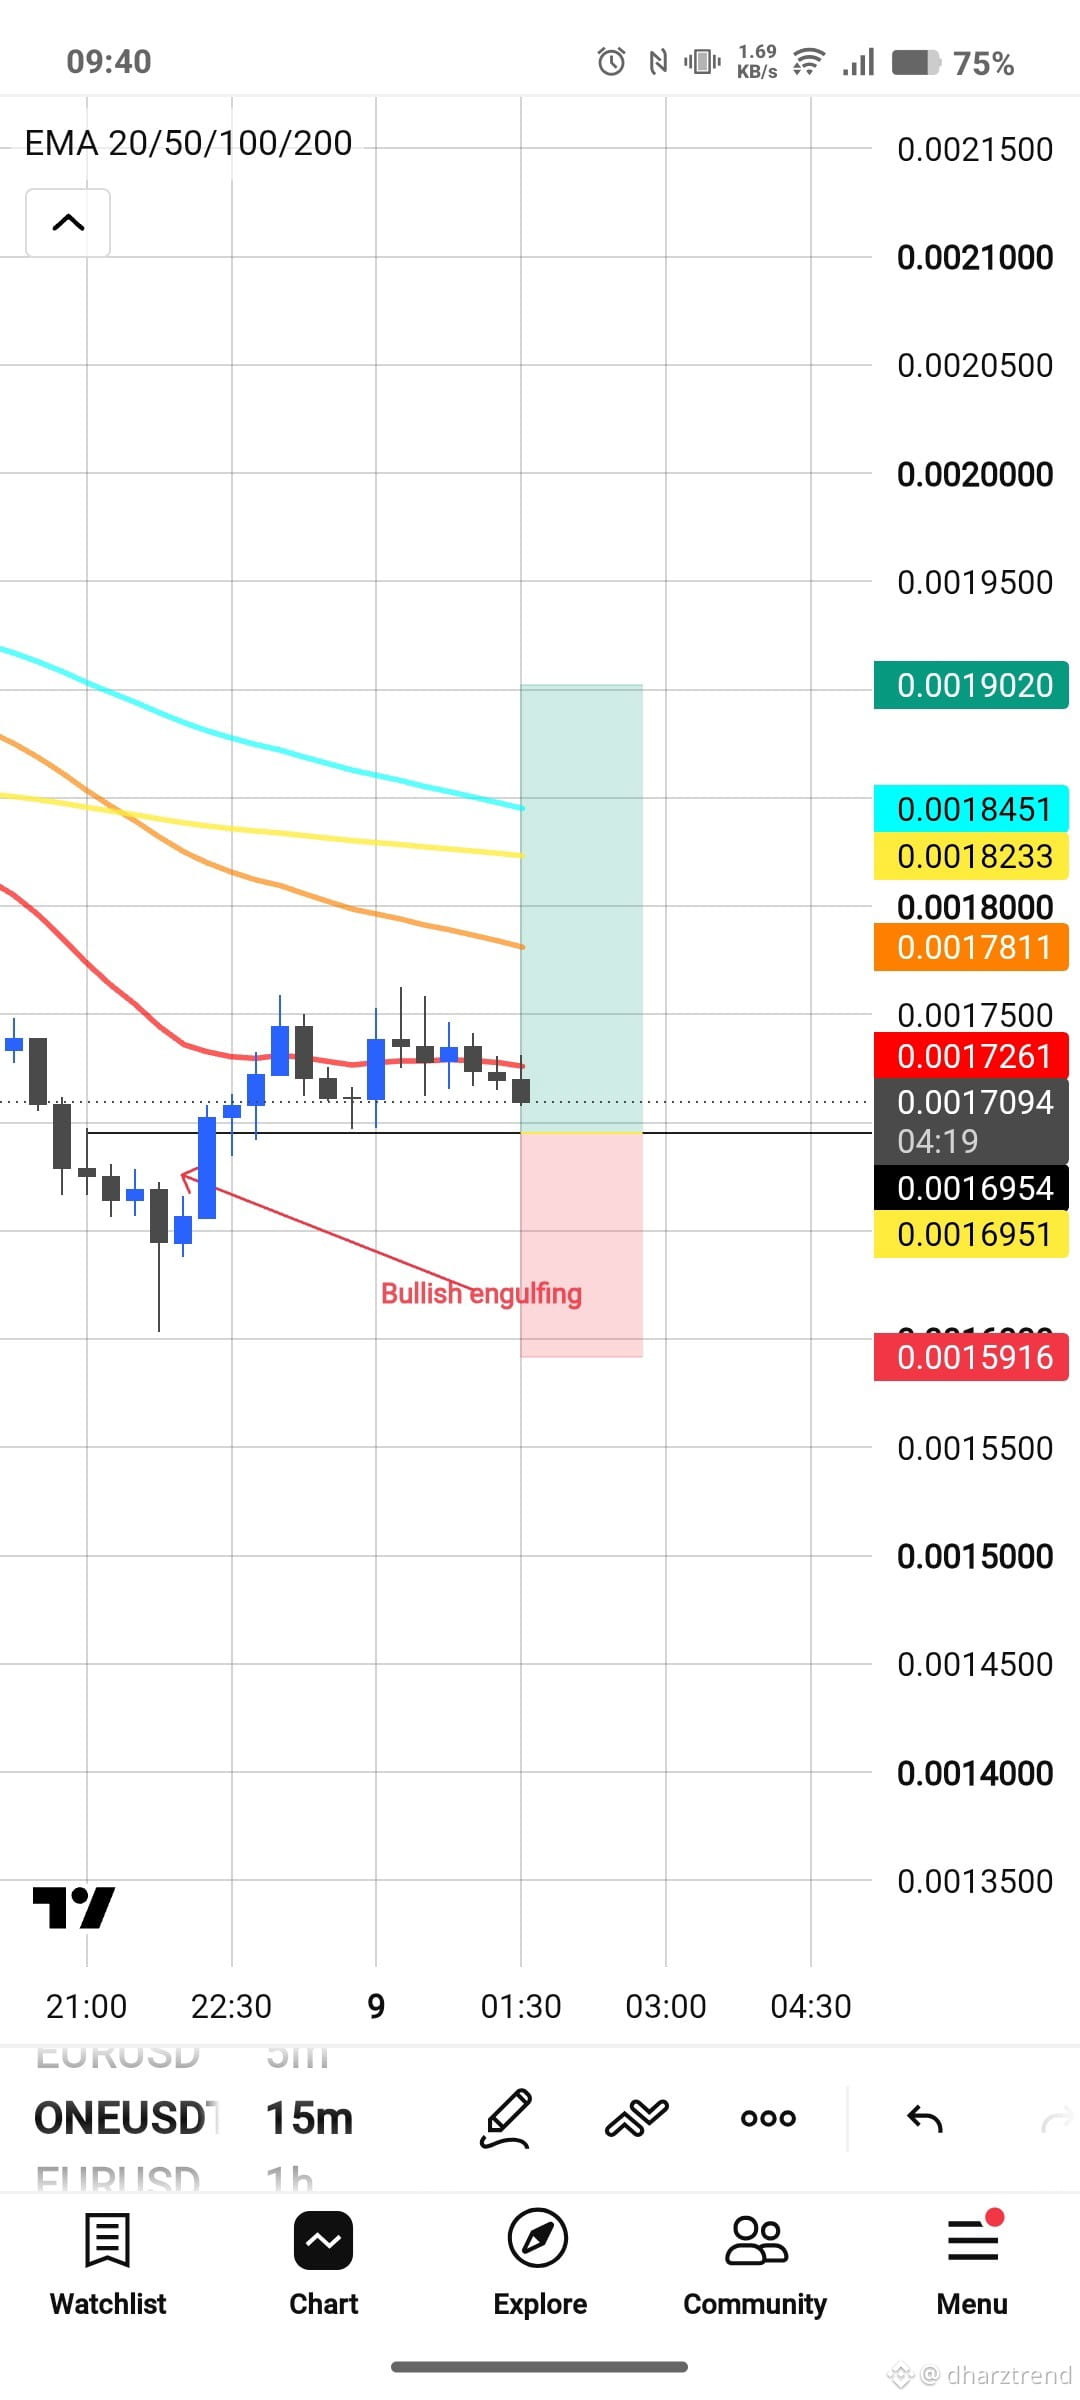
📊 ONEUSDT | Potential Bullish Reversal?
On the 15-minute timeframe, ONEUSDT is showing a potential bullish reversal after forming a Bullish Engulfing pattern.
The price is attempting to recover after a previous decline, but there is still resistance from the EMA 20, 50, 100, and 200.
📍 Trade Setup:
Entry: 0.0016954
Stop Loss: 0.0015916
Take Profit: 0.0019020
My Trading Outlook:
I'm watching for a bullish confirmation and a possible breakout above the EMA 20. If buyers gain momentum, the price could continue moving higher.
However, confirmation is important. Never enter a trade based on a candle pattern alone. Always manage your risk.
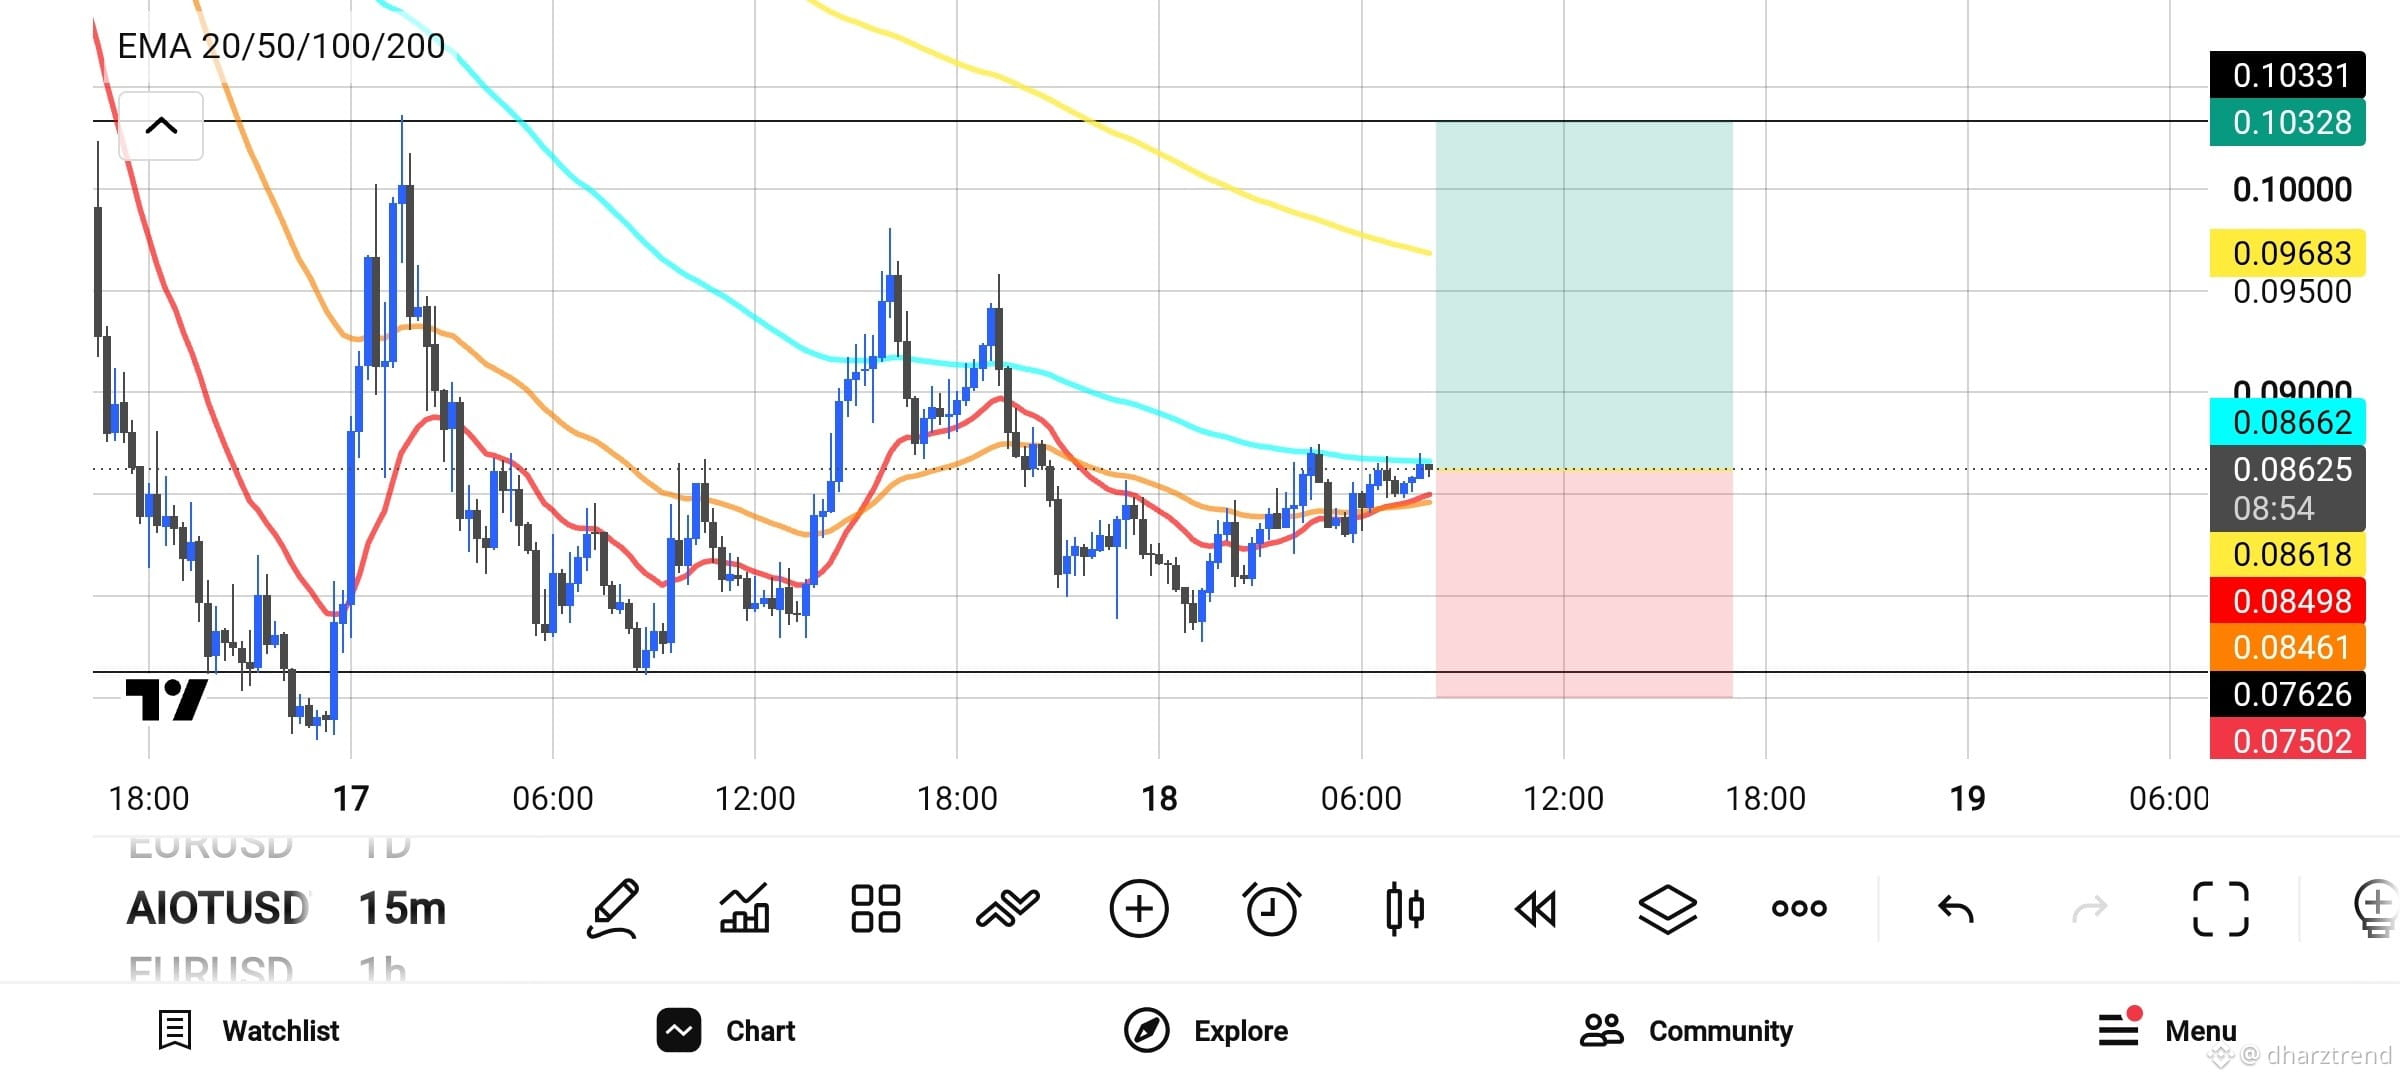
#ONEUSDT #CryptoTrading #PriceAction #TechnicalAnalysis #Binance
$ONE
{future}(ONEUSDT)
📊 ONEUSDT | Potential Bullish Reversal?
On the 15-minute timeframe, ONEUSDT is showing a potential bullish reversal after forming a Bullish Engulfing pattern.
The price is attempting to recover after a previous decline, but there is still resistance from the EMA 20, 50, 100, and 200.
📍 Trade Setup:
Entry: 0.0016954
Stop Loss: 0.0015916
Take Profit: 0.0019020
My Trading Outlook:
I'm watching for a bullish confirmation and a possible breakout above the EMA 20. If buyers gain momentum, the price could continue moving higher.
However, confirmation is important. Never enter a trade based on a candle pattern alone. Always manage your risk.
#ONEUSDT #CryptoTrading #PriceAction #TechnicalAnalysis #Binance
$ONE
On the 15-minute timeframe, ONEUSDT is showing a potential bullish reversal after forming a Bullish Engulfing pattern.
The price is attempting to recover after a previous decline, but there is still resistance from the EMA 20, 50, 100, and 200.
📍 Trade Setup:
Entry: 0.0016954
Stop Loss: 0.0015916
Take Profit: 0.0019020
My Trading Outlook:
I'm watching for a bullish confirmation and a possible breakout above the EMA 20. If buyers gain momentum, the price could continue moving higher.
However, confirmation is important. Never enter a trade based on a candle pattern alone. Always manage your risk.
#ONEUSDT #CryptoTrading #PriceAction #TechnicalAnalysis #Binance
$ONE
283
·
--
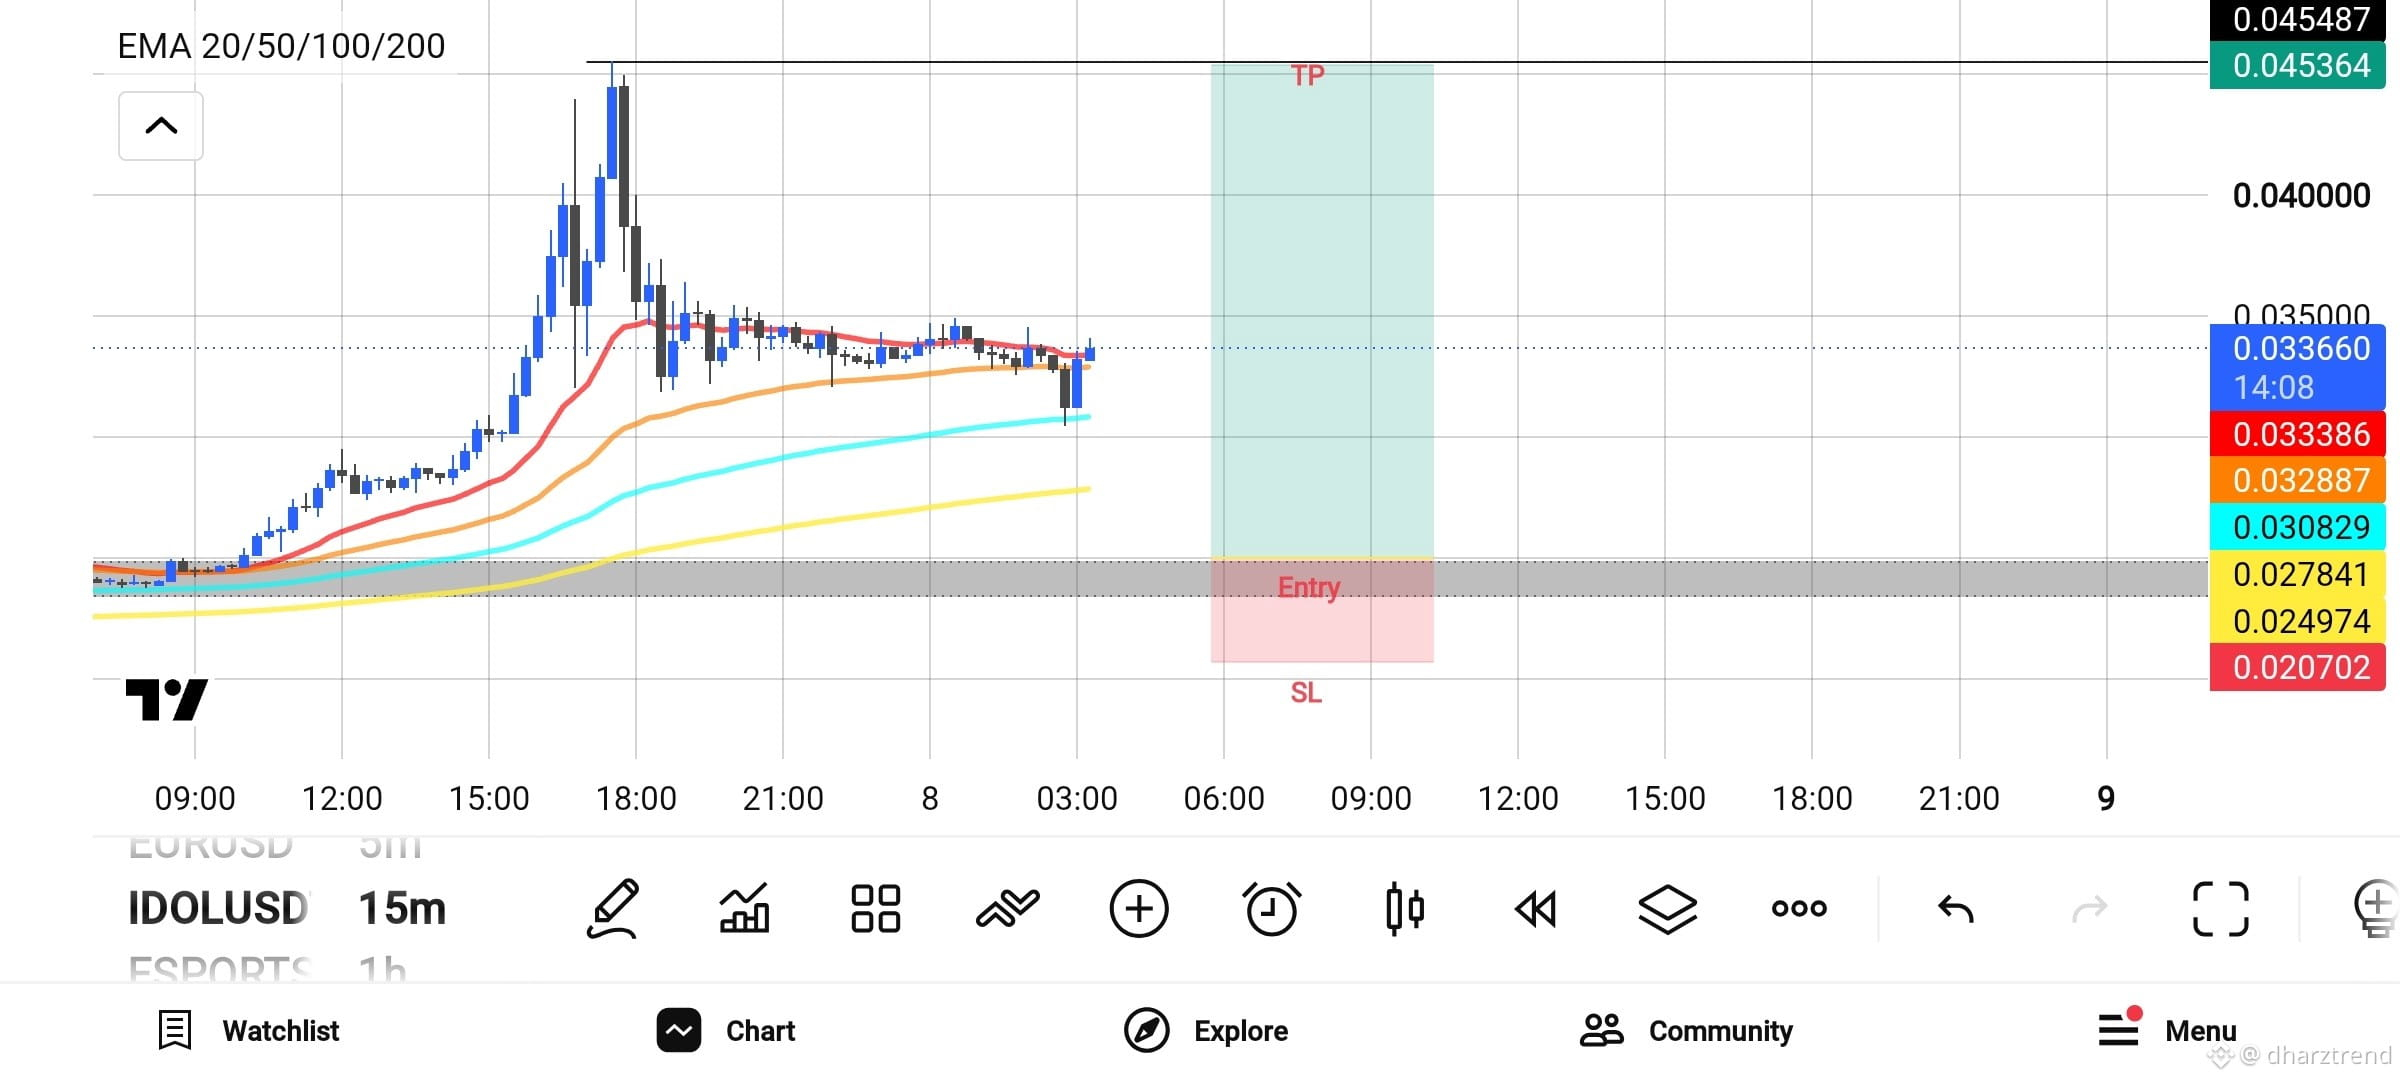
IDOL/USD 15m Setup (Long Bias)
Chart shows clear pullback after the earlier spike. Price is testing the lower EMAs while the higher ones are still sloping up.
Trade Idea:
Entry Zone: 0.0278 – 0.0308 (highlighted red box)
Stop Loss: Below 0.0207
Take Profit: 0.0453 – 0.0455 (highlighted green box)
Risk-reward looks solid if it holds the demand area and reclaims the 20/50 EMA.$IDOL
{future}(IDOLUSDT)
IDOL/USD 15m Setup (Long Bias)
Chart shows clear pullback after the earlier spike. Price is testing the lower EMAs while the higher ones are still sloping up.
Trade Idea:
Entry Zone: 0.0278 – 0.0308 (highlighted red box)
Stop Loss: Below 0.0207
Take Profit: 0.0453 – 0.0455 (highlighted green box)
Risk-reward looks solid if it holds the demand area and reclaims the 20/50 EMA.$IDOL
Chart shows clear pullback after the earlier spike. Price is testing the lower EMAs while the higher ones are still sloping up.
Trade Idea:
Entry Zone: 0.0278 – 0.0308 (highlighted red box)
Stop Loss: Below 0.0207
Take Profit: 0.0453 – 0.0455 (highlighted green box)
Risk-reward looks solid if it holds the demand area and reclaims the 20/50 EMA.$IDOL
488
·
--
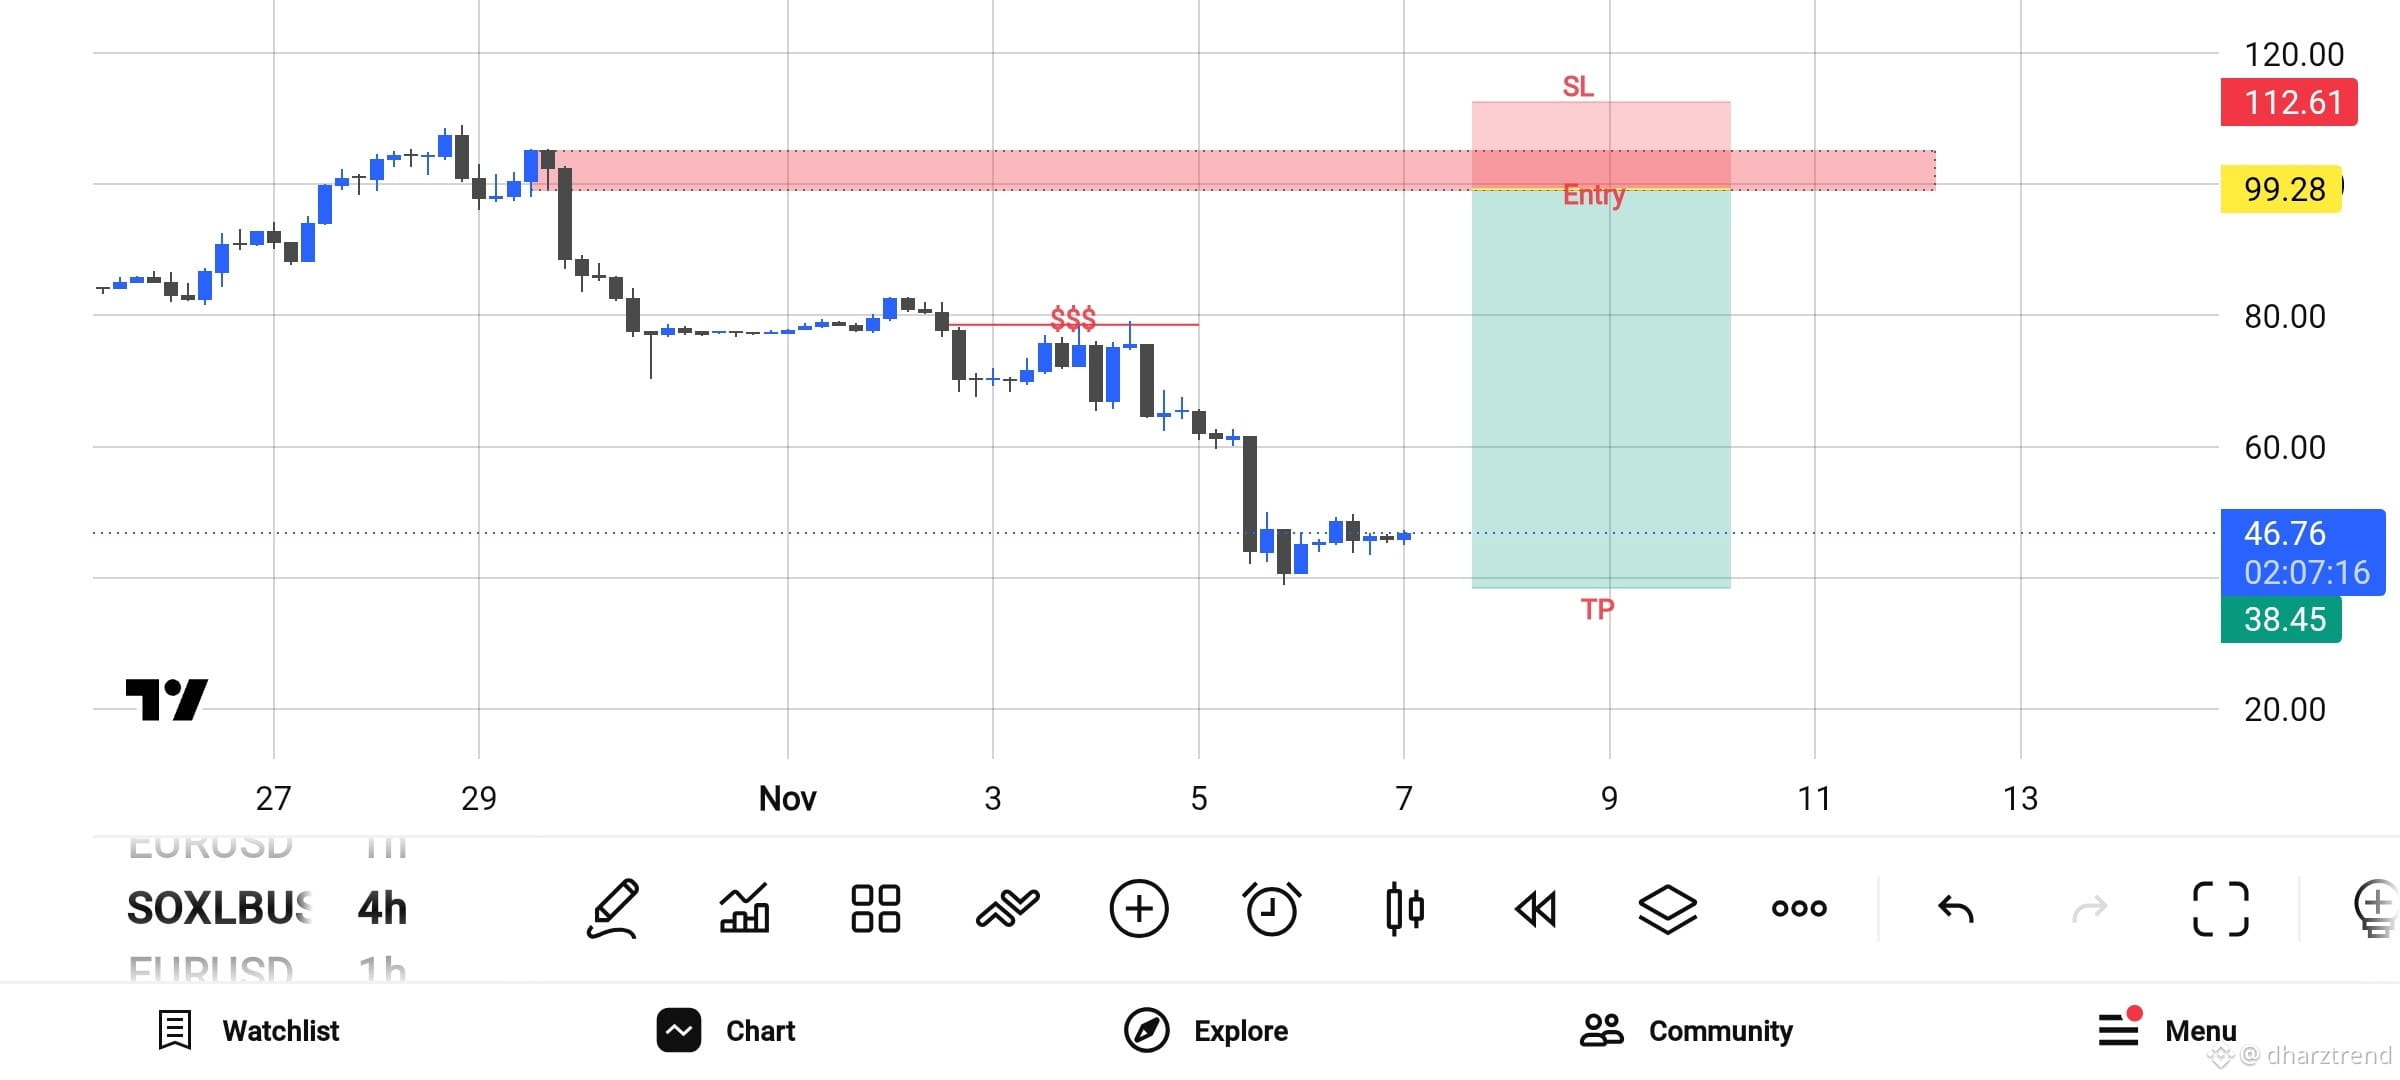
SOXL – Bearish Market Structure | 4H Analysis
SOXL continues to show strong bearish momentum on the 4H timeframe.
My trading setup focuses on a potential short position:
🔴 Entry: $99.28
🛑 Stop Loss: $112.61
🎯 Take Profit: $38.45
Market Outlook:
- Price has broken below previous support levels.
- Sellers remain in control.
- Waiting for a pullback toward the supply zone before considering a short entry.
- The bearish structure remains my primary bias.
Patience is important. I don't chase the market; I wait for price to come to my planned entry.
Remember: Every trade carries risk. Always manage your position size and protect your capital.
#SOXL #TechnicalAnalysis #PriceAction #TradingStrategy #cryptotrading $SOXLB
{spot}(SOXLBUSDT)
SOXL – Bearish Market Structure | 4H Analysis
SOXL continues to show strong bearish momentum on the 4H timeframe.
My trading setup focuses on a potential short position:
🔴 Entry: $99.28
🛑 Stop Loss: $112.61
🎯 Take Profit: $38.45
Market Outlook:
- Price has broken below previous support levels.
- Sellers remain in control.
- Waiting for a pullback toward the supply zone before considering a short entry.
- The bearish structure remains my primary bias.
Patience is important. I don't chase the market; I wait for price to come to my planned entry.
Remember: Every trade carries risk. Always manage your position size and protect your capital.
#SOXL #TechnicalAnalysis #PriceAction #TradingStrategy #cryptotrading $SOXLB
SOXL continues to show strong bearish momentum on the 4H timeframe.
My trading setup focuses on a potential short position:
🔴 Entry: $99.28
🛑 Stop Loss: $112.61
🎯 Take Profit: $38.45
Market Outlook:
- Price has broken below previous support levels.
- Sellers remain in control.
- Waiting for a pullback toward the supply zone before considering a short entry.
- The bearish structure remains my primary bias.
Patience is important. I don't chase the market; I wait for price to come to my planned entry.
Remember: Every trade carries risk. Always manage your position size and protect your capital.
#SOXL #TechnicalAnalysis #PriceAction #TradingStrategy #cryptotrading $SOXLB
1
440
·
--
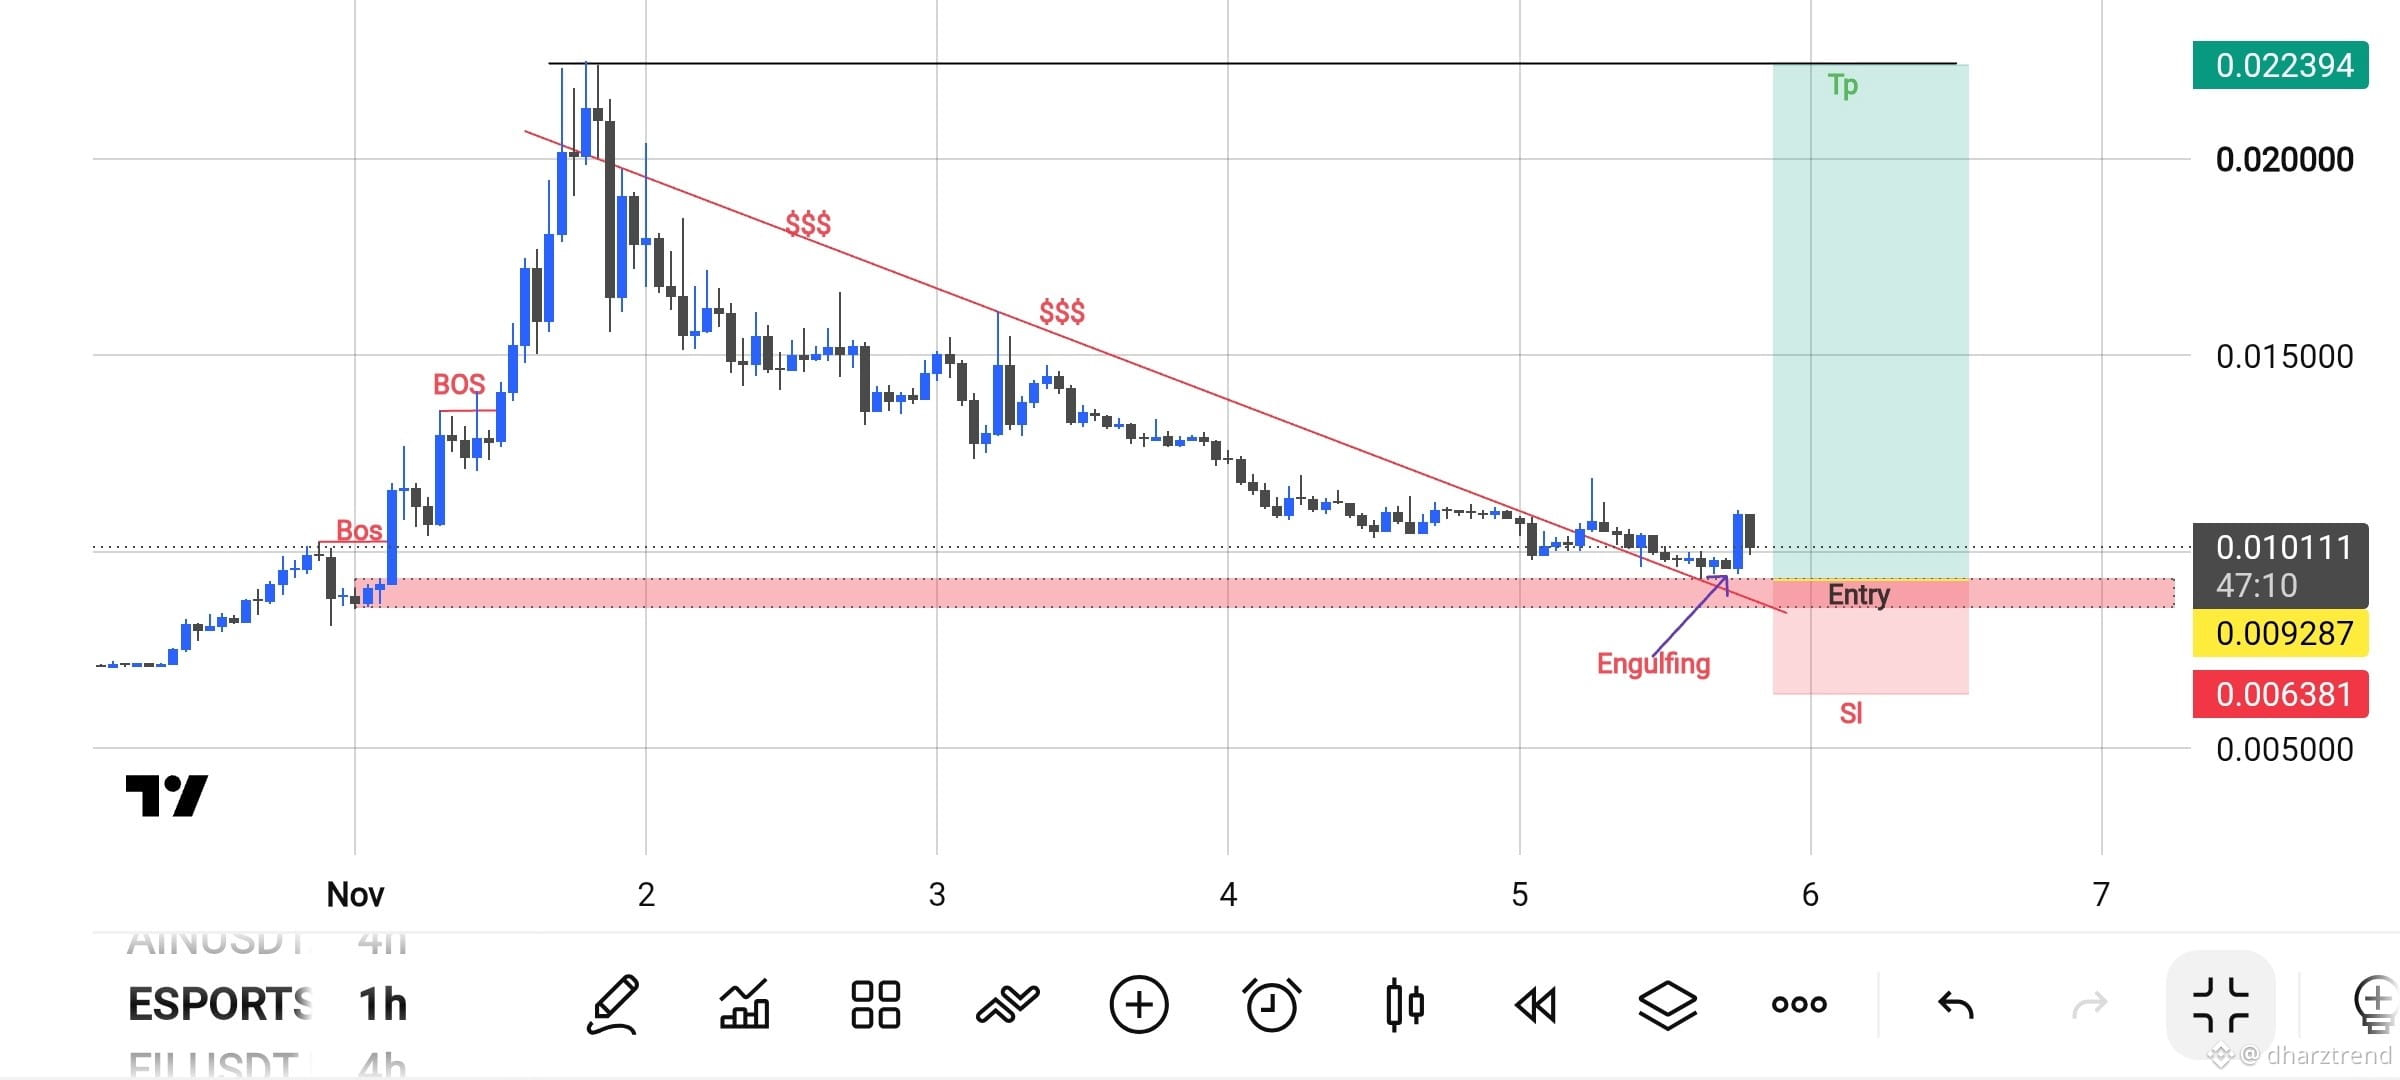
📈 BULLISH REVERSAL SETUP – WATCH THIS ZONE!
After a prolonged downtrend, price is approaching a major support and demand zone.
Here's what I'm watching:
🔹 Market Structure: Previous BOS shows bullish momentum history.
🔹 Trendline: Price is testing the descending resistance trendline.
🔹 Support Zone: Buyers are showing interest around the 0.0093–0.0101 area.
🔹 Confirmation: A bullish engulfing candle could signal a potential reversal.
🎯 Entry: 0.009287
🛑 Stop Loss: 0.006381
🚀 Take Profit: 0.022394
My Strategy: I'm watching for a confirmed bullish reversal rather than chasing the price. Patience and risk management are key.
Can this be the beginning of a new bullish trend? 👀
What's your take? Bullish or bearish?
#CryptoTrading #TechnicalAnalysis #PriceAction #MarketStructure #Binance $ESPORTS
{future}(ESPORTSUSDT)
📈 BULLISH REVERSAL SETUP – WATCH THIS ZONE!
After a prolonged downtrend, price is approaching a major support and demand zone.
Here's what I'm watching:
🔹 Market Structure: Previous BOS shows bullish momentum history.
🔹 Trendline: Price is testing the descending resistance trendline.
🔹 Support Zone: Buyers are showing interest around the 0.0093–0.0101 area.
🔹 Confirmation: A bullish engulfing candle could signal a potential reversal.
🎯 Entry: 0.009287
🛑 Stop Loss: 0.006381
🚀 Take Profit: 0.022394
My Strategy: I'm watching for a confirmed bullish reversal rather than chasing the price. Patience and risk management are key.
Can this be the beginning of a new bullish trend? 👀
What's your take? Bullish or bearish?
#CryptoTrading #TechnicalAnalysis #PriceAction #MarketStructure #Binance $ESPORTS
After a prolonged downtrend, price is approaching a major support and demand zone.
Here's what I'm watching:
🔹 Market Structure: Previous BOS shows bullish momentum history.
🔹 Trendline: Price is testing the descending resistance trendline.
🔹 Support Zone: Buyers are showing interest around the 0.0093–0.0101 area.
🔹 Confirmation: A bullish engulfing candle could signal a potential reversal.
🎯 Entry: 0.009287
🛑 Stop Loss: 0.006381
🚀 Take Profit: 0.022394
My Strategy: I'm watching for a confirmed bullish reversal rather than chasing the price. Patience and risk management are key.
Can this be the beginning of a new bullish trend? 👀
What's your take? Bullish or bearish?
#CryptoTrading #TechnicalAnalysis #PriceAction #MarketStructure #Binance $ESPORTS
2
826
Log in to explore more content
Join global crypto users on Binance Square
⚡️ Get latest and useful information about crypto.
💬 Trusted by the world’s largest crypto exchange.
👍 Discover real insights from verified creators.
Email / Phone number
Trending Topics
IsAnthropic’s$1.5TMarketCapJustified?
24,776 views
149 Discussing
Anthropic Set to Open at $105 in Record Nasdaq Debut
Binance News
·12 Likes
·17.2k views
BTCBelow$62KAmidHikeFearsAndShiftToAnthropic
0 views
2 Discussing
13FInstitutionsBitcoinSpotETPHoldingsHitRecord
1,598 views
53 Discussing