

Bryne B
28 Posts

Bryne B
Report
Block User
Open Trade
Occasional Trader
3.3 Years
16 Following
41 Followers
21 Liked
Posts
Portfolio
All
Quotes
·
--
🚨LATEST: Heads of AI firms warn the UN Security Council that humans could LOSE CONTROL of the future to AI.
OpenAI CEO says AI could advance so quickly that people can no longer understand what is happening or intervene when needed.
“We have unilaterally slowed down in the past. We will do so in the future,” says Sam Altman
Anthropic CEO Dario Amodei echoed the warning, saying poorly managed AI could pose "a risk to humanity as a whole."
“This moment calls for extreme care,” Altman adds.
🚨LATEST: Heads of AI firms warn the UN Security Council that humans could LOSE CONTROL of the future to AI.
OpenAI CEO says AI could advance so quickly that people can no longer understand what is happening or intervene when needed.
“We have unilaterally slowed down in the past. We will do so in the future,” says Sam Altman
Anthropic CEO Dario Amodei echoed the warning, saying poorly managed AI could pose "a risk to humanity as a whole."
“This moment calls for extreme care,” Altman adds.
OpenAI CEO says AI could advance so quickly that people can no longer understand what is happening or intervene when needed.
“We have unilaterally slowed down in the past. We will do so in the future,” says Sam Altman
Anthropic CEO Dario Amodei echoed the warning, saying poorly managed AI could pose "a risk to humanity as a whole."
“This moment calls for extreme care,” Altman adds.
70
·
--
.
At 10:00, price suddenly expanded from the flat 1.0000 baseline up to 1.0007, then immediately plunged down to test 0.9994 within the same candle window before instantly snapping back to equilibrium. The entire move was accompanied by a massive volume spike reaching 4.70K which dwarf the surrounding volume bars
Current Price: 1.0000 USDT
24H Change: -0.02%
24H High: 1.0007 USDT
24H Low: 0.9994 USDT
24H Range: 0.0013 USDT (13 bps total spread)
24H Turnover: ~$43.34M USDT
Volume: Current 15m volume sits around 4.70K USDE.
Moving Average Volume Comparison: MA5 Volume is sitting at 23.19K, while MA10 Volume sits at 200.13K. Current volume is roughly 79.7% below the MA5 volume average, showing complete volume drop-off and exhaustion following the spike.
Structure: Compression & Mean Reversion. The chart exhibits absolute horizontal stability with a localized liquidity sweep.
Moving Averages: MA7 (1.0000), MA14 (1.0000), and MA28 (1.0000) have all flattened and merged perfectly into 1.0000. This cluster indicates zero trend momentum and complete equilibrium across short-to-medium intraday horizons.
Rapid arbitrage response: The dip to 0.9994 was aggressively bought up back to the 1.0000 peg instantly, proving strong market maker depth.
High overall turnover ($43.34M) ensuring tight spreads and zero slippage under normal execution.
Volume has completely dried up post-spike (sitting nearly 80% below MA5 volume), offering no momentum.
Resistance: 1.0007 (24H High / Liquidity Wick)
Support: 0.9994 (24H Low / Rejection Floor)
Equilibrium: 1.0000 (Merged MA7, MA14, MA28 alignment
Decision: HARD PASS / NO TRADE
Reasoning: Trading USDE/USDT for directional profit makes no structural sense. The R:R is completely unviable—risking a potential depeg shock down to 0.9994 to target a fraction of a basis point return back to 1.0000 yields an unfavorable trade setup.
Is this temporary wick down to 0.9994 just an isolated market-order slip on Bybit, or are you noticing similar micro-liquidity sweeps across other synthetic stablecoin order books today?
#Bybit #CryptoTrading #USDE
.
At 10:00, price suddenly expanded from the flat 1.0000 baseline up to 1.0007, then immediately plunged down to test 0.9994 within the same candle window before instantly snapping back to equilibrium. The entire move was accompanied by a massive volume spike reaching 4.70K which dwarf the surrounding volume bars
Current Price: 1.0000 USDT
24H Change: -0.02%
24H High: 1.0007 USDT
24H Low: 0.9994 USDT
24H Range: 0.0013 USDT (13 bps total spread)
24H Turnover: ~$43.34M USDT
Volume: Current 15m volume sits around 4.70K USDE.
Moving Average Volume Comparison: MA5 Volume is sitting at 23.19K, while MA10 Volume sits at 200.13K. Current volume is roughly 79.7% below the MA5 volume average, showing complete volume drop-off and exhaustion following the spike.
Structure: Compression & Mean Reversion. The chart exhibits absolute horizontal stability with a localized liquidity sweep.
Moving Averages: MA7 (1.0000), MA14 (1.0000), and MA28 (1.0000) have all flattened and merged perfectly into 1.0000. This cluster indicates zero trend momentum and complete equilibrium across short-to-medium intraday horizons.
Rapid arbitrage response: The dip to 0.9994 was aggressively bought up back to the 1.0000 peg instantly, proving strong market maker depth.
High overall turnover ($43.34M) ensuring tight spreads and zero slippage under normal execution.
Volume has completely dried up post-spike (sitting nearly 80% below MA5 volume), offering no momentum.
Resistance: 1.0007 (24H High / Liquidity Wick)
Support: 0.9994 (24H Low / Rejection Floor)
Equilibrium: 1.0000 (Merged MA7, MA14, MA28 alignment
Decision: HARD PASS / NO TRADE
Reasoning: Trading USDE/USDT for directional profit makes no structural sense. The R:R is completely unviable—risking a potential depeg shock down to 0.9994 to target a fraction of a basis point return back to 1.0000 yields an unfavorable trade setup.
Is this temporary wick down to 0.9994 just an isolated market-order slip on Bybit, or are you noticing similar micro-liquidity sweeps across other synthetic stablecoin order books today?
#Bybit #CryptoTrading #USDE
At 10:00, price suddenly expanded from the flat 1.0000 baseline up to 1.0007, then immediately plunged down to test 0.9994 within the same candle window before instantly snapping back to equilibrium. The entire move was accompanied by a massive volume spike reaching 4.70K which dwarf the surrounding volume bars
Current Price: 1.0000 USDT
24H Change: -0.02%
24H High: 1.0007 USDT
24H Low: 0.9994 USDT
24H Range: 0.0013 USDT (13 bps total spread)
24H Turnover: ~$43.34M USDT
Volume: Current 15m volume sits around 4.70K USDE.
Moving Average Volume Comparison: MA5 Volume is sitting at 23.19K, while MA10 Volume sits at 200.13K. Current volume is roughly 79.7% below the MA5 volume average, showing complete volume drop-off and exhaustion following the spike.
Structure: Compression & Mean Reversion. The chart exhibits absolute horizontal stability with a localized liquidity sweep.
Moving Averages: MA7 (1.0000), MA14 (1.0000), and MA28 (1.0000) have all flattened and merged perfectly into 1.0000. This cluster indicates zero trend momentum and complete equilibrium across short-to-medium intraday horizons.
Rapid arbitrage response: The dip to 0.9994 was aggressively bought up back to the 1.0000 peg instantly, proving strong market maker depth.
High overall turnover ($43.34M) ensuring tight spreads and zero slippage under normal execution.
Volume has completely dried up post-spike (sitting nearly 80% below MA5 volume), offering no momentum.
Resistance: 1.0007 (24H High / Liquidity Wick)
Support: 0.9994 (24H Low / Rejection Floor)
Equilibrium: 1.0000 (Merged MA7, MA14, MA28 alignment
Decision: HARD PASS / NO TRADE
Reasoning: Trading USDE/USDT for directional profit makes no structural sense. The R:R is completely unviable—risking a potential depeg shock down to 0.9994 to target a fraction of a basis point return back to 1.0000 yields an unfavorable trade setup.
Is this temporary wick down to 0.9994 just an isolated market-order slip on Bybit, or are you noticing similar micro-liquidity sweeps across other synthetic stablecoin order books today?
#Bybit #CryptoTrading #USDE
123
·
--
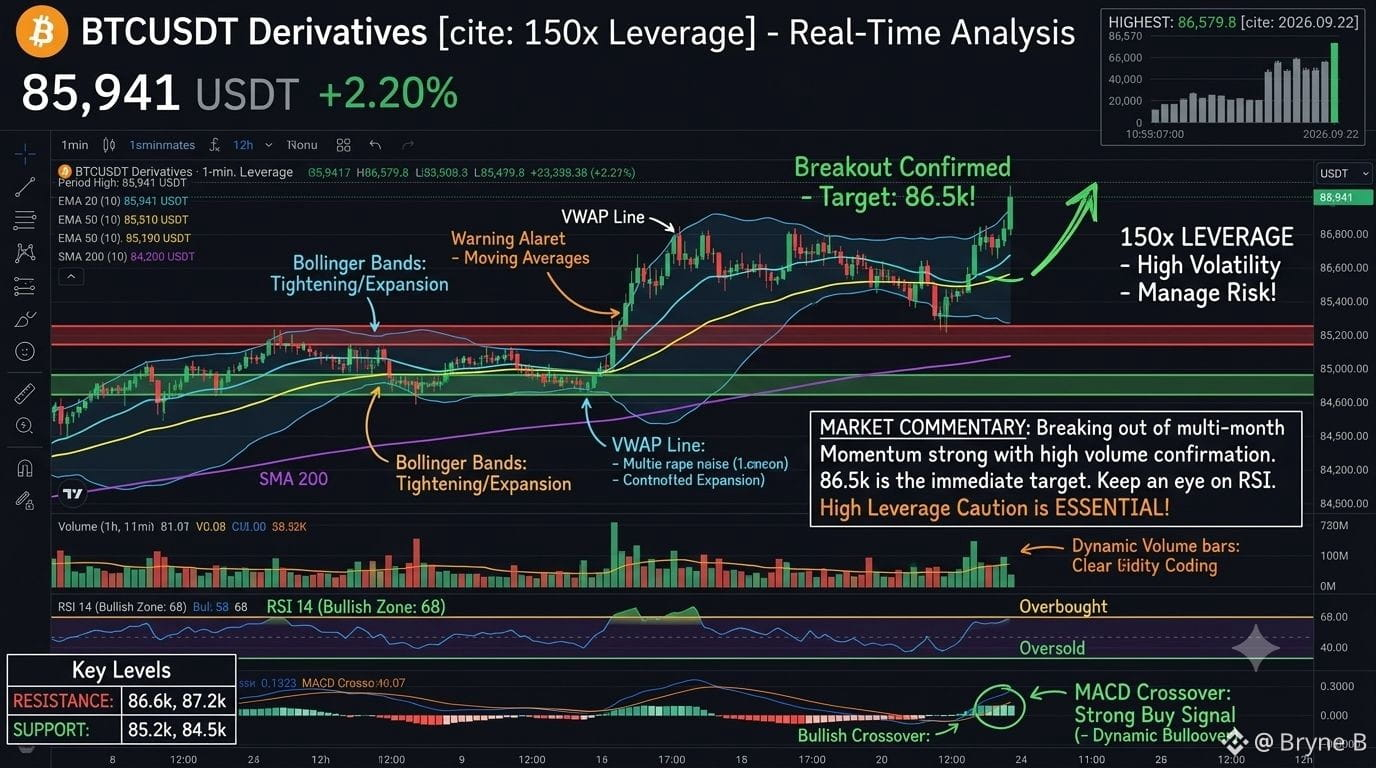
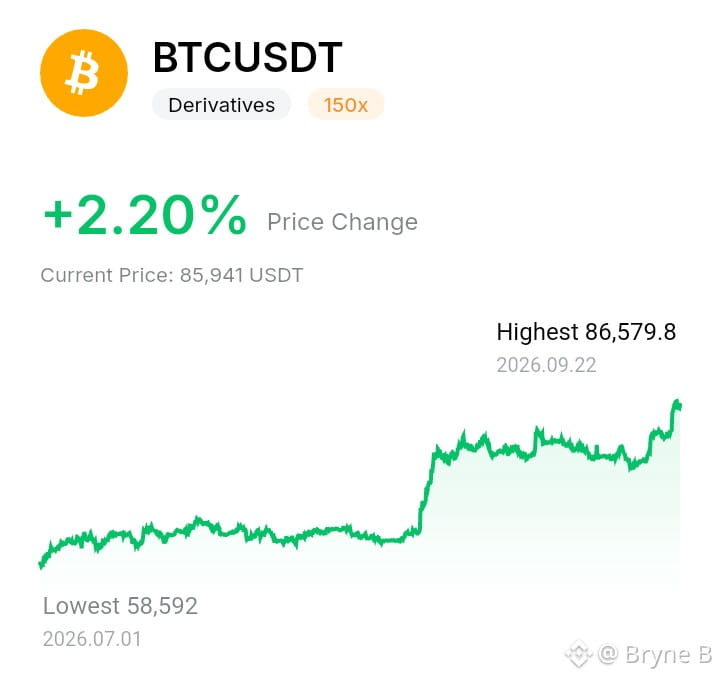
🚀 BTCUSDT Update! 📈
$BTC Bitcoin is showing strong upward momentum! Here are the key highlights from the current price chart:
Current Price: 85,941 USDT (+2.20% Price Change)
Trading Pair: BTCUSDT (Derivatives, 150x Leverage)
Period High: 86,579.8 USDT (Recorded on September 22, 2026)
Period Low: 58,592 USDT (Recorded on July 01, 2026)
After consolidating near the 58k–60k range earlier this summer, Bitcoin staged a massive breakout and is now pressing toward new local highs around $86.5k.
Are you holding long, taking profits, or watching from the sidelines? Let us know your target price for BTC! 💬👇
(Disclaimer: High-leverage derivatives trading like 150x carries extreme risk. Always manage your risk carefully and trade responsibly!)
🚀 BTCUSDT Update! 📈
$BTC Bitcoin is showing strong upward momentum! Here are the key highlights from the current price chart:
Current Price: 85,941 USDT (+2.20% Price Change)
Trading Pair: BTCUSDT (Derivatives, 150x Leverage)
Period High: 86,579.8 USDT (Recorded on September 22, 2026)
Period Low: 58,592 USDT (Recorded on July 01, 2026)
After consolidating near the 58k–60k range earlier this summer, Bitcoin staged a massive breakout and is now pressing toward new local highs around $86.5k.
Are you holding long, taking profits, or watching from the sidelines? Let us know your target price for BTC! 💬👇
(Disclaimer: High-leverage derivatives trading like 150x carries extreme risk. Always manage your risk carefully and trade responsibly!)
$BTC Bitcoin is showing strong upward momentum! Here are the key highlights from the current price chart:
Current Price: 85,941 USDT (+2.20% Price Change)
Trading Pair: BTCUSDT (Derivatives, 150x Leverage)
Period High: 86,579.8 USDT (Recorded on September 22, 2026)
Period Low: 58,592 USDT (Recorded on July 01, 2026)
After consolidating near the 58k–60k range earlier this summer, Bitcoin staged a massive breakout and is now pressing toward new local highs around $86.5k.
Are you holding long, taking profits, or watching from the sidelines? Let us know your target price for BTC! 💬👇
(Disclaimer: High-leverage derivatives trading like 150x carries extreme risk. Always manage your risk carefully and trade responsibly!)
43
·
--
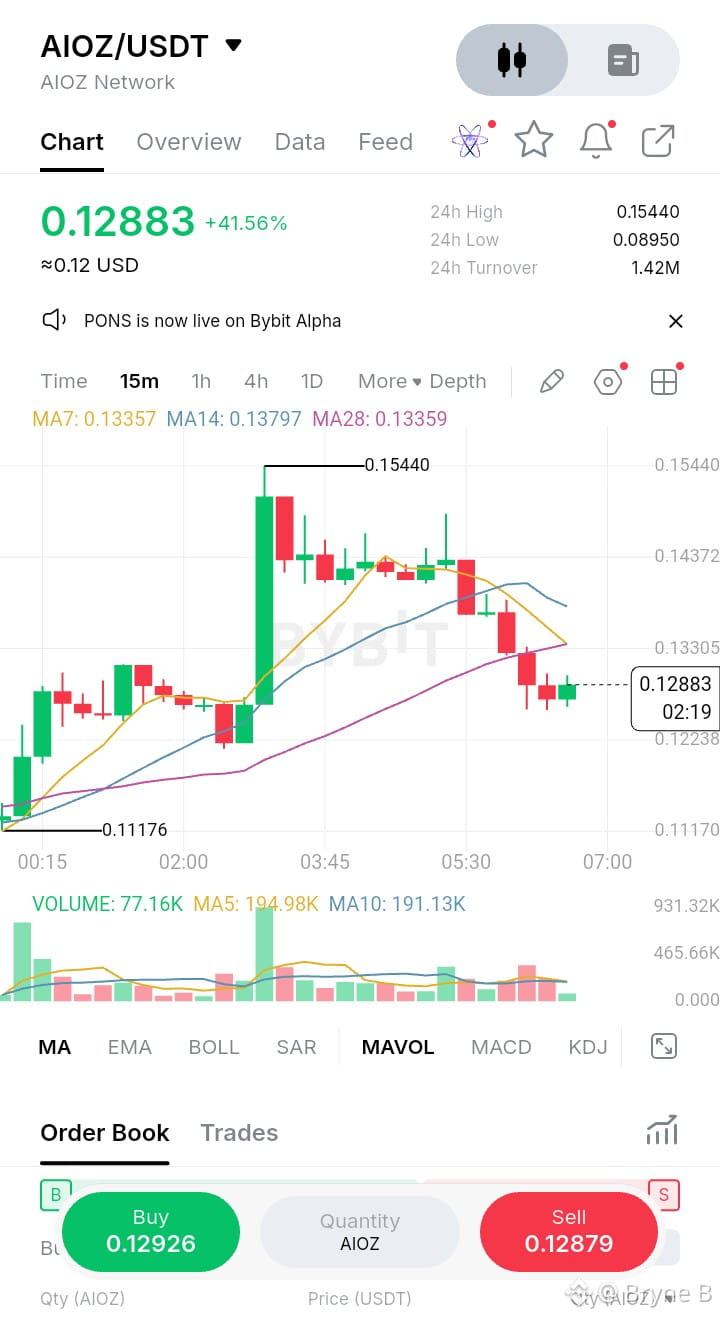
Bullish
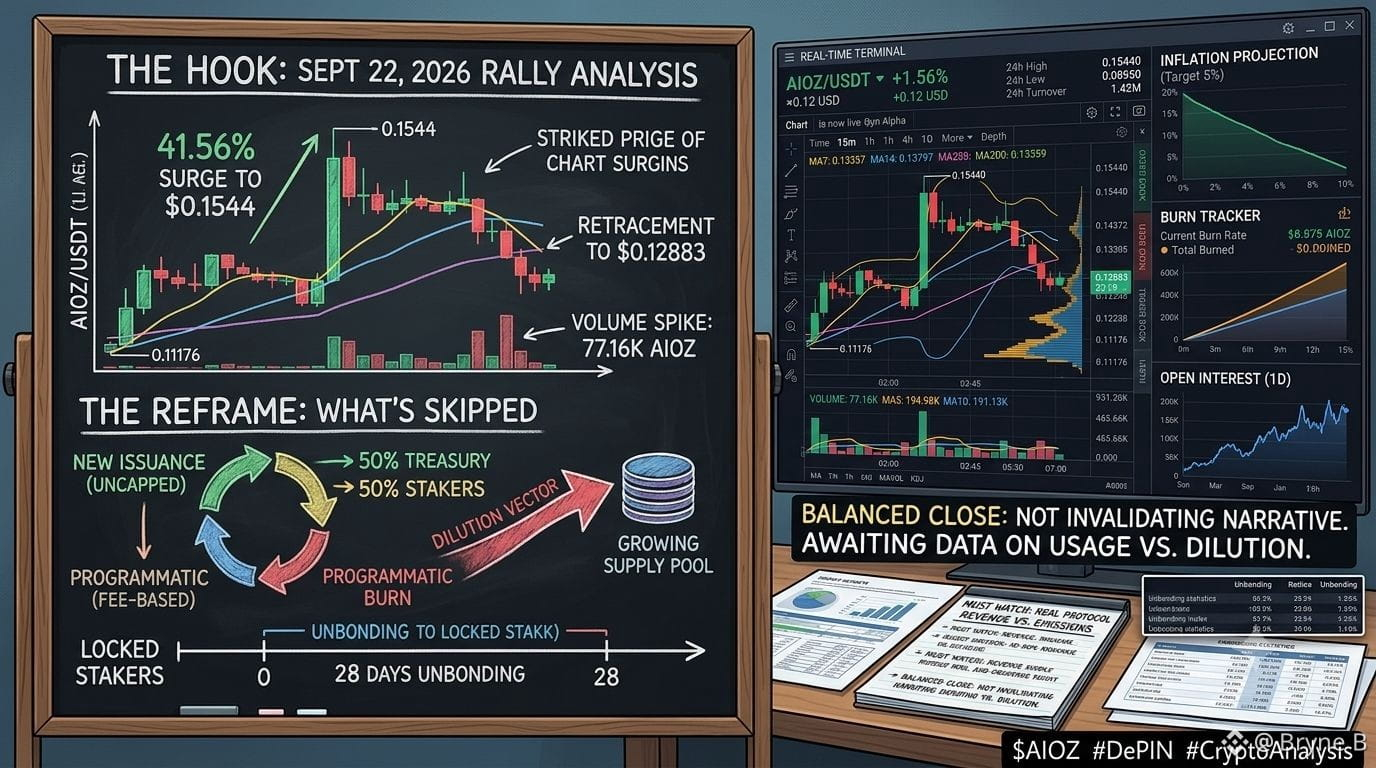
On September 22, 2026, $AIOZ Network surged +41.56% to reach a 24-hour peak of $0.1544 before retracing to $0.1288 on Bybit. The move coincided with a volume spike of 77.16K AIOZ against an average 10-period moving average volume of 191.13K. Market coverage framing the token as a top decentralized AI infrastructure play continues to highlight its target dilution reduction to a 5% inflation rate by late 2026.
Here is the part that gets skipped: supply is not capped. While 50% of base transaction fees are programmatically burned, new issuance is split directly 50/50 between staking validators and the project treasury. Furthermore, locked stakers face a strict 28-day unbonding period. The surface metric treats decreasing inflation as equivalent to net deflation, masking the reality that usage-based fee burns must consistently outpace programmatic emissions to offset continuous dilution.
That gap matters because it highlights a recurring DePIN incentive design: relying on treasury-funded inflation to subsidize node operators while liquid spot trading absorbs the sell pressure. When spot price volatility accelerates—such as today's 41.56% move on Bybit—unstaked holders carry immediate downside exposure while stakers remain locked behind the 28-day queue.
None of this means the underlying utility narrative is invalid. It means token performance remains tethered to whether real network usage fees can scale fast enough to absorb daily supply growth. Will verifiable protocol revenue eventually cross the threshold of daily inflation, or will treasury rewards continue to drive token supply faster than on-chain demand burns it?
$AIOZ #DePIN #CryptoAnalysis
On September 22, 2026, $AIOZ Network surged +41.56% to reach a 24-hour peak of $0.1544 before retracing to $0.1288 on Bybit. The move coincided with a volume spike of 77.16K AIOZ against an average 10-period moving average volume of 191.13K. Market coverage framing the token as a top decentralized AI infrastructure play continues to highlight its target dilution reduction to a 5% inflation rate by late 2026.
Here is the part that gets skipped: supply is not capped. While 50% of base transaction fees are programmatically burned, new issuance is split directly 50/50 between staking validators and the project treasury. Furthermore, locked stakers face a strict 28-day unbonding period. The surface metric treats decreasing inflation as equivalent to net deflation, masking the reality that usage-based fee burns must consistently outpace programmatic emissions to offset continuous dilution.
That gap matters because it highlights a recurring DePIN incentive design: relying on treasury-funded inflation to subsidize node operators while liquid spot trading absorbs the sell pressure. When spot price volatility accelerates—such as today's 41.56% move on Bybit—unstaked holders carry immediate downside exposure while stakers remain locked behind the 28-day queue.
None of this means the underlying utility narrative is invalid. It means token performance remains tethered to whether real network usage fees can scale fast enough to absorb daily supply growth. Will verifiable protocol revenue eventually cross the threshold of daily inflation, or will treasury rewards continue to drive token supply faster than on-chain demand burns it?
$AIOZ #DePIN #CryptoAnalysis
Here is the part that gets skipped: supply is not capped. While 50% of base transaction fees are programmatically burned, new issuance is split directly 50/50 between staking validators and the project treasury. Furthermore, locked stakers face a strict 28-day unbonding period. The surface metric treats decreasing inflation as equivalent to net deflation, masking the reality that usage-based fee burns must consistently outpace programmatic emissions to offset continuous dilution.
That gap matters because it highlights a recurring DePIN incentive design: relying on treasury-funded inflation to subsidize node operators while liquid spot trading absorbs the sell pressure. When spot price volatility accelerates—such as today's 41.56% move on Bybit—unstaked holders carry immediate downside exposure while stakers remain locked behind the 28-day queue.
None of this means the underlying utility narrative is invalid. It means token performance remains tethered to whether real network usage fees can scale fast enough to absorb daily supply growth. Will verifiable protocol revenue eventually cross the threshold of daily inflation, or will treasury rewards continue to drive token supply faster than on-chain demand burns it?
$AIOZ #DePIN #CryptoAnalysis
58
·
--
Article
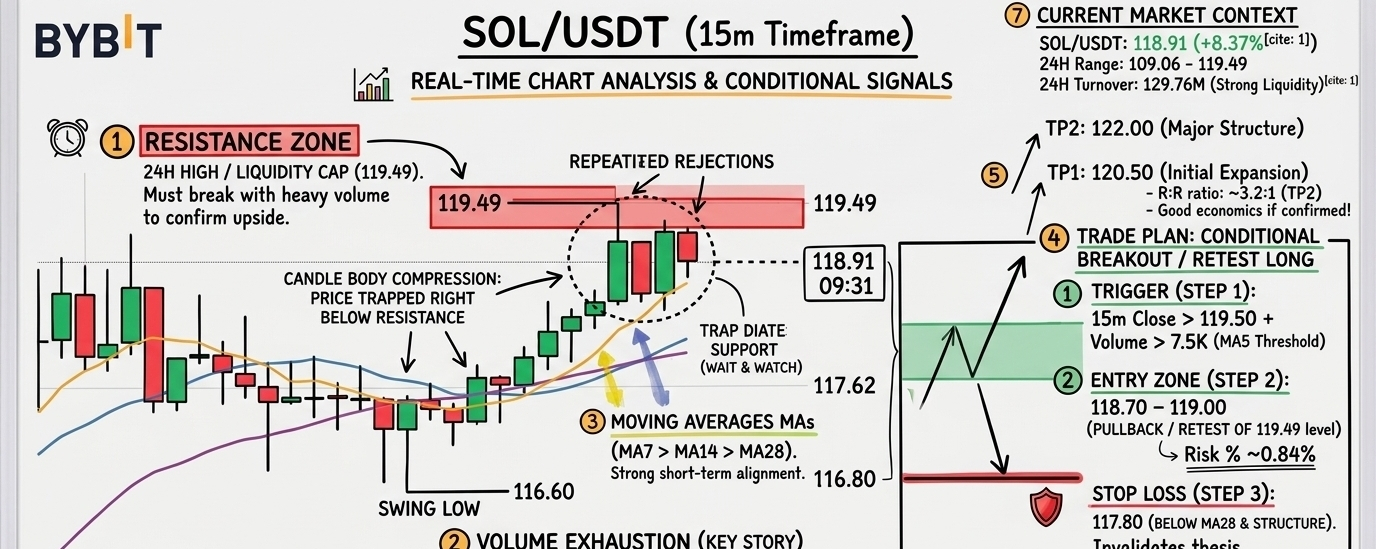
SolI was skimming through the SOL chart expecting a standard consolidation, but the sharp contraction in volume right under the local high caught my attention.
SOL/USDT is currently trading at 118.91, up +8.37% over the last 24 hours. The pair has traded between a 24H low of 109.06 and a high of 119.49, pulling 129.76M USDT in turnover.
Looking at the 15-minute timeframe, price pushed up aggressively from the 116.60 swing low to hit 119.49. Since hitting that peak, candle bodies are compressing tightly right above the moving averages rather than pulling back sharply.
Moving average alignment shows a short-term bullish stack:
MA7: 118.68
MA14: 118.10
MA28: 117.96
Price is holding cleanly above the MA7 (118.68), with MA14 and MA28 fanning out underneath to act as dynamic trailing support.
However, the volume profile demands caution. Current volume sits at 4.23K, which is noticeably below the MA5 volume of 7.48K and MA10 volume of 6.58K. Volume has dropped roughly 43% below its 5-period average during this consolidation. While price compression near highs can precede an expansion, breaking 119.49 without volume participation risks a swift fakeout rejection.
What I Like:
Clean bullish alignment with price staying well above MA7, MA14, and MA28.
Higher low established at 116.60 with rapid recovery.
Deep liquidity and strong 24H turnover (129.76M USDT) ensuring smooth execution.
What I Don't Like:
Volume is actively fading as price sits right under resistance.
Immediate upside is capped by the 119.49 high, offering a tight local range.
Risk of a leverage flush down to test MA28 if buyers get impatient.
Key Levels:
Resistance: 119.49 (24H High / Local Liquidity Cap)
Support: 118.10 – 118.68 (MA7 / MA14 Cluster)
Invalidation: 116.60 (Recent Swing Low)
Trade Plan: CONDITIONAL BREAKOUT / RETEST LONG
Chasing market buys inside this low-volume consolidation offers poor risk/reward. I prefer waiting for explicit confirmation.
Trigger: 15m candle close above 119.50 accompanied by volume crossing above 7.5K (MA5 threshold).
Entry Zone: 118.70 – 119.00 (on pullback/retest of broken resistance)
Target 1 (TP1): 120.50 (Initial expansion zone)
Target 2 (TP2): 122.00 (Major overhead structural level)
Stop Loss (SL): 117.80 (Just below MA28 and local structure)
Risk & Calculations:
Risk: ~0.84% (from ~118.80 entry down to 117.80 SL)
Reward (TP1): ~1.43% | Reward (TP2): ~2.69%
R:R Ratio: ~1.7:1 (TP1) / ~3.2:1 (TP2)
Final View:
Structure remains constructive, but buying straight into resistance on declining volume is a quick way to get chopped up. If volume returns and pushes price past 119.49, the move towards 122.00 opens up quickly. Until then, keeping orders on hold is the disciplined call.
Will buyers step in with real volume to push past 119.49, or are we due for a sweep down to test the MA28 dynamic support?
#Bybit #CryptoTrading #SOL
Sol
I was skimming through the SOL chart expecting a standard consolidation, but the sharp contraction in volume right under the local high caught my attention.
SOL/USDT is currently trading at 118.91, up +8.37% over the last 24 hours. The pair has traded between a 24H low of 109.06 and a high of 119.49, pulling 129.76M USDT in turnover.
Looking at the 15-minute timeframe, price pushed up aggressively from the 116.60 swing low to hit 119.49. Since hitting that peak, candle bodies are compressing tightly right above the moving averages rather than pulling back sharply.
Moving average alignment shows a short-term bullish stack:
MA7: 118.68
MA14: 118.10
MA28: 117.96
Price is holding cleanly above the MA7 (118.68), with MA14 and MA28 fanning out underneath to act as dynamic trailing support.
However, the volume profile demands caution. Current volume sits at 4.23K, which is noticeably below the MA5 volume of 7.48K and MA10 volume of 6.58K. Volume has dropped roughly 43% below its 5-period average during this consolidation. While price compression near highs can precede an expansion, breaking 119.49 without volume participation risks a swift fakeout rejection.
What I Like:
Clean bullish alignment with price staying well above MA7, MA14, and MA28.
Higher low established at 116.60 with rapid recovery.
Deep liquidity and strong 24H turnover (129.76M USDT) ensuring smooth execution.
What I Don't Like:
Volume is actively fading as price sits right under resistance.
Immediate upside is capped by the 119.49 high, offering a tight local range.
Risk of a leverage flush down to test MA28 if buyers get impatient.
Key Levels:
Resistance: 119.49 (24H High / Local Liquidity Cap)
Support: 118.10 – 118.68 (MA7 / MA14 Cluster)
Invalidation: 116.60 (Recent Swing Low)
Trade Plan: CONDITIONAL BREAKOUT / RETEST LONG
Chasing market buys inside this low-volume consolidation offers poor risk/reward. I prefer waiting for explicit confirmation.
Trigger: 15m candle close above 119.50 accompanied by volume crossing above 7.5K (MA5 threshold).
Entry Zone: 118.70 – 119.00 (on pullback/retest of broken resistance)
Target 1 (TP1): 120.50 (Initial expansion zone)
Target 2 (TP2): 122.00 (Major overhead structural level)
Stop Loss (SL): 117.80 (Just below MA28 and local structure)
Risk & Calculations:
Risk: ~0.84% (from ~118.80 entry down to 117.80 SL)
Reward (TP1): ~1.43% | Reward (TP2): ~2.69%
R:R Ratio: ~1.7:1 (TP1) / ~3.2:1 (TP2)
Final View:
Structure remains constructive, but buying straight into resistance on declining volume is a quick way to get chopped up. If volume returns and pushes price past 119.49, the move towards 122.00 opens up quickly. Until then, keeping orders on hold is the disciplined call.
Will buyers step in with real volume to push past 119.49, or are we due for a sweep down to test the MA28 dynamic support?
#Bybit #CryptoTrading #SOL
SOL/USDT is currently trading at 118.91, up +8.37% over the last 24 hours. The pair has traded between a 24H low of 109.06 and a high of 119.49, pulling 129.76M USDT in turnover.
Looking at the 15-minute timeframe, price pushed up aggressively from the 116.60 swing low to hit 119.49. Since hitting that peak, candle bodies are compressing tightly right above the moving averages rather than pulling back sharply.
Moving average alignment shows a short-term bullish stack:
MA7: 118.68
MA14: 118.10
MA28: 117.96
Price is holding cleanly above the MA7 (118.68), with MA14 and MA28 fanning out underneath to act as dynamic trailing support.
However, the volume profile demands caution. Current volume sits at 4.23K, which is noticeably below the MA5 volume of 7.48K and MA10 volume of 6.58K. Volume has dropped roughly 43% below its 5-period average during this consolidation. While price compression near highs can precede an expansion, breaking 119.49 without volume participation risks a swift fakeout rejection.
What I Like:
Clean bullish alignment with price staying well above MA7, MA14, and MA28.
Higher low established at 116.60 with rapid recovery.
Deep liquidity and strong 24H turnover (129.76M USDT) ensuring smooth execution.
What I Don't Like:
Volume is actively fading as price sits right under resistance.
Immediate upside is capped by the 119.49 high, offering a tight local range.
Risk of a leverage flush down to test MA28 if buyers get impatient.
Key Levels:
Resistance: 119.49 (24H High / Local Liquidity Cap)
Support: 118.10 – 118.68 (MA7 / MA14 Cluster)
Invalidation: 116.60 (Recent Swing Low)
Trade Plan: CONDITIONAL BREAKOUT / RETEST LONG
Chasing market buys inside this low-volume consolidation offers poor risk/reward. I prefer waiting for explicit confirmation.
Trigger: 15m candle close above 119.50 accompanied by volume crossing above 7.5K (MA5 threshold).
Entry Zone: 118.70 – 119.00 (on pullback/retest of broken resistance)
Target 1 (TP1): 120.50 (Initial expansion zone)
Target 2 (TP2): 122.00 (Major overhead structural level)
Stop Loss (SL): 117.80 (Just below MA28 and local structure)
Risk & Calculations:
Risk: ~0.84% (from ~118.80 entry down to 117.80 SL)
Reward (TP1): ~1.43% | Reward (TP2): ~2.69%
R:R Ratio: ~1.7:1 (TP1) / ~3.2:1 (TP2)
Final View:
Structure remains constructive, but buying straight into resistance on declining volume is a quick way to get chopped up. If volume returns and pushes price past 119.49, the move towards 122.00 opens up quickly. Until then, keeping orders on hold is the disciplined call.
Will buyers step in with real volume to push past 119.49, or are we due for a sweep down to test the MA28 dynamic support?
#Bybit #CryptoTrading #SOL
42
·
--
Market Update: Bitcoin Reclaims $80K as Market Liquidations Trigger $240M+ Short Squeeze
The cryptocurrency market is experiencing a sharp risk-on rebound, sending Bitcoin (BTC) back above the $80,000 threshold and driving the total digital asset market capitalization up nearly 4.8% to $2.92 trillion.
The sudden upward momentum triggered a cascading wave of short liquidations totaling over $246 million across derivatives exchanges over a 24-hour window.
What’s Driving the Surge?
Market-Wide Short Squeeze: Heavy short positioning combined with steady spot buying pushed major cryptocurrencies through key overhead resistance levels. forced liquidations swept through underhedged derivatives positions, further accelerating the price rally.
Ethereum & Altcoin Rotation: Ethereum (ETH) climbed toward $2,620, bolstered by sustained spot ETF inflows and capital rotating out of dominant BTC trades into key Layer-1 networks.
L1 & L2 Outperformers: privacy coins and select Layer-2 platforms led the rally:
Monero (XMR) surged 13% following a technical breakout amidst growing privacy-sector volume.
Arbitrum (ARB) gained 5.8% on long-term growth forecasts tied to ecosystem expansion.
Stellar (XLM) jumped 8% after its Protocol 28 network upgrade went live.
Macro Outlook & What to Watch Next
Despite the bullish price action, institutional traders remain watchful. Upcoming U.S. macroeconomic inflation readings and ongoing regulatory updates surrounding federal market structure proposals will test whether this breakout holds or turns into another period of consolidation near resistance levels.
Market Update: Bitcoin Reclaims $80K as Market Liquidations Trigger $240M+ Short Squeeze
The cryptocurrency market is experiencing a sharp risk-on rebound, sending Bitcoin (BTC) back above the $80,000 threshold and driving the total digital asset market capitalization up nearly 4.8% to $2.92 trillion.
The sudden upward momentum triggered a cascading wave of short liquidations totaling over $246 million across derivatives exchanges over a 24-hour window.
What’s Driving the Surge?
Market-Wide Short Squeeze: Heavy short positioning combined with steady spot buying pushed major cryptocurrencies through key overhead resistance levels. forced liquidations swept through underhedged derivatives positions, further accelerating the price rally.
Ethereum & Altcoin Rotation: Ethereum (ETH) climbed toward $2,620, bolstered by sustained spot ETF inflows and capital rotating out of dominant BTC trades into key Layer-1 networks.
L1 & L2 Outperformers: privacy coins and select Layer-2 platforms led the rally:
Monero (XMR) surged 13% following a technical breakout amidst growing privacy-sector volume.
Arbitrum (ARB) gained 5.8% on long-term growth forecasts tied to ecosystem expansion.
Stellar (XLM) jumped 8% after its Protocol 28 network upgrade went live.
Macro Outlook & What to Watch Next
Despite the bullish price action, institutional traders remain watchful. Upcoming U.S. macroeconomic inflation readings and ongoing regulatory updates surrounding federal market structure proposals will test whether this breakout holds or turns into another period of consolidation near resistance levels.
The cryptocurrency market is experiencing a sharp risk-on rebound, sending Bitcoin (BTC) back above the $80,000 threshold and driving the total digital asset market capitalization up nearly 4.8% to $2.92 trillion.
The sudden upward momentum triggered a cascading wave of short liquidations totaling over $246 million across derivatives exchanges over a 24-hour window.
What’s Driving the Surge?
Market-Wide Short Squeeze: Heavy short positioning combined with steady spot buying pushed major cryptocurrencies through key overhead resistance levels. forced liquidations swept through underhedged derivatives positions, further accelerating the price rally.
Ethereum & Altcoin Rotation: Ethereum (ETH) climbed toward $2,620, bolstered by sustained spot ETF inflows and capital rotating out of dominant BTC trades into key Layer-1 networks.
L1 & L2 Outperformers: privacy coins and select Layer-2 platforms led the rally:
Monero (XMR) surged 13% following a technical breakout amidst growing privacy-sector volume.
Arbitrum (ARB) gained 5.8% on long-term growth forecasts tied to ecosystem expansion.
Stellar (XLM) jumped 8% after its Protocol 28 network upgrade went live.
Macro Outlook & What to Watch Next
Despite the bullish price action, institutional traders remain watchful. Upcoming U.S. macroeconomic inflation readings and ongoing regulatory updates surrounding federal market structure proposals will test whether this breakout holds or turns into another period of consolidation near resistance levels.
150
·
--
Bullish
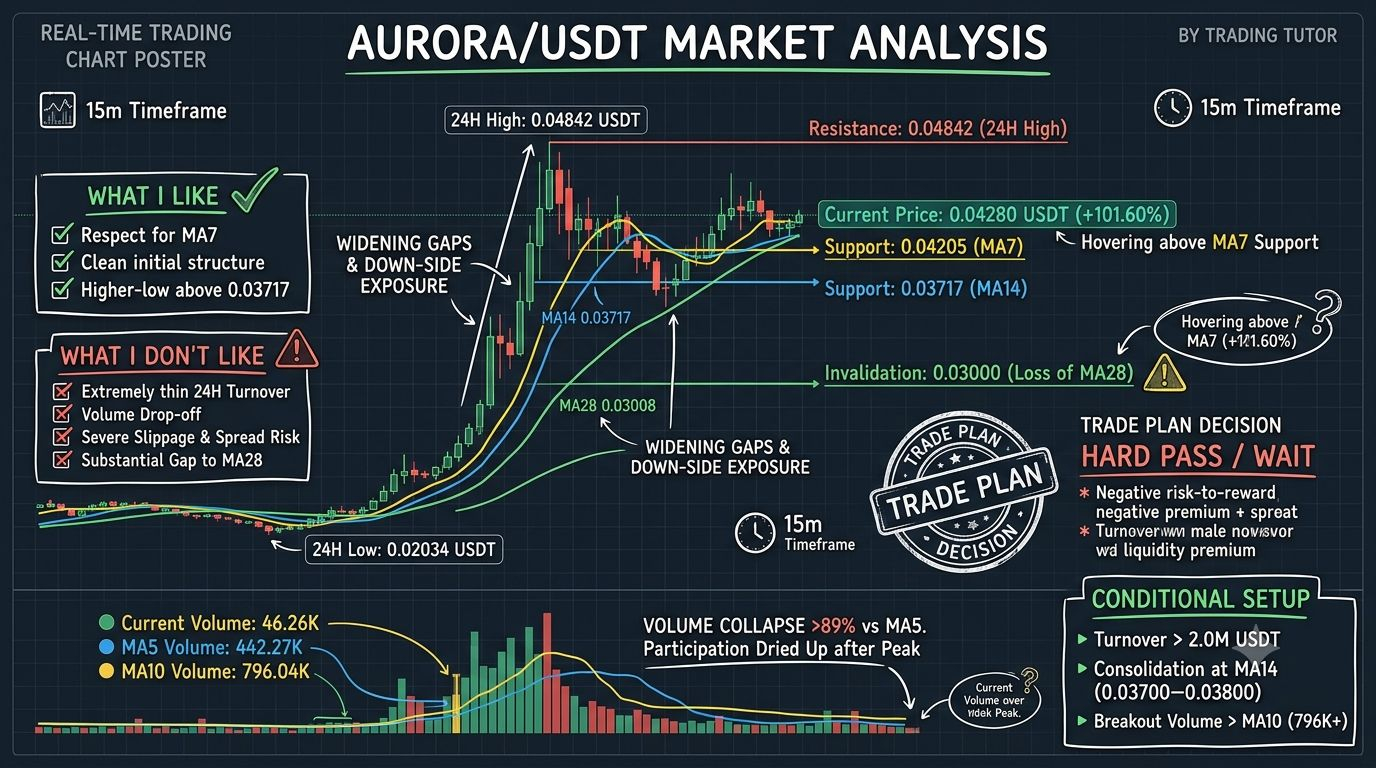
$AURORA (+101% Pump Analysis: Trade Setup or Trap?)
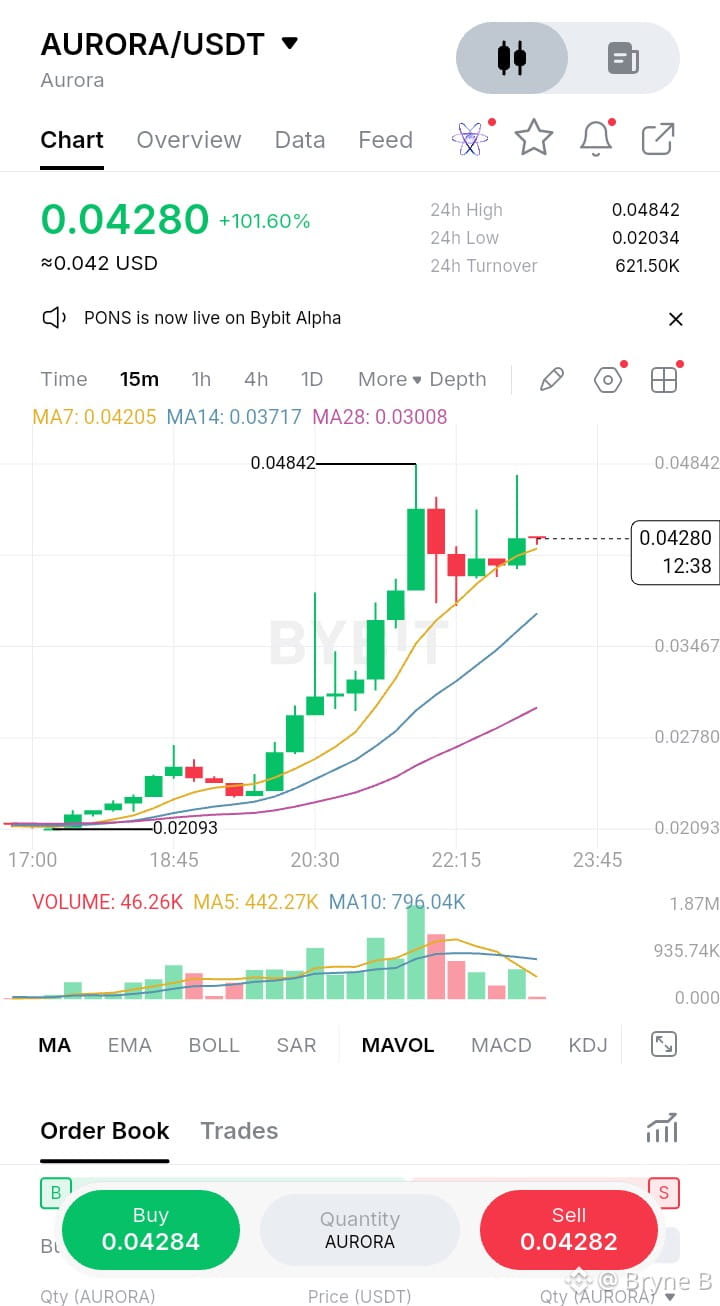
$AURORA doubled off its $0.02093 base to hit a high of $0.04842, but the execution liquidity tells a critical story.
Market Snapshot:
Price: $0.04280
24h Range: $0.02034 – $0.04842
24h Turnover: $621.50K (Extremely thin)
Technical Breakdown:
Trend: Holding above MA7 ($0.04205), but gaps to MA14 ($0.03717) and MA28 ($0.03008) show a heavily overextended chart.
Volume Drying Up: Current 15m volume (46.26K) is down ~89.5% against the MA5 baseline (442.27K).
Key Takeaways:
Pros: Clean trend structure; higher lows holding above $0.03717.
Cons: Thin order books ($621K total turnover) mean massive slippage risk and spread exposure. Trying to buy at $0.04280 for a target of $0.04842 (+13%) against risk to $0.03650 (-14.7%) gives a negative R:R (~0.89:1).
Trade Plan: WAIT / HARD PASS
Watch for Entry Conditions:
Turnover expands past $2.0M USDT (real depth).
Controlled base forms around $0.03700–$0.03800 (MA14).
15m volume breaks back above MA10 (796K+) on a retest.
Key Levels:
Resistance: $0.04842
Support: $0.04205 / $0.03717
Invalidation: $0.03000
Will volume step in to retest $0.04842, or are we heading for a deeper pullback to $0.03700?
#Crypto #Trading #Binance #AURORA
$AURORA (+101% Pump Analysis: Trade Setup or Trap?)
$AURORA doubled off its $0.02093 base to hit a high of $0.04842, but the execution liquidity tells a critical story.
Market Snapshot:
Price: $0.04280
24h Range: $0.02034 – $0.04842
24h Turnover: $621.50K (Extremely thin)
Technical Breakdown:
Trend: Holding above MA7 ($0.04205), but gaps to MA14 ($0.03717) and MA28 ($0.03008) show a heavily overextended chart.
Volume Drying Up: Current 15m volume (46.26K) is down ~89.5% against the MA5 baseline (442.27K).
Key Takeaways:
Pros: Clean trend structure; higher lows holding above $0.03717.
Cons: Thin order books ($621K total turnover) mean massive slippage risk and spread exposure. Trying to buy at $0.04280 for a target of $0.04842 (+13%) against risk to $0.03650 (-14.7%) gives a negative R:R (~0.89:1).
Trade Plan: WAIT / HARD PASS
Watch for Entry Conditions:
Turnover expands past $2.0M USDT (real depth).
Controlled base forms around $0.03700–$0.03800 (MA14).
15m volume breaks back above MA10 (796K+) on a retest.
Key Levels:
Resistance: $0.04842
Support: $0.04205 / $0.03717
Invalidation: $0.03000
Will volume step in to retest $0.04842, or are we heading for a deeper pullback to $0.03700?
#Crypto #Trading #Binance #AURORA
$AURORA doubled off its $0.02093 base to hit a high of $0.04842, but the execution liquidity tells a critical story.
Market Snapshot:
Price: $0.04280
24h Range: $0.02034 – $0.04842
24h Turnover: $621.50K (Extremely thin)
Technical Breakdown:
Trend: Holding above MA7 ($0.04205), but gaps to MA14 ($0.03717) and MA28 ($0.03008) show a heavily overextended chart.
Volume Drying Up: Current 15m volume (46.26K) is down ~89.5% against the MA5 baseline (442.27K).
Key Takeaways:
Pros: Clean trend structure; higher lows holding above $0.03717.
Cons: Thin order books ($621K total turnover) mean massive slippage risk and spread exposure. Trying to buy at $0.04280 for a target of $0.04842 (+13%) against risk to $0.03650 (-14.7%) gives a negative R:R (~0.89:1).
Trade Plan: WAIT / HARD PASS
Watch for Entry Conditions:
Turnover expands past $2.0M USDT (real depth).
Controlled base forms around $0.03700–$0.03800 (MA14).
15m volume breaks back above MA10 (796K+) on a retest.
Key Levels:
Resistance: $0.04842
Support: $0.04205 / $0.03717
Invalidation: $0.03000
Will volume step in to retest $0.04842, or are we heading for a deeper pullback to $0.03700?
#Crypto #Trading #Binance #AURORA
1
·
--
🐕 DOGE/USDT — 15M Setup
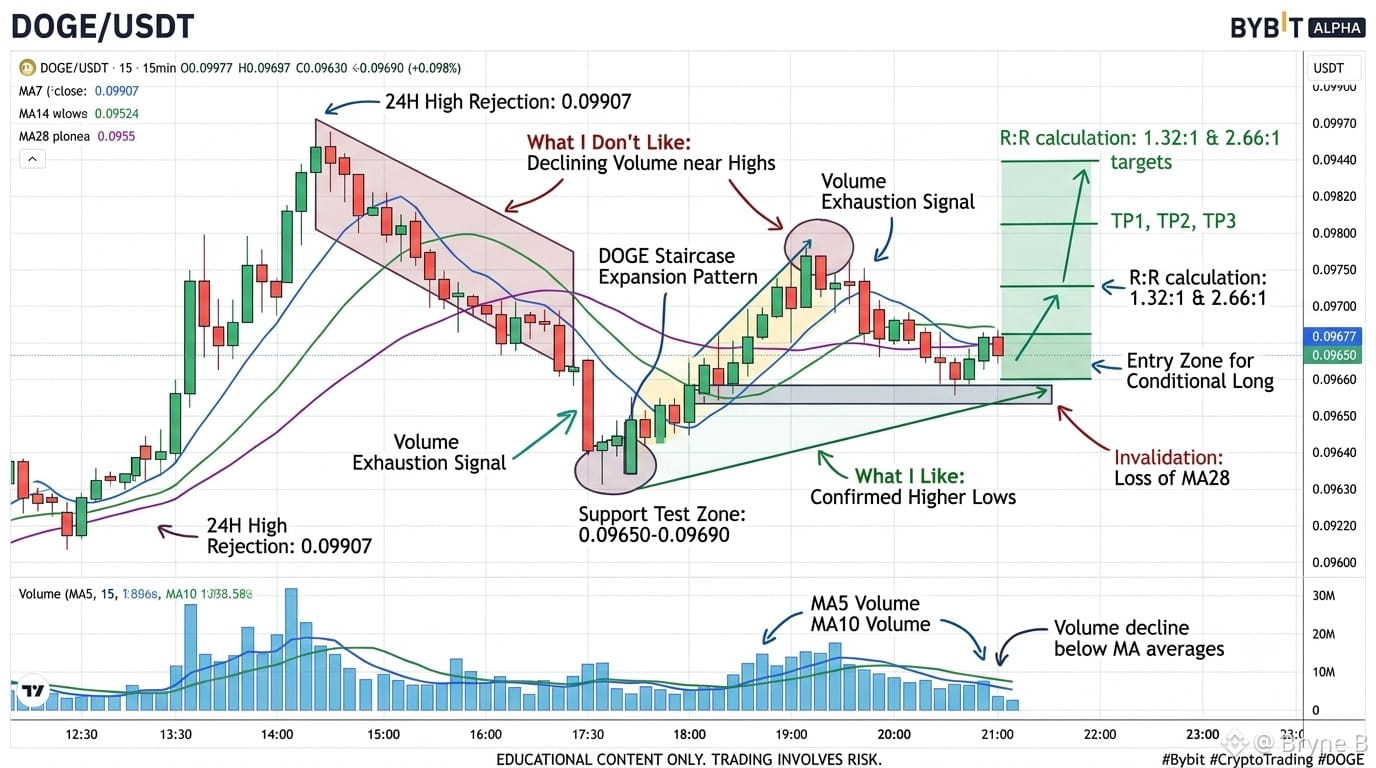
$DOGE DOGE is holding a strong bullish structure, but volume is fading as price approaches 0.09907, raising the risk of a rejection near 0.1000.
📊 Market Structure
• Price: 0.09819 (+13.10%)
• 24H High: 0.09907
• 24H Low: 0.08613
• Turnover: $38.62M
• MA7: 0.09733
• MA14: 0.09692
• MA28: 0.09518
⚠️ Volume Warning
Current volume: 4.76M vs MA5 volume: 7.94M.
Price is pushing higher while participation declines — a potential exhaustion signal.
🎯 Key Levels
Resistance: 0.09907 → 0.10000
Support: 0.09733 → 0.09650–0.09690
Invalidation: 0.09490
📈 Trade Setup
Rather than chasing at 0.09819, watch for a pullback toward 0.09650–0.09690.
TP1: 0.09880
TP2: 0.09907
TP3: 0.10150
SL: 0.09490
Bullish confirmation: Break and hold above 0.09907 with strong volume.
Bearish warning: Rejection + continued volume decline could send DOGE back toward 0.09650.
Bottom line: DOGE remains structurally bullish, but the current risk/reward favors patience over chasing.
#DOGE #DOGEUSDT #Binance #CryptoTrading #TechnicalAnalysis
🐕 DOGE/USDT — 15M Setup
$DOGE DOGE is holding a strong bullish structure, but volume is fading as price approaches 0.09907, raising the risk of a rejection near 0.1000.
📊 Market Structure
• Price: 0.09819 (+13.10%)
• 24H High: 0.09907
• 24H Low: 0.08613
• Turnover: $38.62M
• MA7: 0.09733
• MA14: 0.09692
• MA28: 0.09518
⚠️ Volume Warning
Current volume: 4.76M vs MA5 volume: 7.94M.
Price is pushing higher while participation declines — a potential exhaustion signal.
🎯 Key Levels
Resistance: 0.09907 → 0.10000
Support: 0.09733 → 0.09650–0.09690
Invalidation: 0.09490
📈 Trade Setup
Rather than chasing at 0.09819, watch for a pullback toward 0.09650–0.09690.
TP1: 0.09880
TP2: 0.09907
TP3: 0.10150
SL: 0.09490
Bullish confirmation: Break and hold above 0.09907 with strong volume.
Bearish warning: Rejection + continued volume decline could send DOGE back toward 0.09650.
Bottom line: DOGE remains structurally bullish, but the current risk/reward favors patience over chasing.
#DOGE #DOGEUSDT #Binance #CryptoTrading #TechnicalAnalysis
$DOGE DOGE is holding a strong bullish structure, but volume is fading as price approaches 0.09907, raising the risk of a rejection near 0.1000.
📊 Market Structure
• Price: 0.09819 (+13.10%)
• 24H High: 0.09907
• 24H Low: 0.08613
• Turnover: $38.62M
• MA7: 0.09733
• MA14: 0.09692
• MA28: 0.09518
⚠️ Volume Warning
Current volume: 4.76M vs MA5 volume: 7.94M.
Price is pushing higher while participation declines — a potential exhaustion signal.
🎯 Key Levels
Resistance: 0.09907 → 0.10000
Support: 0.09733 → 0.09650–0.09690
Invalidation: 0.09490
📈 Trade Setup
Rather than chasing at 0.09819, watch for a pullback toward 0.09650–0.09690.
TP1: 0.09880
TP2: 0.09907
TP3: 0.10150
SL: 0.09490
Bullish confirmation: Break and hold above 0.09907 with strong volume.
Bearish warning: Rejection + continued volume decline could send DOGE back toward 0.09650.
Bottom line: DOGE remains structurally bullish, but the current risk/reward favors patience over chasing.
#DOGE #DOGEUSDT #Binance #CryptoTrading #TechnicalAnalysis
35
·
--
Trading the market is no longer about chasing green candles—it is about understanding structural shifts.
1. Macro Liquidity & The "Real-Yield" Pivot
Bitcoin testing the key $82,000–$88,000 breakout levels isn't happening in a vacuum. We are seeing a complete repricing around central bank interest rate cycles and institutional ETF dynamics.
The Reality: Retail hype cycles have been replaced by institutional order flow.
The Lesson: Stop looking for 100x micro-caps on daily charts. Watch institutional spot inflows, funding rates, and open interest (OI) clusters. Capital is concentrating in liquid, high-conviction assets before trickling into sector-specific altcoins.
2. Autonomous AI Agents On-Chain
The narrative has shifted from "AI tokens" to AI Agent Execution Rails.
The Reality: Autonomous agents are now executing micro-transactions, managing yield strategies, and paying for compute on-chain via programmable crypto payment layers.
The Lesson: Look for protocols building real infrastructure for machine-to-machine economies—decentralized compute, zero-knowledge execution, and high-throughput micro-settlement chains.
3. RWA & Yield Composability (TradFi 2.0)
Tokenized Real-World Assets (RWAs)—from US Treasuries to private credit—are no longer an experiment; they are a major liquidity layer holding tens of billions in value.
The Reality: Institutions are deploying capital on-chain to unlock 24/7 liquidity and atomic composability.
The Lesson: DeFi protocols integrating institutional collateral (like tokenized short-term bonds or credit) into perp DEXs and lending markets are capturing sustainable fee revenue, not relying on inflationary tokenomics.
Trade the Structure, Not the Story: Wait for confirmed breakouts above major weekly supply/demand zones.
Respect Systemic Leverage: High open interest paired with stagnant spot price is a red flag for a leverage flush. Protect your capital with strict stop losses.
Follow the Yield: Long-term sustainable growth is moving toward protocols returning real protocol fees to holders.
Trading the market is no longer about chasing green candles—it is about understanding structural shifts.
1. Macro Liquidity & The "Real-Yield" Pivot
Bitcoin testing the key $82,000–$88,000 breakout levels isn't happening in a vacuum. We are seeing a complete repricing around central bank interest rate cycles and institutional ETF dynamics.
The Reality: Retail hype cycles have been replaced by institutional order flow.
The Lesson: Stop looking for 100x micro-caps on daily charts. Watch institutional spot inflows, funding rates, and open interest (OI) clusters. Capital is concentrating in liquid, high-conviction assets before trickling into sector-specific altcoins.
2. Autonomous AI Agents On-Chain
The narrative has shifted from "AI tokens" to AI Agent Execution Rails.
The Reality: Autonomous agents are now executing micro-transactions, managing yield strategies, and paying for compute on-chain via programmable crypto payment layers.
The Lesson: Look for protocols building real infrastructure for machine-to-machine economies—decentralized compute, zero-knowledge execution, and high-throughput micro-settlement chains.
3. RWA & Yield Composability (TradFi 2.0)
Tokenized Real-World Assets (RWAs)—from US Treasuries to private credit—are no longer an experiment; they are a major liquidity layer holding tens of billions in value.
The Reality: Institutions are deploying capital on-chain to unlock 24/7 liquidity and atomic composability.
The Lesson: DeFi protocols integrating institutional collateral (like tokenized short-term bonds or credit) into perp DEXs and lending markets are capturing sustainable fee revenue, not relying on inflationary tokenomics.
Trade the Structure, Not the Story: Wait for confirmed breakouts above major weekly supply/demand zones.
Respect Systemic Leverage: High open interest paired with stagnant spot price is a red flag for a leverage flush. Protect your capital with strict stop losses.
Follow the Yield: Long-term sustainable growth is moving toward protocols returning real protocol fees to holders.
1. Macro Liquidity & The "Real-Yield" Pivot
Bitcoin testing the key $82,000–$88,000 breakout levels isn't happening in a vacuum. We are seeing a complete repricing around central bank interest rate cycles and institutional ETF dynamics.
The Reality: Retail hype cycles have been replaced by institutional order flow.
The Lesson: Stop looking for 100x micro-caps on daily charts. Watch institutional spot inflows, funding rates, and open interest (OI) clusters. Capital is concentrating in liquid, high-conviction assets before trickling into sector-specific altcoins.
2. Autonomous AI Agents On-Chain
The narrative has shifted from "AI tokens" to AI Agent Execution Rails.
The Reality: Autonomous agents are now executing micro-transactions, managing yield strategies, and paying for compute on-chain via programmable crypto payment layers.
The Lesson: Look for protocols building real infrastructure for machine-to-machine economies—decentralized compute, zero-knowledge execution, and high-throughput micro-settlement chains.
3. RWA & Yield Composability (TradFi 2.0)
Tokenized Real-World Assets (RWAs)—from US Treasuries to private credit—are no longer an experiment; they are a major liquidity layer holding tens of billions in value.
The Reality: Institutions are deploying capital on-chain to unlock 24/7 liquidity and atomic composability.
The Lesson: DeFi protocols integrating institutional collateral (like tokenized short-term bonds or credit) into perp DEXs and lending markets are capturing sustainable fee revenue, not relying on inflationary tokenomics.
Trade the Structure, Not the Story: Wait for confirmed breakouts above major weekly supply/demand zones.
Respect Systemic Leverage: High open interest paired with stagnant spot price is a red flag for a leverage flush. Protect your capital with strict stop losses.
Follow the Yield: Long-term sustainable growth is moving toward protocols returning real protocol fees to holders.
25
·
--
Trading the market is no longer about chasing green candles—it is about understanding structural shifts.
1. Macro Liquidity & The "Real-Yield" Pivot
Bitcoin testing the key $82,000–$88,000 breakout levels isn't happening in a vacuum. We are seeing a complete repricing around central bank interest rate cycles and institutional ETF dynamics.
The Reality: Retail hype cycles have been replaced by institutional order flow.
The Lesson: Stop looking for 100x micro-caps on daily charts. Watch institutional spot inflows, funding rates, and open interest (OI) clusters. Capital is concentrating in liquid, high-conviction assets before trickling into sector-specific altcoins.
2. Autonomous AI Agents On-Chain
The narrative has shifted from "AI tokens" to AI Agent Execution Rails.
The Reality: Autonomous agents are now executing micro-transactions, managing yield strategies, and paying for compute on-chain via programmable crypto payment layers.
The Lesson: Look for protocols building real infrastructure for machine-to-machine economies—decentralized compute, zero-knowledge execution, and high-throughput micro-settlement chains.
3. RWA & Yield Composability (TradFi 2.0)
Tokenized Real-World Assets (RWAs)—from US Treasuries to private credit—are no longer an experiment; they are a major liquidity layer holding tens of billions in value.
The Reality: Institutions are deploying capital on-chain to unlock 24/7 liquidity and atomic composability.
The Lesson: DeFi protocols integrating institutional collateral (like tokenized short-term bonds or credit) into perp DEXs and lending markets are capturing sustainable fee revenue, not relying on inflationary tokenomics.
Trade the Structure, Not the Story: Wait for confirmed breakouts above major weekly supply/demand zones.
Respect Systemic Leverage: High open interest paired with stagnant spot price is a red flag for a leverage flush. Protect your capital with strict stop losses.
Follow the Yield: Long-term sustainable growth is moving toward protocols returning real protocol fees to holders.
Trading the market is no longer about chasing green candles—it is about understanding structural shifts.
1. Macro Liquidity & The "Real-Yield" Pivot
Bitcoin testing the key $82,000–$88,000 breakout levels isn't happening in a vacuum. We are seeing a complete repricing around central bank interest rate cycles and institutional ETF dynamics.
The Reality: Retail hype cycles have been replaced by institutional order flow.
The Lesson: Stop looking for 100x micro-caps on daily charts. Watch institutional spot inflows, funding rates, and open interest (OI) clusters. Capital is concentrating in liquid, high-conviction assets before trickling into sector-specific altcoins.
2. Autonomous AI Agents On-Chain
The narrative has shifted from "AI tokens" to AI Agent Execution Rails.
The Reality: Autonomous agents are now executing micro-transactions, managing yield strategies, and paying for compute on-chain via programmable crypto payment layers.
The Lesson: Look for protocols building real infrastructure for machine-to-machine economies—decentralized compute, zero-knowledge execution, and high-throughput micro-settlement chains.
3. RWA & Yield Composability (TradFi 2.0)
Tokenized Real-World Assets (RWAs)—from US Treasuries to private credit—are no longer an experiment; they are a major liquidity layer holding tens of billions in value.
The Reality: Institutions are deploying capital on-chain to unlock 24/7 liquidity and atomic composability.
The Lesson: DeFi protocols integrating institutional collateral (like tokenized short-term bonds or credit) into perp DEXs and lending markets are capturing sustainable fee revenue, not relying on inflationary tokenomics.
Trade the Structure, Not the Story: Wait for confirmed breakouts above major weekly supply/demand zones.
Respect Systemic Leverage: High open interest paired with stagnant spot price is a red flag for a leverage flush. Protect your capital with strict stop losses.
Follow the Yield: Long-term sustainable growth is moving toward protocols returning real protocol fees to holders.
1. Macro Liquidity & The "Real-Yield" Pivot
Bitcoin testing the key $82,000–$88,000 breakout levels isn't happening in a vacuum. We are seeing a complete repricing around central bank interest rate cycles and institutional ETF dynamics.
The Reality: Retail hype cycles have been replaced by institutional order flow.
The Lesson: Stop looking for 100x micro-caps on daily charts. Watch institutional spot inflows, funding rates, and open interest (OI) clusters. Capital is concentrating in liquid, high-conviction assets before trickling into sector-specific altcoins.
2. Autonomous AI Agents On-Chain
The narrative has shifted from "AI tokens" to AI Agent Execution Rails.
The Reality: Autonomous agents are now executing micro-transactions, managing yield strategies, and paying for compute on-chain via programmable crypto payment layers.
The Lesson: Look for protocols building real infrastructure for machine-to-machine economies—decentralized compute, zero-knowledge execution, and high-throughput micro-settlement chains.
3. RWA & Yield Composability (TradFi 2.0)
Tokenized Real-World Assets (RWAs)—from US Treasuries to private credit—are no longer an experiment; they are a major liquidity layer holding tens of billions in value.
The Reality: Institutions are deploying capital on-chain to unlock 24/7 liquidity and atomic composability.
The Lesson: DeFi protocols integrating institutional collateral (like tokenized short-term bonds or credit) into perp DEXs and lending markets are capturing sustainable fee revenue, not relying on inflationary tokenomics.
Trade the Structure, Not the Story: Wait for confirmed breakouts above major weekly supply/demand zones.
Respect Systemic Leverage: High open interest paired with stagnant spot price is a red flag for a leverage flush. Protect your capital with strict stop losses.
Follow the Yield: Long-term sustainable growth is moving toward protocols returning real protocol fees to holders.
44
·
--
Mastering the crypto markets isn't about luck; it's about combining technical analysis with disciplined risk management. To stay ahead, always set clear stop-loss levels to protect your capital. Utilize key indicators like the Relative Strength Index (RSI) and moving averages to gauge market momentum. Never risk more than a small percentage of your total portfolio on a single trade. Consistent practice and strict adherence to your trading plan are the foundations of long-term success.
Mastering the crypto markets isn't about luck; it's about combining technical analysis with disciplined risk management. To stay ahead, always set clear stop-loss levels to protect your capital. Utilize key indicators like the Relative Strength Index (RSI) and moving averages to gauge market momentum. Never risk more than a small percentage of your total portfolio on a single trade. Consistent practice and strict adherence to your trading plan are the foundations of long-term success.
52
·
--
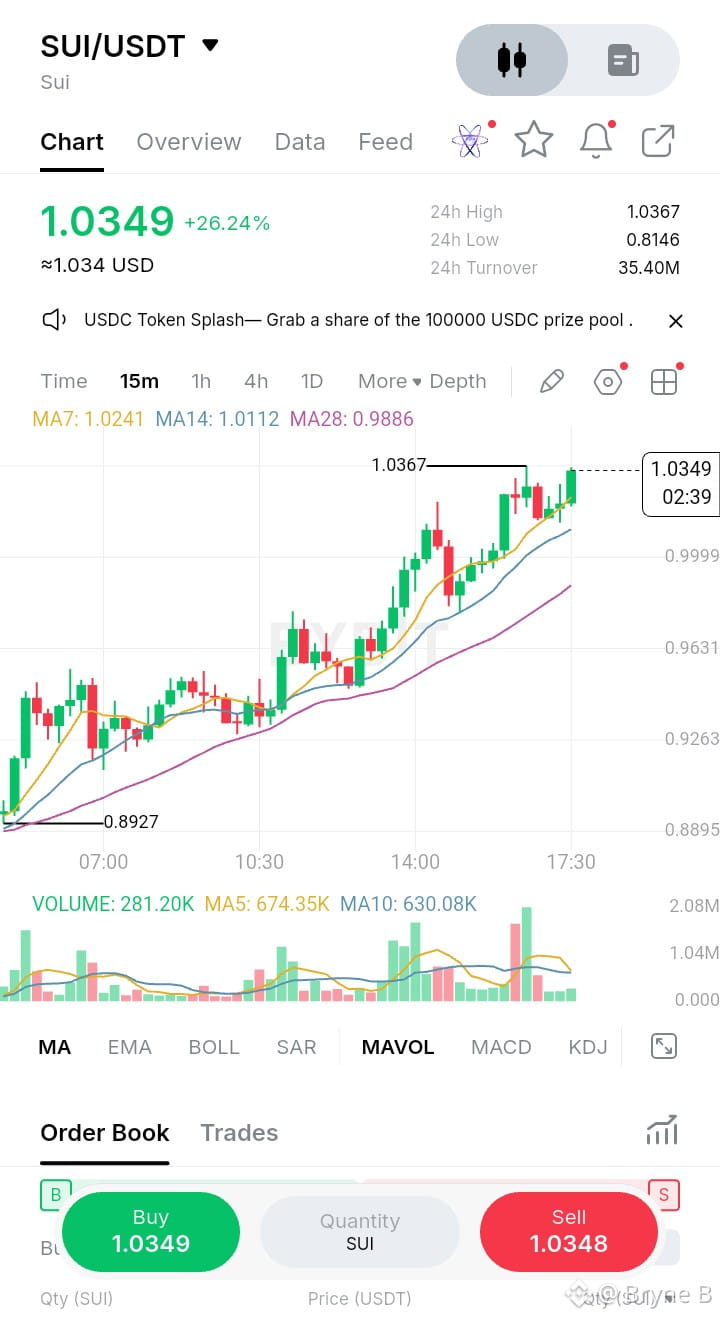
Watching the 15-minute chart print back-to-back green candles into local high liquidity is usually where retail gets trapped, but looking past the headline +26.24% daily spike reveals a far tighter micro-structure unfolding right now.
Price action on SUI/USDT is currently pushing $1.0349, hovering right at the edge of its 24-hour peak at $1.0367 after expanding off the $0.8146 daily low. Turnover is sitting healthily around 35.40M USDT, showing decent institutional participation, but the immediate tape suggests momentum is hitting a localized wall.
The lower-timeframe moving average cluster highlights why this expansion is slowing down:
What I Like:
What I Don't Like:
Volume collapse at key resistance ($1.0367); current candle volume is drastically lagging the 5-period average.
Extended distance from the 28-period moving average makes market orders vulnerable to a pullback.
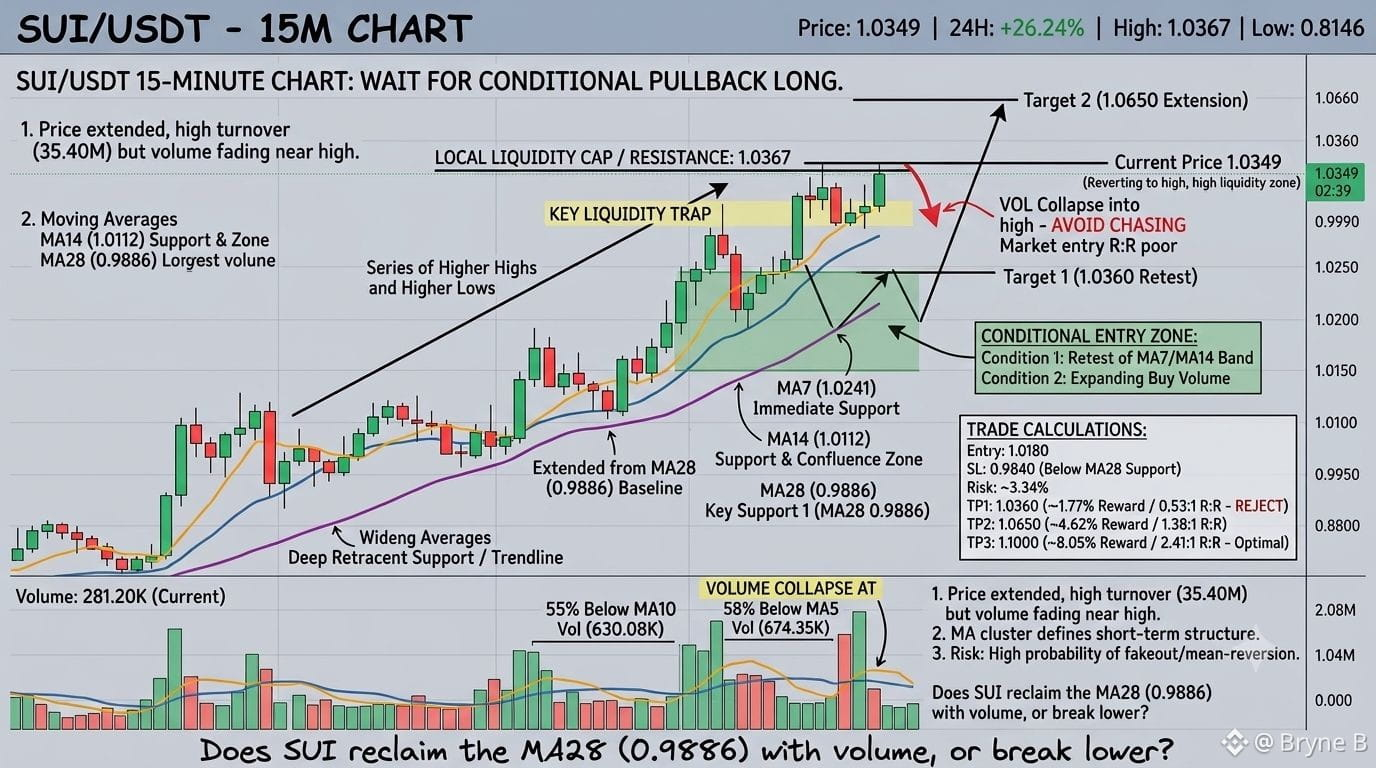
Trade Decision: WAIT / CONDITIONAL PULLBACK LONG.
Key Levels:
Resistance: $1.0367 (24H High & local liquidity cap)
Support 1: $1.0112 (MA14 confluence)
Support 2: $0.9886 (MA28 trendline support)
Invalidation: $0.8927 (Swing low structure)
Conditional Setup (Pullback Plan):
Trigger Condition: Wait for a retest of the MA7/MA14 band around $1.0150–$1.0200 with expanding buy volume.
Entry Zone: $1.0180
Target 1 (TP1): $1.0360 (24h High retest)
Target 2 (TP2): $1.0650 (Extension level)
Target 3 (TP3): $1.1000 (Psychological expansion)
Stop Loss (SL): $0.9840 (Below MA28 and minor pivot)
Risk & Math Check:
Risk: ~3.34% ($1.0180 to $0.9840)
Reward to TP1: ~1.77% (R:R ~ 0.53:1 — Reject market entry)
Reward to TP2: ~4.62% (R:R ~ 1.38:1)
Reward to TP3: ~8.05% (R:R ~ 2.41:1 — Full trade setup economics)
Entering at market price yields a negative risk-to-reward ratio against TP1. Patience is key—never pay the market a premium just to catch a move that is already extended.
#Bybit #CryptoTrading #SUI #TechnicalAnalysis
Watching the 15-minute chart print back-to-back green candles into local high liquidity is usually where retail gets trapped, but looking past the headline +26.24% daily spike reveals a far tighter micro-structure unfolding right now.
Price action on SUI/USDT is currently pushing $1.0349, hovering right at the edge of its 24-hour peak at $1.0367 after expanding off the $0.8146 daily low. Turnover is sitting healthily around 35.40M USDT, showing decent institutional participation, but the immediate tape suggests momentum is hitting a localized wall.
The lower-timeframe moving average cluster highlights why this expansion is slowing down:
What I Like:
What I Don't Like:
Volume collapse at key resistance ($1.0367); current candle volume is drastically lagging the 5-period average.
Extended distance from the 28-period moving average makes market orders vulnerable to a pullback.
Trade Decision: WAIT / CONDITIONAL PULLBACK LONG.
Key Levels:
Resistance: $1.0367 (24H High & local liquidity cap)
Support 1: $1.0112 (MA14 confluence)
Support 2: $0.9886 (MA28 trendline support)
Invalidation: $0.8927 (Swing low structure)
Conditional Setup (Pullback Plan):
Trigger Condition: Wait for a retest of the MA7/MA14 band around $1.0150–$1.0200 with expanding buy volume.
Entry Zone: $1.0180
Target 1 (TP1): $1.0360 (24h High retest)
Target 2 (TP2): $1.0650 (Extension level)
Target 3 (TP3): $1.1000 (Psychological expansion)
Stop Loss (SL): $0.9840 (Below MA28 and minor pivot)
Risk & Math Check:
Risk: ~3.34% ($1.0180 to $0.9840)
Reward to TP1: ~1.77% (R:R ~ 0.53:1 — Reject market entry)
Reward to TP2: ~4.62% (R:R ~ 1.38:1)
Reward to TP3: ~8.05% (R:R ~ 2.41:1 — Full trade setup economics)
Entering at market price yields a negative risk-to-reward ratio against TP1. Patience is key—never pay the market a premium just to catch a move that is already extended.
#Bybit #CryptoTrading #SUI #TechnicalAnalysis
Price action on SUI/USDT is currently pushing $1.0349, hovering right at the edge of its 24-hour peak at $1.0367 after expanding off the $0.8146 daily low. Turnover is sitting healthily around 35.40M USDT, showing decent institutional participation, but the immediate tape suggests momentum is hitting a localized wall.
The lower-timeframe moving average cluster highlights why this expansion is slowing down:
What I Like:
What I Don't Like:
Volume collapse at key resistance ($1.0367); current candle volume is drastically lagging the 5-period average.
Extended distance from the 28-period moving average makes market orders vulnerable to a pullback.
Trade Decision: WAIT / CONDITIONAL PULLBACK LONG.
Key Levels:
Resistance: $1.0367 (24H High & local liquidity cap)
Support 1: $1.0112 (MA14 confluence)
Support 2: $0.9886 (MA28 trendline support)
Invalidation: $0.8927 (Swing low structure)
Conditional Setup (Pullback Plan):
Trigger Condition: Wait for a retest of the MA7/MA14 band around $1.0150–$1.0200 with expanding buy volume.
Entry Zone: $1.0180
Target 1 (TP1): $1.0360 (24h High retest)
Target 2 (TP2): $1.0650 (Extension level)
Target 3 (TP3): $1.1000 (Psychological expansion)
Stop Loss (SL): $0.9840 (Below MA28 and minor pivot)
Risk & Math Check:
Risk: ~3.34% ($1.0180 to $0.9840)
Reward to TP1: ~1.77% (R:R ~ 0.53:1 — Reject market entry)
Reward to TP2: ~4.62% (R:R ~ 1.38:1)
Reward to TP3: ~8.05% (R:R ~ 2.41:1 — Full trade setup economics)
Entering at market price yields a negative risk-to-reward ratio against TP1. Patience is key—never pay the market a premium just to catch a move that is already extended.
#Bybit #CryptoTrading #SUI #TechnicalAnalysis
97
·
--
Bullish
$ARB
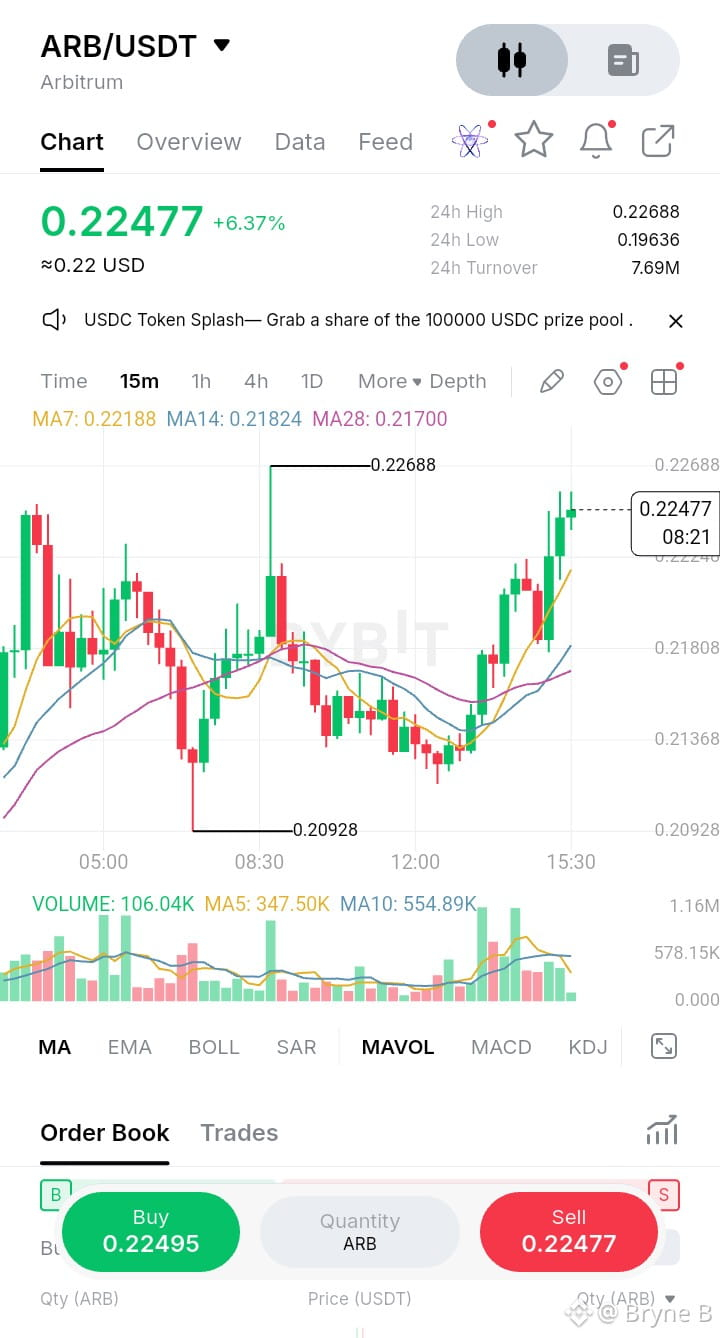
From September 14 to September 20, ARB climbed from $0.13369 to $0.21754, a 62.7% increase, while CoinGecko recorded $306.1M of volume on September 20. On September 21, the Bybit ARB/USDT chart shows $0.22477, up 6.37% over 24 hours, with a $0.19636–$0.22688 intraday range.
Here’s the part that gets skipped: September 23 is the next scheduled ARB vesting date, only 2 days after the current move. Tokenomics.com lists 53.8% of that release for insiders, 35.0% for private investors, and 11.2% for the foundation. The mechanism is straightforward: new vested tokens increase potential market supply, while the actual selling decision remains with recipients.
The contrast is that Arbitrum’s September 2 H1 report showed $6.19M of DAO income for January–June 2026, with protocol gross margins above 97%; Robinhood Chain’s July contribution added $360K of AEP licence fees, equal to 35% of DAO income that month. Yet AEP chains return 10% of net protocol revenue to the ecosystem, meaning network revenue and direct ARB token value capture are separate mechanisms.
None of this means the 62.7% rally is invalid; it means price momentum and token supply are moving on different clocks. With ARB at $0.22477 on September 21, will September 23’s vesting event produce measurable spot selling, or will trading volume absorb the additional supply?
#ARB #Arbitrum #Crypto #ARBUSDT
$ARB
From September 14 to September 20, ARB climbed from $0.13369 to $0.21754, a 62.7% increase, while CoinGecko recorded $306.1M of volume on September 20. On September 21, the Bybit ARB/USDT chart shows $0.22477, up 6.37% over 24 hours, with a $0.19636–$0.22688 intraday range.
Here’s the part that gets skipped: September 23 is the next scheduled ARB vesting date, only 2 days after the current move. Tokenomics.com lists 53.8% of that release for insiders, 35.0% for private investors, and 11.2% for the foundation. The mechanism is straightforward: new vested tokens increase potential market supply, while the actual selling decision remains with recipients.
The contrast is that Arbitrum’s September 2 H1 report showed $6.19M of DAO income for January–June 2026, with protocol gross margins above 97%; Robinhood Chain’s July contribution added $360K of AEP licence fees, equal to 35% of DAO income that month. Yet AEP chains return 10% of net protocol revenue to the ecosystem, meaning network revenue and direct ARB token value capture are separate mechanisms.
None of this means the 62.7% rally is invalid; it means price momentum and token supply are moving on different clocks. With ARB at $0.22477 on September 21, will September 23’s vesting event produce measurable spot selling, or will trading volume absorb the additional supply?
#ARB #Arbitrum #Crypto #ARBUSDT
From September 14 to September 20, ARB climbed from $0.13369 to $0.21754, a 62.7% increase, while CoinGecko recorded $306.1M of volume on September 20. On September 21, the Bybit ARB/USDT chart shows $0.22477, up 6.37% over 24 hours, with a $0.19636–$0.22688 intraday range.
Here’s the part that gets skipped: September 23 is the next scheduled ARB vesting date, only 2 days after the current move. Tokenomics.com lists 53.8% of that release for insiders, 35.0% for private investors, and 11.2% for the foundation. The mechanism is straightforward: new vested tokens increase potential market supply, while the actual selling decision remains with recipients.
The contrast is that Arbitrum’s September 2 H1 report showed $6.19M of DAO income for January–June 2026, with protocol gross margins above 97%; Robinhood Chain’s July contribution added $360K of AEP licence fees, equal to 35% of DAO income that month. Yet AEP chains return 10% of net protocol revenue to the ecosystem, meaning network revenue and direct ARB token value capture are separate mechanisms.
None of this means the 62.7% rally is invalid; it means price momentum and token supply are moving on different clocks. With ARB at $0.22477 on September 21, will September 23’s vesting event produce measurable spot selling, or will trading volume absorb the additional supply?
#ARB #Arbitrum #Crypto #ARBUSDT
191
·
--
Bullish
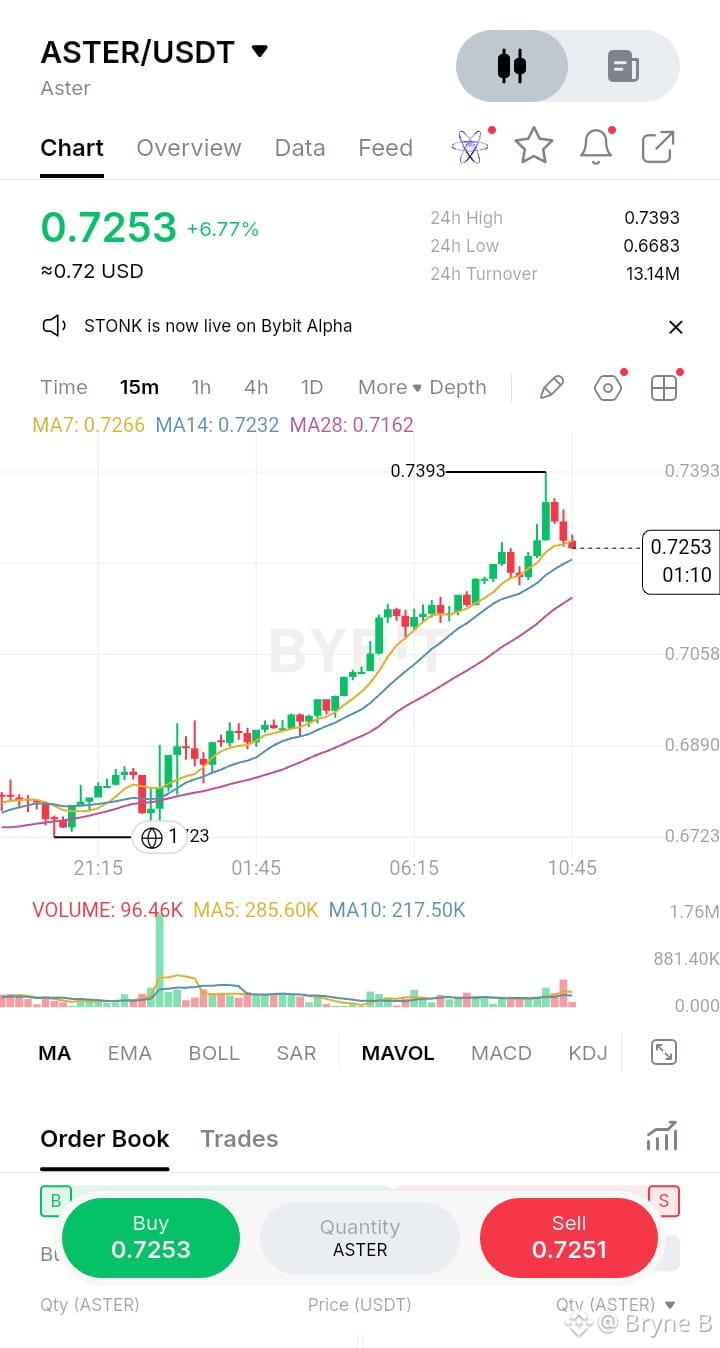
ASTER/USDT Market Update
Price: $0.7253 (+6.77%) | ≈$0.72 USD
Session Snapshot
24h High: $0.7393
24h Low: $0.6683
24h Turnover: 13.14M
Volume (recent): 96.46K
Technical Read
ASTER has staged a clean, sustained uptrend over the past session, climbing from a low near $0.6683 to an intraday peak of $0.7393 before consolidating modestly around the $0.7253 level.
Moving Averages (15m):
MA7: 0.7266
MA14: 0.7232
MA28: 0.7162
The short-, medium-, and long-term moving averages remain in clear bullish alignment (MA7 > MA14 > MA28), with price action tracking above all three throughout the advance — a textbook uptrend structure. The moving averages are fanning upward rather than converging, suggesting momentum has not yet meaningfully decayed.
Price Action: The move has been largely orderly, with green candles dominating the ascent and only shallow pullbacks along the way. The most recent candles show some red bodies near the highs (~$0.7393), hinting at short-term profit-taking or resistance testing after the sharp run-up. Price is currently hovering just below that intraday high, effectively pausing to digest gains.
Volume: A volume spike accompanied the initial breakout higher, with MA5 (285.60K) still running above MA10 (217.50K) on the volume overlay — consistent with the move being demand-driven rather than a low-conviction drift.
Key Levels to Watch
Resistance: $0.7393 (session high)
Support: MA7/MA14 cluster (~$0.723–0.727), followed by the $0.7058 pivot
Takeaway
The structure remains constructive while price holds above its short-term moving averages. A decisive close above $0.7393 would signal continuation, while a break below the MA7/MA14 band could indicate the rally is losing steam and open the door to a deeper retracement toward $0.7058. $ASTER
ASTER/USDT Market Update
Price: $0.7253 (+6.77%) | ≈$0.72 USD
Session Snapshot
24h High: $0.7393
24h Low: $0.6683
24h Turnover: 13.14M
Volume (recent): 96.46K
Technical Read
ASTER has staged a clean, sustained uptrend over the past session, climbing from a low near $0.6683 to an intraday peak of $0.7393 before consolidating modestly around the $0.7253 level.
Moving Averages (15m):
MA7: 0.7266
MA14: 0.7232
MA28: 0.7162
The short-, medium-, and long-term moving averages remain in clear bullish alignment (MA7 > MA14 > MA28), with price action tracking above all three throughout the advance — a textbook uptrend structure. The moving averages are fanning upward rather than converging, suggesting momentum has not yet meaningfully decayed.
Price Action: The move has been largely orderly, with green candles dominating the ascent and only shallow pullbacks along the way. The most recent candles show some red bodies near the highs (~$0.7393), hinting at short-term profit-taking or resistance testing after the sharp run-up. Price is currently hovering just below that intraday high, effectively pausing to digest gains.
Volume: A volume spike accompanied the initial breakout higher, with MA5 (285.60K) still running above MA10 (217.50K) on the volume overlay — consistent with the move being demand-driven rather than a low-conviction drift.
Key Levels to Watch
Resistance: $0.7393 (session high)
Support: MA7/MA14 cluster (~$0.723–0.727), followed by the $0.7058 pivot
Takeaway
The structure remains constructive while price holds above its short-term moving averages. A decisive close above $0.7393 would signal continuation, while a break below the MA7/MA14 band could indicate the rally is losing steam and open the door to a deeper retracement toward $0.7058. $ASTER
Price: $0.7253 (+6.77%) | ≈$0.72 USD
Session Snapshot
24h High: $0.7393
24h Low: $0.6683
24h Turnover: 13.14M
Volume (recent): 96.46K
Technical Read
ASTER has staged a clean, sustained uptrend over the past session, climbing from a low near $0.6683 to an intraday peak of $0.7393 before consolidating modestly around the $0.7253 level.
Moving Averages (15m):
MA7: 0.7266
MA14: 0.7232
MA28: 0.7162
The short-, medium-, and long-term moving averages remain in clear bullish alignment (MA7 > MA14 > MA28), with price action tracking above all three throughout the advance — a textbook uptrend structure. The moving averages are fanning upward rather than converging, suggesting momentum has not yet meaningfully decayed.
Price Action: The move has been largely orderly, with green candles dominating the ascent and only shallow pullbacks along the way. The most recent candles show some red bodies near the highs (~$0.7393), hinting at short-term profit-taking or resistance testing after the sharp run-up. Price is currently hovering just below that intraday high, effectively pausing to digest gains.
Volume: A volume spike accompanied the initial breakout higher, with MA5 (285.60K) still running above MA10 (217.50K) on the volume overlay — consistent with the move being demand-driven rather than a low-conviction drift.
Key Levels to Watch
Resistance: $0.7393 (session high)
Support: MA7/MA14 cluster (~$0.723–0.727), followed by the $0.7058 pivot
Takeaway
The structure remains constructive while price holds above its short-term moving averages. A decisive close above $0.7393 would signal continuation, while a break below the MA7/MA14 band could indicate the rally is losing steam and open the door to a deeper retracement toward $0.7058. $ASTER
166
·
--
Bullish
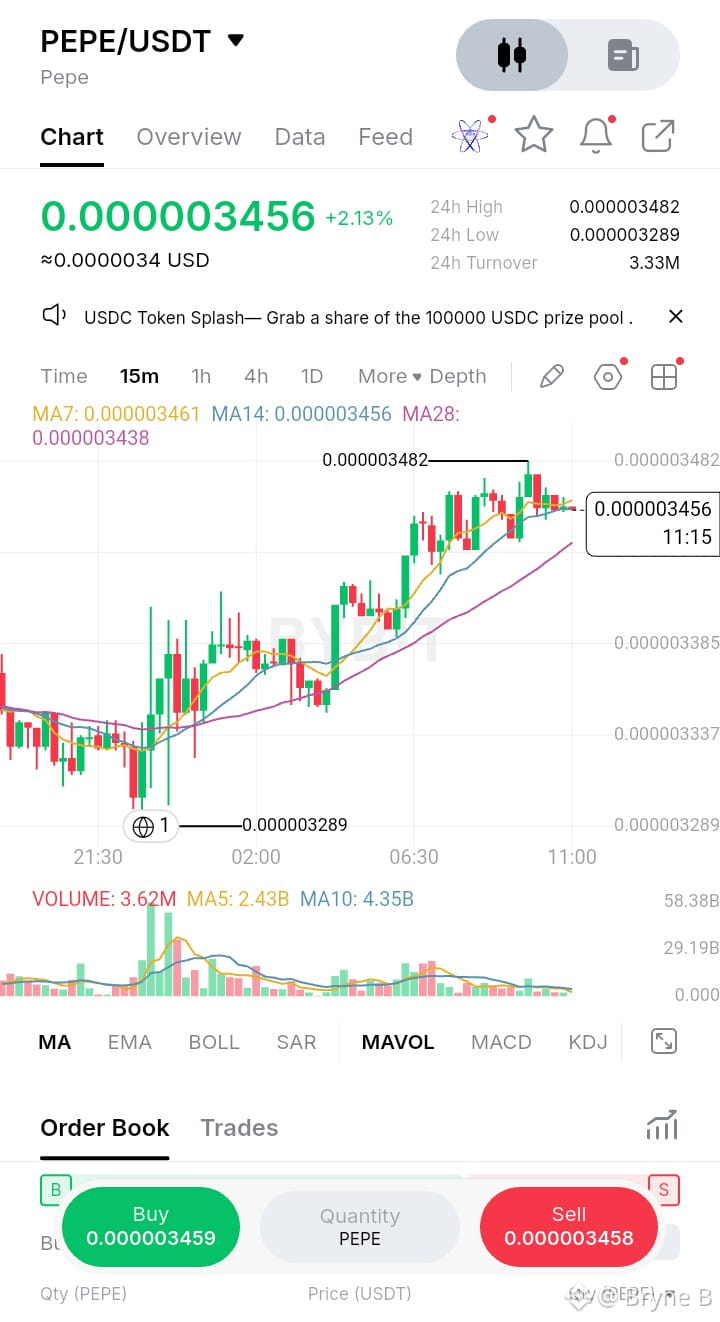
PEPE is trading at $0.000003456 as of 11:15 UTC today, September 17, 2026, up 2.13% on the session after bouncing off a 24-hour low of $0.000003289 to a high of $0.000003482. Turnover over the past 24 hours sits at roughly 3.33M on Bybit's PEPE/USDT pair — a modest move, but it comes against a backdrop investors have been calling structurally bullish since early $PEPE August.
What makes this worth noting isn't the bounce — it's who's actually positioned to benefit from it. On August 5, 2026, Santiment recorded a net 4.54 trillion PEPE leaving exchanges in a single day, the largest outflow since November 2024, with top-100 wallets growing their holdings roughly 6% over 30 days to about 86 trillion tokens. That's routinely framed as "reduced sell pressure." But Canary Capital's April 8, 2026 spot-ETF S-1 disclosed that, as of January 2026, the ten largest PEPE wallets alone held approximately 41% of circulating supply. Outflows into cold storage and concentration into the same handful of addresses are two ways of describing the same underlying fact.
That gap matters beyond PEPE. Any token where a small number of wallets can move both the "supply shock" narrative and the actual float deserves the same scrutiny regardless of ticker. The Canary ETF, meanwhile, remains under SEC review five months after filing, with no approval timeline disclosed.
None of this means the rally is manufactured. It means the accumulation story and the concentration risk are describing the same wallets — worth watching whether outflows keep pairing with holder-count growth, or just with bigger balances in fewer hands.
$PEPE #PEPE #Crypto
PEPE is trading at $0.000003456 as of 11:15 UTC today, September 17, 2026, up 2.13% on the session after bouncing off a 24-hour low of $0.000003289 to a high of $0.000003482. Turnover over the past 24 hours sits at roughly 3.33M on Bybit's PEPE/USDT pair — a modest move, but it comes against a backdrop investors have been calling structurally bullish since early $PEPE August.
What makes this worth noting isn't the bounce — it's who's actually positioned to benefit from it. On August 5, 2026, Santiment recorded a net 4.54 trillion PEPE leaving exchanges in a single day, the largest outflow since November 2024, with top-100 wallets growing their holdings roughly 6% over 30 days to about 86 trillion tokens. That's routinely framed as "reduced sell pressure." But Canary Capital's April 8, 2026 spot-ETF S-1 disclosed that, as of January 2026, the ten largest PEPE wallets alone held approximately 41% of circulating supply. Outflows into cold storage and concentration into the same handful of addresses are two ways of describing the same underlying fact.
That gap matters beyond PEPE. Any token where a small number of wallets can move both the "supply shock" narrative and the actual float deserves the same scrutiny regardless of ticker. The Canary ETF, meanwhile, remains under SEC review five months after filing, with no approval timeline disclosed.
None of this means the rally is manufactured. It means the accumulation story and the concentration risk are describing the same wallets — worth watching whether outflows keep pairing with holder-count growth, or just with bigger balances in fewer hands.
$PEPE #PEPE #Crypto
What makes this worth noting isn't the bounce — it's who's actually positioned to benefit from it. On August 5, 2026, Santiment recorded a net 4.54 trillion PEPE leaving exchanges in a single day, the largest outflow since November 2024, with top-100 wallets growing their holdings roughly 6% over 30 days to about 86 trillion tokens. That's routinely framed as "reduced sell pressure." But Canary Capital's April 8, 2026 spot-ETF S-1 disclosed that, as of January 2026, the ten largest PEPE wallets alone held approximately 41% of circulating supply. Outflows into cold storage and concentration into the same handful of addresses are two ways of describing the same underlying fact.
That gap matters beyond PEPE. Any token where a small number of wallets can move both the "supply shock" narrative and the actual float deserves the same scrutiny regardless of ticker. The Canary ETF, meanwhile, remains under SEC review five months after filing, with no approval timeline disclosed.
None of this means the rally is manufactured. It means the accumulation story and the concentration risk are describing the same wallets — worth watching whether outflows keep pairing with holder-count growth, or just with bigger balances in fewer hands.
$PEPE #PEPE #Crypto
300
·
--
well said
well said


RonyZ
·
--
Markets don’t move on emotions.
They move on liquidity incentives.
Capital is always asking one simple question:
“Where can I get the most upside without increasing my risk?”
Early in a cycle, the answer is safety.
Mid-cycle, it’s efficiency.
Late-cycle, it’s responsiveness.
That’s why money rotates, not because investors get reckless, but because returns compress at the top.
When Gold and Silver stop delivering strong upside, capital has to move.
Risk stays the same.
Reward shrinks.
So liquidity flows downstream:
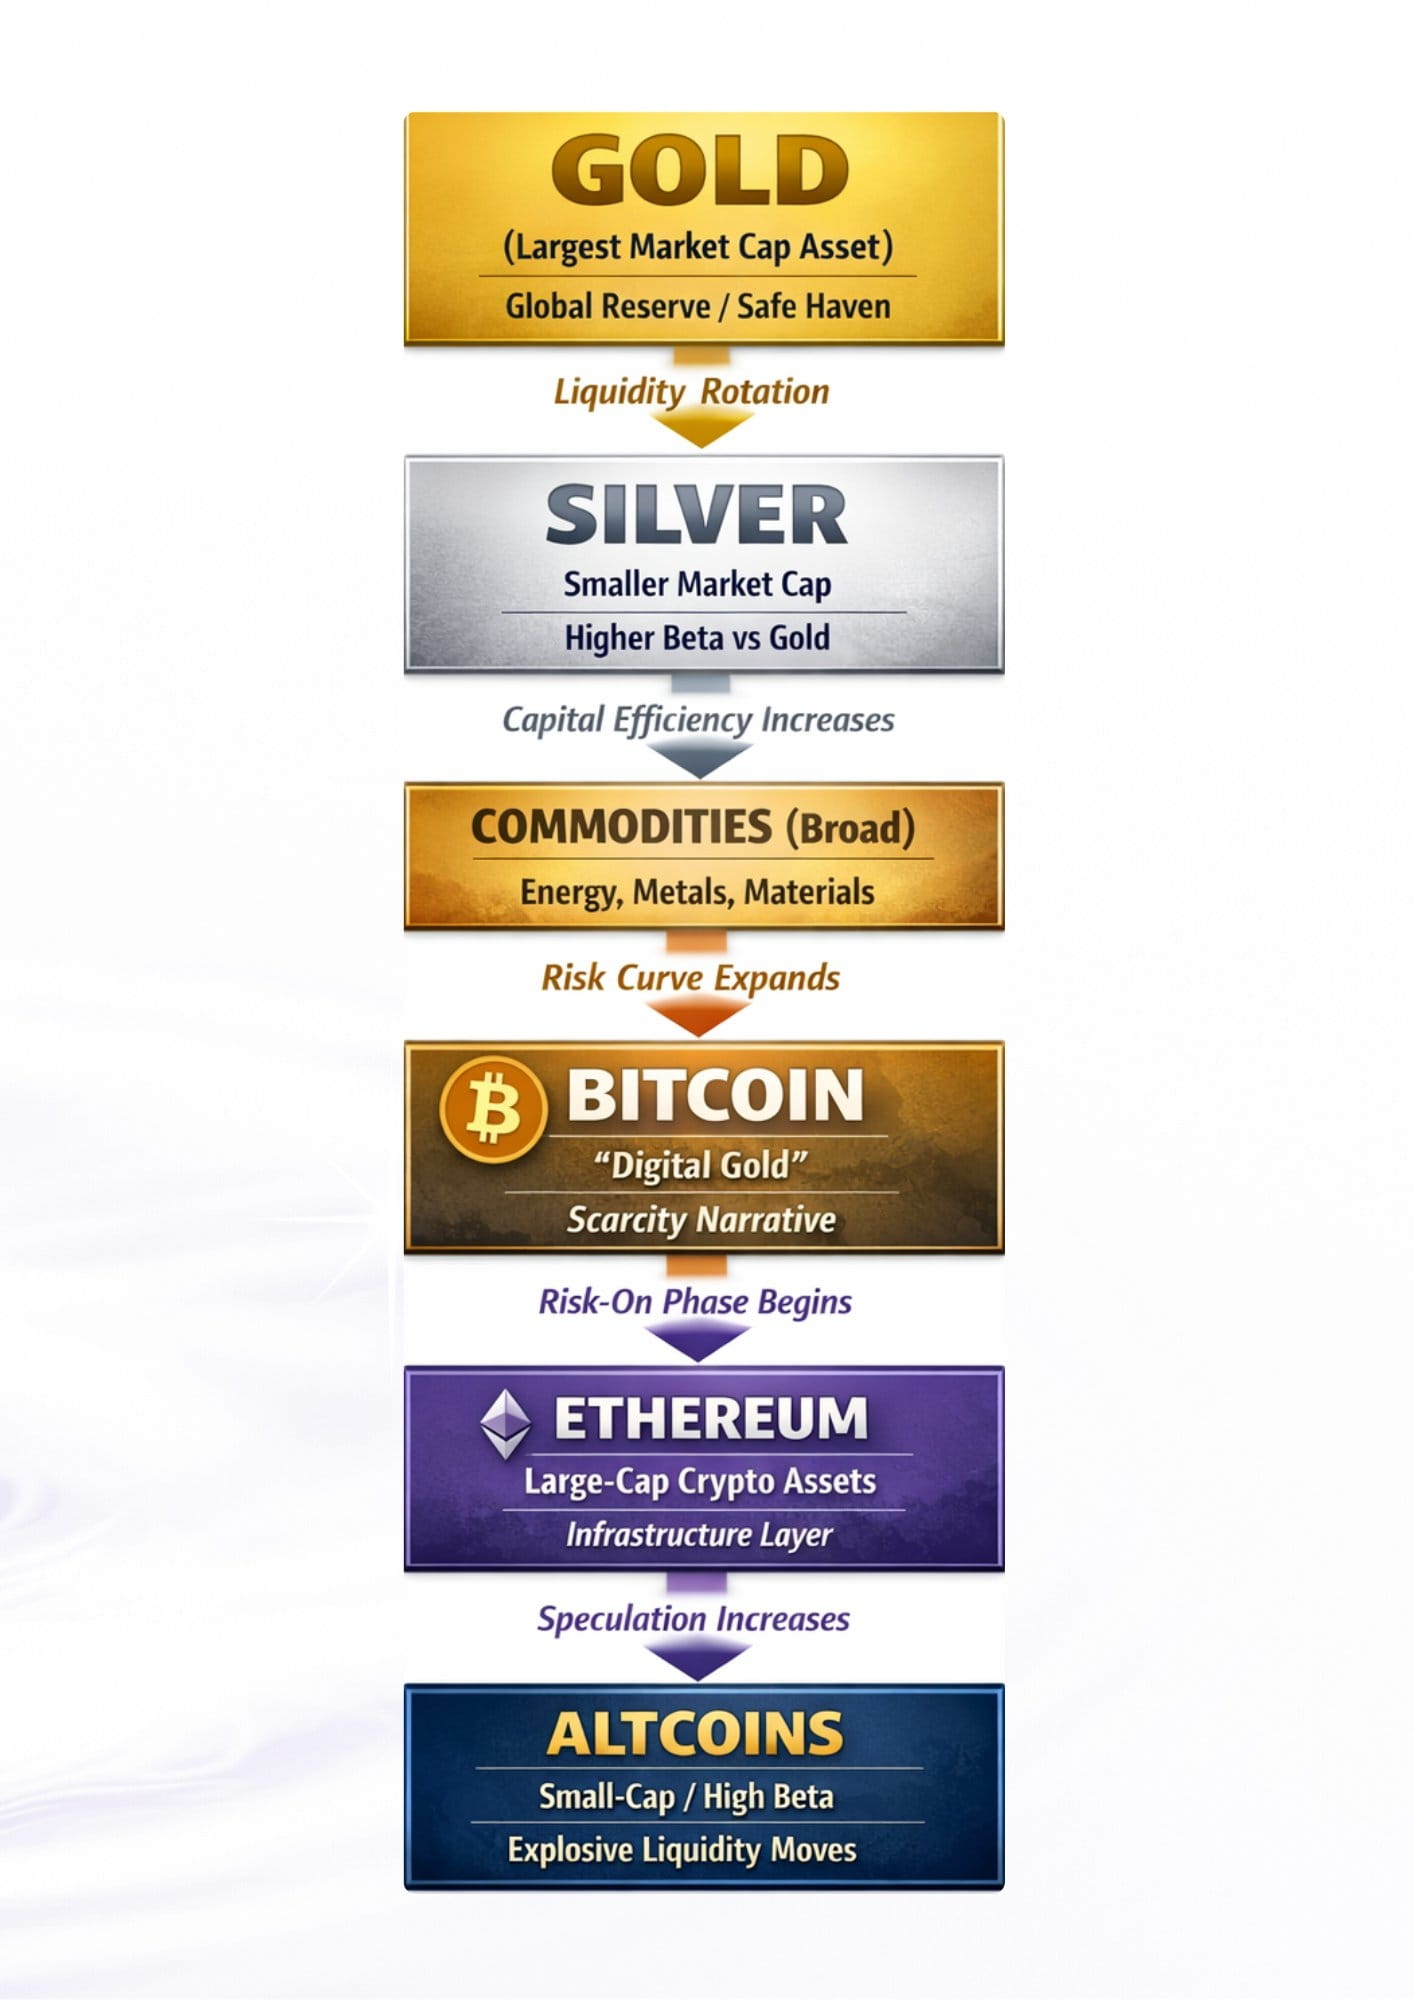
Gold → Silver → Bitcoin → ETH & large caps → mid caps → small caps → memes.
Same money.
Smaller markets.
Bigger price reactions.
Think of it like water flowing downhill.
Big containers at the top need a lot to overflow.
Smaller containers below spill with much less.
The water didn’t increase.
The containers just got smaller.
Narratives always come after the move:
“Gold = fiat hedge”
“Bitcoin = digital gold”
“Alts = innovation”
It’s all recycled liquidity finding efficiency.
We’re only at the early stages of this flow.
The real spills come later.
#Market_Update #market_tips #liquidity #CryptoMarketAnalysis #BinanceSquareFamily
They move on liquidity incentives.
Capital is always asking one simple question:
“Where can I get the most upside without increasing my risk?”
Early in a cycle, the answer is safety.
Mid-cycle, it’s efficiency.
Late-cycle, it’s responsiveness.
That’s why money rotates, not because investors get reckless, but because returns compress at the top.
When Gold and Silver stop delivering strong upside, capital has to move.
Risk stays the same.
Reward shrinks.
So liquidity flows downstream:
Gold → Silver → Bitcoin → ETH & large caps → mid caps → small caps → memes.
Same money.
Smaller markets.
Bigger price reactions.
Think of it like water flowing downhill.
Big containers at the top need a lot to overflow.
Smaller containers below spill with much less.
The water didn’t increase.
The containers just got smaller.
Narratives always come after the move:
“Gold = fiat hedge”
“Bitcoin = digital gold”
“Alts = innovation”
It’s all recycled liquidity finding efficiency.
We’re only at the early stages of this flow.
The real spills come later.
#Market_Update #market_tips #liquidity #CryptoMarketAnalysis #BinanceSquareFamily
·
--
BREAKING NEWS from BlackRock & Larry Fink! 🔥
The financial world is on the edge of another revolution! 💥
👑 Larry Fink, CEO of BlackRock, just CONFIRMED — the company is launching its own blockchain-based asset tokenization platform! 💎
Yes, the world’s largest asset manager is going all in on the digital future of traditional finance! 🚀
🔍 What’s happening?
BlackRock plans to tokenize its iShares ETFs, giving investors direct access to stocks and bonds through digital wallets! 💰📲
Fink described this as “a move toward the tokenization of all assets” — and it’s truly a game changer 🧠⚡
💼 Fun fact: BlackRock already launched BUIDL, a tokenized money market fund worth around $2.8B, created in partnership with Securitize 🏦
📈 Why this matters for Crypto & TradFi:
✨ TradFi x DeFi: Tokenizing real-world assets enables instant settlements, fractional ownership, and 24/7 trading
💳 Access for everyone: Retail investors can finally invest in high-end traditional assets directly from their wallets
⚙️ Efficiency boost: Fewer middlemen = lower costs + full transparency
🏛️ Institutional trust: With BlackRock in the game, this isn’t an experiment — it’s the start of a new financial era 🌐
⚠️ But there are still challenges:
🔒 Regulations and custody of digital securities need to evolve
🧩 Blockchain infrastructure must handle massive scaling
👥 Adoption depends on trust, user education, and seamless experience
---
💬 TL;DR:
BlackRock is making a bold leap into blockchain, bridging the gap between traditional assets and the crypto ecosystem. 🌍
If this succeeds, it could become the biggest bridge ever built between DeFi and Wall Street! 🚀
👇
🔥 Follow me so you don’t miss the hottest crypto updates!
❤️ Smash that like button & share your thoughts 💭
My fam — I appreciate you all! 💪💫
$BNB $SAGA $SOL
BREAKING NEWS from BlackRock & Larry Fink! 🔥
The financial world is on the edge of another revolution! 💥
👑 Larry Fink, CEO of BlackRock, just CONFIRMED — the company is launching its own blockchain-based asset tokenization platform! 💎
Yes, the world’s largest asset manager is going all in on the digital future of traditional finance! 🚀
🔍 What’s happening?
BlackRock plans to tokenize its iShares ETFs, giving investors direct access to stocks and bonds through digital wallets! 💰📲
Fink described this as “a move toward the tokenization of all assets” — and it’s truly a game changer 🧠⚡
💼 Fun fact: BlackRock already launched BUIDL, a tokenized money market fund worth around $2.8B, created in partnership with Securitize 🏦
📈 Why this matters for Crypto & TradFi:
✨ TradFi x DeFi: Tokenizing real-world assets enables instant settlements, fractional ownership, and 24/7 trading
💳 Access for everyone: Retail investors can finally invest in high-end traditional assets directly from their wallets
⚙️ Efficiency boost: Fewer middlemen = lower costs + full transparency
🏛️ Institutional trust: With BlackRock in the game, this isn’t an experiment — it’s the start of a new financial era 🌐
⚠️ But there are still challenges:
🔒 Regulations and custody of digital securities need to evolve
🧩 Blockchain infrastructure must handle massive scaling
👥 Adoption depends on trust, user education, and seamless experience
---
💬 TL;DR:
BlackRock is making a bold leap into blockchain, bridging the gap between traditional assets and the crypto ecosystem. 🌍
If this succeeds, it could become the biggest bridge ever built between DeFi and Wall Street! 🚀
👇
🔥 Follow me so you don’t miss the hottest crypto updates!
❤️ Smash that like button & share your thoughts 💭
My fam — I appreciate you all! 💪💫
$BNB $SAGA $SOL
The financial world is on the edge of another revolution! 💥
👑 Larry Fink, CEO of BlackRock, just CONFIRMED — the company is launching its own blockchain-based asset tokenization platform! 💎
Yes, the world’s largest asset manager is going all in on the digital future of traditional finance! 🚀
🔍 What’s happening?
BlackRock plans to tokenize its iShares ETFs, giving investors direct access to stocks and bonds through digital wallets! 💰📲
Fink described this as “a move toward the tokenization of all assets” — and it’s truly a game changer 🧠⚡
💼 Fun fact: BlackRock already launched BUIDL, a tokenized money market fund worth around $2.8B, created in partnership with Securitize 🏦
📈 Why this matters for Crypto & TradFi:
✨ TradFi x DeFi: Tokenizing real-world assets enables instant settlements, fractional ownership, and 24/7 trading
💳 Access for everyone: Retail investors can finally invest in high-end traditional assets directly from their wallets
⚙️ Efficiency boost: Fewer middlemen = lower costs + full transparency
🏛️ Institutional trust: With BlackRock in the game, this isn’t an experiment — it’s the start of a new financial era 🌐
⚠️ But there are still challenges:
🔒 Regulations and custody of digital securities need to evolve
🧩 Blockchain infrastructure must handle massive scaling
👥 Adoption depends on trust, user education, and seamless experience
---
💬 TL;DR:
BlackRock is making a bold leap into blockchain, bridging the gap between traditional assets and the crypto ecosystem. 🌍
If this succeeds, it could become the biggest bridge ever built between DeFi and Wall Street! 🚀
👇
🔥 Follow me so you don’t miss the hottest crypto updates!
❤️ Smash that like button & share your thoughts 💭
My fam — I appreciate you all! 💪💫
$BNB $SAGA $SOL
·
--
Bearish
🧊 Bitcoin Faces Bearish Pressure: What’s Driving the Downtrend?
The crypto market is showing signs of uncertainty as Bitcoin (BTC) experiences a bearish sentiment, with 58% of traders currently feeling pessimistic about its short-term outlook. BTC’s price has dropped by 4.90%, hovering around $105,761, reflecting broader weakness across the market.
📉 Market Overview
The overall crypto market cap stands at $3.58 trillion, marking a 5.29% decline, while the 24-hour trading volume has surged by 36.32%, reaching $271.66 billion. This indicates heightened activity — likely driven by traders reacting to volatility rather than new investments entering the market.
Adding to the pressure, BTC ETF net outflows of $530.9 million signal that institutional investors are taking profits or reducing exposure, contributing further to the sell-off.
😨 Fear & Greed Index: Fear Dominates
The Fear & Greed Index is currently at 28, firmly in the “Fear” zone. This shows investors’ growing caution amid recent dips, suggesting a potential lack of confidence in the near-term market recovery.
🔍 Broader Impact
Other major cryptocurrencies are also under pressure — BNB is down 8.90% and DOGE has fallen 8.44%, mirroring Bitcoin’s trend. This correlation highlights a widespread correction phase rather than an isolated BTC movement.
🧠 What Traders Should Watch
While short-term sentiment remains bearish, such pullbacks often create opportunities for accumulation. Historically, Bitcoin corrections have been followed by periods of consolidation before the next bullish cycle.
Key factors to monitor include:
BTC ETF inflows/outflows
Macroeconomic conditions (interest rates, inflation data)
Market liquidity and volume trends
In summary: Bitcoin is facing a temporary bearish wave, driven by investor fear and ETF outflows. However, volatility is part of crypto’s DNA — and those who understand market cycles know that fear often precedes opportunity.
#MarketPullback #BTC
#ShareYourThoughtOnBTC
🧊 Bitcoin Faces Bearish Pressure: What’s Driving the Downtrend?
The crypto market is showing signs of uncertainty as Bitcoin (BTC) experiences a bearish sentiment, with 58% of traders currently feeling pessimistic about its short-term outlook. BTC’s price has dropped by 4.90%, hovering around $105,761, reflecting broader weakness across the market.
📉 Market Overview
The overall crypto market cap stands at $3.58 trillion, marking a 5.29% decline, while the 24-hour trading volume has surged by 36.32%, reaching $271.66 billion. This indicates heightened activity — likely driven by traders reacting to volatility rather than new investments entering the market.
Adding to the pressure, BTC ETF net outflows of $530.9 million signal that institutional investors are taking profits or reducing exposure, contributing further to the sell-off.
😨 Fear & Greed Index: Fear Dominates
The Fear & Greed Index is currently at 28, firmly in the “Fear” zone. This shows investors’ growing caution amid recent dips, suggesting a potential lack of confidence in the near-term market recovery.
🔍 Broader Impact
Other major cryptocurrencies are also under pressure — BNB is down 8.90% and DOGE has fallen 8.44%, mirroring Bitcoin’s trend. This correlation highlights a widespread correction phase rather than an isolated BTC movement.
🧠 What Traders Should Watch
While short-term sentiment remains bearish, such pullbacks often create opportunities for accumulation. Historically, Bitcoin corrections have been followed by periods of consolidation before the next bullish cycle.
Key factors to monitor include:
BTC ETF inflows/outflows
Macroeconomic conditions (interest rates, inflation data)
Market liquidity and volume trends
In summary: Bitcoin is facing a temporary bearish wave, driven by investor fear and ETF outflows. However, volatility is part of crypto’s DNA — and those who understand market cycles know that fear often precedes opportunity.
#MarketPullback #BTC
#ShareYourThoughtOnBTC
The crypto market is showing signs of uncertainty as Bitcoin (BTC) experiences a bearish sentiment, with 58% of traders currently feeling pessimistic about its short-term outlook. BTC’s price has dropped by 4.90%, hovering around $105,761, reflecting broader weakness across the market.
📉 Market Overview
The overall crypto market cap stands at $3.58 trillion, marking a 5.29% decline, while the 24-hour trading volume has surged by 36.32%, reaching $271.66 billion. This indicates heightened activity — likely driven by traders reacting to volatility rather than new investments entering the market.
Adding to the pressure, BTC ETF net outflows of $530.9 million signal that institutional investors are taking profits or reducing exposure, contributing further to the sell-off.
😨 Fear & Greed Index: Fear Dominates
The Fear & Greed Index is currently at 28, firmly in the “Fear” zone. This shows investors’ growing caution amid recent dips, suggesting a potential lack of confidence in the near-term market recovery.
🔍 Broader Impact
Other major cryptocurrencies are also under pressure — BNB is down 8.90% and DOGE has fallen 8.44%, mirroring Bitcoin’s trend. This correlation highlights a widespread correction phase rather than an isolated BTC movement.
🧠 What Traders Should Watch
While short-term sentiment remains bearish, such pullbacks often create opportunities for accumulation. Historically, Bitcoin corrections have been followed by periods of consolidation before the next bullish cycle.
Key factors to monitor include:
BTC ETF inflows/outflows
Macroeconomic conditions (interest rates, inflation data)
Market liquidity and volume trends
In summary: Bitcoin is facing a temporary bearish wave, driven by investor fear and ETF outflows. However, volatility is part of crypto’s DNA — and those who understand market cycles know that fear often precedes opportunity.
#MarketPullback #BTC
#ShareYourThoughtOnBTC
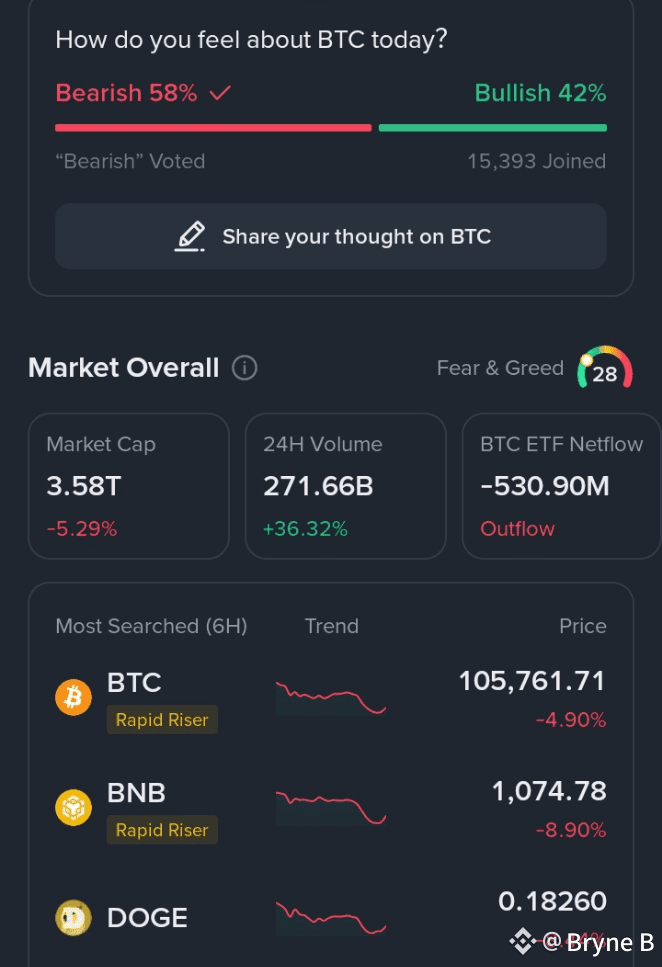
40
·
--
Most people hear about crypto and think it’s only about buying coins and getting rich fast.
But the truth is — crypto is about empowering YOU to control your money without relying on banks or governments.
Here’s what makes it powerful 👇
🔹 Decentralization – No single authority controls it. The power is shared across a global network.
🔹 Blockchain Transparency – Every transaction is recorded publicly, making fraud almost impossible.
🔹 Limited Supply = Real Value – Unlike printed money, most cryptocurrencies have a fixed supply, protecting against inflation.
🔹 Global Access – Whether you’re in New York or Nairobi, crypto lets you send or receive money instantly and cheaply.
🔹 Innovation Beyond Coins – From NFTs to DeFi to tokenized assets, crypto is building a new digital economy.
💬 Remember: Don’t just trade crypto — understand it.
Knowledge is your strongest investment.
Most people hear about crypto and think it’s only about buying coins and getting rich fast.
But the truth is — crypto is about empowering YOU to control your money without relying on banks or governments.
Here’s what makes it powerful 👇
🔹 Decentralization – No single authority controls it. The power is shared across a global network.
🔹 Blockchain Transparency – Every transaction is recorded publicly, making fraud almost impossible.
🔹 Limited Supply = Real Value – Unlike printed money, most cryptocurrencies have a fixed supply, protecting against inflation.
🔹 Global Access – Whether you’re in New York or Nairobi, crypto lets you send or receive money instantly and cheaply.
🔹 Innovation Beyond Coins – From NFTs to DeFi to tokenized assets, crypto is building a new digital economy.
💬 Remember: Don’t just trade crypto — understand it.
Knowledge is your strongest investment.
But the truth is — crypto is about empowering YOU to control your money without relying on banks or governments.
Here’s what makes it powerful 👇
🔹 Decentralization – No single authority controls it. The power is shared across a global network.
🔹 Blockchain Transparency – Every transaction is recorded publicly, making fraud almost impossible.
🔹 Limited Supply = Real Value – Unlike printed money, most cryptocurrencies have a fixed supply, protecting against inflation.
🔹 Global Access – Whether you’re in New York or Nairobi, crypto lets you send or receive money instantly and cheaply.
🔹 Innovation Beyond Coins – From NFTs to DeFi to tokenized assets, crypto is building a new digital economy.
💬 Remember: Don’t just trade crypto — understand it.
Knowledge is your strongest investment.
9
9
Log in to explore more content
Join global crypto users on Binance Square
⚡️ Get latest and useful information about crypto.
💬 Trusted by the world’s largest crypto exchange.
👍 Discover real insights from verified creators.
Email / Phone number
Trending Topics
QNTRises39%
47,763 views
1,154 Discussing
🚨 QNT IS SURGING! 📈
$QNT is making a huge move today, climbing nearly 40% as buying pressure accelerates.
The rally has put Quant firmly back in the spotlight, with traders watching to see whether this momentum can continue or if a pullback comes next.
🔥 Key things to watch:
• Strong trading volume
• Momentum above recent highs
• The $100 psychological level
• Whether buyers can maintain control
Big moves bring big volatility. Stay alert and manage risk.
Are you watching $QNT? 👀
#QNT #altcoins #CryptoNews
#qntrises39% $QNT
The07
·4 Likes
·4k views
EthereumBreaksAbove$2700
4,247 views
116 Discussing
BitgetBreachForgedRequestsNotStolenKeys
46,838 views
923 Discussing