
老陌
555 Posts

老陌
 Square Verified
Report
Block User
Marketing Advisor|#Airdrop|Share first-line news! #实话实说爆光内幕!
23 Following
824 Followers
444 Liked
Posts
All
Videos
·
--
#BTC
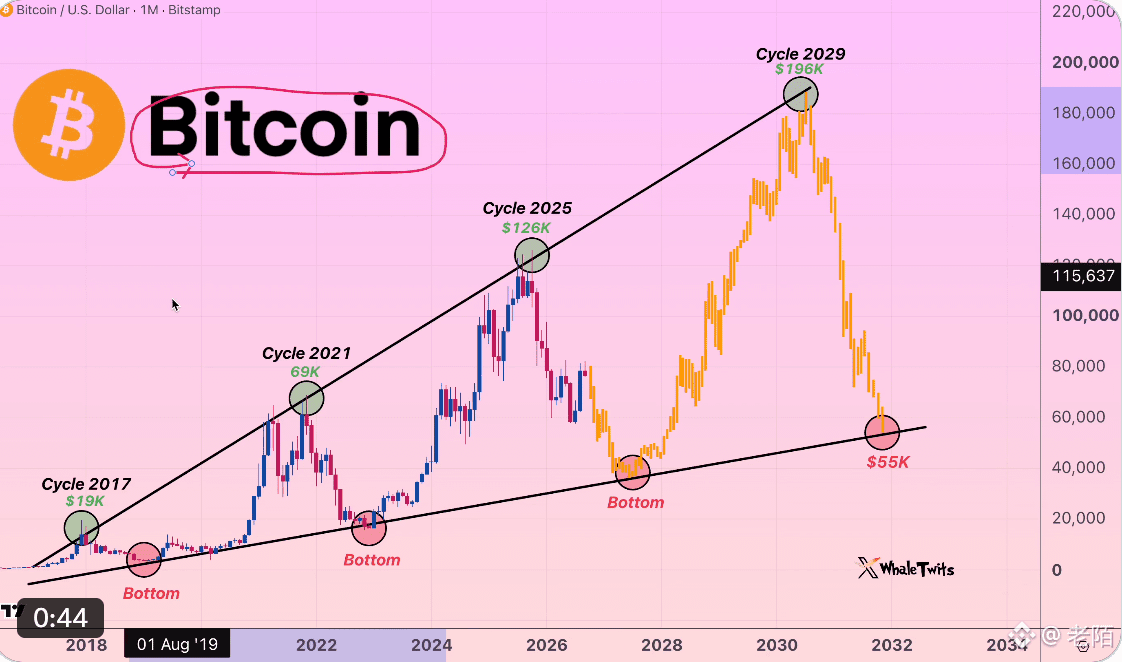
$57K might be the bottom—or just a mid-way stop;
$196K might be the target—or just a gimmick.
What you should really care about isn’t whether this chart is right, but what you’ll do if $57K doesn’t come and it goes straight up.
#BTC
$57K might be the bottom—or just a mid-way stop;
$196K might be the target—or just a gimmick.
What you should really care about isn’t whether this chart is right, but what you’ll do if $57K doesn’t come and it goes straight up.
$57K might be the bottom—or just a mid-way stop;
$196K might be the target—or just a gimmick.
What you should really care about isn’t whether this chart is right, but what you’ll do if $57K doesn’t come and it goes straight up.
4
1
3k
·
--
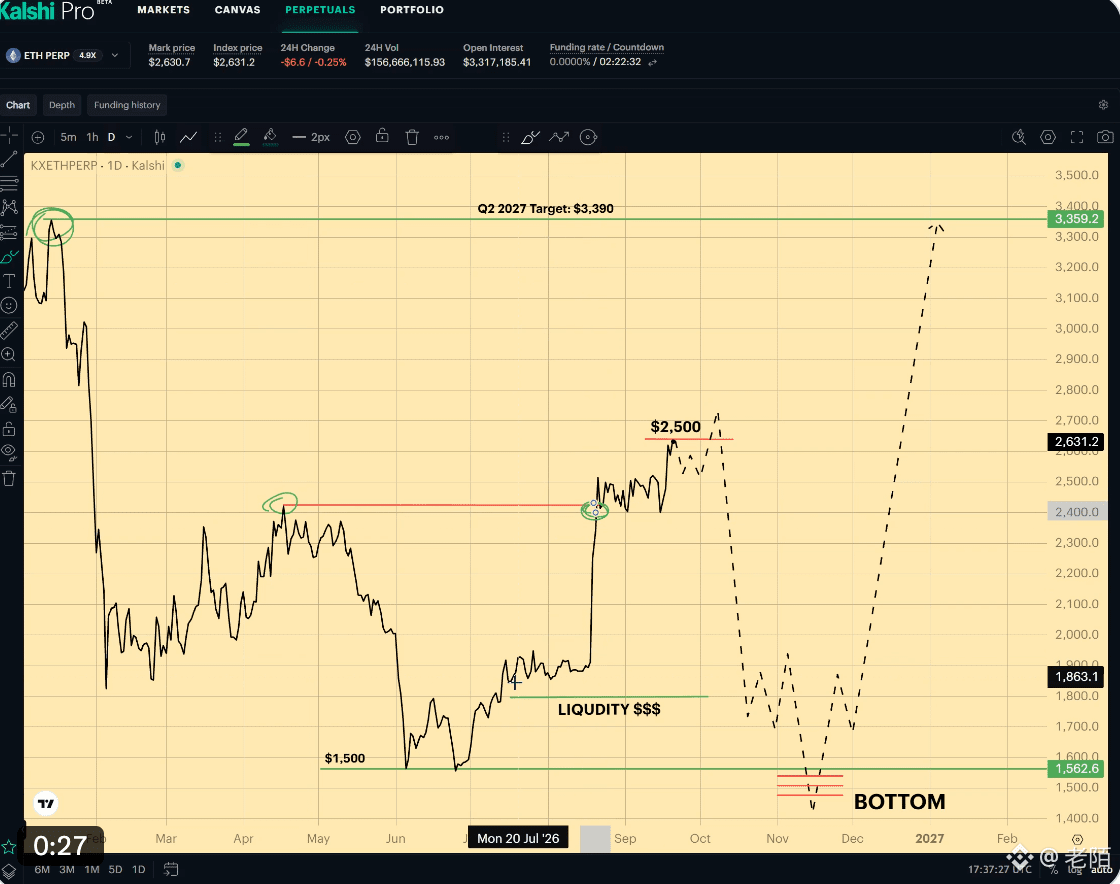
#ETH From $2,670 to $1,500—during the drop, at every level of $2,200, $2,000, and $1,800, someone will always think, “This is cheap enough.”
The real risk isn’t missing out on $1,500—it’s continuously adding positions during the decline and firing all your rounds early.
By the time the area you truly want to buy shows up, many people have neither remaining positions nor the courage to act.
This is the most dangerous part of this market move.
#ETH From $2,670 to $1,500—during the drop, at every level of $2,200, $2,000, and $1,800, someone will always think, “This is cheap enough.”
The real risk isn’t missing out on $1,500—it’s continuously adding positions during the decline and firing all your rounds early.
By the time the area you truly want to buy shows up, many people have neither remaining positions nor the courage to act.
This is the most dangerous part of this market move.
The real risk isn’t missing out on $1,500—it’s continuously adding positions during the decline and firing all your rounds early.
By the time the area you truly want to buy shows up, many people have neither remaining positions nor the courage to act.
This is the most dangerous part of this market move.
1
4
2.6k
·
--
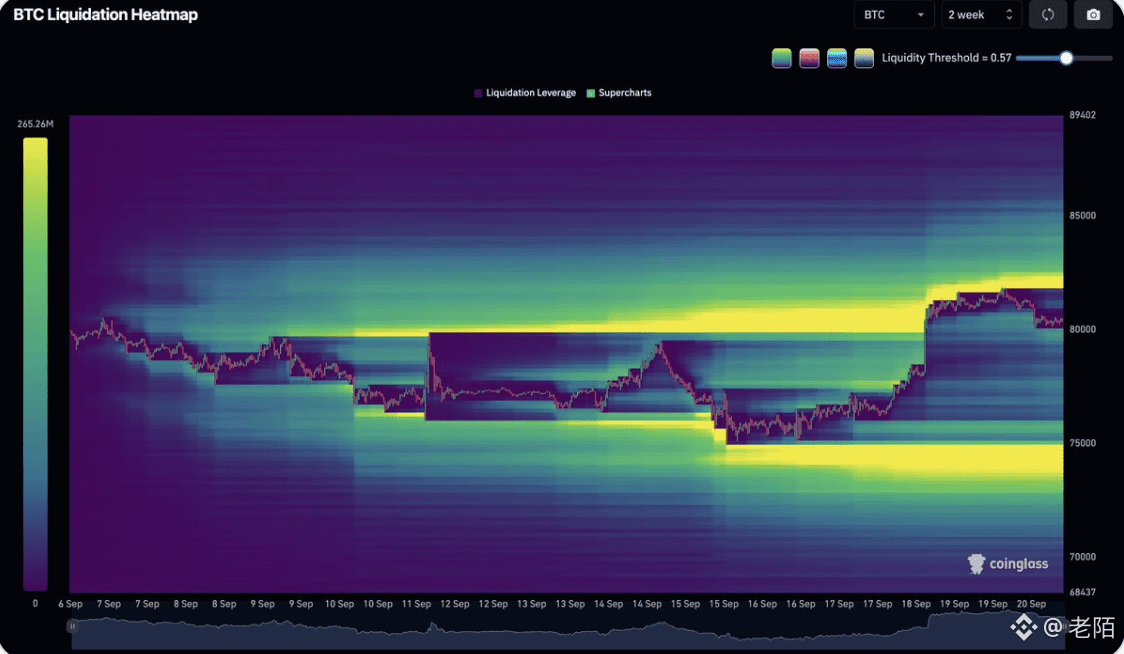
#BTC Above $82K–$83K is a clear resistance zone, while below $75K there is still some distance.
If the price continues to range and there is no new negative catalyst, the odds are higher that it will first test $83,000 upward.
Liquidity is piled up above, so it’s also easier to get swept first.
#BTC Above $82K–$83K is a clear resistance zone, while below $75K there is still some distance.
If the price continues to range and there is no new negative catalyst, the odds are higher that it will first test $83,000 upward.
Liquidity is piled up above, so it’s also easier to get swept first.
If the price continues to range and there is no new negative catalyst, the odds are higher that it will first test $83,000 upward.
Liquidity is piled up above, so it’s also easier to get swept first.
1
891
·
--
If there is a pullback or a quick spike, don’t be easily shaken out.
But “not being shaken out” doesn’t mean you should stubbornly hold on.
Real preparation means thinking in advance: at which point of a pullback can you still hold; and if price breaks below which level, you must leave.
Without this line, what’s called “holding” is only emotion.
#BTC If price is consolidating above the key support, the fluctuation is just the process; if the support has already been broken, then it isn’t a shakeout—it’s a change in direction.
If there is a pullback or a quick spike, don’t be easily shaken out.
But “not being shaken out” doesn’t mean you should stubbornly hold on.
Real preparation means thinking in advance: at which point of a pullback can you still hold; and if price breaks below which level, you must leave.
Without this line, what’s called “holding” is only emotion.
#BTC If price is consolidating above the key support, the fluctuation is just the process; if the support has already been broken, then it isn’t a shakeout—it’s a change in direction.
But “not being shaken out” doesn’t mean you should stubbornly hold on.
Real preparation means thinking in advance: at which point of a pullback can you still hold; and if price breaks below which level, you must leave.
Without this line, what’s called “holding” is only emotion.
#BTC If price is consolidating above the key support, the fluctuation is just the process; if the support has already been broken, then it isn’t a shakeout—it’s a change in direction.
328
·
--
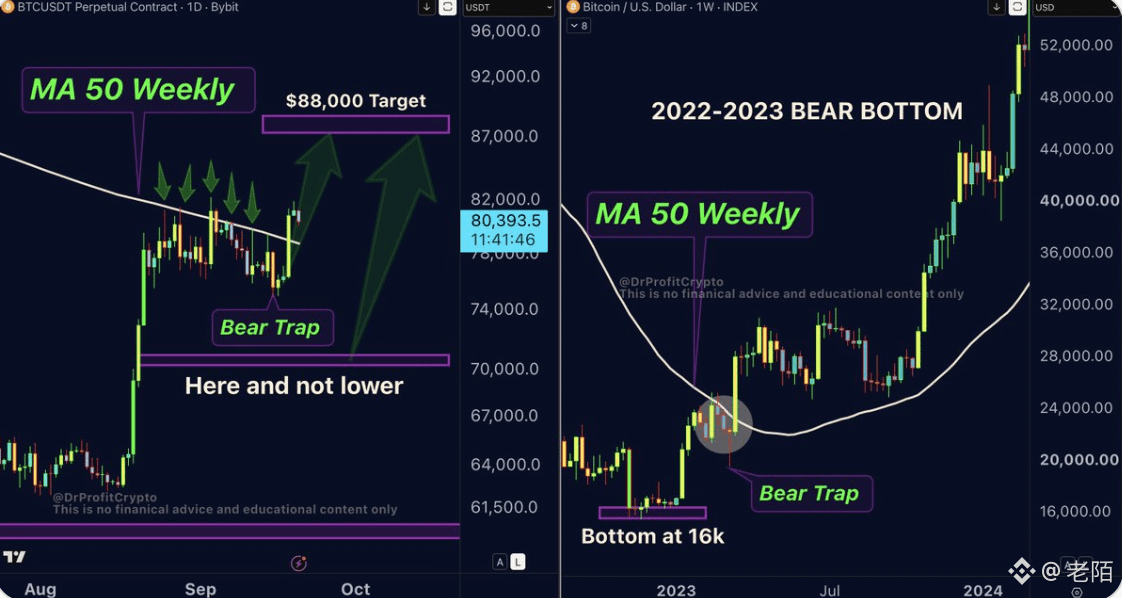
Use the 2022–2023 moving-average structure to infer what’s happening now—while overlooking one key difference: market participants have changed.
Back then, #BTC was mainly driven by retail traders and offshore capital. Today, spot ETFs, institutional custody, and the options market are all influencing price.
Even if MA50 “reclaims” the same level, the underlying capital structure, leverage levels, and liquidity depth are completely different.
You can use historical patterns as reference, but you can’t directly apply them.
What you really should look at isn’t “how much it rose after the last breakout,” but whether this breakout has net inflows into ETFs, whether OI is healthy, and whether related assets—like ETH and COIN—are moving strongly in sync.
A single moving average can’t carry the bull-market conclusion by itself.
Use the 2022–2023 moving-average structure to infer what’s happening now—while overlooking one key difference: market participants have changed.
Back then, #BTC was mainly driven by retail traders and offshore capital. Today, spot ETFs, institutional custody, and the options market are all influencing price.
Even if MA50 “reclaims” the same level, the underlying capital structure, leverage levels, and liquidity depth are completely different.
You can use historical patterns as reference, but you can’t directly apply them.
What you really should look at isn’t “how much it rose after the last breakout,” but whether this breakout has net inflows into ETFs, whether OI is healthy, and whether related assets—like ETH and COIN—are moving strongly in sync.
A single moving average can’t carry the bull-market conclusion by itself.
Back then, #BTC was mainly driven by retail traders and offshore capital. Today, spot ETFs, institutional custody, and the options market are all influencing price.
Even if MA50 “reclaims” the same level, the underlying capital structure, leverage levels, and liquidity depth are completely different.
You can use historical patterns as reference, but you can’t directly apply them.
What you really should look at isn’t “how much it rose after the last breakout,” but whether this breakout has net inflows into ETFs, whether OI is healthy, and whether related assets—like ETH and COIN—are moving strongly in sync.
A single moving average can’t carry the bull-market conclusion by itself.
217
·
--
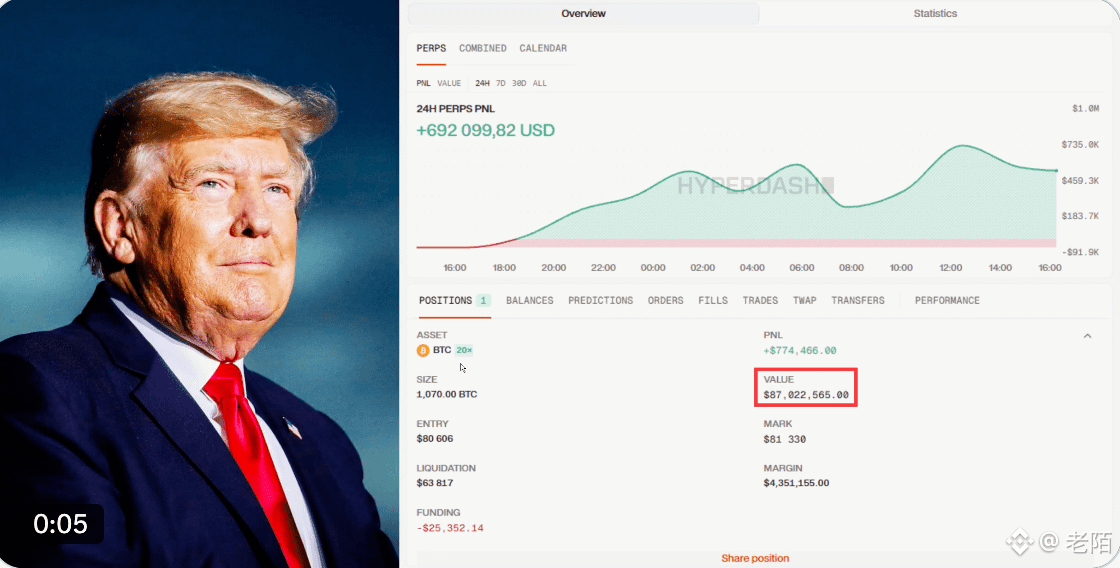
Don’t worry about whether this wallet “knows something.”
What you should ask is: why do messages like this always show up before votes?
Before major events, #BTC and #ETH are naturally prone to large directional bets.
Posting messages before the vote, stoking emotions, and attracting copy-traders is itself a trading strategy.
A $87 million long position might be a real position—or it might be a lure used to manufacture consensus.
If the market chases longs because of it, then the people who truly profit probably aren’t this wallet, but the ones who laid the groundwork early and are waiting for retail traders to lift the market.
Don’t worry about whether this wallet “knows something.”
What you should ask is: why do messages like this always show up before votes?
Before major events, #BTC and #ETH are naturally prone to large directional bets.
Posting messages before the vote, stoking emotions, and attracting copy-traders is itself a trading strategy.
A $87 million long position might be a real position—or it might be a lure used to manufacture consensus.
If the market chases longs because of it, then the people who truly profit probably aren’t this wallet, but the ones who laid the groundwork early and are waiting for retail traders to lift the market.
What you should ask is: why do messages like this always show up before votes?
Before major events, #BTC and #ETH are naturally prone to large directional bets.
Posting messages before the vote, stoking emotions, and attracting copy-traders is itself a trading strategy.
A $87 million long position might be a real position—or it might be a lure used to manufacture consensus.
If the market chases longs because of it, then the people who truly profit probably aren’t this wallet, but the ones who laid the groundwork early and are waiting for retail traders to lift the market.
253
·
--
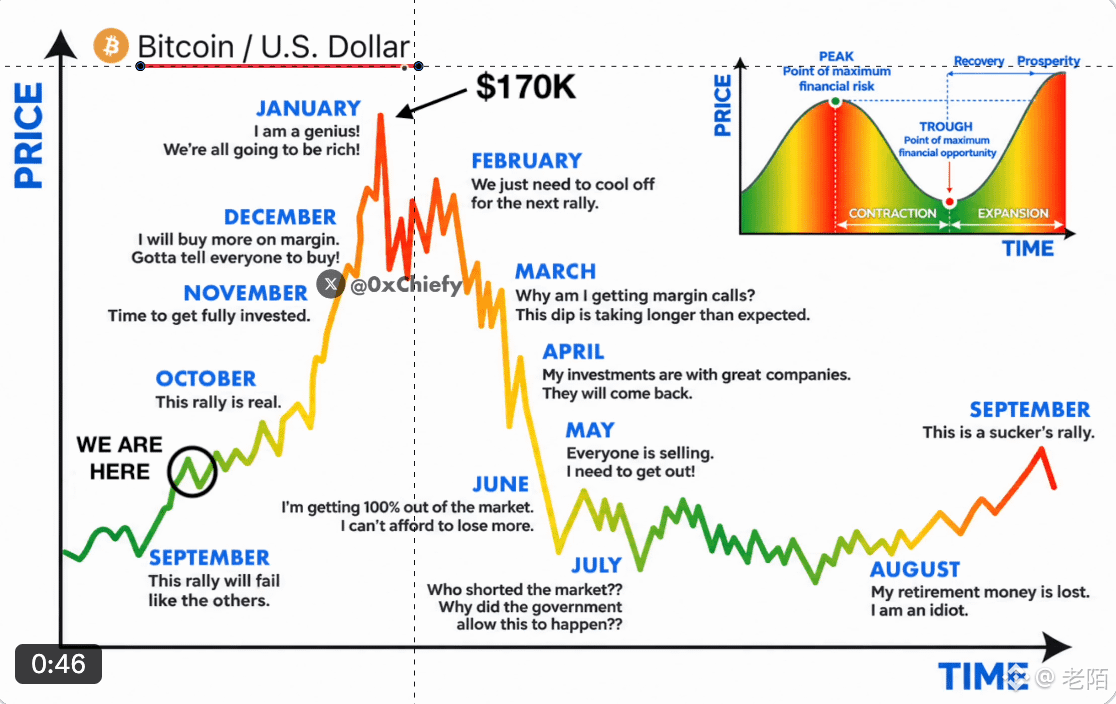
Reconstruct the 2026–2027 timeline using past cycle rhythms, but overlooking one key change: the market structure is already different.
The spot ETF market, institutional custody, and the depth of the options market are all unlike the previous round.
The volatility of <#BTC > has been compressed, and the transmission path during the altcoin season has also changed.
The old “monthly patterns” may not be replicable anymore.
Rather than memorizing this table, it’s better to watch the real drivers: liquidity, funding rates, and net ETF inflows.
Reconstruct the 2026–2027 timeline using past cycle rhythms, but overlooking one key change: the market structure is already different.
The spot ETF market, institutional custody, and the depth of the options market are all unlike the previous round.
The volatility of <#BTC > has been compressed, and the transmission path during the altcoin season has also changed.
The old “monthly patterns” may not be replicable anymore.
Rather than memorizing this table, it’s better to watch the real drivers: liquidity, funding rates, and net ETF inflows.
The spot ETF market, institutional custody, and the depth of the options market are all unlike the previous round.
The volatility of <#BTC > has been compressed, and the transmission path during the altcoin season has also changed.
The old “monthly patterns” may not be replicable anymore.
Rather than memorizing this table, it’s better to watch the real drivers: liquidity, funding rates, and net ETF inflows.
1.1k
·
--
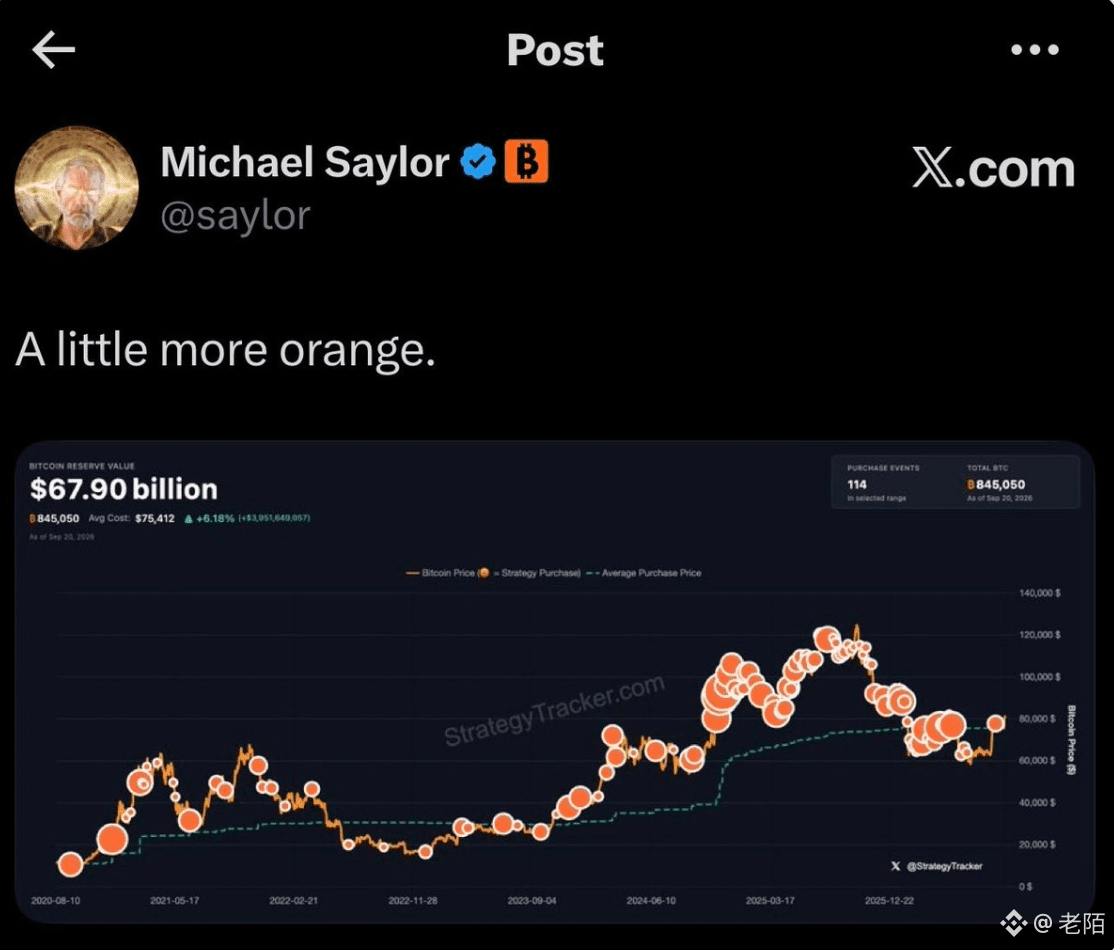
Saylor continues to buy #BTC . On the surface, it looks like a positive signal, but consider it from another angle: if an individual or a company keeps concentrating its holdings, it also means the risk is concentrated.
If in the future MicroStrategy is forced to reduce its holdings due to financing pressure, debt coming due, or changes in the market environment, then today’s “good news” that’s being interpreted as bullish could turn into tomorrow’s source of selling pressure.
The more you buy, the larger the potential pool of sellers in the future.
Saylor continues to buy #BTC . On the surface, it looks like a positive signal, but consider it from another angle: if an individual or a company keeps concentrating its holdings, it also means the risk is concentrated.
If in the future MicroStrategy is forced to reduce its holdings due to financing pressure, debt coming due, or changes in the market environment, then today’s “good news” that’s being interpreted as bullish could turn into tomorrow’s source of selling pressure.
The more you buy, the larger the potential pool of sellers in the future.
If in the future MicroStrategy is forced to reduce its holdings due to financing pressure, debt coming due, or changes in the market environment, then today’s “good news” that’s being interpreted as bullish could turn into tomorrow’s source of selling pressure.
The more you buy, the larger the potential pool of sellers in the future.
1
1
965
·
--
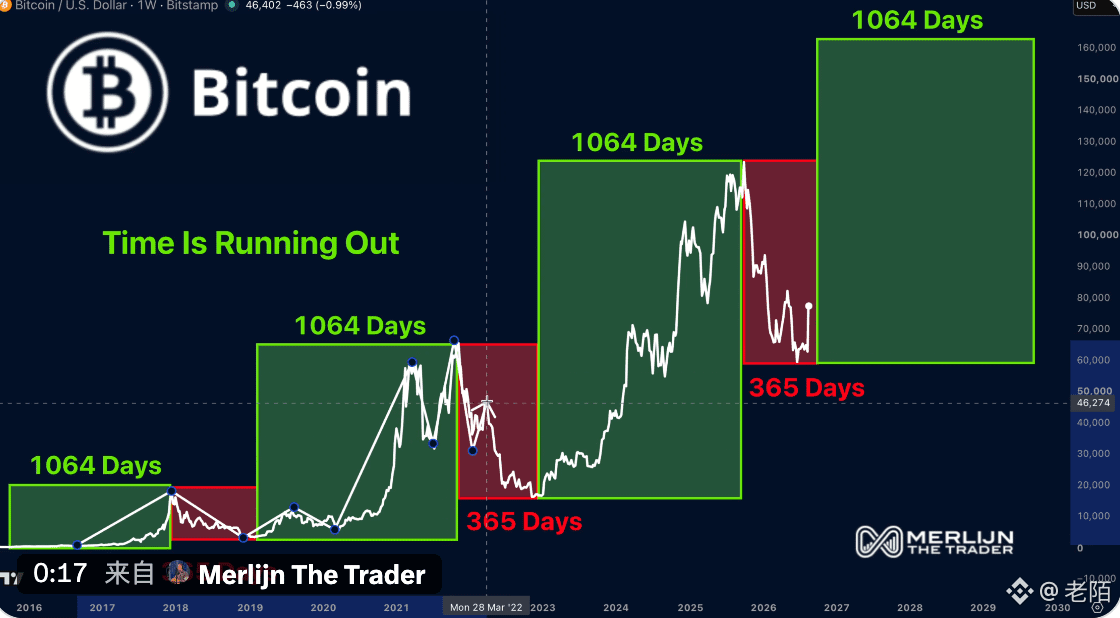
“The biggest bull market in history will kick off on Monday”——this kind of date-specific call is often the least reliable.
#BTC and #ETH’s major moves are never triggered according to a calendar, but driven by liquidity, capital inflows, and emotional resonance.
Treat “Monday” as a switch—more like manufacturing urgency than doing analysis.
“The biggest bull market in history will kick off on Monday”——this kind of date-specific call is often the least reliable.
#BTC and #ETH’s major moves are never triggered according to a calendar, but driven by liquidity, capital inflows, and emotional resonance.
Treat “Monday” as a switch—more like manufacturing urgency than doing analysis.
#BTC and #ETH’s major moves are never triggered according to a calendar, but driven by liquidity, capital inflows, and emotional resonance.
Treat “Monday” as a switch—more like manufacturing urgency than doing analysis.
1.3k
·
--
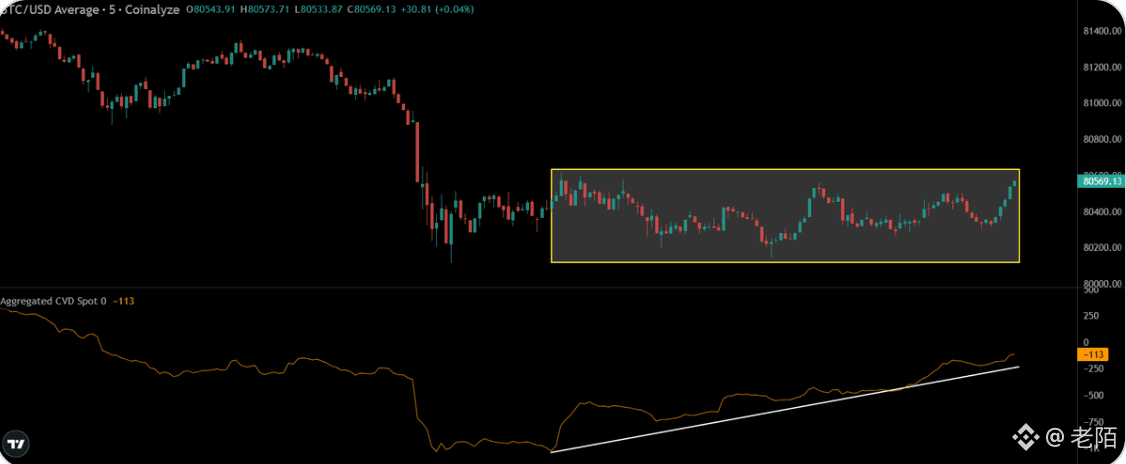
#BTC Sideways consolidation, spot CVD rising—it looks like accumulation.
But an increasing CVD could also just be passive buying being absorbed, rather than the main players actively building positions.
Sideways trading itself can mean either accumulation or distribution—the key is whether the price keeps getting repeatedly rejected near the upper end or the lower end of the range.
Drawing an “accumulation” conclusion from just one indicator can make you overlook another possibility: this could be placing bids in order to unload before a sell-off.
#BTC Sideways consolidation, spot CVD rising—it looks like accumulation.
But an increasing CVD could also just be passive buying being absorbed, rather than the main players actively building positions.
Sideways trading itself can mean either accumulation or distribution—the key is whether the price keeps getting repeatedly rejected near the upper end or the lower end of the range.
Drawing an “accumulation” conclusion from just one indicator can make you overlook another possibility: this could be placing bids in order to unload before a sell-off.
But an increasing CVD could also just be passive buying being absorbed, rather than the main players actively building positions.
Sideways trading itself can mean either accumulation or distribution—the key is whether the price keeps getting repeatedly rejected near the upper end or the lower end of the range.
Drawing an “accumulation” conclusion from just one indicator can make you overlook another possibility: this could be placing bids in order to unload before a sell-off.
1
747
·
--
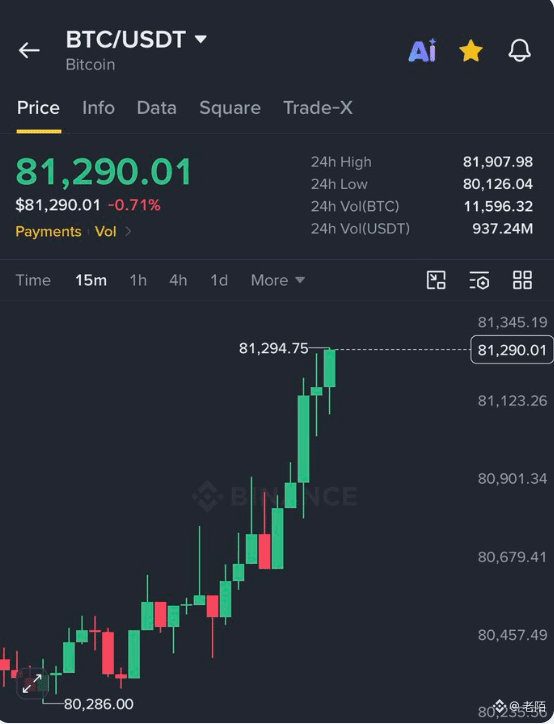
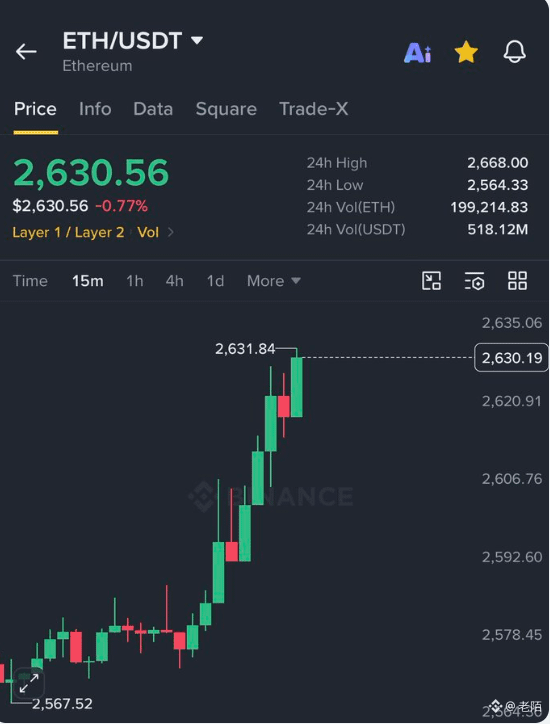
#BTC Reclaims Above $81,000—#ETH Recovers $2,600, while “WW3” is trending globally. This really does seem abnormal.
But interpreting the #BTC rally directly as a “new safe-haven asset” is a logical leap.
Gold is rising because it has been a crisis asset for thousands of years—driven by long-standing consensus. #BTC #BTC is moving only because of liquidity expectations, short covering, or leverage effects.
When wars escalate, risk assets often rise in the short term; that’s not rare historically—but that’s volatility, not safe-haven behavior.
The real test of safe-haven properties is whether it can hold up during a liquidity crisis, not whether it rallies faster than gold in a news-driven rebound.
#BTC Reclaims Above $81,000—#ETH Recovers $2,600, while “WW3” is trending globally. This really does seem abnormal.
But interpreting the #BTC rally directly as a “new safe-haven asset” is a logical leap.
Gold is rising because it has been a crisis asset for thousands of years—driven by long-standing consensus. #BTC #BTC is moving only because of liquidity expectations, short covering, or leverage effects.
When wars escalate, risk assets often rise in the short term; that’s not rare historically—but that’s volatility, not safe-haven behavior.
The real test of safe-haven properties is whether it can hold up during a liquidity crisis, not whether it rallies faster than gold in a news-driven rebound.
But interpreting the #BTC rally directly as a “new safe-haven asset” is a logical leap.
Gold is rising because it has been a crisis asset for thousands of years—driven by long-standing consensus. #BTC #BTC is moving only because of liquidity expectations, short covering, or leverage effects.
When wars escalate, risk assets often rise in the short term; that’s not rare historically—but that’s volatility, not safe-haven behavior.
The real test of safe-haven properties is whether it can hold up during a liquidity crisis, not whether it rallies faster than gold in a news-driven rebound.
796
·
--
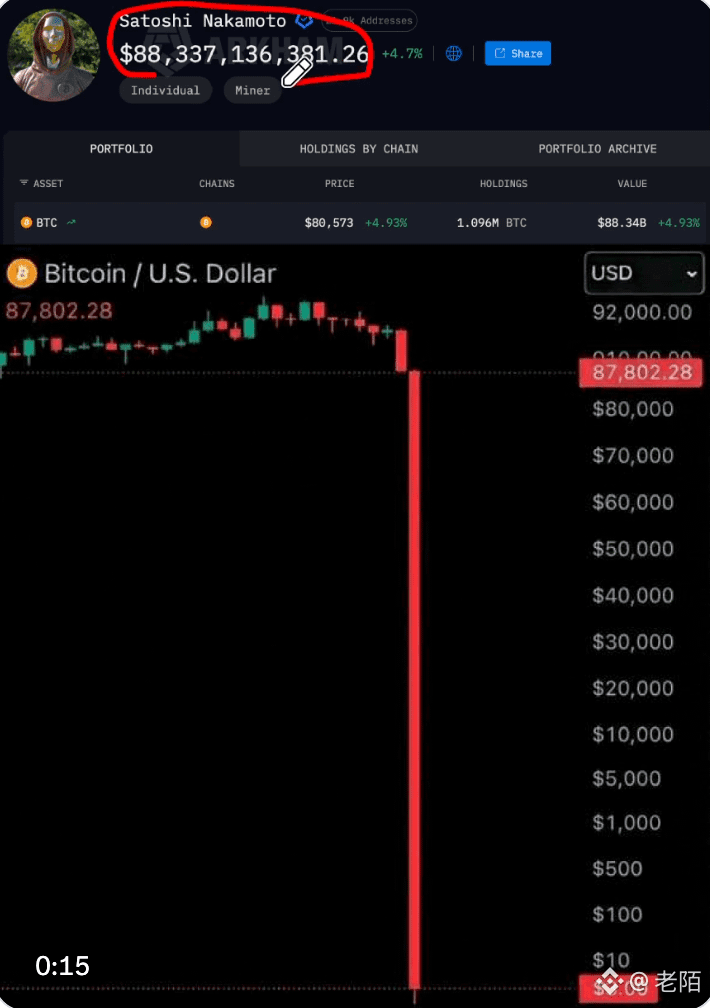
“Satoshi Nakamoto is already dead or has lost the private key, so institutions are willing to buy #BTC” — this inference sounds smooth, but the logic jumps too quickly.
Institutions may buy #BTC not necessarily because they’ve confirmed the creator can’t sell, but also because 1.1 million bitcoins account for only about 5% of the total supply, and market liquidity, ETF structure, and the derivatives market can already absorb such a shock.
Also, if it really were the CIA or an intelligence agency that created it, why hasn’t any credible evidence emerged in over a decade? Conspiracy theories are easy to talk about, but hard to verify.
“Satoshi Nakamoto is already dead or has lost the private key, so institutions are willing to buy #BTC” — this inference sounds smooth, but the logic jumps too quickly.
Institutions may buy #BTC not necessarily because they’ve confirmed the creator can’t sell, but also because 1.1 million bitcoins account for only about 5% of the total supply, and market liquidity, ETF structure, and the derivatives market can already absorb such a shock.
Also, if it really were the CIA or an intelligence agency that created it, why hasn’t any credible evidence emerged in over a decade? Conspiracy theories are easy to talk about, but hard to verify.
Institutions may buy #BTC not necessarily because they’ve confirmed the creator can’t sell, but also because 1.1 million bitcoins account for only about 5% of the total supply, and market liquidity, ETF structure, and the derivatives market can already absorb such a shock.
Also, if it really were the CIA or an intelligence agency that created it, why hasn’t any credible evidence emerged in over a decade? Conspiracy theories are easy to talk about, but hard to verify.
1
3.7k
·
--
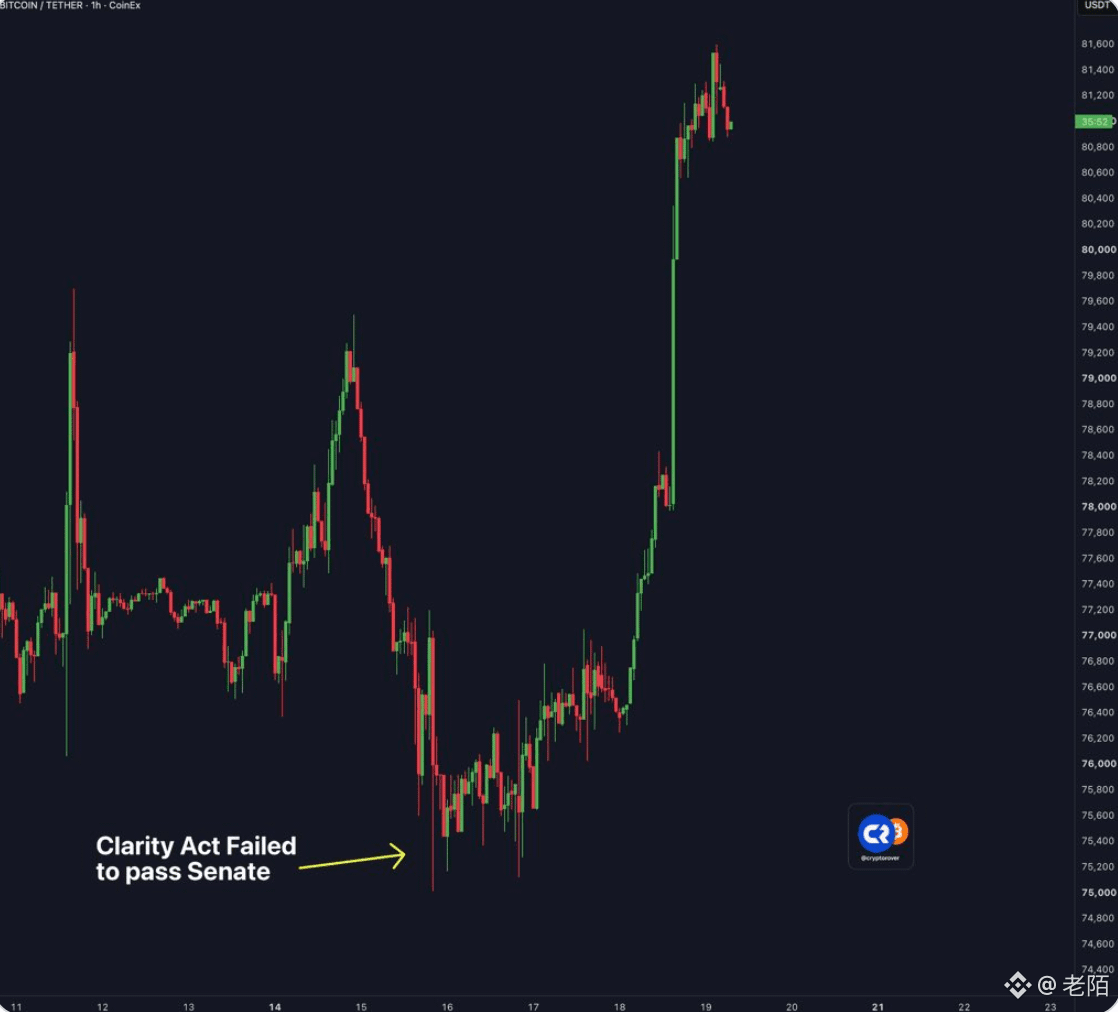
Clarity Act didn’t pass the Senate; #BTC instead jumped more than $6,000—looks undeniably strong.
But don’t rush to take “bad news doesn’t drop” as pure strength.
In the short term, the rally could also be short-covering, “buy-the-rumor, sell-the-fact” once the news hits, or a liquidity-driven move.
Clarity Act didn’t pass the Senate; #BTC instead jumped more than $6,000—looks undeniably strong.
But don’t rush to take “bad news doesn’t drop” as pure strength.
In the short term, the rally could also be short-covering, “buy-the-rumor, sell-the-fact” once the news hits, or a liquidity-driven move.
But don’t rush to take “bad news doesn’t drop” as pure strength.
In the short term, the rally could also be short-covering, “buy-the-rumor, sell-the-fact” once the news hits, or a liquidity-driven move.
588
·
--
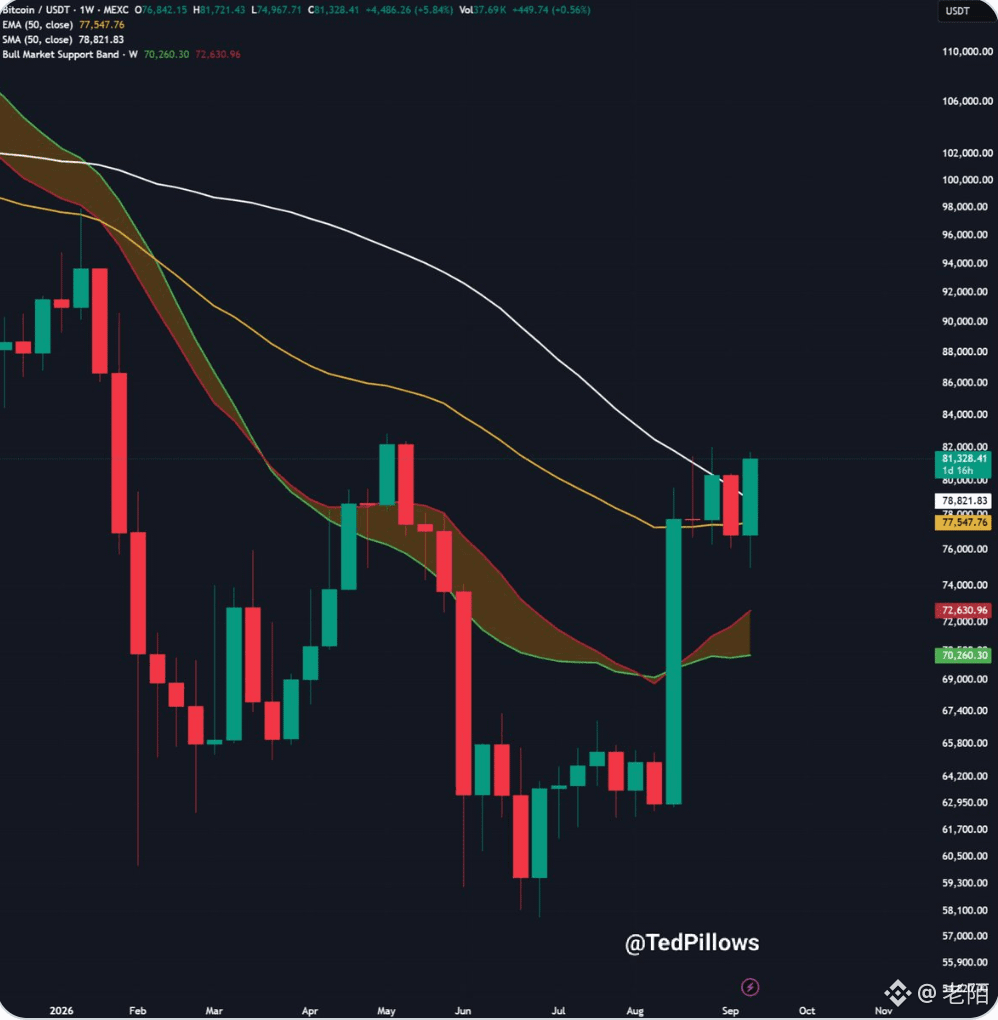
It looks like #BTC is finally about to move above the 50-week moving average.
Now, all Bitcoin needs is to break through $83,000 to confirm that the bottom has already formed.
It looks like #BTC is finally about to move above the 50-week moving average.
Now, all Bitcoin needs is to break through $83,000 to confirm that the bottom has already formed.
Now, all Bitcoin needs is to break through $83,000 to confirm that the bottom has already formed.
445
·
--
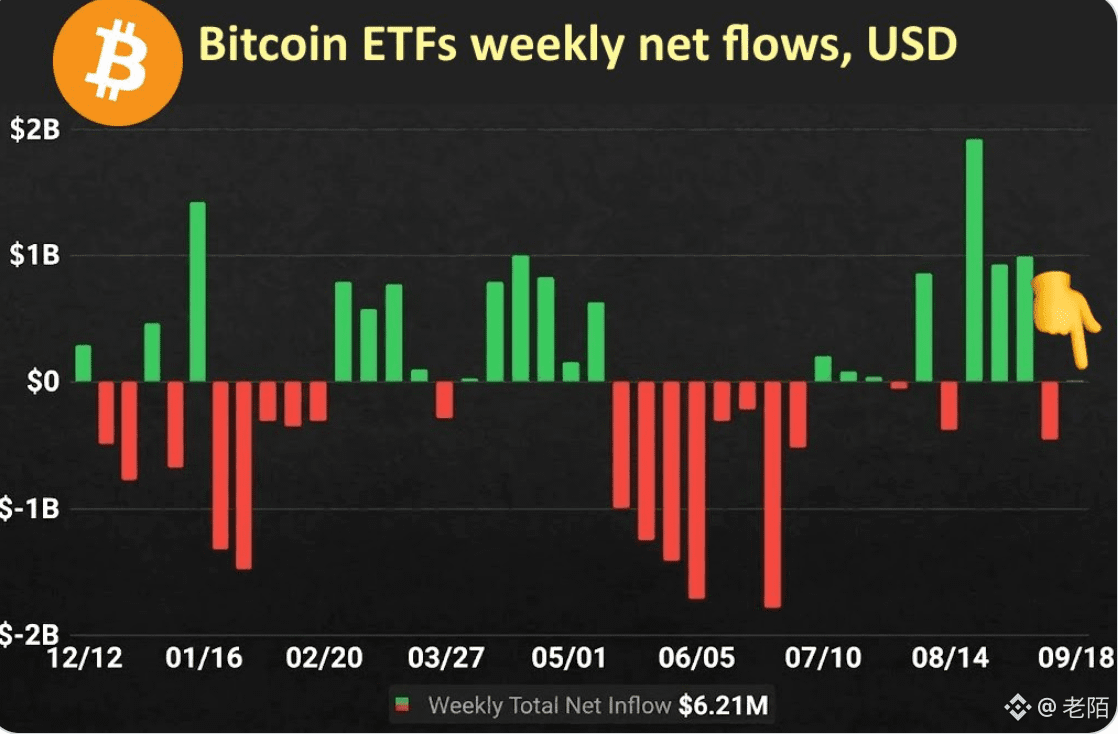
Latest updates: #BTC ETF bought $433 million on Friday. 👀
Weekly inflows are nearly flat.
#BTC is already ready to keep climbing!
Latest updates: #BTC ETF bought $433 million on Friday. 👀
Weekly inflows are nearly flat.
#BTC is already ready to keep climbing!
Weekly inflows are nearly flat.
#BTC is already ready to keep climbing!
454
·
--
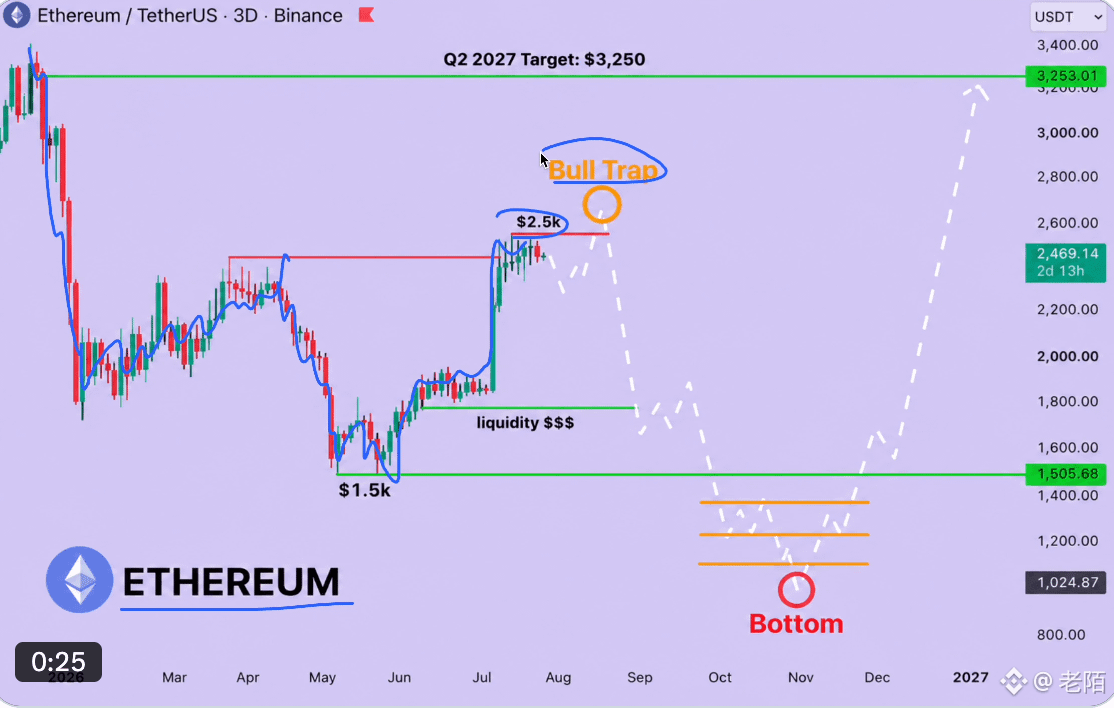
🚨 “#ETH needs to set up the most ruthless bull trap of 2026” — this kind of headline is very eye-catching.
The roadmap is also very specific: a false breakout at $2,670, a bloodbath at $1,800, surrender at $1,500—then the market bottoms sometime in 11–12 months, and finally it reclaims $1,600 to kick off the bull market.
But the more this kind of script is pinpointed to exact price levels, the more you have to be careful.
#ETH might fall to $1,500, or it might not even get there; $2,670 might be a trap, or it might be the breakout starting point.
What you really should do isn’t memorizing these numbers—it’s figuring out: what if $2,670 directly turns into a new trend? What if $1,800 is the bottom?
You can be bearish, but don’t treat someone else’s roadmap as your own risk management.
🚨 “#ETH needs to set up the most ruthless bull trap of 2026” — this kind of headline is very eye-catching.
The roadmap is also very specific: a false breakout at $2,670, a bloodbath at $1,800, surrender at $1,500—then the market bottoms sometime in 11–12 months, and finally it reclaims $1,600 to kick off the bull market.
But the more this kind of script is pinpointed to exact price levels, the more you have to be careful.
#ETH might fall to $1,500, or it might not even get there; $2,670 might be a trap, or it might be the breakout starting point.
What you really should do isn’t memorizing these numbers—it’s figuring out: what if $2,670 directly turns into a new trend? What if $1,800 is the bottom?
You can be bearish, but don’t treat someone else’s roadmap as your own risk management.
The roadmap is also very specific: a false breakout at $2,670, a bloodbath at $1,800, surrender at $1,500—then the market bottoms sometime in 11–12 months, and finally it reclaims $1,600 to kick off the bull market.
But the more this kind of script is pinpointed to exact price levels, the more you have to be careful.
#ETH might fall to $1,500, or it might not even get there; $2,670 might be a trap, or it might be the breakout starting point.
What you really should do isn’t memorizing these numbers—it’s figuring out: what if $2,670 directly turns into a new trend? What if $1,800 is the bottom?
You can be bearish, but don’t treat someone else’s roadmap as your own risk management.
2
3.4k
·
--
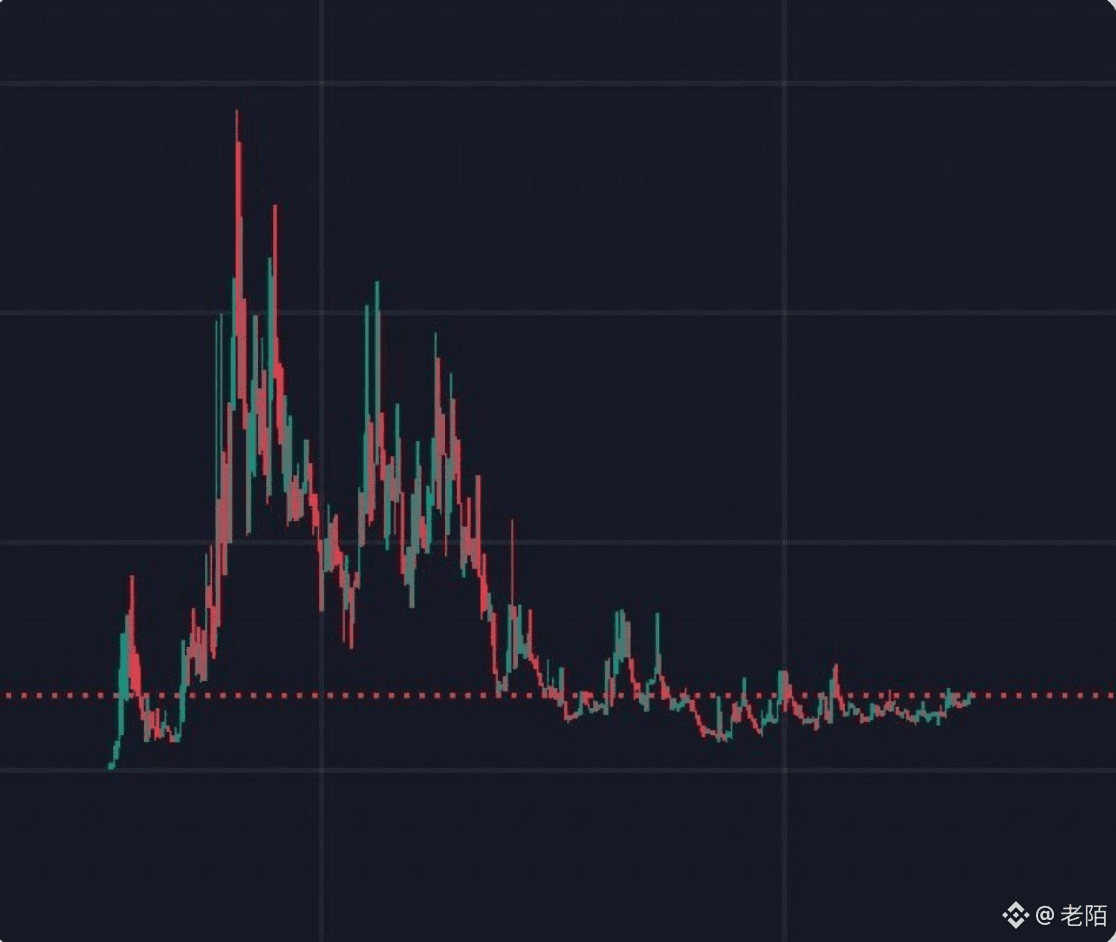
Buy images in this pattern.
Sell it in October.
In the future, you’ll thank me.
Buy images in this pattern.
Sell it in October.
In the future, you’ll thank me.
Sell it in October.
In the future, you’ll thank me.
830
·
--
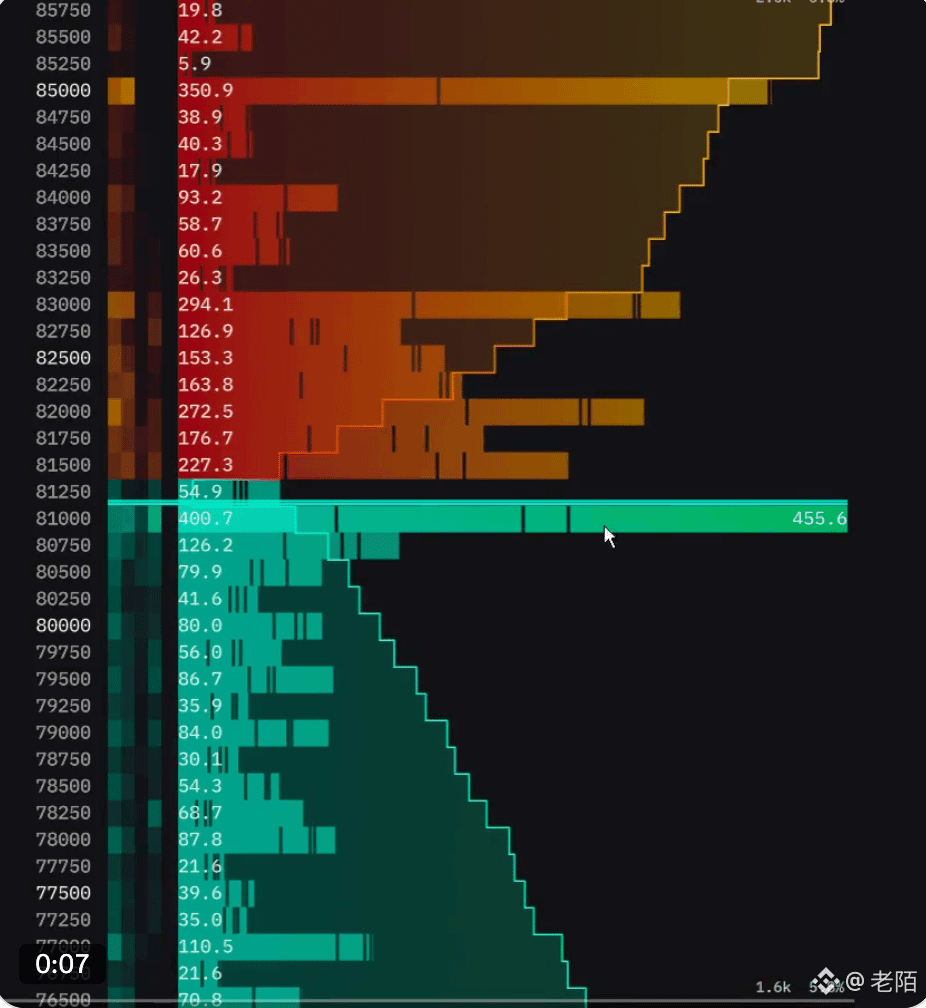
🚨 The script for #BTC next week is already very clear.
Now #BTC is roughly around $81K, with a large amount of liquidity stacked above it.
So I think it will move upward first in the short term.
First target: $82K.
Then there’s a bigger liquidity cluster around $83K–$85K.
The largest visible lump of liquidity is right around $85K.
That liquidity hasn’t been touched yet.
So my base assumption is very simple:
Push it upward first. Sweep the liquidity. Then see how it reacts.
I’m watching #BTC take out $82K–$85K next week!
🚨 The script for #BTC next week is already very clear.
Now #BTC is roughly around $81K, with a large amount of liquidity stacked above it.
So I think it will move upward first in the short term.
First target: $82K.
Then there’s a bigger liquidity cluster around $83K–$85K.
The largest visible lump of liquidity is right around $85K.
That liquidity hasn’t been touched yet.
So my base assumption is very simple:
Push it upward first. Sweep the liquidity. Then see how it reacts.
I’m watching #BTC take out $82K–$85K next week!
Now #BTC is roughly around $81K, with a large amount of liquidity stacked above it.
So I think it will move upward first in the short term.
First target: $82K.
Then there’s a bigger liquidity cluster around $83K–$85K.
The largest visible lump of liquidity is right around $85K.
That liquidity hasn’t been touched yet.
So my base assumption is very simple:
Push it upward first. Sweep the liquidity. Then see how it reacts.
I’m watching #BTC take out $82K–$85K next week!
1
4.9k
·
--
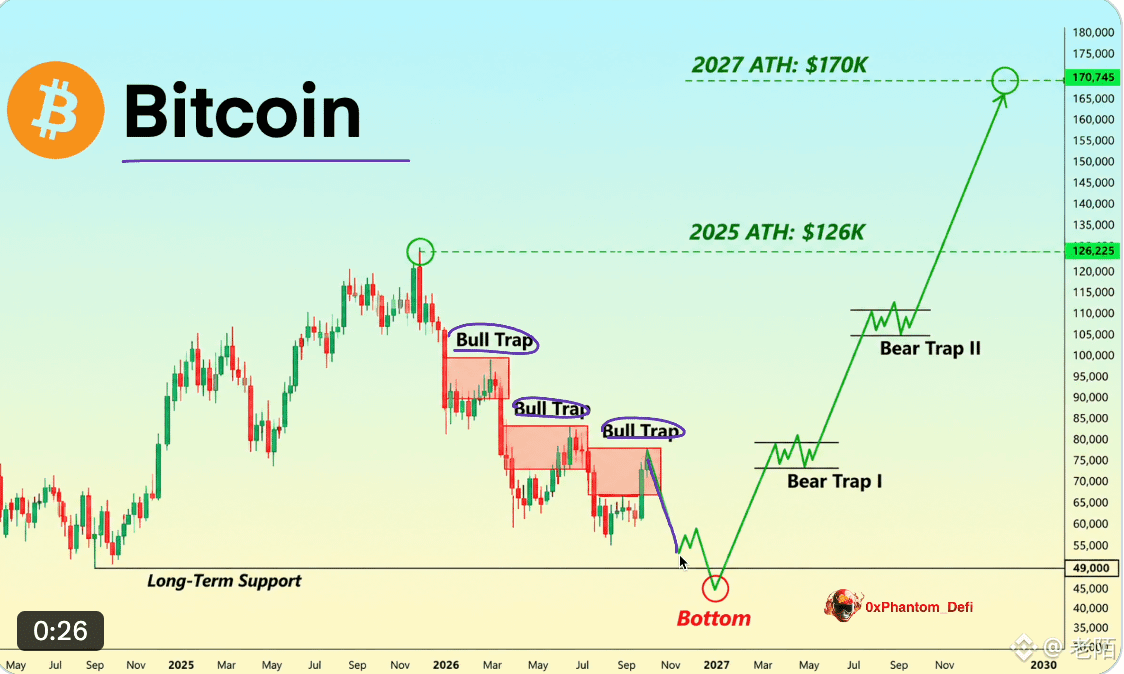
🚨 Warning-style thread is back again: #BTC’s “last long trap.”
This narrative is very compelling: first pump a bit, then crash—turning points mapped with precision: $82K → $74K → $68K → $57K → $49K.
But the problem is: the more precisely a route map is drawn, the more likely it’s retrospective attribution rather than a forward-looking prediction.
#BTC might drop, or it might not. What you should really do isn’t memorize these price levels, but think it through: what if $82K isn’t a trap but a breakout? What if $49K never comes?
Going bearish is fine, but don’t take someone else’s roadmap and treat it as your own risk management.
🚨 Warning-style thread is back again: #BTC’s “last long trap.”
This narrative is very compelling: first pump a bit, then crash—turning points mapped with precision: $82K → $74K → $68K → $57K → $49K.
But the problem is: the more precisely a route map is drawn, the more likely it’s retrospective attribution rather than a forward-looking prediction.
#BTC might drop, or it might not. What you should really do isn’t memorize these price levels, but think it through: what if $82K isn’t a trap but a breakout? What if $49K never comes?
Going bearish is fine, but don’t take someone else’s roadmap and treat it as your own risk management.
This narrative is very compelling: first pump a bit, then crash—turning points mapped with precision: $82K → $74K → $68K → $57K → $49K.
But the problem is: the more precisely a route map is drawn, the more likely it’s retrospective attribution rather than a forward-looking prediction.
#BTC might drop, or it might not. What you should really do isn’t memorize these price levels, but think it through: what if $82K isn’t a trap but a breakout? What if $49K never comes?
Going bearish is fine, but don’t take someone else’s roadmap and treat it as your own risk management.
1
1.4k
·
--
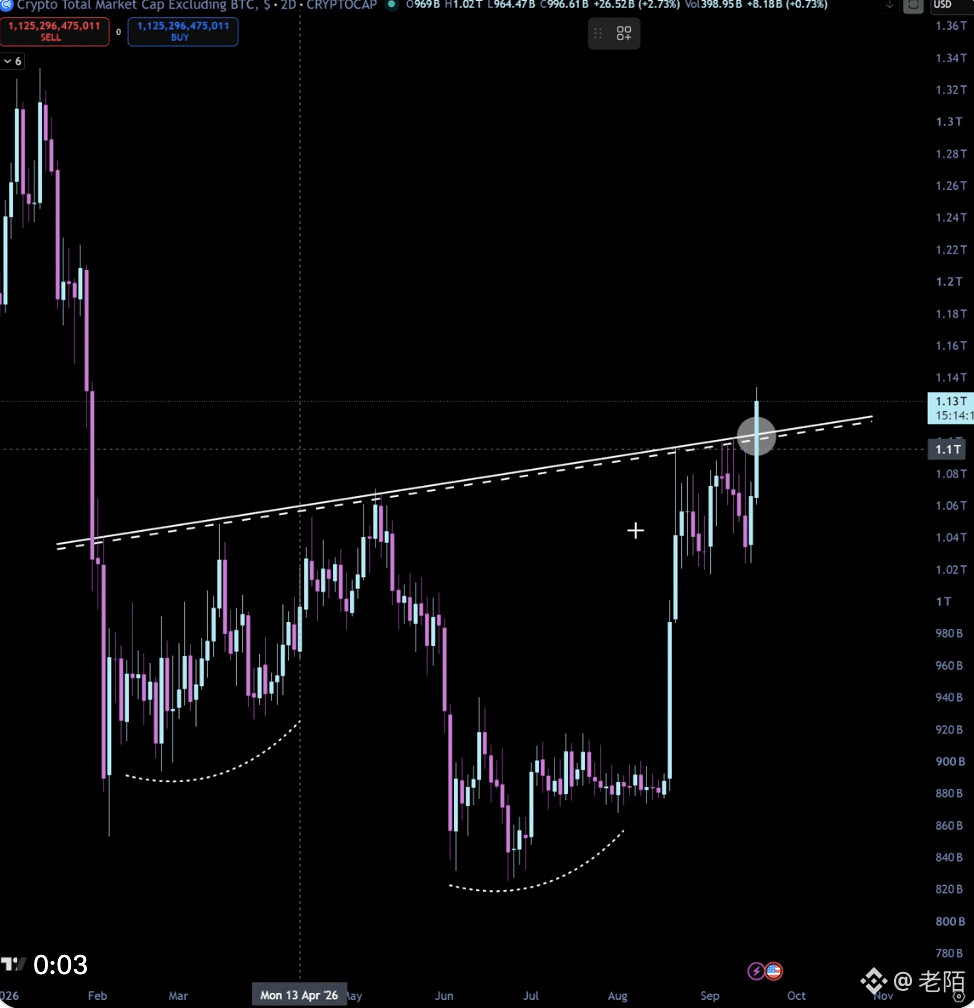
The next round of gains in the crypto market has already begun.
#BTC, #ETH, and #SOL are all getting restless.
The next round of gains in the crypto market has already begun.
#BTC, #ETH, and #SOL are all getting restless.
#BTC, #ETH, and #SOL are all getting restless.
405
Log in to explore more content
Join global crypto users on Binance Square
⚡️ Get latest and useful information about crypto.
💬 Trusted by the world’s largest crypto exchange.
👍 Discover real insights from verified creators.
Email / Phone number
Trending Topics
NEARRisesNearly80%InAWeek
3,019 views
279 Discussing
#nearrisesnearly80%inaweek 🚨 NEAR EXPLODED 80% - WHAT’S BEHIND THE MOVE?
NEAR has become one of the performing L1 altcoins jumping nearly 80% in just one week. Its now trading around $4.15 to $4.30. This isn’t a price spike. There’s real momentum behind the move.
🔹 NEAR Intents has processed than $29 billion in cumulative volume. That’s a signal that developers and users are actively building on the platform.
🔹 DeFi activity is growing and total value locked or TVL is rising steadily. That means more money is flowing into NEAR-based protocols.
🔹 A major development is the partnership with Hyperliquid bringing perpetuals infrastructure. That opens up possibilities for advanced trading on NEAR.
🔹. The AI + cross-chain narrative is gaining serious traction. The idea of integrating AI tools with blockchain across networks is a deal. And NEAR is positioning itself at the center of it.
📊 Key levels to watch:
$4.00–$4.30 → This is the pivot zone. If price holds here it could support upside.
$4.70–$5.00 → This is a resistance zone. Breaking through could signal a move to $5.
$3.30–$3.50 → This is key support. If selling pressure builds we may see a drop down to this level.
After an 80% rally markets often get choppy. There’s a chance we’ll see some profit-taking soon. The big question is whether NEAR can hold the zone and turn it into support. Or if we’ll see a pullback first.
👀 So what do you think? Is NEAR headed toward $5. Will it take a step back before the next leg up?
#Near #crypto #Khan62 #altcoins
$NEAR
$BTC $SOL
Khan 62
·2 Likes
·3k views
MultiversXPlansHardForkRecovery
4,051 views
290 Discussing
CircleLaunchesInstitutionalBTCBackedBorrowing
6,710 views
429 Discussing