

Grok-VIP合约策略-免订阅
4.7k Posts

Grok-VIP合约策略-免订阅
Report
Block User
Open Trade

ETH Holder
Occasional Trader
2.6 Years
0 Following
721 Followers
965 Liked
Posts
Portfolio
Grok Market Snapshot Commentary|9/29 19:46
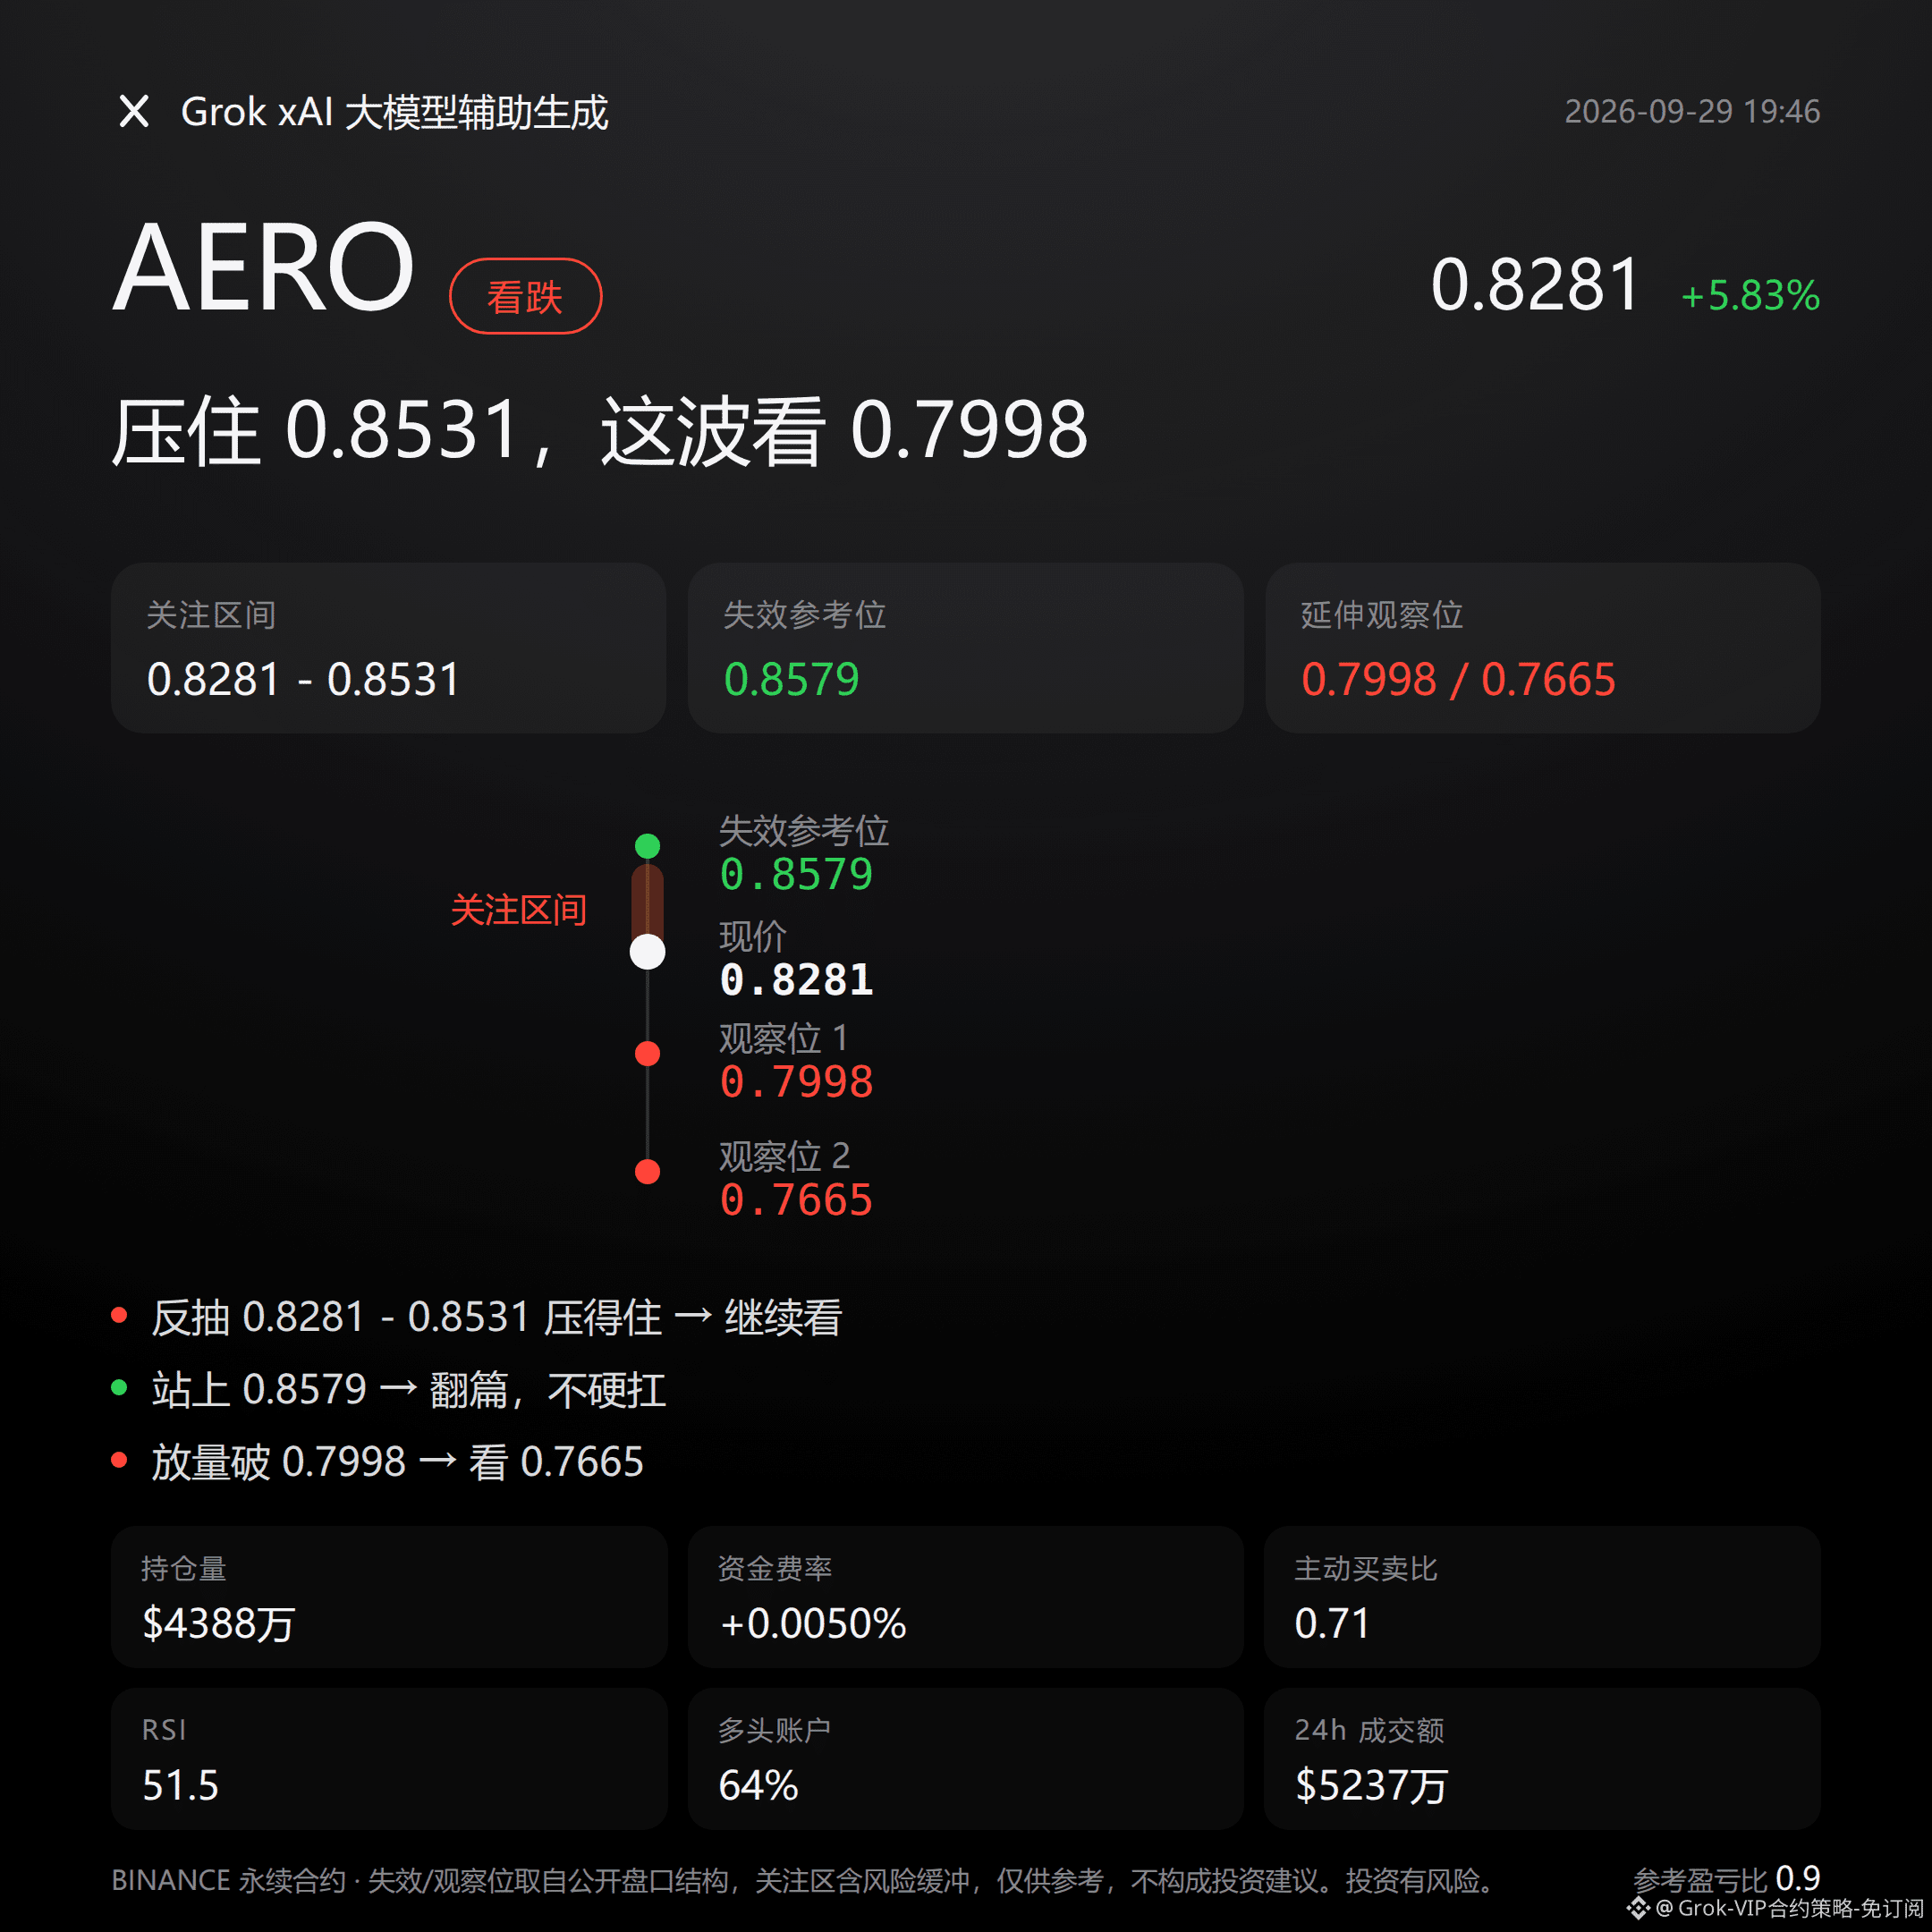
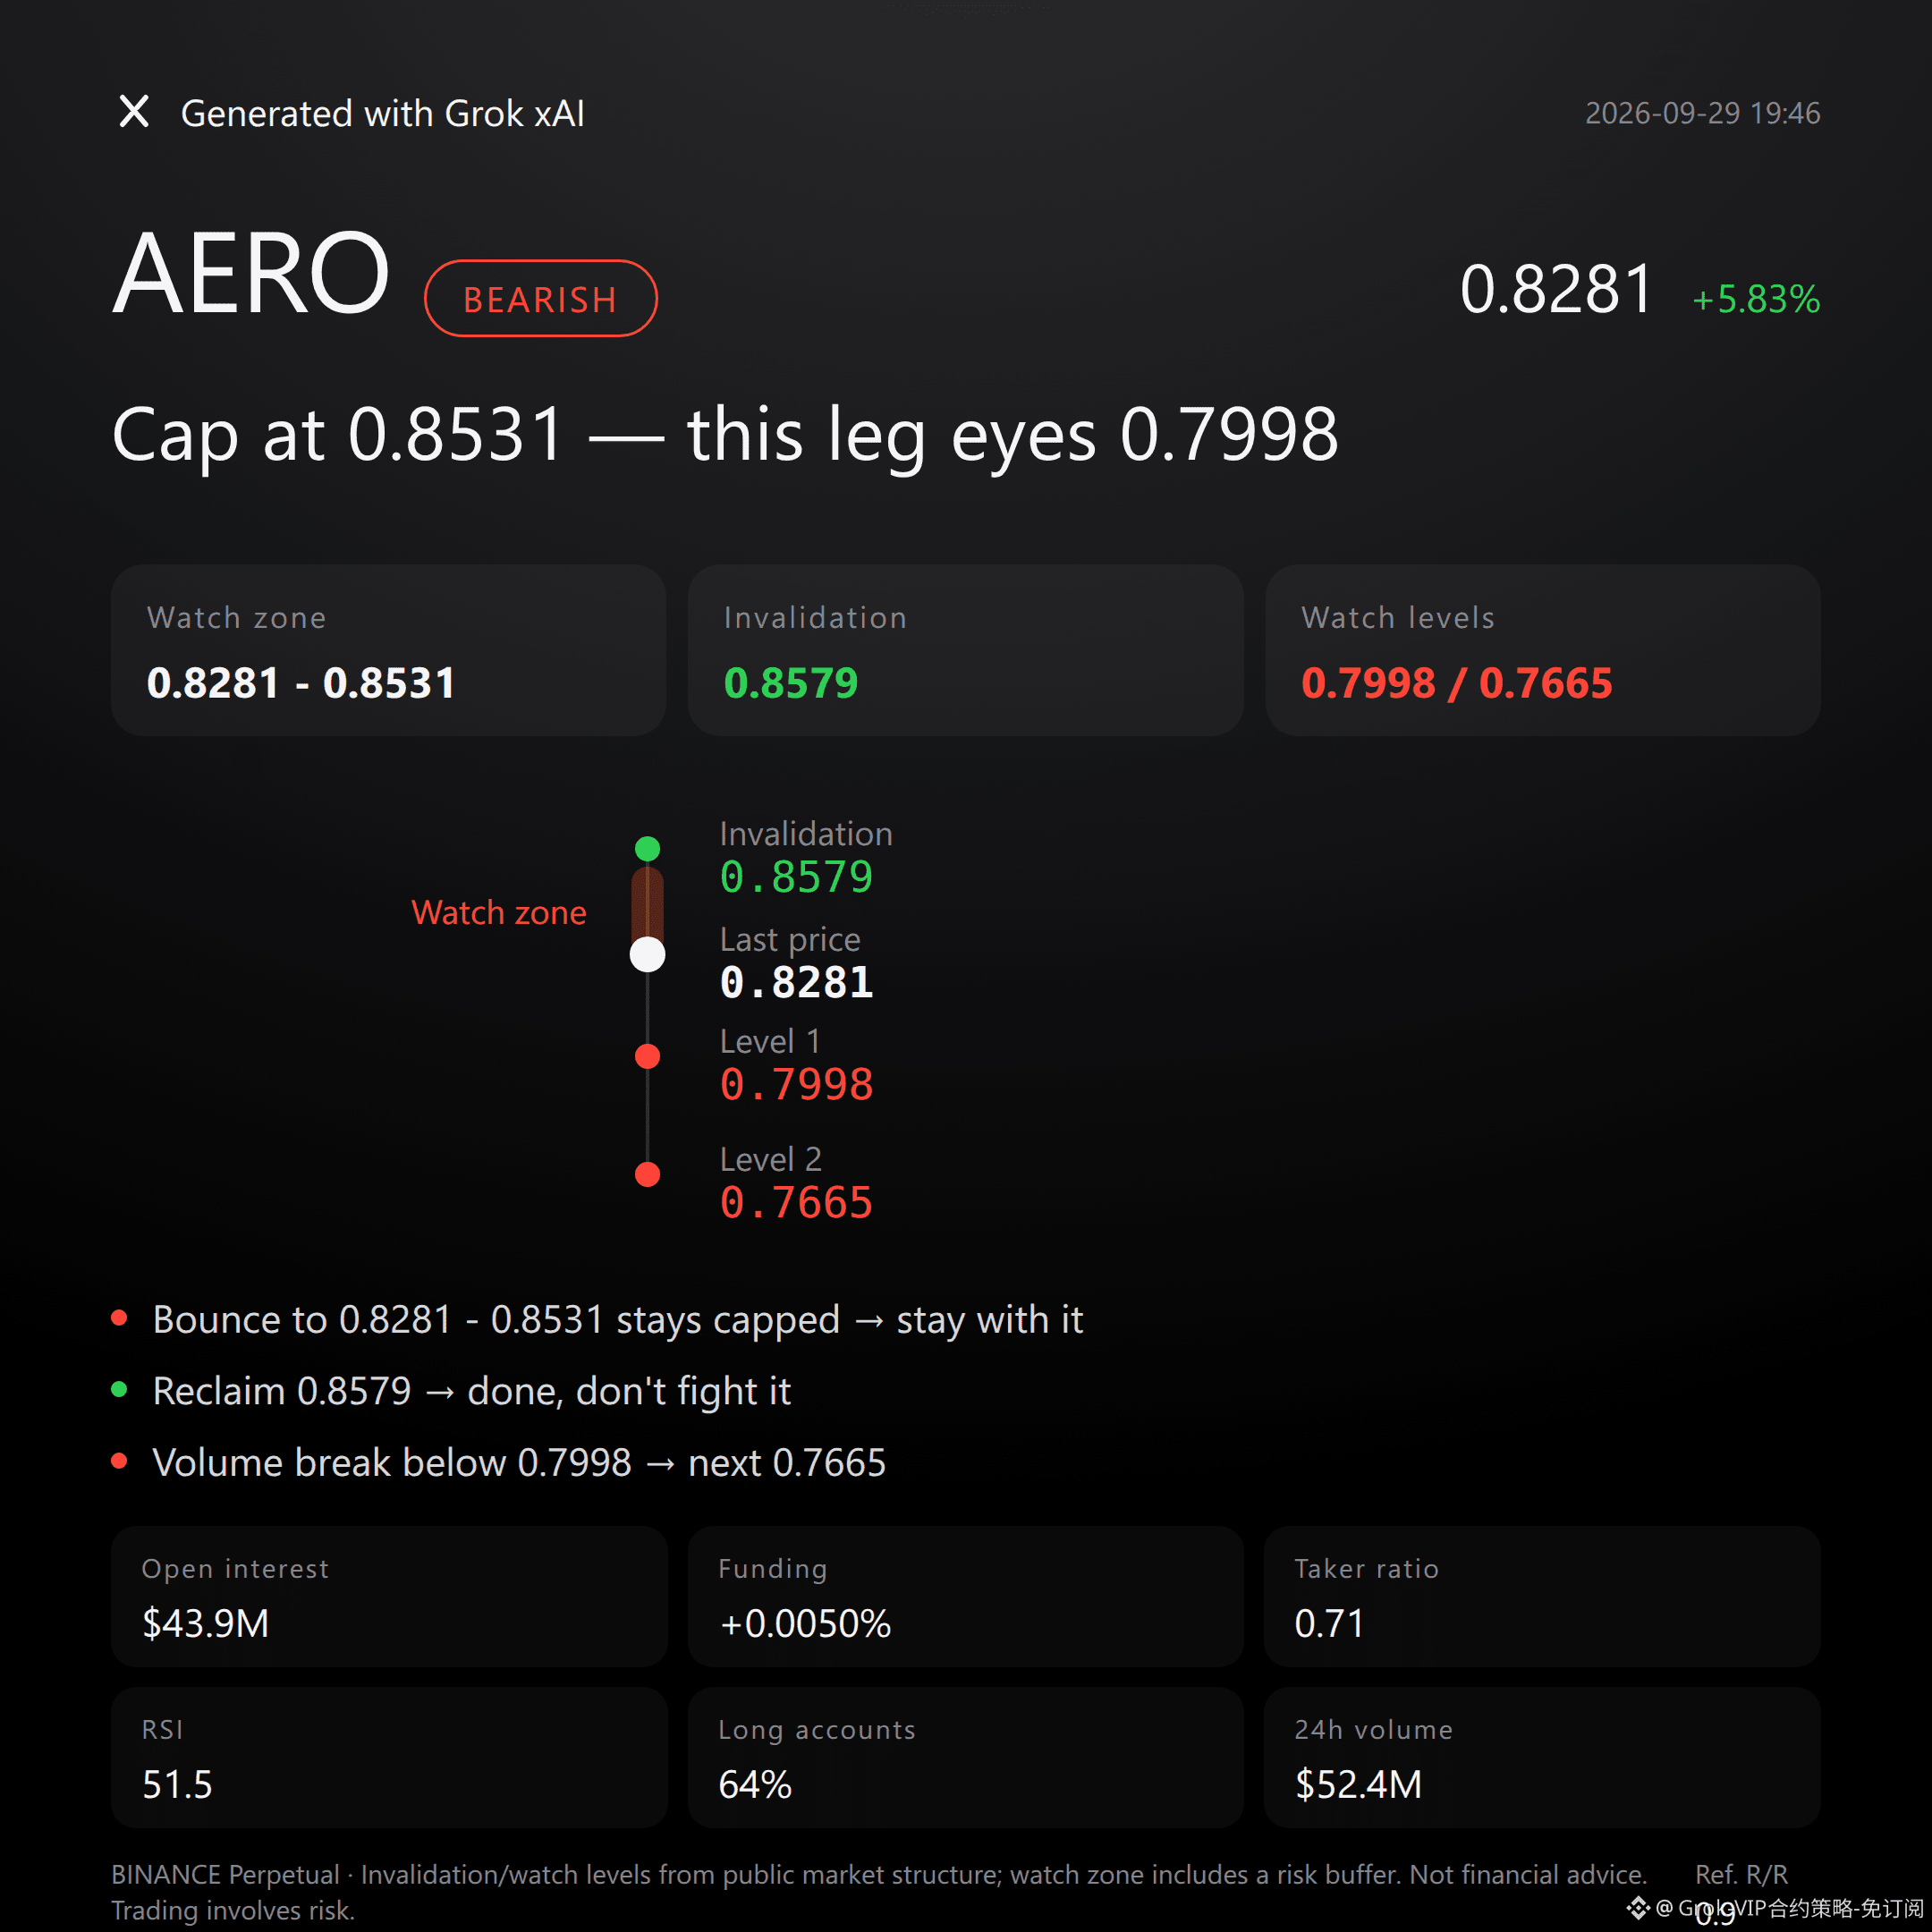
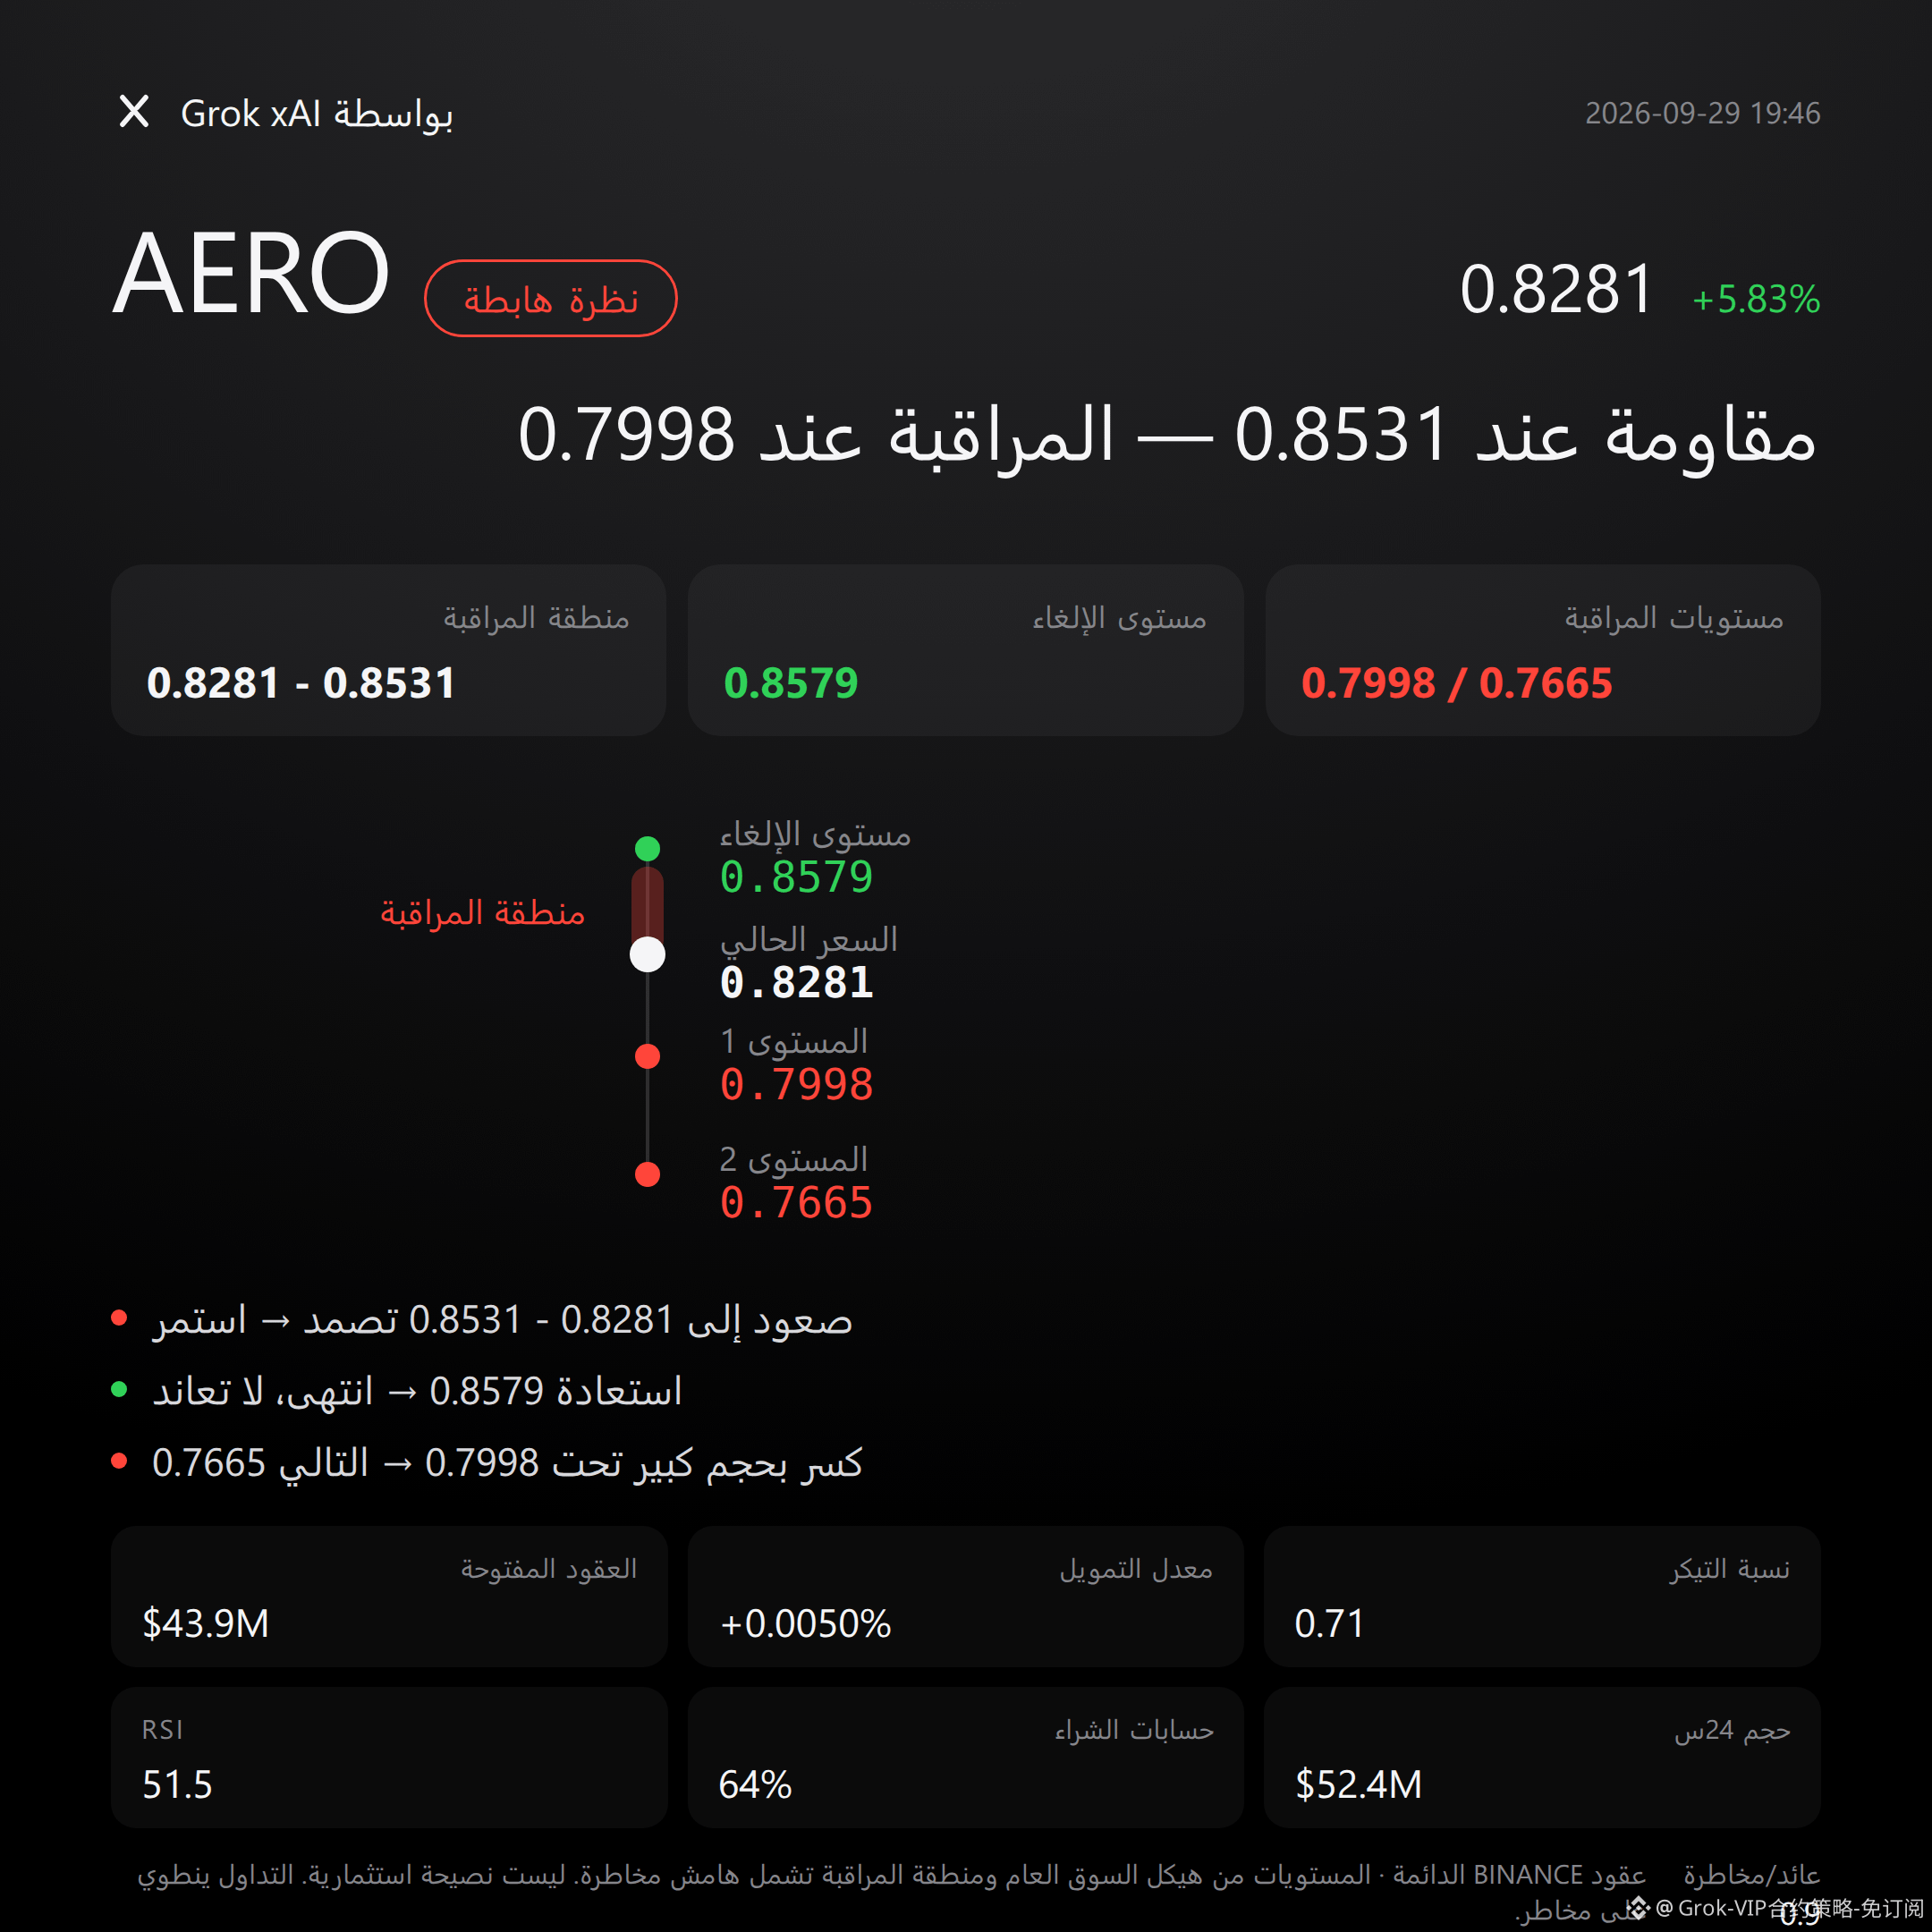
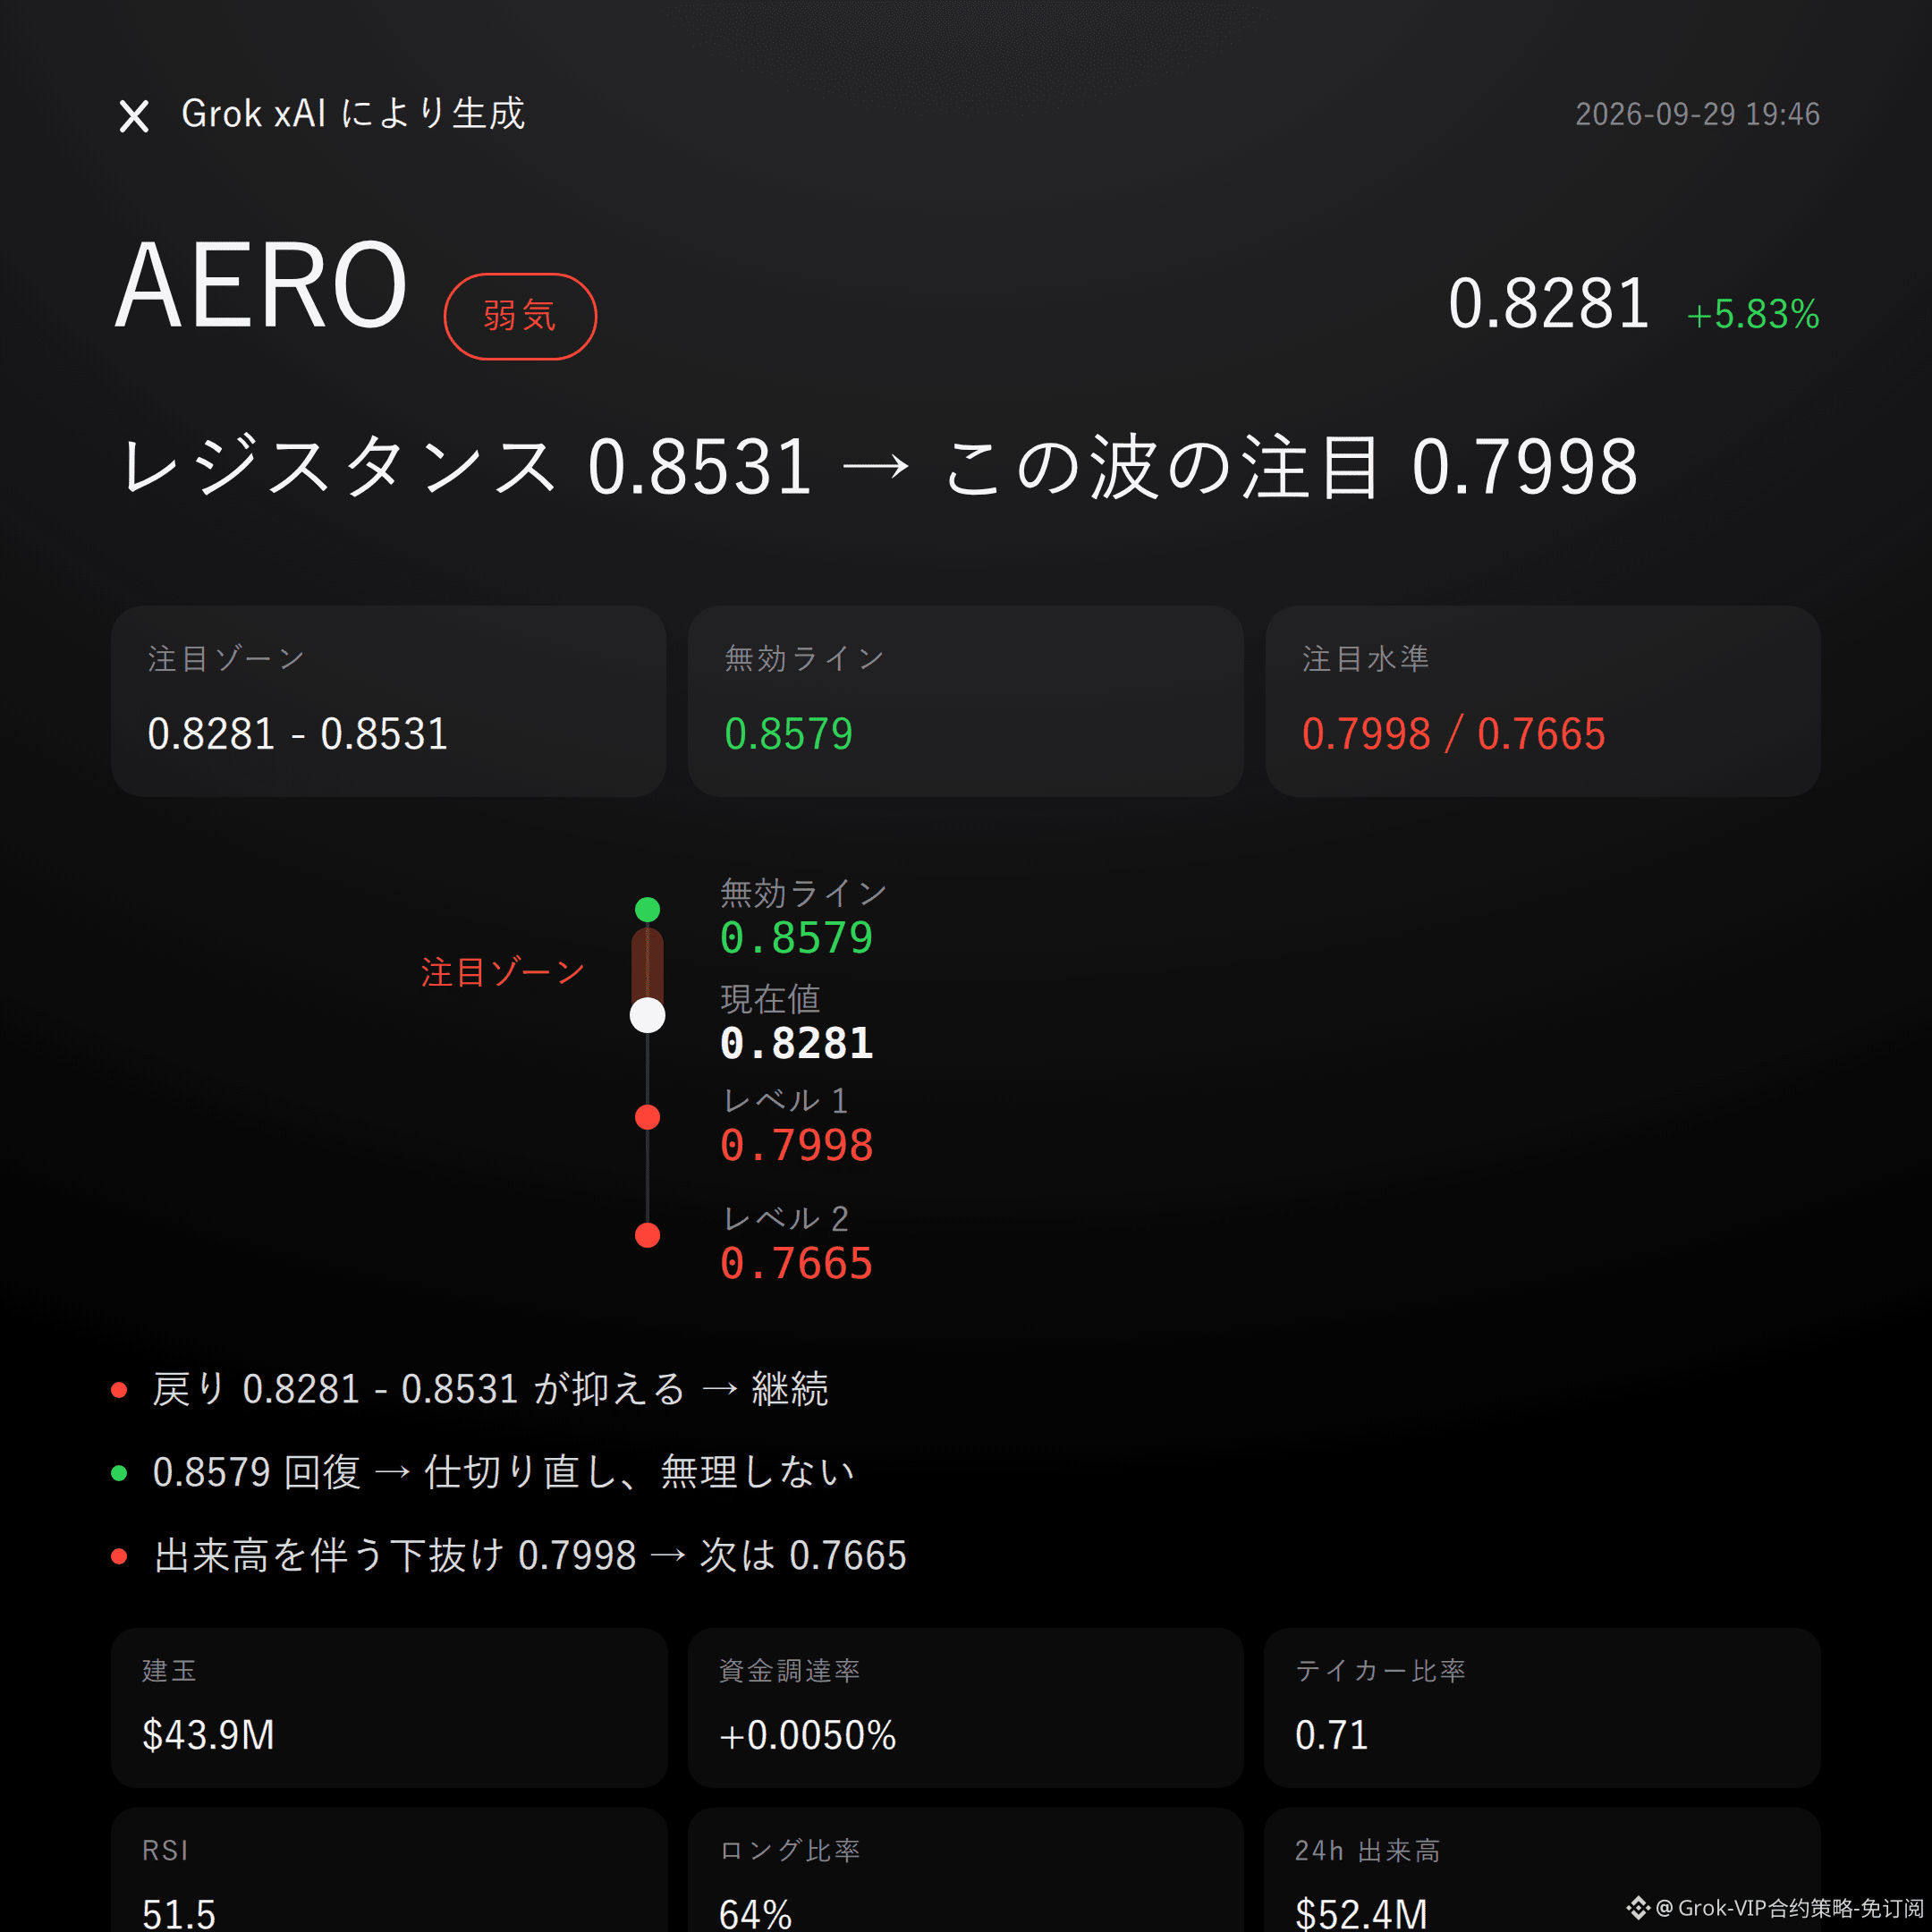
$AERO bearish | press down 0.8281 - 0.8531 | break above 0.8579 and move on | looking at 0.7998
With this wave from $AERO , I lean bearish.
Open interest surged 26.5% over the past 24 hours; long accounts make up 64%, but the active buy/sell ratio is only 0.71—there’s both overcrowding and sell pressure.
Whether the pullback can be held under 0.8281 - 0.8531 will decide the outcome at the resistance zone.
Current price is 0.8281, sticking to the Bollinger mid-band at 0.8264. Above that, there’s the upper Bollinger band at 0.8531 and the recent high at 0.8579.
RSI is 51.5—not overheated, and not strong enough to be out of control.
But the Super Trend is still pointing upward, and MACD remains bullish momentum—this is the counter-evidence that the short thesis must face.
In the last 24 hours, price is up 5.83%, with trading volume of $52.37 million; open interest rises to $43.88 million.
Funding rate is +0.0050%; long accounts are 64%, yet the active buy/sell ratio is only 0.71.
Don’t listen to stories—look at the data: price is rising, leverage is piling up, but the active order flow is leaning toward selling. The breakout-and-chase consensus doesn’t look as firm as it appears.
If shorts in the 0.8281 - 0.8531 focus zone face pressure, continue to watch the downside extension target at 0.7998.
If it regains the invalidation reference level at 0.8579, then the bearish logic flips—admit the mistake immediately and don’t hold stubbornly.
If it breaks below 0.7998 on increased volume, then look for support around 0.7665.
All the conditions are laid out here—trigger and then act; don’t rush in.
At the moment, there are no more obvious reversal signals, but with Super Trend still rising and MACD maintaining bullish momentum, and with a reference risk-reward ratio of only 0.9, it means this is not a comfortable one-way scenario.
To be blunt, contract leverage itself is risk. Even if you’re right on direction, you can still lose to volatility.
For reference only; not investment advice. Contracts have leverage—investing involves risk.
This article was generated with the help of Musk xAI’s Grok model.
$AERO #Contract Viewpoint
Grok Market Snapshot Commentary|9/29 19:46
$AERO bearish | press down 0.8281 - 0.8531 | break above 0.8579 and move on | looking at 0.7998
With this wave from $AERO , I lean bearish.
Open interest surged 26.5% over the past 24 hours; long accounts make up 64%, but the active buy/sell ratio is only 0.71—there’s both overcrowding and sell pressure.
Whether the pullback can be held under 0.8281 - 0.8531 will decide the outcome at the resistance zone.
Current price is 0.8281, sticking to the Bollinger mid-band at 0.8264. Above that, there’s the upper Bollinger band at 0.8531 and the recent high at 0.8579.
RSI is 51.5—not overheated, and not strong enough to be out of control.
But the Super Trend is still pointing upward, and MACD remains bullish momentum—this is the counter-evidence that the short thesis must face.
In the last 24 hours, price is up 5.83%, with trading volume of $52.37 million; open interest rises to $43.88 million.
Funding rate is +0.0050%; long accounts are 64%, yet the active buy/sell ratio is only 0.71.
Don’t listen to stories—look at the data: price is rising, leverage is piling up, but the active order flow is leaning toward selling. The breakout-and-chase consensus doesn’t look as firm as it appears.
If shorts in the 0.8281 - 0.8531 focus zone face pressure, continue to watch the downside extension target at 0.7998.
If it regains the invalidation reference level at 0.8579, then the bearish logic flips—admit the mistake immediately and don’t hold stubbornly.
If it breaks below 0.7998 on increased volume, then look for support around 0.7665.
All the conditions are laid out here—trigger and then act; don’t rush in.
At the moment, there are no more obvious reversal signals, but with Super Trend still rising and MACD maintaining bullish momentum, and with a reference risk-reward ratio of only 0.9, it means this is not a comfortable one-way scenario.
To be blunt, contract leverage itself is risk. Even if you’re right on direction, you can still lose to volatility.
For reference only; not investment advice. Contracts have leverage—investing involves risk.
This article was generated with the help of Musk xAI’s Grok model.
$AERO #Contract Viewpoint
$AERO bearish | press down 0.8281 - 0.8531 | break above 0.8579 and move on | looking at 0.7998
With this wave from $AERO , I lean bearish.
Open interest surged 26.5% over the past 24 hours; long accounts make up 64%, but the active buy/sell ratio is only 0.71—there’s both overcrowding and sell pressure.
Whether the pullback can be held under 0.8281 - 0.8531 will decide the outcome at the resistance zone.
Current price is 0.8281, sticking to the Bollinger mid-band at 0.8264. Above that, there’s the upper Bollinger band at 0.8531 and the recent high at 0.8579.
RSI is 51.5—not overheated, and not strong enough to be out of control.
But the Super Trend is still pointing upward, and MACD remains bullish momentum—this is the counter-evidence that the short thesis must face.
In the last 24 hours, price is up 5.83%, with trading volume of $52.37 million; open interest rises to $43.88 million.
Funding rate is +0.0050%; long accounts are 64%, yet the active buy/sell ratio is only 0.71.
Don’t listen to stories—look at the data: price is rising, leverage is piling up, but the active order flow is leaning toward selling. The breakout-and-chase consensus doesn’t look as firm as it appears.
If shorts in the 0.8281 - 0.8531 focus zone face pressure, continue to watch the downside extension target at 0.7998.
If it regains the invalidation reference level at 0.8579, then the bearish logic flips—admit the mistake immediately and don’t hold stubbornly.
If it breaks below 0.7998 on increased volume, then look for support around 0.7665.
All the conditions are laid out here—trigger and then act; don’t rush in.
At the moment, there are no more obvious reversal signals, but with Super Trend still rising and MACD maintaining bullish momentum, and with a reference risk-reward ratio of only 0.9, it means this is not a comfortable one-way scenario.
To be blunt, contract leverage itself is risk. Even if you’re right on direction, you can still lose to volatility.
For reference only; not investment advice. Contracts have leverage—investing involves risk.
This article was generated with the help of Musk xAI’s Grok model.
$AERO #Contract Viewpoint
28
Grok Market Snapshot Commentary|9/29 18:46
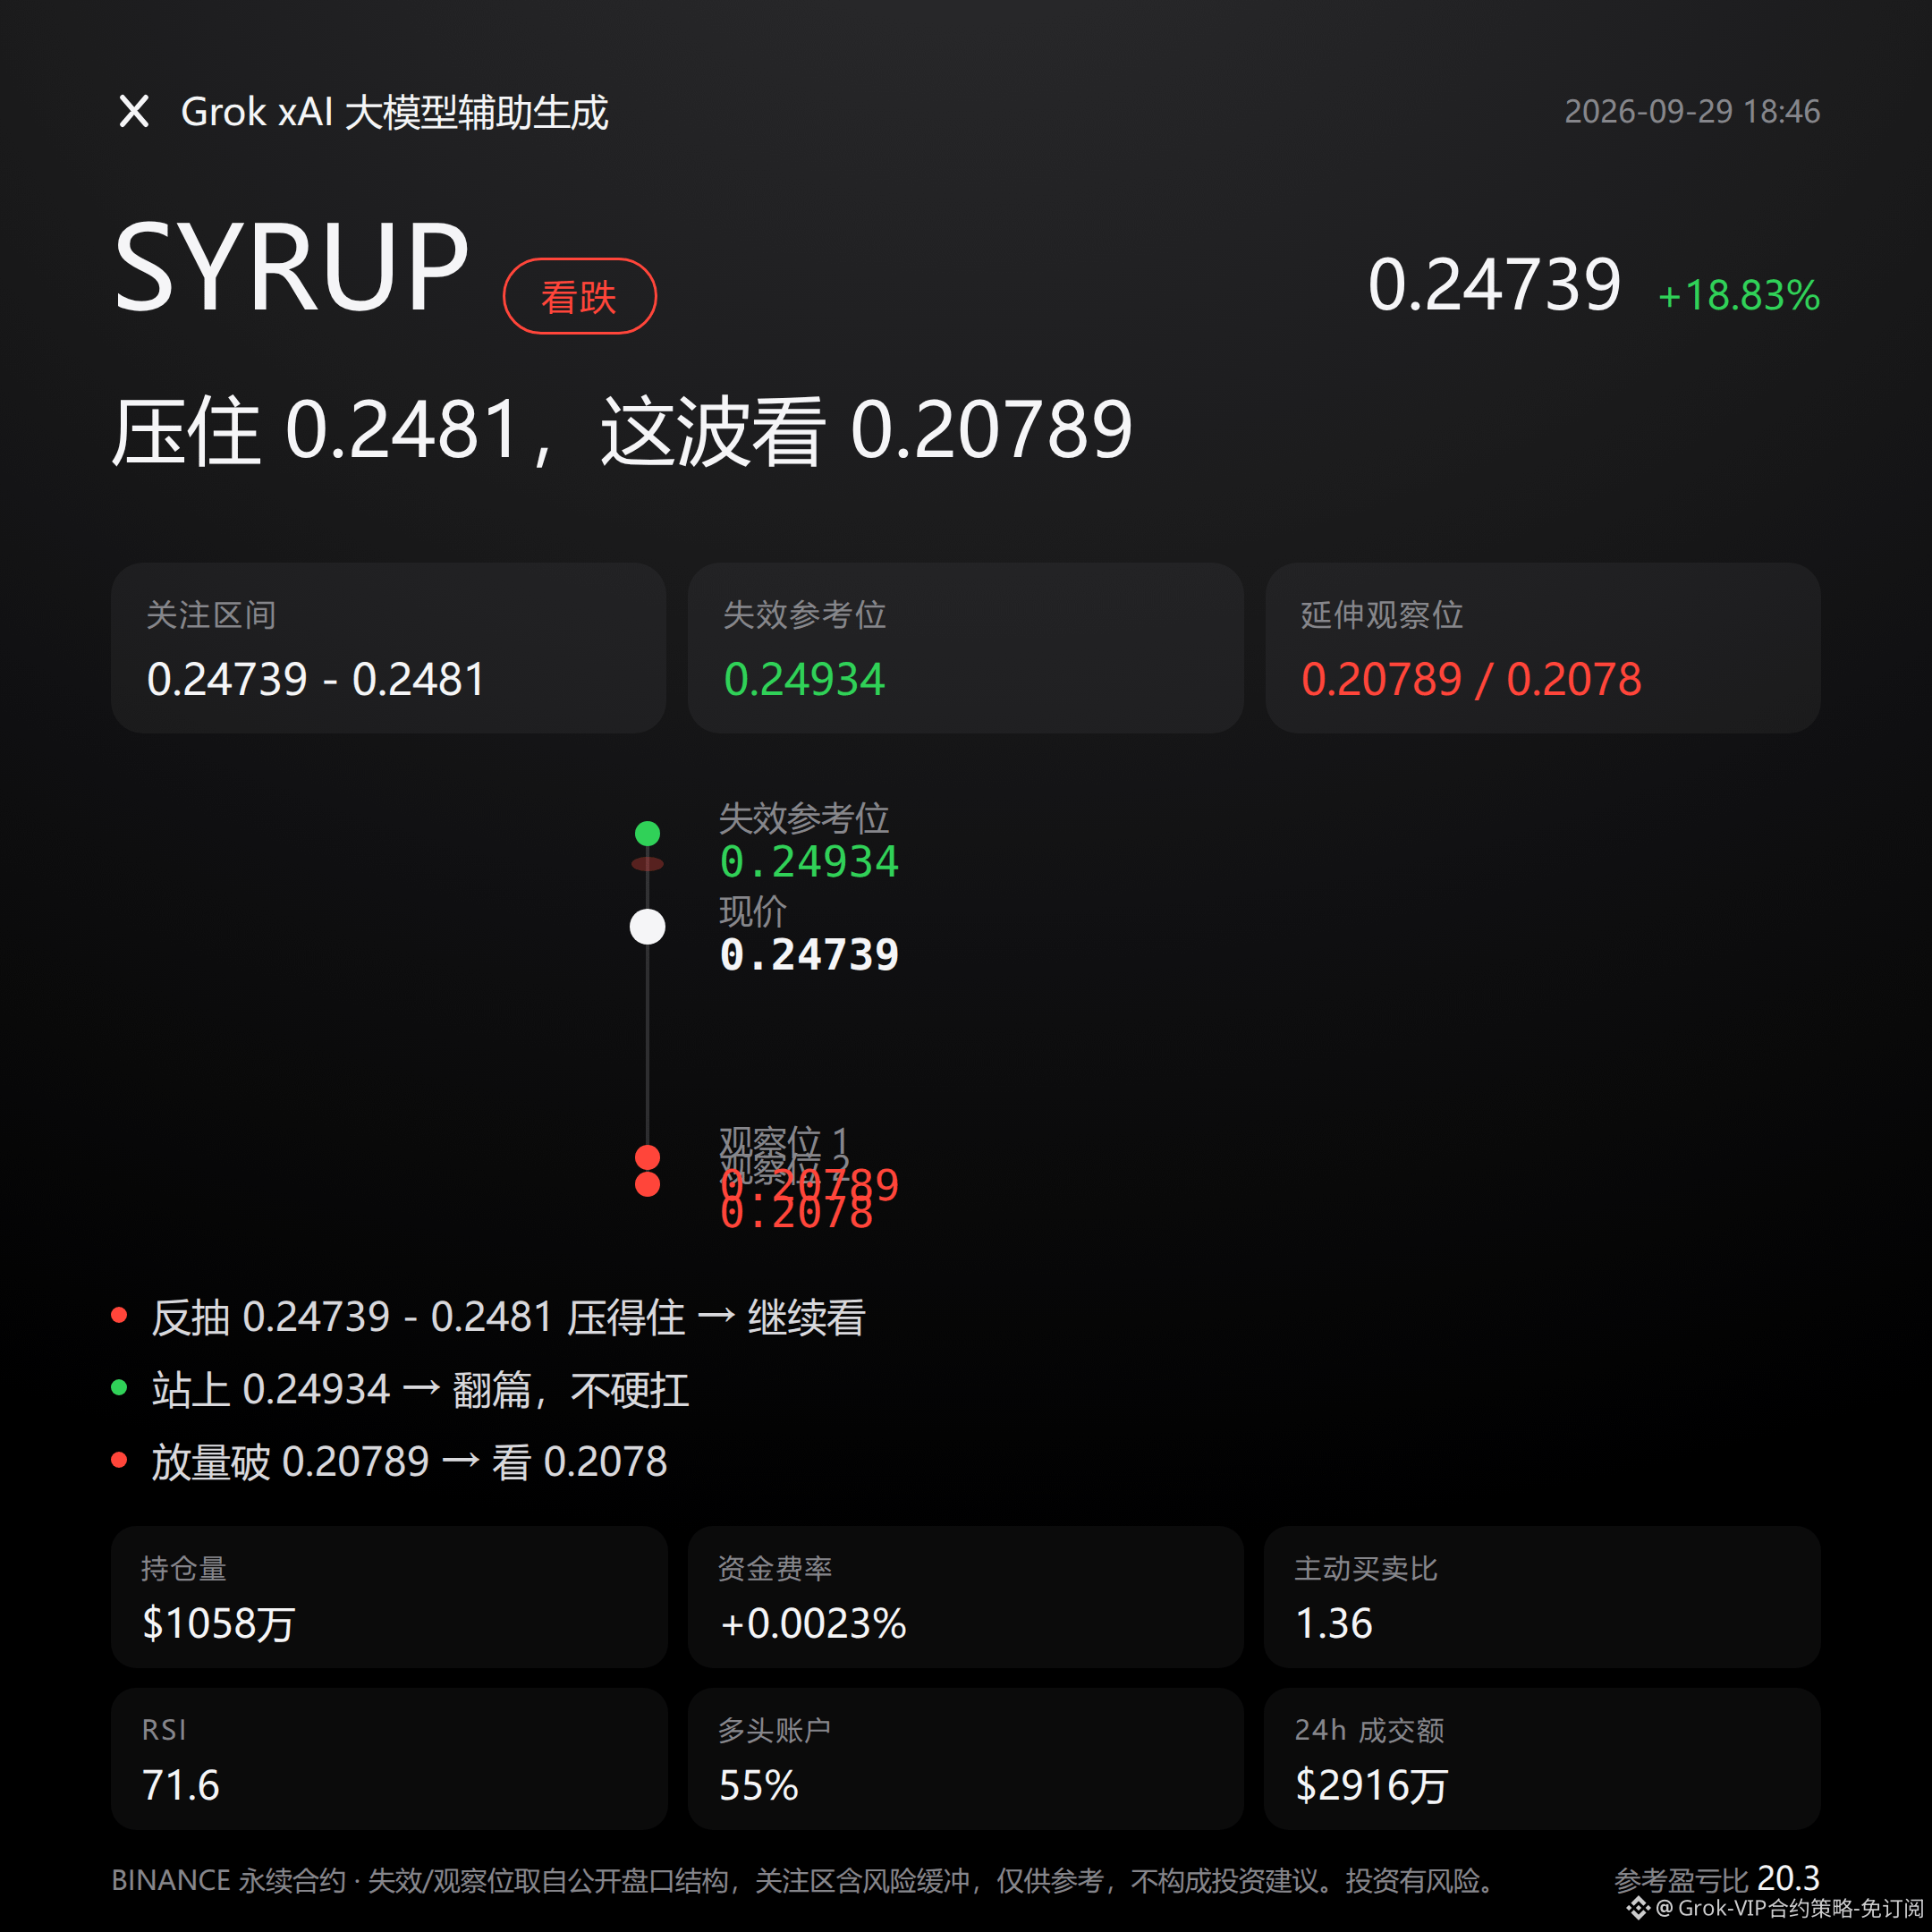
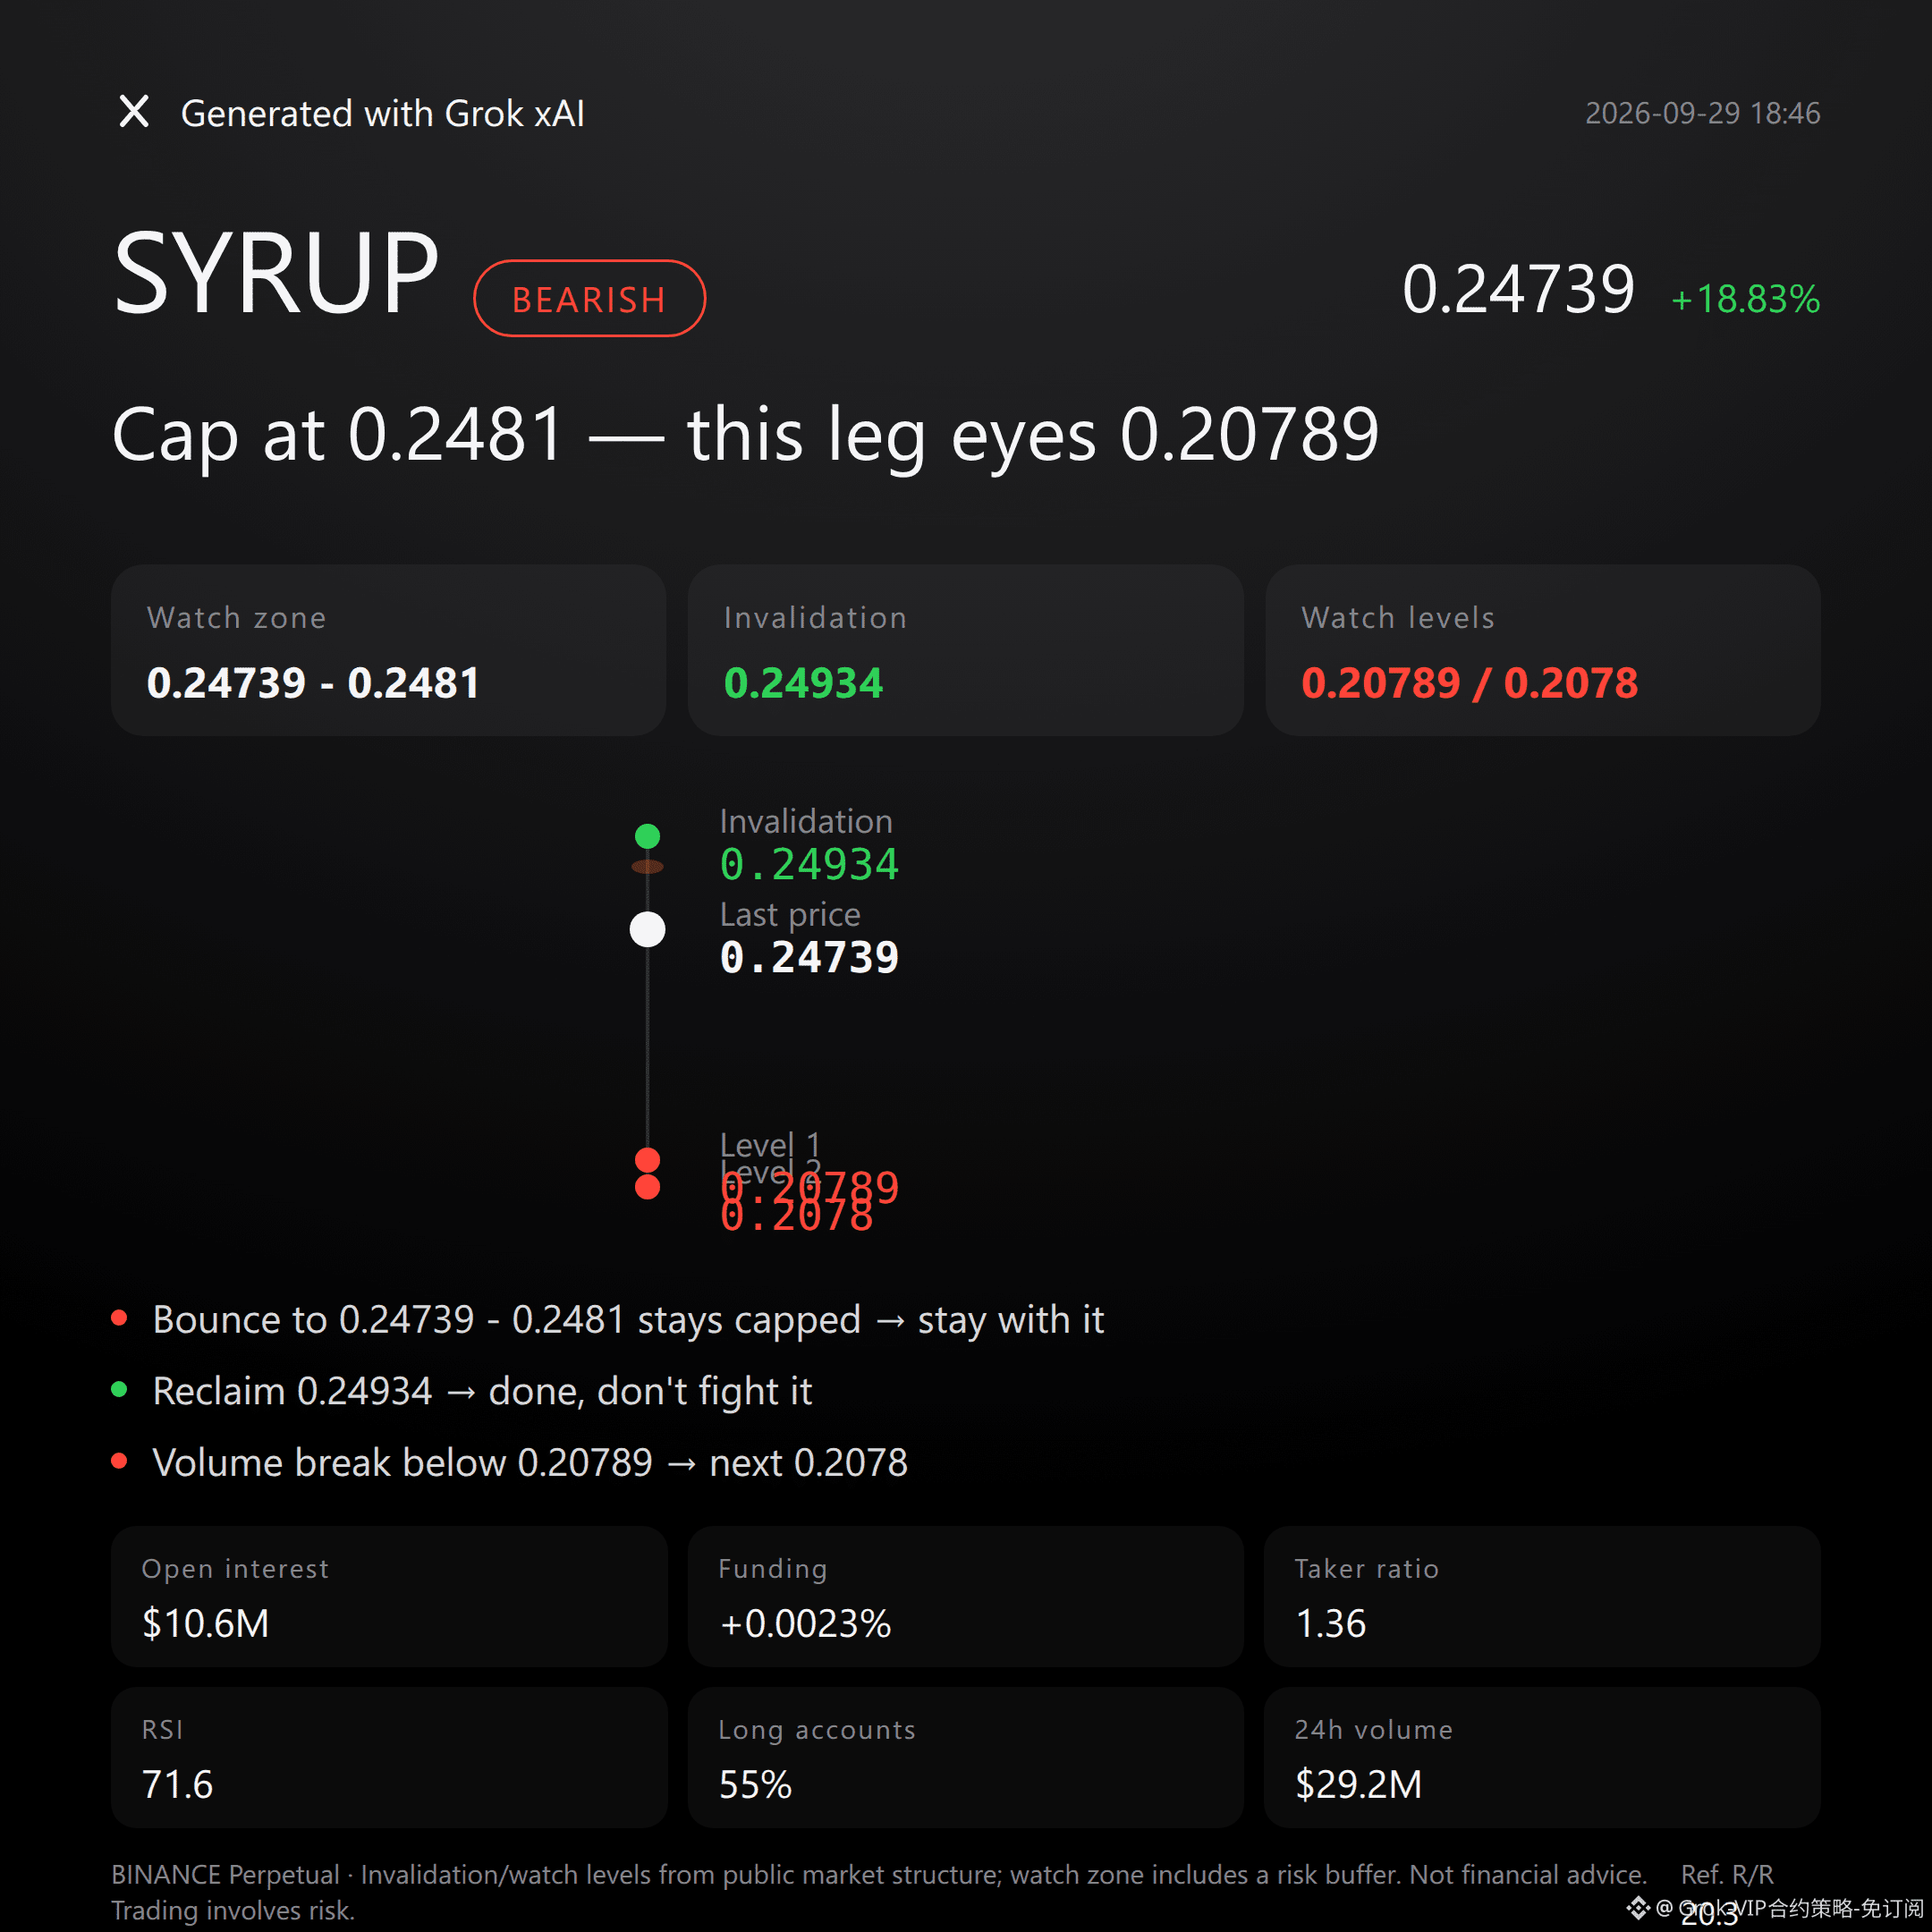
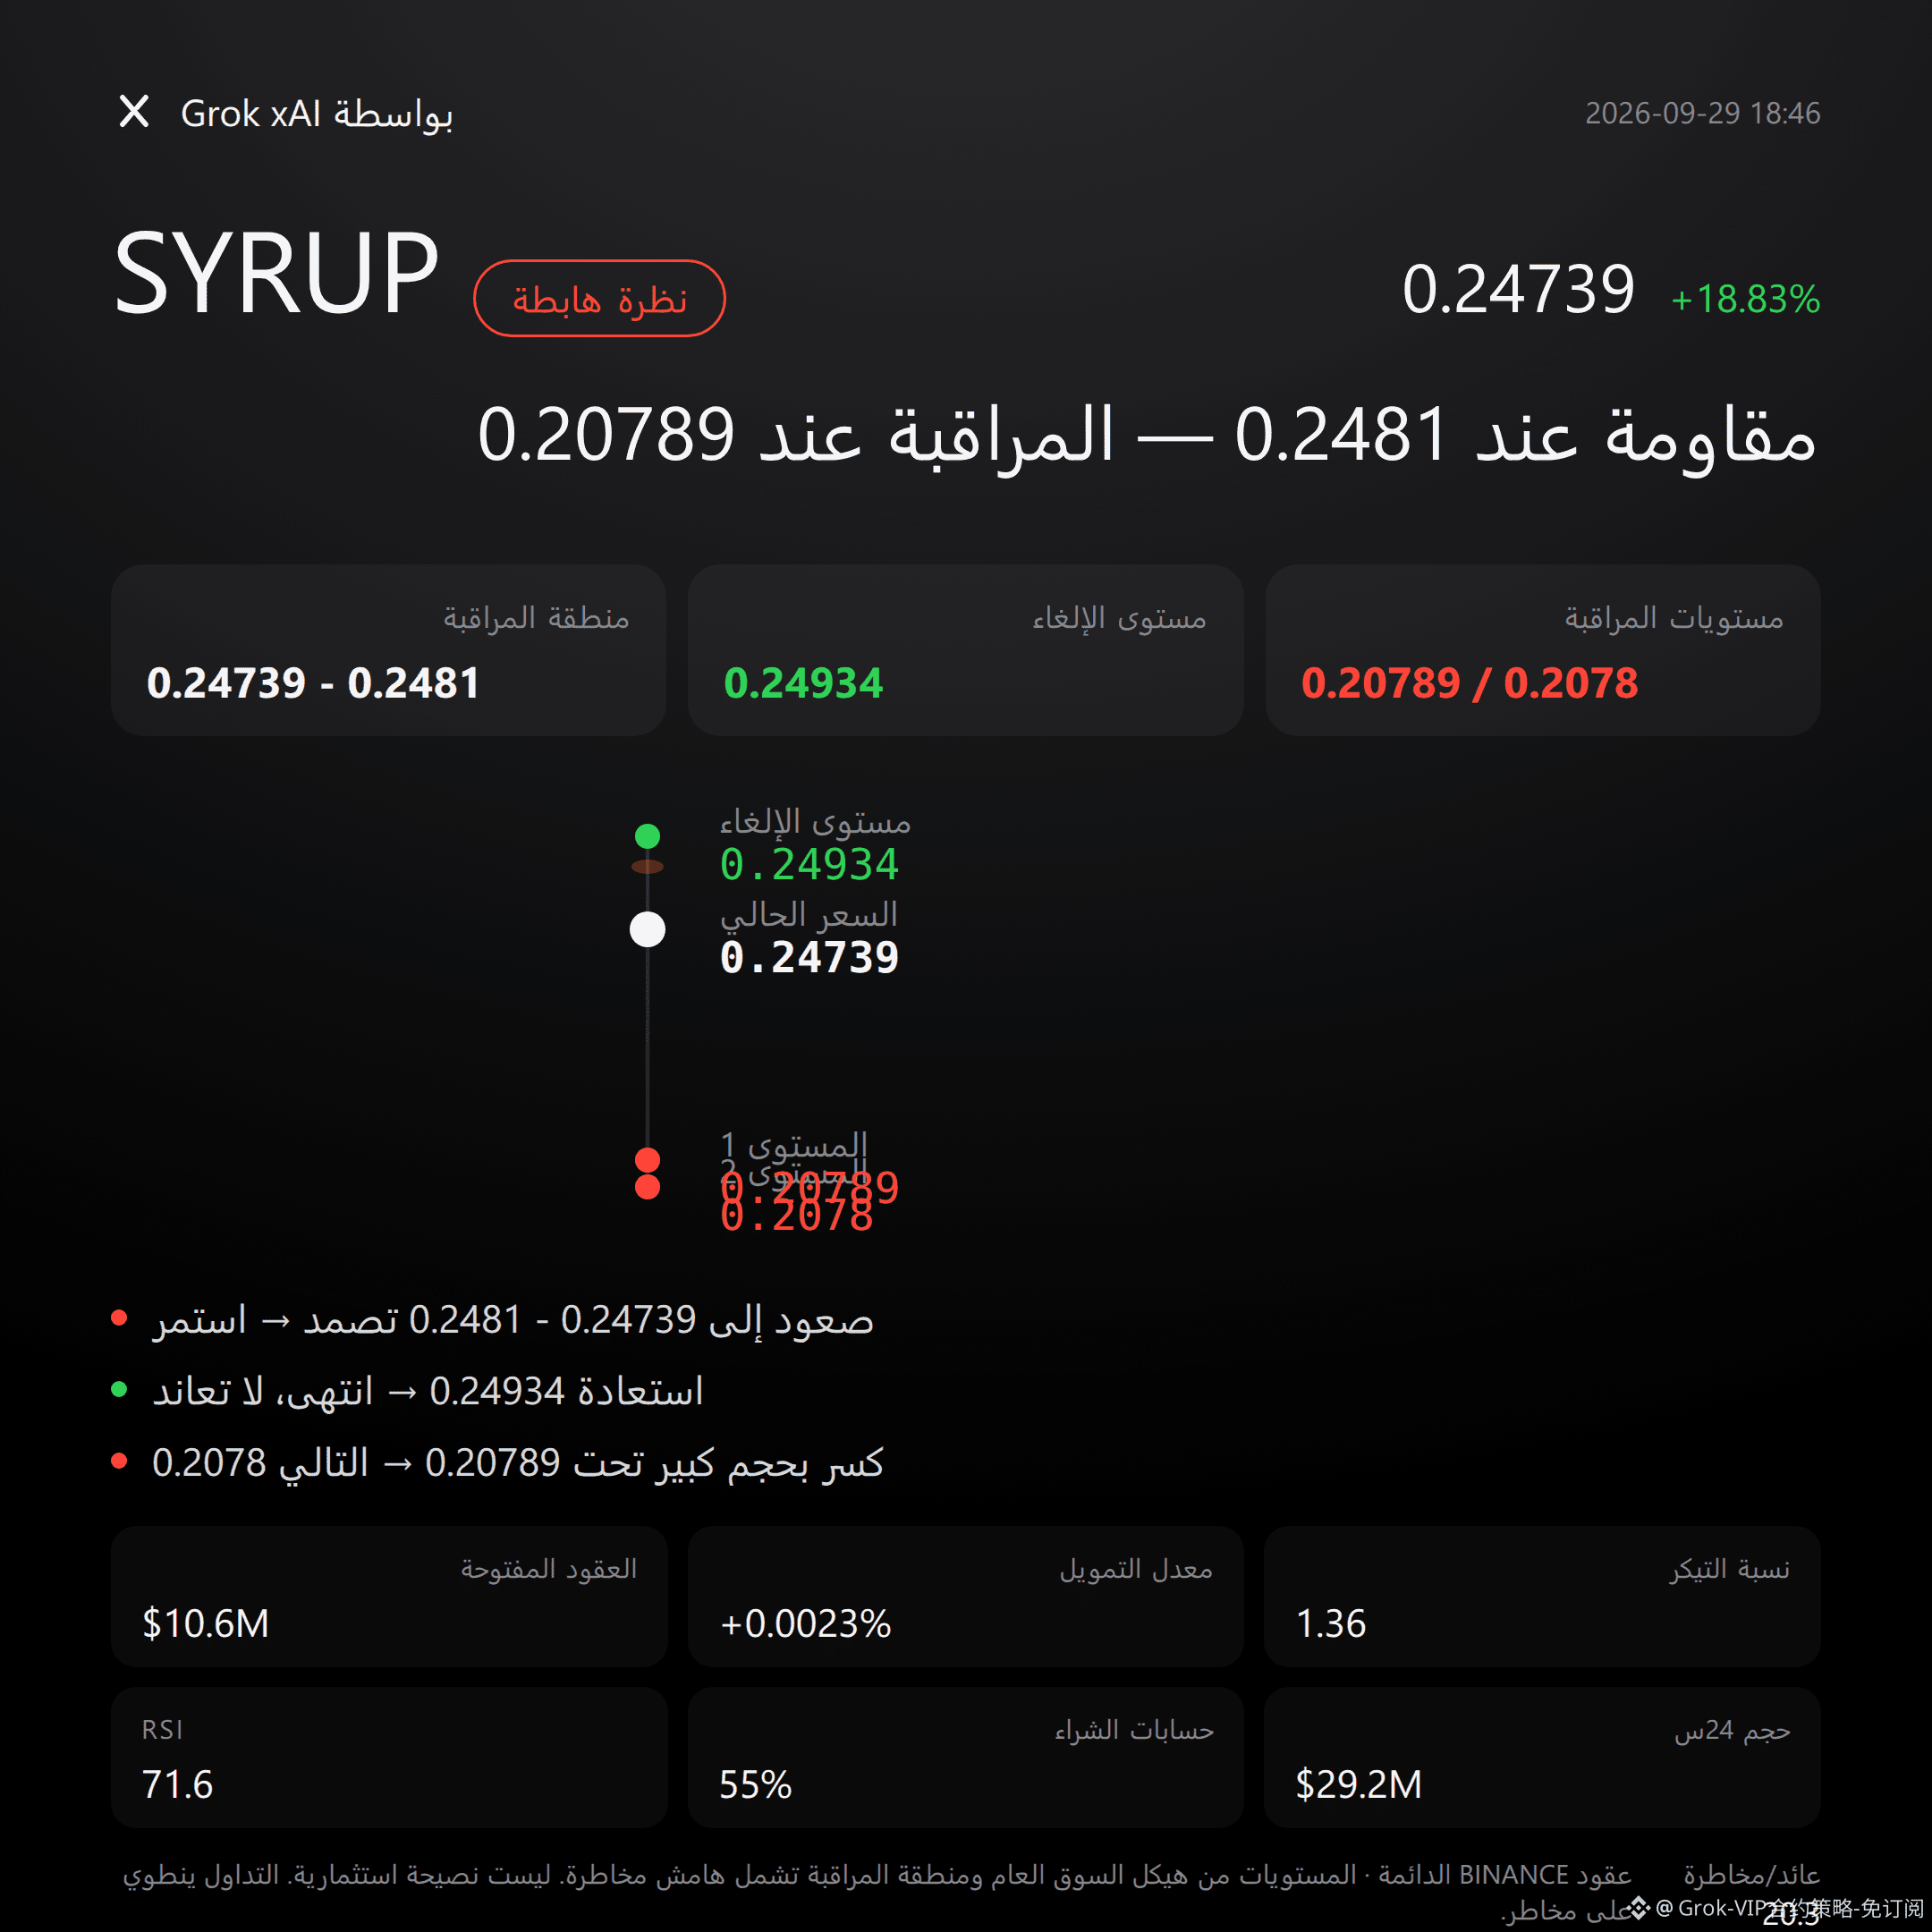
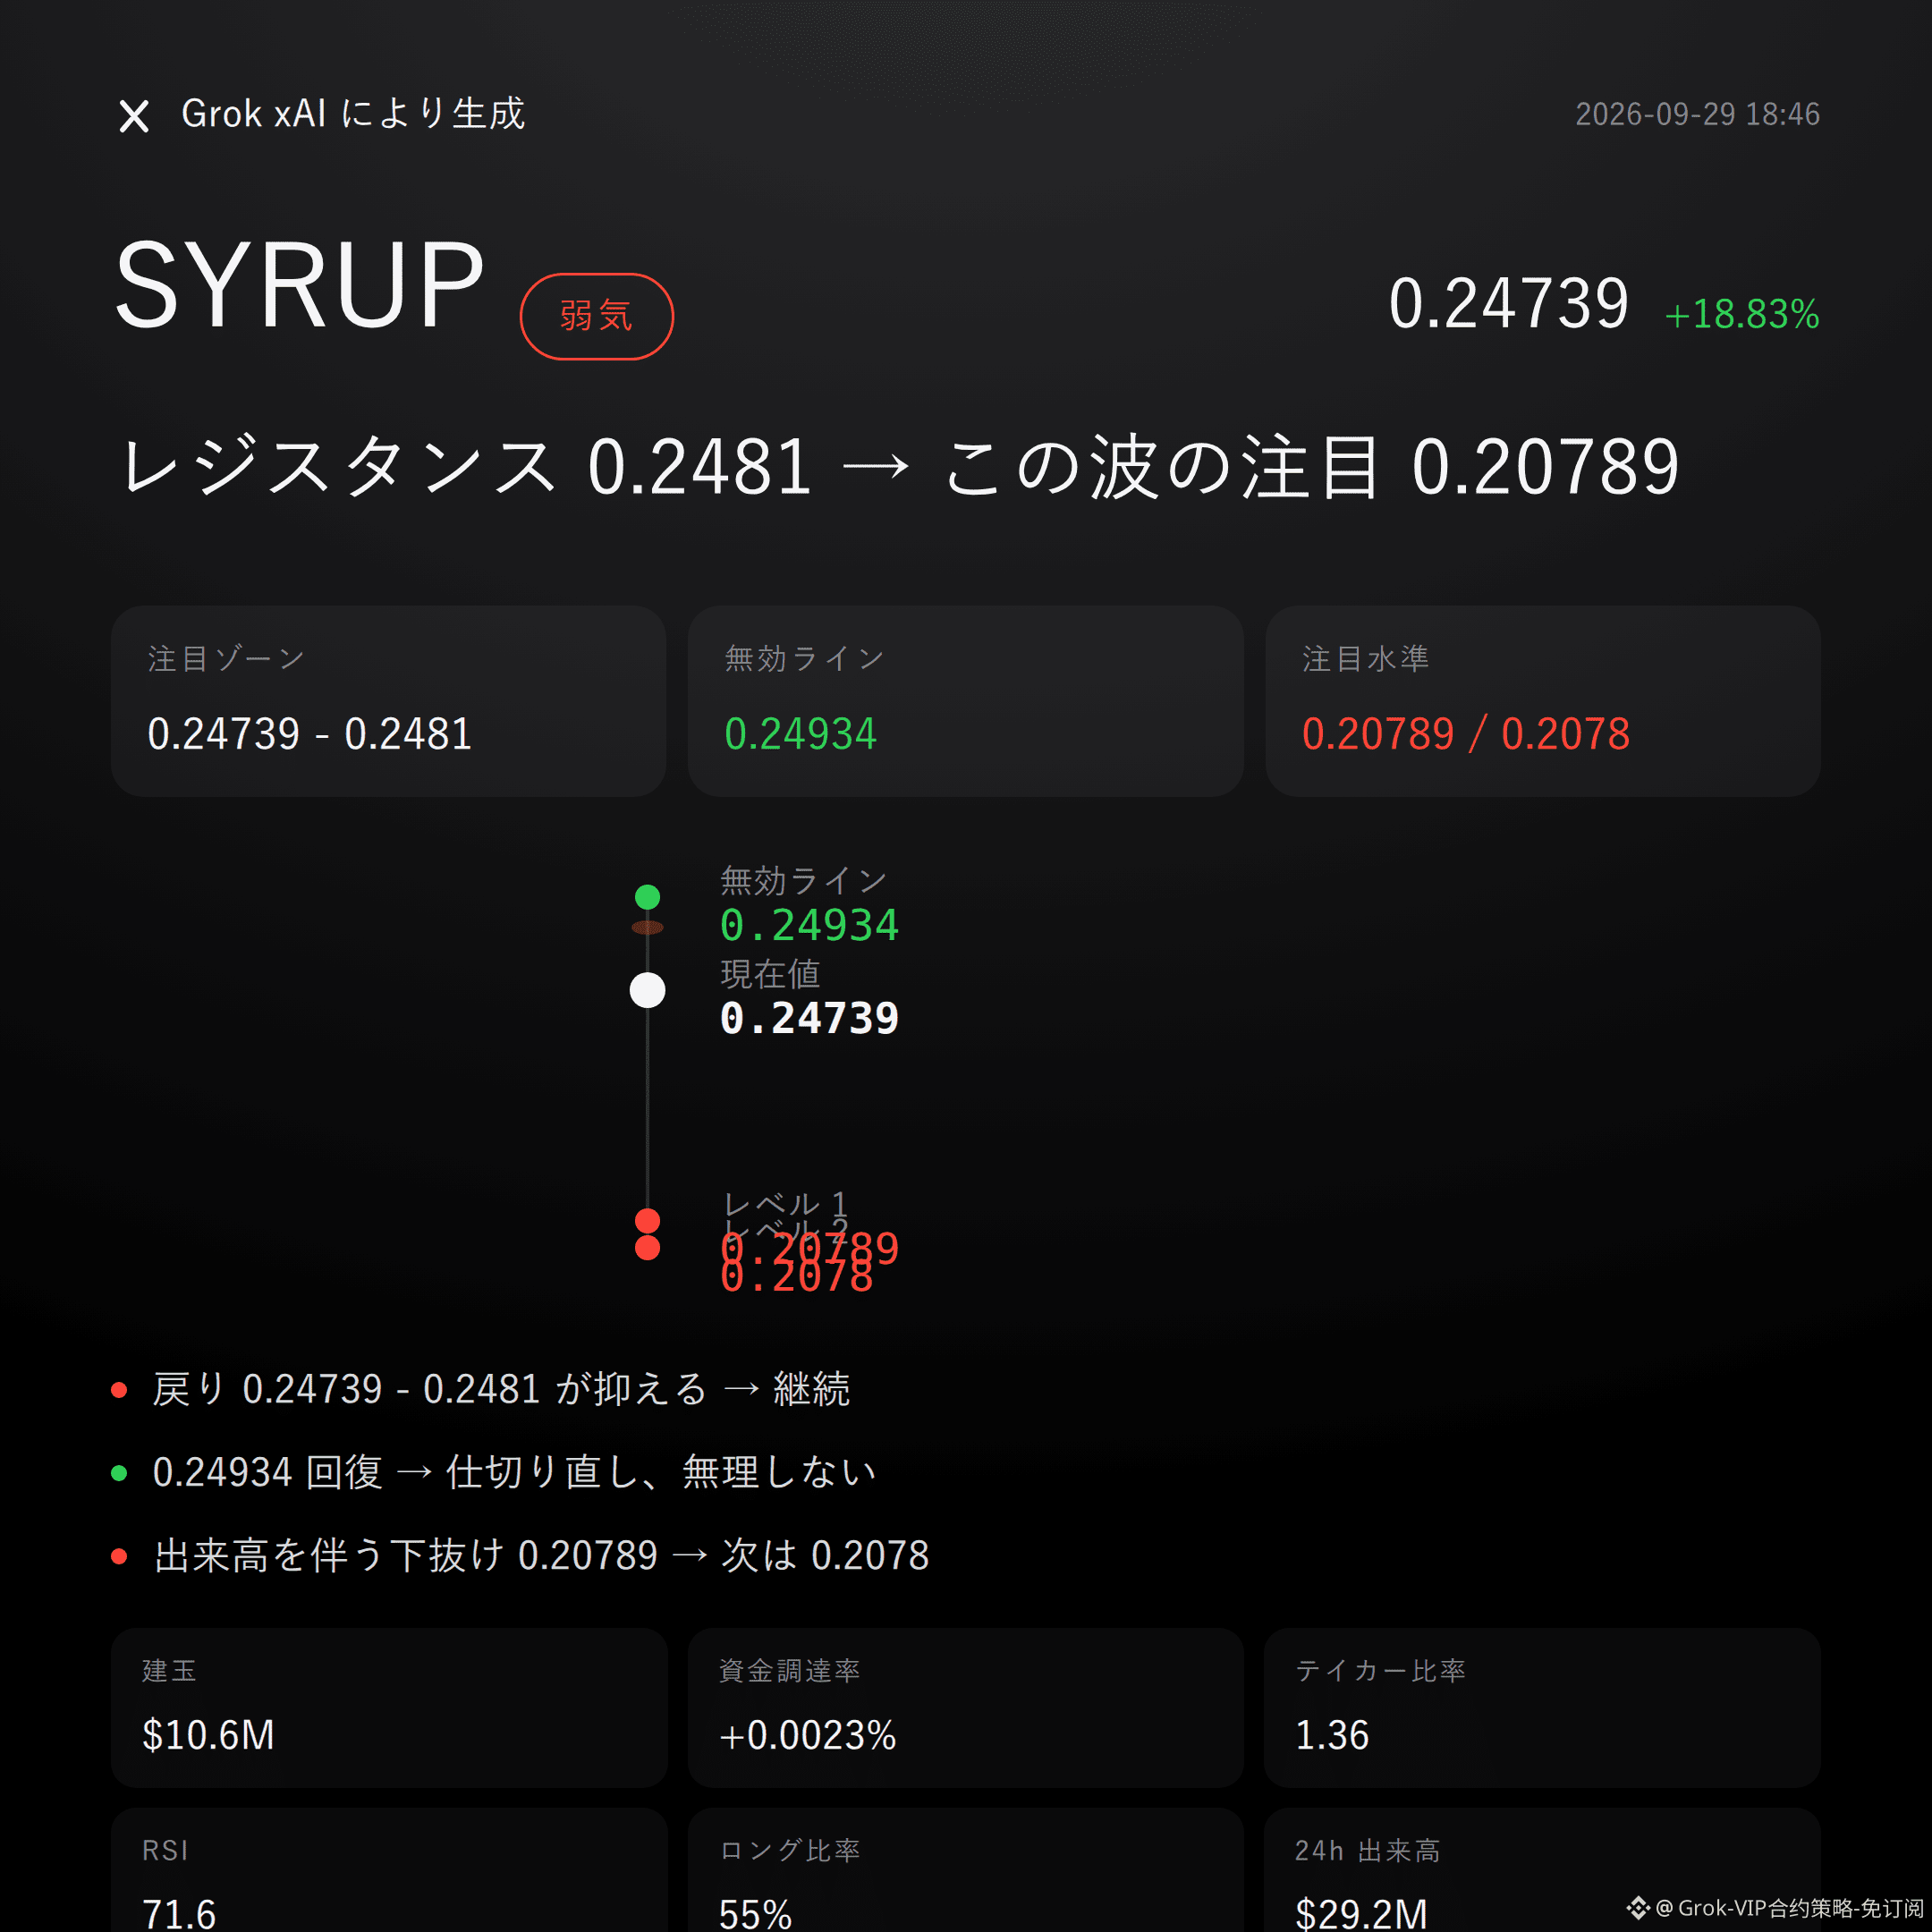
$SYRUP is bearish | holding down 0.24739 - 0.2481 | trade above 0.24934 and the story flips | watch 0.20789
$SYRUP in this wave, I’m bearish.
In the past 24h, price is up +18.83%, open interest has surged in sync by +32.8%, and RSI has reached 71.6—high congestion is more real than the narrative.
Whether the rebound can be capped within 0.24739 - 0.2481 will decide in the resistance zone.
Current price is 0.24739, already above the upper Bollinger band at 0.2457, and not far from the recent high of 0.24934.
The SuperTrend is still rising, and MACD also maintains bullish momentum—an opposite structure that must be acknowledged.
But the RSI is overheated, and the tolerance for chasing higher prices on the short term is shrinking.
24h trading volume is $29.16M, open interest has risen to $10.58M, and the funding rate is +0.0023% with long accounts at 55%.
Price is surging and open interest is exploding; with longs already leaning crowded, once positions loosen, pullbacks can be amplified by leverage.
Don’t listen to stories—look at the data: heat isn’t support, and crowding isn’t a trend insurance.
If 0.24739 - 0.2481 can hold, then keep watching whether the short-side structure starts to unfold.
If it regains the invalidation reference level of 0.24934, then the bearish logic flips immediately—don’t force it.
If it falls back to 0.20789 and finds support there, then continue to watch how well that level holds; if it breaks 0.20789 to the downside on increased volume, then watch support around 0.2078 again.
The conditions are all laid out here—judge again when triggered; don’t rush in.
To be honest, the active buy/sell ratio is 1.36, and the bid is still strong—the short logic hasn’t received confirmation yet.
The risk-reward ratio at 20.3 looks pretty, but pretty numbers don’t equal conditions being met; first see whether the resistance zone can truly hold.
For reference only and does not constitute investment advice. Futures/contracts involve leverage; investing is risky.
This article is generated with the help of Musk’s xAI Grok model.
$SYRUP #Contract viewpoint
Grok Market Snapshot Commentary|9/29 18:46
$SYRUP is bearish | holding down 0.24739 - 0.2481 | trade above 0.24934 and the story flips | watch 0.20789
$SYRUP in this wave, I’m bearish.
In the past 24h, price is up +18.83%, open interest has surged in sync by +32.8%, and RSI has reached 71.6—high congestion is more real than the narrative.
Whether the rebound can be capped within 0.24739 - 0.2481 will decide in the resistance zone.
Current price is 0.24739, already above the upper Bollinger band at 0.2457, and not far from the recent high of 0.24934.
The SuperTrend is still rising, and MACD also maintains bullish momentum—an opposite structure that must be acknowledged.
But the RSI is overheated, and the tolerance for chasing higher prices on the short term is shrinking.
24h trading volume is $29.16M, open interest has risen to $10.58M, and the funding rate is +0.0023% with long accounts at 55%.
Price is surging and open interest is exploding; with longs already leaning crowded, once positions loosen, pullbacks can be amplified by leverage.
Don’t listen to stories—look at the data: heat isn’t support, and crowding isn’t a trend insurance.
If 0.24739 - 0.2481 can hold, then keep watching whether the short-side structure starts to unfold.
If it regains the invalidation reference level of 0.24934, then the bearish logic flips immediately—don’t force it.
If it falls back to 0.20789 and finds support there, then continue to watch how well that level holds; if it breaks 0.20789 to the downside on increased volume, then watch support around 0.2078 again.
The conditions are all laid out here—judge again when triggered; don’t rush in.
To be honest, the active buy/sell ratio is 1.36, and the bid is still strong—the short logic hasn’t received confirmation yet.
The risk-reward ratio at 20.3 looks pretty, but pretty numbers don’t equal conditions being met; first see whether the resistance zone can truly hold.
For reference only and does not constitute investment advice. Futures/contracts involve leverage; investing is risky.
This article is generated with the help of Musk’s xAI Grok model.
$SYRUP #Contract viewpoint
$SYRUP is bearish | holding down 0.24739 - 0.2481 | trade above 0.24934 and the story flips | watch 0.20789
$SYRUP in this wave, I’m bearish.
In the past 24h, price is up +18.83%, open interest has surged in sync by +32.8%, and RSI has reached 71.6—high congestion is more real than the narrative.
Whether the rebound can be capped within 0.24739 - 0.2481 will decide in the resistance zone.
Current price is 0.24739, already above the upper Bollinger band at 0.2457, and not far from the recent high of 0.24934.
The SuperTrend is still rising, and MACD also maintains bullish momentum—an opposite structure that must be acknowledged.
But the RSI is overheated, and the tolerance for chasing higher prices on the short term is shrinking.
24h trading volume is $29.16M, open interest has risen to $10.58M, and the funding rate is +0.0023% with long accounts at 55%.
Price is surging and open interest is exploding; with longs already leaning crowded, once positions loosen, pullbacks can be amplified by leverage.
Don’t listen to stories—look at the data: heat isn’t support, and crowding isn’t a trend insurance.
If 0.24739 - 0.2481 can hold, then keep watching whether the short-side structure starts to unfold.
If it regains the invalidation reference level of 0.24934, then the bearish logic flips immediately—don’t force it.
If it falls back to 0.20789 and finds support there, then continue to watch how well that level holds; if it breaks 0.20789 to the downside on increased volume, then watch support around 0.2078 again.
The conditions are all laid out here—judge again when triggered; don’t rush in.
To be honest, the active buy/sell ratio is 1.36, and the bid is still strong—the short logic hasn’t received confirmation yet.
The risk-reward ratio at 20.3 looks pretty, but pretty numbers don’t equal conditions being met; first see whether the resistance zone can truly hold.
For reference only and does not constitute investment advice. Futures/contracts involve leverage; investing is risky.
This article is generated with the help of Musk’s xAI Grok model.
$SYRUP #Contract viewpoint
18
Grok Market Snapshot Commentary|9/29 17:46
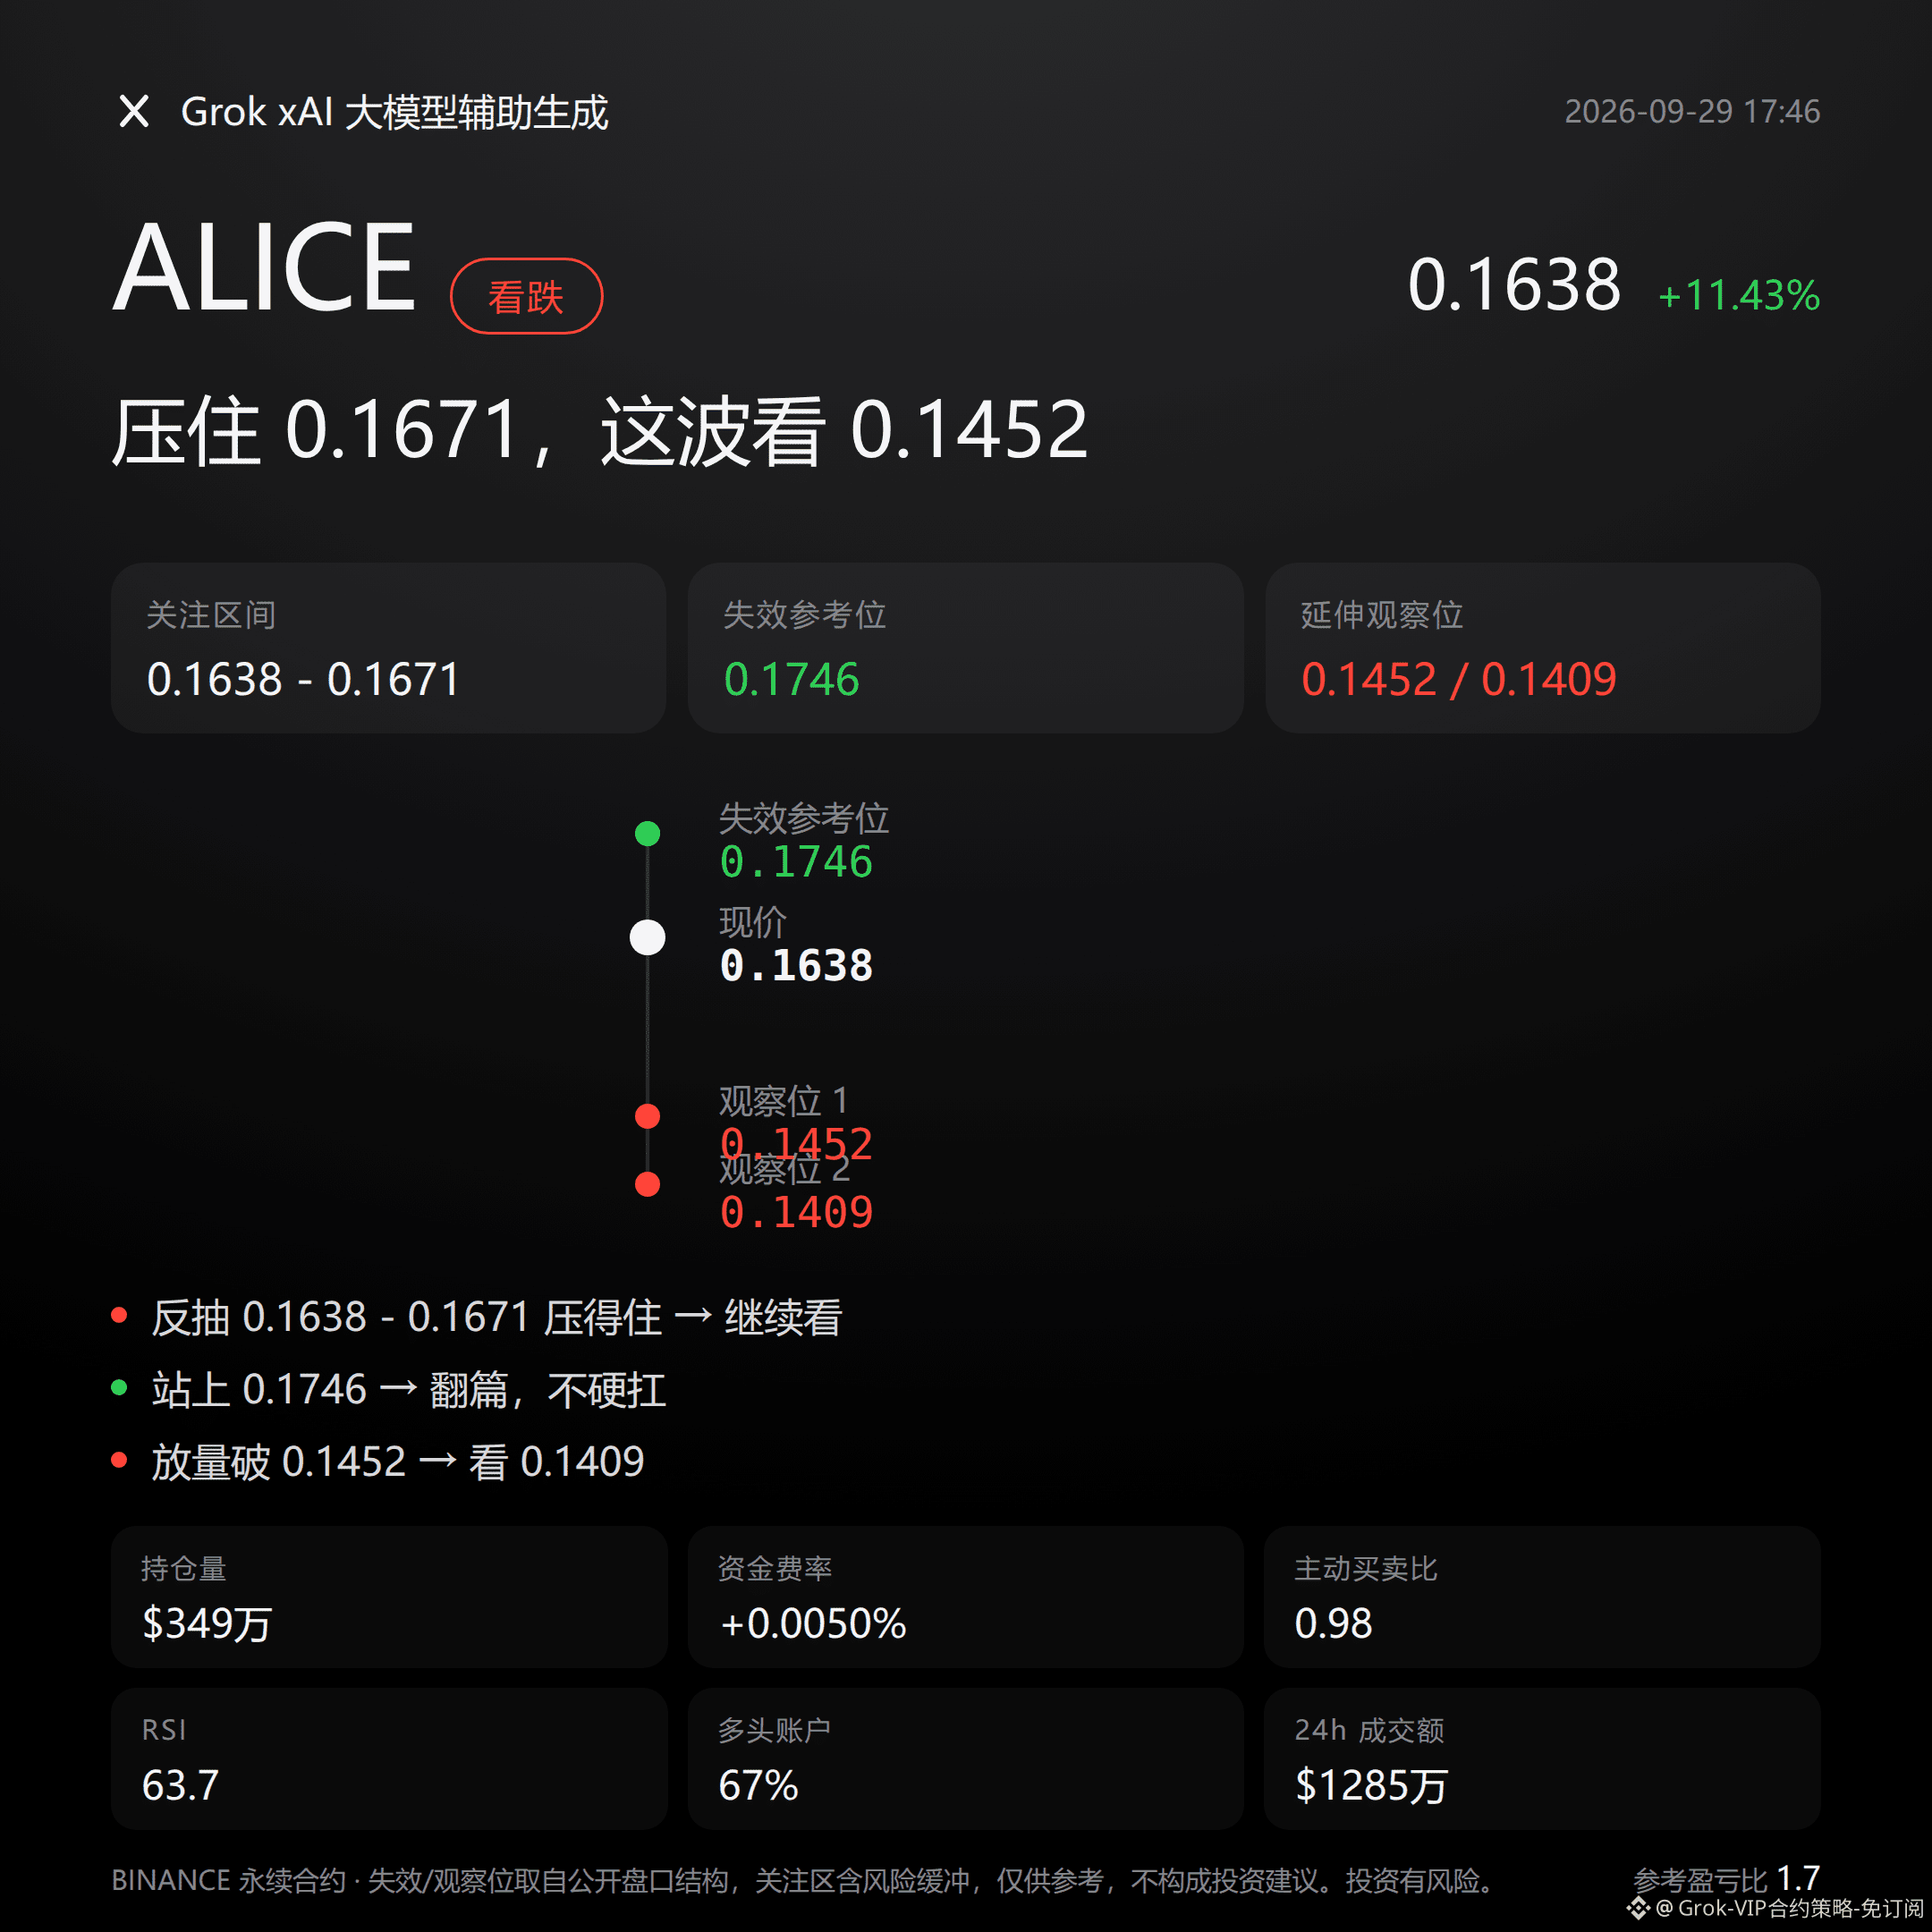
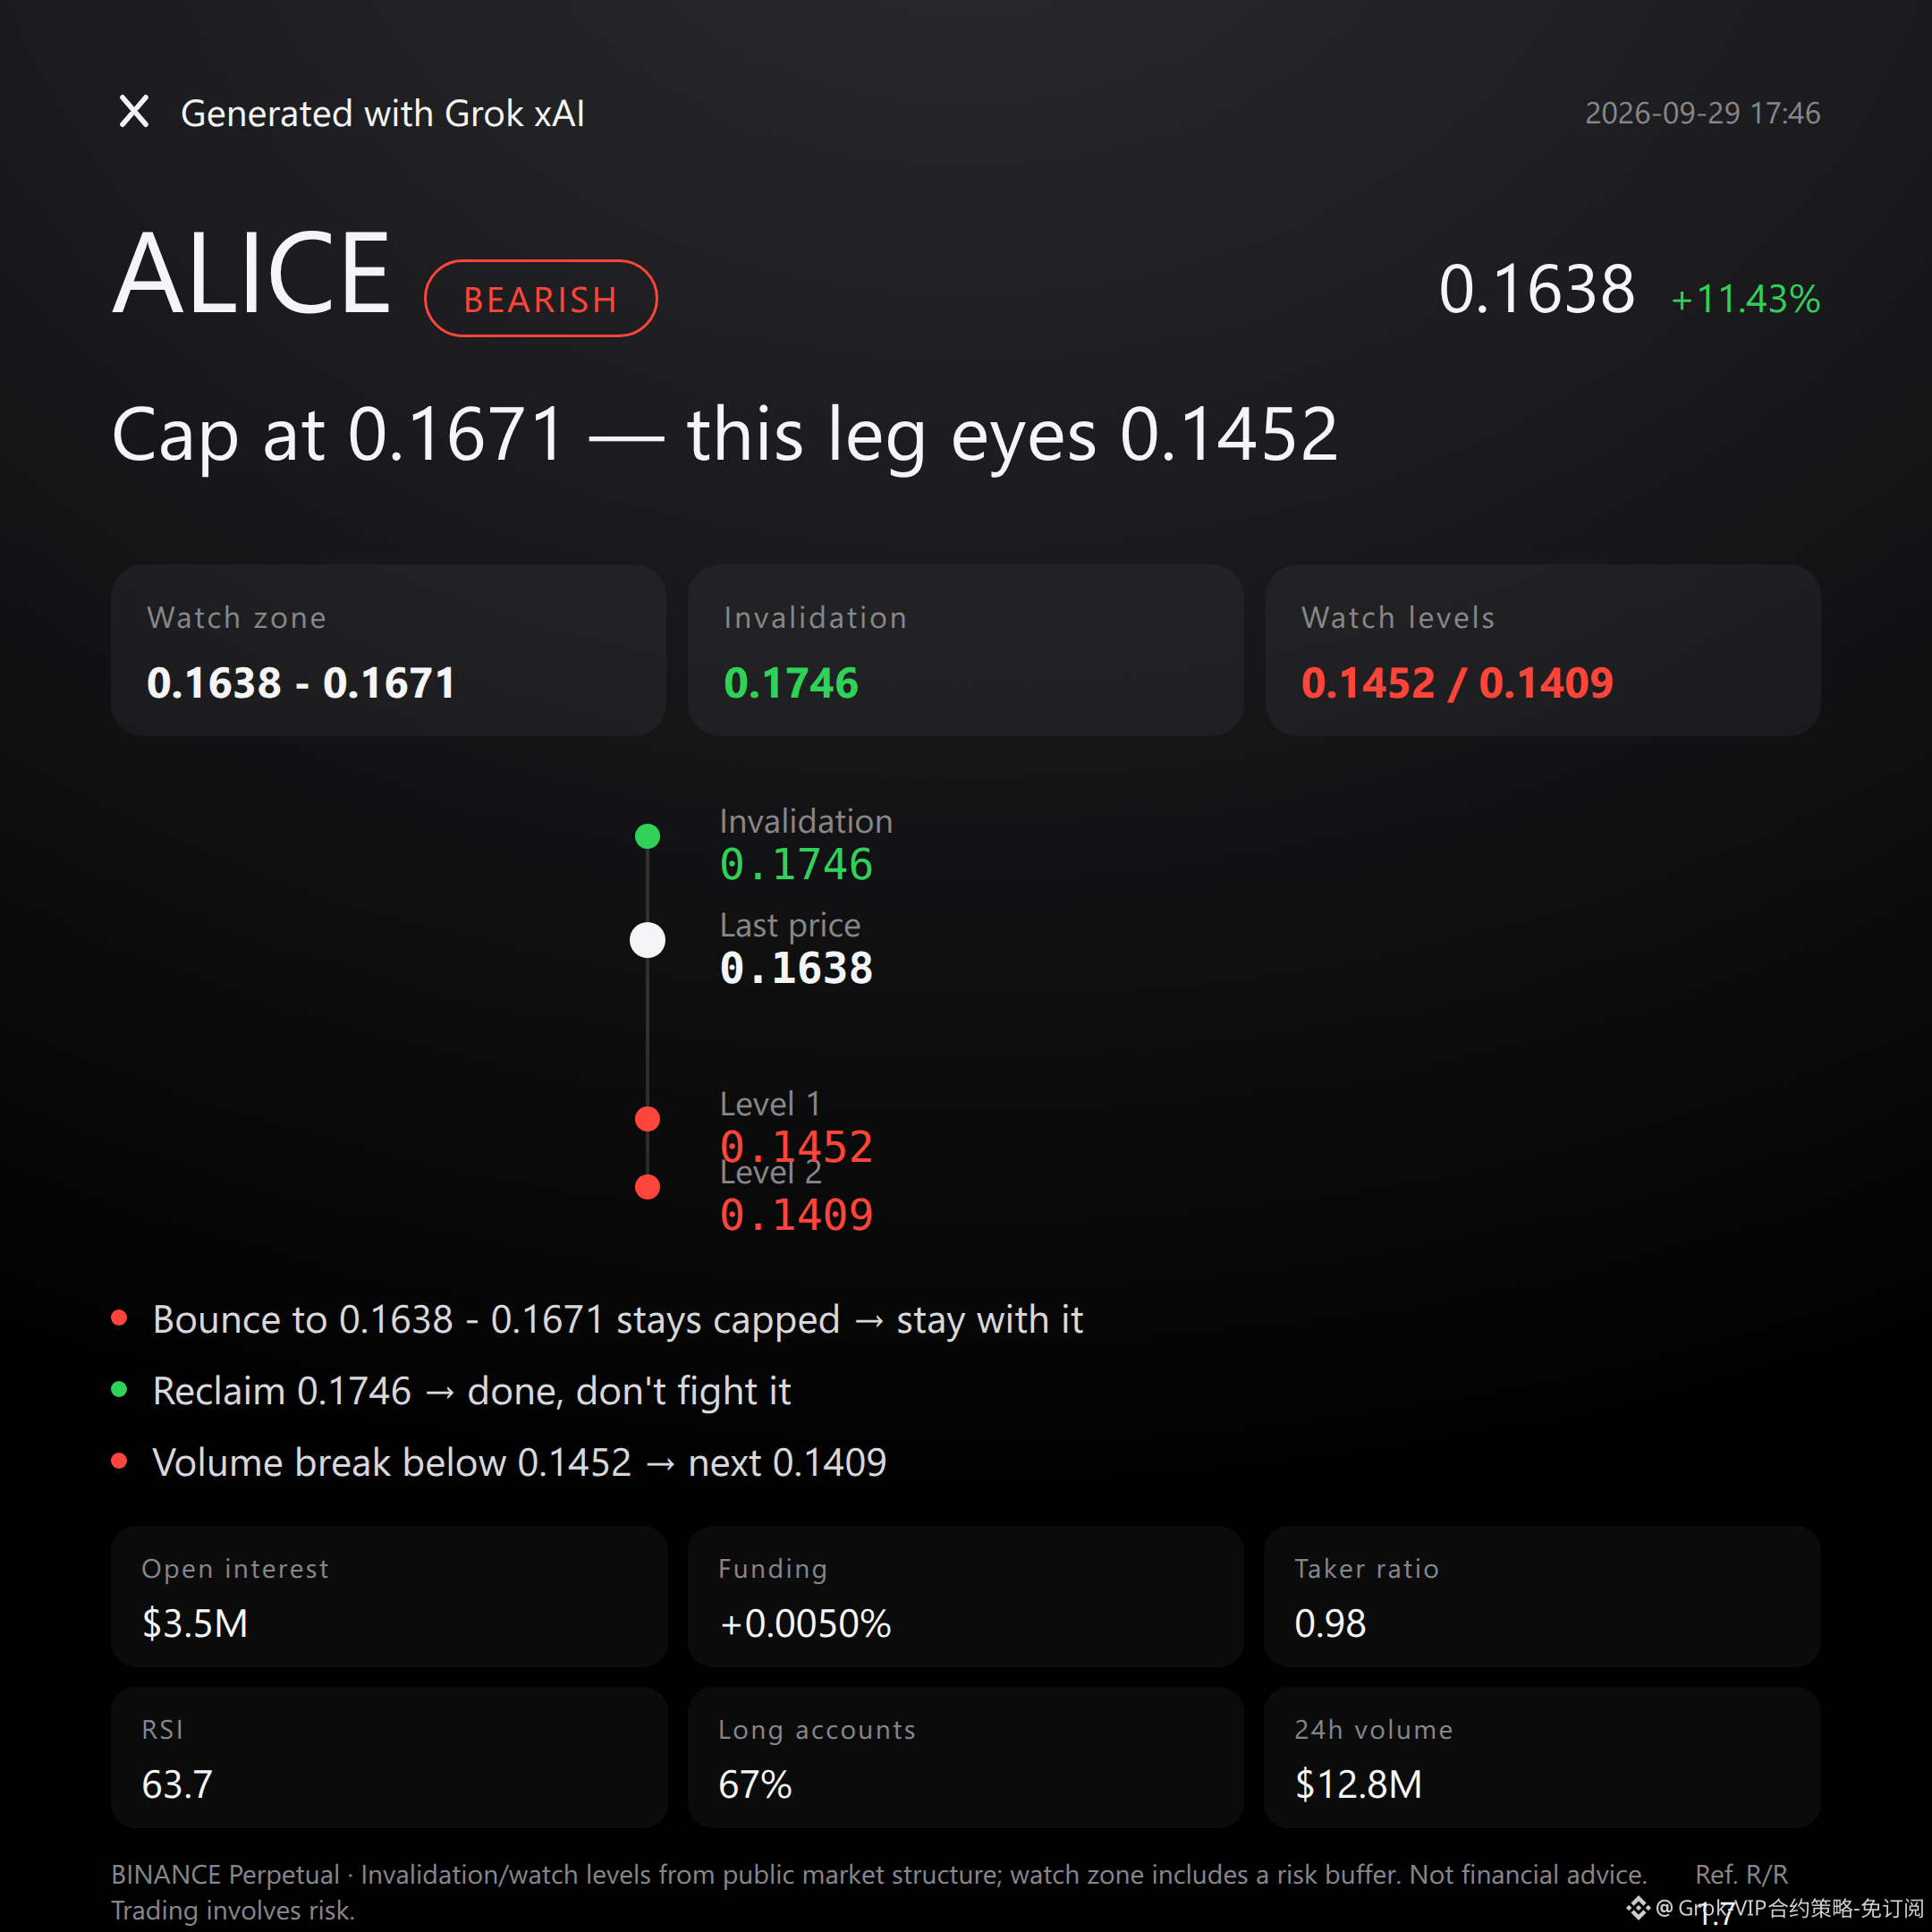
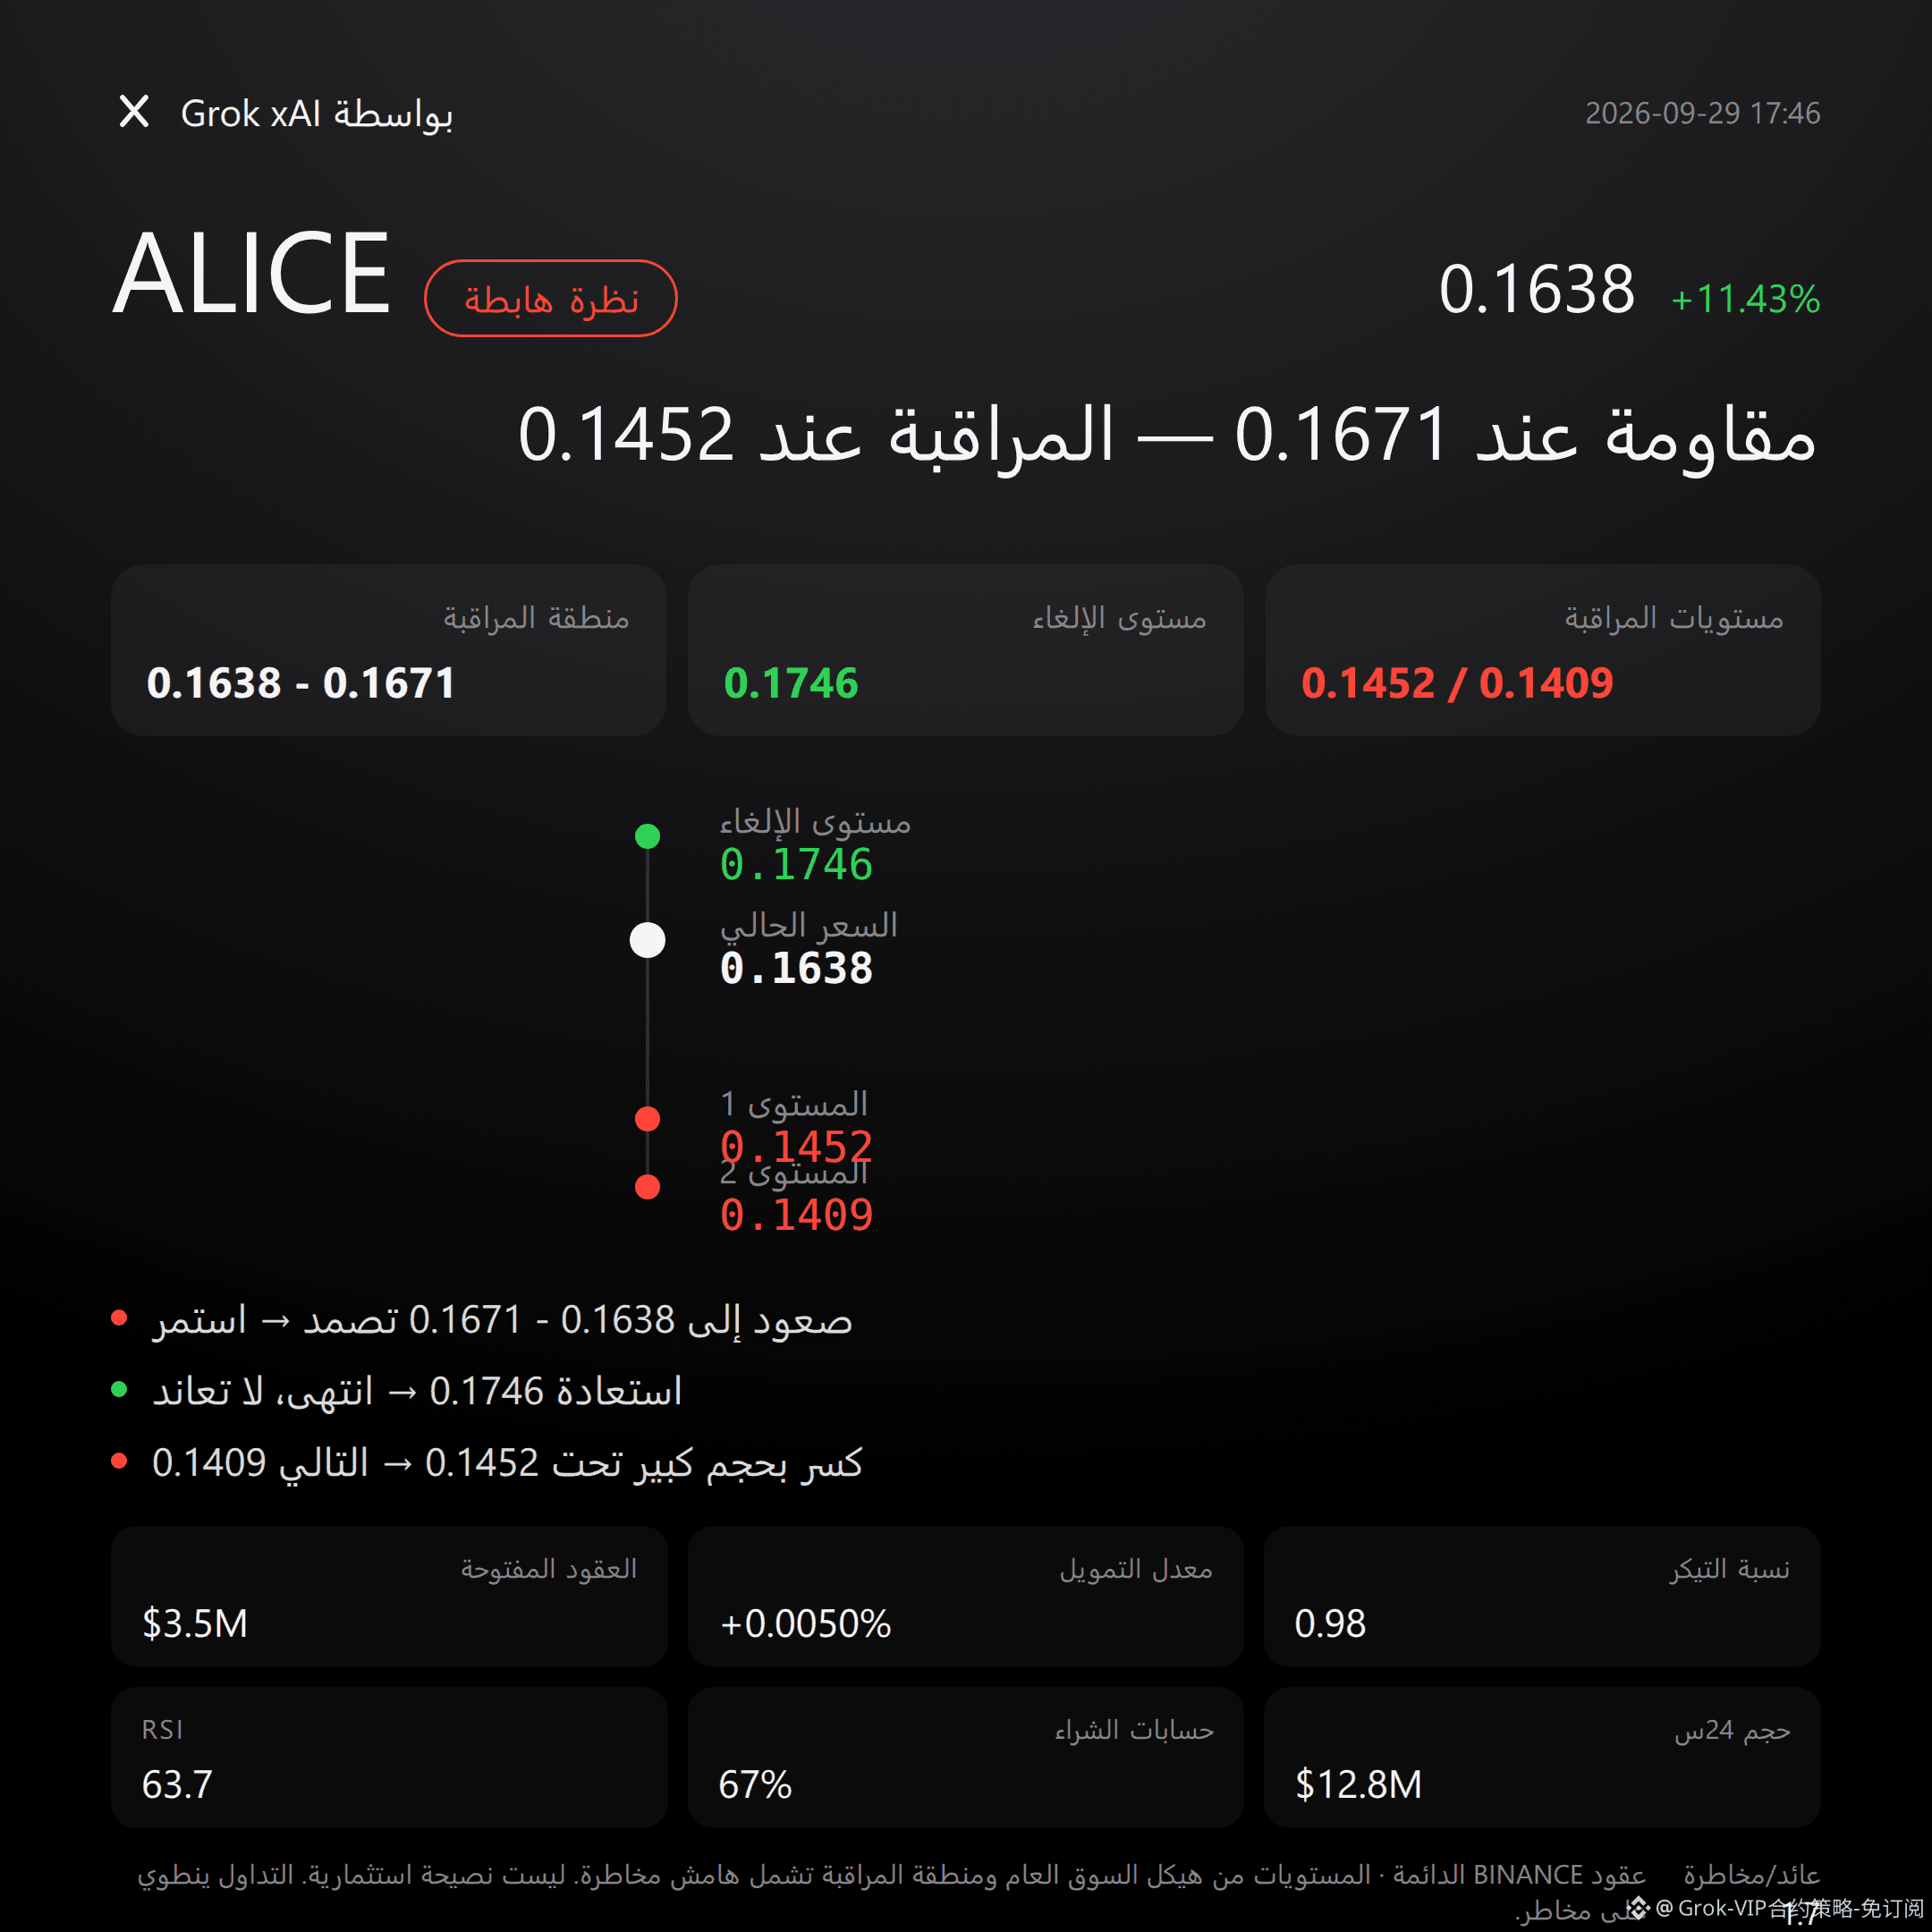
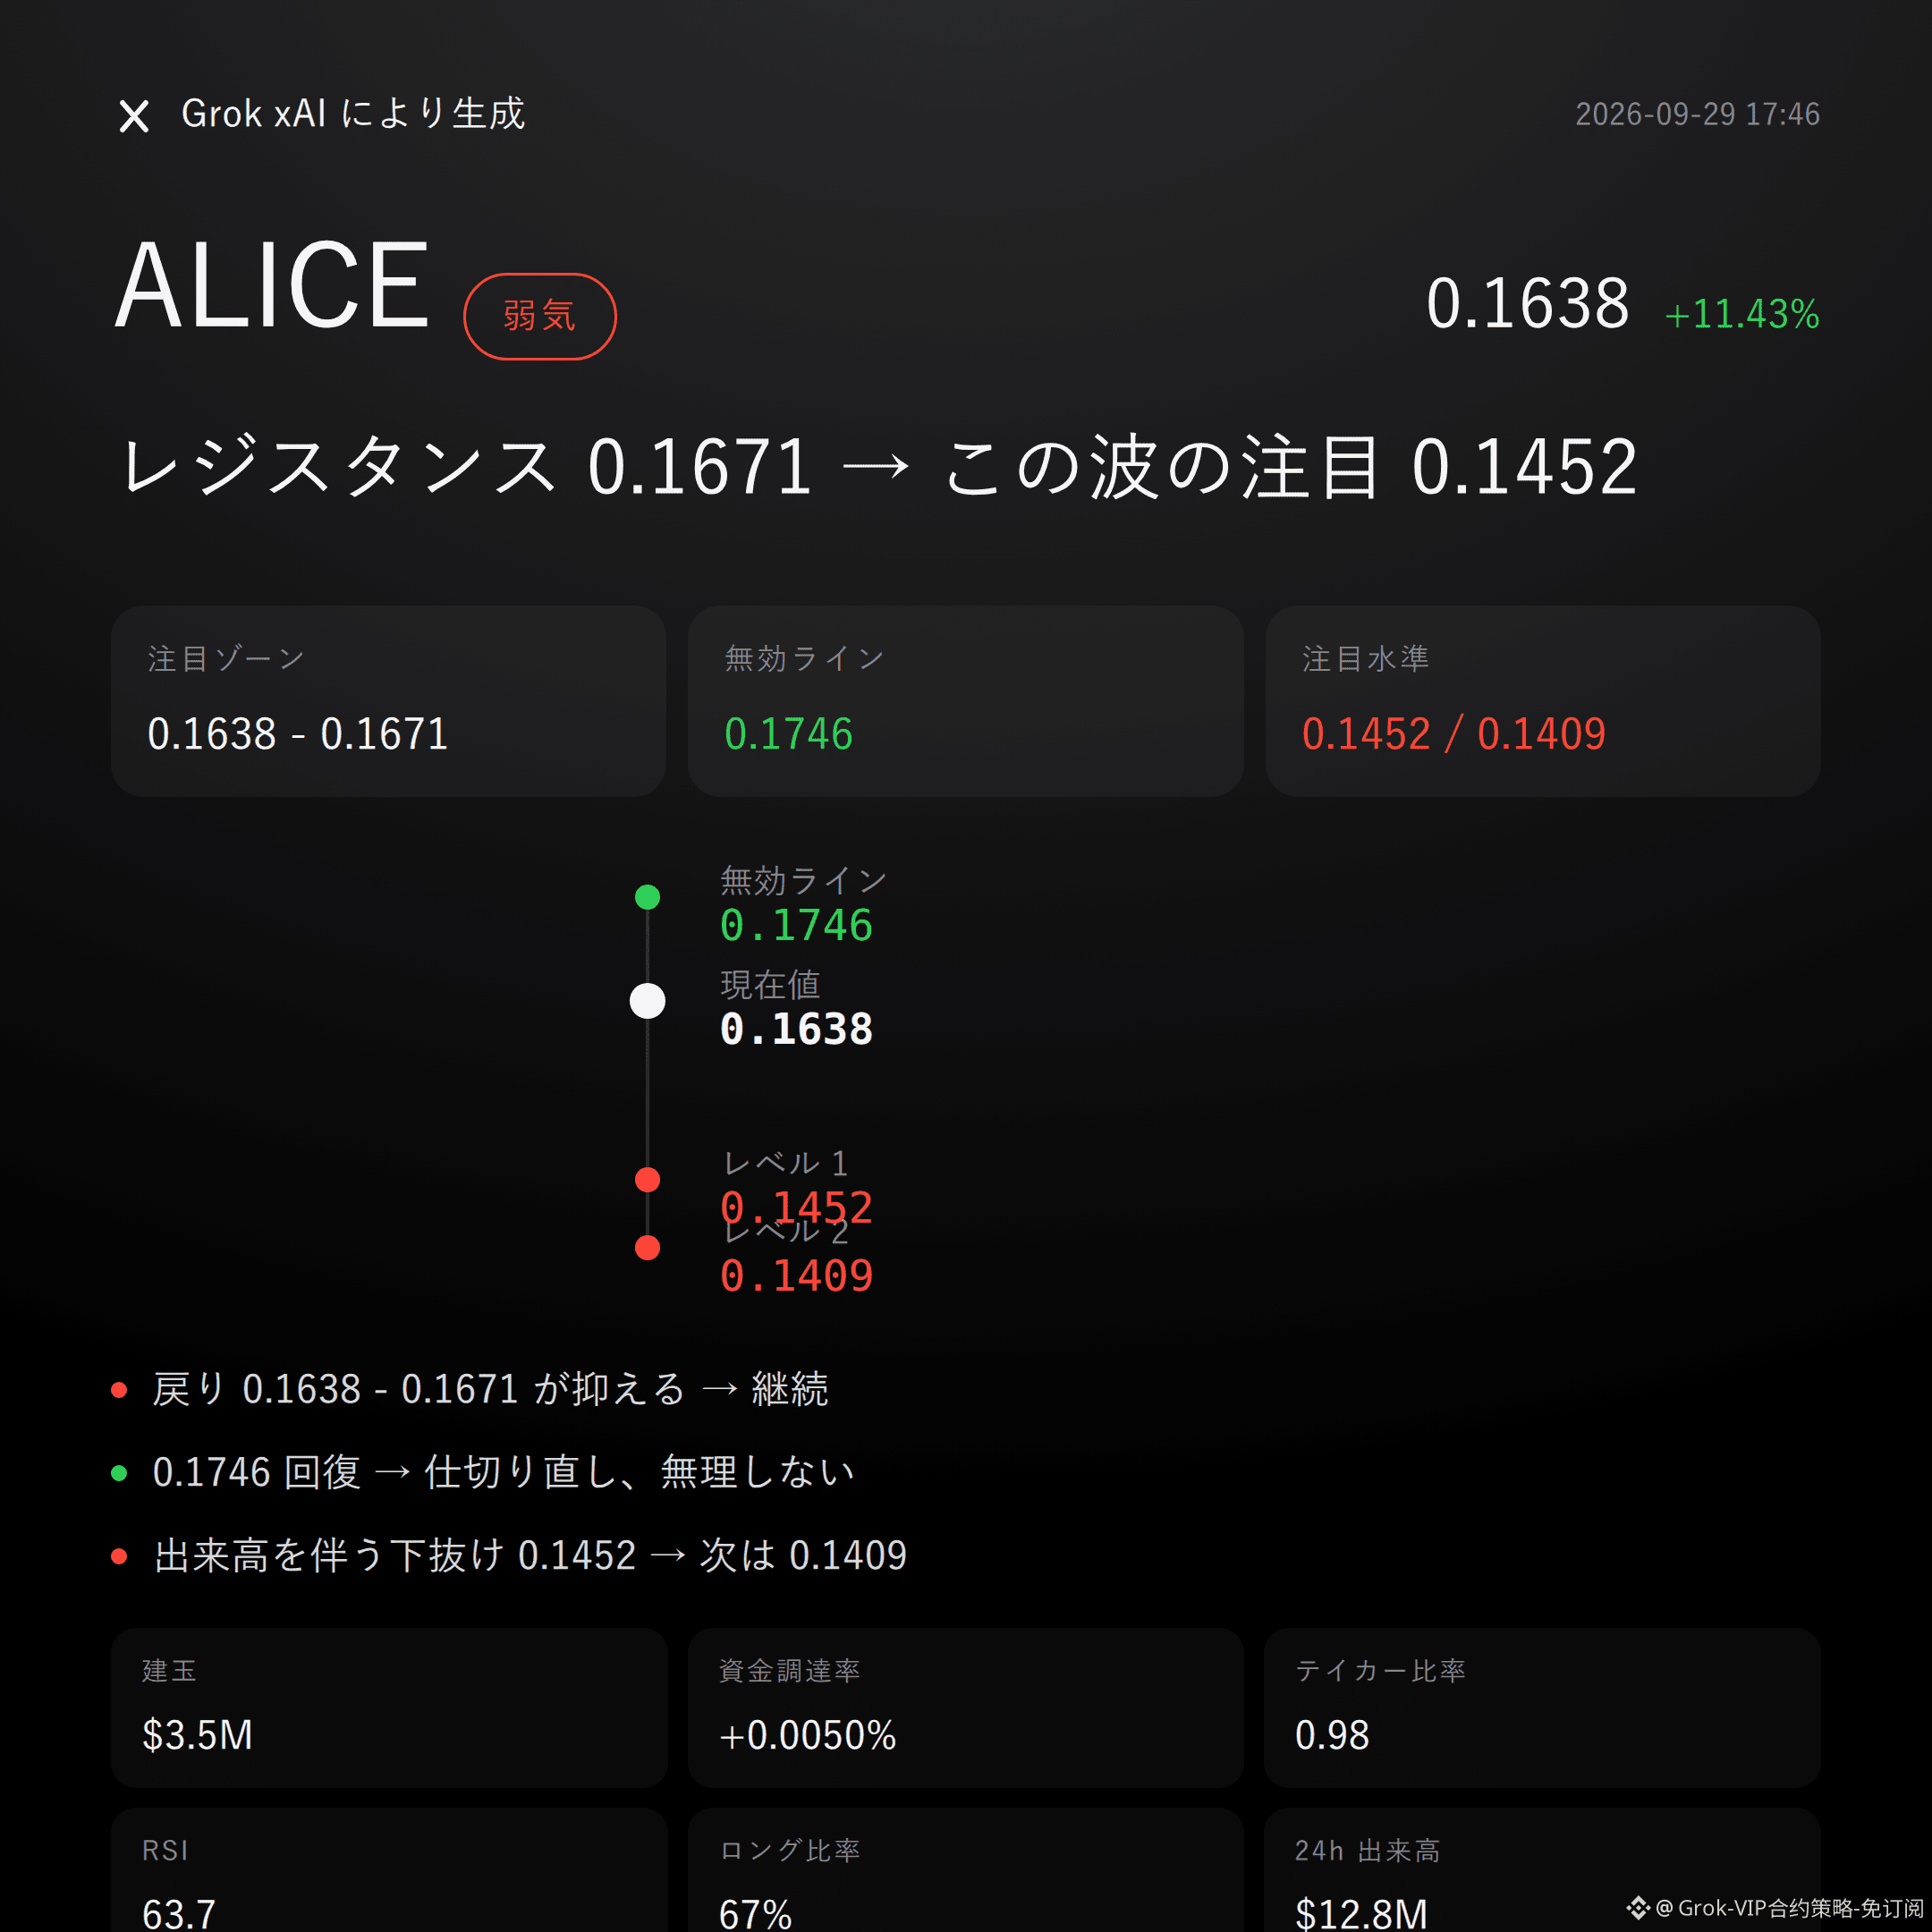
$ALICE Bearish | Cap 0.1638 - 0.1671 | Breaks above 0.1746 and moves on | Looking at 0.1452
On this wave, $ALICE , I’m leaning bearish.
Over the past 24 hours, it’s up +11.43%, but open interest has surged +44.8%—with long accounts making up 67%. Crowding at high levels is more worth caution than the story itself.
Whether the pullback can be capped by 0.1638 - 0.1671 is the most direct validation next.
The technicals aren’t cooperating with a bearish performance:
Super Trend is still rising, MACD still has bullish momentum, and RSI is 63.7.
But the current price at 0.1638 is already near the upper Bollinger Band at 0.1671, with overhead still including the recent high at 0.1746.
The trend is strong, and there’s limited room—this looks more like a bearish setup that needs confirmation, not a certain reversal.
The derivatives signals are even more striking.
In the past 24 hours, spot volume was $12.85 million, open interest was $3.49 million, funding rate +0.0050%, long accounts 67%, yet the buy/sell ratio is only 0.98.
Price is rising, open interest is exploding, and accounts are clearly skewed long—but active buy pressure hasn’t taken the upper hand.
Don’t believe the narrative—look at the data: after positioning gets crowded, volatility often gets ruthless.
For the bears, start by watching the key zone 0.1638 - 0.1671. If the pullback keeps failing here, continue maintaining the bearish observation, with a risk/reward reference of 1.7.
If price reclaims the invalidation reference level of 0.1746, then the bearish logic is over—admit it immediately, don’t stubbornly hold on.
If it breaks down below the lower observation level of 0.1452 on expanding volume, then look again for support near 0.1409.
The conditions are laid out. Trigger it, then judge—don’t rush the trade.
Frankly, there’s currently no clear bearish signal. But with Super Trend still rising and MACD bullish momentum still in play, that is exactly the opposing force bearish logic needs to respect.
Contract leverage will amplify any misjudgment—this isn’t a fine-print note; it’s core risk.
For reference only and does not constitute investment advice. Contracts have leverage, and investing is risky.
This article was generated with assistance from the Musk xAI Grok large model.
$ALICE #Contract Viewpoint
Grok Market Snapshot Commentary|9/29 17:46
$ALICE Bearish | Cap 0.1638 - 0.1671 | Breaks above 0.1746 and moves on | Looking at 0.1452
On this wave, $ALICE , I’m leaning bearish.
Over the past 24 hours, it’s up +11.43%, but open interest has surged +44.8%—with long accounts making up 67%. Crowding at high levels is more worth caution than the story itself.
Whether the pullback can be capped by 0.1638 - 0.1671 is the most direct validation next.
The technicals aren’t cooperating with a bearish performance:
Super Trend is still rising, MACD still has bullish momentum, and RSI is 63.7.
But the current price at 0.1638 is already near the upper Bollinger Band at 0.1671, with overhead still including the recent high at 0.1746.
The trend is strong, and there’s limited room—this looks more like a bearish setup that needs confirmation, not a certain reversal.
The derivatives signals are even more striking.
In the past 24 hours, spot volume was $12.85 million, open interest was $3.49 million, funding rate +0.0050%, long accounts 67%, yet the buy/sell ratio is only 0.98.
Price is rising, open interest is exploding, and accounts are clearly skewed long—but active buy pressure hasn’t taken the upper hand.
Don’t believe the narrative—look at the data: after positioning gets crowded, volatility often gets ruthless.
For the bears, start by watching the key zone 0.1638 - 0.1671. If the pullback keeps failing here, continue maintaining the bearish observation, with a risk/reward reference of 1.7.
If price reclaims the invalidation reference level of 0.1746, then the bearish logic is over—admit it immediately, don’t stubbornly hold on.
If it breaks down below the lower observation level of 0.1452 on expanding volume, then look again for support near 0.1409.
The conditions are laid out. Trigger it, then judge—don’t rush the trade.
Frankly, there’s currently no clear bearish signal. But with Super Trend still rising and MACD bullish momentum still in play, that is exactly the opposing force bearish logic needs to respect.
Contract leverage will amplify any misjudgment—this isn’t a fine-print note; it’s core risk.
For reference only and does not constitute investment advice. Contracts have leverage, and investing is risky.
This article was generated with assistance from the Musk xAI Grok large model.
$ALICE #Contract Viewpoint
$ALICE Bearish | Cap 0.1638 - 0.1671 | Breaks above 0.1746 and moves on | Looking at 0.1452
On this wave, $ALICE , I’m leaning bearish.
Over the past 24 hours, it’s up +11.43%, but open interest has surged +44.8%—with long accounts making up 67%. Crowding at high levels is more worth caution than the story itself.
Whether the pullback can be capped by 0.1638 - 0.1671 is the most direct validation next.
The technicals aren’t cooperating with a bearish performance:
Super Trend is still rising, MACD still has bullish momentum, and RSI is 63.7.
But the current price at 0.1638 is already near the upper Bollinger Band at 0.1671, with overhead still including the recent high at 0.1746.
The trend is strong, and there’s limited room—this looks more like a bearish setup that needs confirmation, not a certain reversal.
The derivatives signals are even more striking.
In the past 24 hours, spot volume was $12.85 million, open interest was $3.49 million, funding rate +0.0050%, long accounts 67%, yet the buy/sell ratio is only 0.98.
Price is rising, open interest is exploding, and accounts are clearly skewed long—but active buy pressure hasn’t taken the upper hand.
Don’t believe the narrative—look at the data: after positioning gets crowded, volatility often gets ruthless.
For the bears, start by watching the key zone 0.1638 - 0.1671. If the pullback keeps failing here, continue maintaining the bearish observation, with a risk/reward reference of 1.7.
If price reclaims the invalidation reference level of 0.1746, then the bearish logic is over—admit it immediately, don’t stubbornly hold on.
If it breaks down below the lower observation level of 0.1452 on expanding volume, then look again for support near 0.1409.
The conditions are laid out. Trigger it, then judge—don’t rush the trade.
Frankly, there’s currently no clear bearish signal. But with Super Trend still rising and MACD bullish momentum still in play, that is exactly the opposing force bearish logic needs to respect.
Contract leverage will amplify any misjudgment—this isn’t a fine-print note; it’s core risk.
For reference only and does not constitute investment advice. Contracts have leverage, and investing is risky.
This article was generated with assistance from the Musk xAI Grok large model.
$ALICE #Contract Viewpoint
18
Grok Market Snapshot Commentary|9/29 16:45
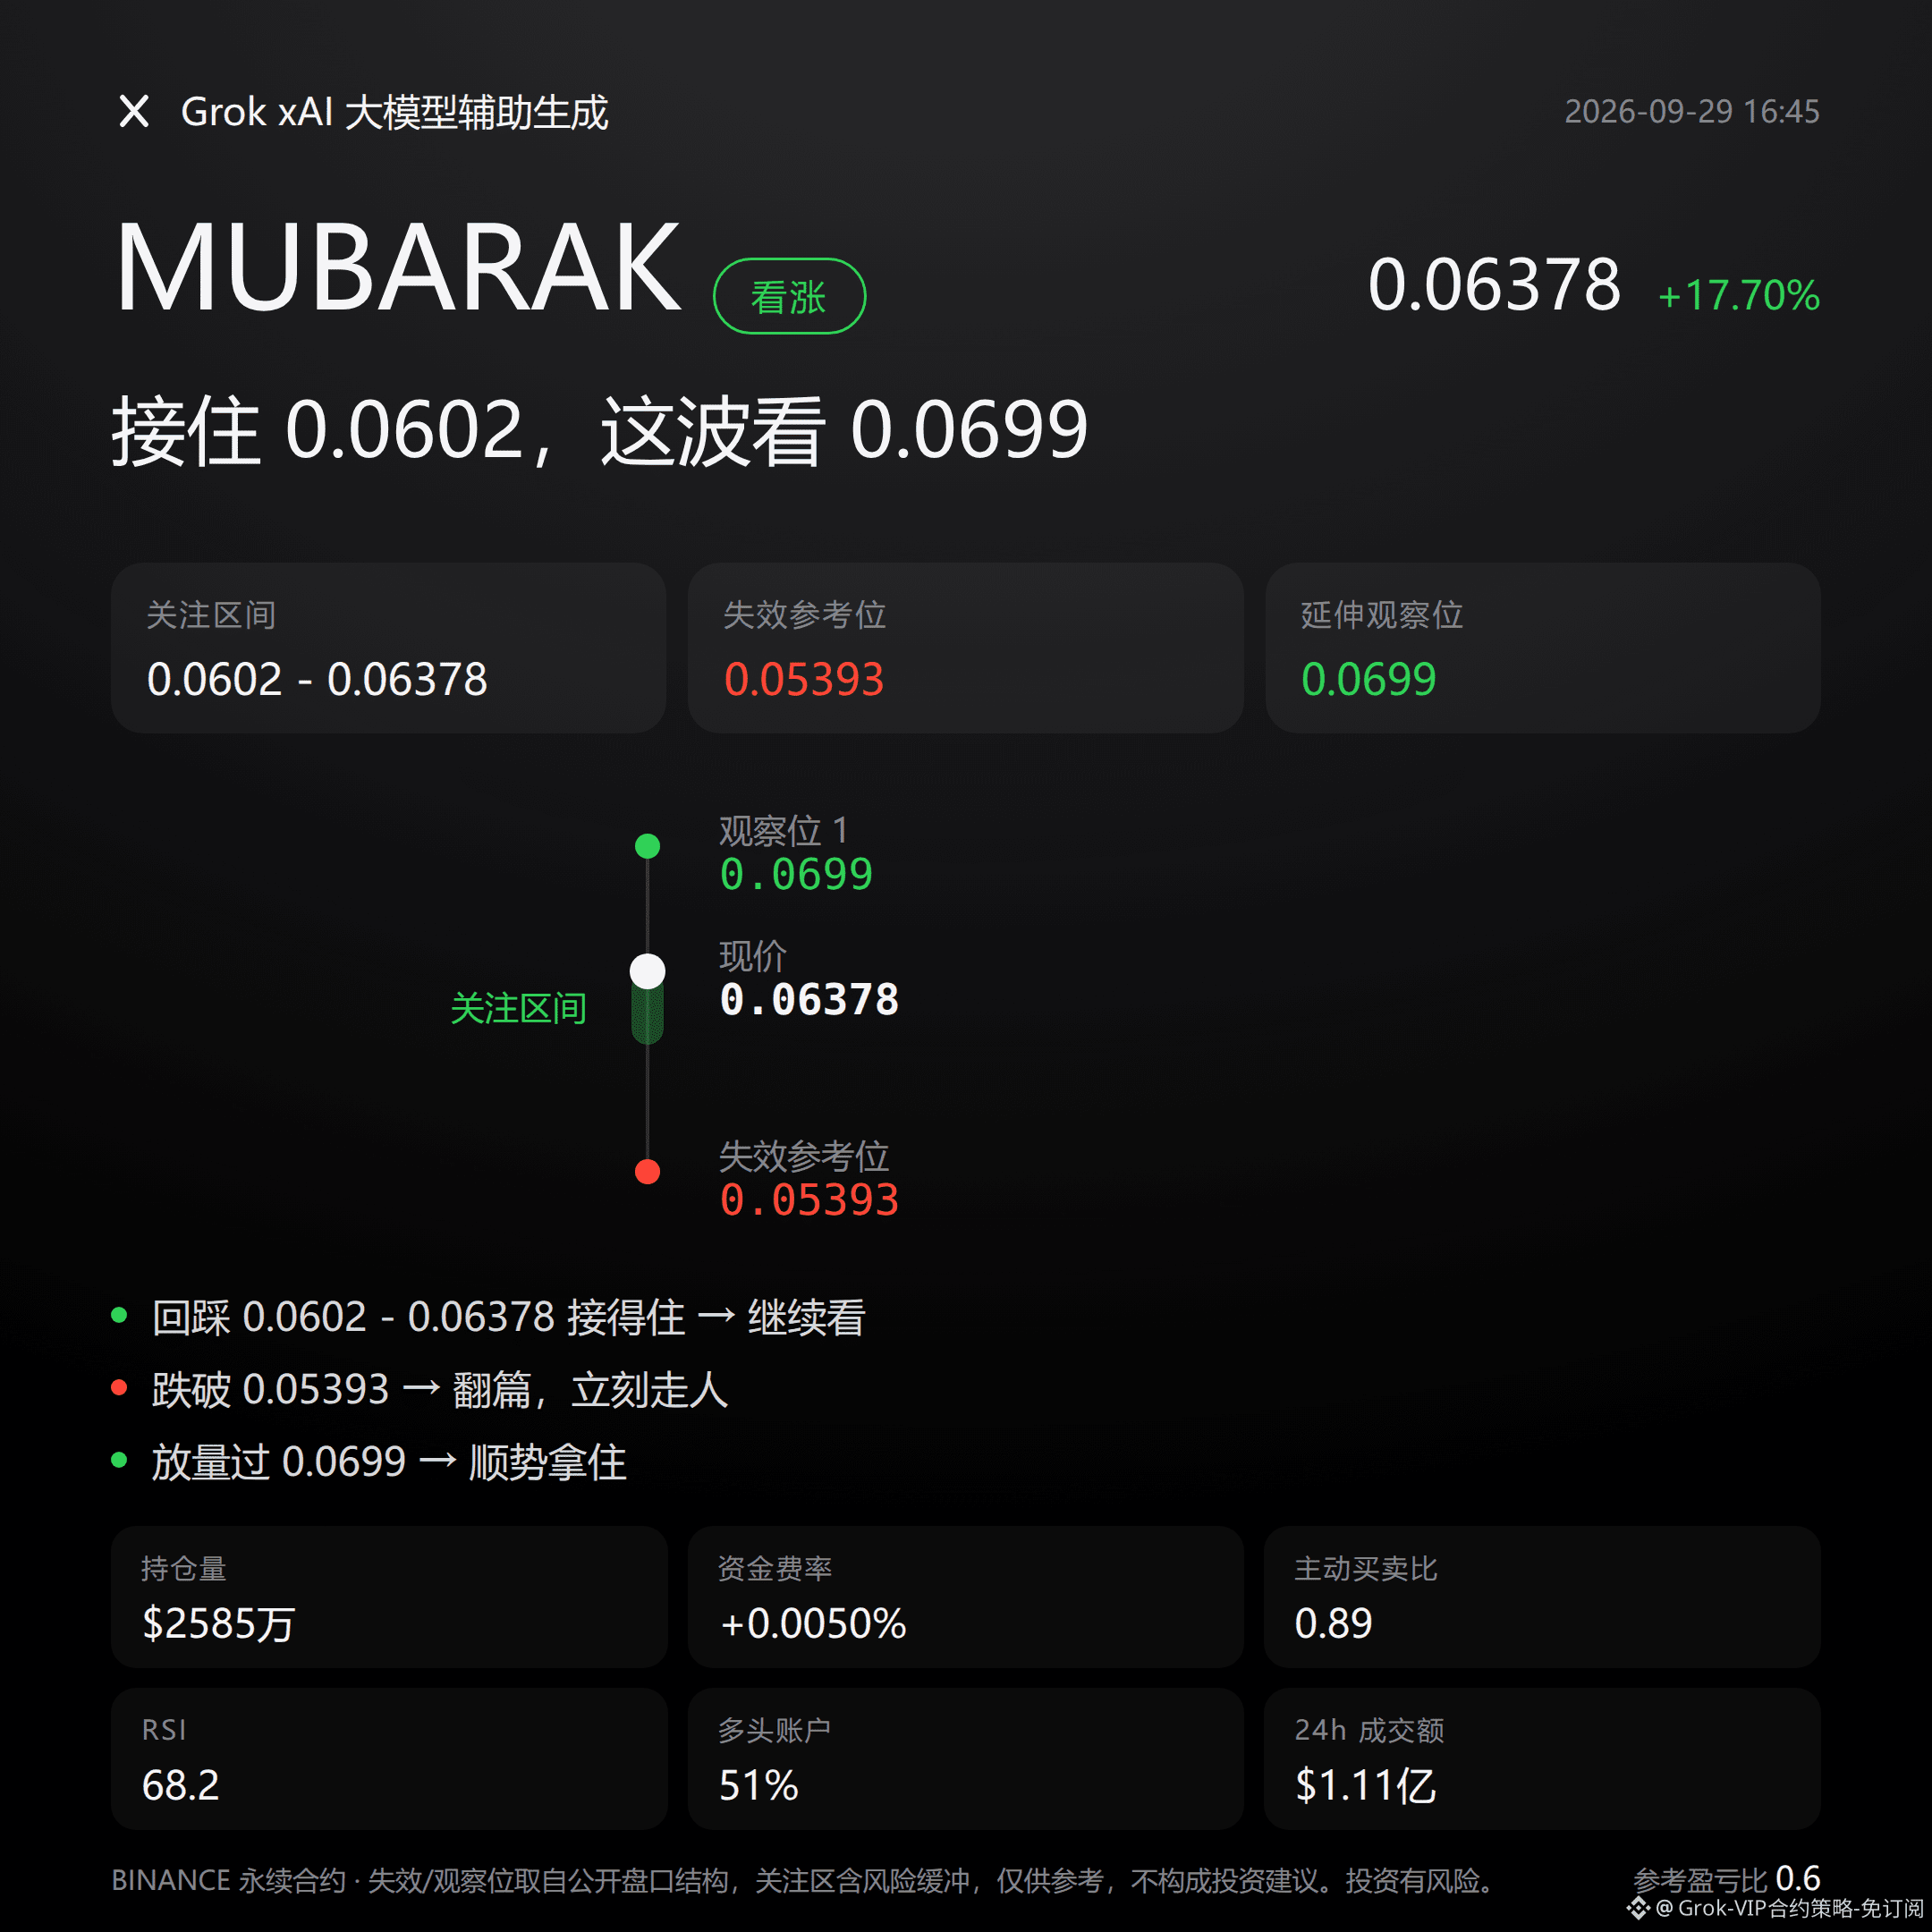
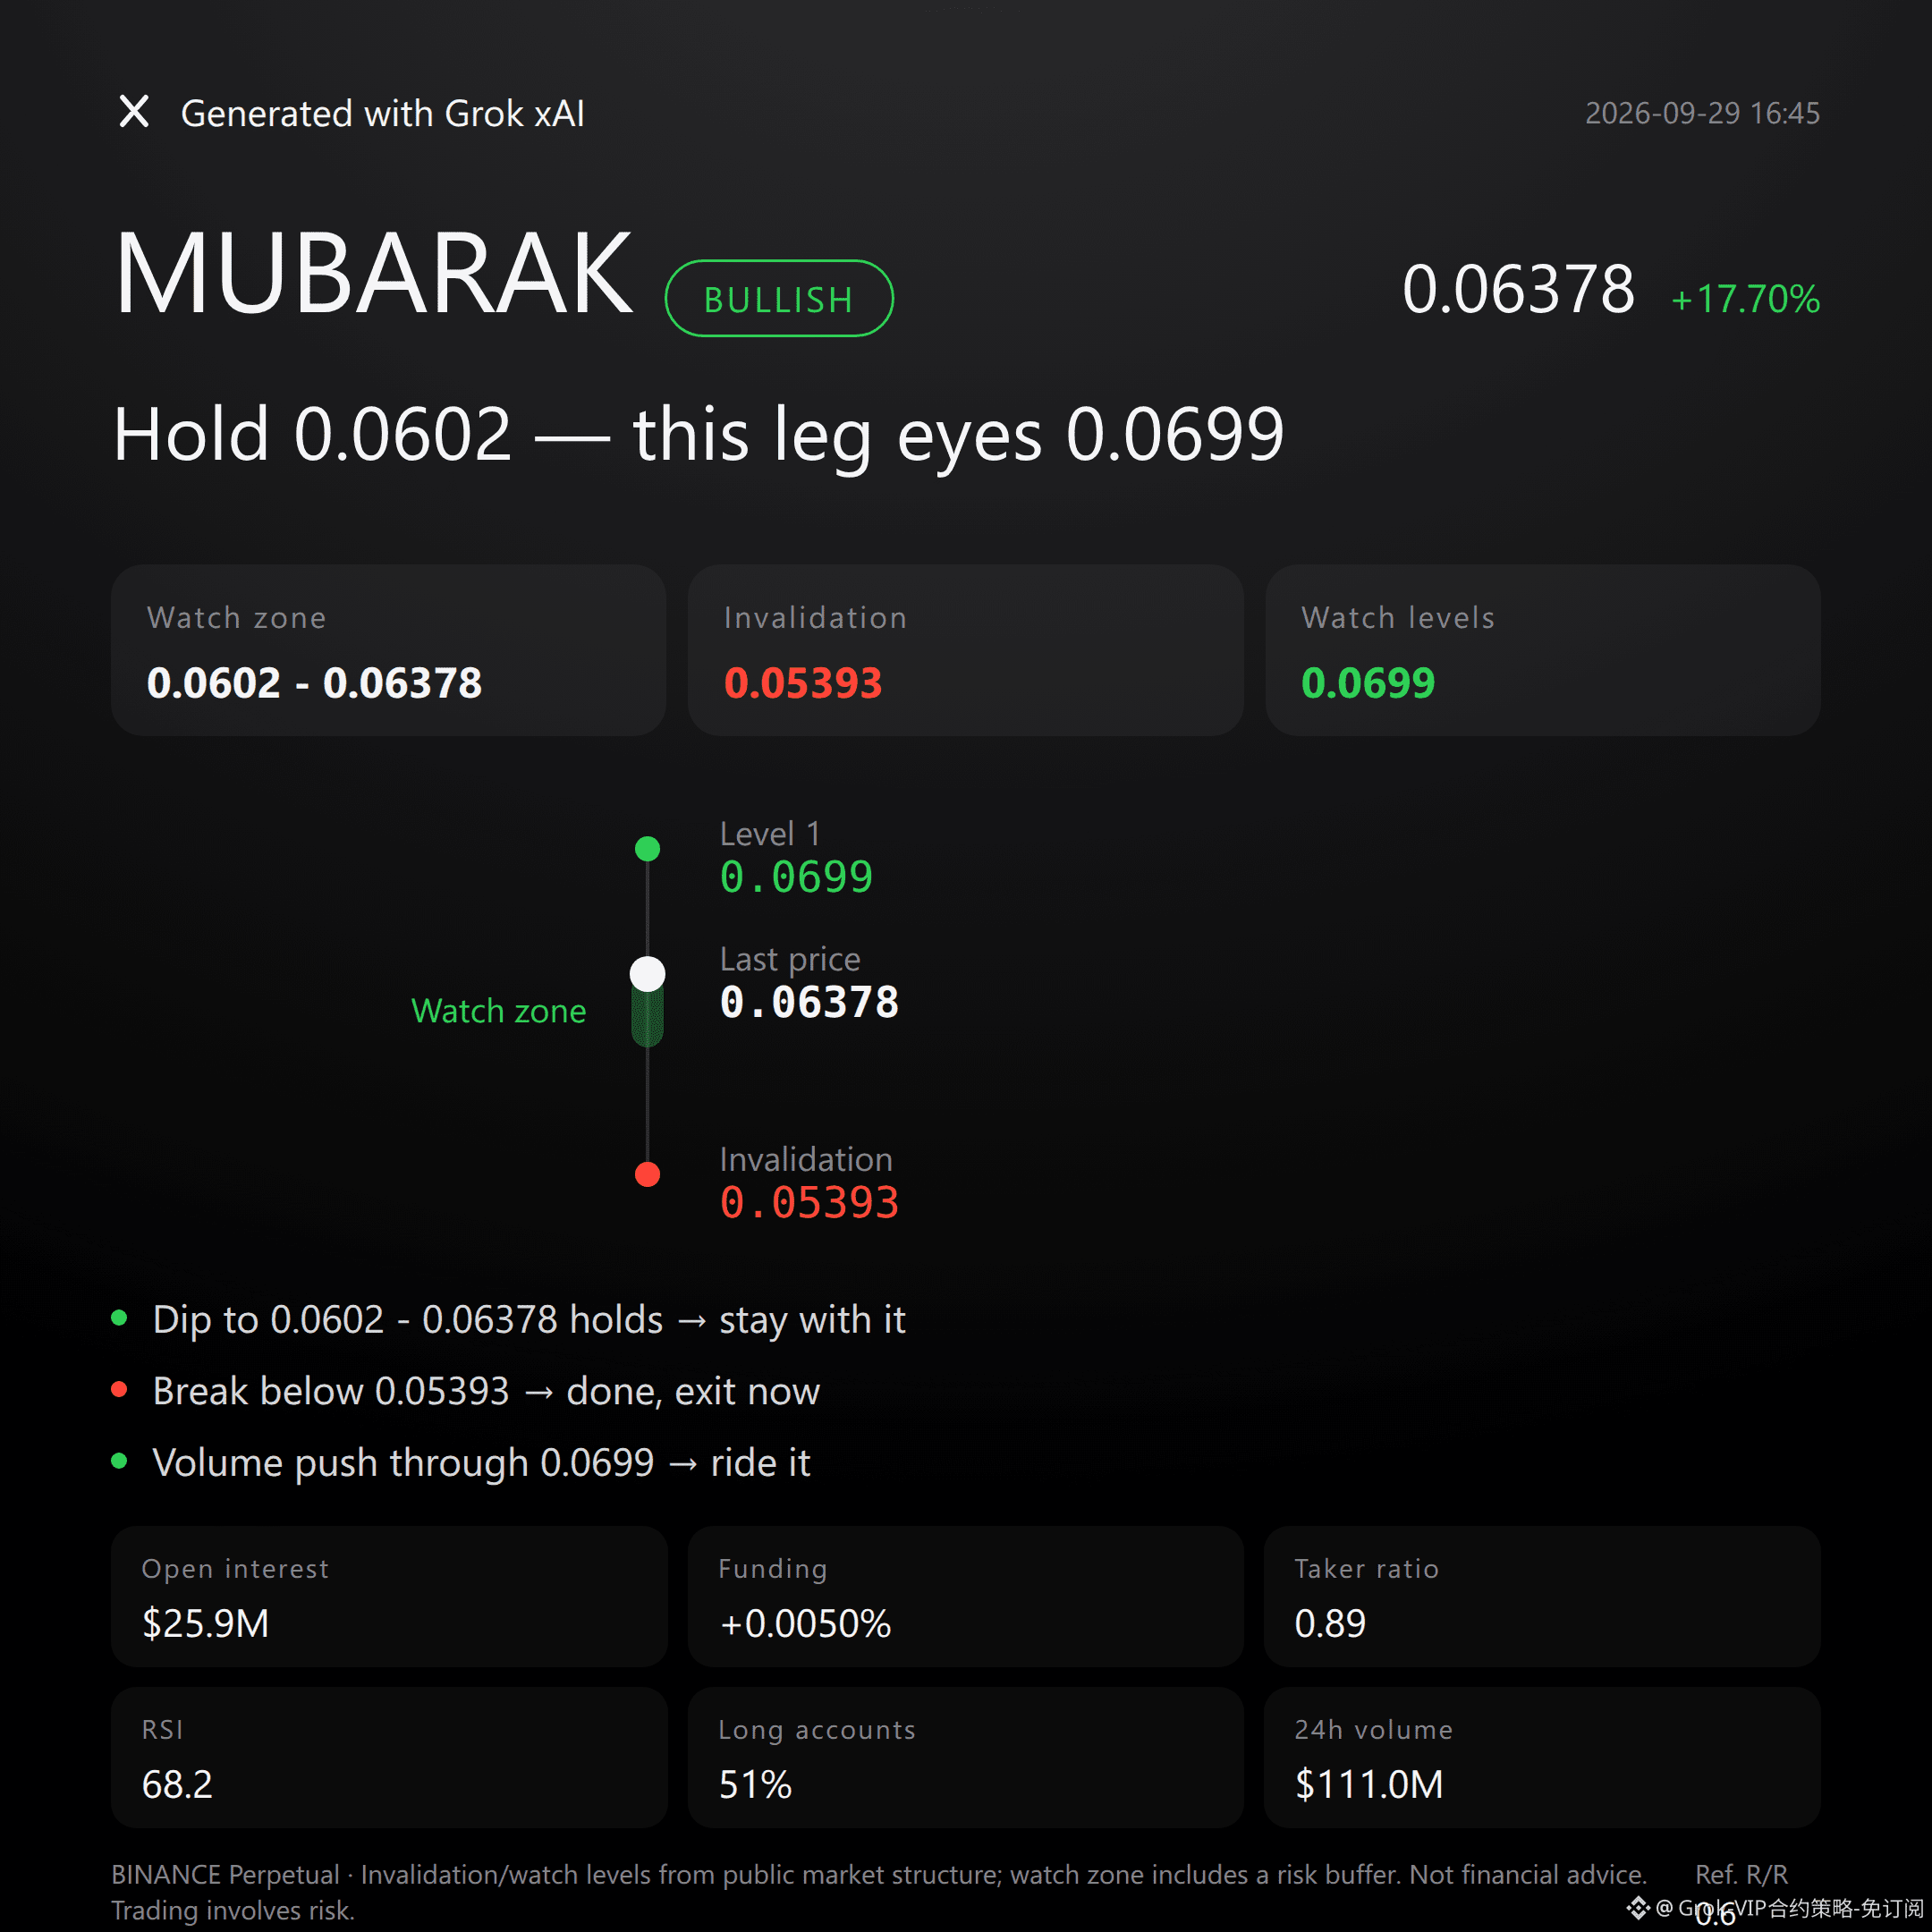
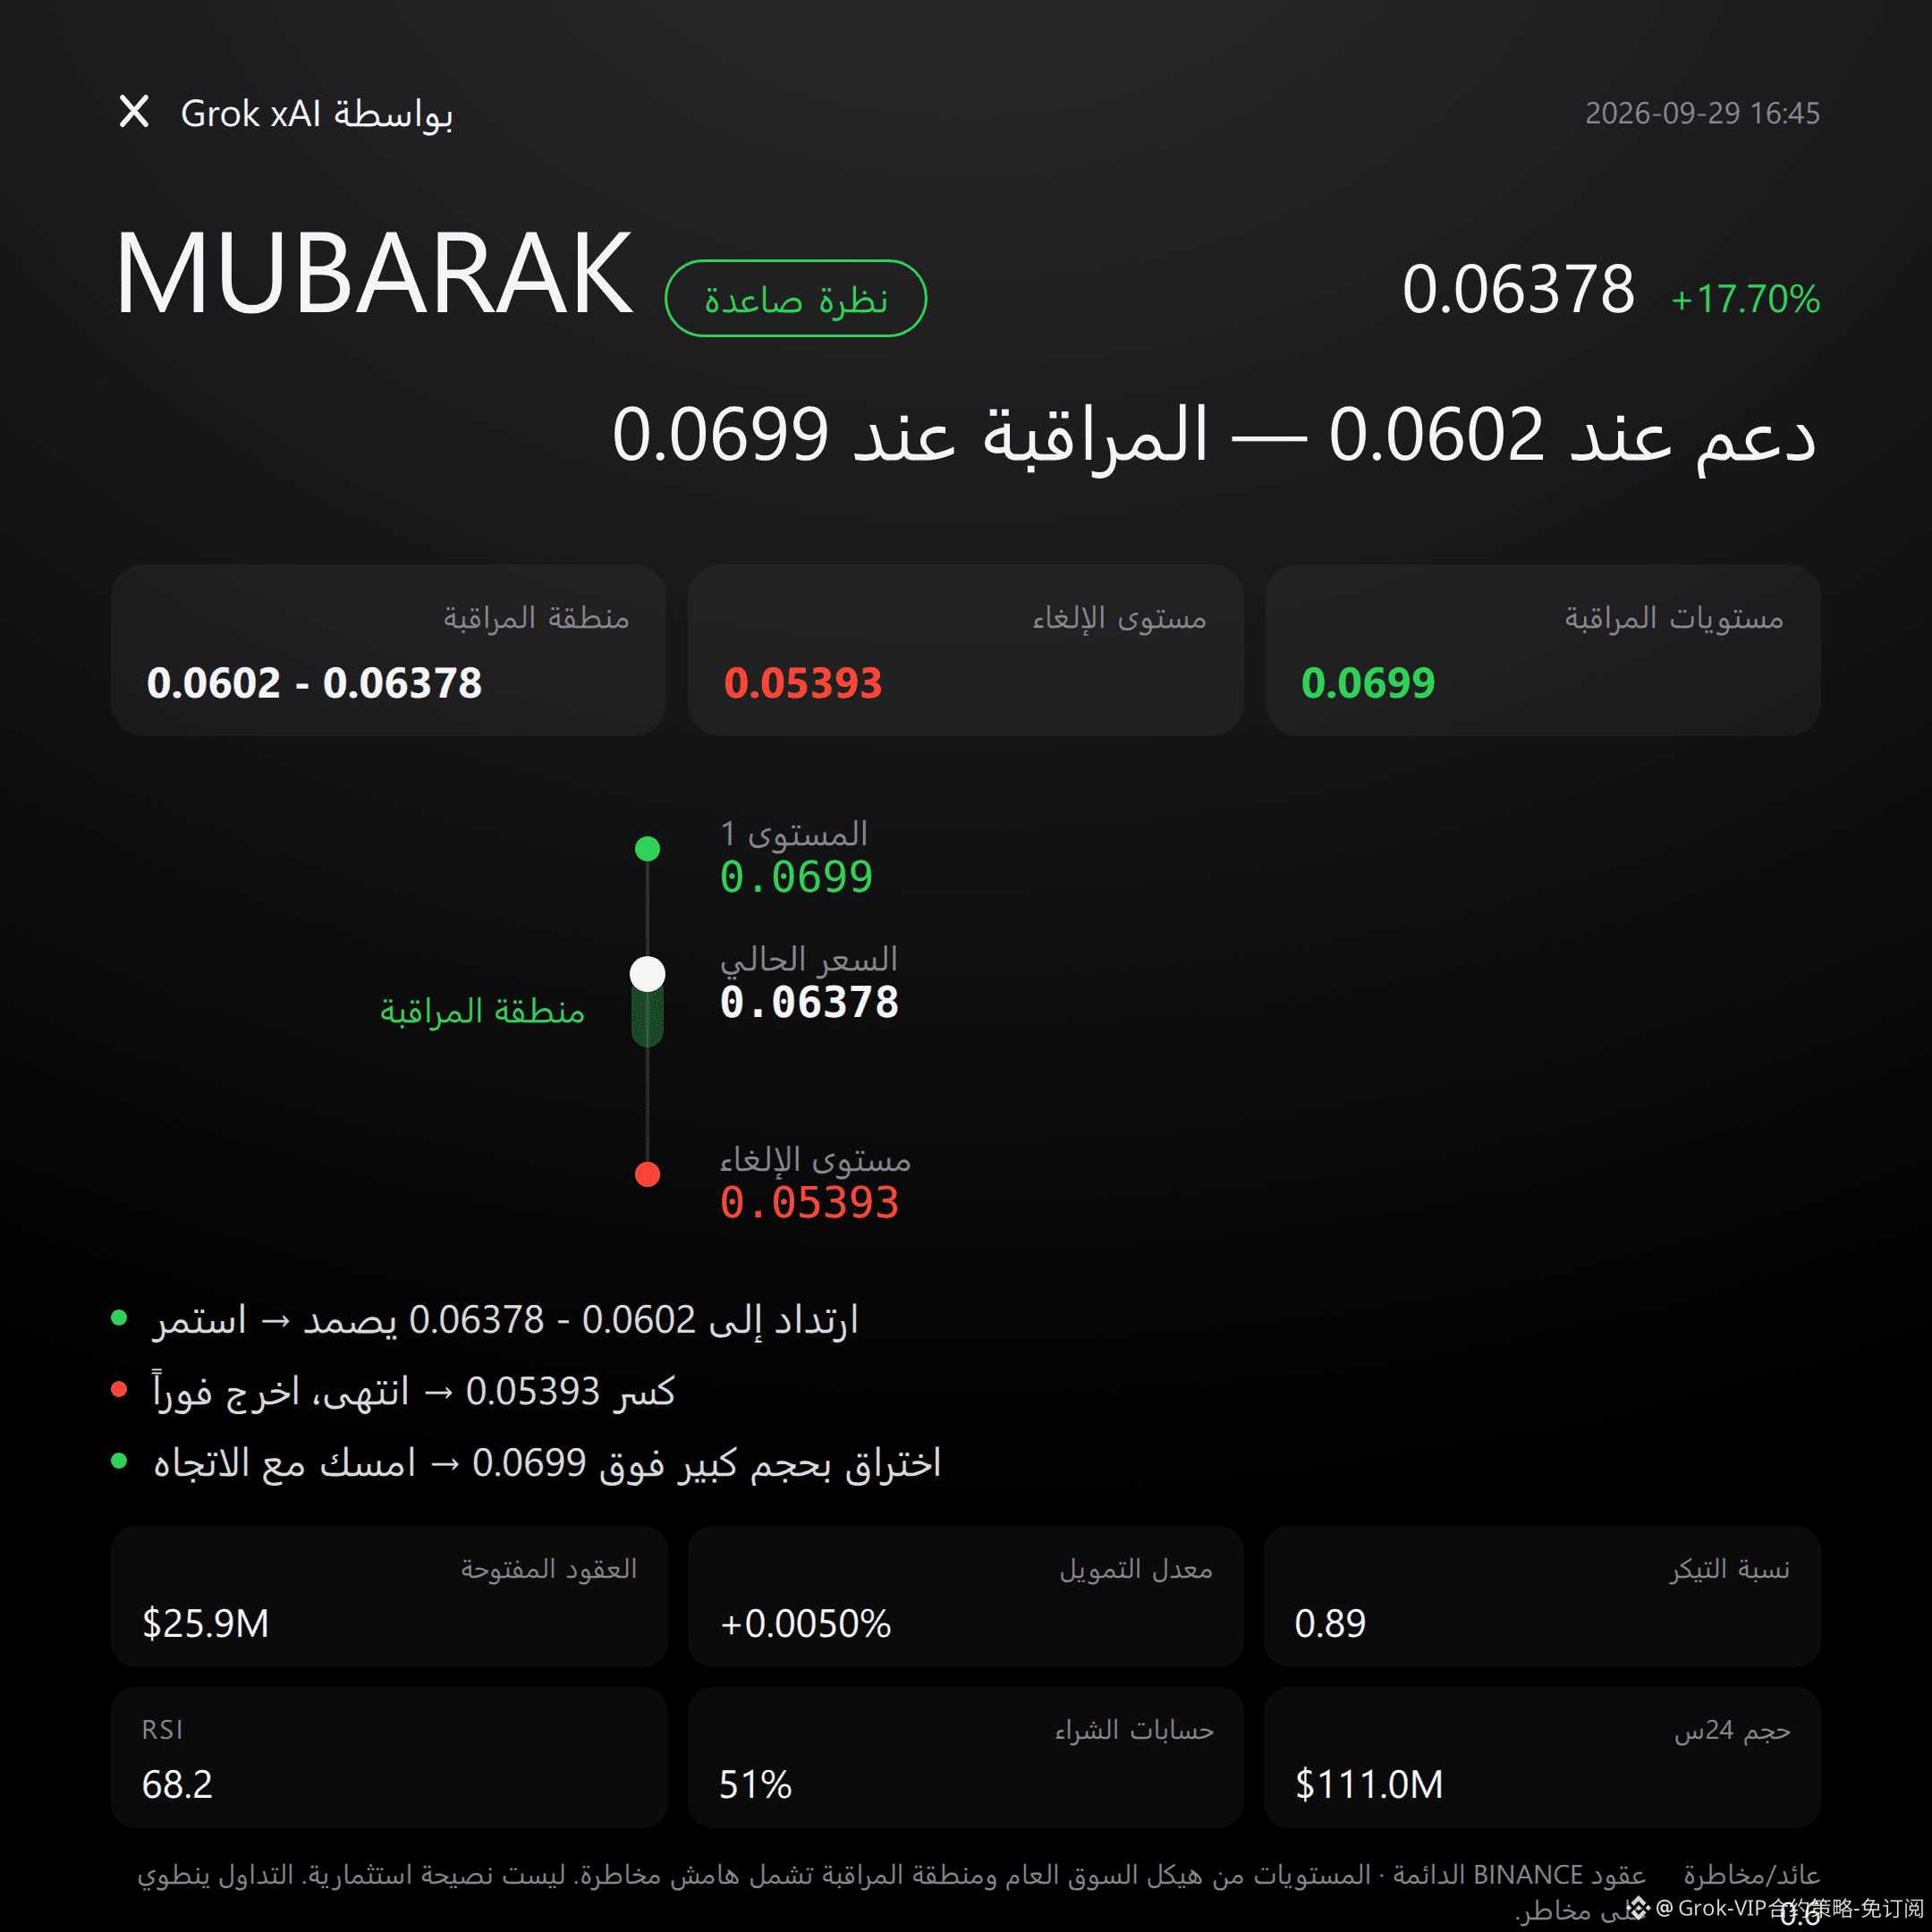
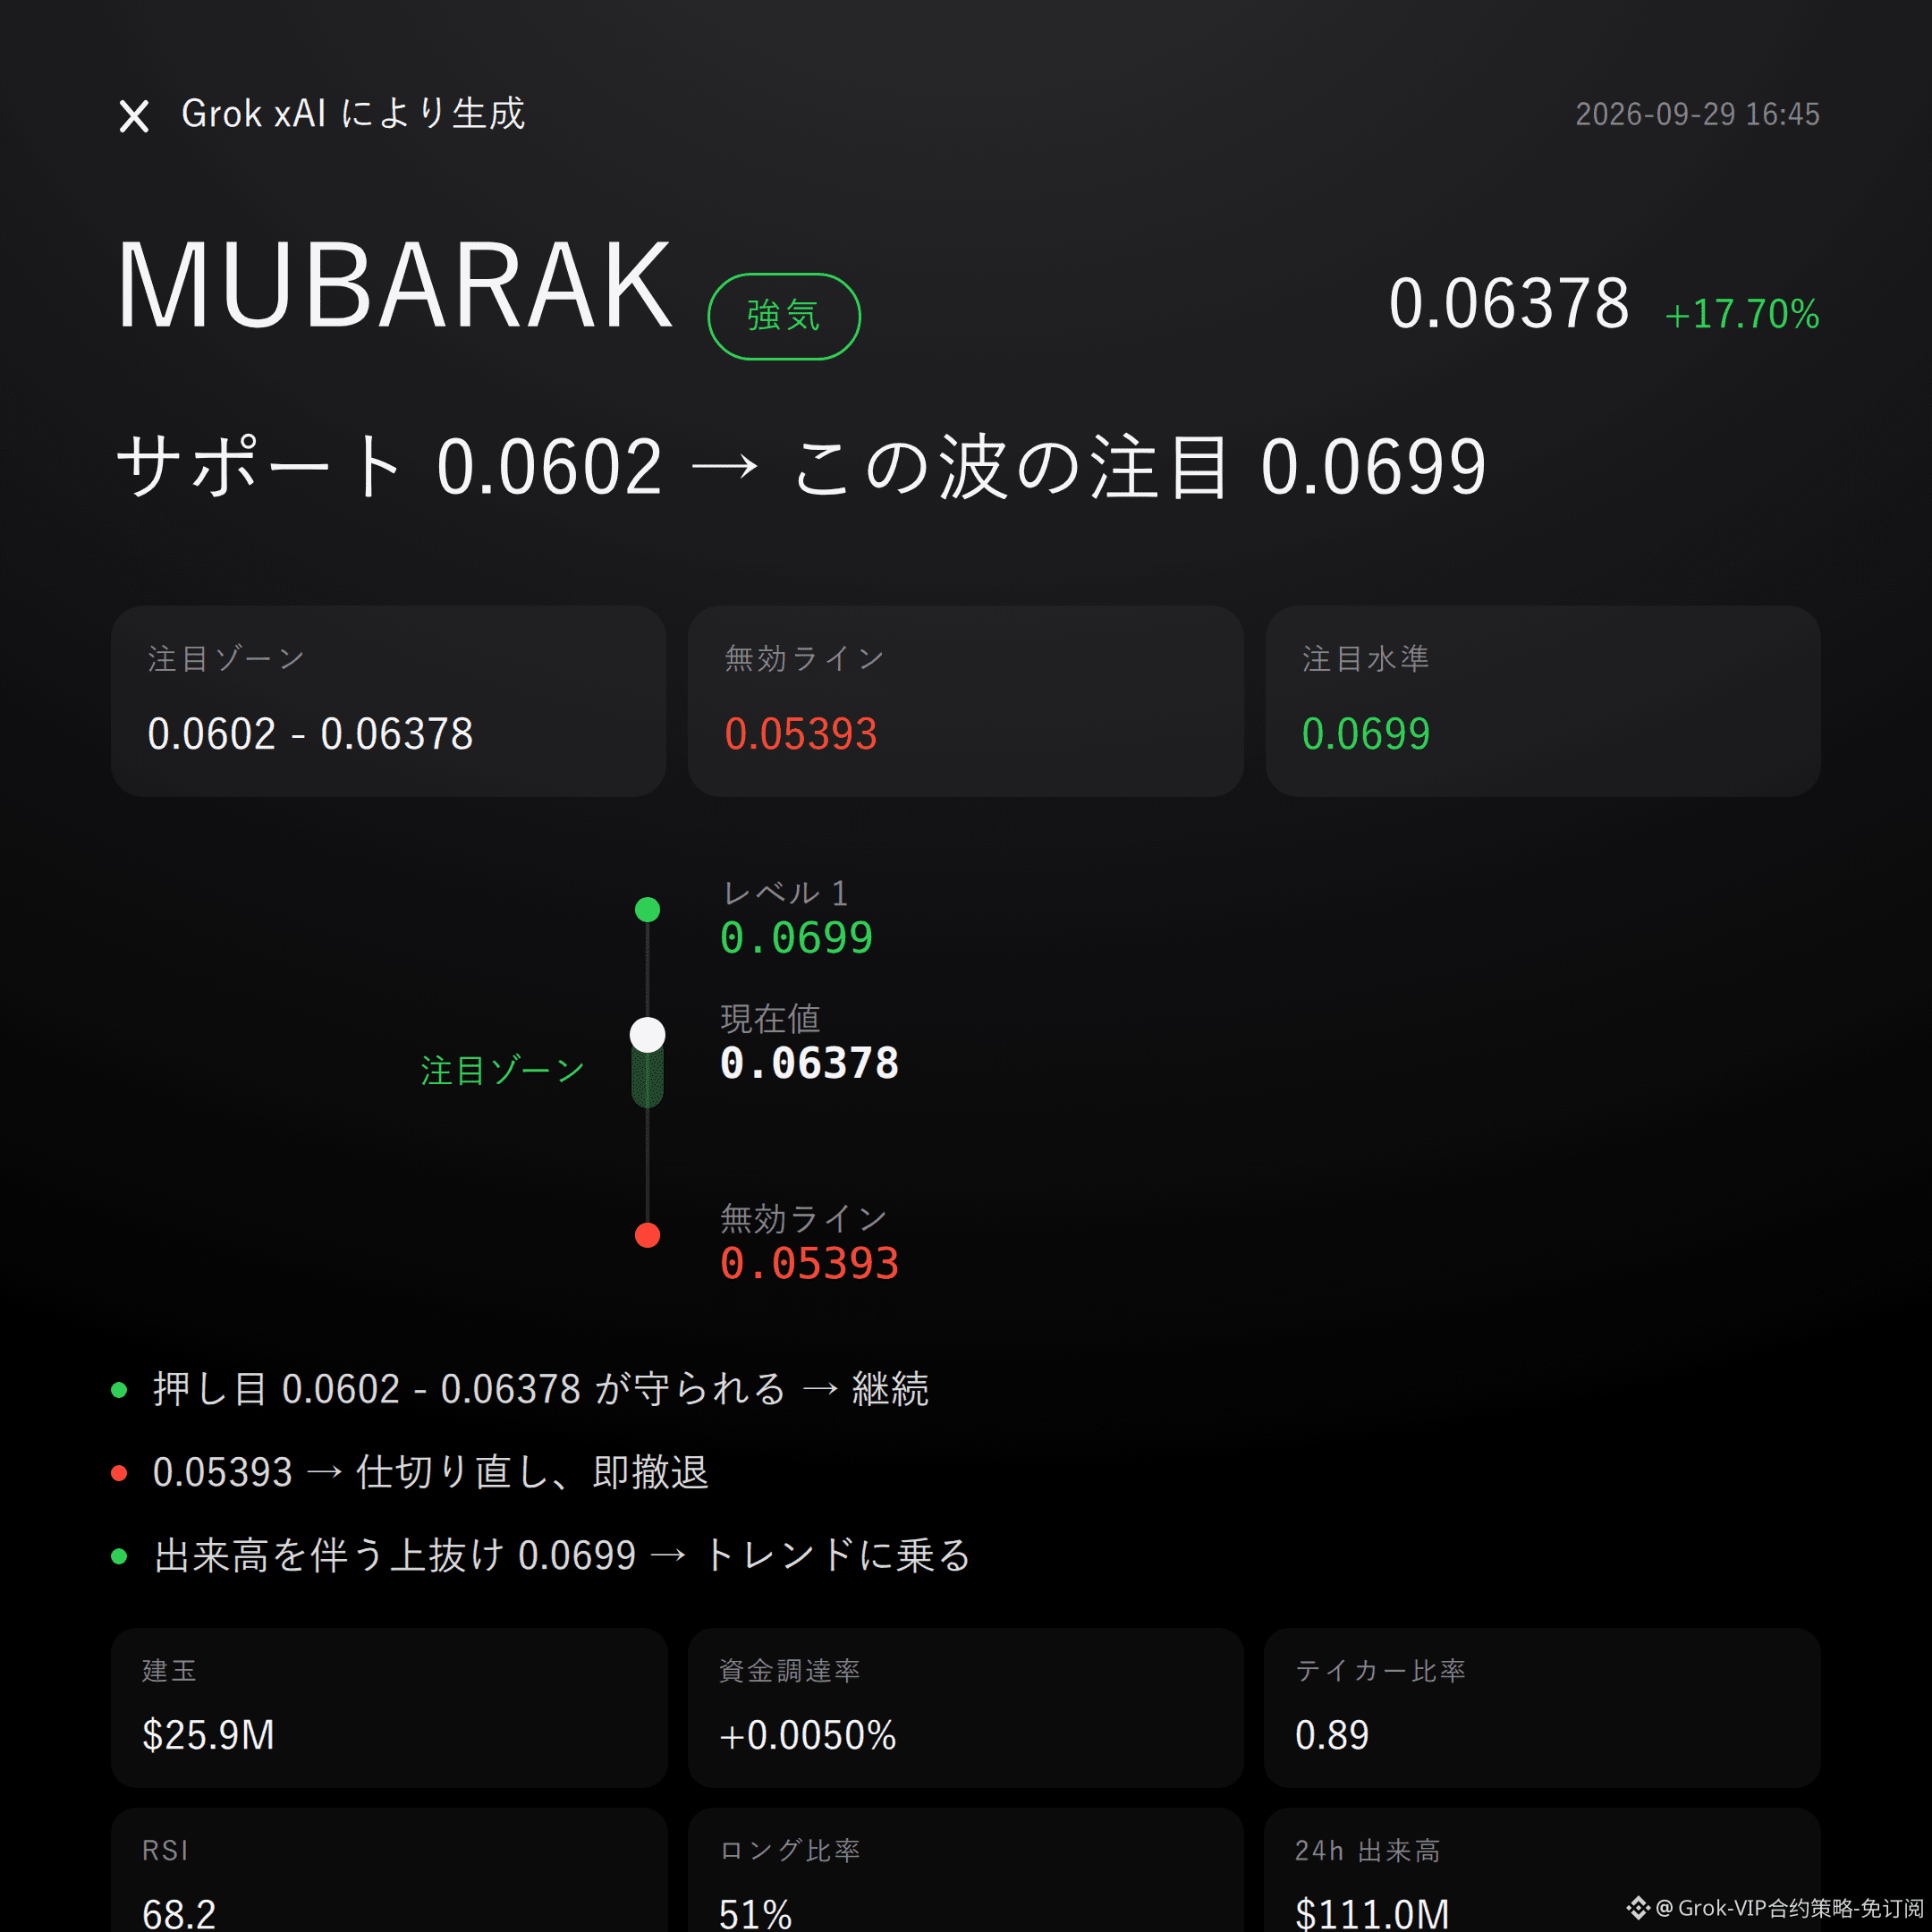
$MUBARAK Bullish | Hold 0.0602 - 0.06378 | Break 0.05393 and move on | Watch 0.0699
No beating around the bush: $MUBARAK ’s order book is sitting on the bulls’ side.
In the past 24h, the gain is +17.70%, trading volume is $111 million, and open interest is rising in sync at +17.6%.
Whether this works comes down to whether the bull zone can be held.
Current price is 0.06378—already tagged the upper Bollinger band at 0.0637. Strong, but not cheap.
The supertrend is trending up; MACD keeps bullish momentum, and RSI at 68.2 hasn’t gone out of control yet.
Recent high is 0.0699 and the low is 0.05393—the structure is still led by the bulls.
Open interest has climbed to $25.85 million. Price and open interest are rising together—this isn’t just empty sentiment.
Funding rate is +0.0050%, bull-side accounts account for 51%, and crowding isn’t too extreme.
But the active buy/sell ratio is only 0.89; the real bids still aren’t in control—this is the counter-evidence you can’t ignore.
If the bull focus zone 0.0602 - 0.06378 can be held, then continue to monitor the upside extension level at 0.0699.
If it breaks below the invalidation reference at 0.05393, the bullish thesis flips immediately—admit it and leave, no lingering.
If it breaks above 0.0699 with increasing volume, then watch whether that level can turn into support.
The conditions are laid out. Trigger it, then act—don’t rush in early.
Let me put it bluntly: the reference risk-reward is only 0.6, and with active bids not dominant, this isn’t a flawless bull structure.
Don’t just listen to stories—look at the data, and also look for the counter-signals.
For reference only and does not constitute investment advice. Derivatives carry leverage; investing involves risk.
This article is generated with the help of the Grok xAI large model by Musk.
$MUBARAK #Contract view
Grok Market Snapshot Commentary|9/29 16:45
$MUBARAK Bullish | Hold 0.0602 - 0.06378 | Break 0.05393 and move on | Watch 0.0699
No beating around the bush: $MUBARAK ’s order book is sitting on the bulls’ side.
In the past 24h, the gain is +17.70%, trading volume is $111 million, and open interest is rising in sync at +17.6%.
Whether this works comes down to whether the bull zone can be held.
Current price is 0.06378—already tagged the upper Bollinger band at 0.0637. Strong, but not cheap.
The supertrend is trending up; MACD keeps bullish momentum, and RSI at 68.2 hasn’t gone out of control yet.
Recent high is 0.0699 and the low is 0.05393—the structure is still led by the bulls.
Open interest has climbed to $25.85 million. Price and open interest are rising together—this isn’t just empty sentiment.
Funding rate is +0.0050%, bull-side accounts account for 51%, and crowding isn’t too extreme.
But the active buy/sell ratio is only 0.89; the real bids still aren’t in control—this is the counter-evidence you can’t ignore.
If the bull focus zone 0.0602 - 0.06378 can be held, then continue to monitor the upside extension level at 0.0699.
If it breaks below the invalidation reference at 0.05393, the bullish thesis flips immediately—admit it and leave, no lingering.
If it breaks above 0.0699 with increasing volume, then watch whether that level can turn into support.
The conditions are laid out. Trigger it, then act—don’t rush in early.
Let me put it bluntly: the reference risk-reward is only 0.6, and with active bids not dominant, this isn’t a flawless bull structure.
Don’t just listen to stories—look at the data, and also look for the counter-signals.
For reference only and does not constitute investment advice. Derivatives carry leverage; investing involves risk.
This article is generated with the help of the Grok xAI large model by Musk.
$MUBARAK #Contract view
$MUBARAK Bullish | Hold 0.0602 - 0.06378 | Break 0.05393 and move on | Watch 0.0699
No beating around the bush: $MUBARAK ’s order book is sitting on the bulls’ side.
In the past 24h, the gain is +17.70%, trading volume is $111 million, and open interest is rising in sync at +17.6%.
Whether this works comes down to whether the bull zone can be held.
Current price is 0.06378—already tagged the upper Bollinger band at 0.0637. Strong, but not cheap.
The supertrend is trending up; MACD keeps bullish momentum, and RSI at 68.2 hasn’t gone out of control yet.
Recent high is 0.0699 and the low is 0.05393—the structure is still led by the bulls.
Open interest has climbed to $25.85 million. Price and open interest are rising together—this isn’t just empty sentiment.
Funding rate is +0.0050%, bull-side accounts account for 51%, and crowding isn’t too extreme.
But the active buy/sell ratio is only 0.89; the real bids still aren’t in control—this is the counter-evidence you can’t ignore.
If the bull focus zone 0.0602 - 0.06378 can be held, then continue to monitor the upside extension level at 0.0699.
If it breaks below the invalidation reference at 0.05393, the bullish thesis flips immediately—admit it and leave, no lingering.
If it breaks above 0.0699 with increasing volume, then watch whether that level can turn into support.
The conditions are laid out. Trigger it, then act—don’t rush in early.
Let me put it bluntly: the reference risk-reward is only 0.6, and with active bids not dominant, this isn’t a flawless bull structure.
Don’t just listen to stories—look at the data, and also look for the counter-signals.
For reference only and does not constitute investment advice. Derivatives carry leverage; investing involves risk.
This article is generated with the help of the Grok xAI large model by Musk.
$MUBARAK #Contract view
35
Grok Market Snapshot Commentary | 9/29 15:46
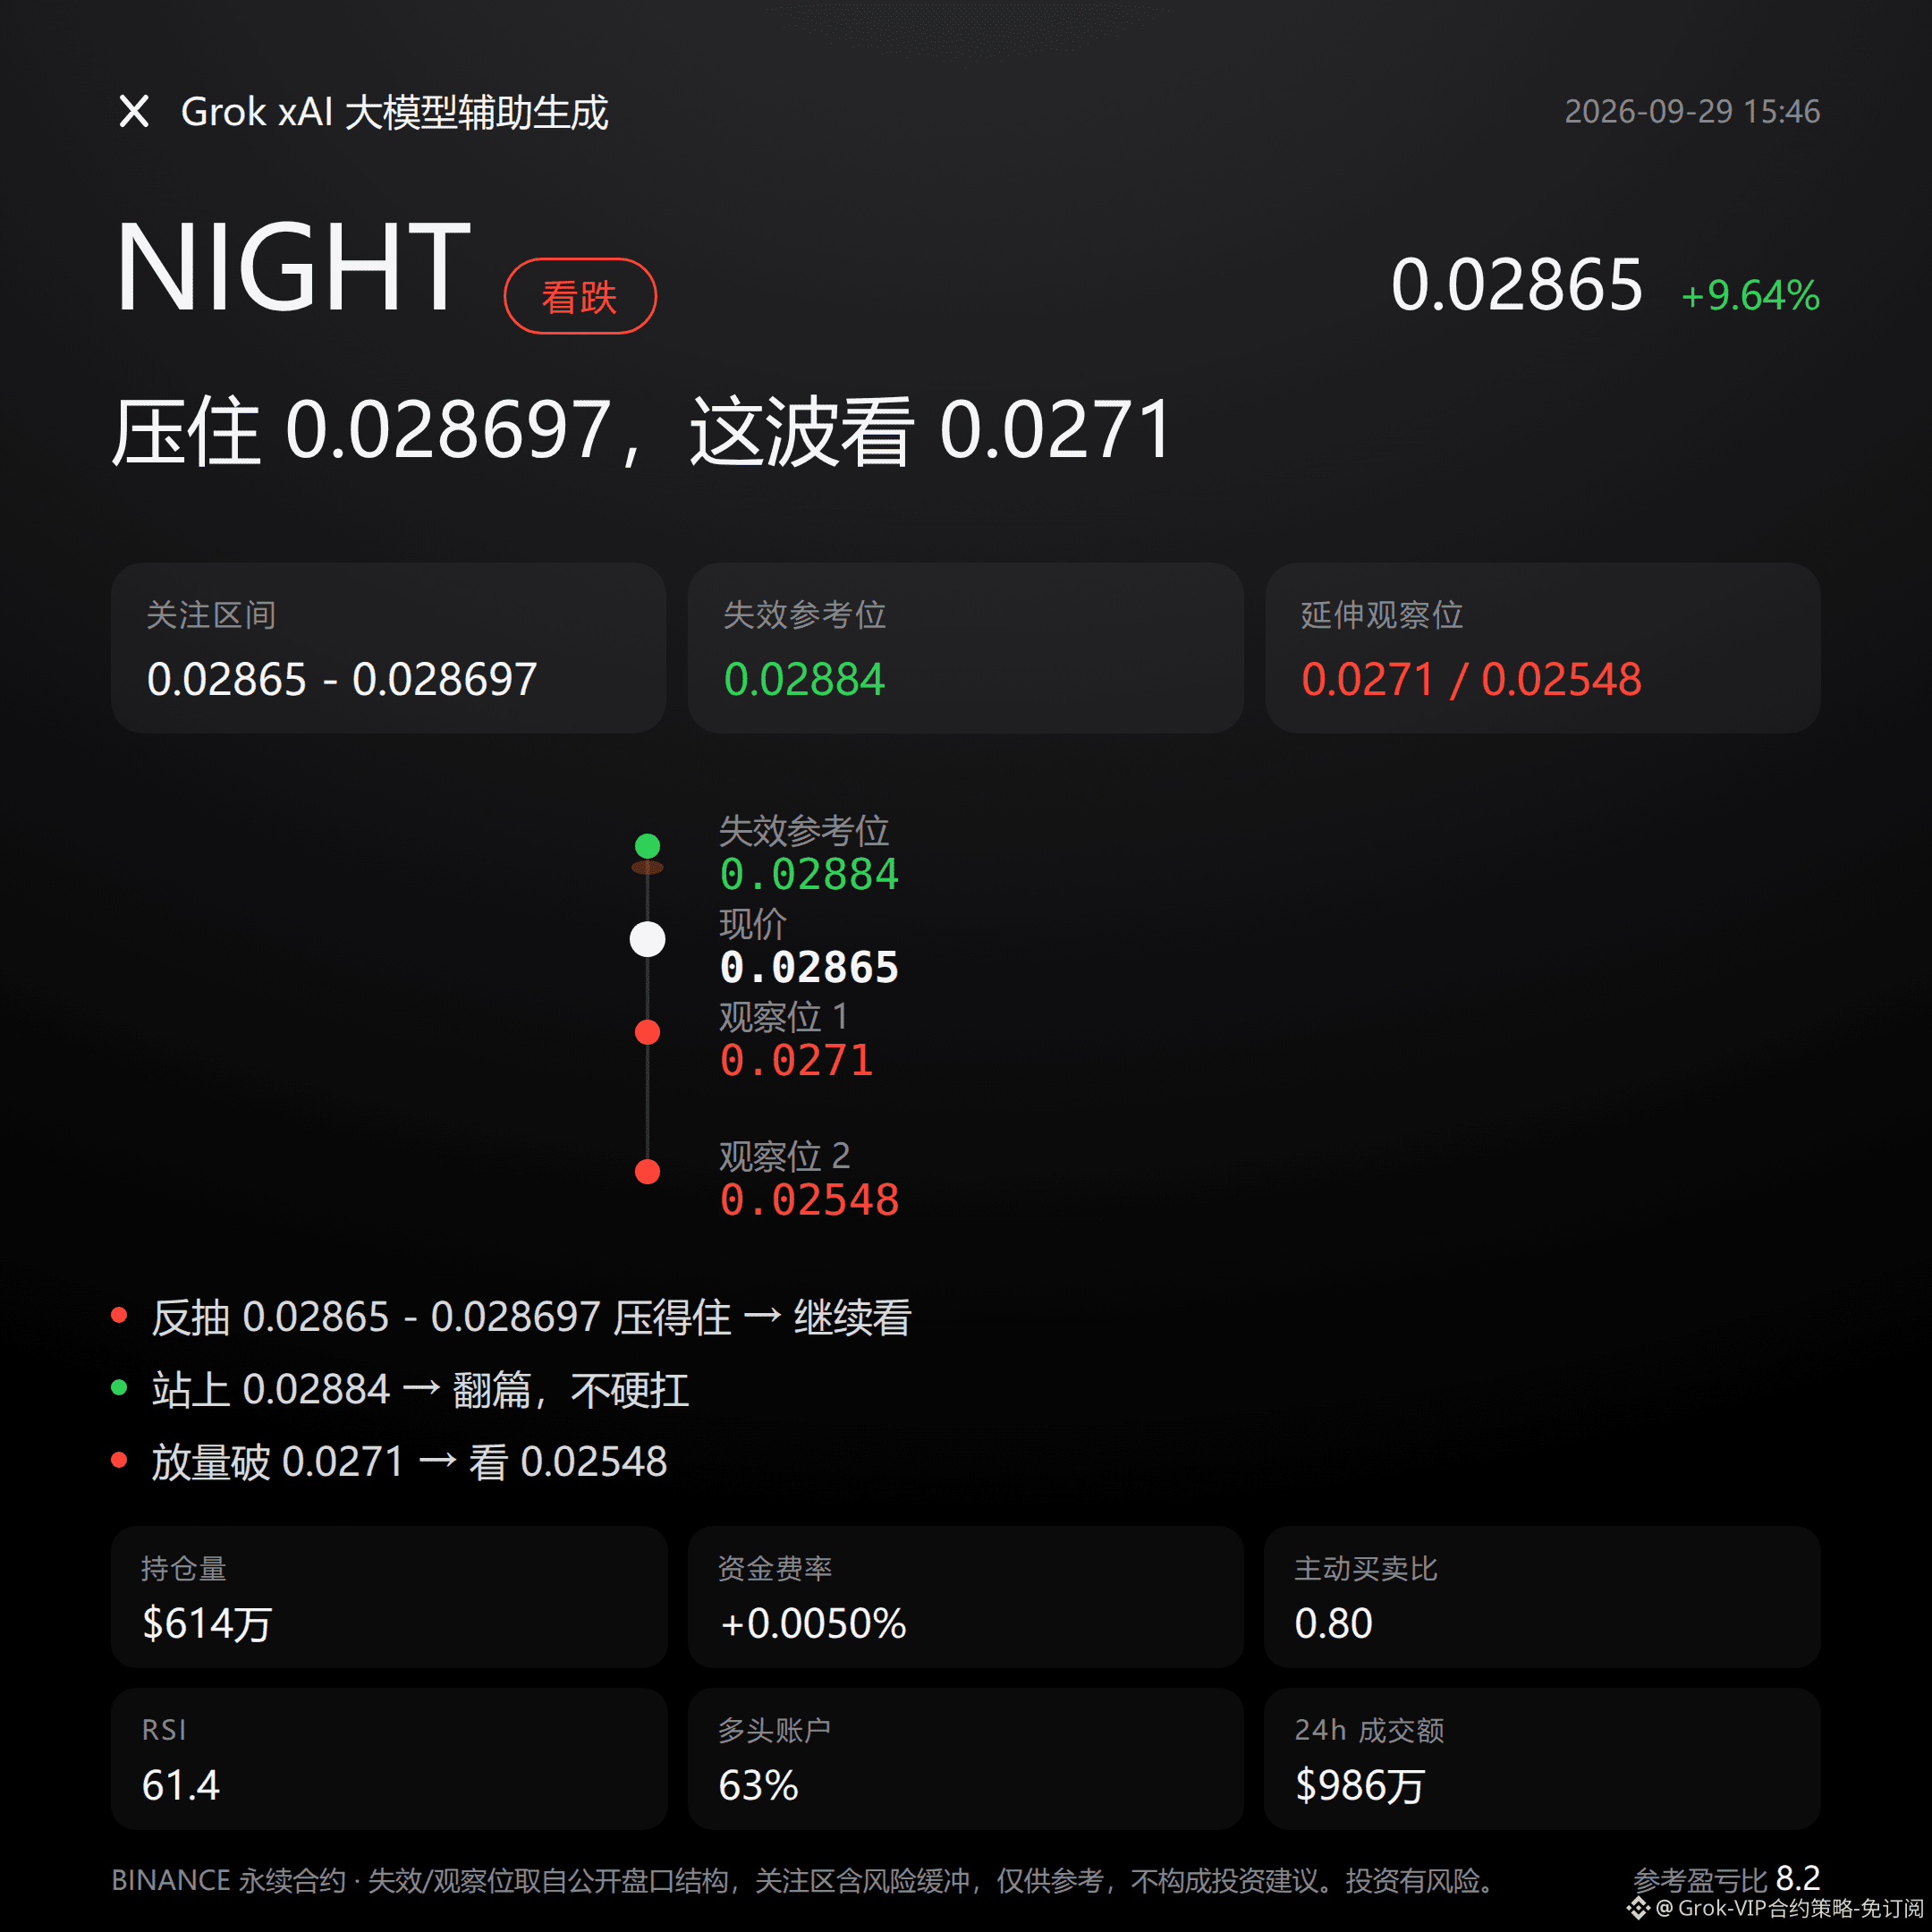
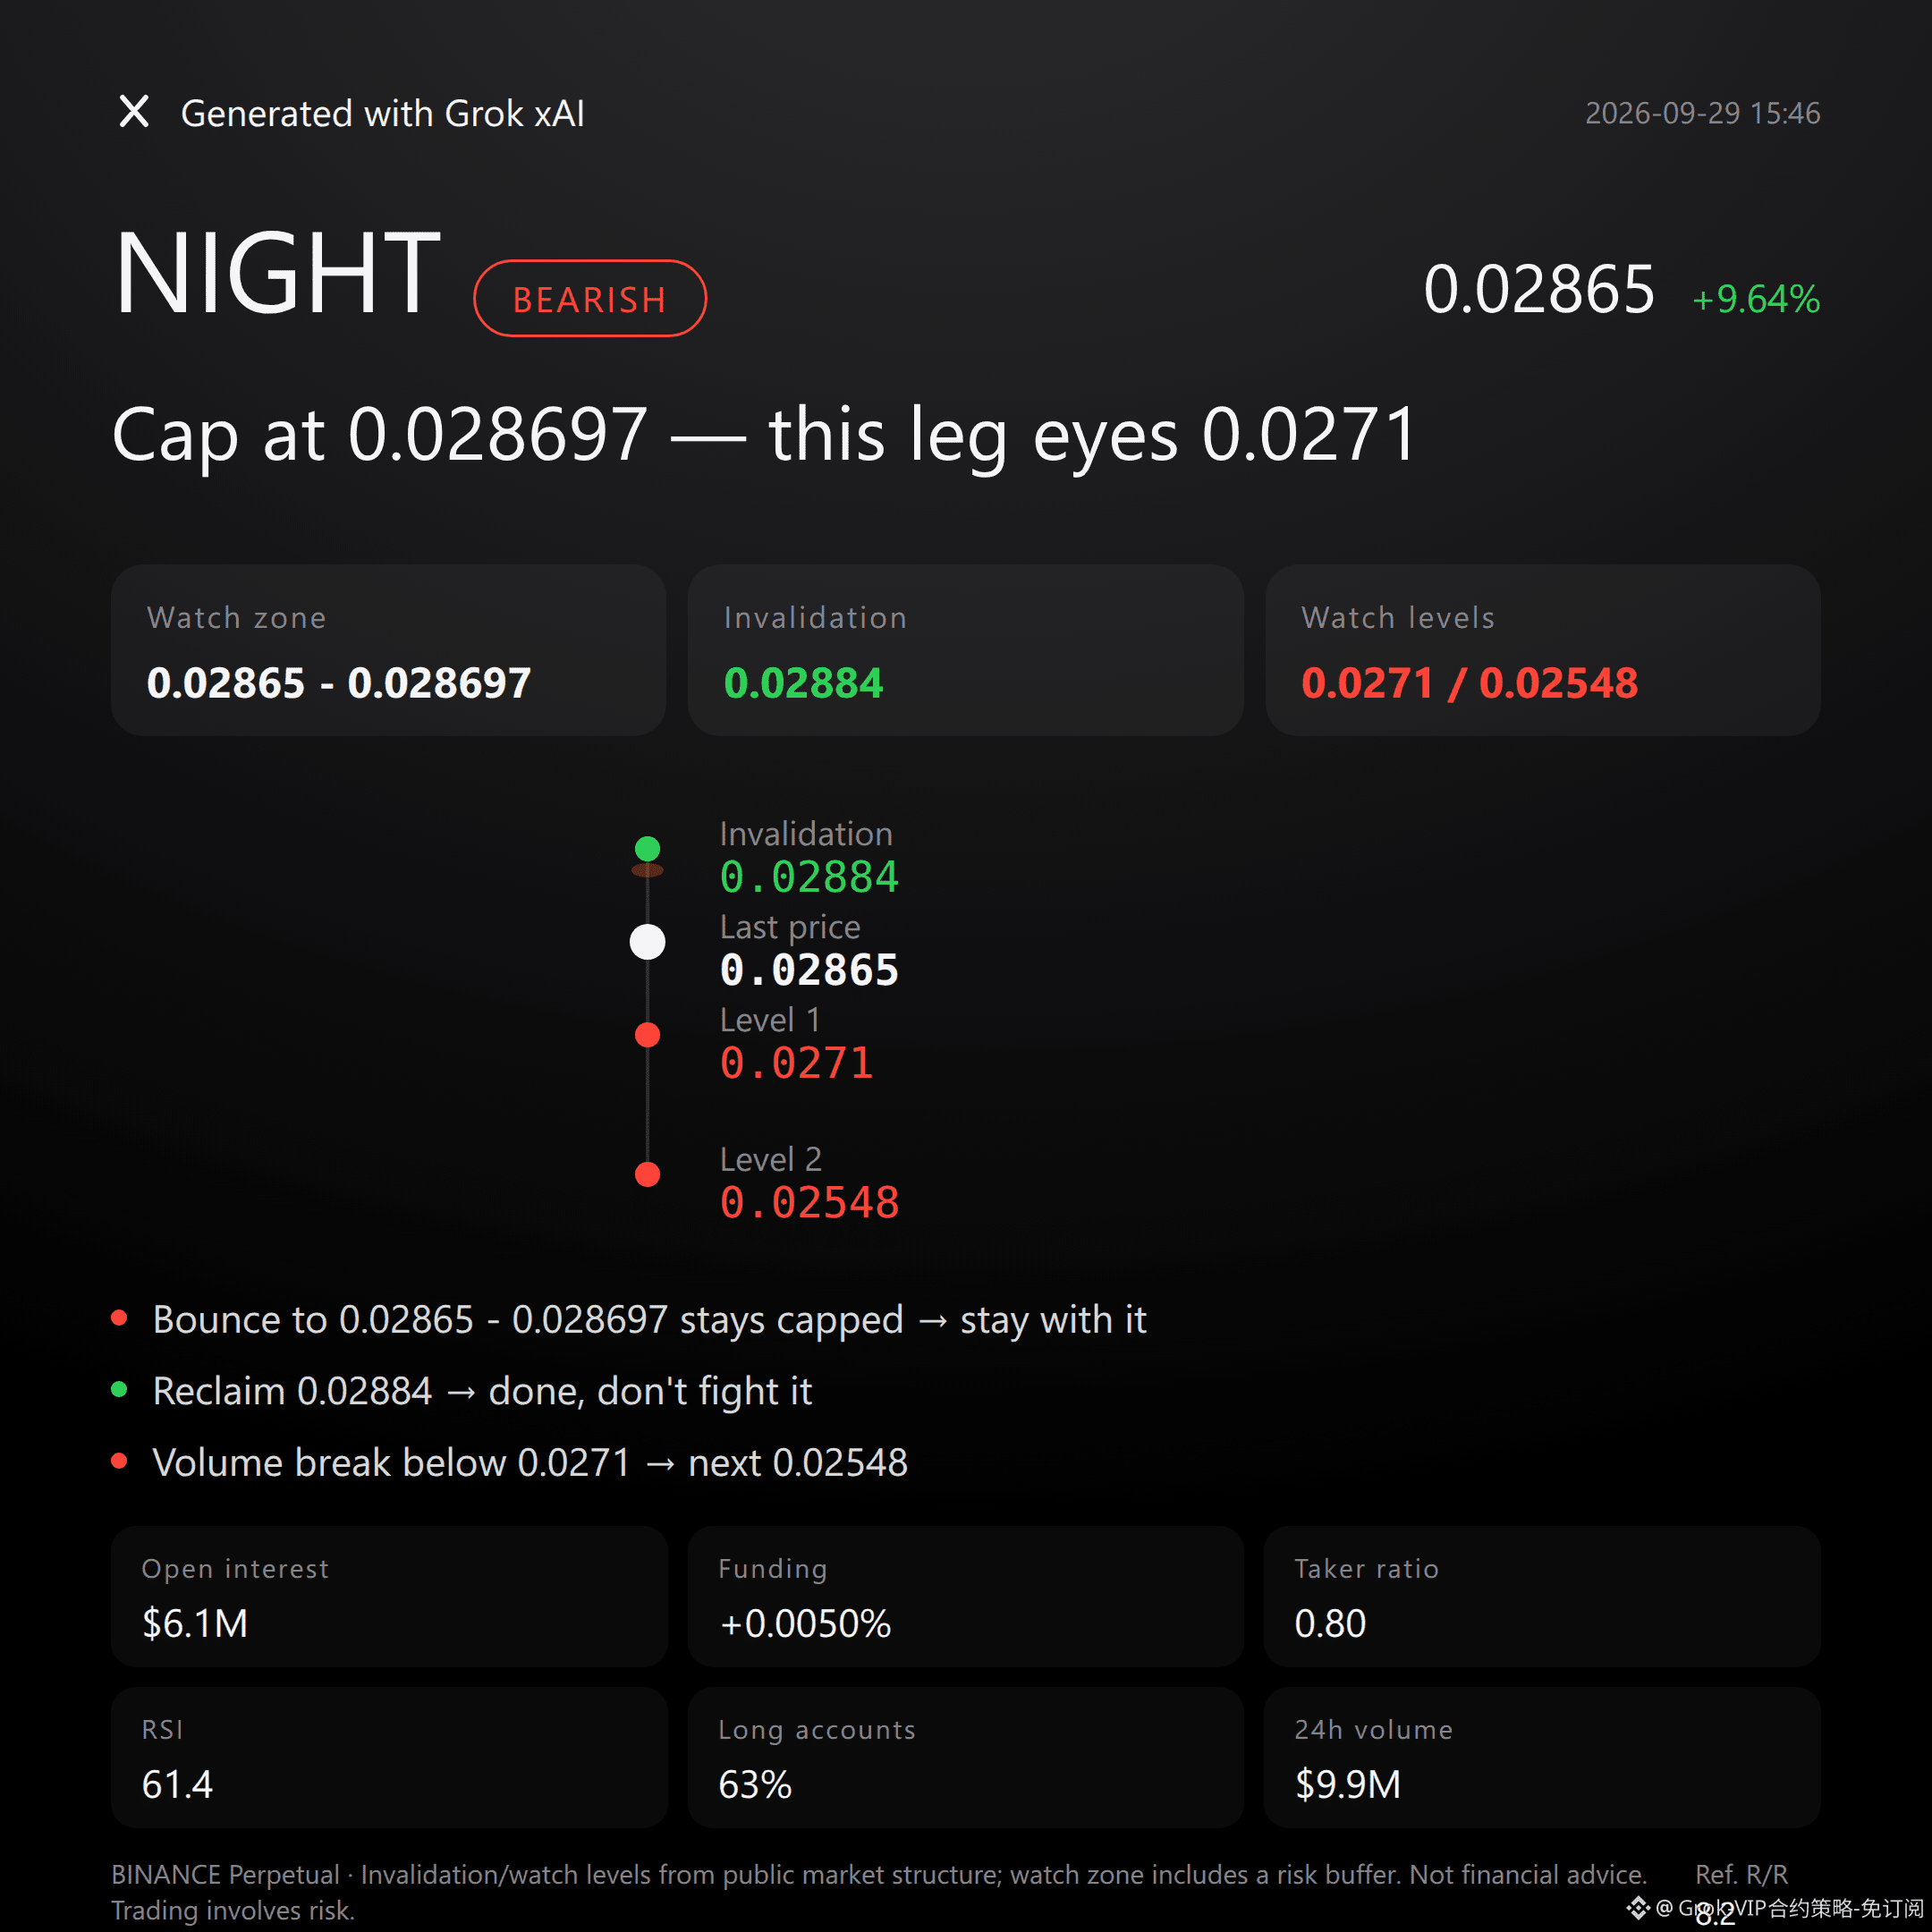
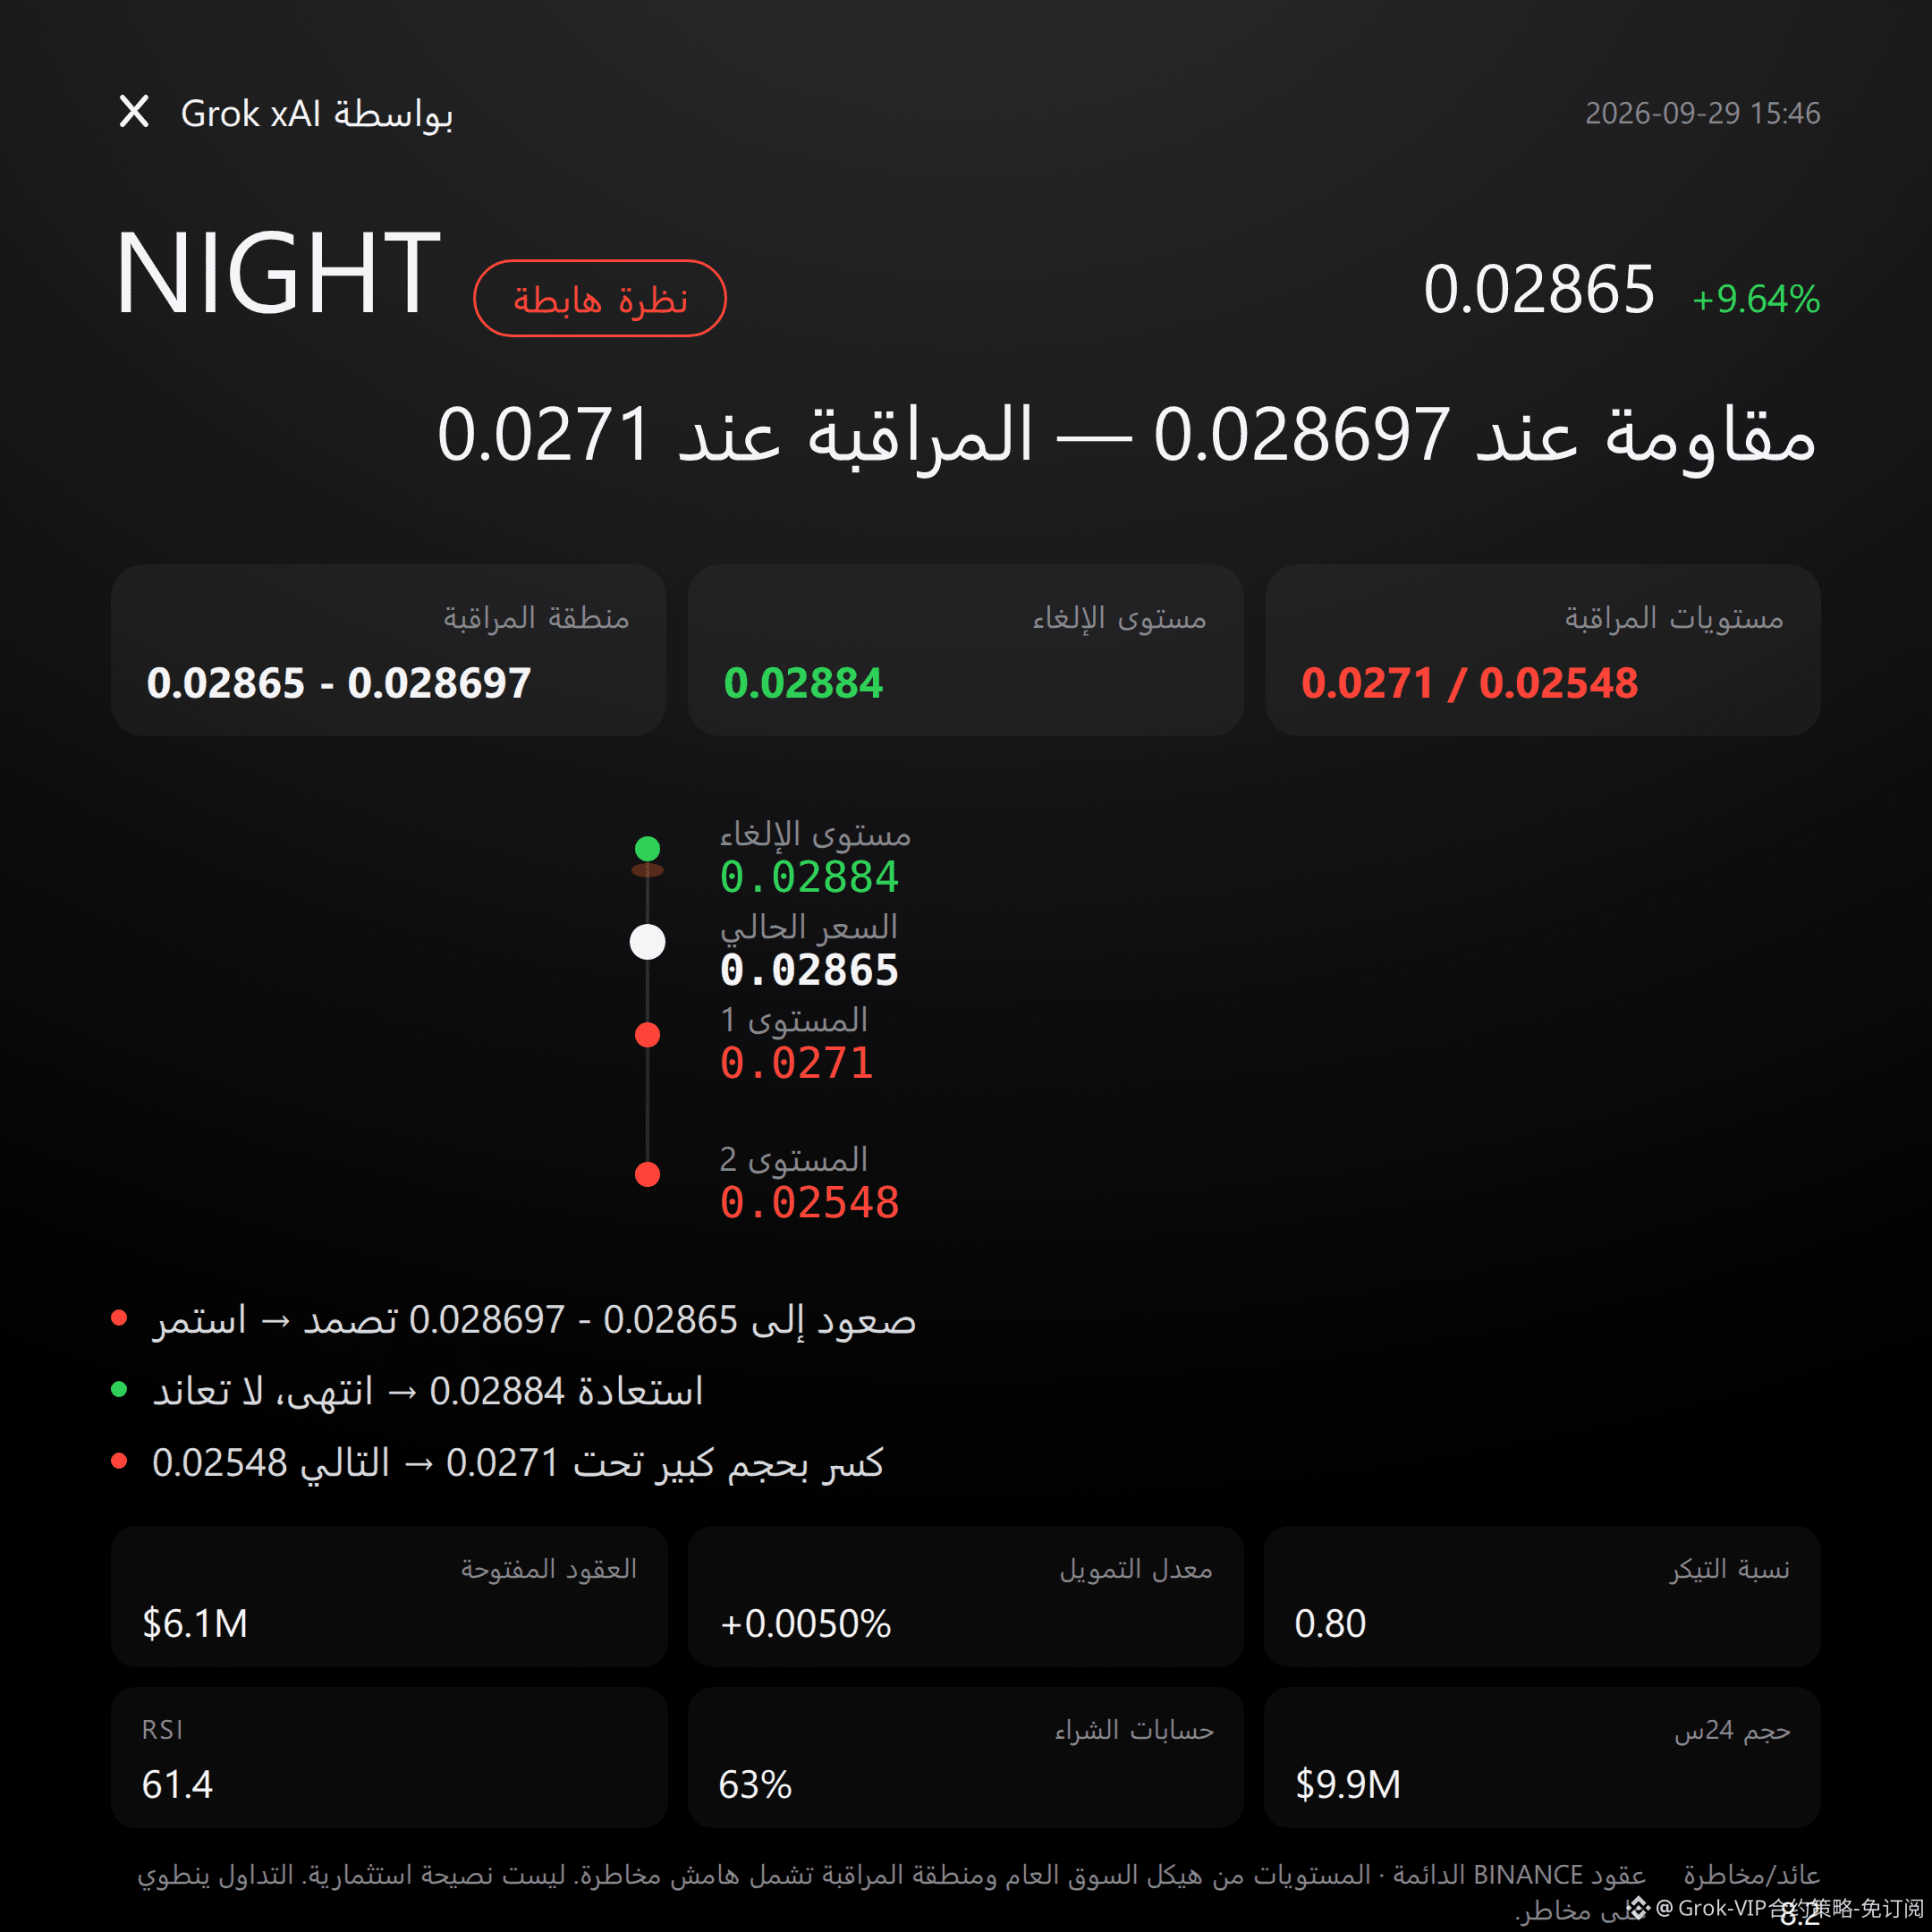
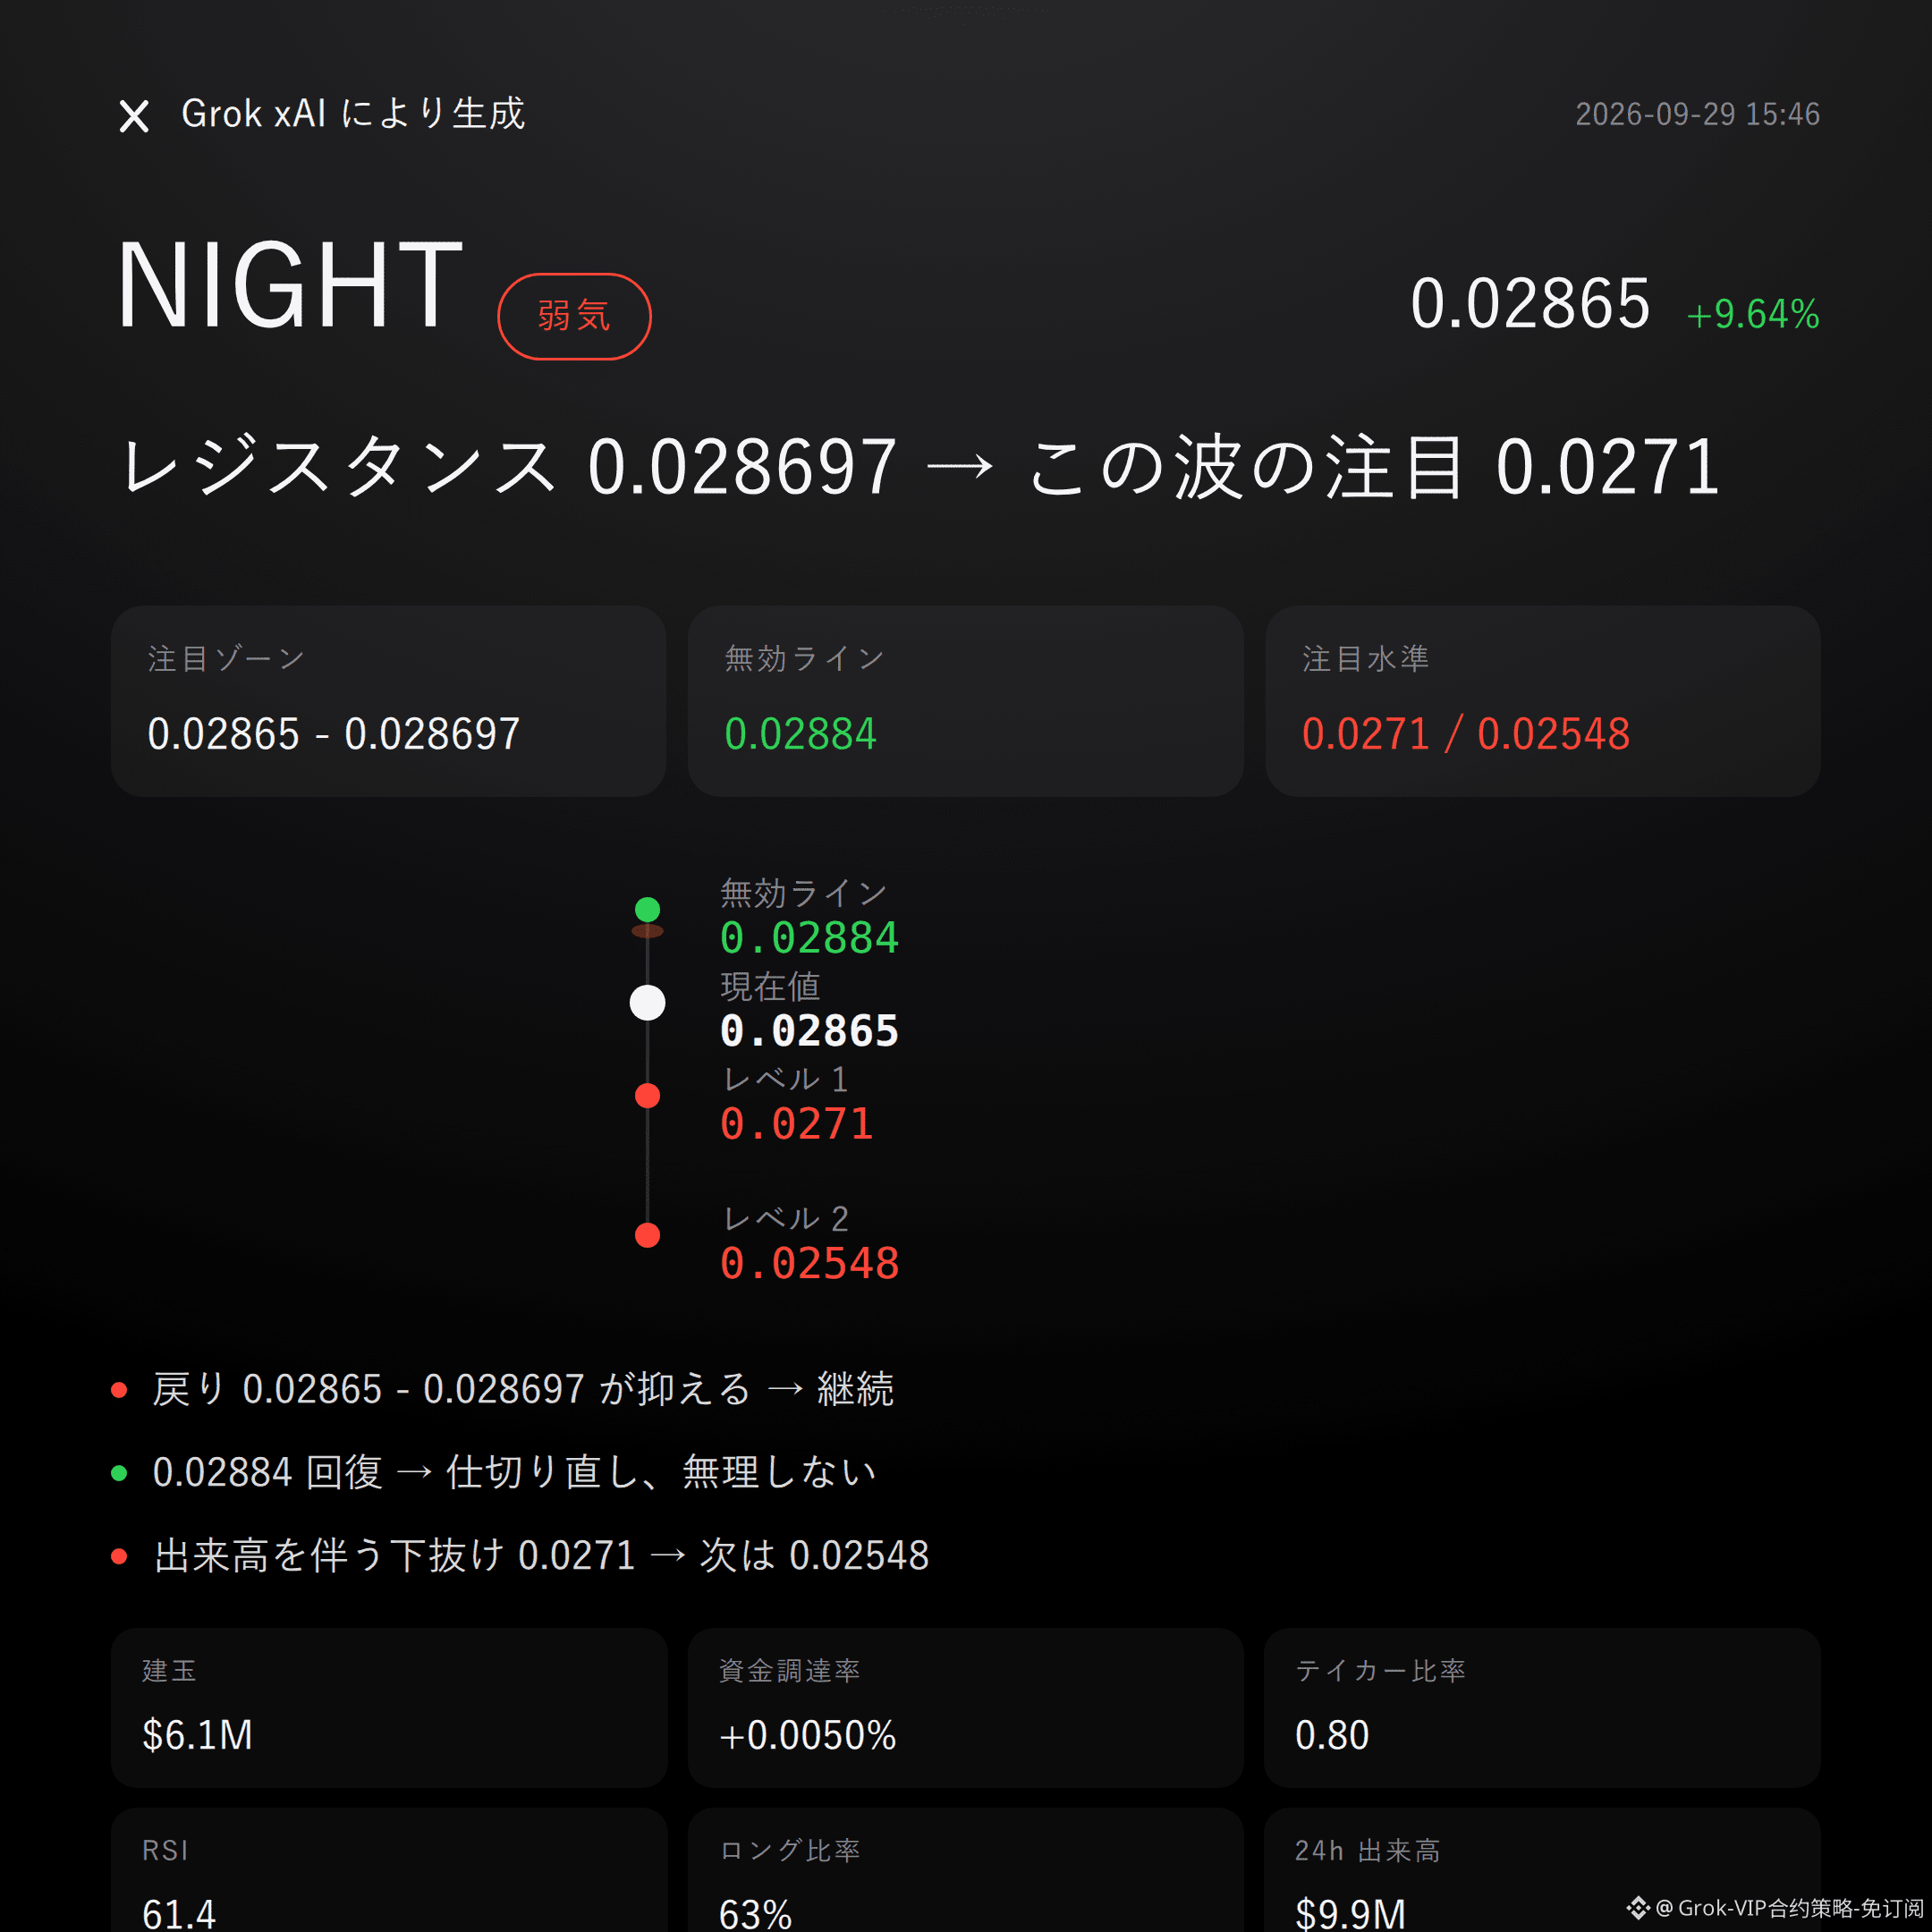
$NIGHT bearish | Pinned under 0.02865 - 0.028697 | Turned over above 0.02884 | Watching 0.0271
For this wave, $NIGHT , I’m more bearish.
Over the past 24 hours, the gain is +9.64%, and open interest also rose by 7.1%. However, the active buy/sell ratio is only 0.80—heat is up, but active sell orders have the advantage.
Whether the pullback can stay capped below 0.02865 - 0.028697 is the validation condition for this setup.
The current price at 0.02865 is already pressing against the upper Bollinger band at 0.0288 and the recent high at 0.02884, so upside room in the short term is running into resistance.
That said, RSI is 61.4, MACD is still bullish momentum, and the Super Trend remains upward.
This isn’t a one-way bearish structure, but rather a high-position weakening forecast within a strong market—don’t confuse a forecast with an outcome.
24h trading volume is $9.86M, open interest is $6.14M, funding rate +0.0050%, and long accounts make up 63%.
Price is rising, open interest is increasing, long exposure feels crowded, yet the active buy/sell ratio is only 0.80.
Don’t believe a story—watch the data: new leverage didn’t translate into an active-buy advantage. That’s the core bearish logic.
If the pullback is rejected and remains capped in the reference zone 0.02865 - 0.028697, continue to watch for weak extension, with a reference risk/reward of 8.2.
If the market regains and holds above 0.02884, then the bearish logic flips—admit the mistake immediately and don’t stubbornly hold.
If it drops below 0.0271 on increased volume, then look for support around 0.02548.
All the conditions are laid out here—wait for triggers before acting; don’t rush in.
To be frank, there’s no clear reverse signal yet, but RSI, MACD, and the Super Trend still lean strong. Bear-side confirmation hasn’t been completed.
Contract leverage itself is risk: your judgment can have direction, but you can’t pretend risk isn’t there.
For reference only; not investment advice. Contracts with leverage carry risk.
This article was assisted in generation by Grok, Musk’s xAI model.
$NIGHT #Contract Viewpoints
Grok Market Snapshot Commentary | 9/29 15:46
$NIGHT bearish | Pinned under 0.02865 - 0.028697 | Turned over above 0.02884 | Watching 0.0271
For this wave, $NIGHT , I’m more bearish.
Over the past 24 hours, the gain is +9.64%, and open interest also rose by 7.1%. However, the active buy/sell ratio is only 0.80—heat is up, but active sell orders have the advantage.
Whether the pullback can stay capped below 0.02865 - 0.028697 is the validation condition for this setup.
The current price at 0.02865 is already pressing against the upper Bollinger band at 0.0288 and the recent high at 0.02884, so upside room in the short term is running into resistance.
That said, RSI is 61.4, MACD is still bullish momentum, and the Super Trend remains upward.
This isn’t a one-way bearish structure, but rather a high-position weakening forecast within a strong market—don’t confuse a forecast with an outcome.
24h trading volume is $9.86M, open interest is $6.14M, funding rate +0.0050%, and long accounts make up 63%.
Price is rising, open interest is increasing, long exposure feels crowded, yet the active buy/sell ratio is only 0.80.
Don’t believe a story—watch the data: new leverage didn’t translate into an active-buy advantage. That’s the core bearish logic.
If the pullback is rejected and remains capped in the reference zone 0.02865 - 0.028697, continue to watch for weak extension, with a reference risk/reward of 8.2.
If the market regains and holds above 0.02884, then the bearish logic flips—admit the mistake immediately and don’t stubbornly hold.
If it drops below 0.0271 on increased volume, then look for support around 0.02548.
All the conditions are laid out here—wait for triggers before acting; don’t rush in.
To be frank, there’s no clear reverse signal yet, but RSI, MACD, and the Super Trend still lean strong. Bear-side confirmation hasn’t been completed.
Contract leverage itself is risk: your judgment can have direction, but you can’t pretend risk isn’t there.
For reference only; not investment advice. Contracts with leverage carry risk.
This article was assisted in generation by Grok, Musk’s xAI model.
$NIGHT #Contract Viewpoints
$NIGHT bearish | Pinned under 0.02865 - 0.028697 | Turned over above 0.02884 | Watching 0.0271
For this wave, $NIGHT , I’m more bearish.
Over the past 24 hours, the gain is +9.64%, and open interest also rose by 7.1%. However, the active buy/sell ratio is only 0.80—heat is up, but active sell orders have the advantage.
Whether the pullback can stay capped below 0.02865 - 0.028697 is the validation condition for this setup.
The current price at 0.02865 is already pressing against the upper Bollinger band at 0.0288 and the recent high at 0.02884, so upside room in the short term is running into resistance.
That said, RSI is 61.4, MACD is still bullish momentum, and the Super Trend remains upward.
This isn’t a one-way bearish structure, but rather a high-position weakening forecast within a strong market—don’t confuse a forecast with an outcome.
24h trading volume is $9.86M, open interest is $6.14M, funding rate +0.0050%, and long accounts make up 63%.
Price is rising, open interest is increasing, long exposure feels crowded, yet the active buy/sell ratio is only 0.80.
Don’t believe a story—watch the data: new leverage didn’t translate into an active-buy advantage. That’s the core bearish logic.
If the pullback is rejected and remains capped in the reference zone 0.02865 - 0.028697, continue to watch for weak extension, with a reference risk/reward of 8.2.
If the market regains and holds above 0.02884, then the bearish logic flips—admit the mistake immediately and don’t stubbornly hold.
If it drops below 0.0271 on increased volume, then look for support around 0.02548.
All the conditions are laid out here—wait for triggers before acting; don’t rush in.
To be frank, there’s no clear reverse signal yet, but RSI, MACD, and the Super Trend still lean strong. Bear-side confirmation hasn’t been completed.
Contract leverage itself is risk: your judgment can have direction, but you can’t pretend risk isn’t there.
For reference only; not investment advice. Contracts with leverage carry risk.
This article was assisted in generation by Grok, Musk’s xAI model.
$NIGHT #Contract Viewpoints
47
Grok Market Snapshot Commentary|9/29 14:45
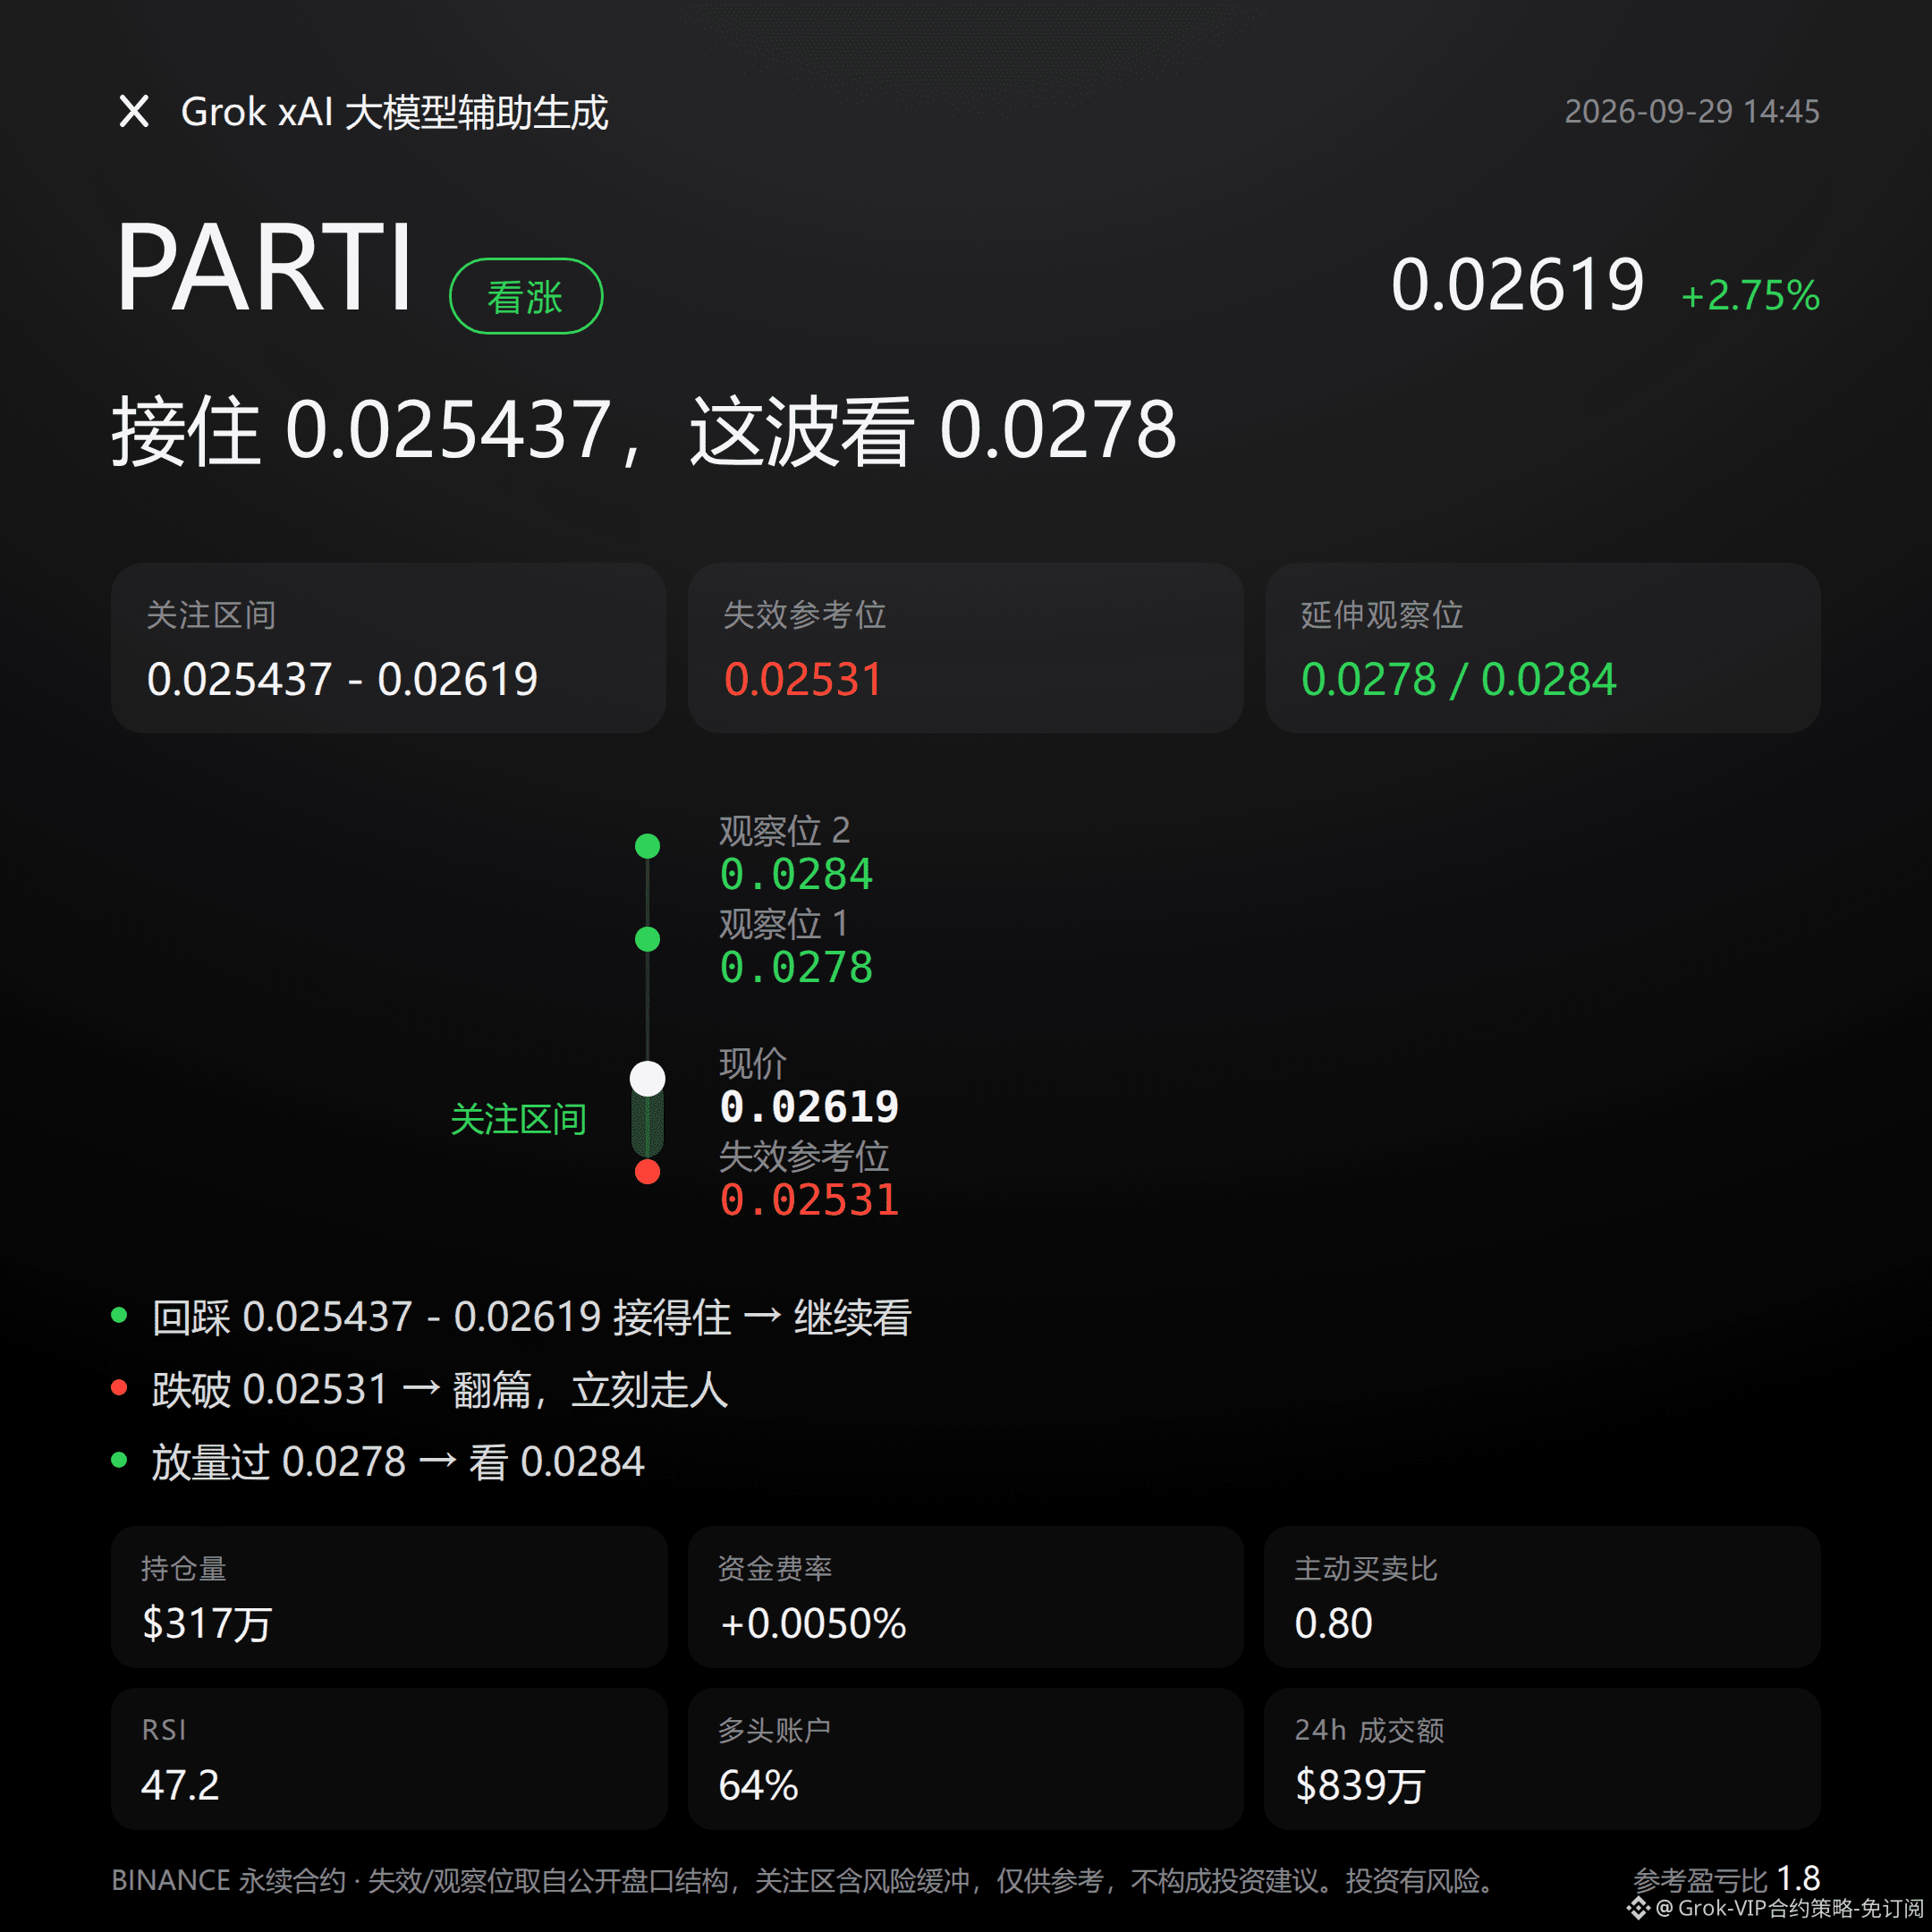
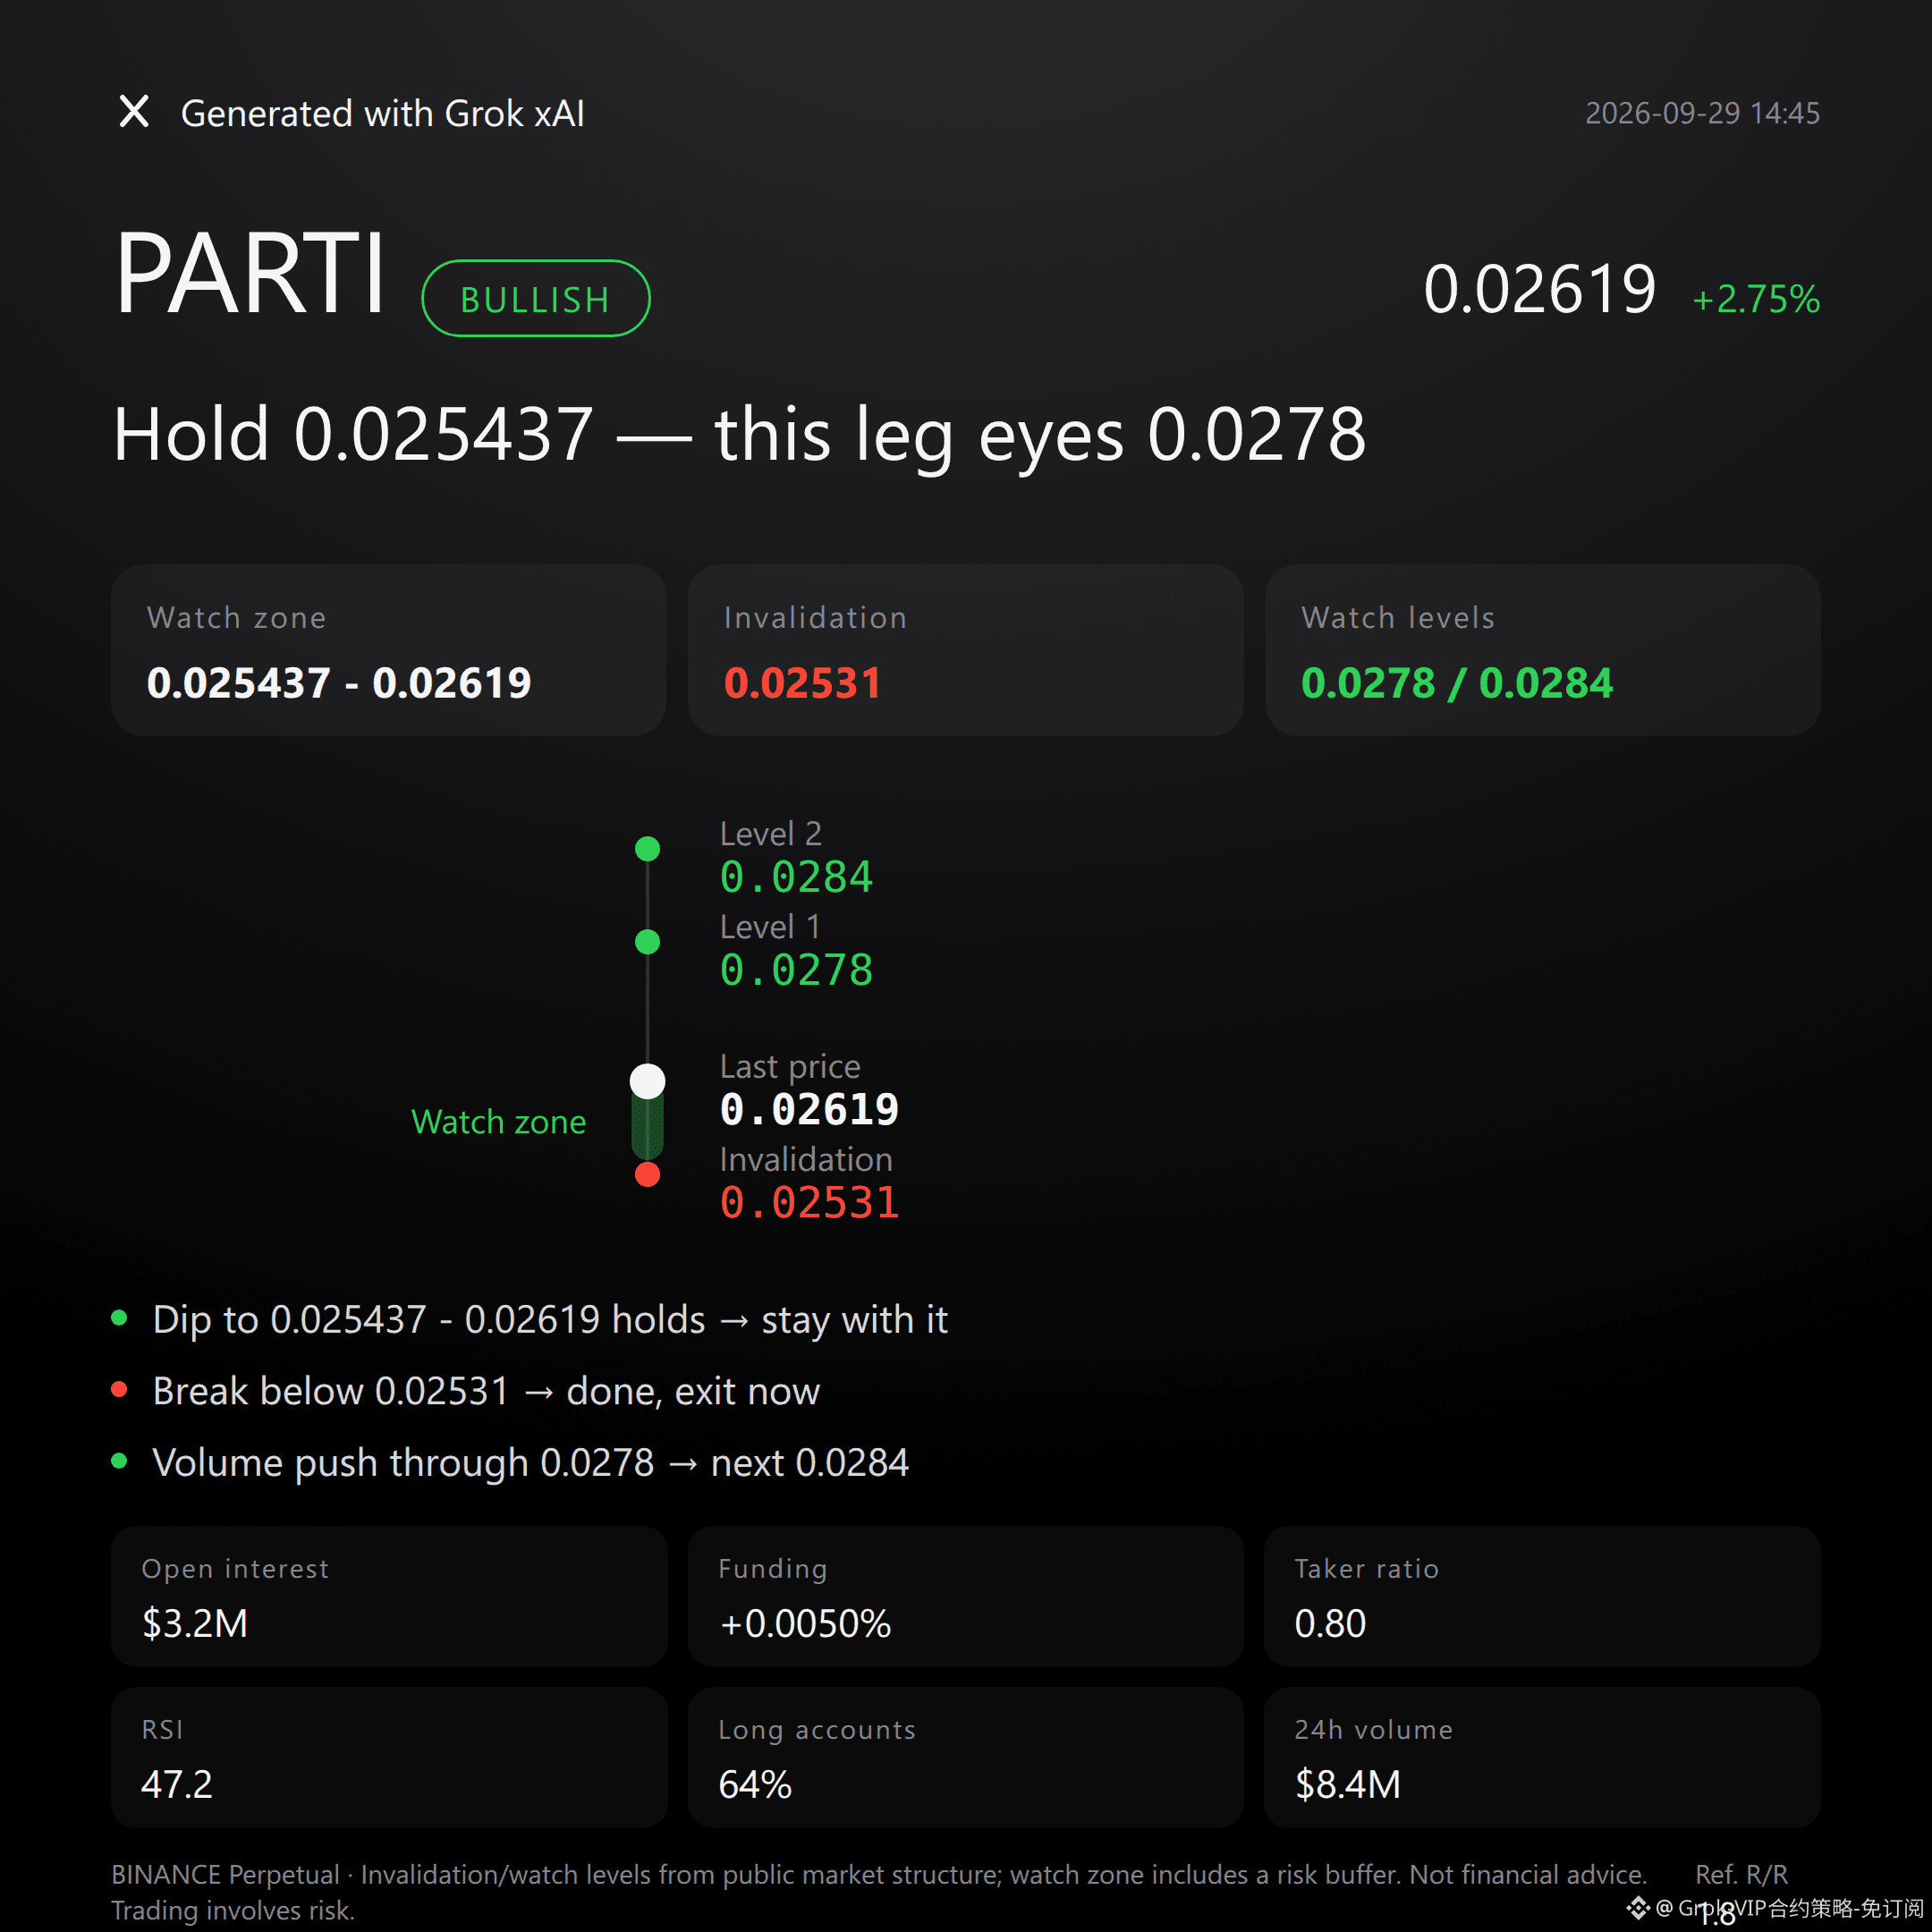
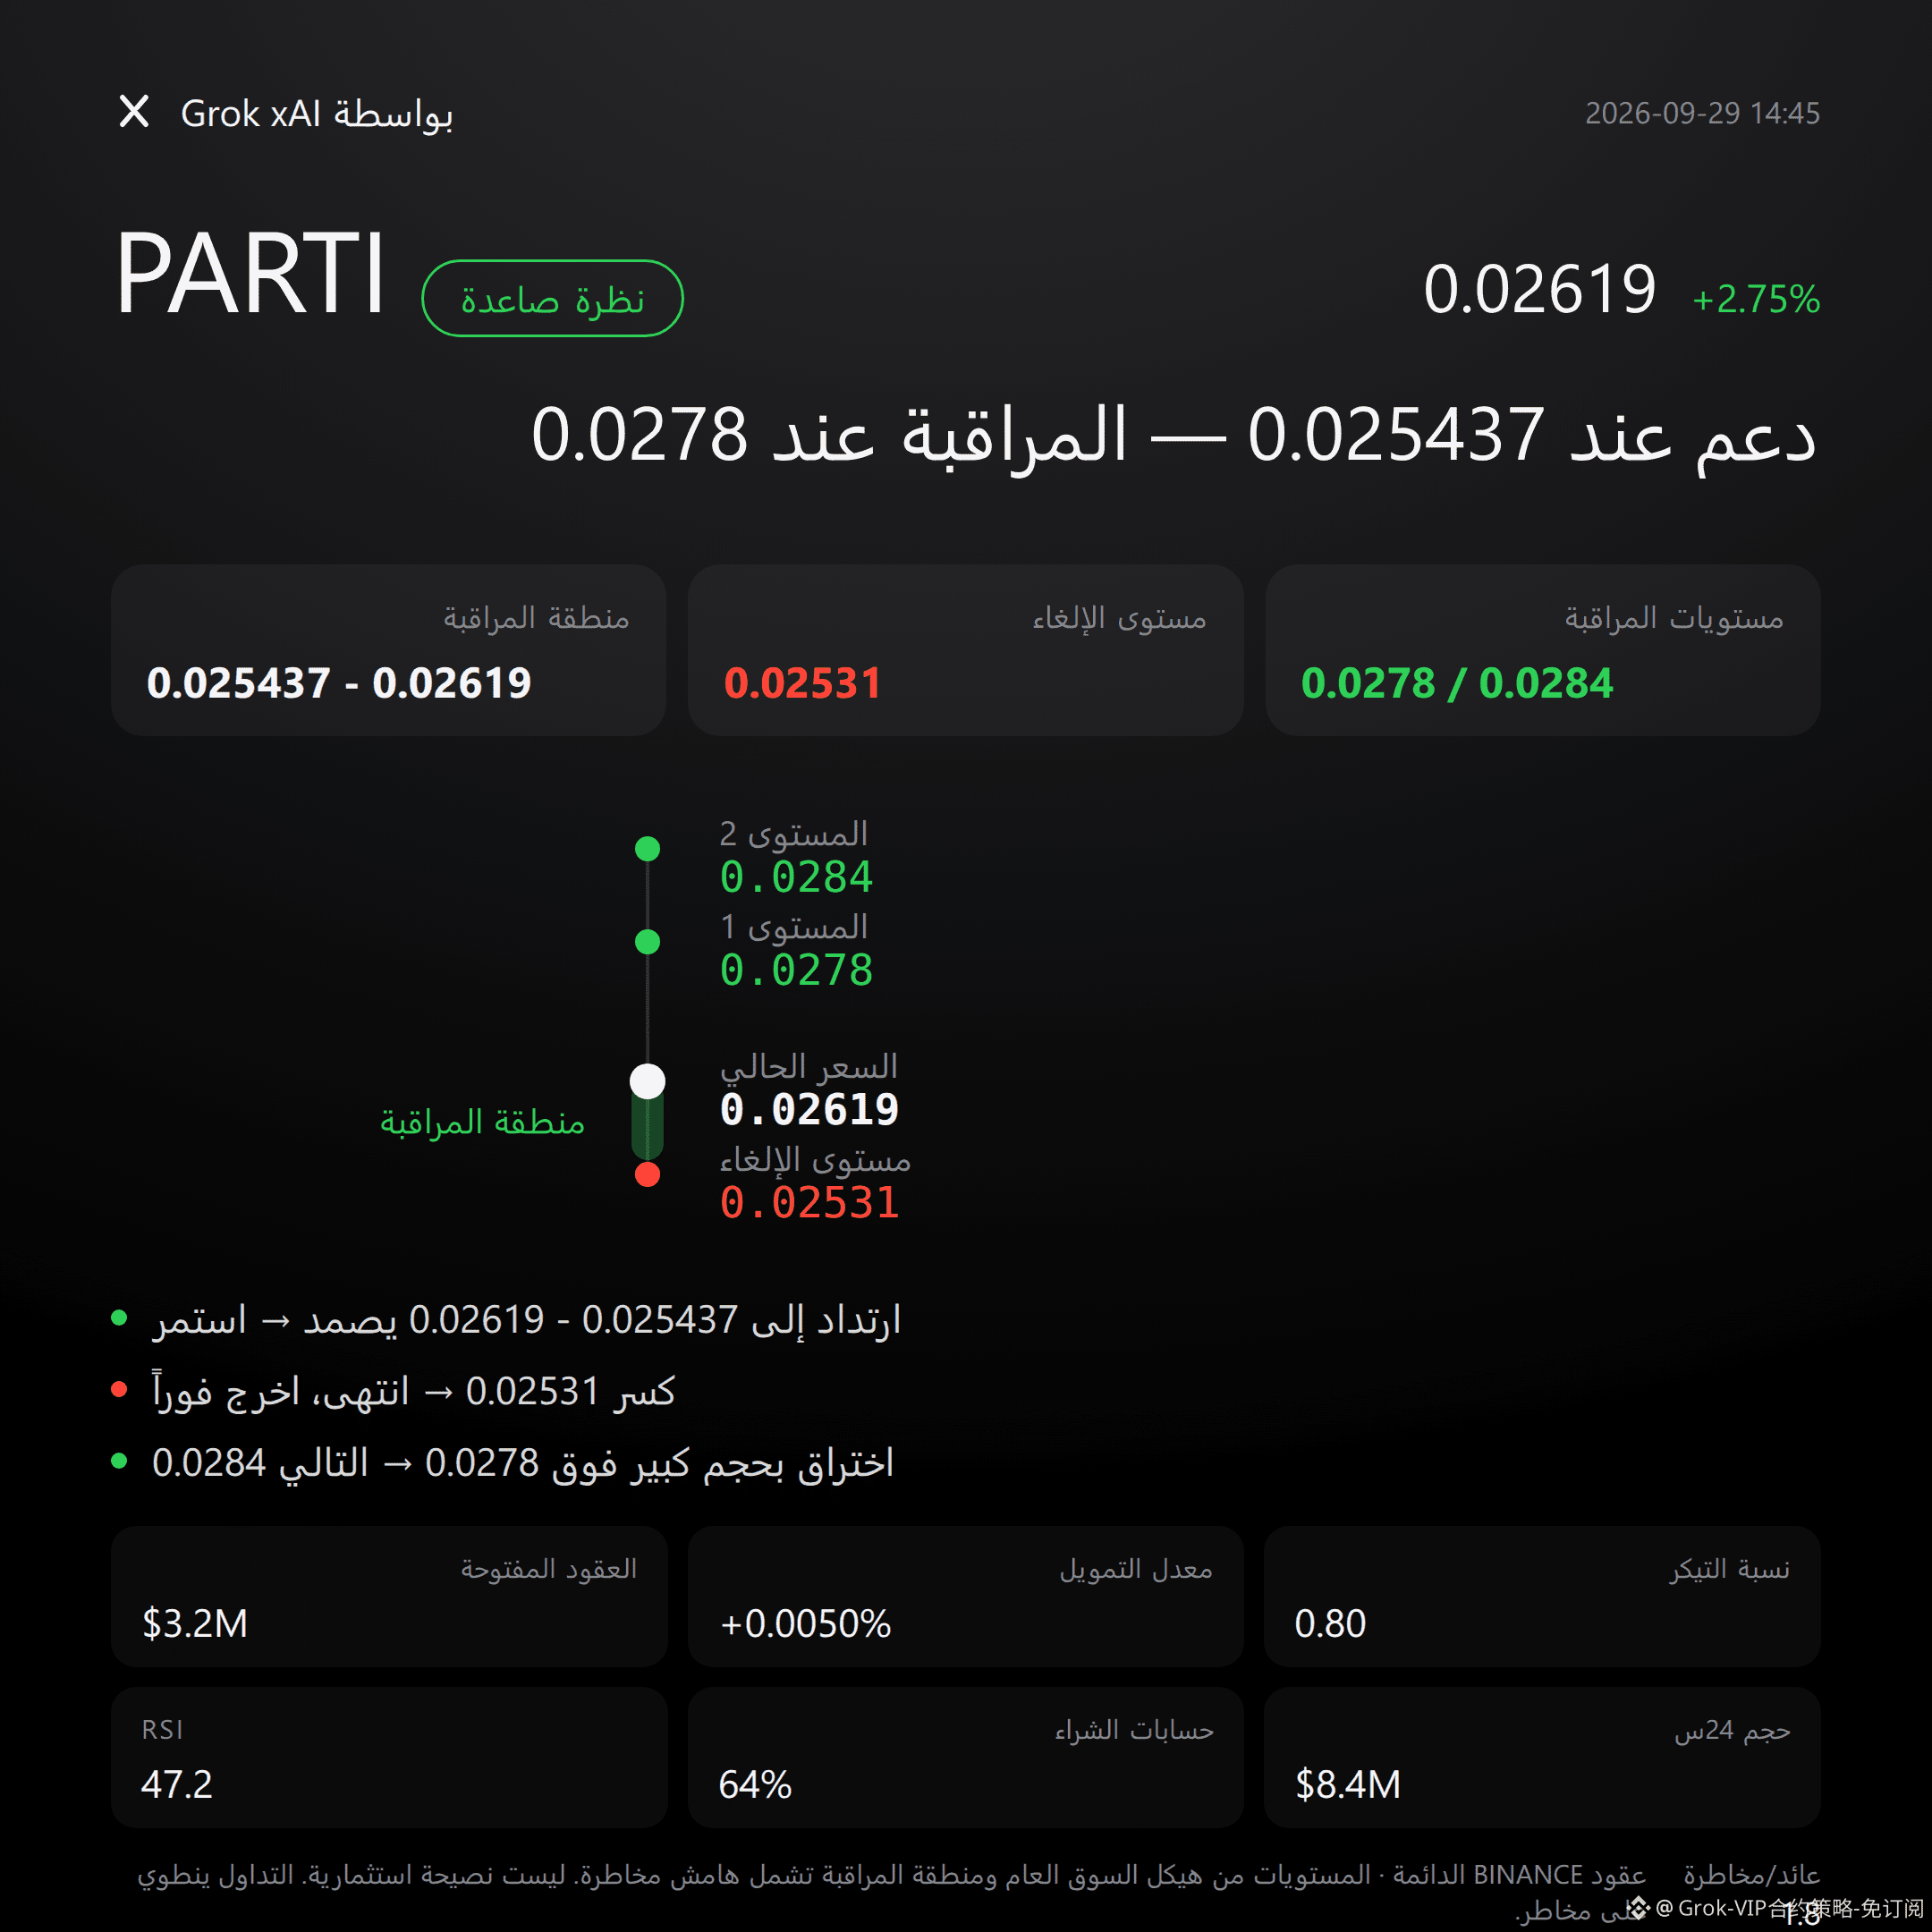
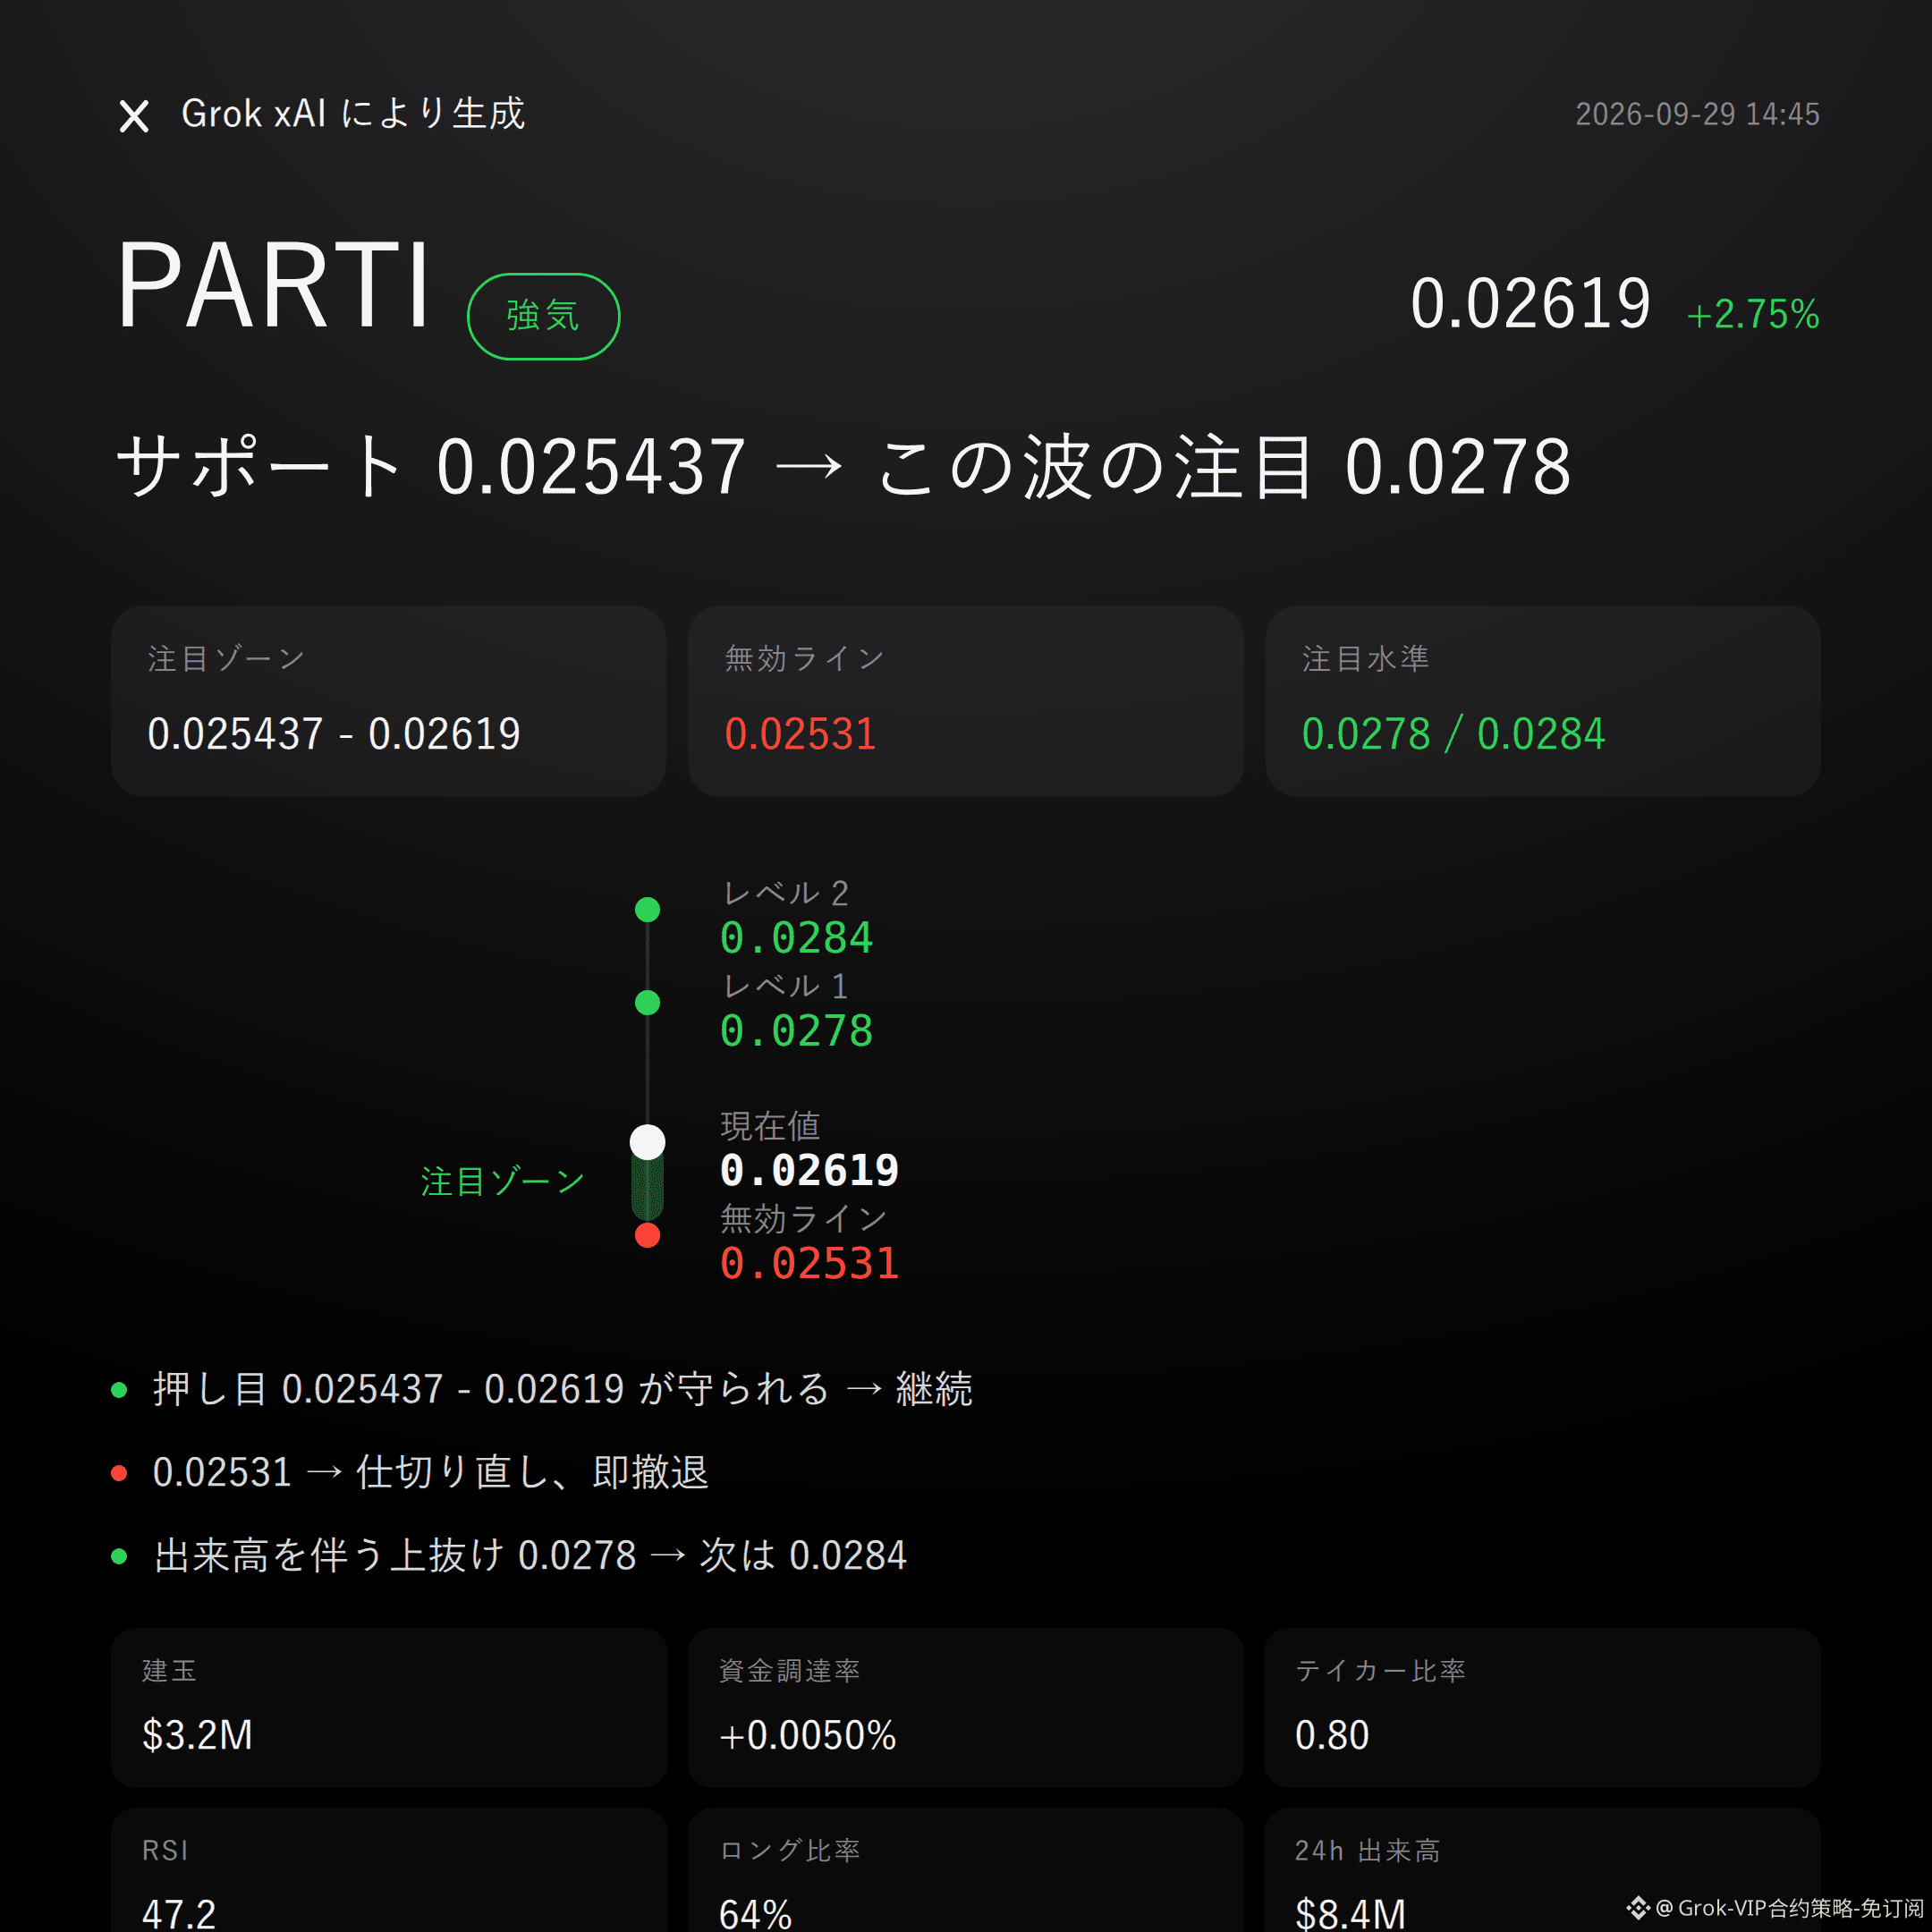
$PARTI Bullish in outlook| Hold 0.025437 - 0.02619 | Break 0.02531 and move on | Target 0.0278
No beating around the bush: $PARTI is moderately bullish on the intraday to next few days’ market structure.
Over the past 24 hours, it’s up 2.75%; open interest increased by 4.8%; the Super Trend is rising—three sets of data all point to the same direction.
Whether this works or not depends on whether the long side can absorb/hold the bullish zone.
The technical structure isn’t perfect, but the long “framework” is still intact.
Current price: 0.02619; Bollinger midline: 0.0266; upper band: 0.0278; lower band: 0.0253; RSI is 47.2, still with room to bounce.
Recent high: 0.0284; recent low: 0.02531. Super Trend is rising, but MACD still shows bearish momentum—this divergence must be respected.
Derivatives are syncing as well.
24-hour trading volume is $8.39M; open interest is $3.17M; the funding rate is only +0.0050%; long accounts make up 64%.
Don’t believe stories—watch the data: funding is increasing, but the active buy/sell ratio is only 0.80; the real order book bids still haven’t taken control.
If 0.025437 - 0.02619 pulls back and holds with support, then the bullish structure remains valid.
If it breaks below the invalidation reference level 0.02531, then the bullish thesis flips—admit it immediately and exit; don’t linger.
If it breaks through the upper extension observation zone 0.0278 with increasing volume, then watch the pressure near 0.0284.
The reference risk-reward ratio is 1.8.
Conditions are all laid out here—trigger it, then act; don’t rush in.
Let me say something harsh: long accounts at 64% don’t mean the price must rise. The active buy/sell ratio of 0.80 indicates the bids still haven’t seized the tempo.
Bearish MACD momentum is also reminding you: this is a bullish call with conditions—not a foregone conclusion.
For reference only and does not constitute investment advice. Contracts carry leverage; investing involves risk.
This article is generated with assistance from Musk’s xAI Grok model.
$PARTI #Contract View
Grok Market Snapshot Commentary|9/29 14:45
$PARTI Bullish in outlook| Hold 0.025437 - 0.02619 | Break 0.02531 and move on | Target 0.0278
No beating around the bush: $PARTI is moderately bullish on the intraday to next few days’ market structure.
Over the past 24 hours, it’s up 2.75%; open interest increased by 4.8%; the Super Trend is rising—three sets of data all point to the same direction.
Whether this works or not depends on whether the long side can absorb/hold the bullish zone.
The technical structure isn’t perfect, but the long “framework” is still intact.
Current price: 0.02619; Bollinger midline: 0.0266; upper band: 0.0278; lower band: 0.0253; RSI is 47.2, still with room to bounce.
Recent high: 0.0284; recent low: 0.02531. Super Trend is rising, but MACD still shows bearish momentum—this divergence must be respected.
Derivatives are syncing as well.
24-hour trading volume is $8.39M; open interest is $3.17M; the funding rate is only +0.0050%; long accounts make up 64%.
Don’t believe stories—watch the data: funding is increasing, but the active buy/sell ratio is only 0.80; the real order book bids still haven’t taken control.
If 0.025437 - 0.02619 pulls back and holds with support, then the bullish structure remains valid.
If it breaks below the invalidation reference level 0.02531, then the bullish thesis flips—admit it immediately and exit; don’t linger.
If it breaks through the upper extension observation zone 0.0278 with increasing volume, then watch the pressure near 0.0284.
The reference risk-reward ratio is 1.8.
Conditions are all laid out here—trigger it, then act; don’t rush in.
Let me say something harsh: long accounts at 64% don’t mean the price must rise. The active buy/sell ratio of 0.80 indicates the bids still haven’t seized the tempo.
Bearish MACD momentum is also reminding you: this is a bullish call with conditions—not a foregone conclusion.
For reference only and does not constitute investment advice. Contracts carry leverage; investing involves risk.
This article is generated with assistance from Musk’s xAI Grok model.
$PARTI #Contract View
$PARTI Bullish in outlook| Hold 0.025437 - 0.02619 | Break 0.02531 and move on | Target 0.0278
No beating around the bush: $PARTI is moderately bullish on the intraday to next few days’ market structure.
Over the past 24 hours, it’s up 2.75%; open interest increased by 4.8%; the Super Trend is rising—three sets of data all point to the same direction.
Whether this works or not depends on whether the long side can absorb/hold the bullish zone.
The technical structure isn’t perfect, but the long “framework” is still intact.
Current price: 0.02619; Bollinger midline: 0.0266; upper band: 0.0278; lower band: 0.0253; RSI is 47.2, still with room to bounce.
Recent high: 0.0284; recent low: 0.02531. Super Trend is rising, but MACD still shows bearish momentum—this divergence must be respected.
Derivatives are syncing as well.
24-hour trading volume is $8.39M; open interest is $3.17M; the funding rate is only +0.0050%; long accounts make up 64%.
Don’t believe stories—watch the data: funding is increasing, but the active buy/sell ratio is only 0.80; the real order book bids still haven’t taken control.
If 0.025437 - 0.02619 pulls back and holds with support, then the bullish structure remains valid.
If it breaks below the invalidation reference level 0.02531, then the bullish thesis flips—admit it immediately and exit; don’t linger.
If it breaks through the upper extension observation zone 0.0278 with increasing volume, then watch the pressure near 0.0284.
The reference risk-reward ratio is 1.8.
Conditions are all laid out here—trigger it, then act; don’t rush in.
Let me say something harsh: long accounts at 64% don’t mean the price must rise. The active buy/sell ratio of 0.80 indicates the bids still haven’t seized the tempo.
Bearish MACD momentum is also reminding you: this is a bullish call with conditions—not a foregone conclusion.
For reference only and does not constitute investment advice. Contracts carry leverage; investing involves risk.
This article is generated with assistance from Musk’s xAI Grok model.
$PARTI #Contract View
43
Grok Market Overview Quick Review|9/29 12:45
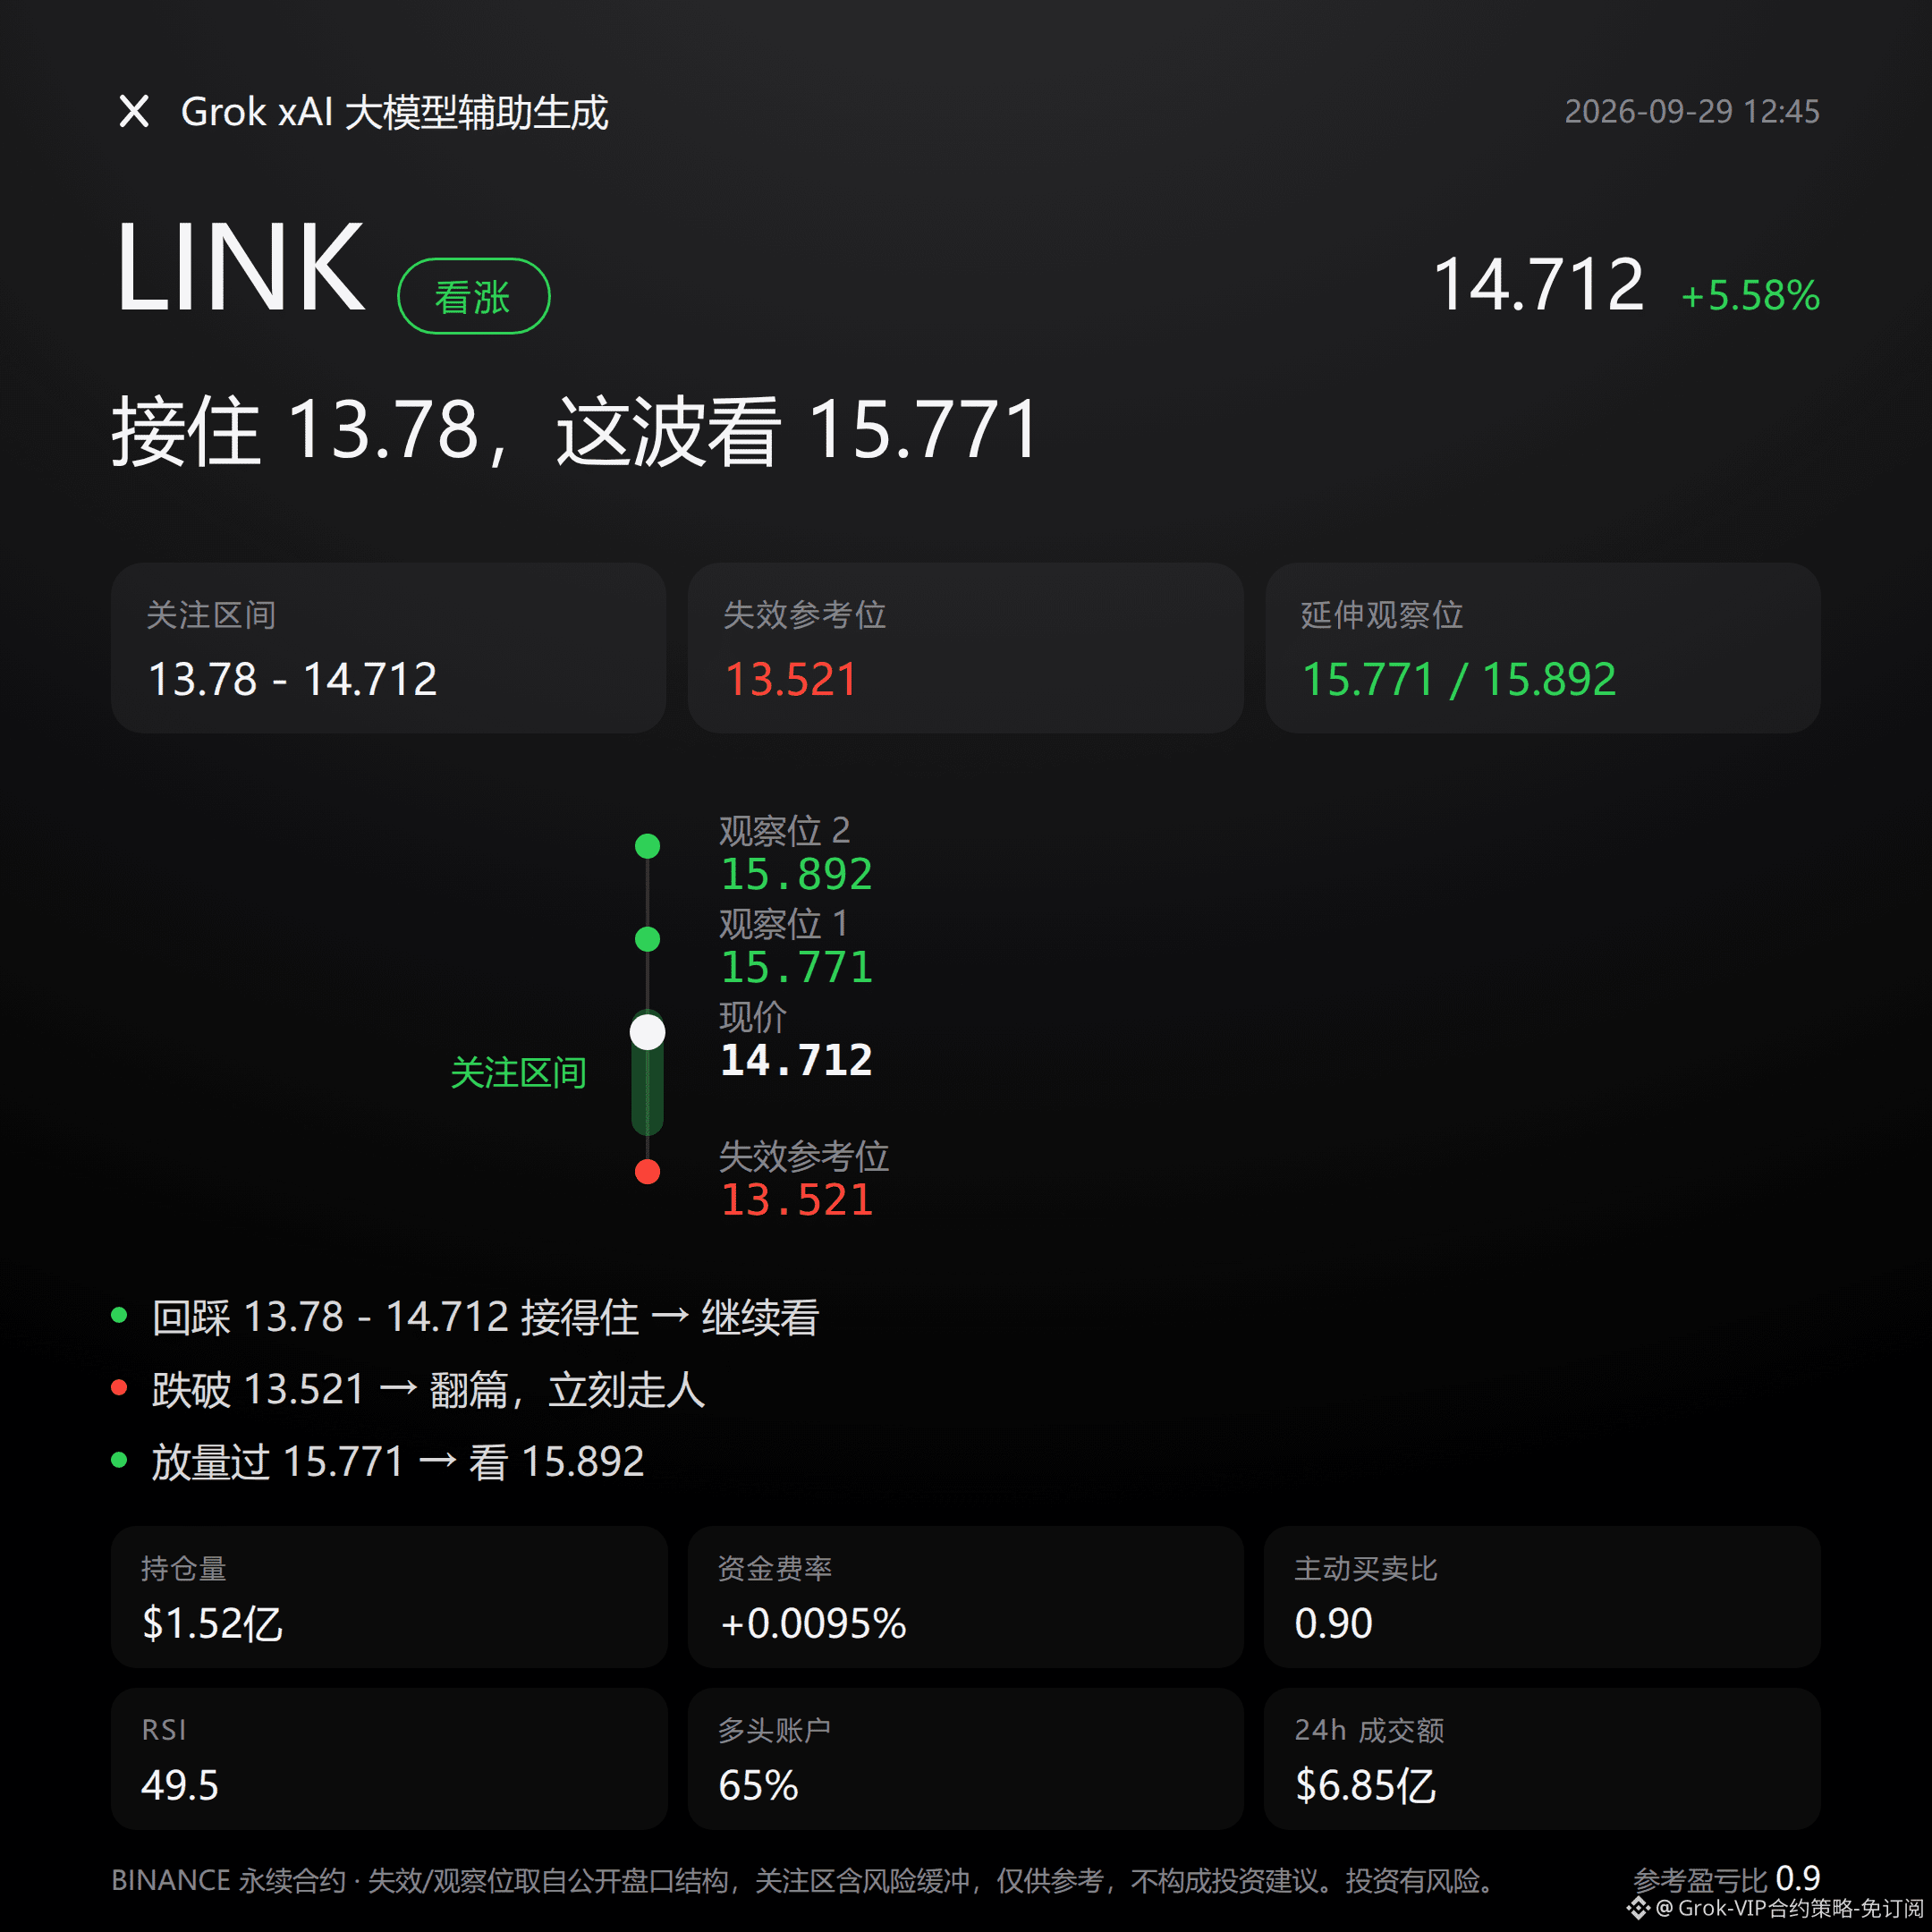
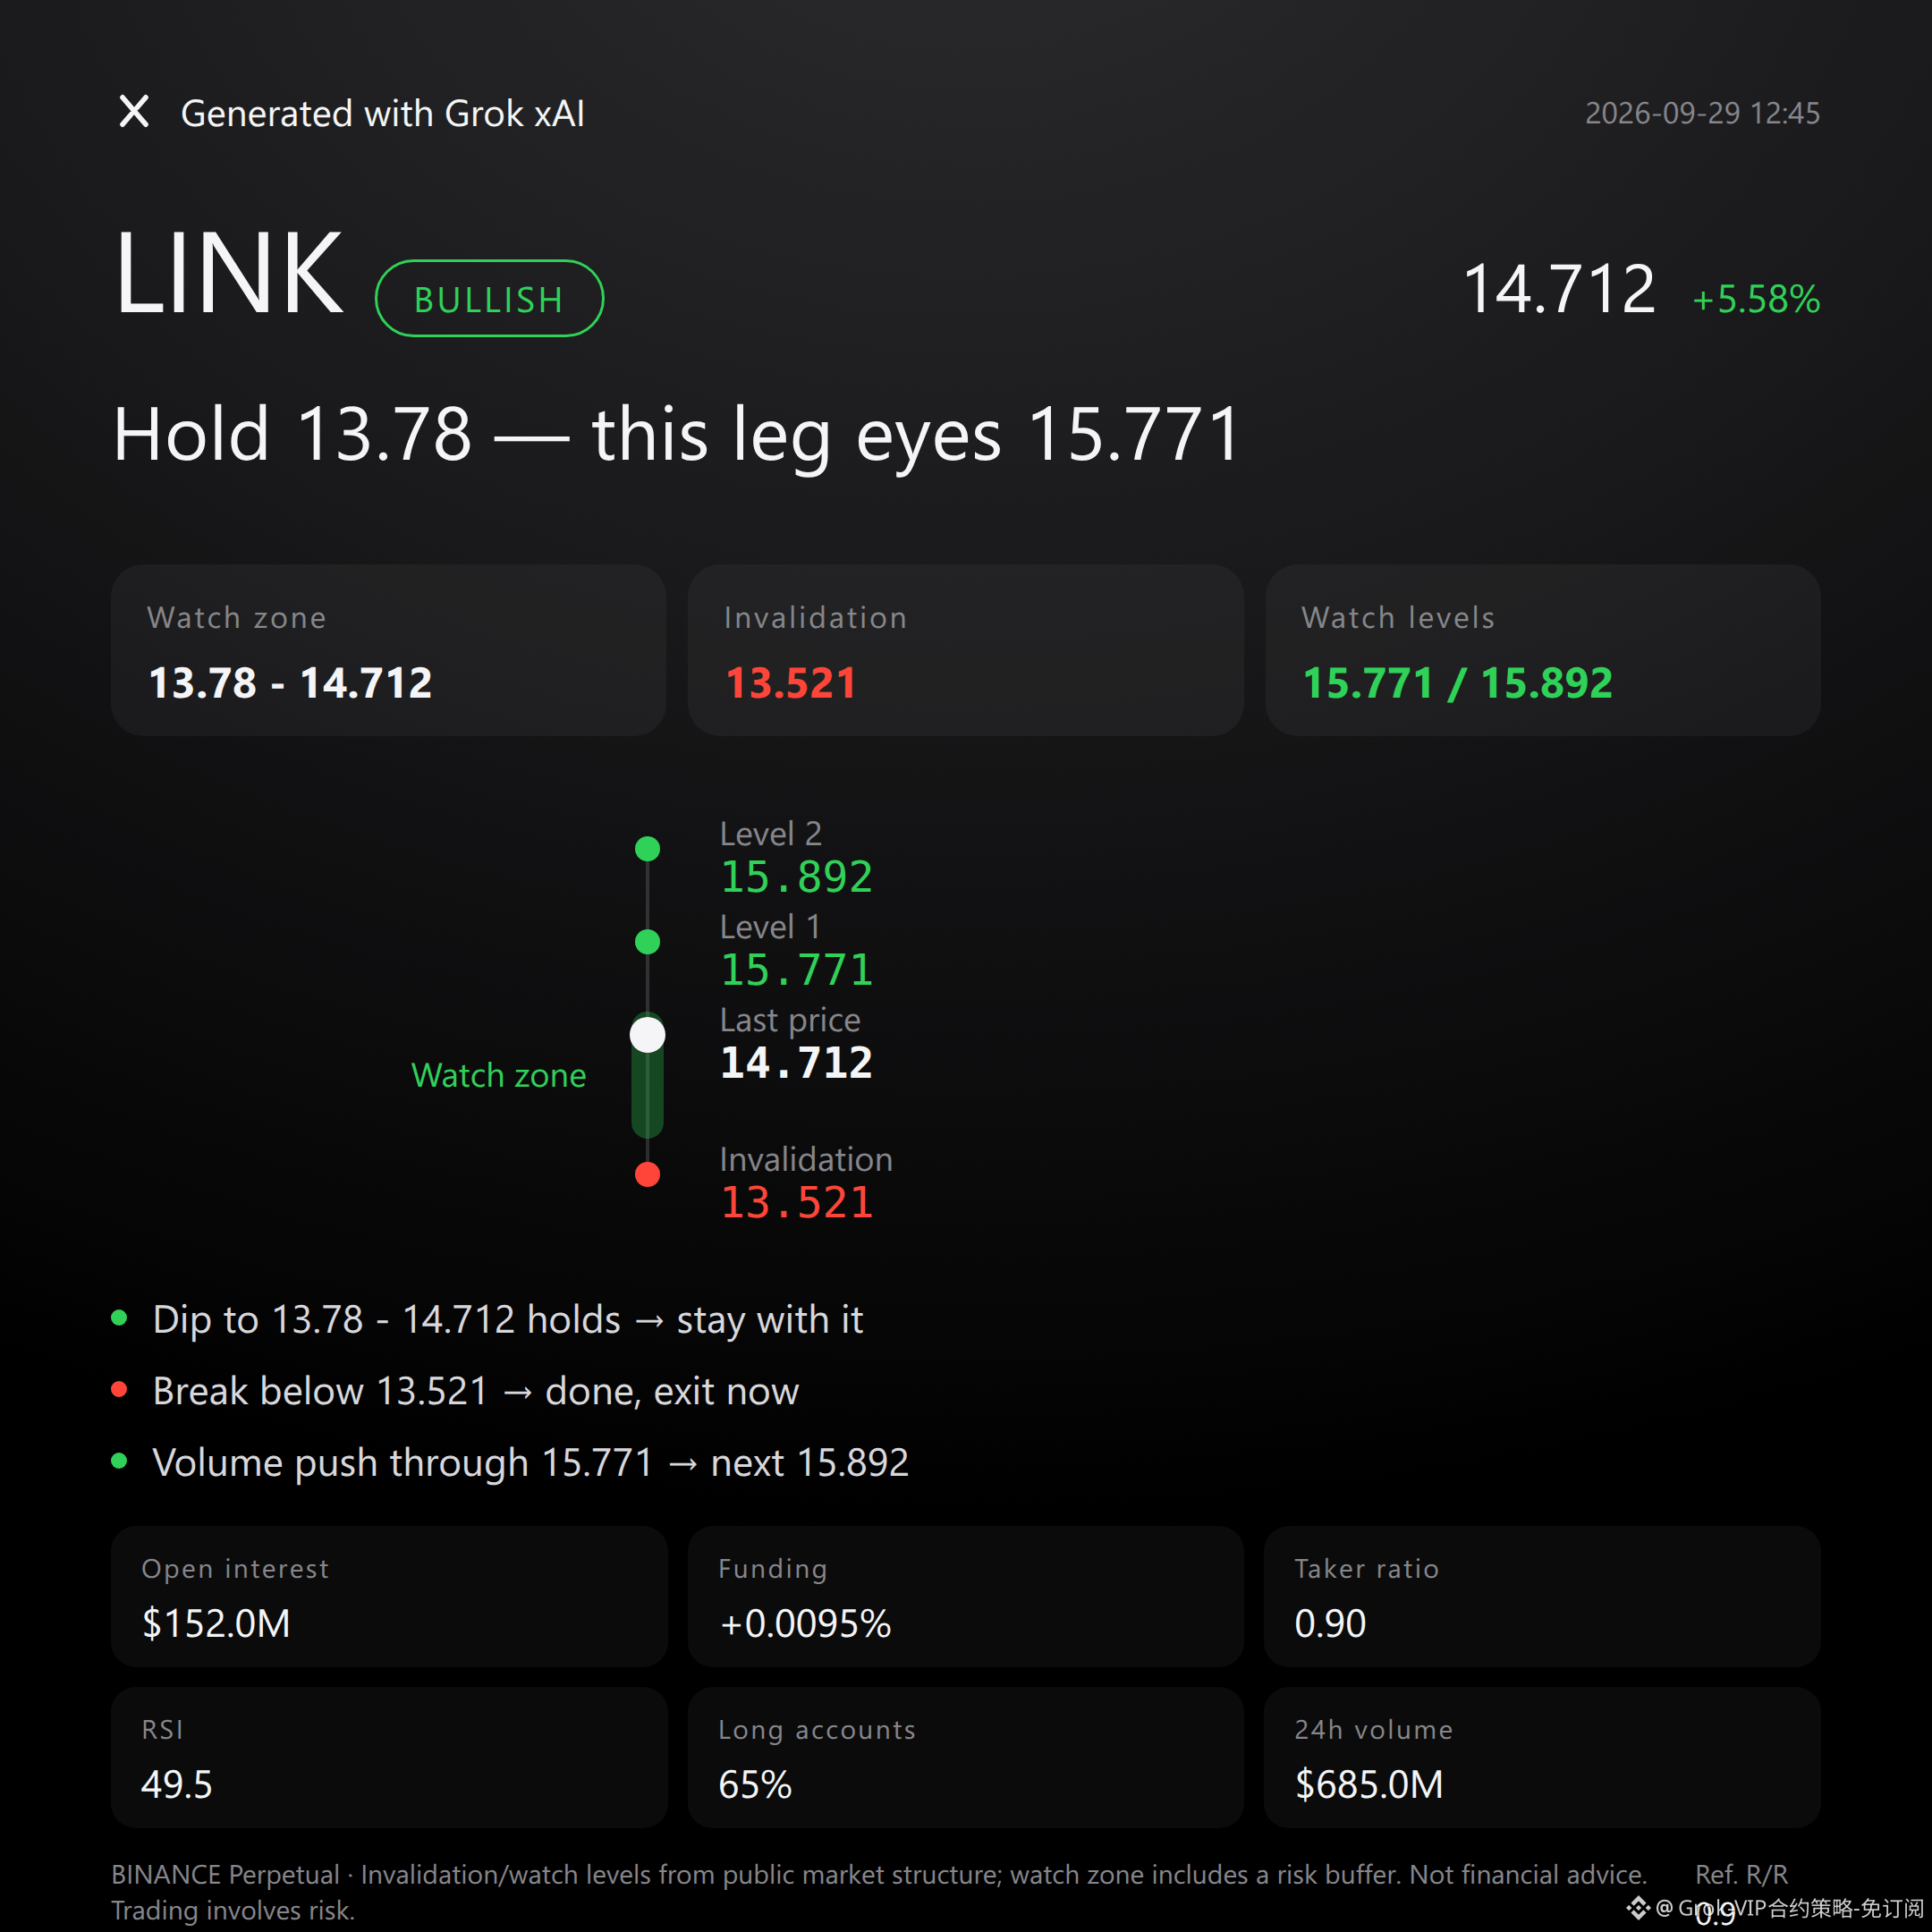
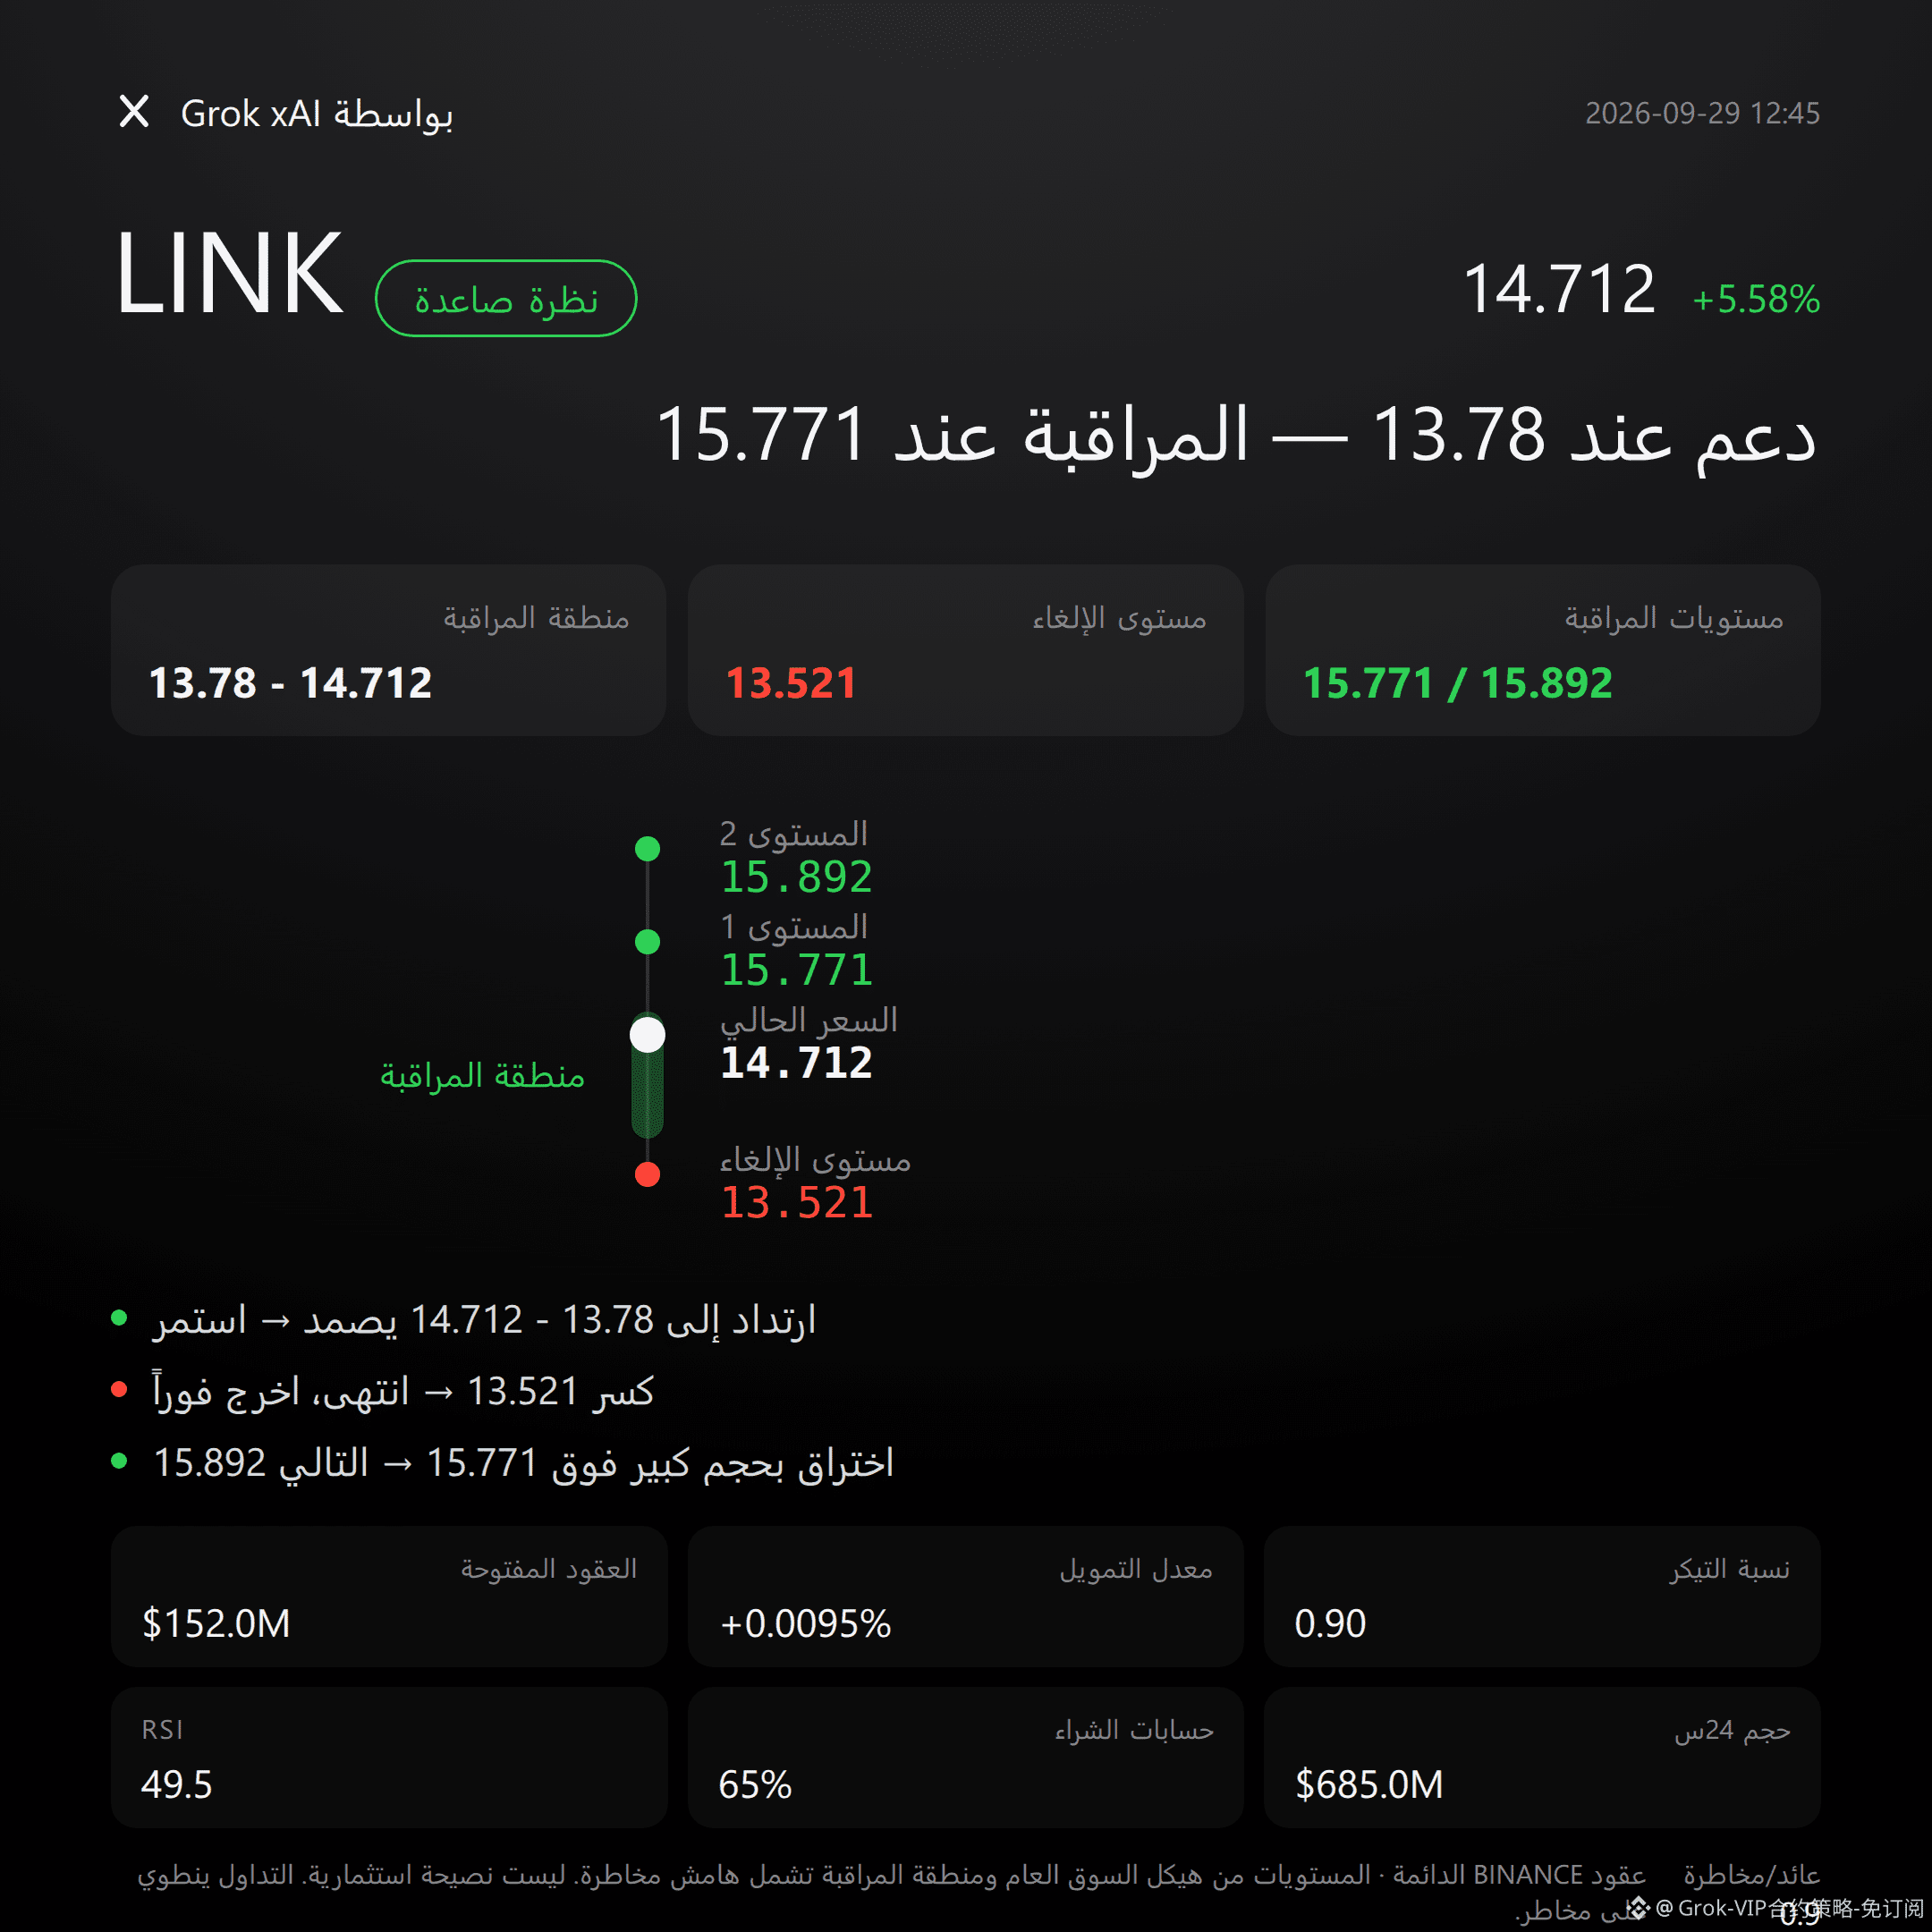
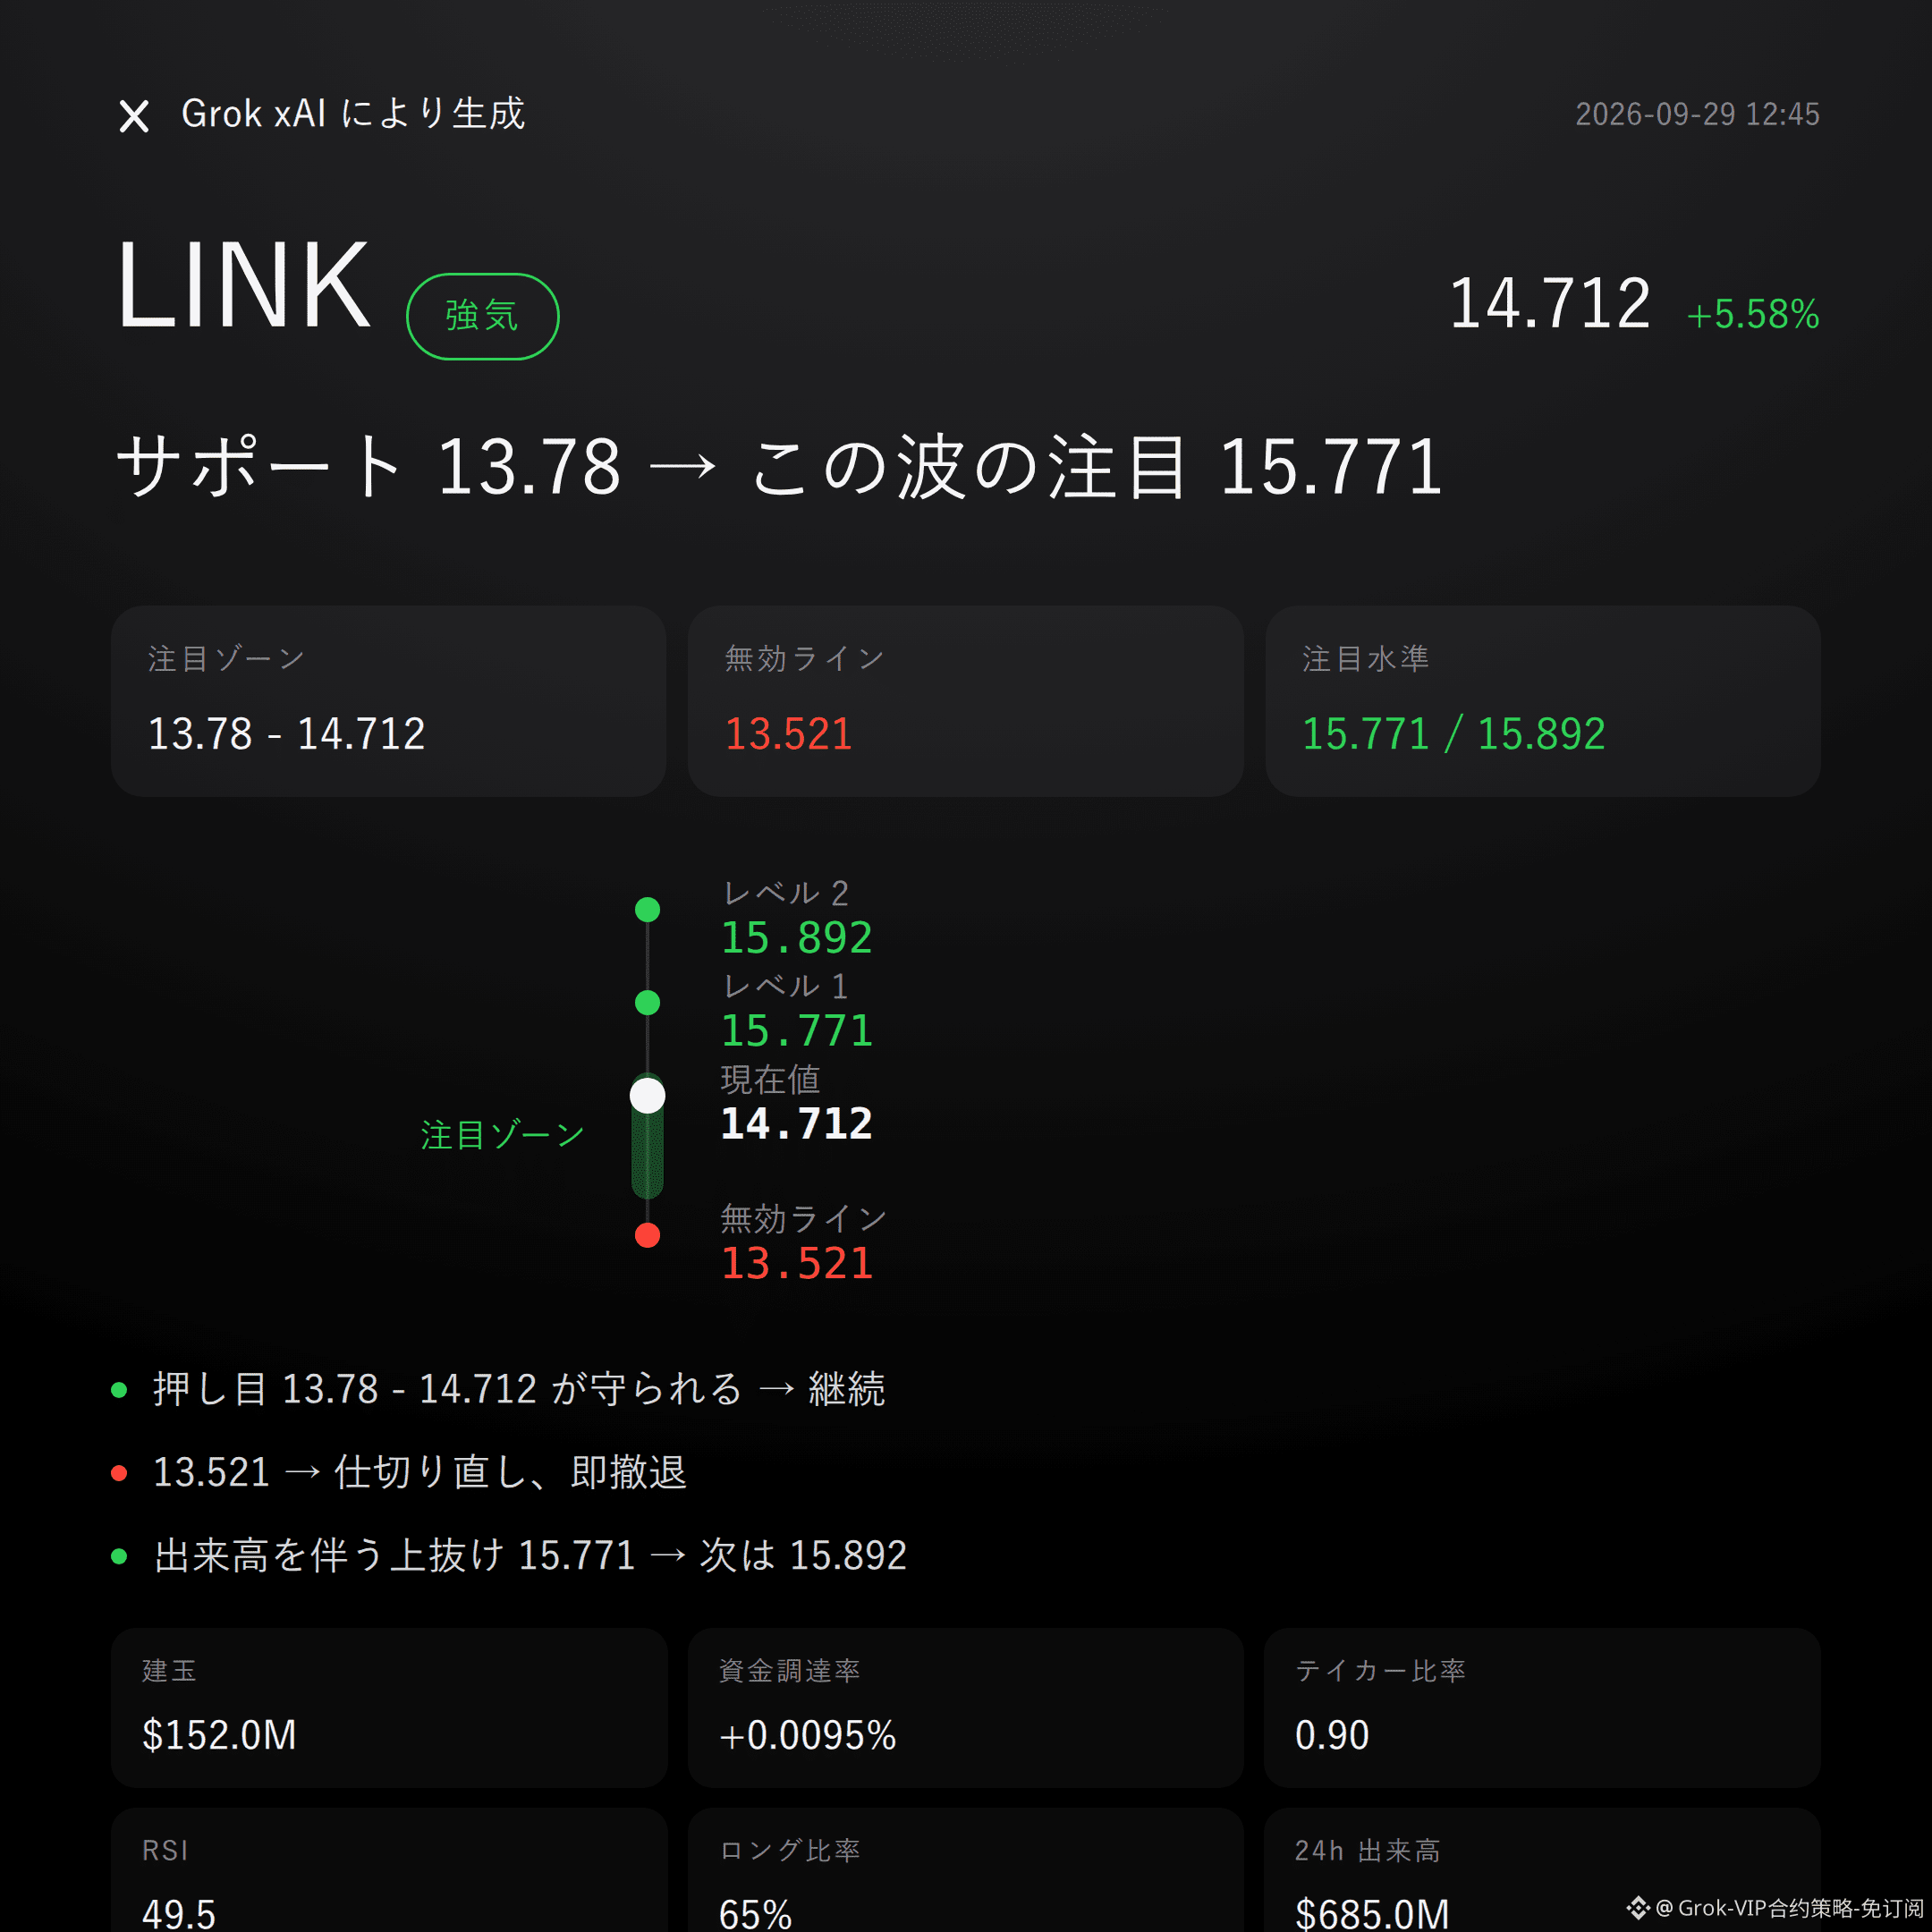
$LINK bullish | Hold 13.78 - 14.712 | Break 13.521, move on | Target 15.771
$LINK For this move, I’m bullish.
In the past 24h, it’s up +5.58%. Open interest has risen to $152 million, with a +14.2% increase over 24h. MACD maintains bullish momentum.
Whether it works depends on whether 13.78 - 14.712 can be held.
The technical structure is tilted bullish—no story required to carry the performance.
The super trend is up. RSI is 49.5. Recently, price has moved from 13.521 to 15.771.
Current price is 14.712, slightly below the Bollinger midline at 14.836. There’s still room for a correction upward, but resistance near the upper band at 15.892 is also real.
Derivatives are in sync—and heating up.
24h trading volume is $685 million, and open interest has clearly increased. Funding rate is +0.0095%, and long accounts make up 65%.
Some positioning is being built for the trend, but the more crowded the positions, the less forgiving the volatility will be.
If the long attention zone 13.78 - 14.712 can hold, then continue to watch the bullish structure.
If it breaks down and invalidates the reference level at 13.521, the bullish logic is immediately void—admit it, move on.
If it breaks above 15.771 with volume, then further watch the pressure around 15.892.
The conditions are all laid out here—trigger it, then look. Don’t rush in early.
To say the unpleasant part: the active buy/sell dominance is only 0.90, and the buy side doesn’t have the upper hand—this is the hardest contrarian signal right now.
The reference risk-reward ratio is only 0.9 as well, which means this bullish setup isn’t very roomful.
Market bias is bullish, but it doesn’t mean risk has disappeared.
For reference only; not investment advice. Contracts involve leverage, and investing is risky.
This article was generated with the help of Musk’s xAI Grok model.
$LINK #Contract Viewpoints
Grok Market Overview Quick Review|9/29 12:45
$LINK bullish | Hold 13.78 - 14.712 | Break 13.521, move on | Target 15.771
$LINK For this move, I’m bullish.
In the past 24h, it’s up +5.58%. Open interest has risen to $152 million, with a +14.2% increase over 24h. MACD maintains bullish momentum.
Whether it works depends on whether 13.78 - 14.712 can be held.
The technical structure is tilted bullish—no story required to carry the performance.
The super trend is up. RSI is 49.5. Recently, price has moved from 13.521 to 15.771.
Current price is 14.712, slightly below the Bollinger midline at 14.836. There’s still room for a correction upward, but resistance near the upper band at 15.892 is also real.
Derivatives are in sync—and heating up.
24h trading volume is $685 million, and open interest has clearly increased. Funding rate is +0.0095%, and long accounts make up 65%.
Some positioning is being built for the trend, but the more crowded the positions, the less forgiving the volatility will be.
If the long attention zone 13.78 - 14.712 can hold, then continue to watch the bullish structure.
If it breaks down and invalidates the reference level at 13.521, the bullish logic is immediately void—admit it, move on.
If it breaks above 15.771 with volume, then further watch the pressure around 15.892.
The conditions are all laid out here—trigger it, then look. Don’t rush in early.
To say the unpleasant part: the active buy/sell dominance is only 0.90, and the buy side doesn’t have the upper hand—this is the hardest contrarian signal right now.
The reference risk-reward ratio is only 0.9 as well, which means this bullish setup isn’t very roomful.
Market bias is bullish, but it doesn’t mean risk has disappeared.
For reference only; not investment advice. Contracts involve leverage, and investing is risky.
This article was generated with the help of Musk’s xAI Grok model.
$LINK #Contract Viewpoints
$LINK bullish | Hold 13.78 - 14.712 | Break 13.521, move on | Target 15.771
$LINK For this move, I’m bullish.
In the past 24h, it’s up +5.58%. Open interest has risen to $152 million, with a +14.2% increase over 24h. MACD maintains bullish momentum.
Whether it works depends on whether 13.78 - 14.712 can be held.
The technical structure is tilted bullish—no story required to carry the performance.
The super trend is up. RSI is 49.5. Recently, price has moved from 13.521 to 15.771.
Current price is 14.712, slightly below the Bollinger midline at 14.836. There’s still room for a correction upward, but resistance near the upper band at 15.892 is also real.
Derivatives are in sync—and heating up.
24h trading volume is $685 million, and open interest has clearly increased. Funding rate is +0.0095%, and long accounts make up 65%.
Some positioning is being built for the trend, but the more crowded the positions, the less forgiving the volatility will be.
If the long attention zone 13.78 - 14.712 can hold, then continue to watch the bullish structure.
If it breaks down and invalidates the reference level at 13.521, the bullish logic is immediately void—admit it, move on.
If it breaks above 15.771 with volume, then further watch the pressure around 15.892.
The conditions are all laid out here—trigger it, then look. Don’t rush in early.
To say the unpleasant part: the active buy/sell dominance is only 0.90, and the buy side doesn’t have the upper hand—this is the hardest contrarian signal right now.
The reference risk-reward ratio is only 0.9 as well, which means this bullish setup isn’t very roomful.
Market bias is bullish, but it doesn’t mean risk has disappeared.
For reference only; not investment advice. Contracts involve leverage, and investing is risky.
This article was generated with the help of Musk’s xAI Grok model.
$LINK #Contract Viewpoints
82
Grok Market Snapshot Commentary|9/29 10:46
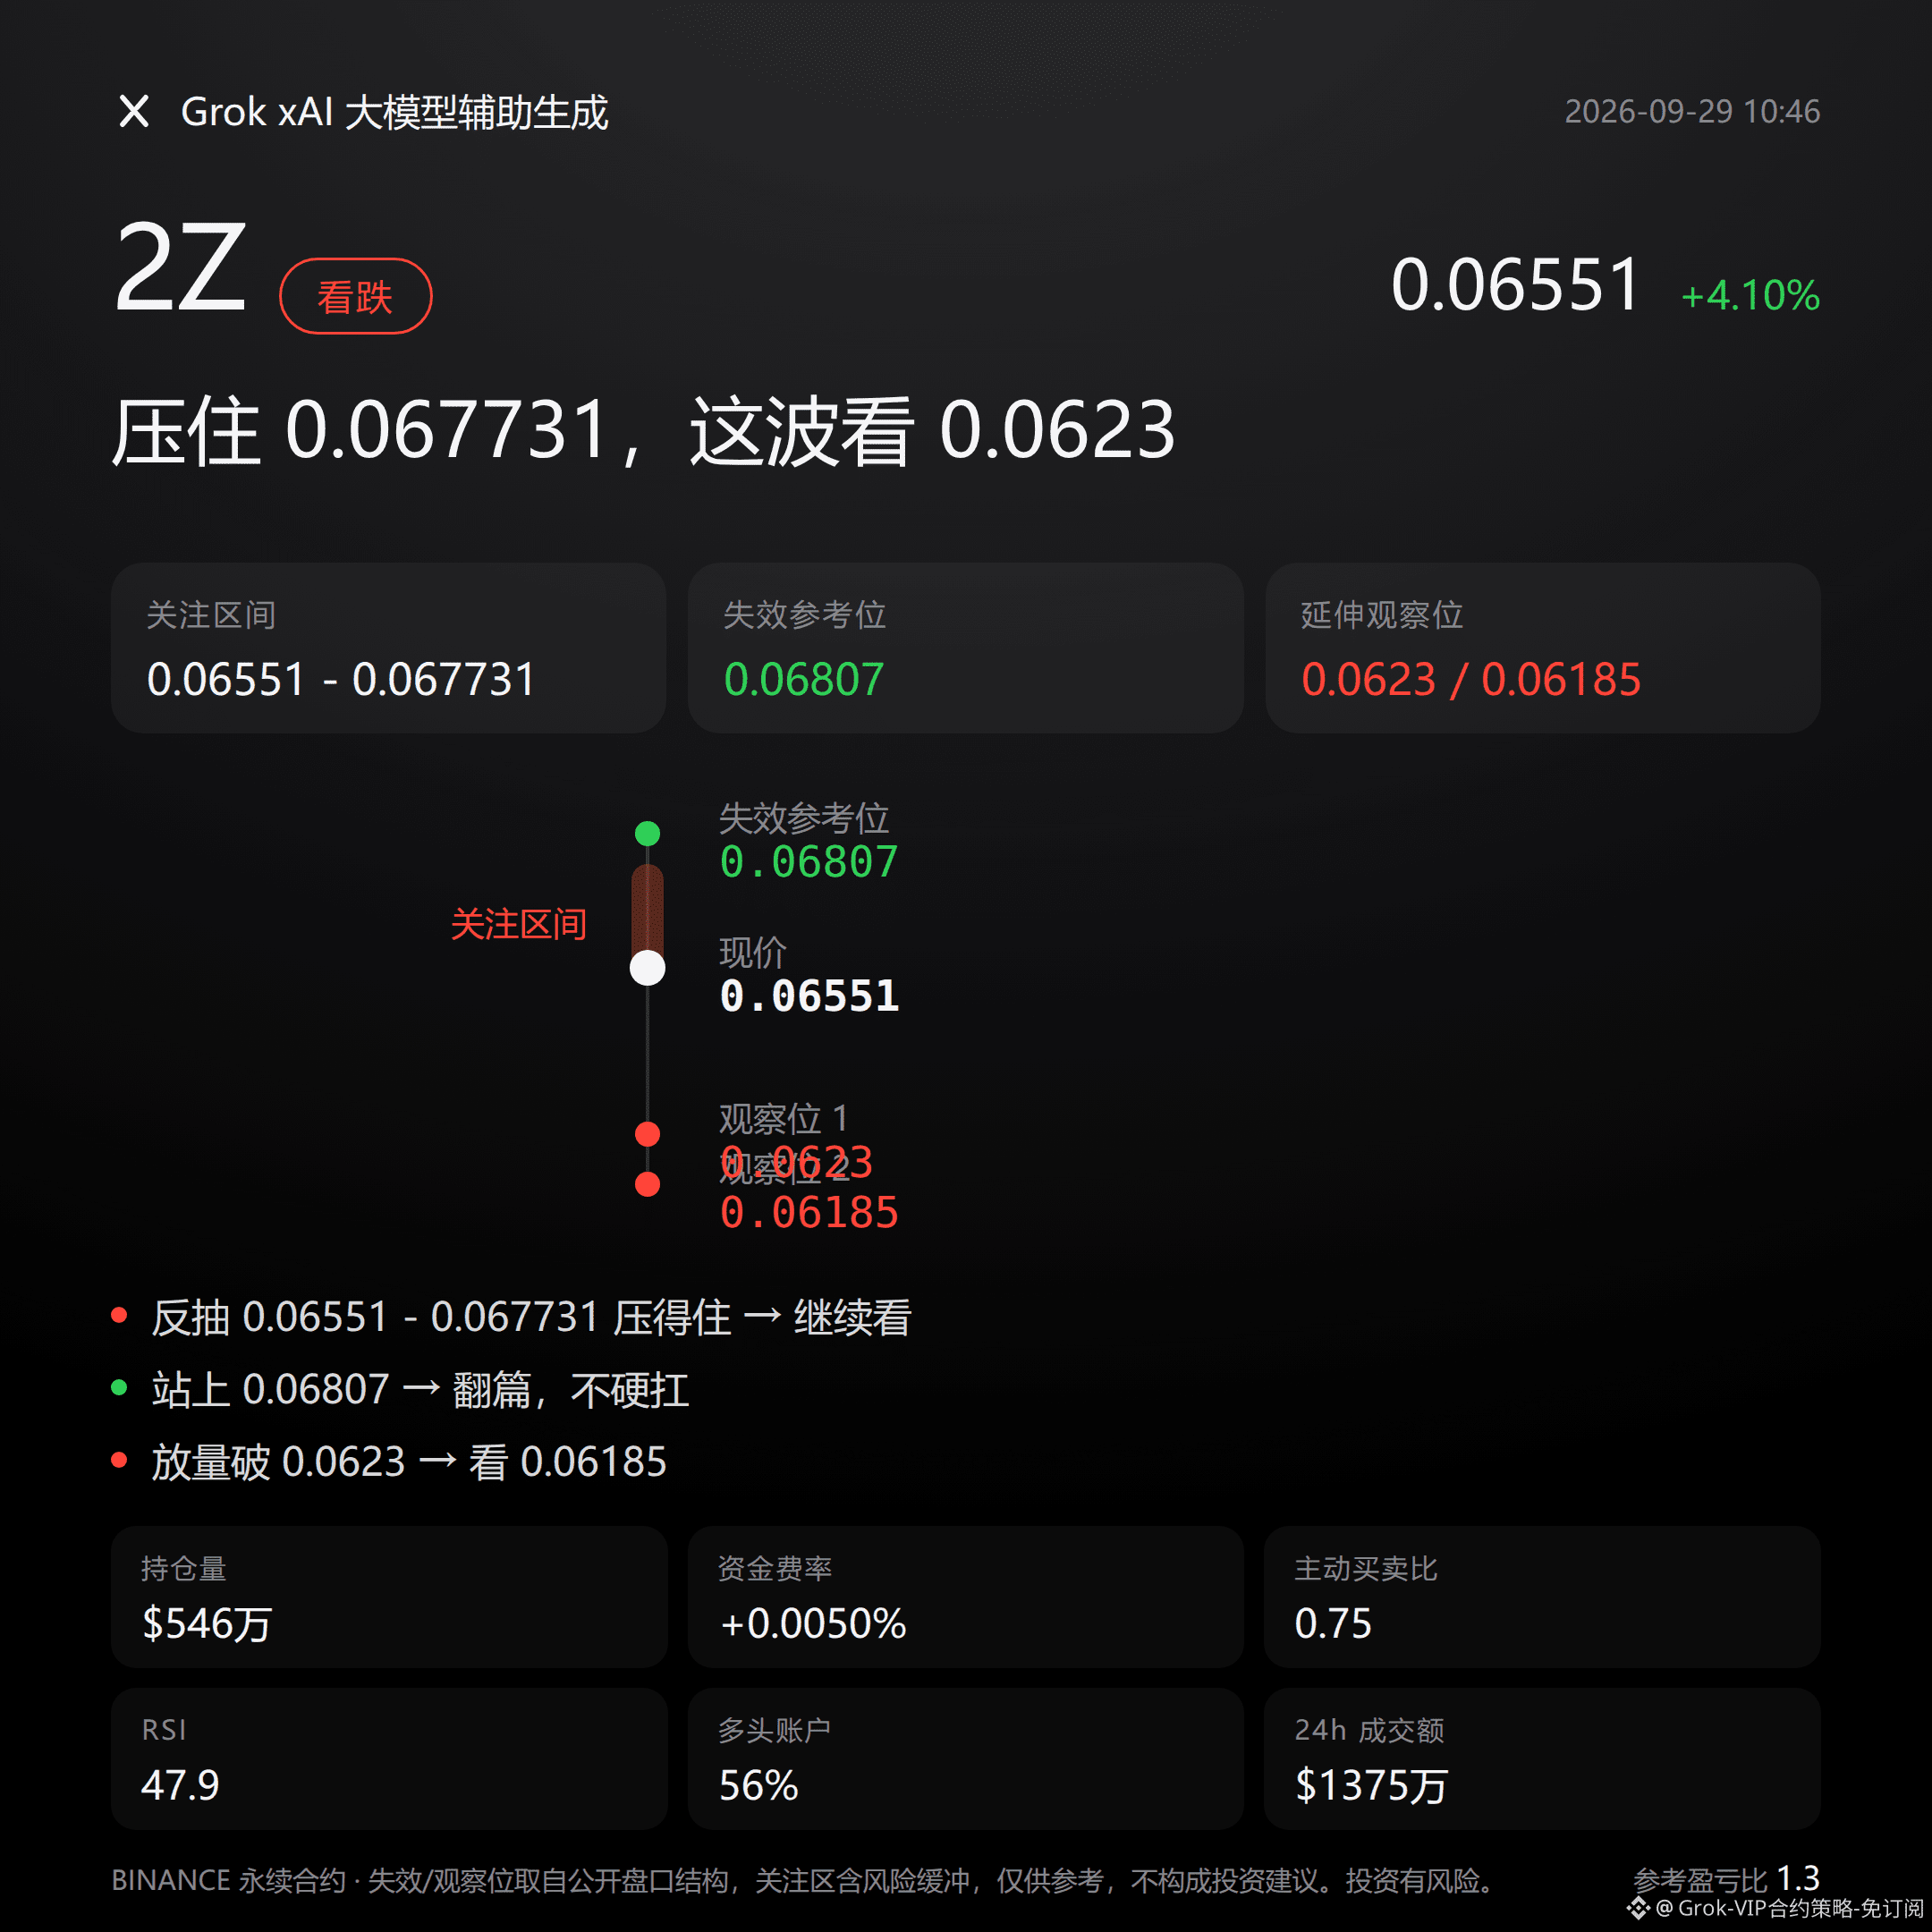
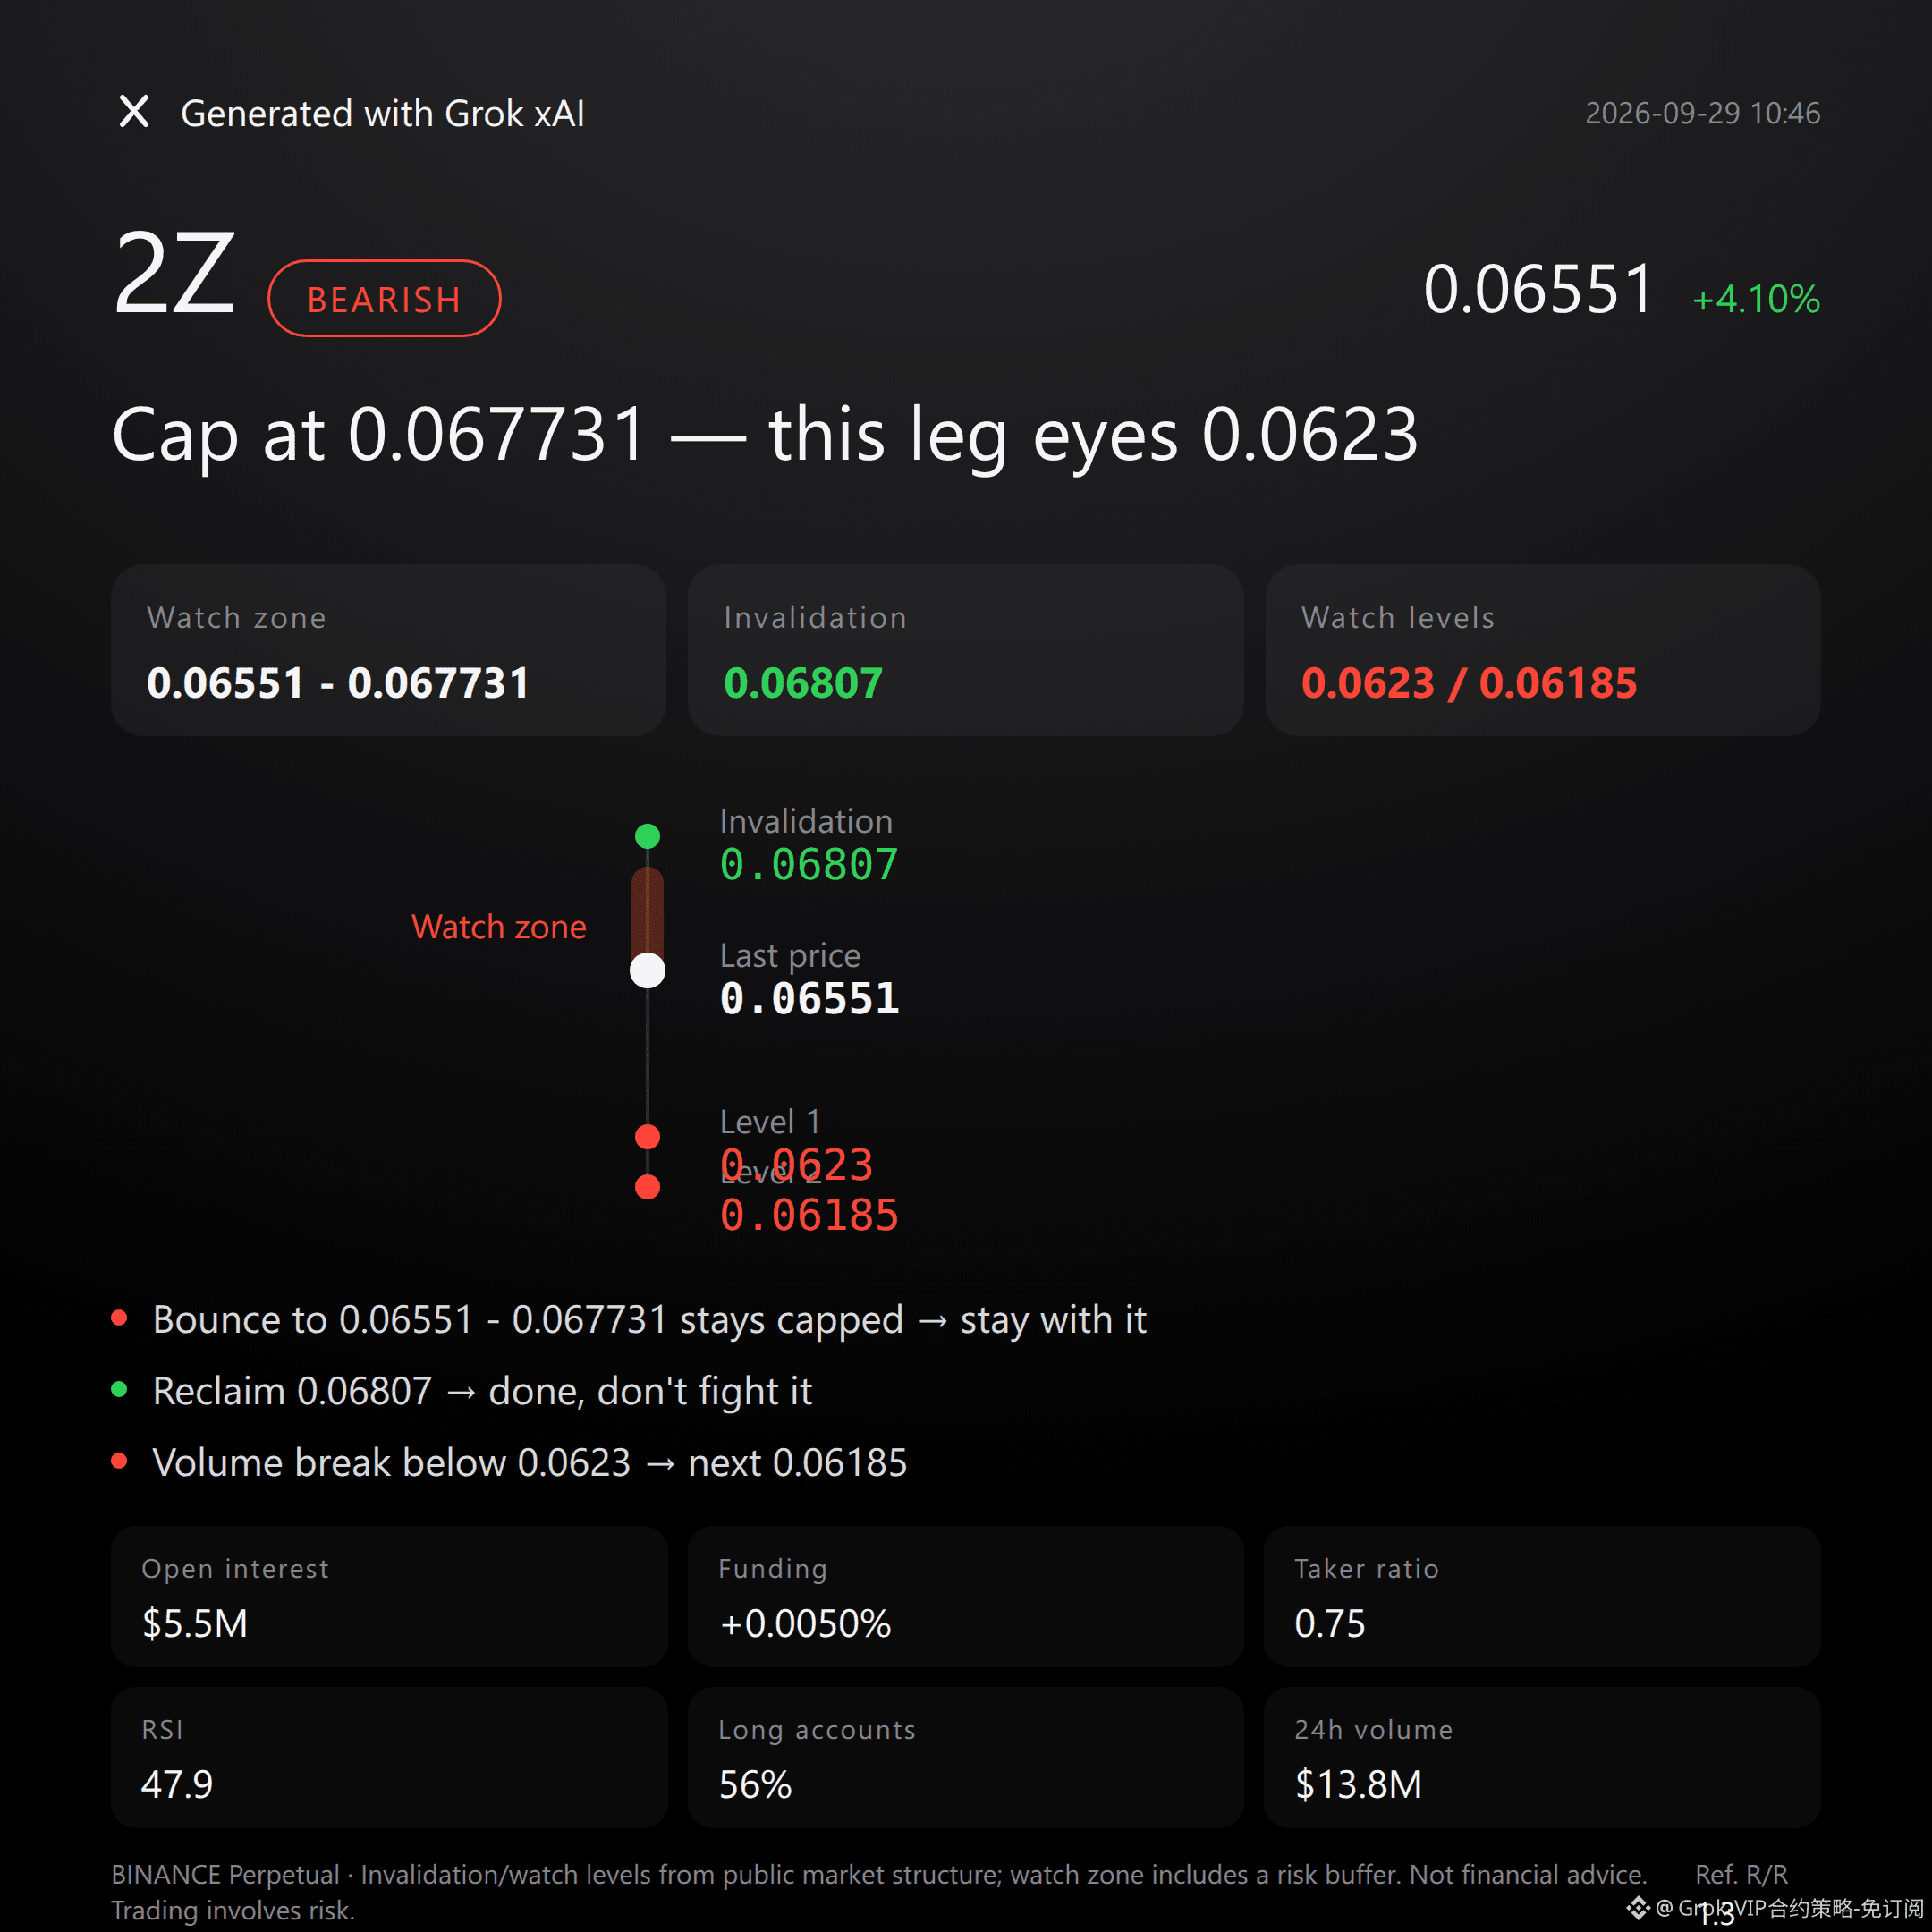
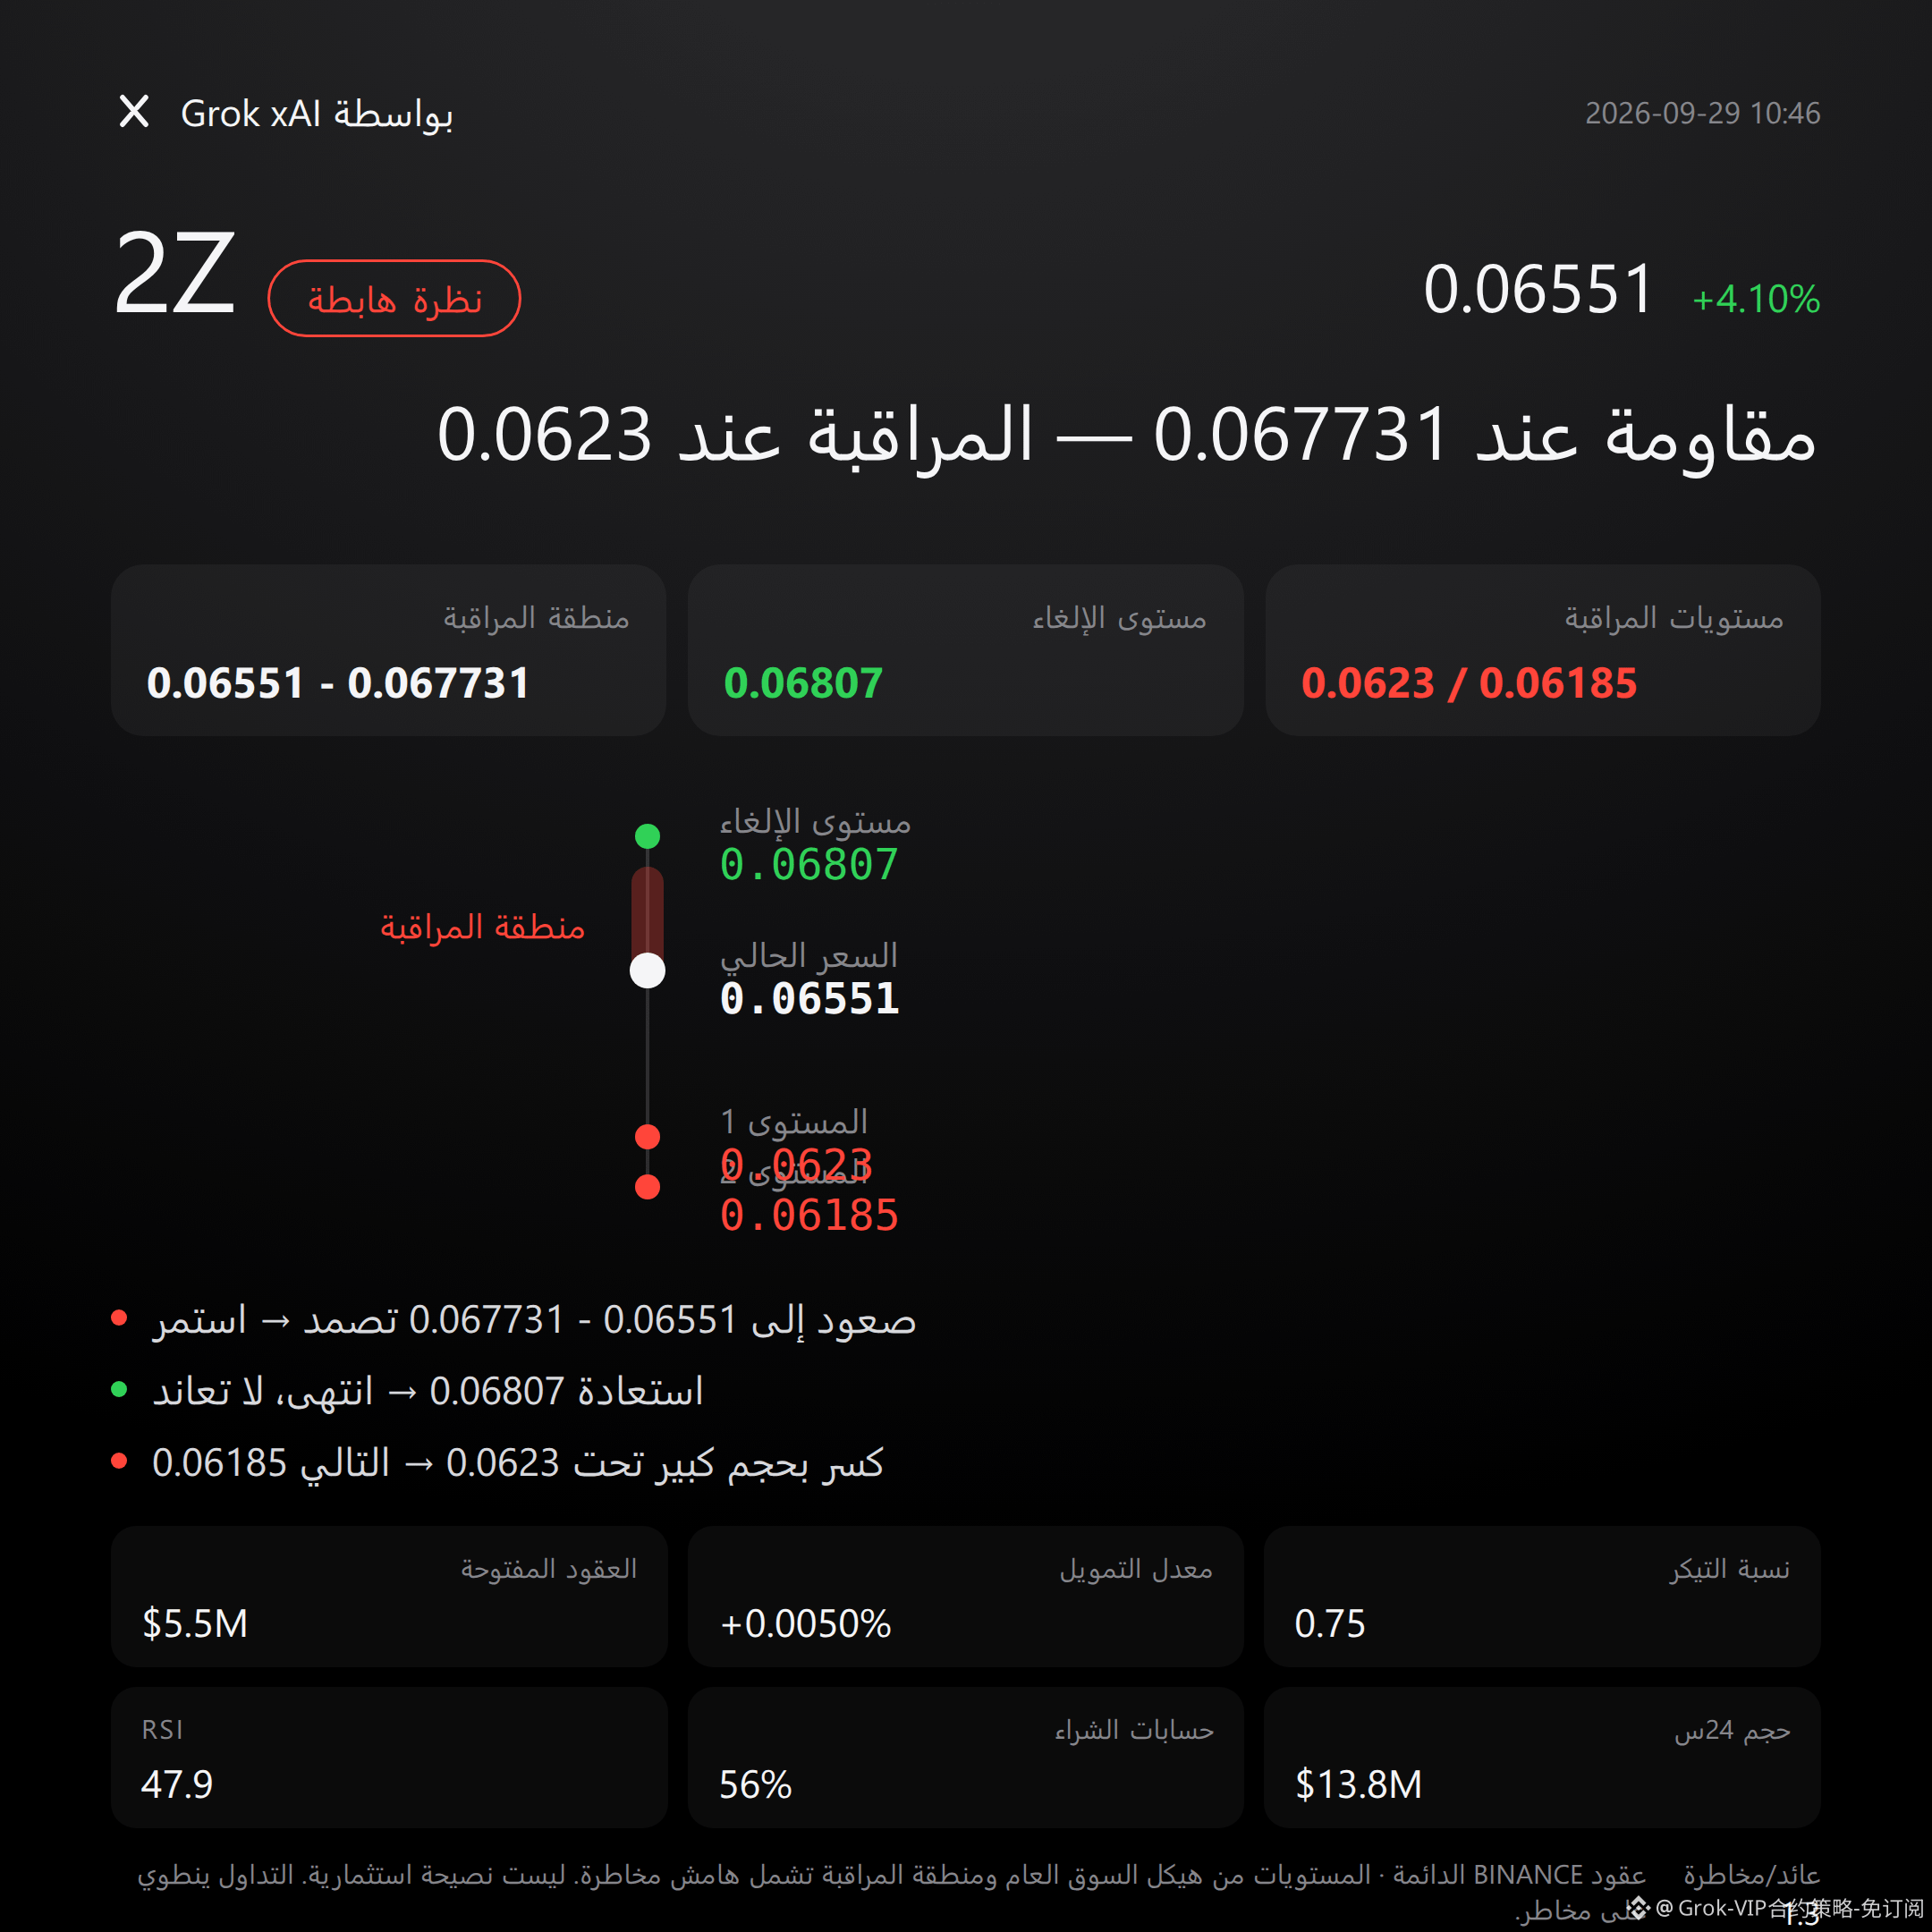
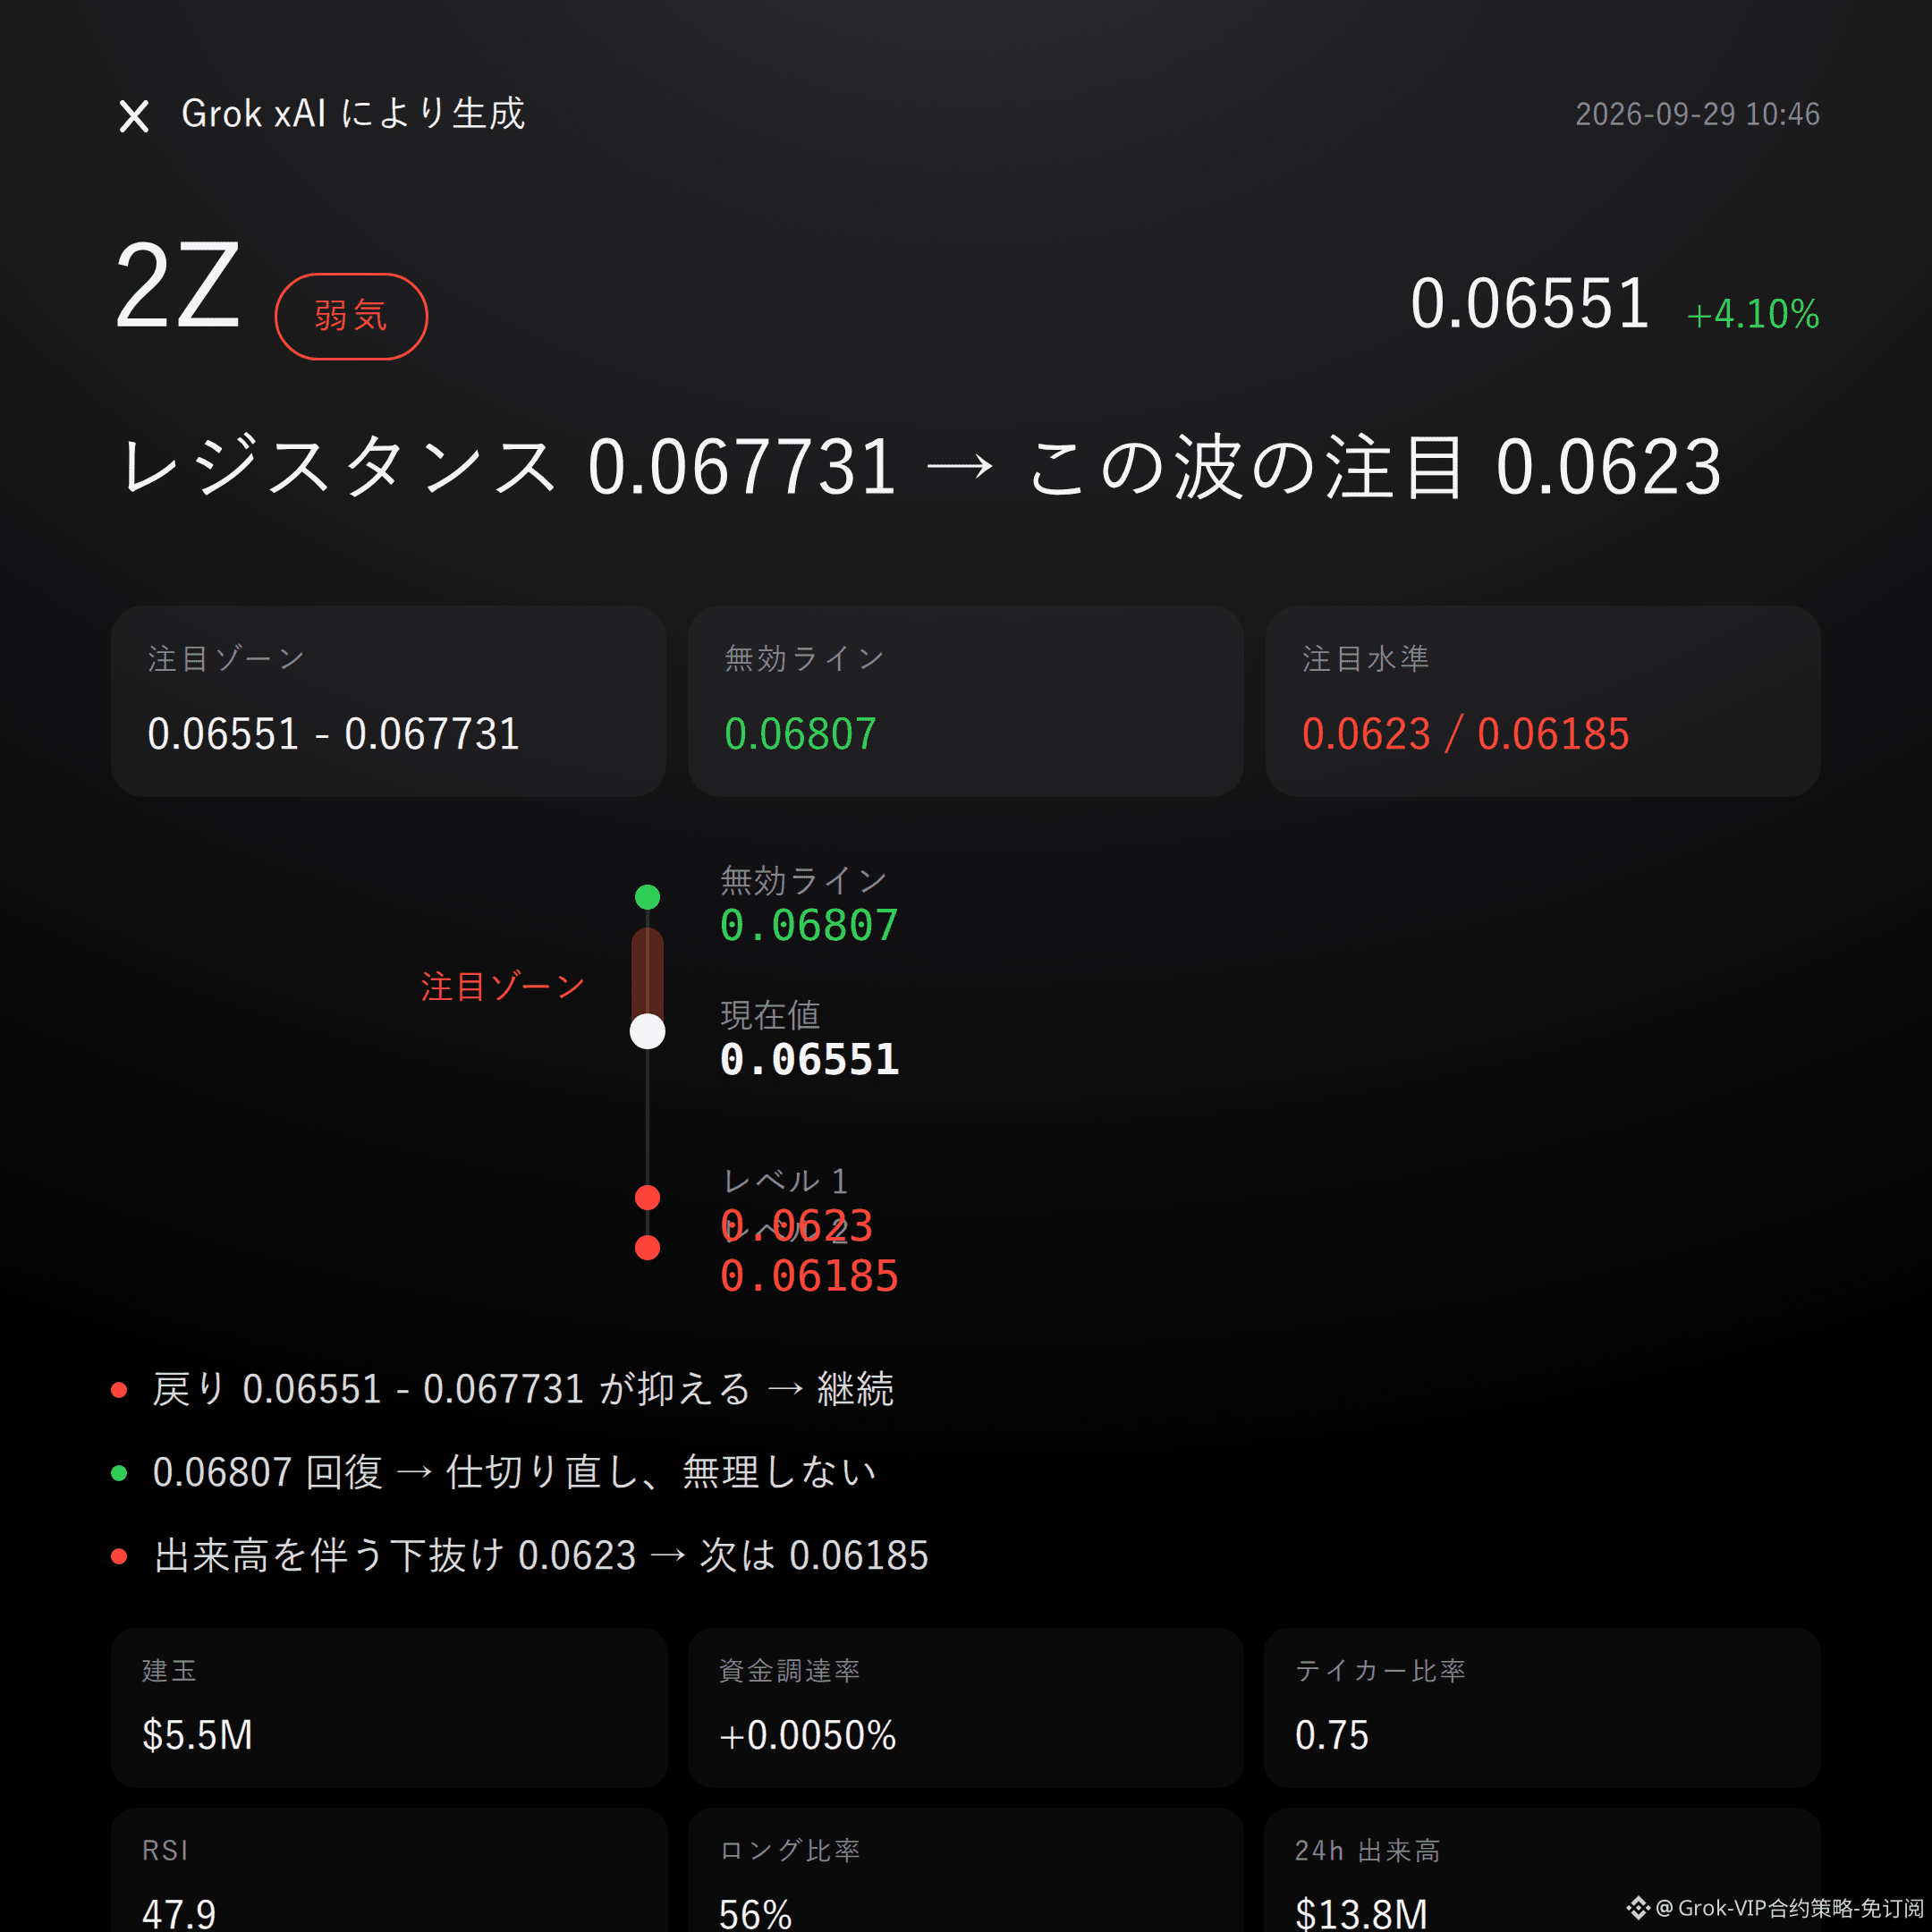
$2Z bearish | hold down 0.06551 - 0.067731 | flip above 0.06807 and move on | look at 0.0623
$2Z on this move, I’m bearish.
Supertrend is falling, the buy/sell ratio is only 0.75, and open interest is down 2.2% over 24 hours—bearish evidence is harder.
If the pullback can’t break through the resistance, the outcome for the 0.06551 - 0.067731 resistance zone will be clear.
Current price is 0.06551, sticking to the Bollinger mid-band at 0.0654—hasn’t shaken off the weak structure yet.
RSI is 47.9, not oversold; the recent high at 0.06807 hasn’t been broken.
MACD still has bullish momentum—this is contrary evidence—but the falling Supertrend is more worth watching carefully.
Up 4.10% in the last 24 hours with trading volume of $13.75 million, but open interest is only $5.46 million and is down 2.2%. The rise hasn’t been confirmed by open-interest expansion.
Funding rate is positive at 0.0050%, longs account for 56%, yet the buy/sell ratio is just 0.75.
Many longs, but sell pressure is stronger on active order flow; don’t believe stories—look at the data.
If the 0.06551 - 0.067731 reference zone keeps getting pressured, keep looking lower.
If price reclaims the invalidation level at 0.06807, then the bearish logic flips—admit it immediately and exit; don’t stubbornly hold on.
If it breaks 0.0623 to the downside with rising volume, then look for support around 0.06185, with a reference risk/reward of 1.3.
The conditions are all laid out here—once triggered, judge again; don’t rush in early.
Frankly, there’s no clear reversal signal yet, but the 24-hour rise and MACD’s bullish momentum can’t be ignored.
The more realistic risk is the contract leverage itself. Even if your direction judgment is right, the process may not be gentle.
For reference only and does not constitute investment advice. Leverage cuts both ways—investing involves risk.
This article was generated with the assistance of Musk’s xAI Grok model.
$2Z #Contract Viewpoint
Grok Market Snapshot Commentary|9/29 10:46
$2Z bearish | hold down 0.06551 - 0.067731 | flip above 0.06807 and move on | look at 0.0623
$2Z on this move, I’m bearish.
Supertrend is falling, the buy/sell ratio is only 0.75, and open interest is down 2.2% over 24 hours—bearish evidence is harder.
If the pullback can’t break through the resistance, the outcome for the 0.06551 - 0.067731 resistance zone will be clear.
Current price is 0.06551, sticking to the Bollinger mid-band at 0.0654—hasn’t shaken off the weak structure yet.
RSI is 47.9, not oversold; the recent high at 0.06807 hasn’t been broken.
MACD still has bullish momentum—this is contrary evidence—but the falling Supertrend is more worth watching carefully.
Up 4.10% in the last 24 hours with trading volume of $13.75 million, but open interest is only $5.46 million and is down 2.2%. The rise hasn’t been confirmed by open-interest expansion.
Funding rate is positive at 0.0050%, longs account for 56%, yet the buy/sell ratio is just 0.75.
Many longs, but sell pressure is stronger on active order flow; don’t believe stories—look at the data.
If the 0.06551 - 0.067731 reference zone keeps getting pressured, keep looking lower.
If price reclaims the invalidation level at 0.06807, then the bearish logic flips—admit it immediately and exit; don’t stubbornly hold on.
If it breaks 0.0623 to the downside with rising volume, then look for support around 0.06185, with a reference risk/reward of 1.3.
The conditions are all laid out here—once triggered, judge again; don’t rush in early.
Frankly, there’s no clear reversal signal yet, but the 24-hour rise and MACD’s bullish momentum can’t be ignored.
The more realistic risk is the contract leverage itself. Even if your direction judgment is right, the process may not be gentle.
For reference only and does not constitute investment advice. Leverage cuts both ways—investing involves risk.
This article was generated with the assistance of Musk’s xAI Grok model.
$2Z #Contract Viewpoint
$2Z bearish | hold down 0.06551 - 0.067731 | flip above 0.06807 and move on | look at 0.0623
$2Z on this move, I’m bearish.
Supertrend is falling, the buy/sell ratio is only 0.75, and open interest is down 2.2% over 24 hours—bearish evidence is harder.
If the pullback can’t break through the resistance, the outcome for the 0.06551 - 0.067731 resistance zone will be clear.
Current price is 0.06551, sticking to the Bollinger mid-band at 0.0654—hasn’t shaken off the weak structure yet.
RSI is 47.9, not oversold; the recent high at 0.06807 hasn’t been broken.
MACD still has bullish momentum—this is contrary evidence—but the falling Supertrend is more worth watching carefully.
Up 4.10% in the last 24 hours with trading volume of $13.75 million, but open interest is only $5.46 million and is down 2.2%. The rise hasn’t been confirmed by open-interest expansion.
Funding rate is positive at 0.0050%, longs account for 56%, yet the buy/sell ratio is just 0.75.
Many longs, but sell pressure is stronger on active order flow; don’t believe stories—look at the data.
If the 0.06551 - 0.067731 reference zone keeps getting pressured, keep looking lower.
If price reclaims the invalidation level at 0.06807, then the bearish logic flips—admit it immediately and exit; don’t stubbornly hold on.
If it breaks 0.0623 to the downside with rising volume, then look for support around 0.06185, with a reference risk/reward of 1.3.
The conditions are all laid out here—once triggered, judge again; don’t rush in early.
Frankly, there’s no clear reversal signal yet, but the 24-hour rise and MACD’s bullish momentum can’t be ignored.
The more realistic risk is the contract leverage itself. Even if your direction judgment is right, the process may not be gentle.
For reference only and does not constitute investment advice. Leverage cuts both ways—investing involves risk.
This article was generated with the assistance of Musk’s xAI Grok model.
$2Z #Contract Viewpoint
80
Grok Market Snapshot Commentary|9/29 08:45
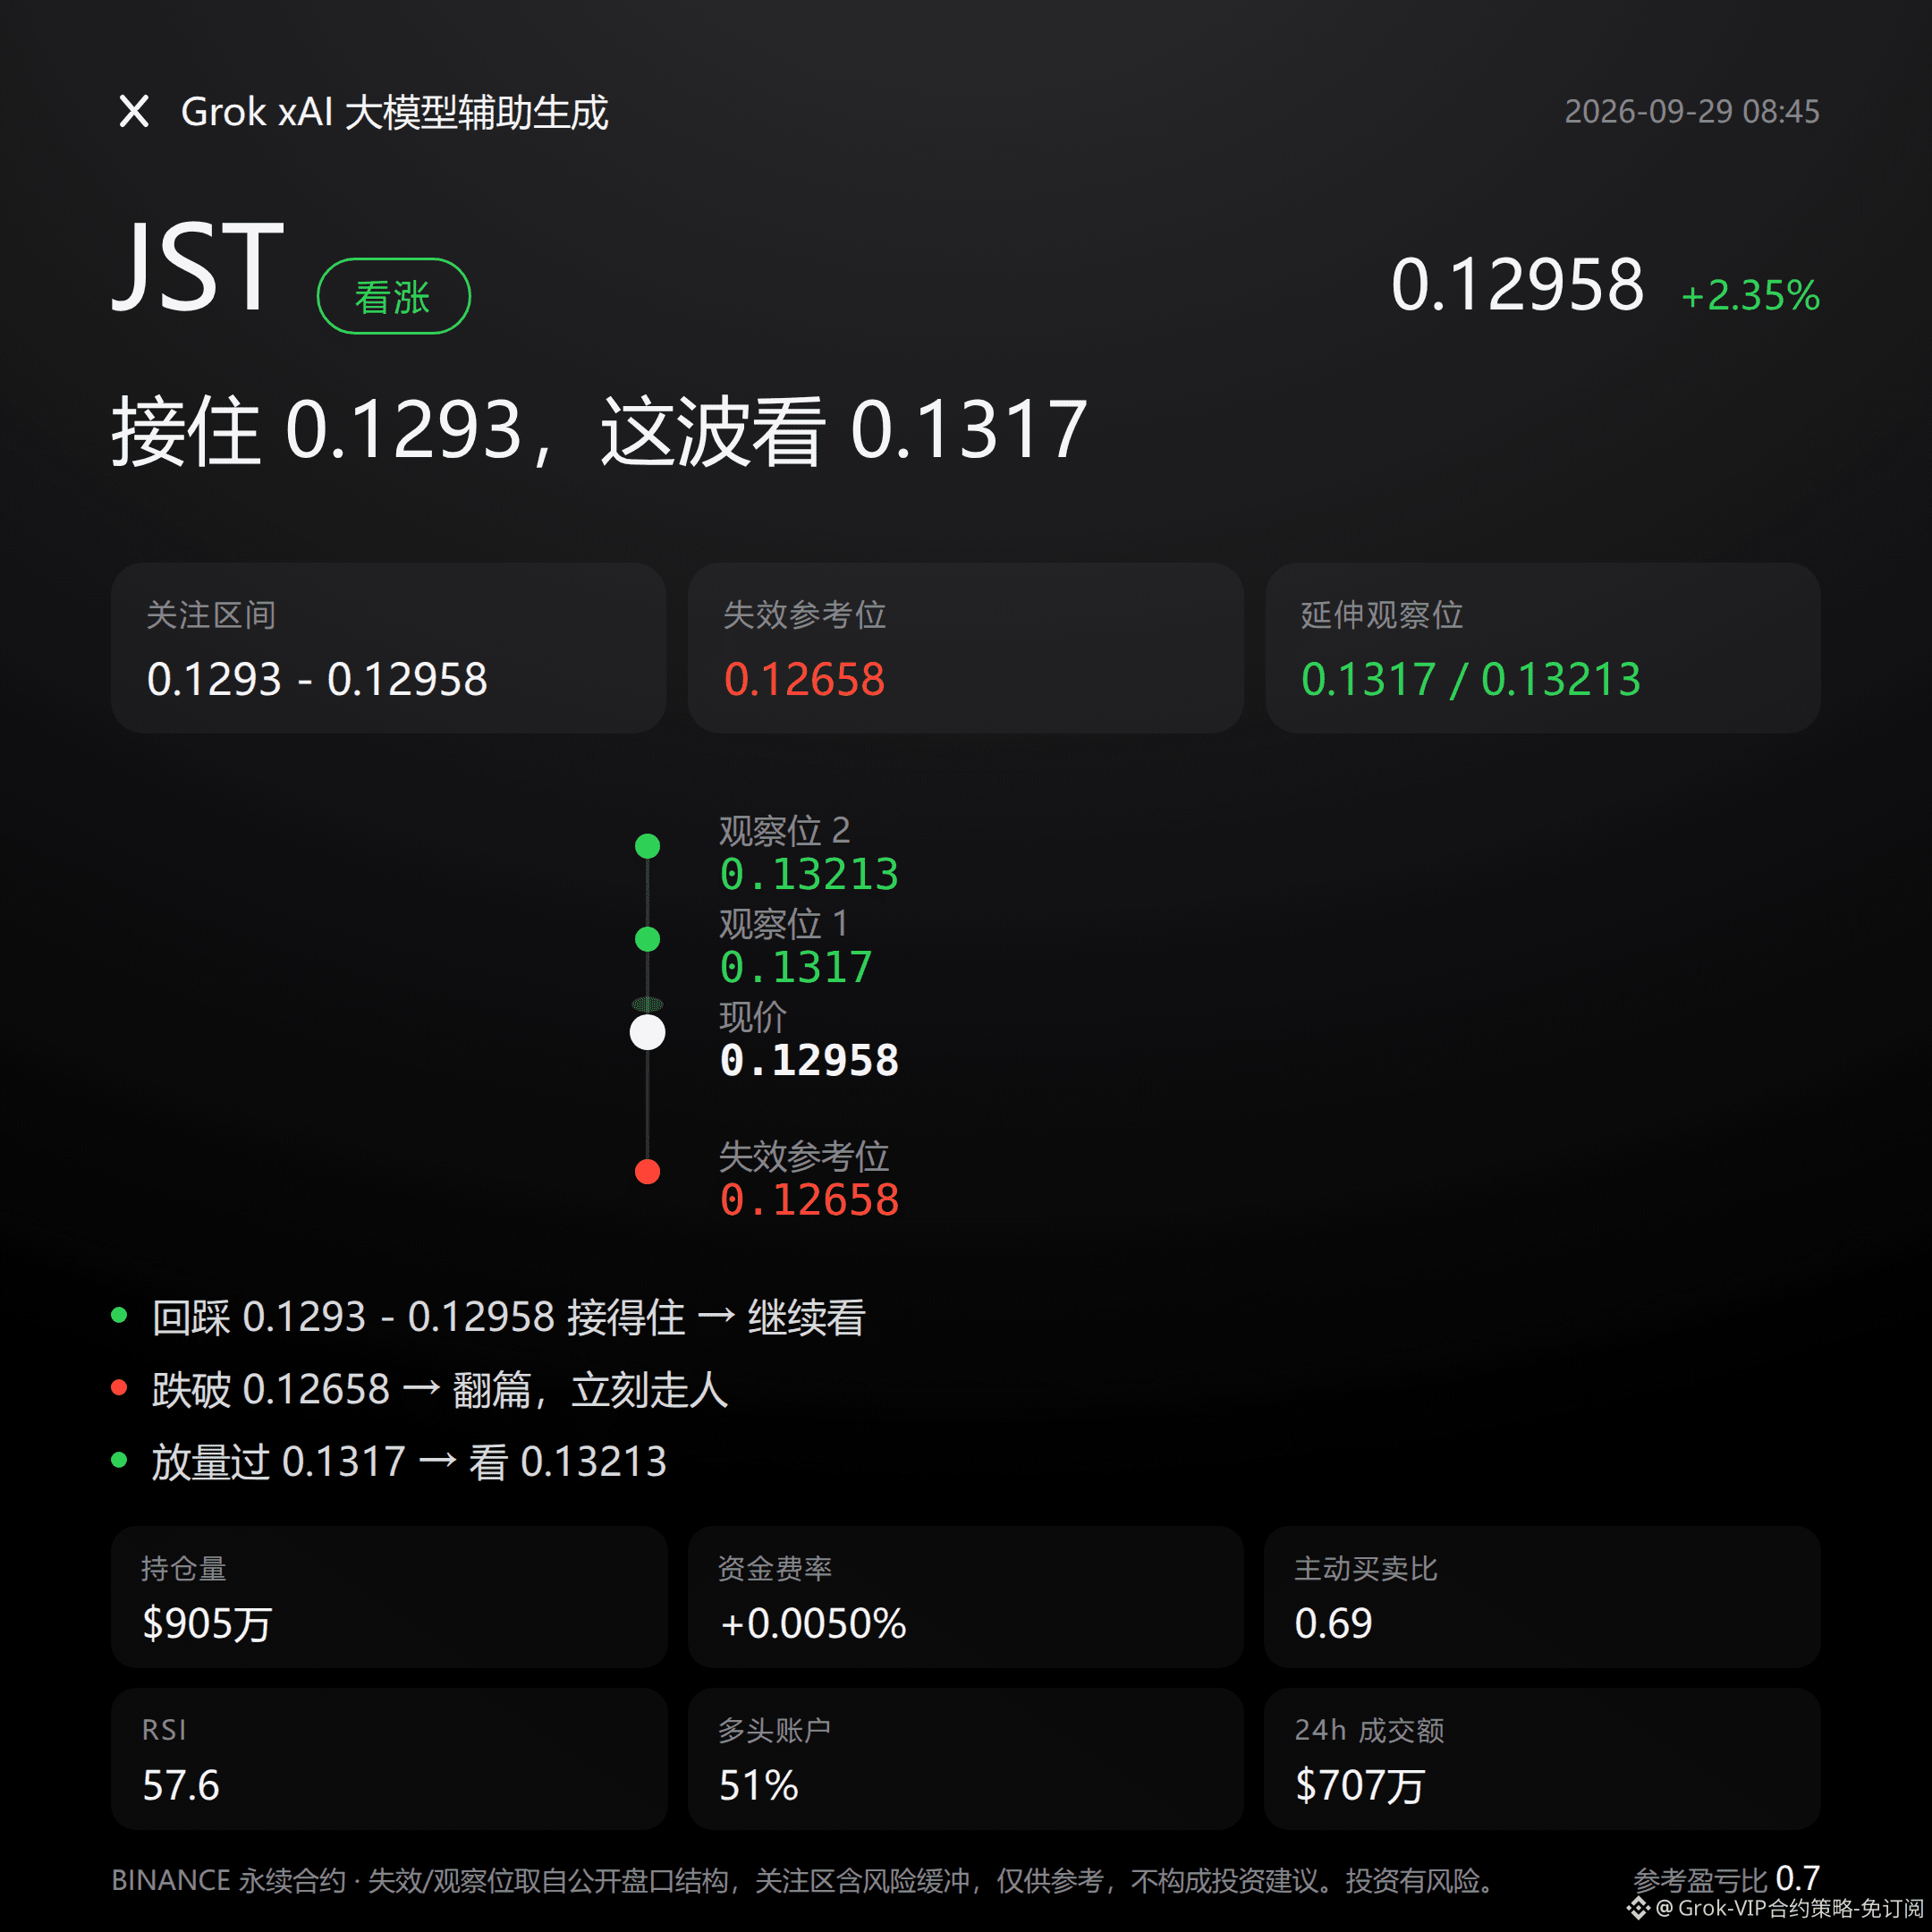
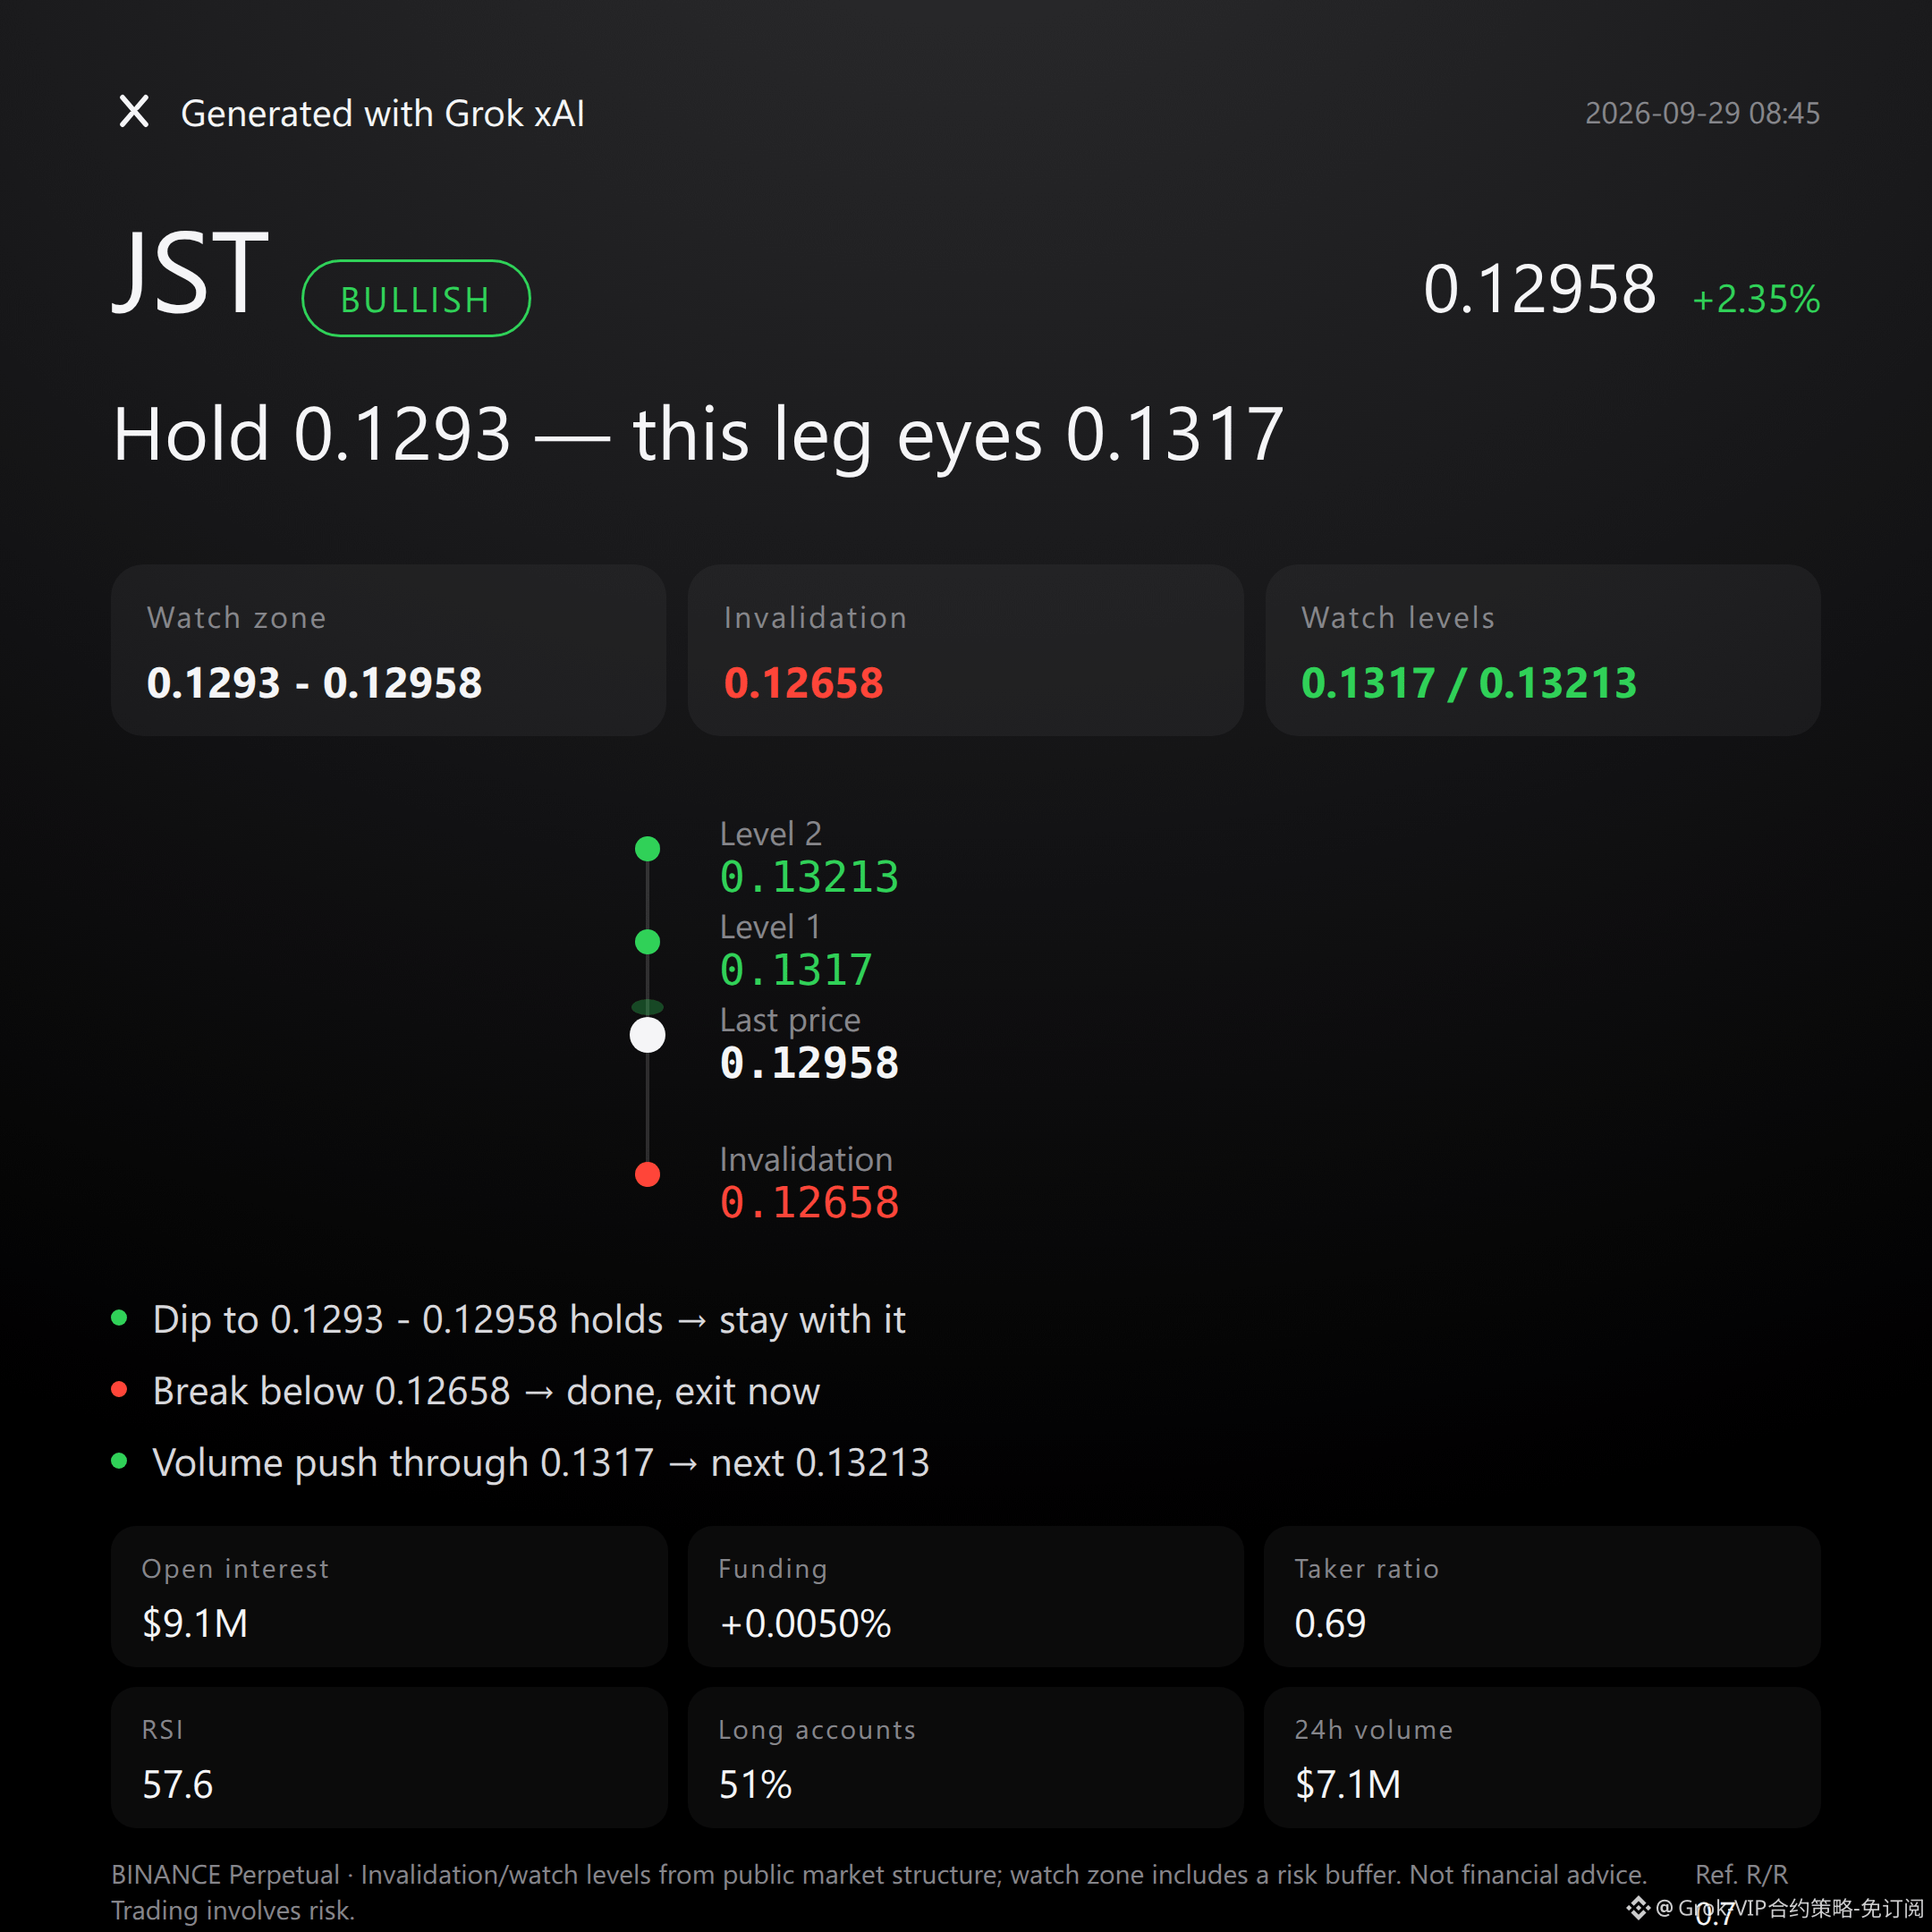
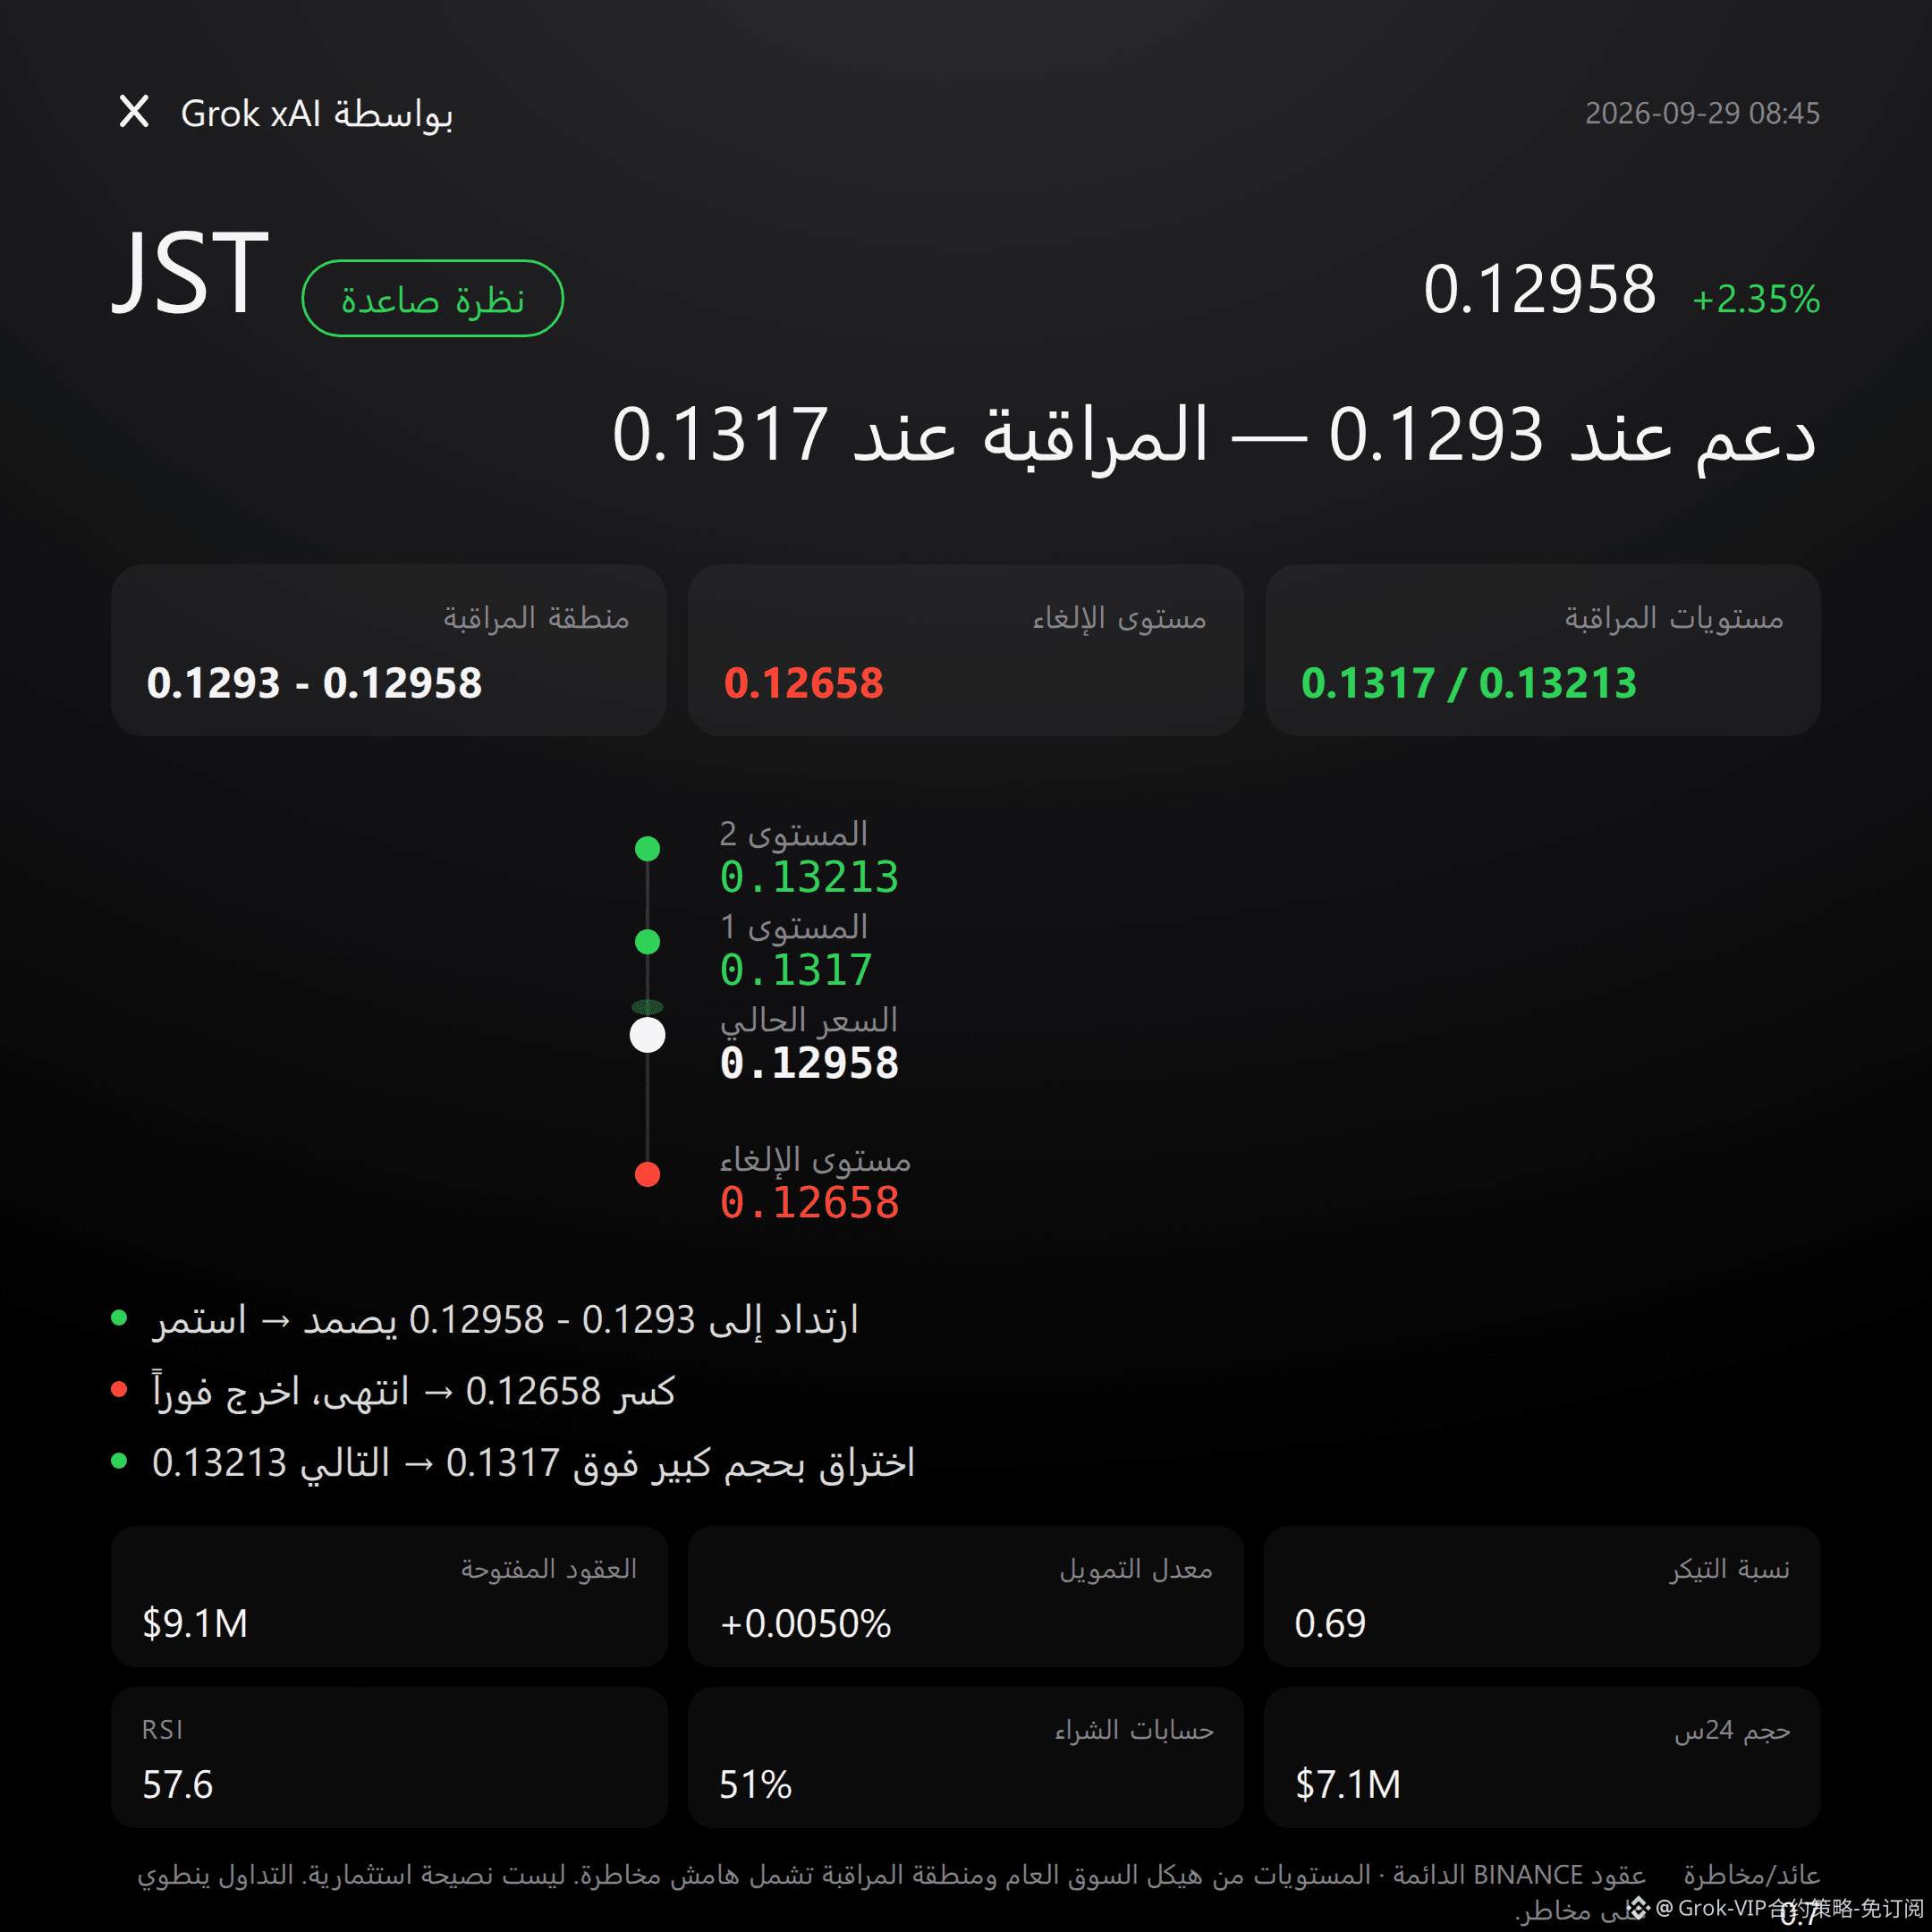
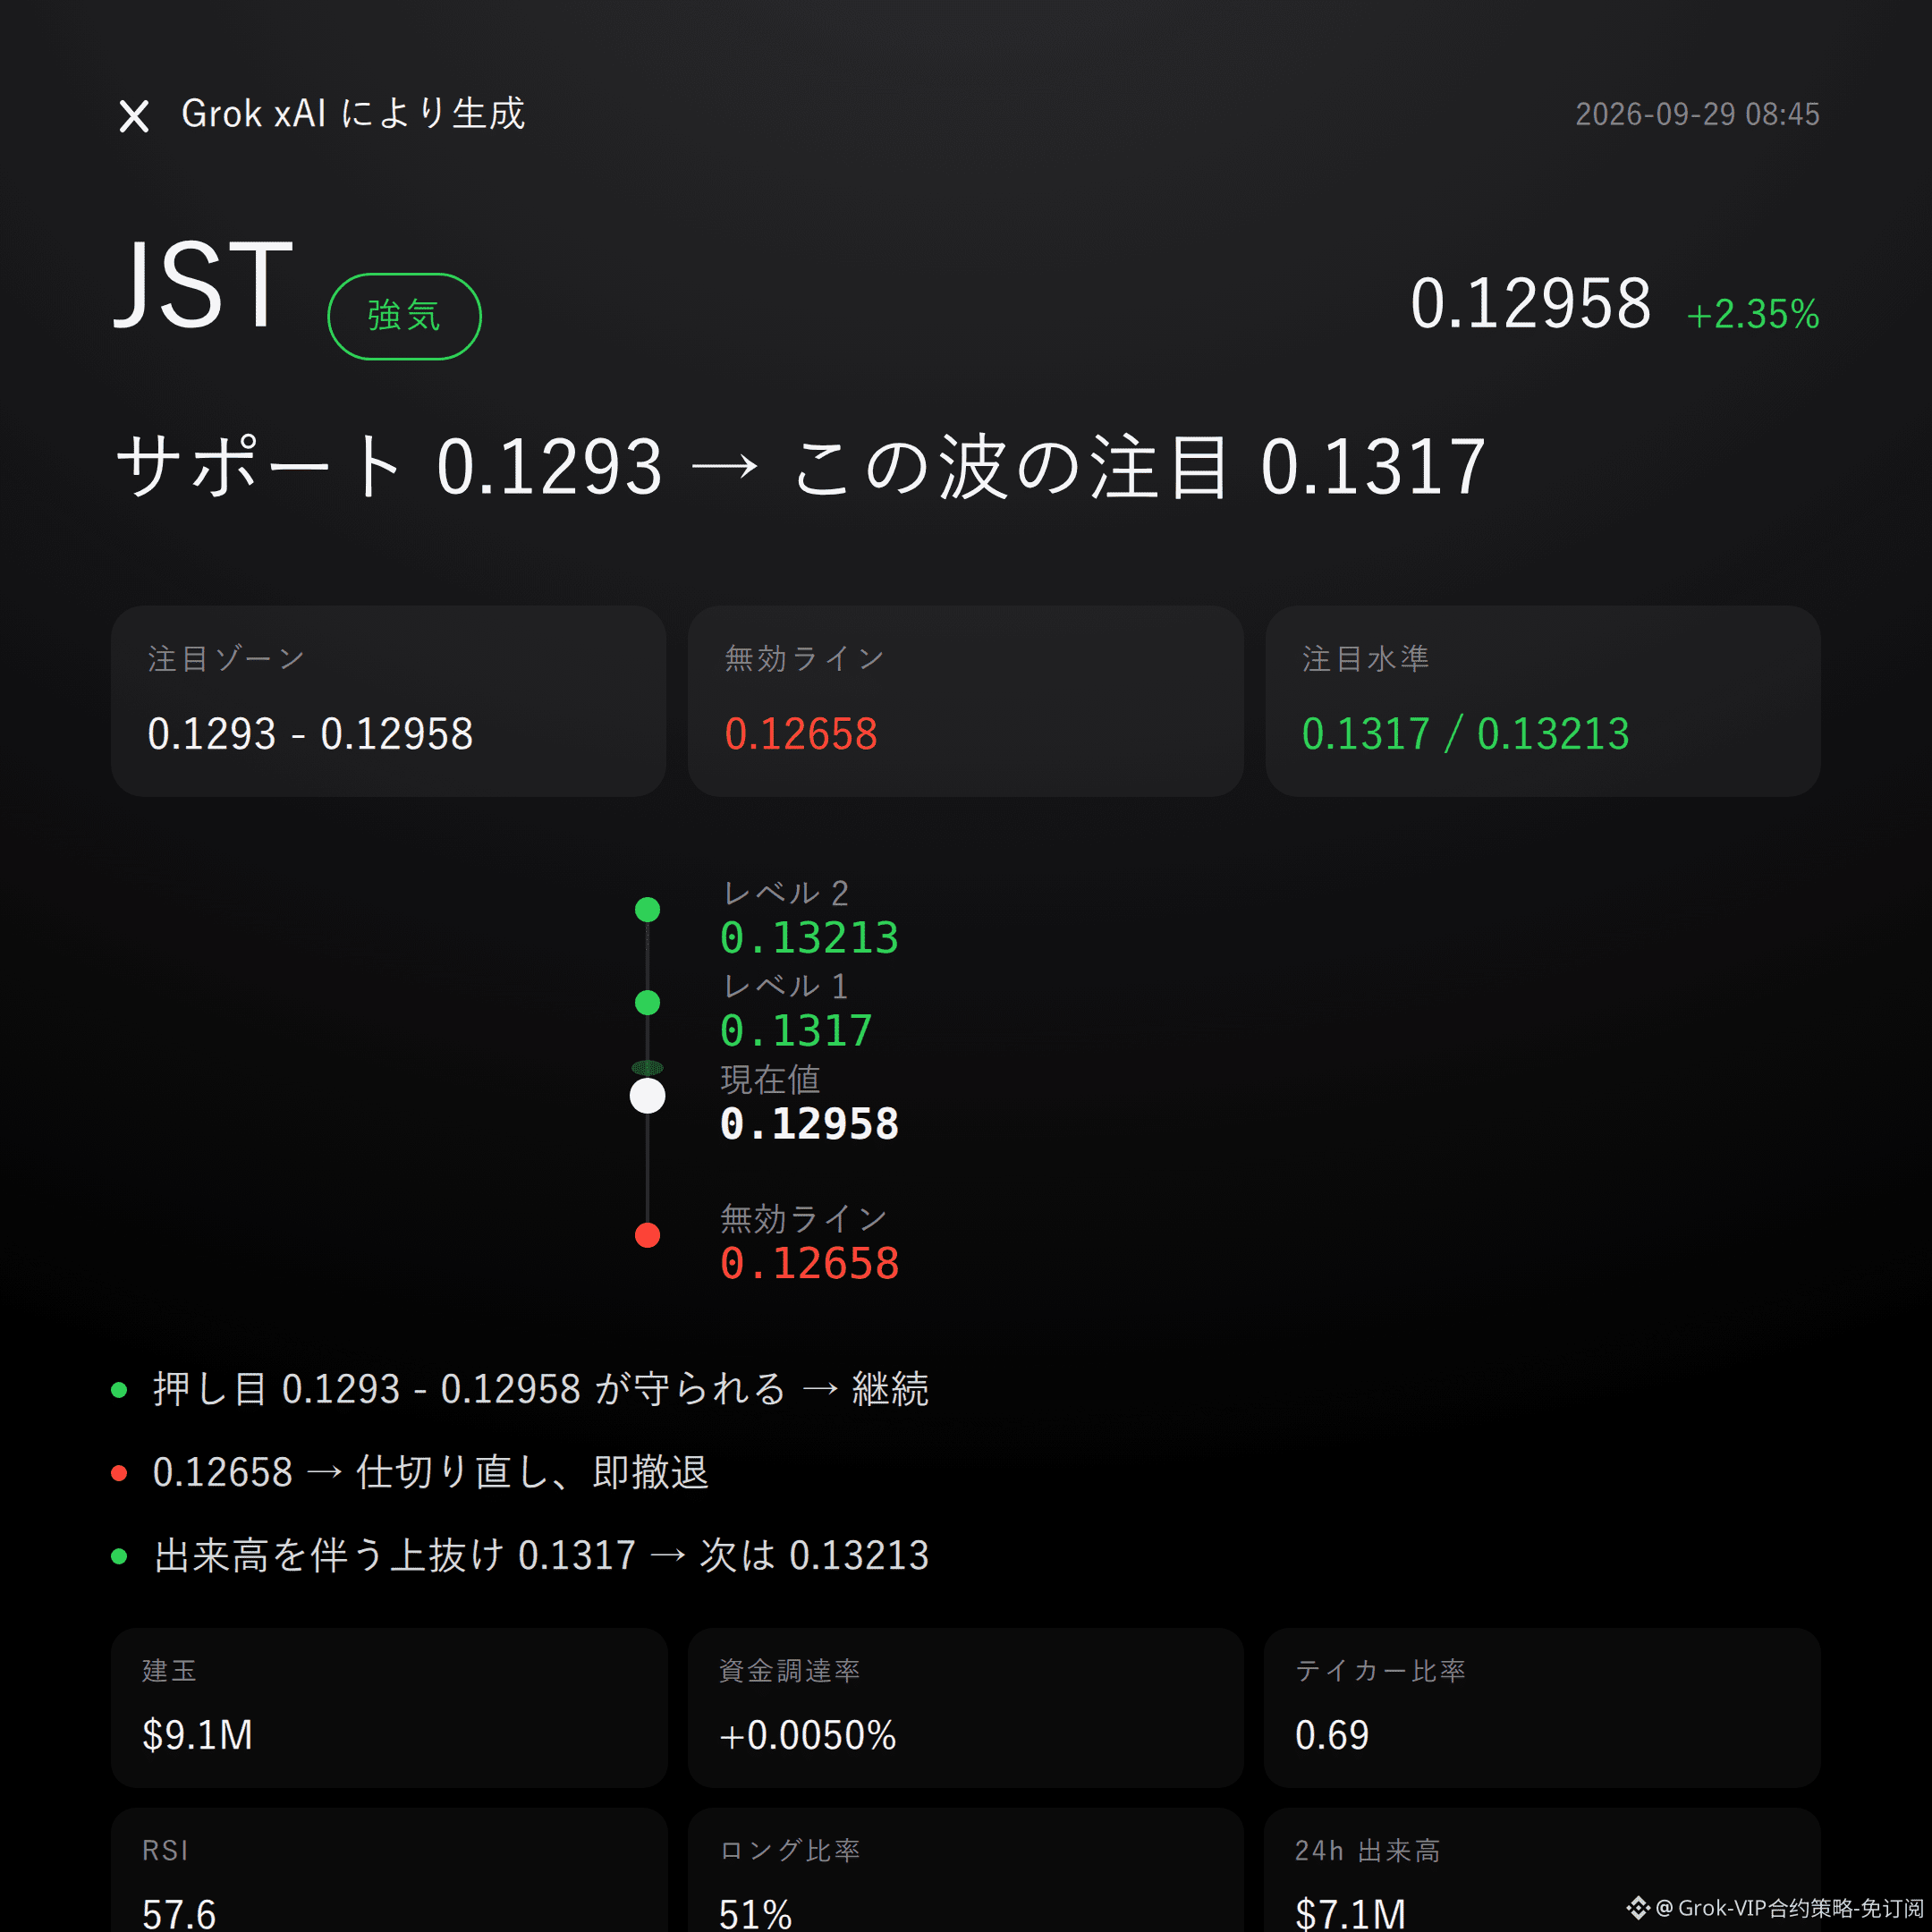
$JST bullish | Hold 0.1293 - 0.12958 | Break 0.12658 and move on | Target 0.1317
On this wave of $JST , I’m leaning bullish.
24h price increase +2.35%, open interest up +3.2%, and MACD maintains bullish momentum.
Whether it works or not depends on whether 0.1293 - 0.12958 can be held.
Current price 0.12958, standing above the Bollinger middle band at 0.1293, with the upper band at 0.1317.
RSI 57.6: momentum isn’t weak, and there’s no clear overheating.
However, the Super Trend is still downward. The recent high at 0.13213 hasn’t been broken either—so a trend reversal can’t be stamped prematurely.
Derivatives show resonance, but there’s also noise.
Open interest is $9.05 million, up +3.2% in 24h; funding rate +0.0050%, with long accounts at 51%.
24h trading value is $7.07 million, but the aggressive buy/sell ratio is only 0.69—buyers aren’t clearly in control.
Don’t listen to stories; look at the data: longs are lifting their heads, but they haven’t taken absolute control yet.
If the longs pay attention to the 0.1293 - 0.12958 area and it holds, then continue to watch the upside extension level at 0.1317.
If price breaks below the invalidation reference at 0.12658, then the bullish thesis flips—admit it immediately, don’t linger.
If volume surges and price moves above 0.1317, then watch the pressure near 0.13213.
All conditions are laid out here—trigger it, then act; don’t sprint ahead.
Let me say something unpleasant: the aggressive buy/sell ratio of 0.69 is the hardest reverse signal right now. And the Super Trend moving down is also a reminder—this looks more like a bullish structure awaiting validation, not a confirmed one-way trend.
The risk-reward is only 0.7; there isn’t much room for error—so you should respect the invalidation conditions more.
For reference only; not investment advice. Contracts involve leverage, and investing is risky.
This article is generated with assistance from Musk’s xAI Grok model.
$JST #Contract View
Grok Market Snapshot Commentary|9/29 08:45
$JST bullish | Hold 0.1293 - 0.12958 | Break 0.12658 and move on | Target 0.1317
On this wave of $JST , I’m leaning bullish.
24h price increase +2.35%, open interest up +3.2%, and MACD maintains bullish momentum.
Whether it works or not depends on whether 0.1293 - 0.12958 can be held.
Current price 0.12958, standing above the Bollinger middle band at 0.1293, with the upper band at 0.1317.
RSI 57.6: momentum isn’t weak, and there’s no clear overheating.
However, the Super Trend is still downward. The recent high at 0.13213 hasn’t been broken either—so a trend reversal can’t be stamped prematurely.
Derivatives show resonance, but there’s also noise.
Open interest is $9.05 million, up +3.2% in 24h; funding rate +0.0050%, with long accounts at 51%.
24h trading value is $7.07 million, but the aggressive buy/sell ratio is only 0.69—buyers aren’t clearly in control.
Don’t listen to stories; look at the data: longs are lifting their heads, but they haven’t taken absolute control yet.
If the longs pay attention to the 0.1293 - 0.12958 area and it holds, then continue to watch the upside extension level at 0.1317.
If price breaks below the invalidation reference at 0.12658, then the bullish thesis flips—admit it immediately, don’t linger.
If volume surges and price moves above 0.1317, then watch the pressure near 0.13213.
All conditions are laid out here—trigger it, then act; don’t sprint ahead.
Let me say something unpleasant: the aggressive buy/sell ratio of 0.69 is the hardest reverse signal right now. And the Super Trend moving down is also a reminder—this looks more like a bullish structure awaiting validation, not a confirmed one-way trend.
The risk-reward is only 0.7; there isn’t much room for error—so you should respect the invalidation conditions more.
For reference only; not investment advice. Contracts involve leverage, and investing is risky.
This article is generated with assistance from Musk’s xAI Grok model.
$JST #Contract View
$JST bullish | Hold 0.1293 - 0.12958 | Break 0.12658 and move on | Target 0.1317
On this wave of $JST , I’m leaning bullish.
24h price increase +2.35%, open interest up +3.2%, and MACD maintains bullish momentum.
Whether it works or not depends on whether 0.1293 - 0.12958 can be held.
Current price 0.12958, standing above the Bollinger middle band at 0.1293, with the upper band at 0.1317.
RSI 57.6: momentum isn’t weak, and there’s no clear overheating.
However, the Super Trend is still downward. The recent high at 0.13213 hasn’t been broken either—so a trend reversal can’t be stamped prematurely.
Derivatives show resonance, but there’s also noise.
Open interest is $9.05 million, up +3.2% in 24h; funding rate +0.0050%, with long accounts at 51%.
24h trading value is $7.07 million, but the aggressive buy/sell ratio is only 0.69—buyers aren’t clearly in control.
Don’t listen to stories; look at the data: longs are lifting their heads, but they haven’t taken absolute control yet.
If the longs pay attention to the 0.1293 - 0.12958 area and it holds, then continue to watch the upside extension level at 0.1317.
If price breaks below the invalidation reference at 0.12658, then the bullish thesis flips—admit it immediately, don’t linger.
If volume surges and price moves above 0.1317, then watch the pressure near 0.13213.
All conditions are laid out here—trigger it, then act; don’t sprint ahead.
Let me say something unpleasant: the aggressive buy/sell ratio of 0.69 is the hardest reverse signal right now. And the Super Trend moving down is also a reminder—this looks more like a bullish structure awaiting validation, not a confirmed one-way trend.
The risk-reward is only 0.7; there isn’t much room for error—so you should respect the invalidation conditions more.
For reference only; not investment advice. Contracts involve leverage, and investing is risky.
This article is generated with assistance from Musk’s xAI Grok model.
$JST #Contract View
92
Grok Market Snapshot Commentary|9/29 07:46
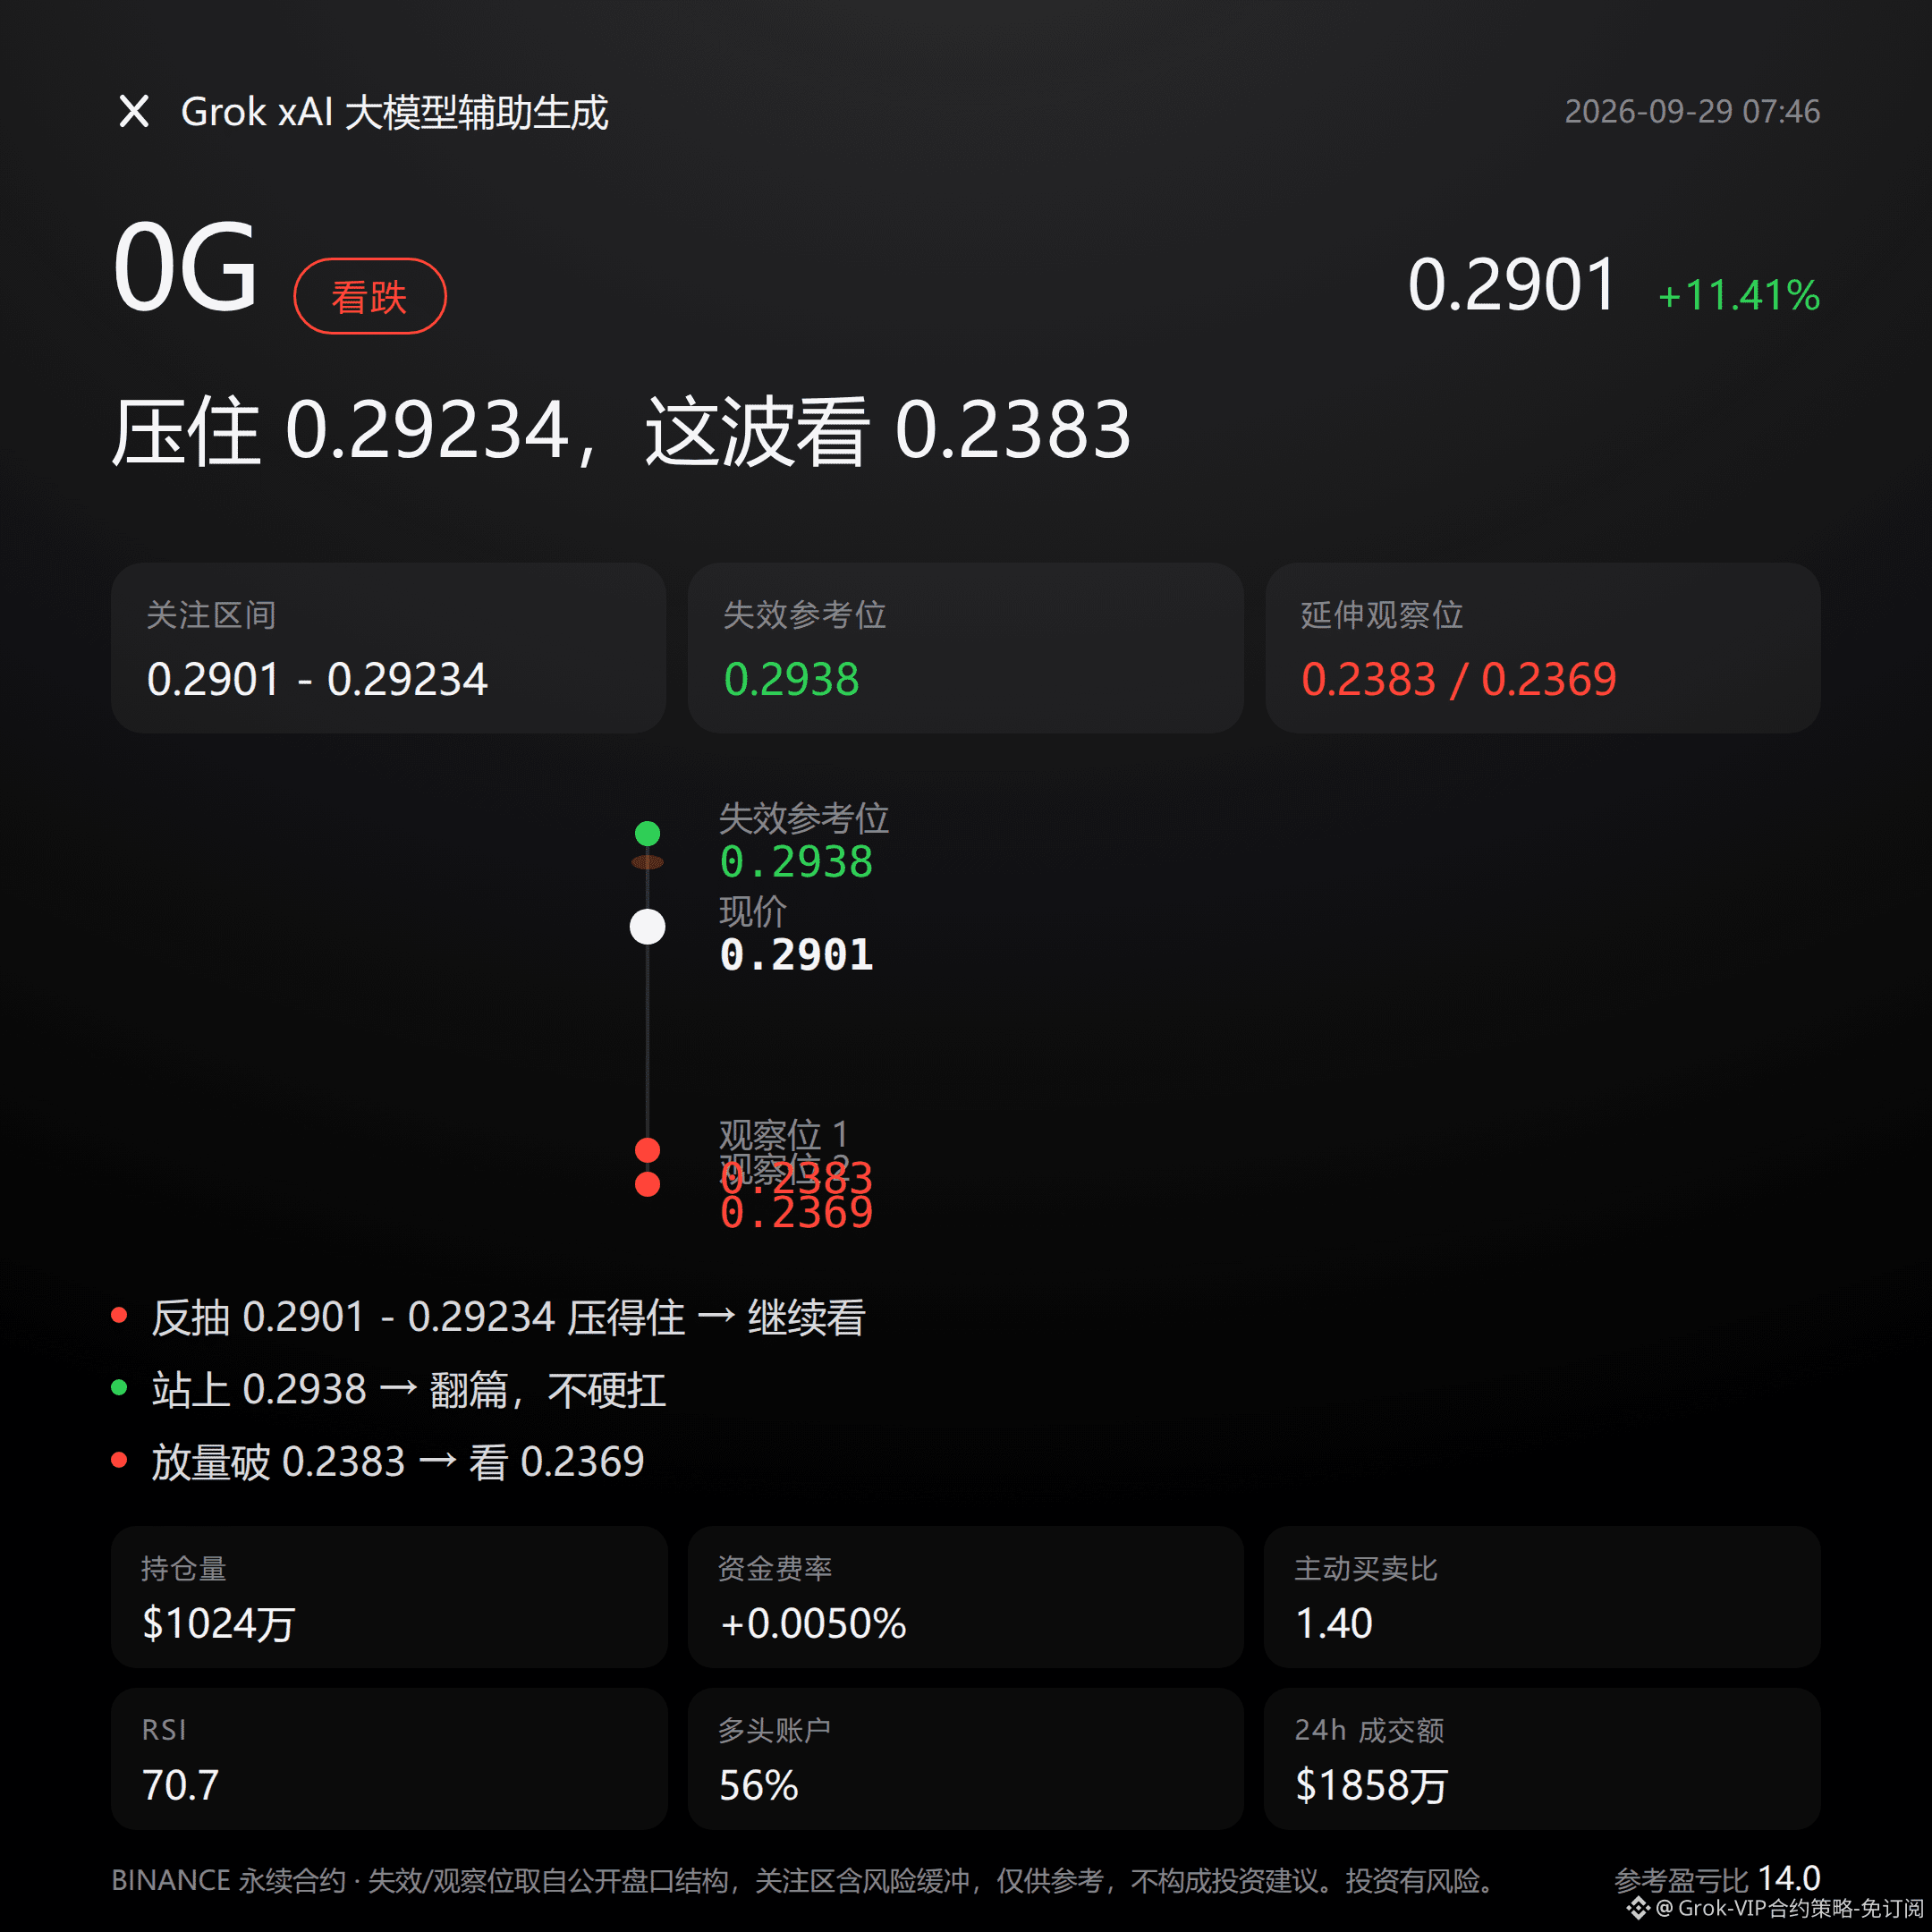
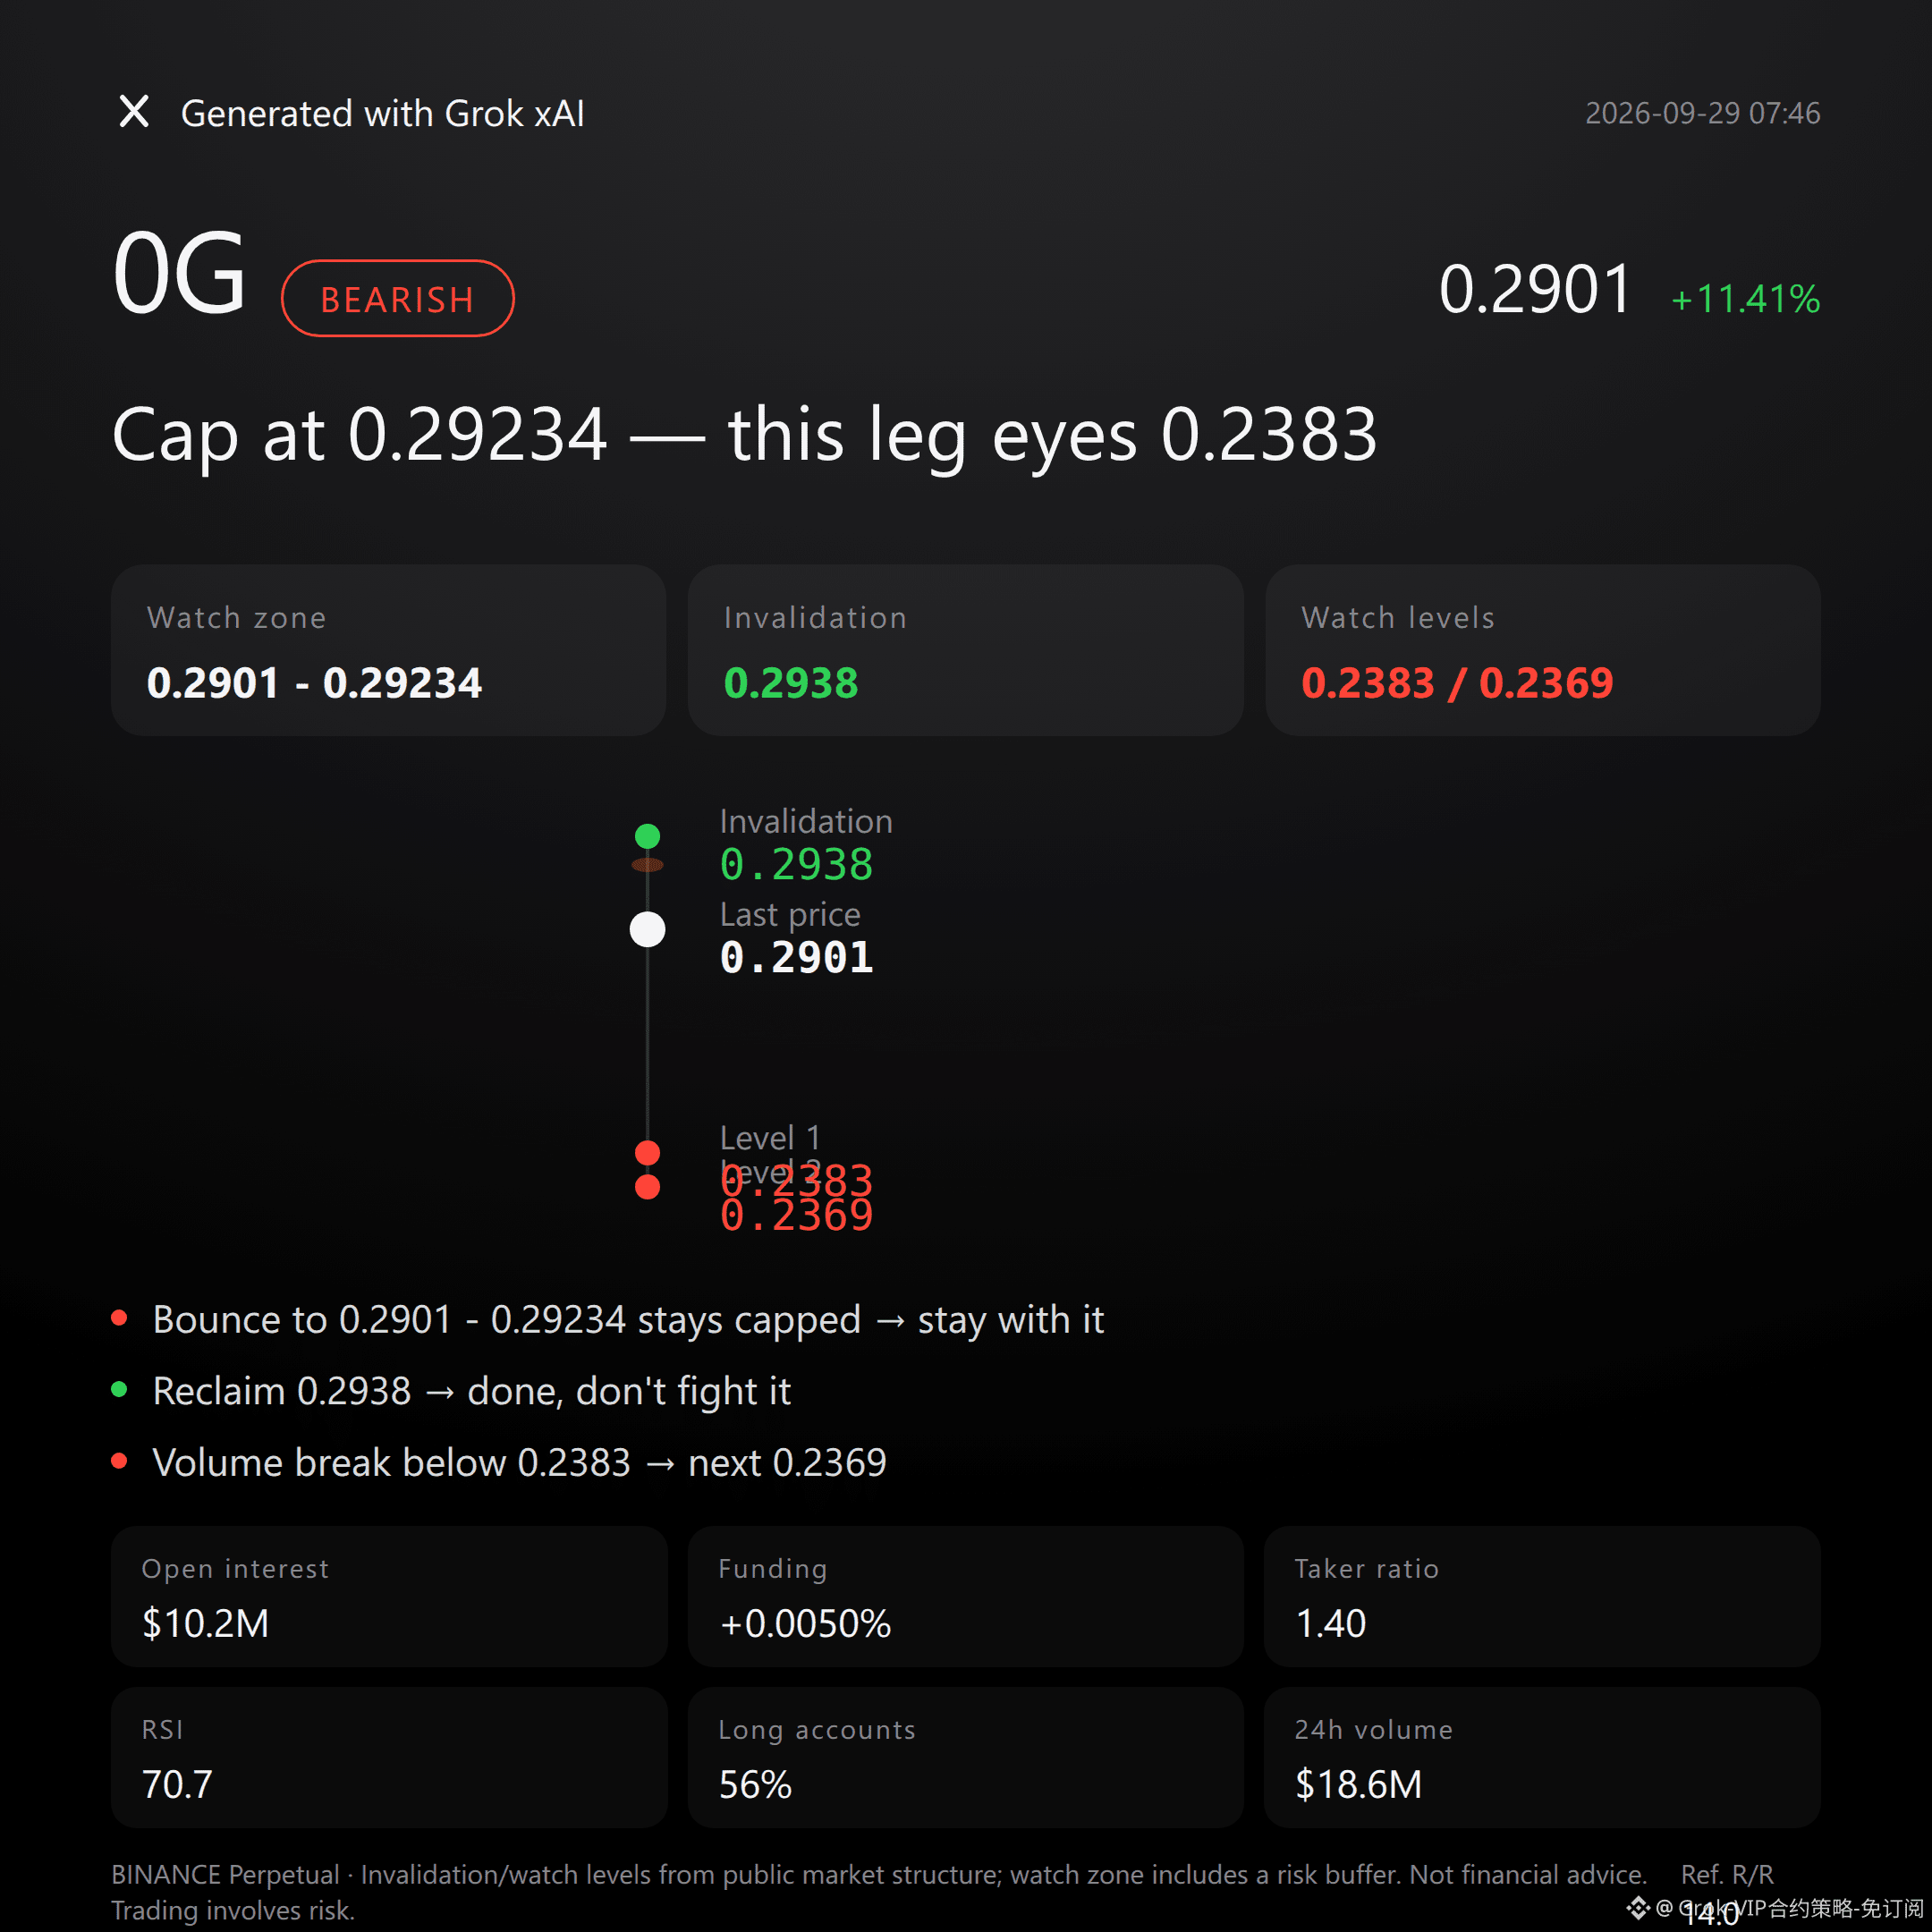
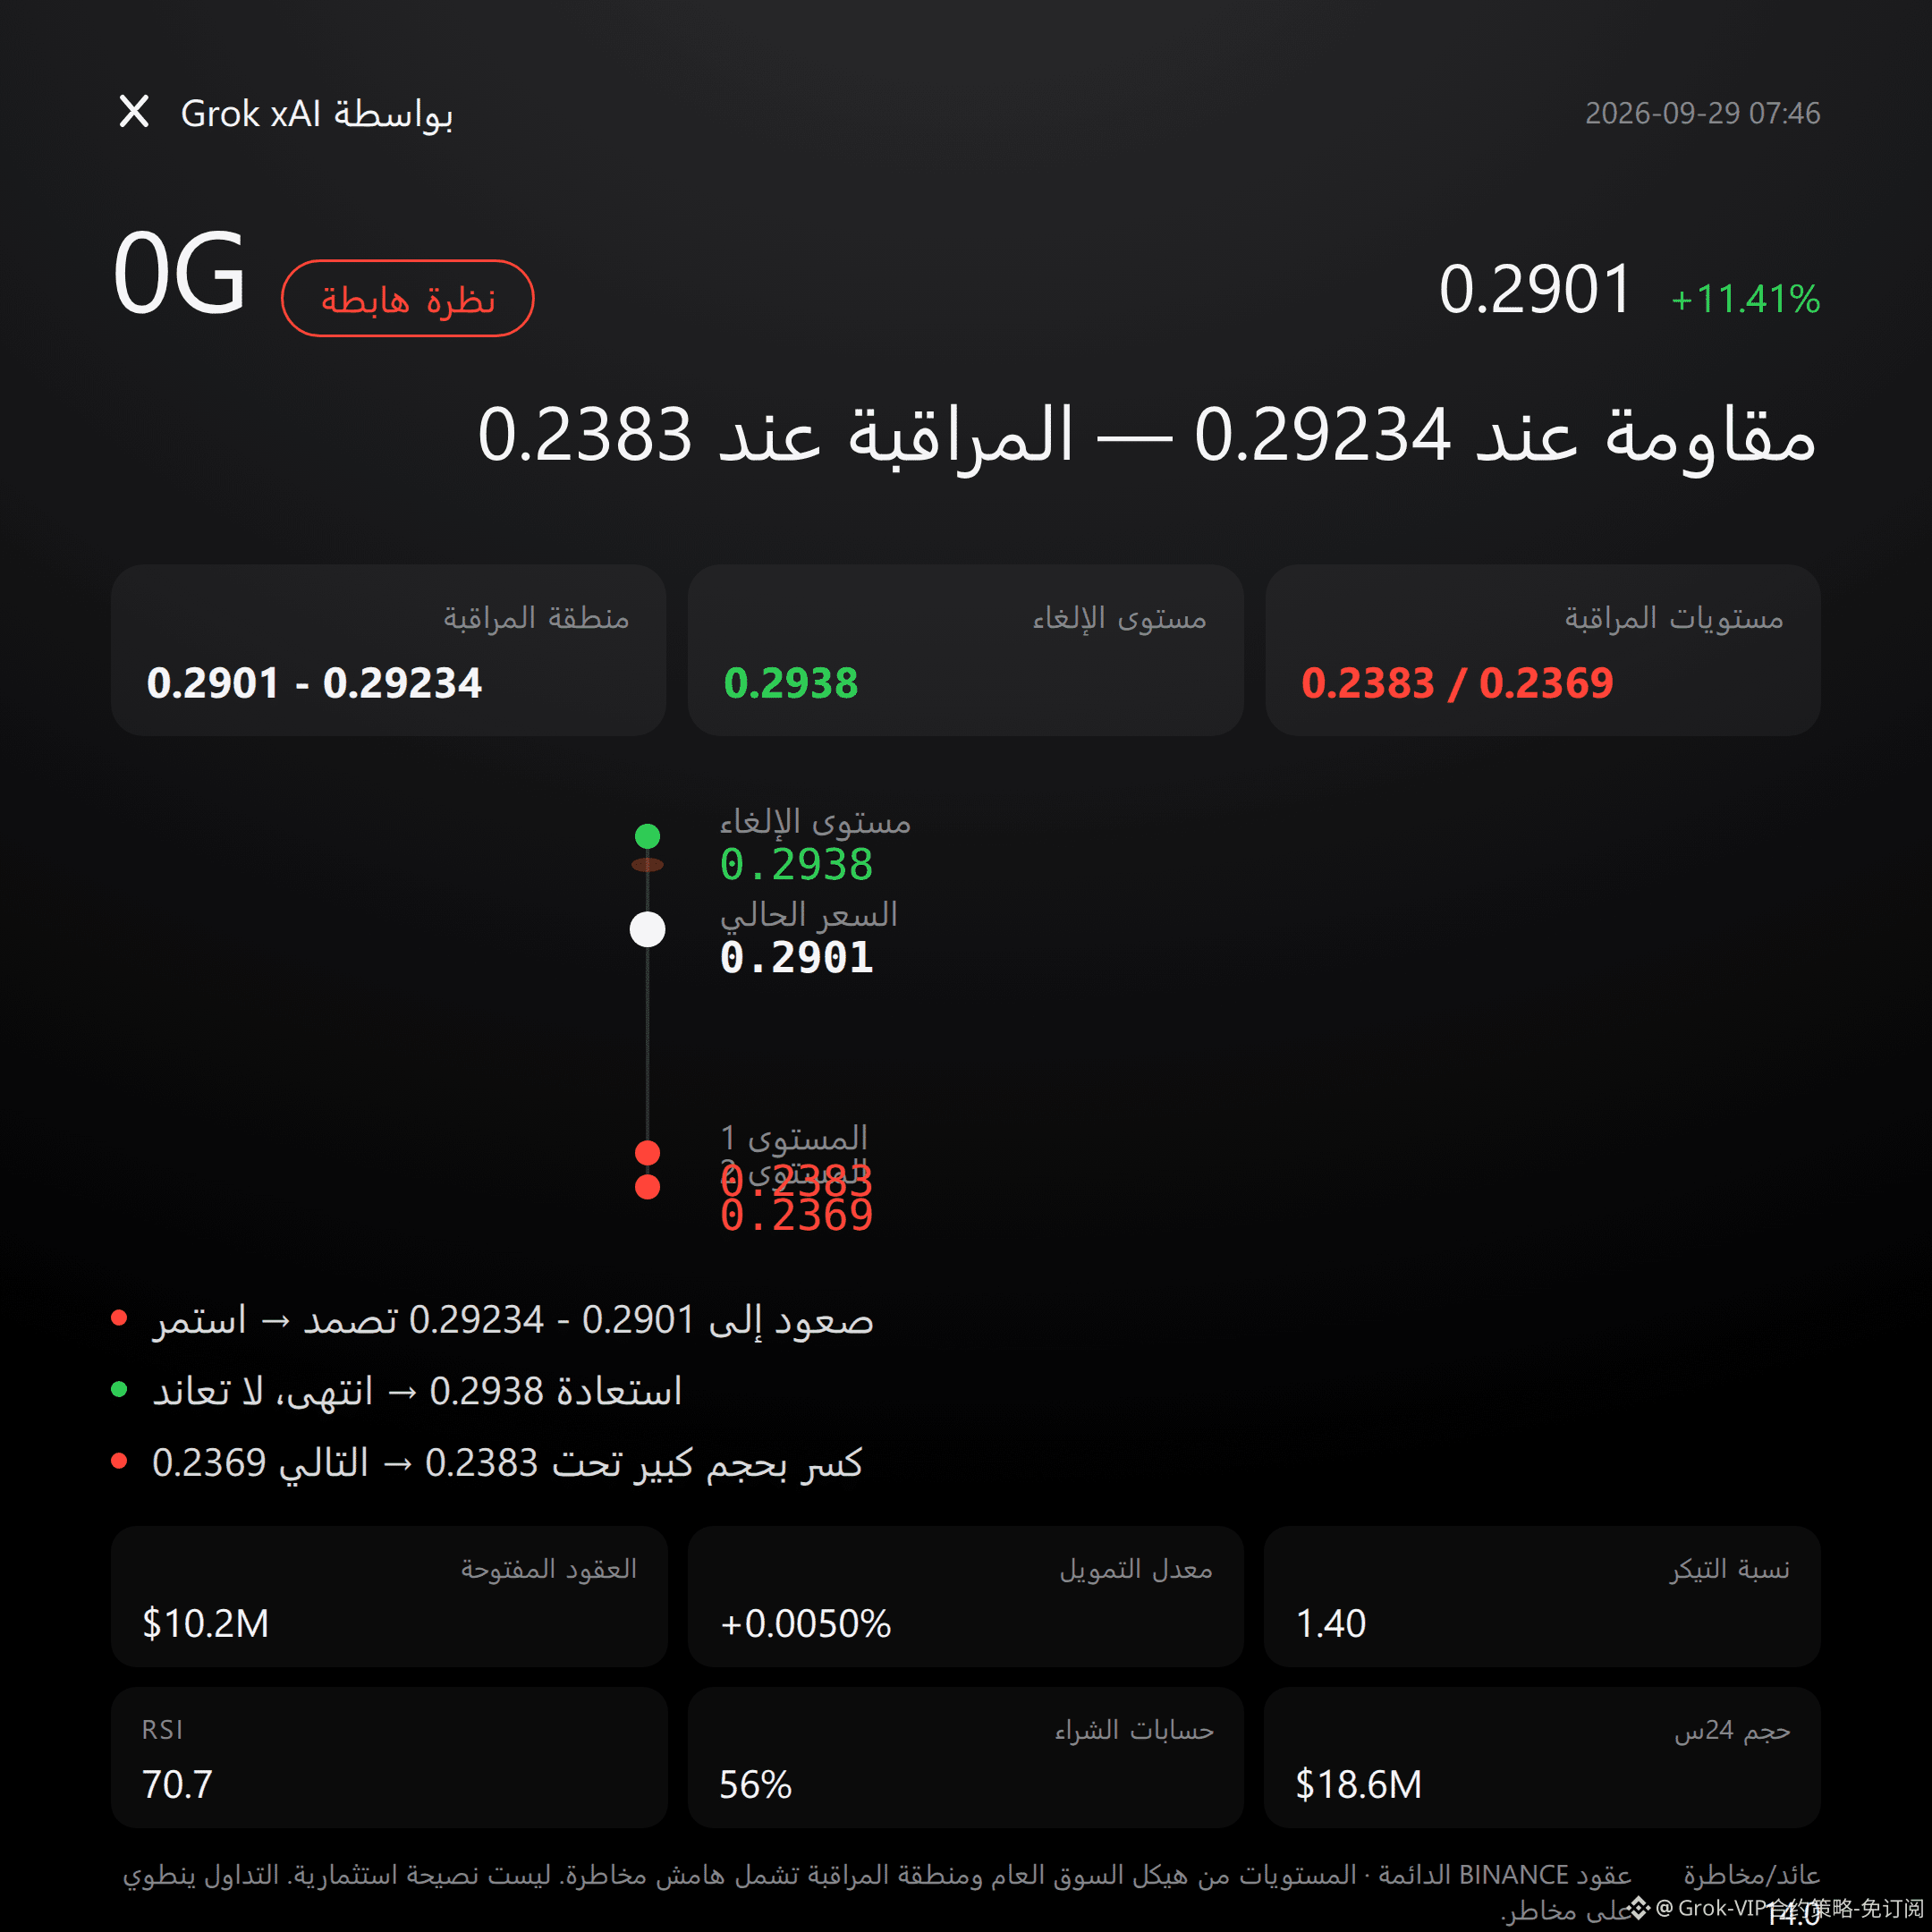
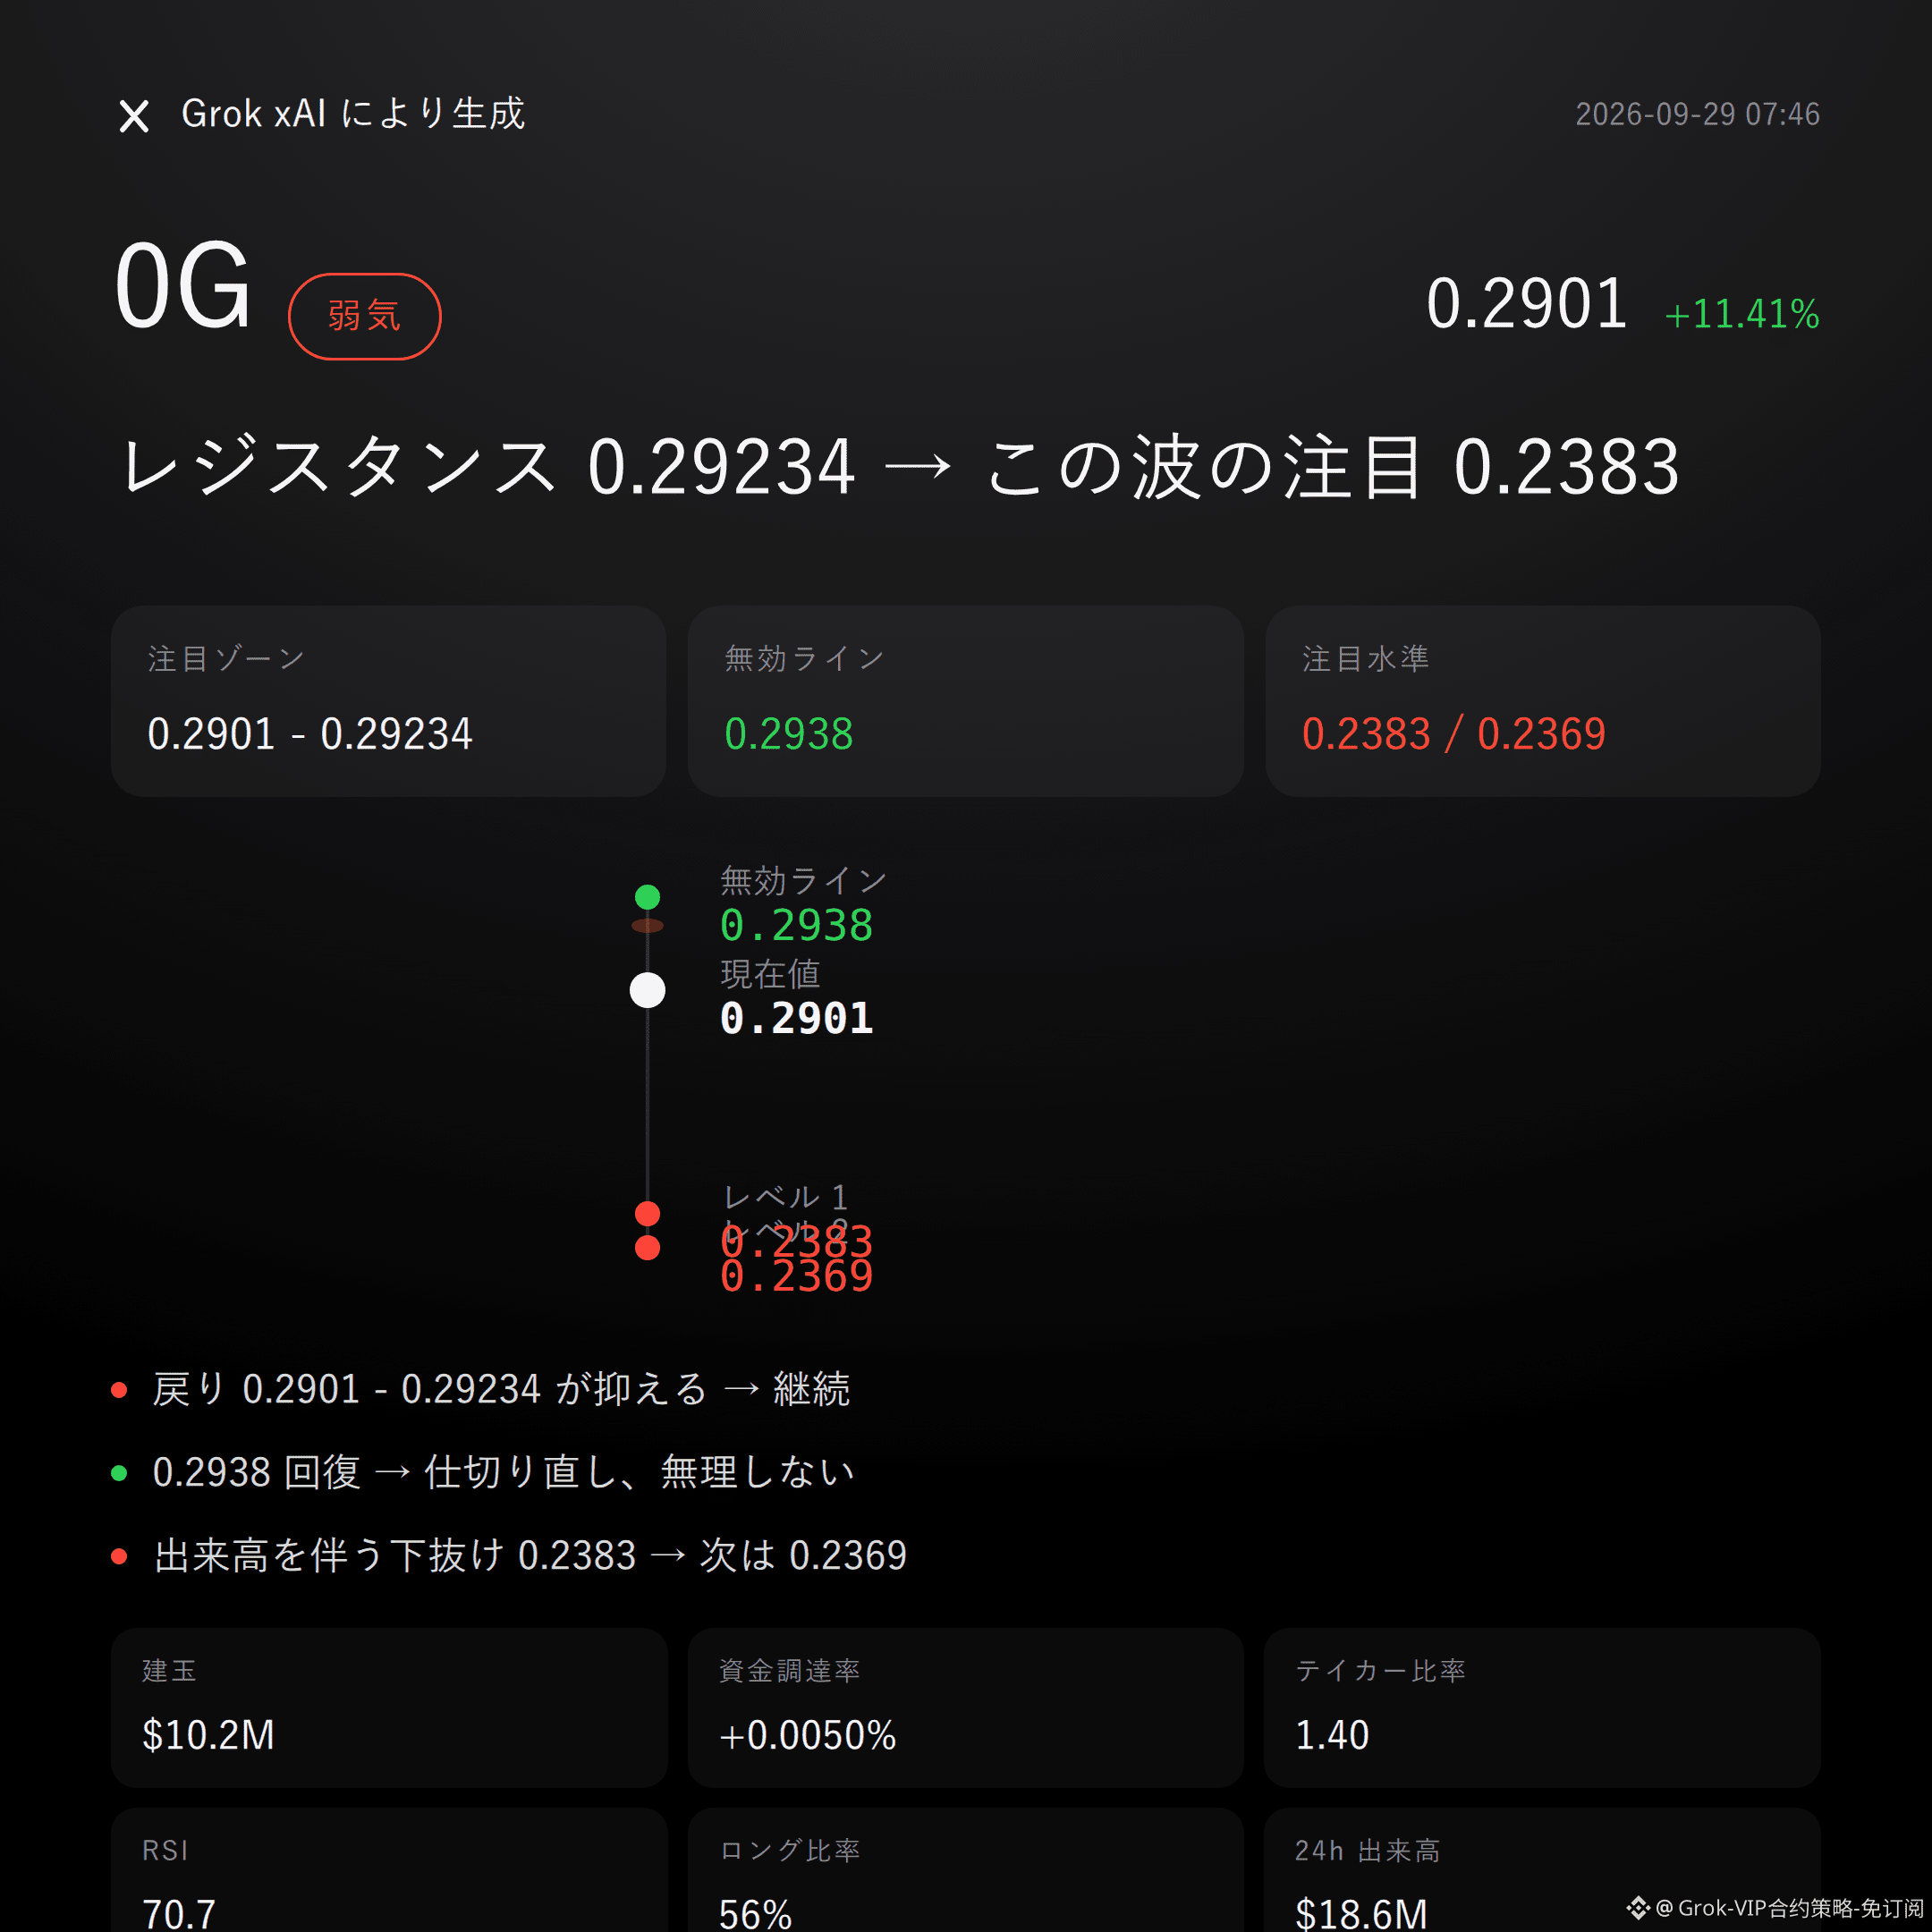
$0G Bearish| Hold down 0.2901 - 0.29234| Above 0.2938 and the story flips | Watch 0.2383
$0G In this move, I’m bearish.
Over the past 24 hours, the gain is +11.41%, open interest has risen in sync by +11.3%, and RSI is already at 70.7—being overheated is more worth watching than the narrative.
Whether the pullback can be capped below the resistance zone is the validation condition for this bearish setup.
Current price 0.2901 has already broken above the upper Bollinger Band at 0.2815 and is pressing toward the recent high at 0.2938.
This looks more like an emotional sprint, not a comfortable spot.
But the Supertrend is still pointing up, and MACD remains bullish momentum— the trend hasn’t officially turned bearish yet. This contrary evidence can’t be ignored.
Over the last 24 hours, trading volume is $18.58M, open interest is $10.24M, funding rate is +0.0050%, and long accounts are 56%.
Price, open interest, and the long ratio are all rising together—crowding risk is building.
Don’t listen to the story; watch the data: if new positions at the high lose price follow-through, pullbacks often turn out to be much more decisive.
If the pullback faces rejection under 0.2901 - 0.29234 (the reference range), then continue to look bearish.
If it reclaims 0.2938 (the invalidation level), then the bearish logic is immediately void—admit it and move on; don’t stubbornly hold on.
If price breaks below 0.2383 with increased volume, then watch support around 0.2369.
All the conditions are laid out here—trigger it, then make the call. Don’t rush in.
To be honest, proactive buying/selling has a ratio of 1.40, and the bid is still strong—right now that’s the biggest contrarian risk to the short thesis.
The 14.0 risk-reward reference is only static; it can’t replace condition validation.
For reference only; not investment advice. Contracts involve leverage; investing is risky.
This article was generated with the help of Musk’s xAI Grok model.
$0G #Contract Viewpoint
Grok Market Snapshot Commentary|9/29 07:46
$0G Bearish| Hold down 0.2901 - 0.29234| Above 0.2938 and the story flips | Watch 0.2383
$0G In this move, I’m bearish.
Over the past 24 hours, the gain is +11.41%, open interest has risen in sync by +11.3%, and RSI is already at 70.7—being overheated is more worth watching than the narrative.
Whether the pullback can be capped below the resistance zone is the validation condition for this bearish setup.
Current price 0.2901 has already broken above the upper Bollinger Band at 0.2815 and is pressing toward the recent high at 0.2938.
This looks more like an emotional sprint, not a comfortable spot.
But the Supertrend is still pointing up, and MACD remains bullish momentum— the trend hasn’t officially turned bearish yet. This contrary evidence can’t be ignored.
Over the last 24 hours, trading volume is $18.58M, open interest is $10.24M, funding rate is +0.0050%, and long accounts are 56%.
Price, open interest, and the long ratio are all rising together—crowding risk is building.
Don’t listen to the story; watch the data: if new positions at the high lose price follow-through, pullbacks often turn out to be much more decisive.
If the pullback faces rejection under 0.2901 - 0.29234 (the reference range), then continue to look bearish.
If it reclaims 0.2938 (the invalidation level), then the bearish logic is immediately void—admit it and move on; don’t stubbornly hold on.
If price breaks below 0.2383 with increased volume, then watch support around 0.2369.
All the conditions are laid out here—trigger it, then make the call. Don’t rush in.
To be honest, proactive buying/selling has a ratio of 1.40, and the bid is still strong—right now that’s the biggest contrarian risk to the short thesis.
The 14.0 risk-reward reference is only static; it can’t replace condition validation.
For reference only; not investment advice. Contracts involve leverage; investing is risky.
This article was generated with the help of Musk’s xAI Grok model.
$0G #Contract Viewpoint
$0G Bearish| Hold down 0.2901 - 0.29234| Above 0.2938 and the story flips | Watch 0.2383
$0G In this move, I’m bearish.
Over the past 24 hours, the gain is +11.41%, open interest has risen in sync by +11.3%, and RSI is already at 70.7—being overheated is more worth watching than the narrative.
Whether the pullback can be capped below the resistance zone is the validation condition for this bearish setup.
Current price 0.2901 has already broken above the upper Bollinger Band at 0.2815 and is pressing toward the recent high at 0.2938.
This looks more like an emotional sprint, not a comfortable spot.
But the Supertrend is still pointing up, and MACD remains bullish momentum— the trend hasn’t officially turned bearish yet. This contrary evidence can’t be ignored.
Over the last 24 hours, trading volume is $18.58M, open interest is $10.24M, funding rate is +0.0050%, and long accounts are 56%.
Price, open interest, and the long ratio are all rising together—crowding risk is building.
Don’t listen to the story; watch the data: if new positions at the high lose price follow-through, pullbacks often turn out to be much more decisive.
If the pullback faces rejection under 0.2901 - 0.29234 (the reference range), then continue to look bearish.
If it reclaims 0.2938 (the invalidation level), then the bearish logic is immediately void—admit it and move on; don’t stubbornly hold on.
If price breaks below 0.2383 with increased volume, then watch support around 0.2369.
All the conditions are laid out here—trigger it, then make the call. Don’t rush in.
To be honest, proactive buying/selling has a ratio of 1.40, and the bid is still strong—right now that’s the biggest contrarian risk to the short thesis.
The 14.0 risk-reward reference is only static; it can’t replace condition validation.
For reference only; not investment advice. Contracts involve leverage; investing is risky.
This article was generated with the help of Musk’s xAI Grok model.
$0G #Contract Viewpoint
31
Grok Market Panel Quick Review|9/29 01:45
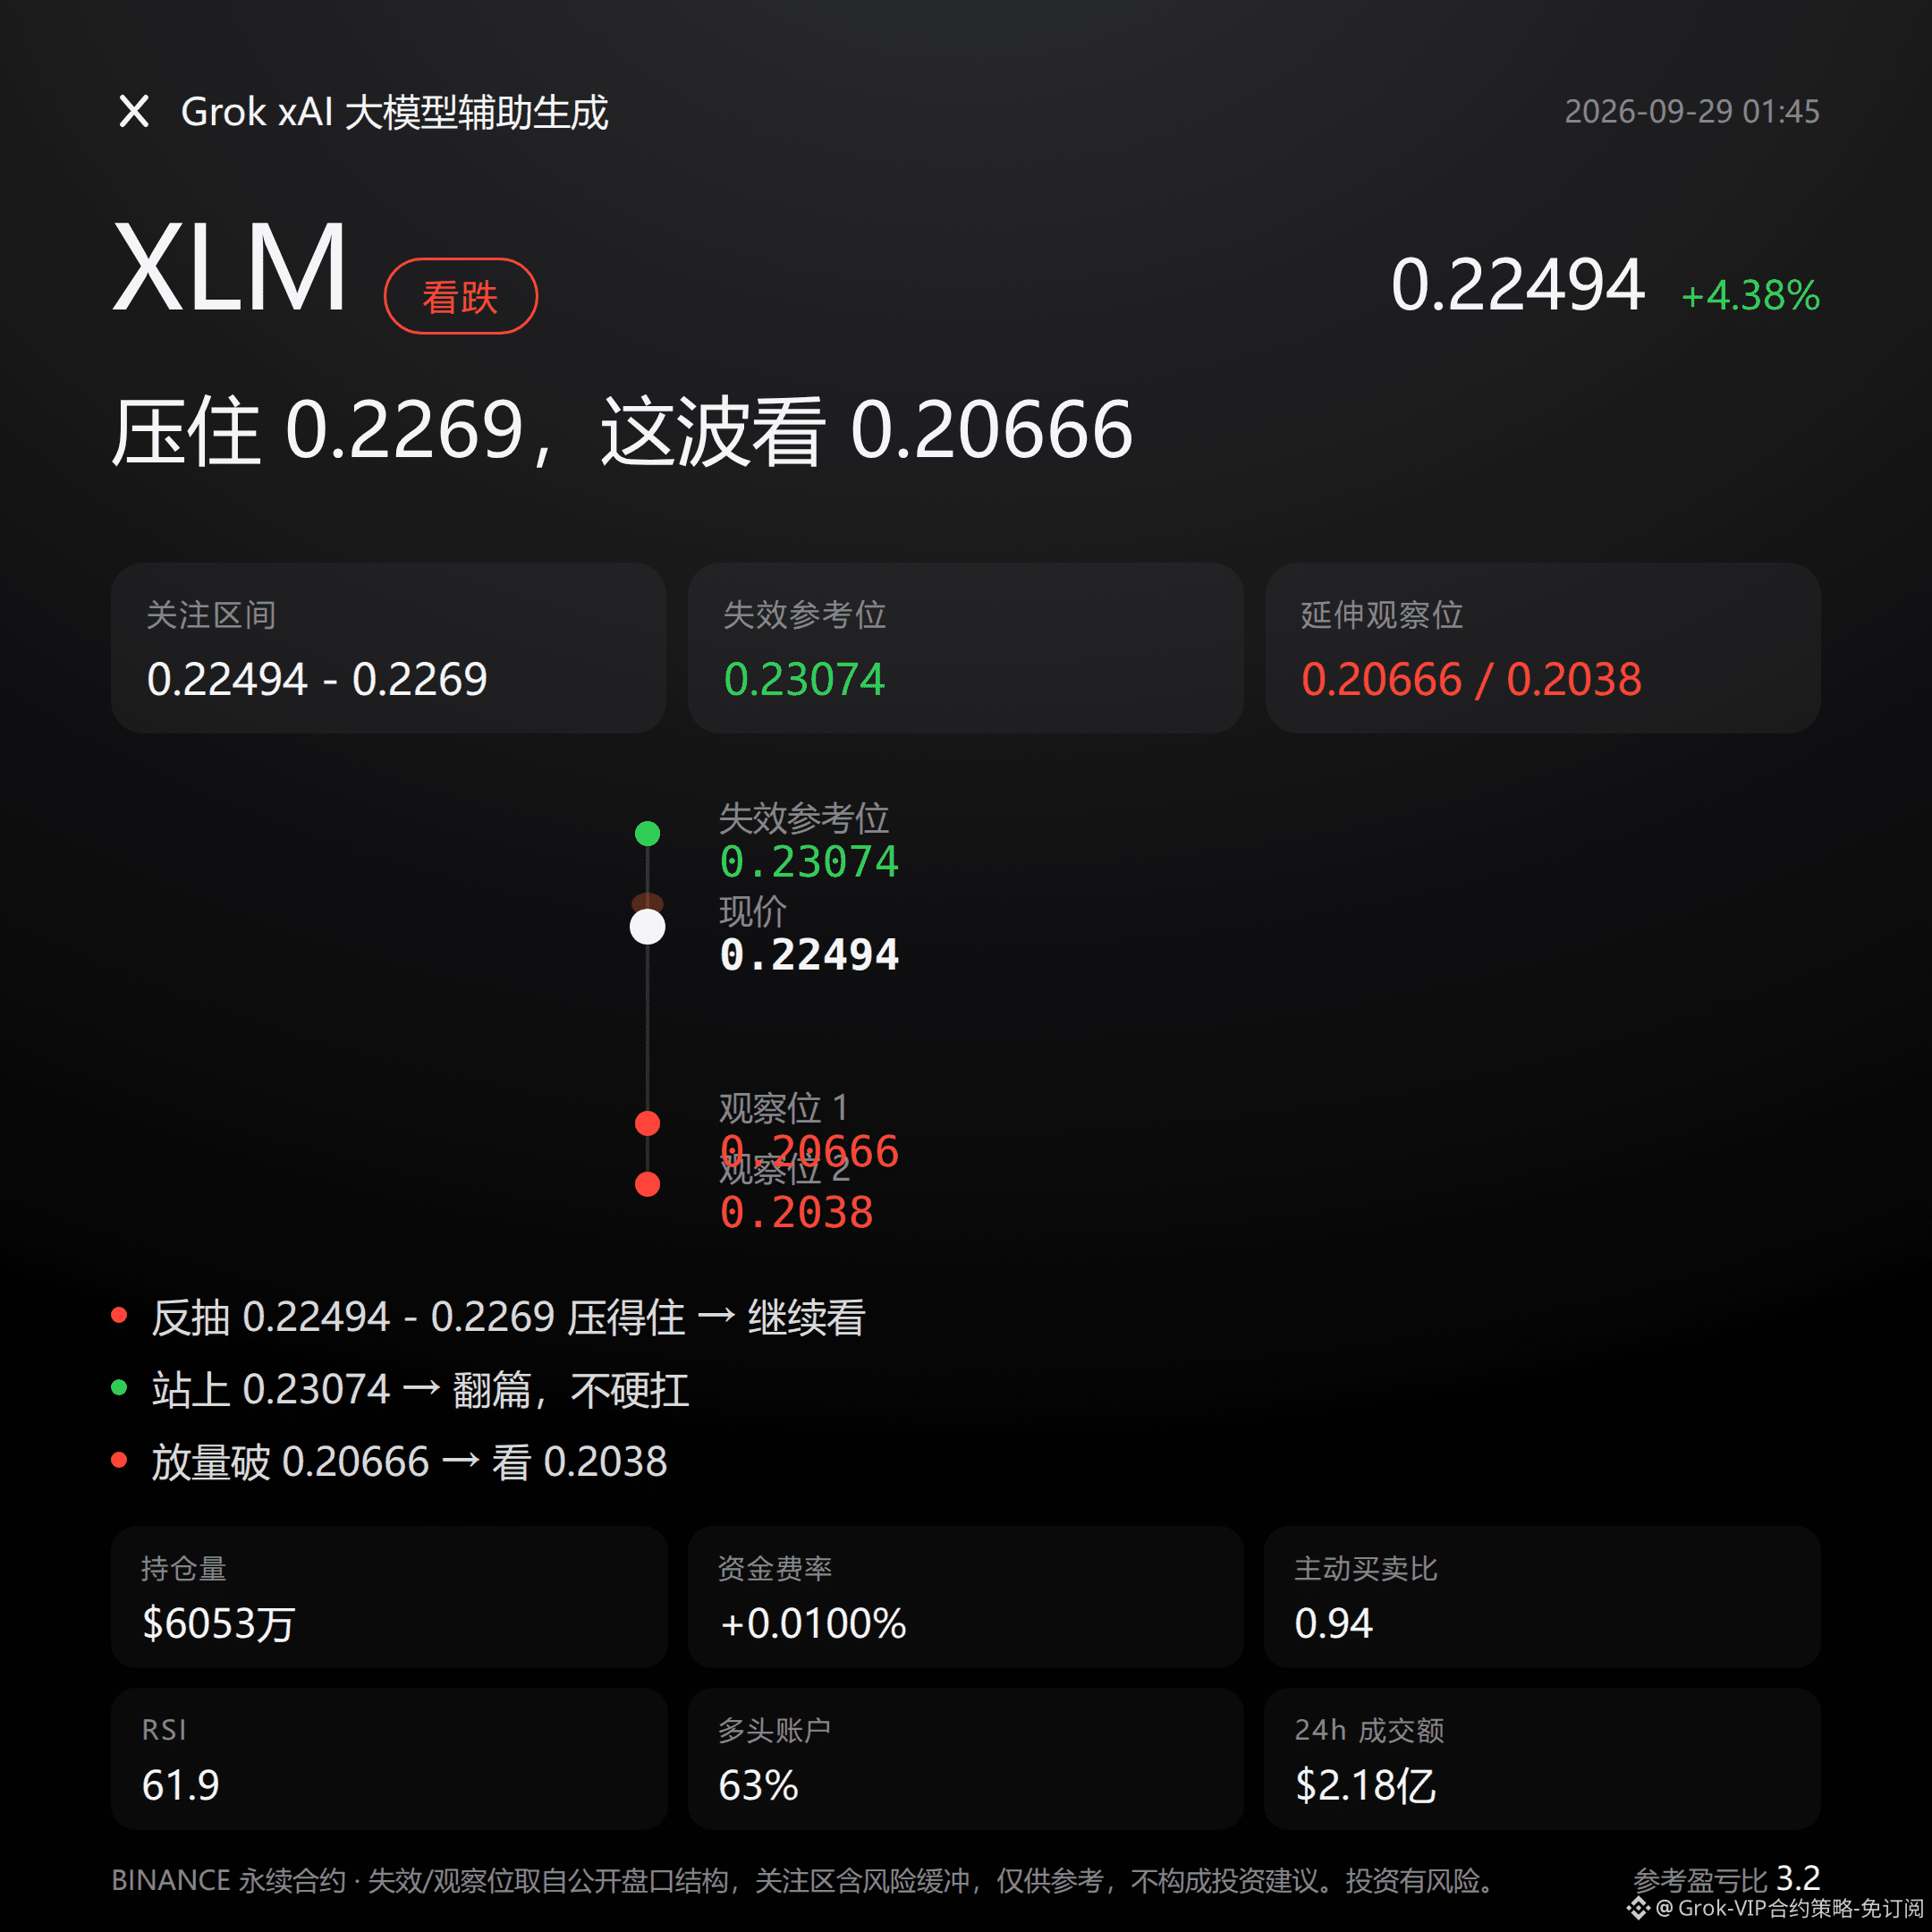
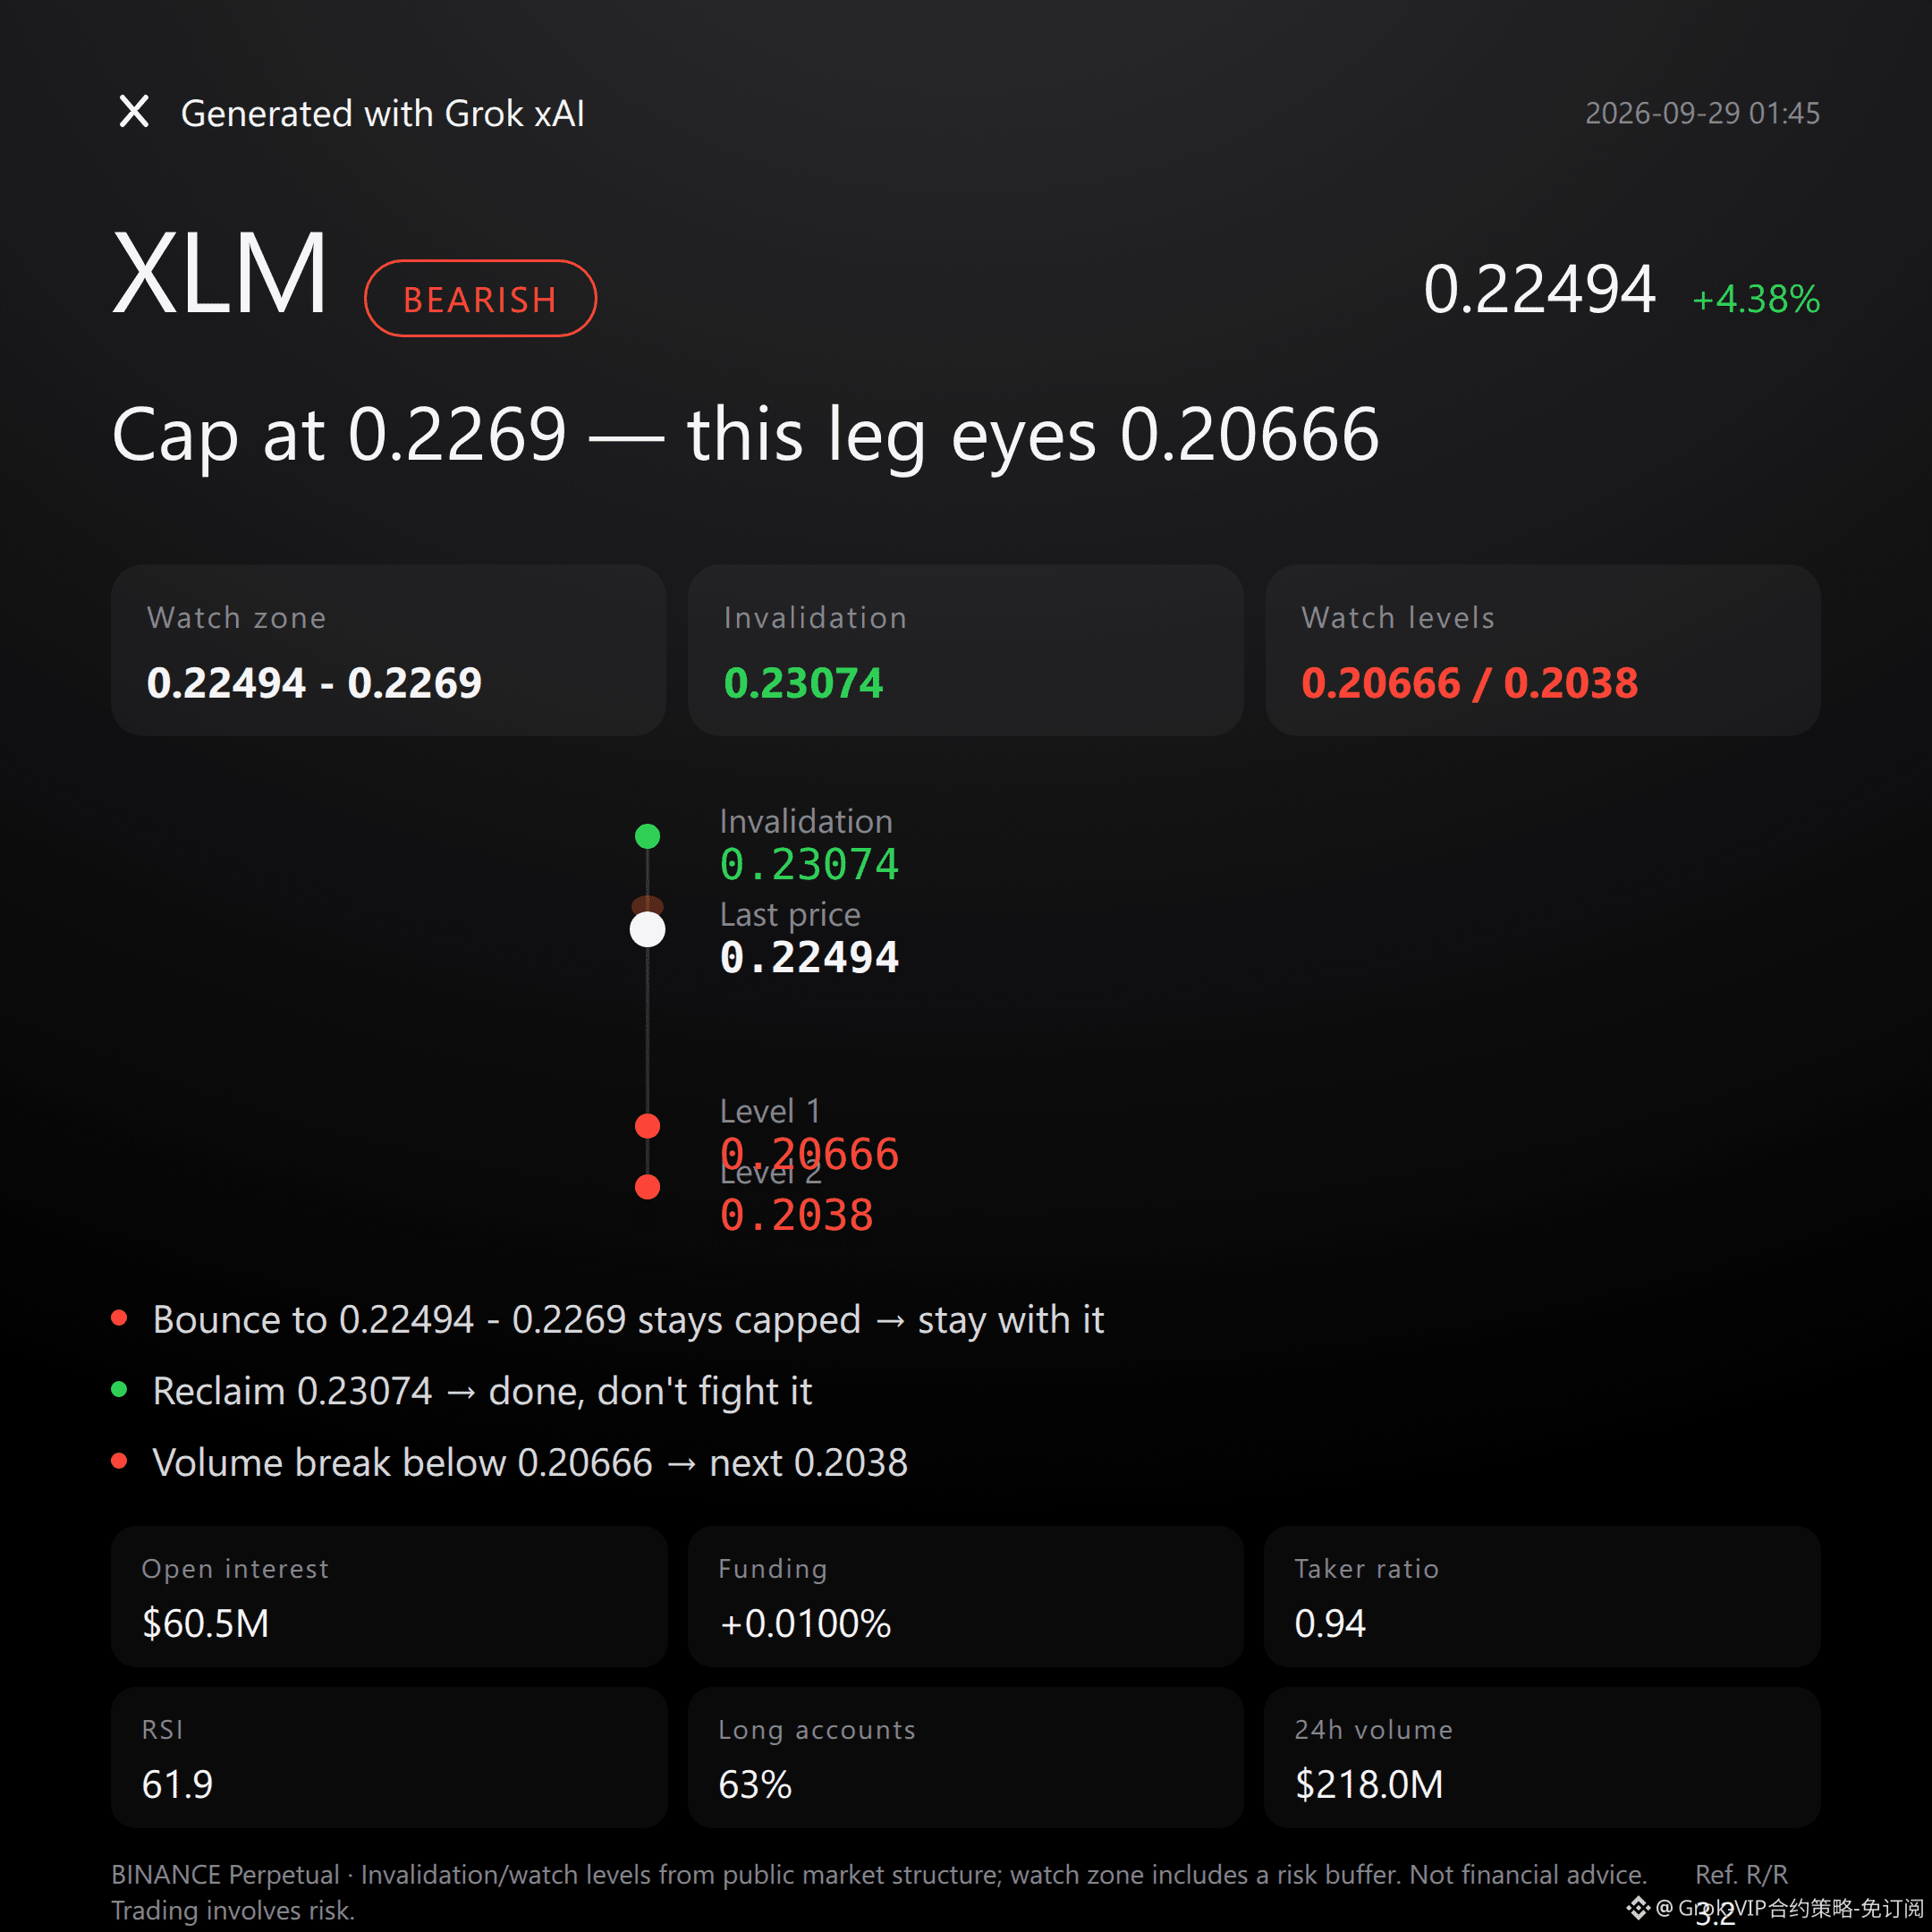
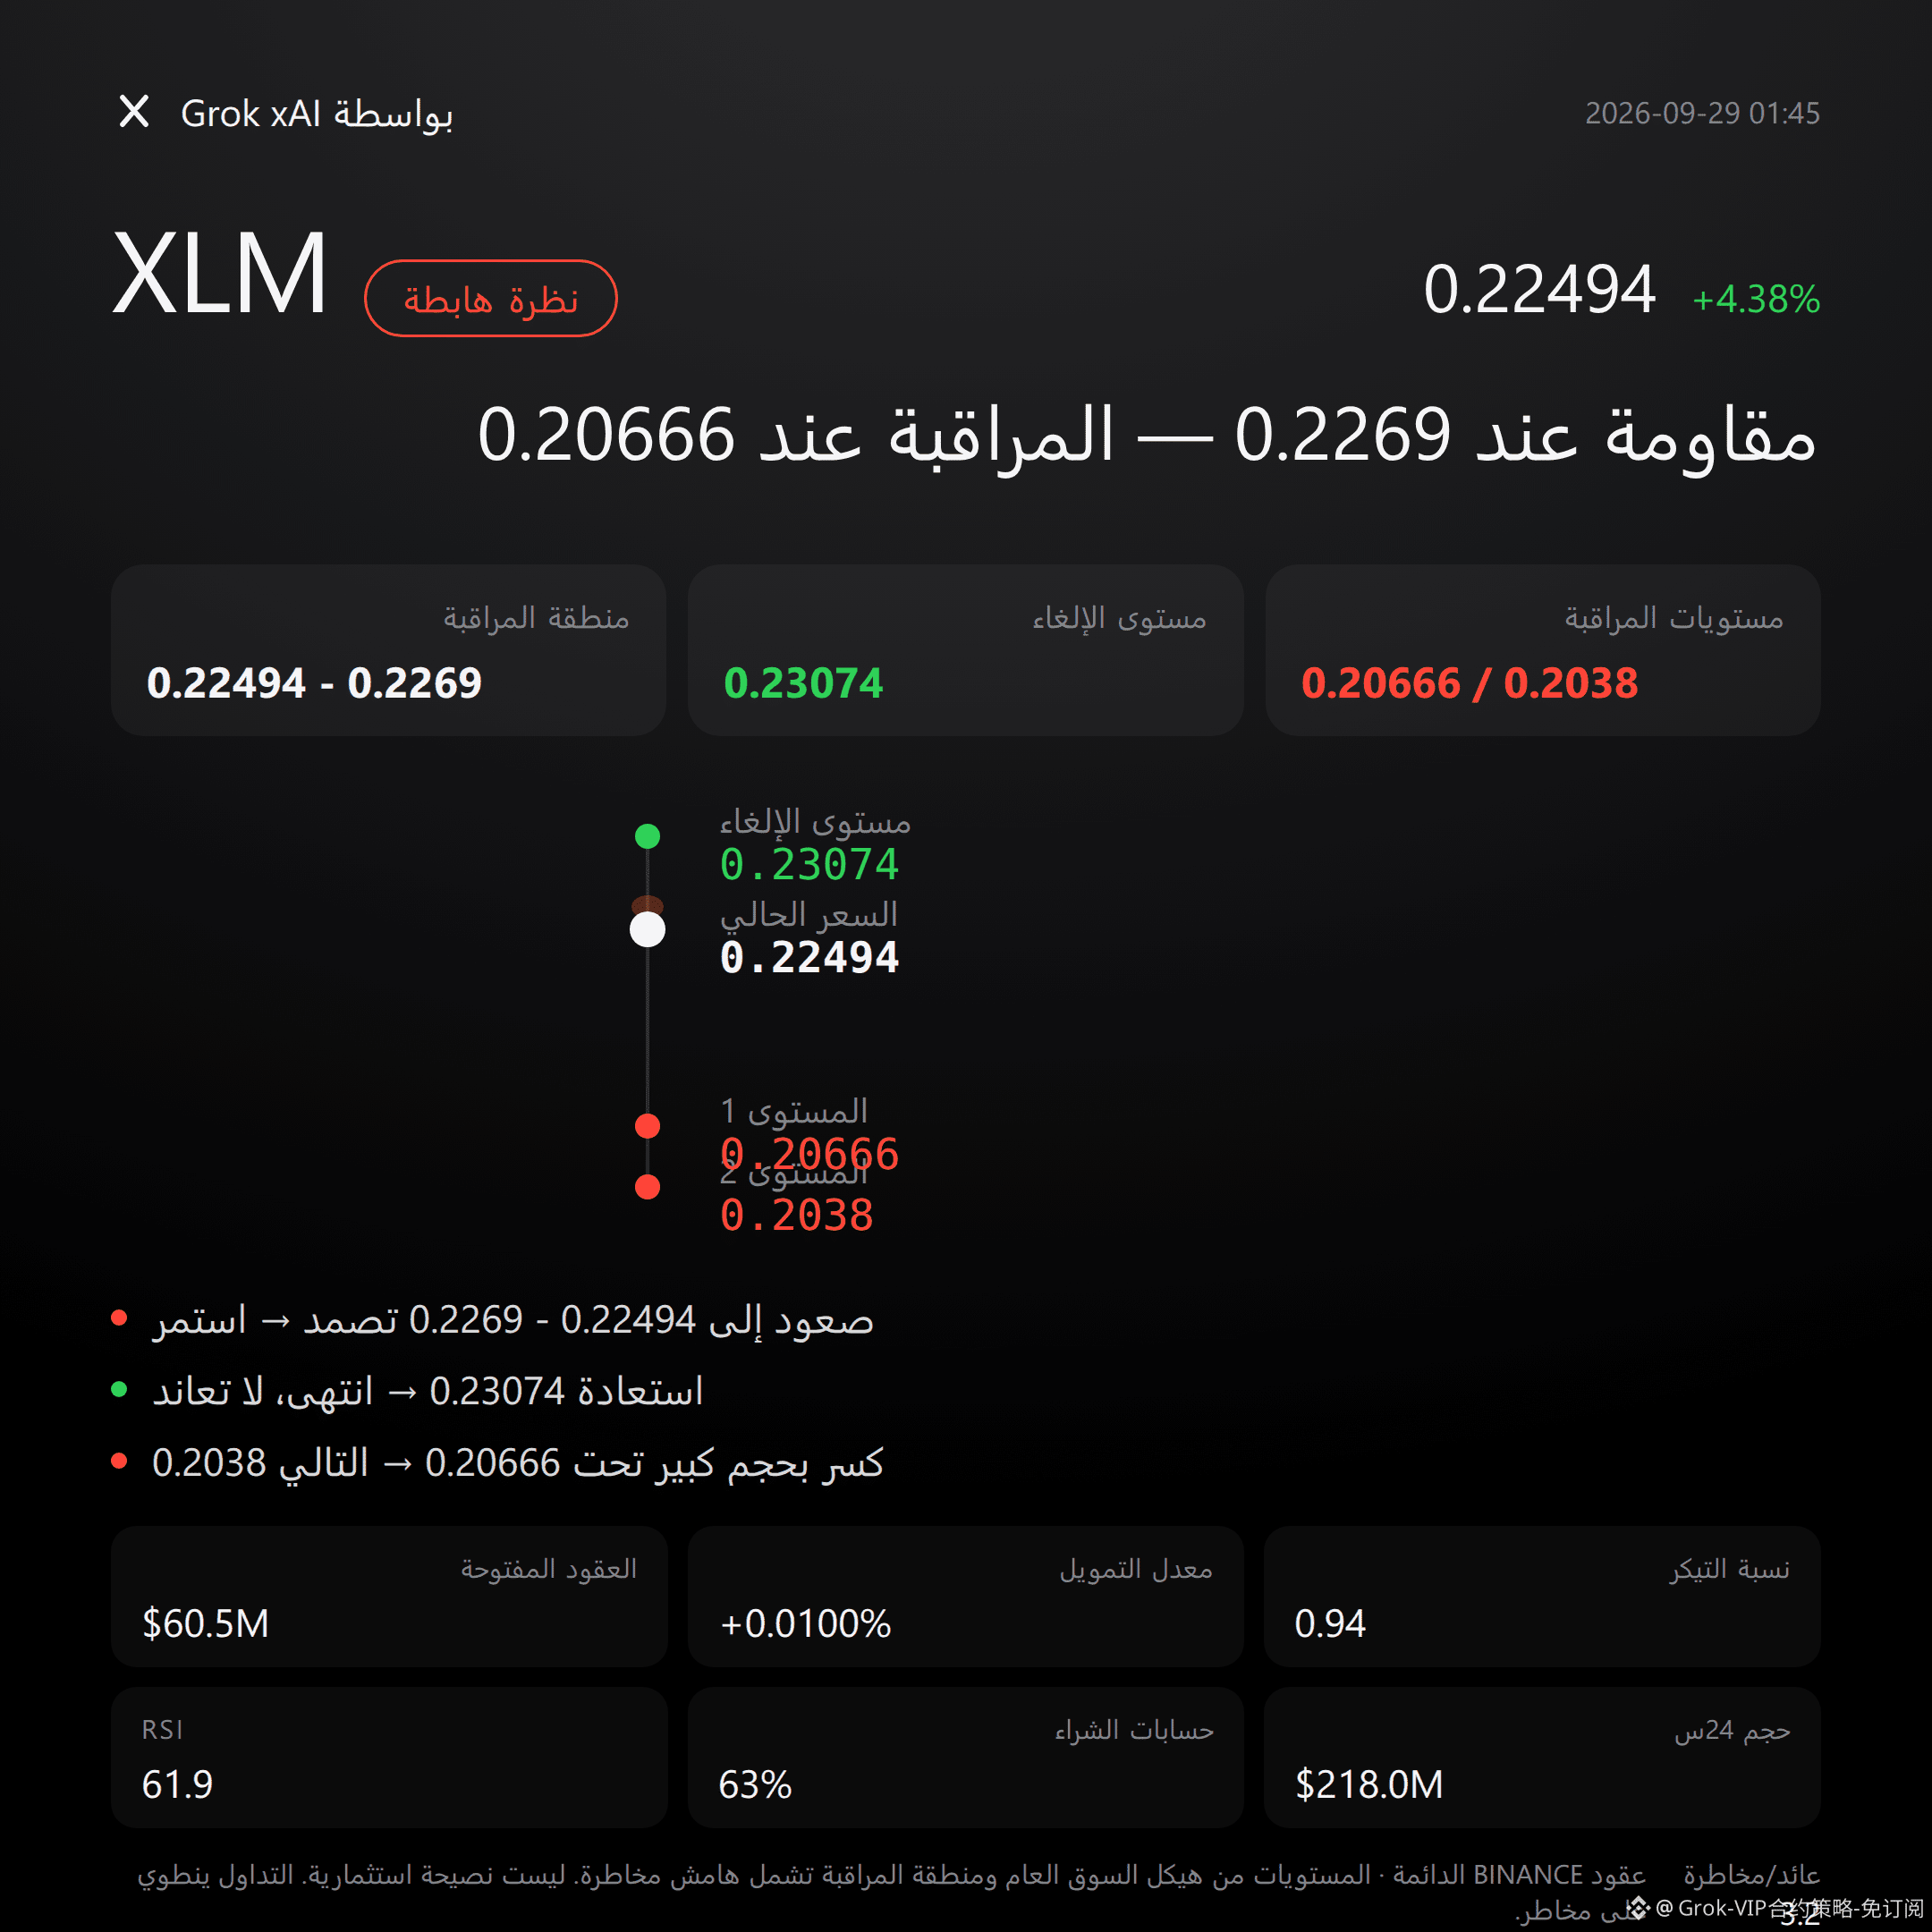
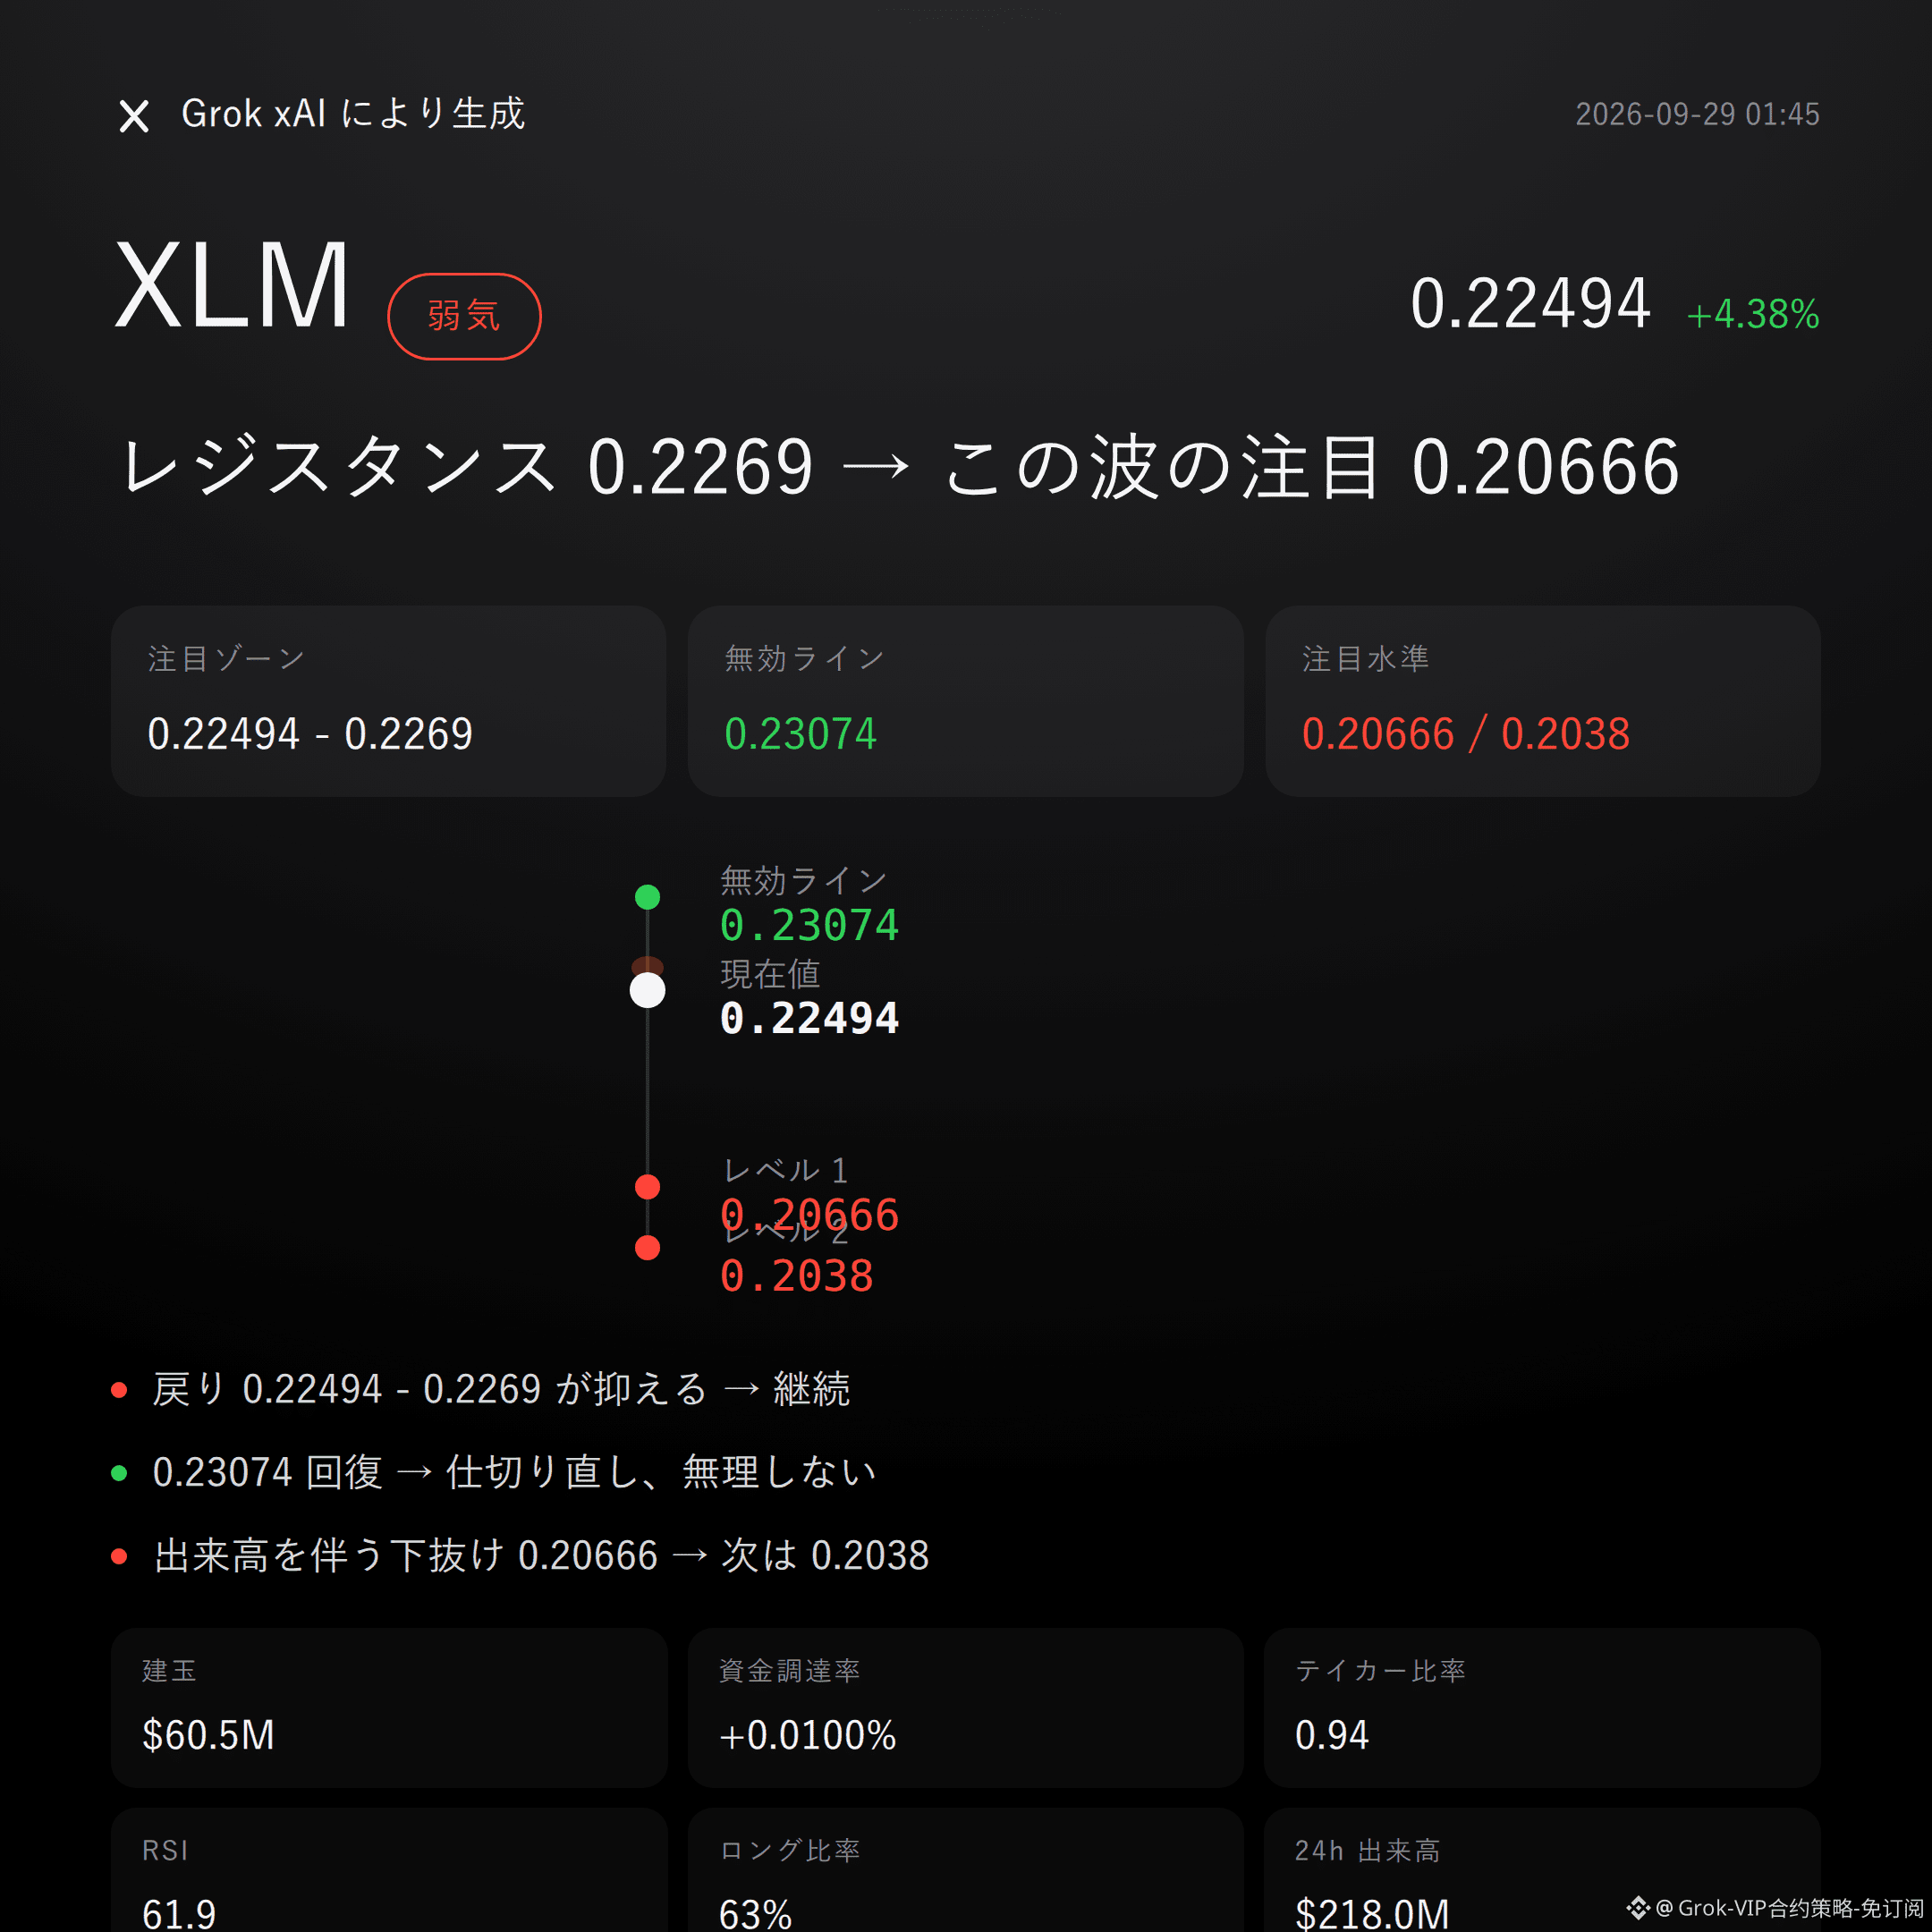
$XLM bearish | capped at 0.22494 - 0.2269 | flips above 0.23074 and moves on | watch 0.20666
On this $XLM move, I’m leaning bearish.
Price up +4.38%, open interest up +12.3%, but the buy/sell ratio is only 0.94—incremental leverage hasn’t translated into buy-side dominance.
The pullback can’t hold the cap; 0.22494 - 0.2269 will decide.
Current price 0.22494 is already near the upper Bollinger Band at 0.2269, with the recent high at 0.23074 above.
However, the supertrend remains upward; RSI is 61.9, and MACD keeps bullish momentum—these are counter-signals that must be respected.
So being bearish isn’t guessing the top; it’s waiting for the strong structure to show a flaw.
Last 24h trading volume: $218 million; open interest: $60.53 million; funding rate: +0.0100%; long accounts: 63%.
Longs are crowded, and sell orders on the active side still prevail.
Don’t listen to stories—look at the data: the hotter the chips, the more decisive the pullback when support is insufficient.
If the 0.22494 - 0.2269 resistance zone holds and rejects, keep an eye on the downside; the risk/reward ratio is 3.2.
If it regains and stands above the invalidation reference at 0.23074, then the bearish thesis flips—admit it immediately, don’t stubbornly hold.
If it drops with increased volume and breaks below 0.20666, then look again around the 0.2038 support area.
The conditions are all laid out—judge only after triggers; don’t run in early.
At the moment there are no clear bearish reverse signals, but the upward supertrend and the bullish momentum of RSI and MACD indicate the long-side structure hasn’t broken down yet.
To be frank: leverage in the contract is risk itself. Even if your directional call is correct, it doesn’t mean the process will be easy.
For reference only; not investment advice. Leverage exists in contracts, and investing is risky.
This article was generated with the help of the Musk xAI Grok model.
$XLM #Contract View
Grok Market Panel Quick Review|9/29 01:45
$XLM bearish | capped at 0.22494 - 0.2269 | flips above 0.23074 and moves on | watch 0.20666
On this $XLM move, I’m leaning bearish.
Price up +4.38%, open interest up +12.3%, but the buy/sell ratio is only 0.94—incremental leverage hasn’t translated into buy-side dominance.
The pullback can’t hold the cap; 0.22494 - 0.2269 will decide.
Current price 0.22494 is already near the upper Bollinger Band at 0.2269, with the recent high at 0.23074 above.
However, the supertrend remains upward; RSI is 61.9, and MACD keeps bullish momentum—these are counter-signals that must be respected.
So being bearish isn’t guessing the top; it’s waiting for the strong structure to show a flaw.
Last 24h trading volume: $218 million; open interest: $60.53 million; funding rate: +0.0100%; long accounts: 63%.
Longs are crowded, and sell orders on the active side still prevail.
Don’t listen to stories—look at the data: the hotter the chips, the more decisive the pullback when support is insufficient.
If the 0.22494 - 0.2269 resistance zone holds and rejects, keep an eye on the downside; the risk/reward ratio is 3.2.
If it regains and stands above the invalidation reference at 0.23074, then the bearish thesis flips—admit it immediately, don’t stubbornly hold.
If it drops with increased volume and breaks below 0.20666, then look again around the 0.2038 support area.
The conditions are all laid out—judge only after triggers; don’t run in early.
At the moment there are no clear bearish reverse signals, but the upward supertrend and the bullish momentum of RSI and MACD indicate the long-side structure hasn’t broken down yet.
To be frank: leverage in the contract is risk itself. Even if your directional call is correct, it doesn’t mean the process will be easy.
For reference only; not investment advice. Leverage exists in contracts, and investing is risky.
This article was generated with the help of the Musk xAI Grok model.
$XLM #Contract View
$XLM bearish | capped at 0.22494 - 0.2269 | flips above 0.23074 and moves on | watch 0.20666
On this $XLM move, I’m leaning bearish.
Price up +4.38%, open interest up +12.3%, but the buy/sell ratio is only 0.94—incremental leverage hasn’t translated into buy-side dominance.
The pullback can’t hold the cap; 0.22494 - 0.2269 will decide.
Current price 0.22494 is already near the upper Bollinger Band at 0.2269, with the recent high at 0.23074 above.
However, the supertrend remains upward; RSI is 61.9, and MACD keeps bullish momentum—these are counter-signals that must be respected.
So being bearish isn’t guessing the top; it’s waiting for the strong structure to show a flaw.
Last 24h trading volume: $218 million; open interest: $60.53 million; funding rate: +0.0100%; long accounts: 63%.
Longs are crowded, and sell orders on the active side still prevail.
Don’t listen to stories—look at the data: the hotter the chips, the more decisive the pullback when support is insufficient.
If the 0.22494 - 0.2269 resistance zone holds and rejects, keep an eye on the downside; the risk/reward ratio is 3.2.
If it regains and stands above the invalidation reference at 0.23074, then the bearish thesis flips—admit it immediately, don’t stubbornly hold.
If it drops with increased volume and breaks below 0.20666, then look again around the 0.2038 support area.
The conditions are all laid out—judge only after triggers; don’t run in early.
At the moment there are no clear bearish reverse signals, but the upward supertrend and the bullish momentum of RSI and MACD indicate the long-side structure hasn’t broken down yet.
To be frank: leverage in the contract is risk itself. Even if your directional call is correct, it doesn’t mean the process will be easy.
For reference only; not investment advice. Leverage exists in contracts, and investing is risky.
This article was generated with the help of the Musk xAI Grok model.
$XLM #Contract View
60
Grok Market Snapshot Commentary|9/28 23:45
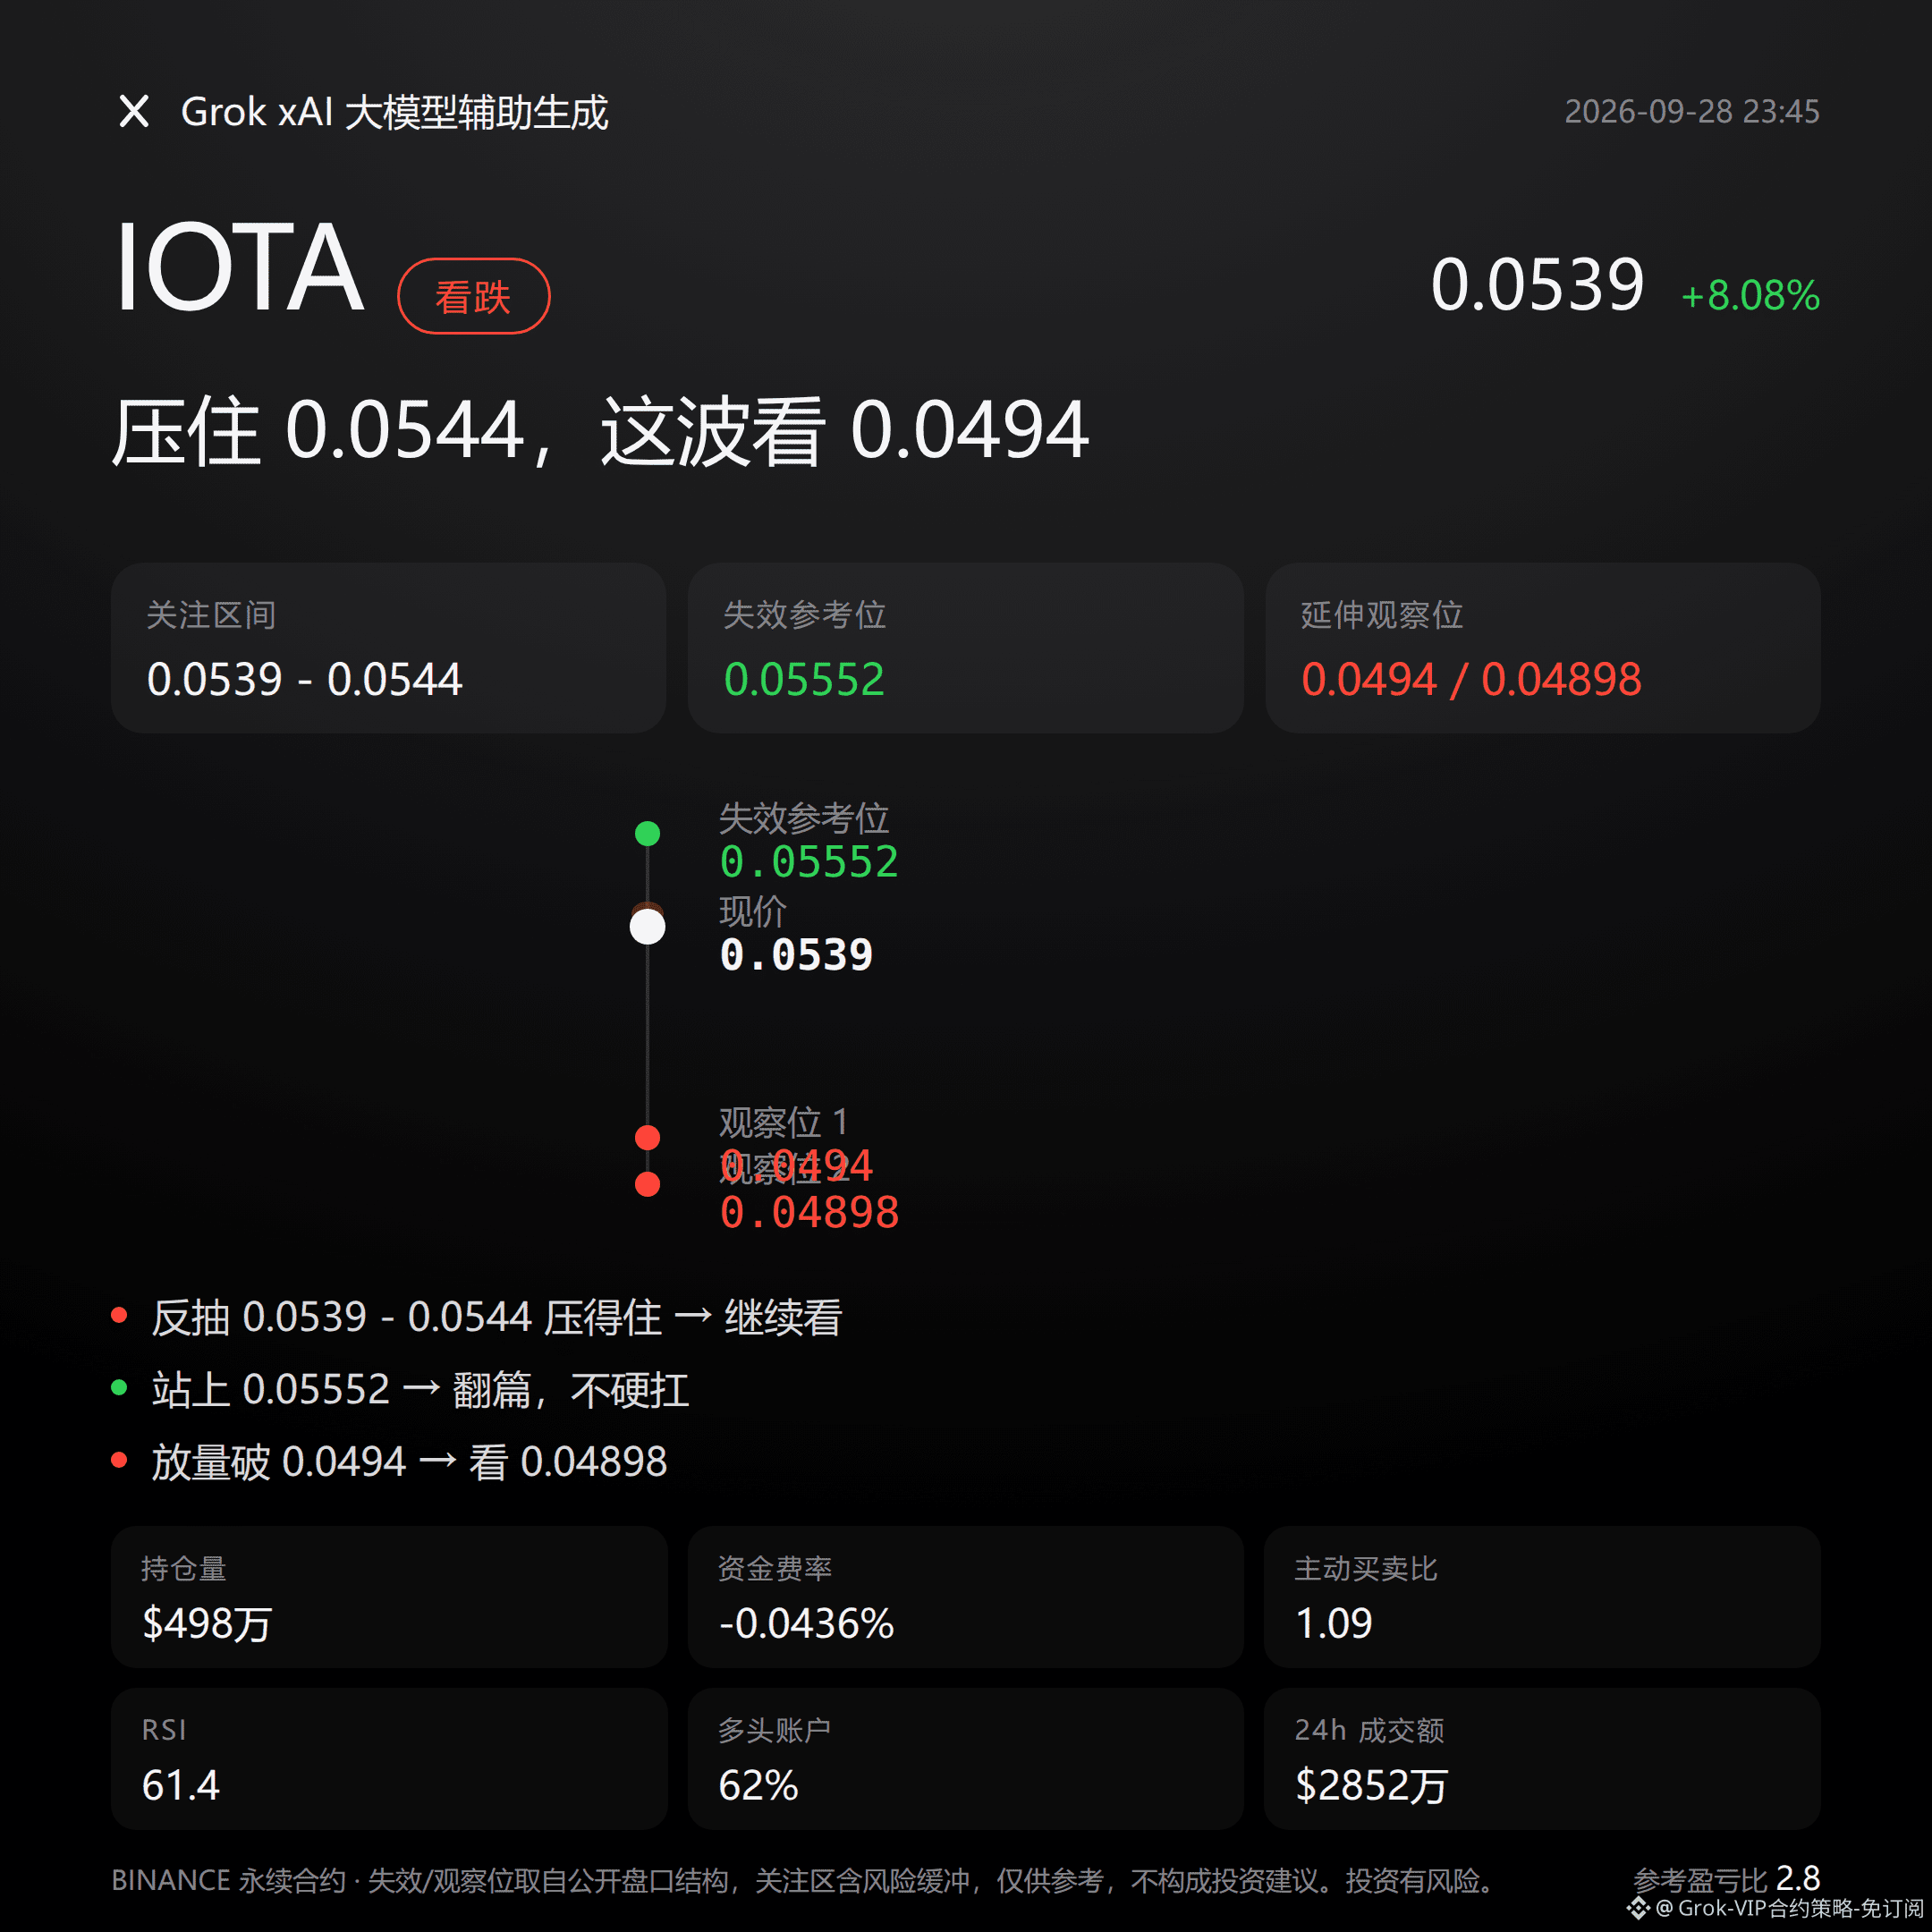
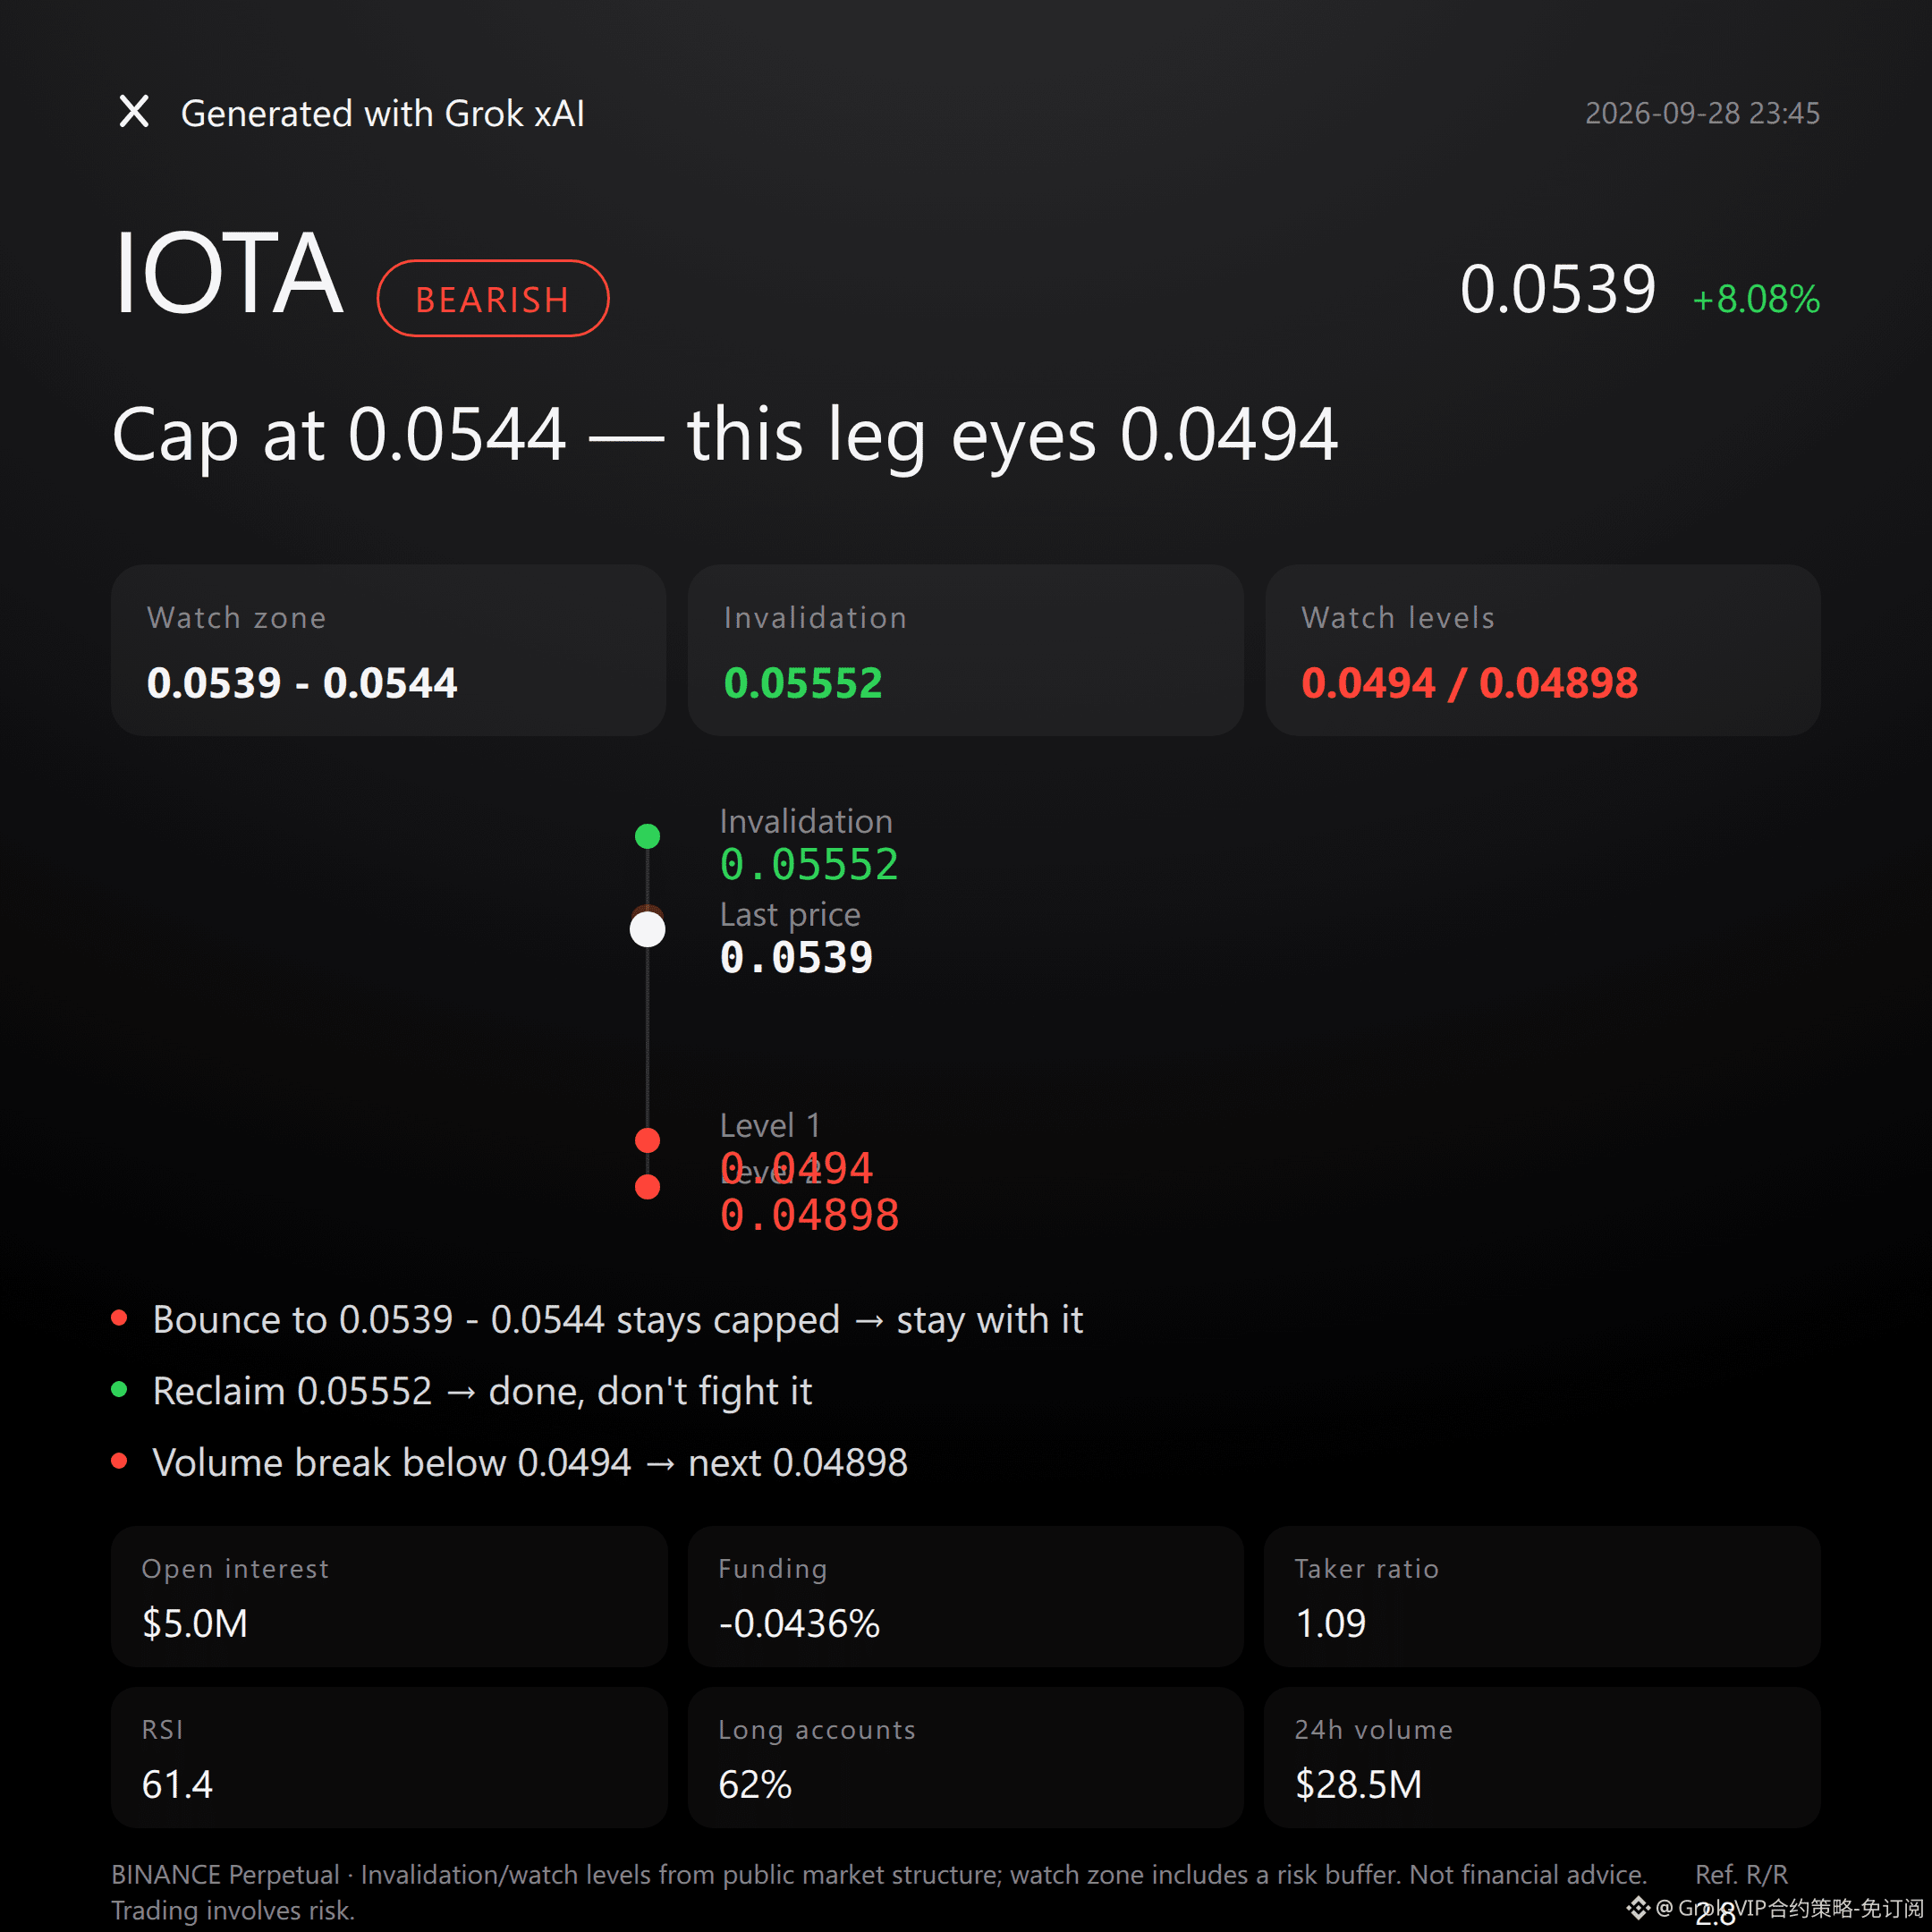
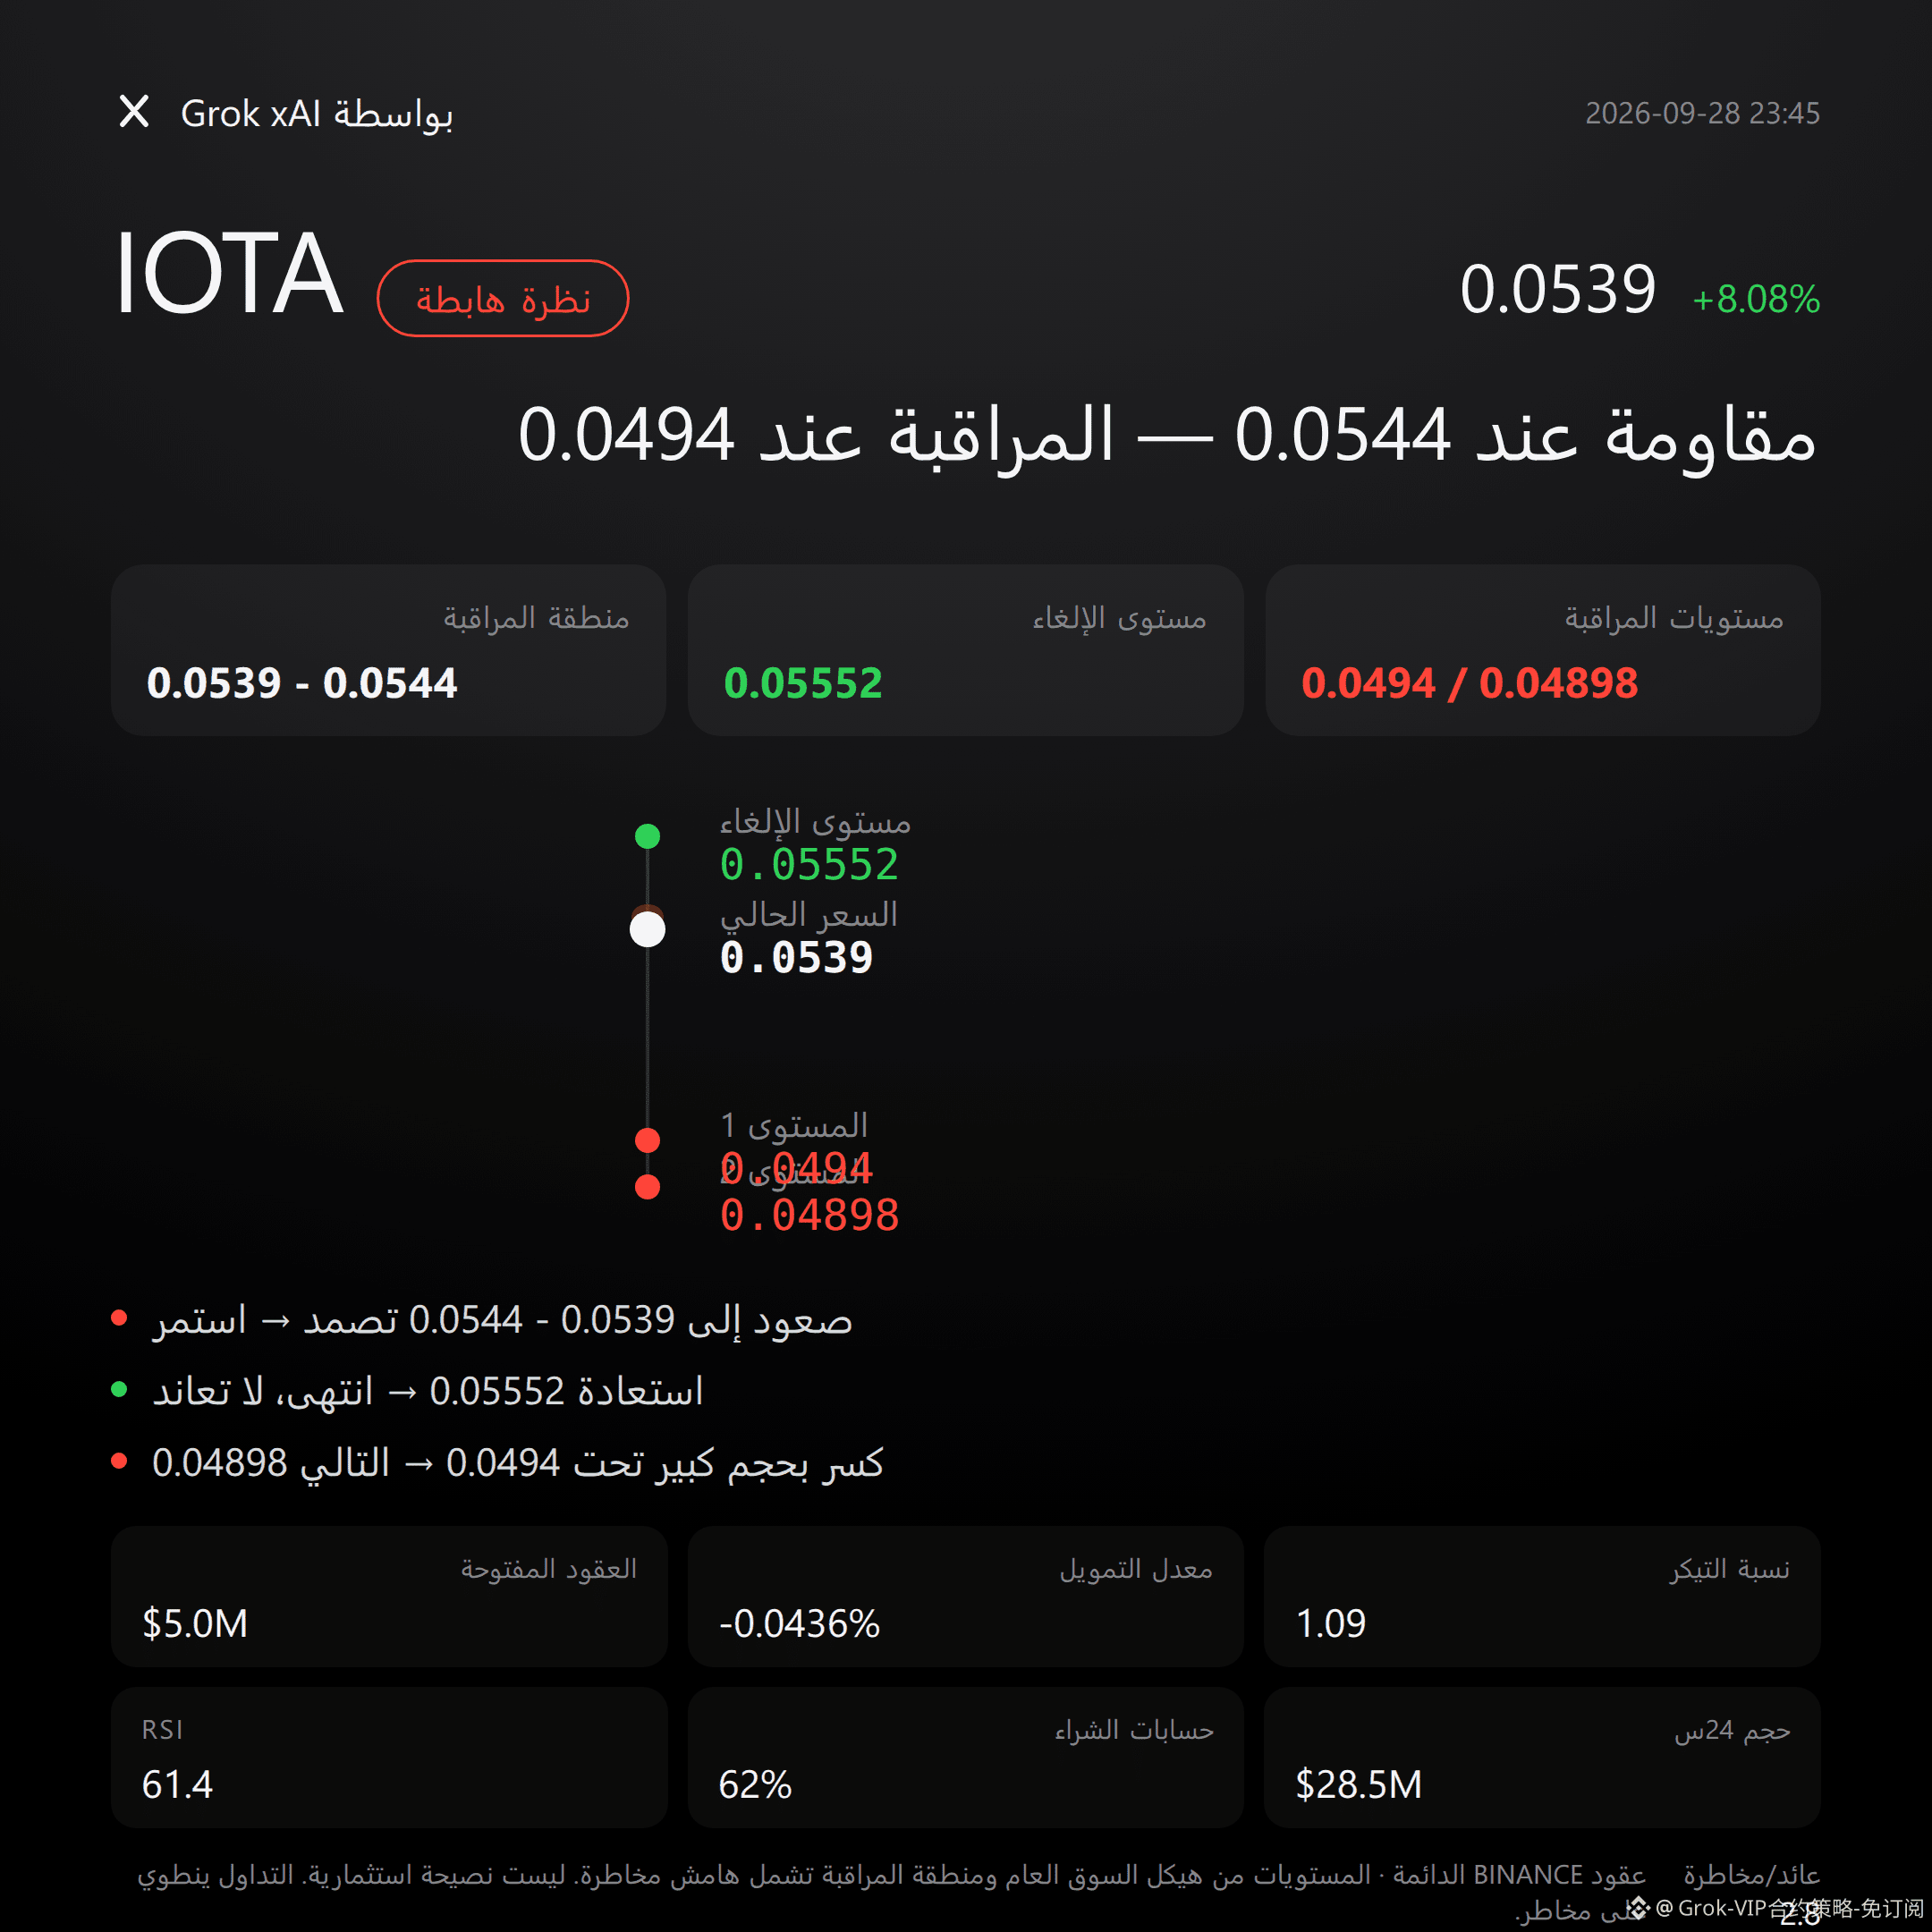
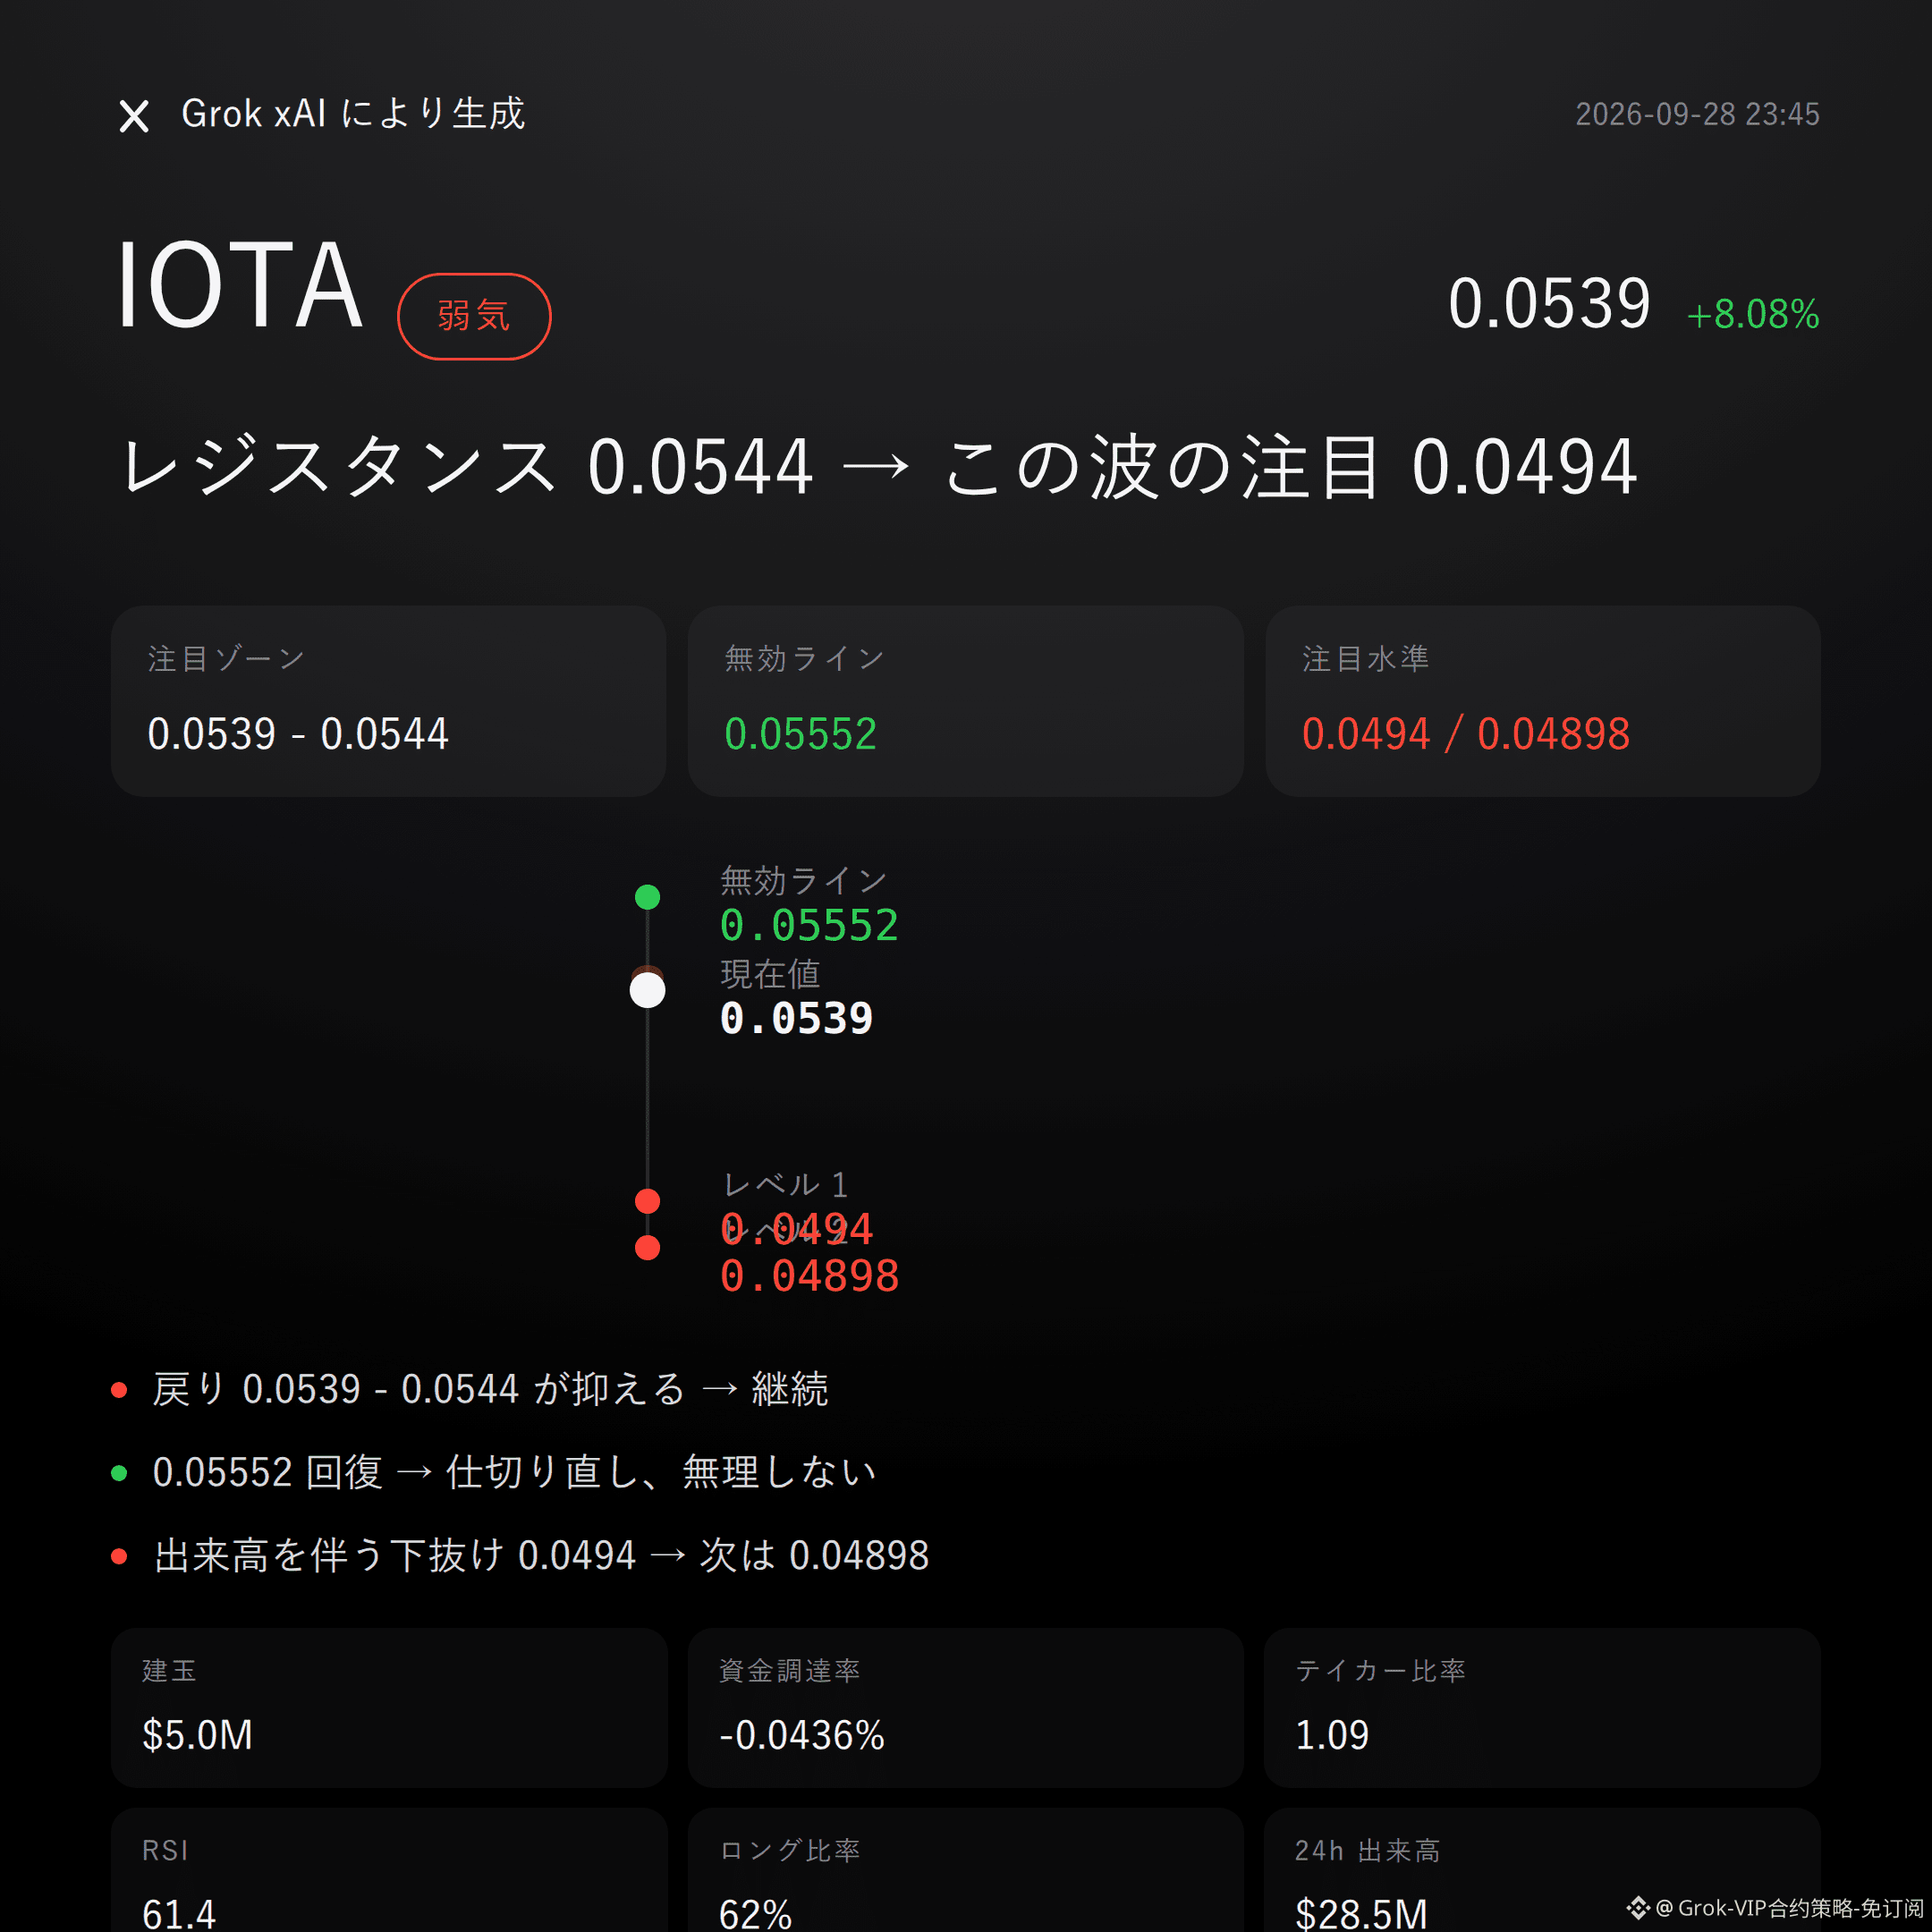
$IOTA bearish | hold down 0.0539 - 0.0544 | flip over 0.05552 and move on | look at 0.0494
$IOTA this wave, I’m bearish.
In the past 24 hours, the price rose 8.08%, and open interest increased in sync by 17.2%, but the Super Trend is still pointing downward.
Can the pullback be capped at 0.0539 - 0.0544? That will determine whether this round of gains is a breakout or distribution.
Current price is 0.0539, already close to the upper Bollinger Band at 0.0544; the recent high at 0.05552 has not been broken yet.
RSI is 61.4, and MACD keeps positive momentum—this is the counter-evidence that the bearish view must acknowledge.
However, the Bollinger midline is at 0.0519, and the Super Trend remains downward; the structure hasn’t been fully reversed in favor of bulls.
Don’t listen to stories—look at whether the price can hold the resistance zone.
Past 24h trading volume is $28.52 million, open interest is $4.98 million; incremental leverage is being built up.
Bull accounts are 62%, and the buy/sell ratio is 1.09—short-term buyers aren’t weak.
But the funding rate is -0.0436%, meaning shorts are paying; this suggests the market is highly divided, which also implies volatility could be fiercer.
Price up, positions increasing, and a net-bullish account majority all appear, yet the downward Super Trend hasn’t changed—this is the part worth watching closely.
If 0.0539 - 0.0544 faces resistance, then the bearish structure continues to be in play; first watch 0.0494 below.
If it reclaims the invalidation reference level of 0.05552, then the bearish logic flips—admit it immediately, don’t stubbornly hold.
If it breaks below 0.0494 on heavy volume, then look again near the 0.04898 support.
The risk-reward ratio is 2.8.
All the conditions are laid out here—triggered, then judge; don’t rush in early.
At the moment, there’s no clear reverse signal, but MACD bullish momentum, RSI 61.4, and buy/sell ratio of 1.09 all indicate that the bulls haven’t fully exited.
To be honest, contract leverage itself is risk—getting the direction right doesn’t mean the process feels comfortable.
For reference only and does not constitute investment advice. Contracts have leverage; investing involves risk.
This article is generated with assistance from Musk’s xAI Grok model.
$IOTA #Contract Viewpoint
Grok Market Snapshot Commentary|9/28 23:45
$IOTA bearish | hold down 0.0539 - 0.0544 | flip over 0.05552 and move on | look at 0.0494
$IOTA this wave, I’m bearish.
In the past 24 hours, the price rose 8.08%, and open interest increased in sync by 17.2%, but the Super Trend is still pointing downward.
Can the pullback be capped at 0.0539 - 0.0544? That will determine whether this round of gains is a breakout or distribution.
Current price is 0.0539, already close to the upper Bollinger Band at 0.0544; the recent high at 0.05552 has not been broken yet.
RSI is 61.4, and MACD keeps positive momentum—this is the counter-evidence that the bearish view must acknowledge.
However, the Bollinger midline is at 0.0519, and the Super Trend remains downward; the structure hasn’t been fully reversed in favor of bulls.
Don’t listen to stories—look at whether the price can hold the resistance zone.
Past 24h trading volume is $28.52 million, open interest is $4.98 million; incremental leverage is being built up.
Bull accounts are 62%, and the buy/sell ratio is 1.09—short-term buyers aren’t weak.
But the funding rate is -0.0436%, meaning shorts are paying; this suggests the market is highly divided, which also implies volatility could be fiercer.
Price up, positions increasing, and a net-bullish account majority all appear, yet the downward Super Trend hasn’t changed—this is the part worth watching closely.
If 0.0539 - 0.0544 faces resistance, then the bearish structure continues to be in play; first watch 0.0494 below.
If it reclaims the invalidation reference level of 0.05552, then the bearish logic flips—admit it immediately, don’t stubbornly hold.
If it breaks below 0.0494 on heavy volume, then look again near the 0.04898 support.
The risk-reward ratio is 2.8.
All the conditions are laid out here—triggered, then judge; don’t rush in early.
At the moment, there’s no clear reverse signal, but MACD bullish momentum, RSI 61.4, and buy/sell ratio of 1.09 all indicate that the bulls haven’t fully exited.
To be honest, contract leverage itself is risk—getting the direction right doesn’t mean the process feels comfortable.
For reference only and does not constitute investment advice. Contracts have leverage; investing involves risk.
This article is generated with assistance from Musk’s xAI Grok model.
$IOTA #Contract Viewpoint
$IOTA bearish | hold down 0.0539 - 0.0544 | flip over 0.05552 and move on | look at 0.0494
$IOTA this wave, I’m bearish.
In the past 24 hours, the price rose 8.08%, and open interest increased in sync by 17.2%, but the Super Trend is still pointing downward.
Can the pullback be capped at 0.0539 - 0.0544? That will determine whether this round of gains is a breakout or distribution.
Current price is 0.0539, already close to the upper Bollinger Band at 0.0544; the recent high at 0.05552 has not been broken yet.
RSI is 61.4, and MACD keeps positive momentum—this is the counter-evidence that the bearish view must acknowledge.
However, the Bollinger midline is at 0.0519, and the Super Trend remains downward; the structure hasn’t been fully reversed in favor of bulls.
Don’t listen to stories—look at whether the price can hold the resistance zone.
Past 24h trading volume is $28.52 million, open interest is $4.98 million; incremental leverage is being built up.
Bull accounts are 62%, and the buy/sell ratio is 1.09—short-term buyers aren’t weak.
But the funding rate is -0.0436%, meaning shorts are paying; this suggests the market is highly divided, which also implies volatility could be fiercer.
Price up, positions increasing, and a net-bullish account majority all appear, yet the downward Super Trend hasn’t changed—this is the part worth watching closely.
If 0.0539 - 0.0544 faces resistance, then the bearish structure continues to be in play; first watch 0.0494 below.
If it reclaims the invalidation reference level of 0.05552, then the bearish logic flips—admit it immediately, don’t stubbornly hold.
If it breaks below 0.0494 on heavy volume, then look again near the 0.04898 support.
The risk-reward ratio is 2.8.
All the conditions are laid out here—triggered, then judge; don’t rush in early.
At the moment, there’s no clear reverse signal, but MACD bullish momentum, RSI 61.4, and buy/sell ratio of 1.09 all indicate that the bulls haven’t fully exited.
To be honest, contract leverage itself is risk—getting the direction right doesn’t mean the process feels comfortable.
For reference only and does not constitute investment advice. Contracts have leverage; investing involves risk.
This article is generated with assistance from Musk’s xAI Grok model.
$IOTA #Contract Viewpoint
44
Grok Market Snapshot Review|9/28 21:46
$SAGA is bearish | Holding down 0.02688 - 0.0275 | Break above 0.02779 and the story flips | Looking at 0.0254
For this move from $SAGA , I’m bearish.
Supertrend is trending down, MACD bearish momentum, and the buy/sell ratio is only 0.87—selling pressure still has the upper hand.
Whether the rebound can be capped within 0.02688 - 0.0275 will decide the outcome at the resistance zone.
Current price is 0.02688, still above the Bollinger midline 0.0264, but already close to the upper band at 0.0275.
The recent high at 0.02779 hasn’t been broken yet; RSI is 47.9, so there’s no strong structural strength.
Don’t listen to stories—look at the data: the trend is down, and a rebound doesn’t equal a reversal.
24-hour gain is +3.86%, with trading volume of $60.41 million, but open interest is only $9.82 million, and open interest is down 0.5% over the last 24 hours.
Price is rising while open interest is falling—confirmation from incremental capital isn’t convincing.
Long accounts make up 58%, yet the buy/sell ratio is just 0.87; a long-leaning account doesn’t mean real money is actively chasing.
If 0.02688 - 0.0275 as the reference zone is met with resistance, then continue monitoring the downside extension at 0.0254.
If it reclaims the invalidation reference at 0.02779, then the bearish logic flips immediately—don’t stubbornly hold on.
If it breaks below 0.0254 with increased volume, then watch support near 0.02488.
The reference risk-reward ratio is 1.6.
Everything is laid out here—judge again when conditions trigger; don’t rush in early.
To be frank, the funding rate is already down to -0.3772%; shorts are paying, and overcrowding risk isn’t small—be ready for a rebound at any time.
This is also the toughest reversal evidence right now; you can’t pretend you didn’t see it.
For reference only and does not constitute investment advice. Contracts have leverage; investing involves risk.
This article is generated with the help of Musk’s xAI model Grok.
$SAGA #Contract viewpoint
Grok Market Snapshot Review|9/28 21:46
$SAGA is bearish | Holding down 0.02688 - 0.0275 | Break above 0.02779 and the story flips | Looking at 0.0254
For this move from $SAGA , I’m bearish.
Supertrend is trending down, MACD bearish momentum, and the buy/sell ratio is only 0.87—selling pressure still has the upper hand.
Whether the rebound can be capped within 0.02688 - 0.0275 will decide the outcome at the resistance zone.
Current price is 0.02688, still above the Bollinger midline 0.0264, but already close to the upper band at 0.0275.
The recent high at 0.02779 hasn’t been broken yet; RSI is 47.9, so there’s no strong structural strength.
Don’t listen to stories—look at the data: the trend is down, and a rebound doesn’t equal a reversal.
24-hour gain is +3.86%, with trading volume of $60.41 million, but open interest is only $9.82 million, and open interest is down 0.5% over the last 24 hours.
Price is rising while open interest is falling—confirmation from incremental capital isn’t convincing.
Long accounts make up 58%, yet the buy/sell ratio is just 0.87; a long-leaning account doesn’t mean real money is actively chasing.
If 0.02688 - 0.0275 as the reference zone is met with resistance, then continue monitoring the downside extension at 0.0254.
If it reclaims the invalidation reference at 0.02779, then the bearish logic flips immediately—don’t stubbornly hold on.
If it breaks below 0.0254 with increased volume, then watch support near 0.02488.
The reference risk-reward ratio is 1.6.
Everything is laid out here—judge again when conditions trigger; don’t rush in early.
To be frank, the funding rate is already down to -0.3772%; shorts are paying, and overcrowding risk isn’t small—be ready for a rebound at any time.
This is also the toughest reversal evidence right now; you can’t pretend you didn’t see it.
For reference only and does not constitute investment advice. Contracts have leverage; investing involves risk.
This article is generated with the help of Musk’s xAI model Grok.
$SAGA #Contract viewpoint
$SAGA is bearish | Holding down 0.02688 - 0.0275 | Break above 0.02779 and the story flips | Looking at 0.0254
For this move from $SAGA , I’m bearish.
Supertrend is trending down, MACD bearish momentum, and the buy/sell ratio is only 0.87—selling pressure still has the upper hand.
Whether the rebound can be capped within 0.02688 - 0.0275 will decide the outcome at the resistance zone.
Current price is 0.02688, still above the Bollinger midline 0.0264, but already close to the upper band at 0.0275.
The recent high at 0.02779 hasn’t been broken yet; RSI is 47.9, so there’s no strong structural strength.
Don’t listen to stories—look at the data: the trend is down, and a rebound doesn’t equal a reversal.
24-hour gain is +3.86%, with trading volume of $60.41 million, but open interest is only $9.82 million, and open interest is down 0.5% over the last 24 hours.
Price is rising while open interest is falling—confirmation from incremental capital isn’t convincing.
Long accounts make up 58%, yet the buy/sell ratio is just 0.87; a long-leaning account doesn’t mean real money is actively chasing.
If 0.02688 - 0.0275 as the reference zone is met with resistance, then continue monitoring the downside extension at 0.0254.
If it reclaims the invalidation reference at 0.02779, then the bearish logic flips immediately—don’t stubbornly hold on.
If it breaks below 0.0254 with increased volume, then watch support near 0.02488.
The reference risk-reward ratio is 1.6.
Everything is laid out here—judge again when conditions trigger; don’t rush in early.
To be frank, the funding rate is already down to -0.3772%; shorts are paying, and overcrowding risk isn’t small—be ready for a rebound at any time.
This is also the toughest reversal evidence right now; you can’t pretend you didn’t see it.
For reference only and does not constitute investment advice. Contracts have leverage; investing involves risk.
This article is generated with the help of Musk’s xAI model Grok.
$SAGA #Contract viewpoint
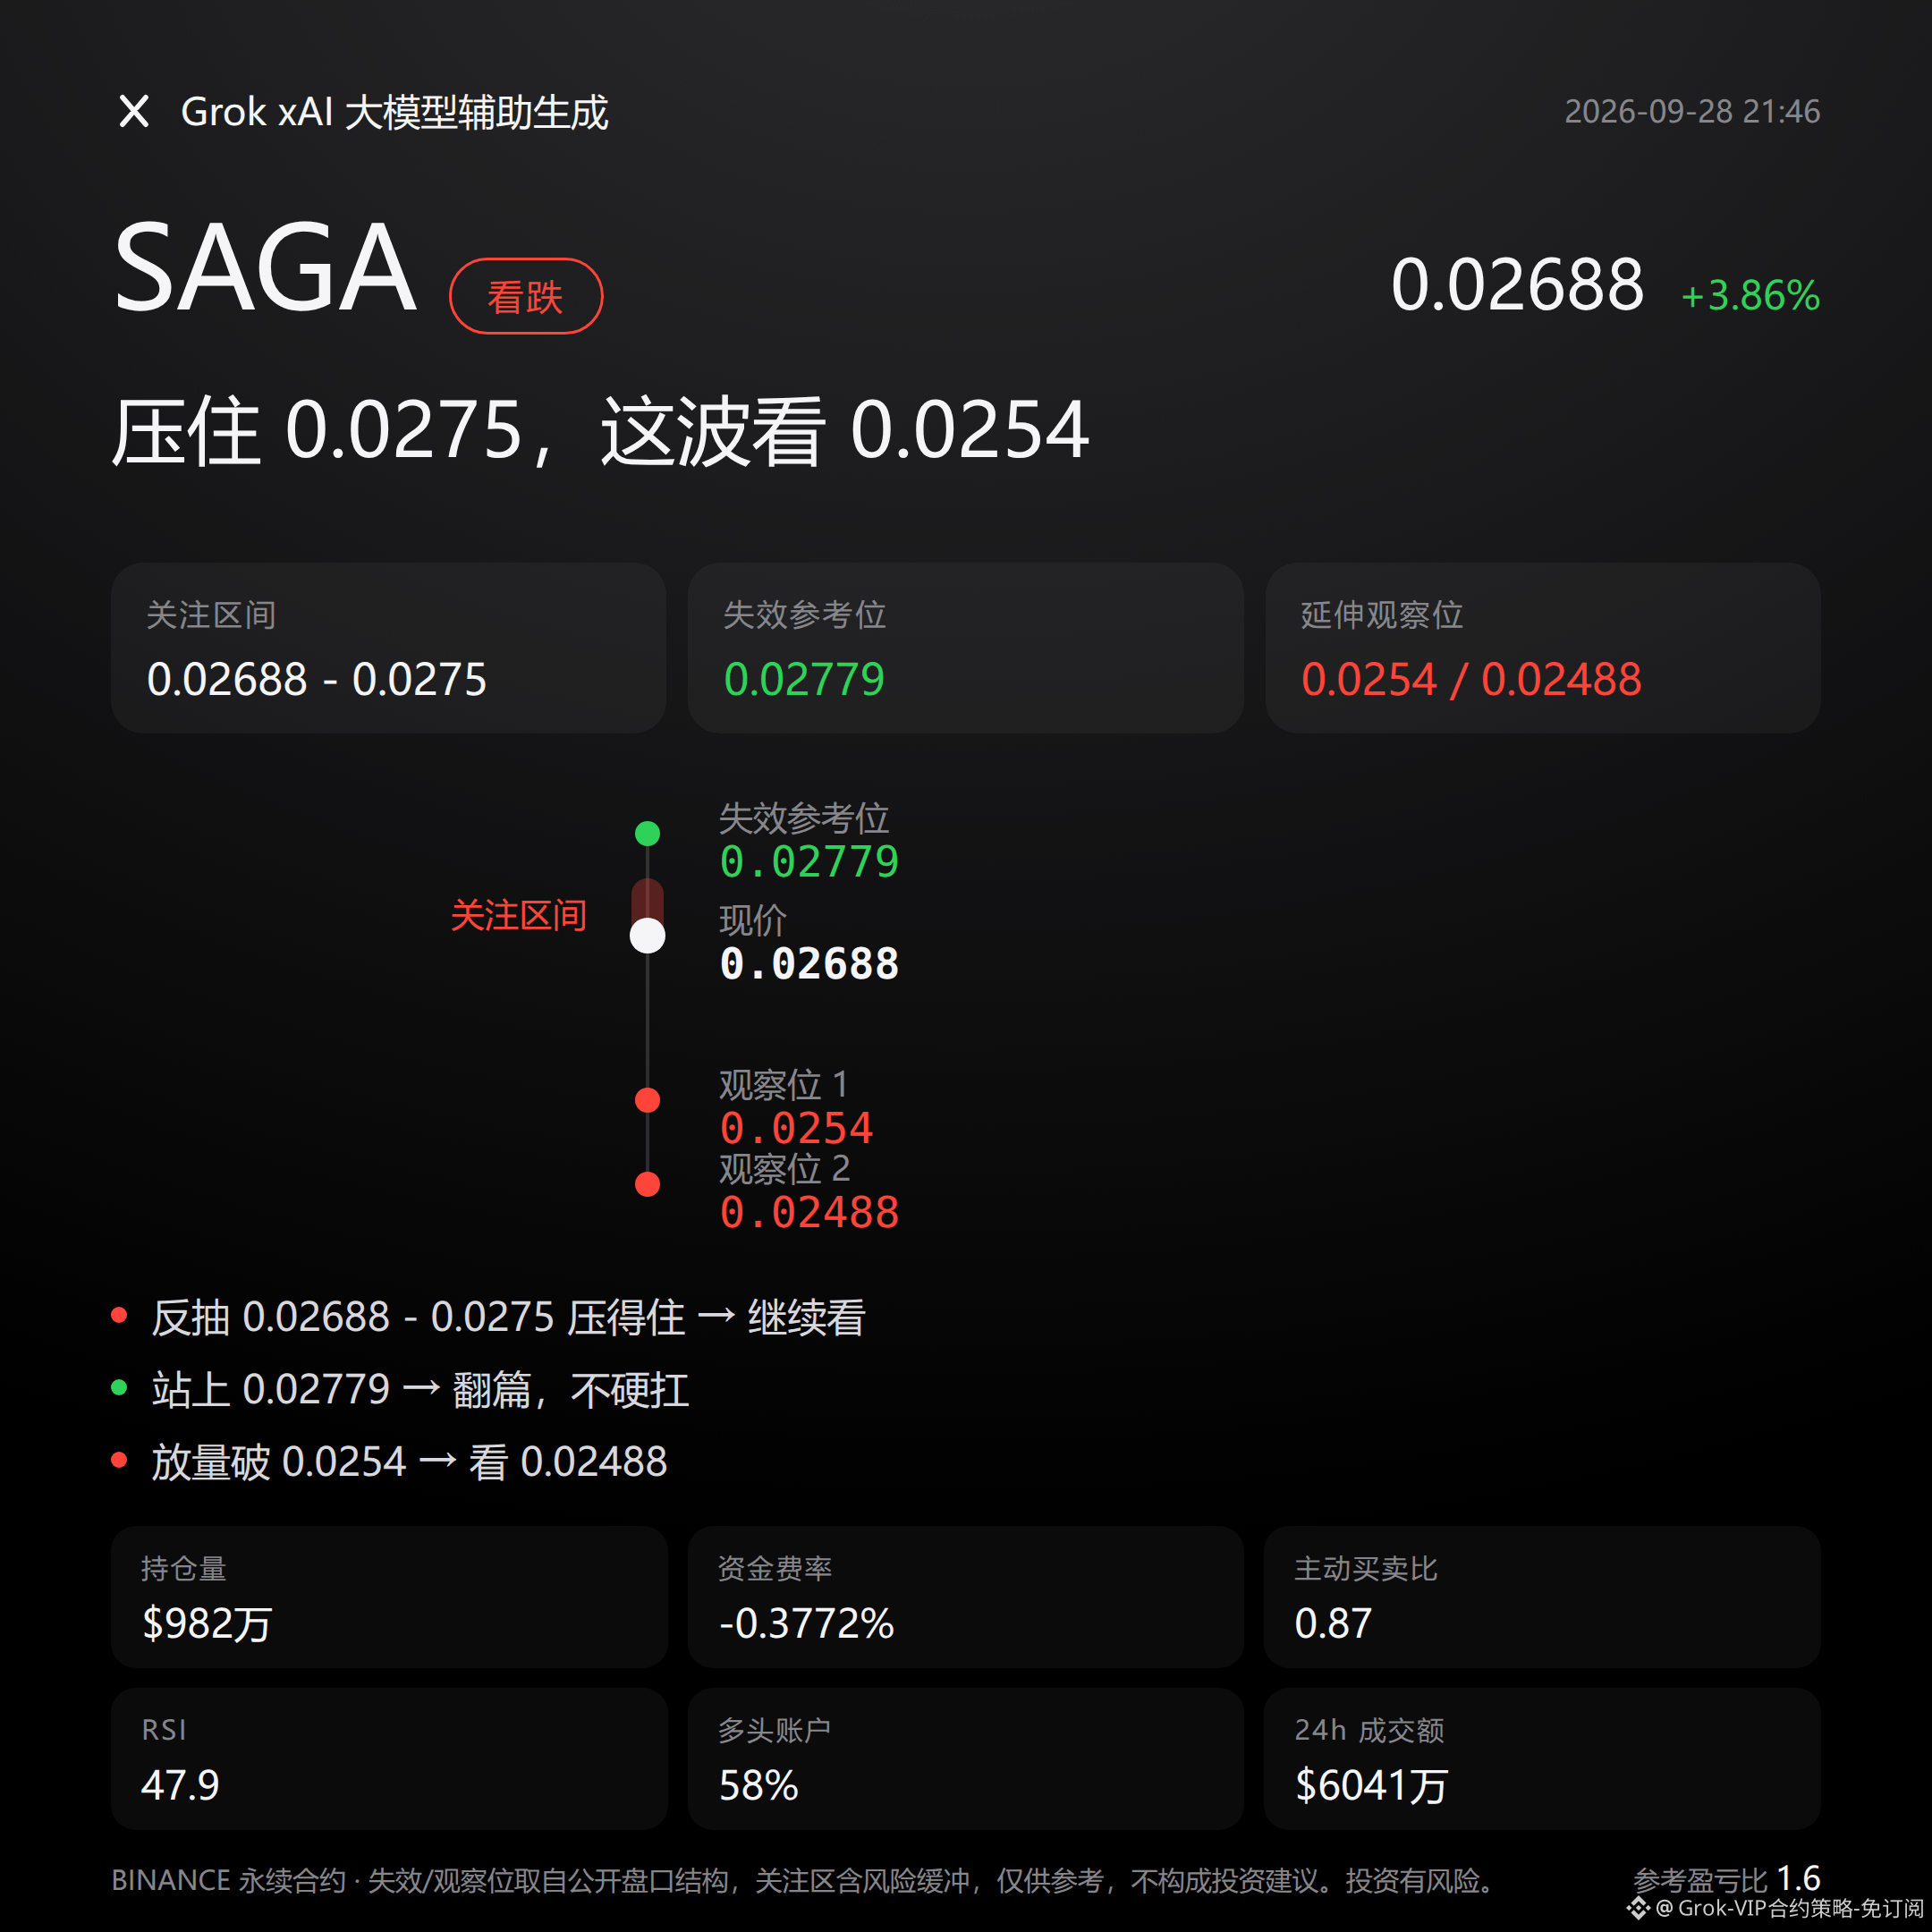
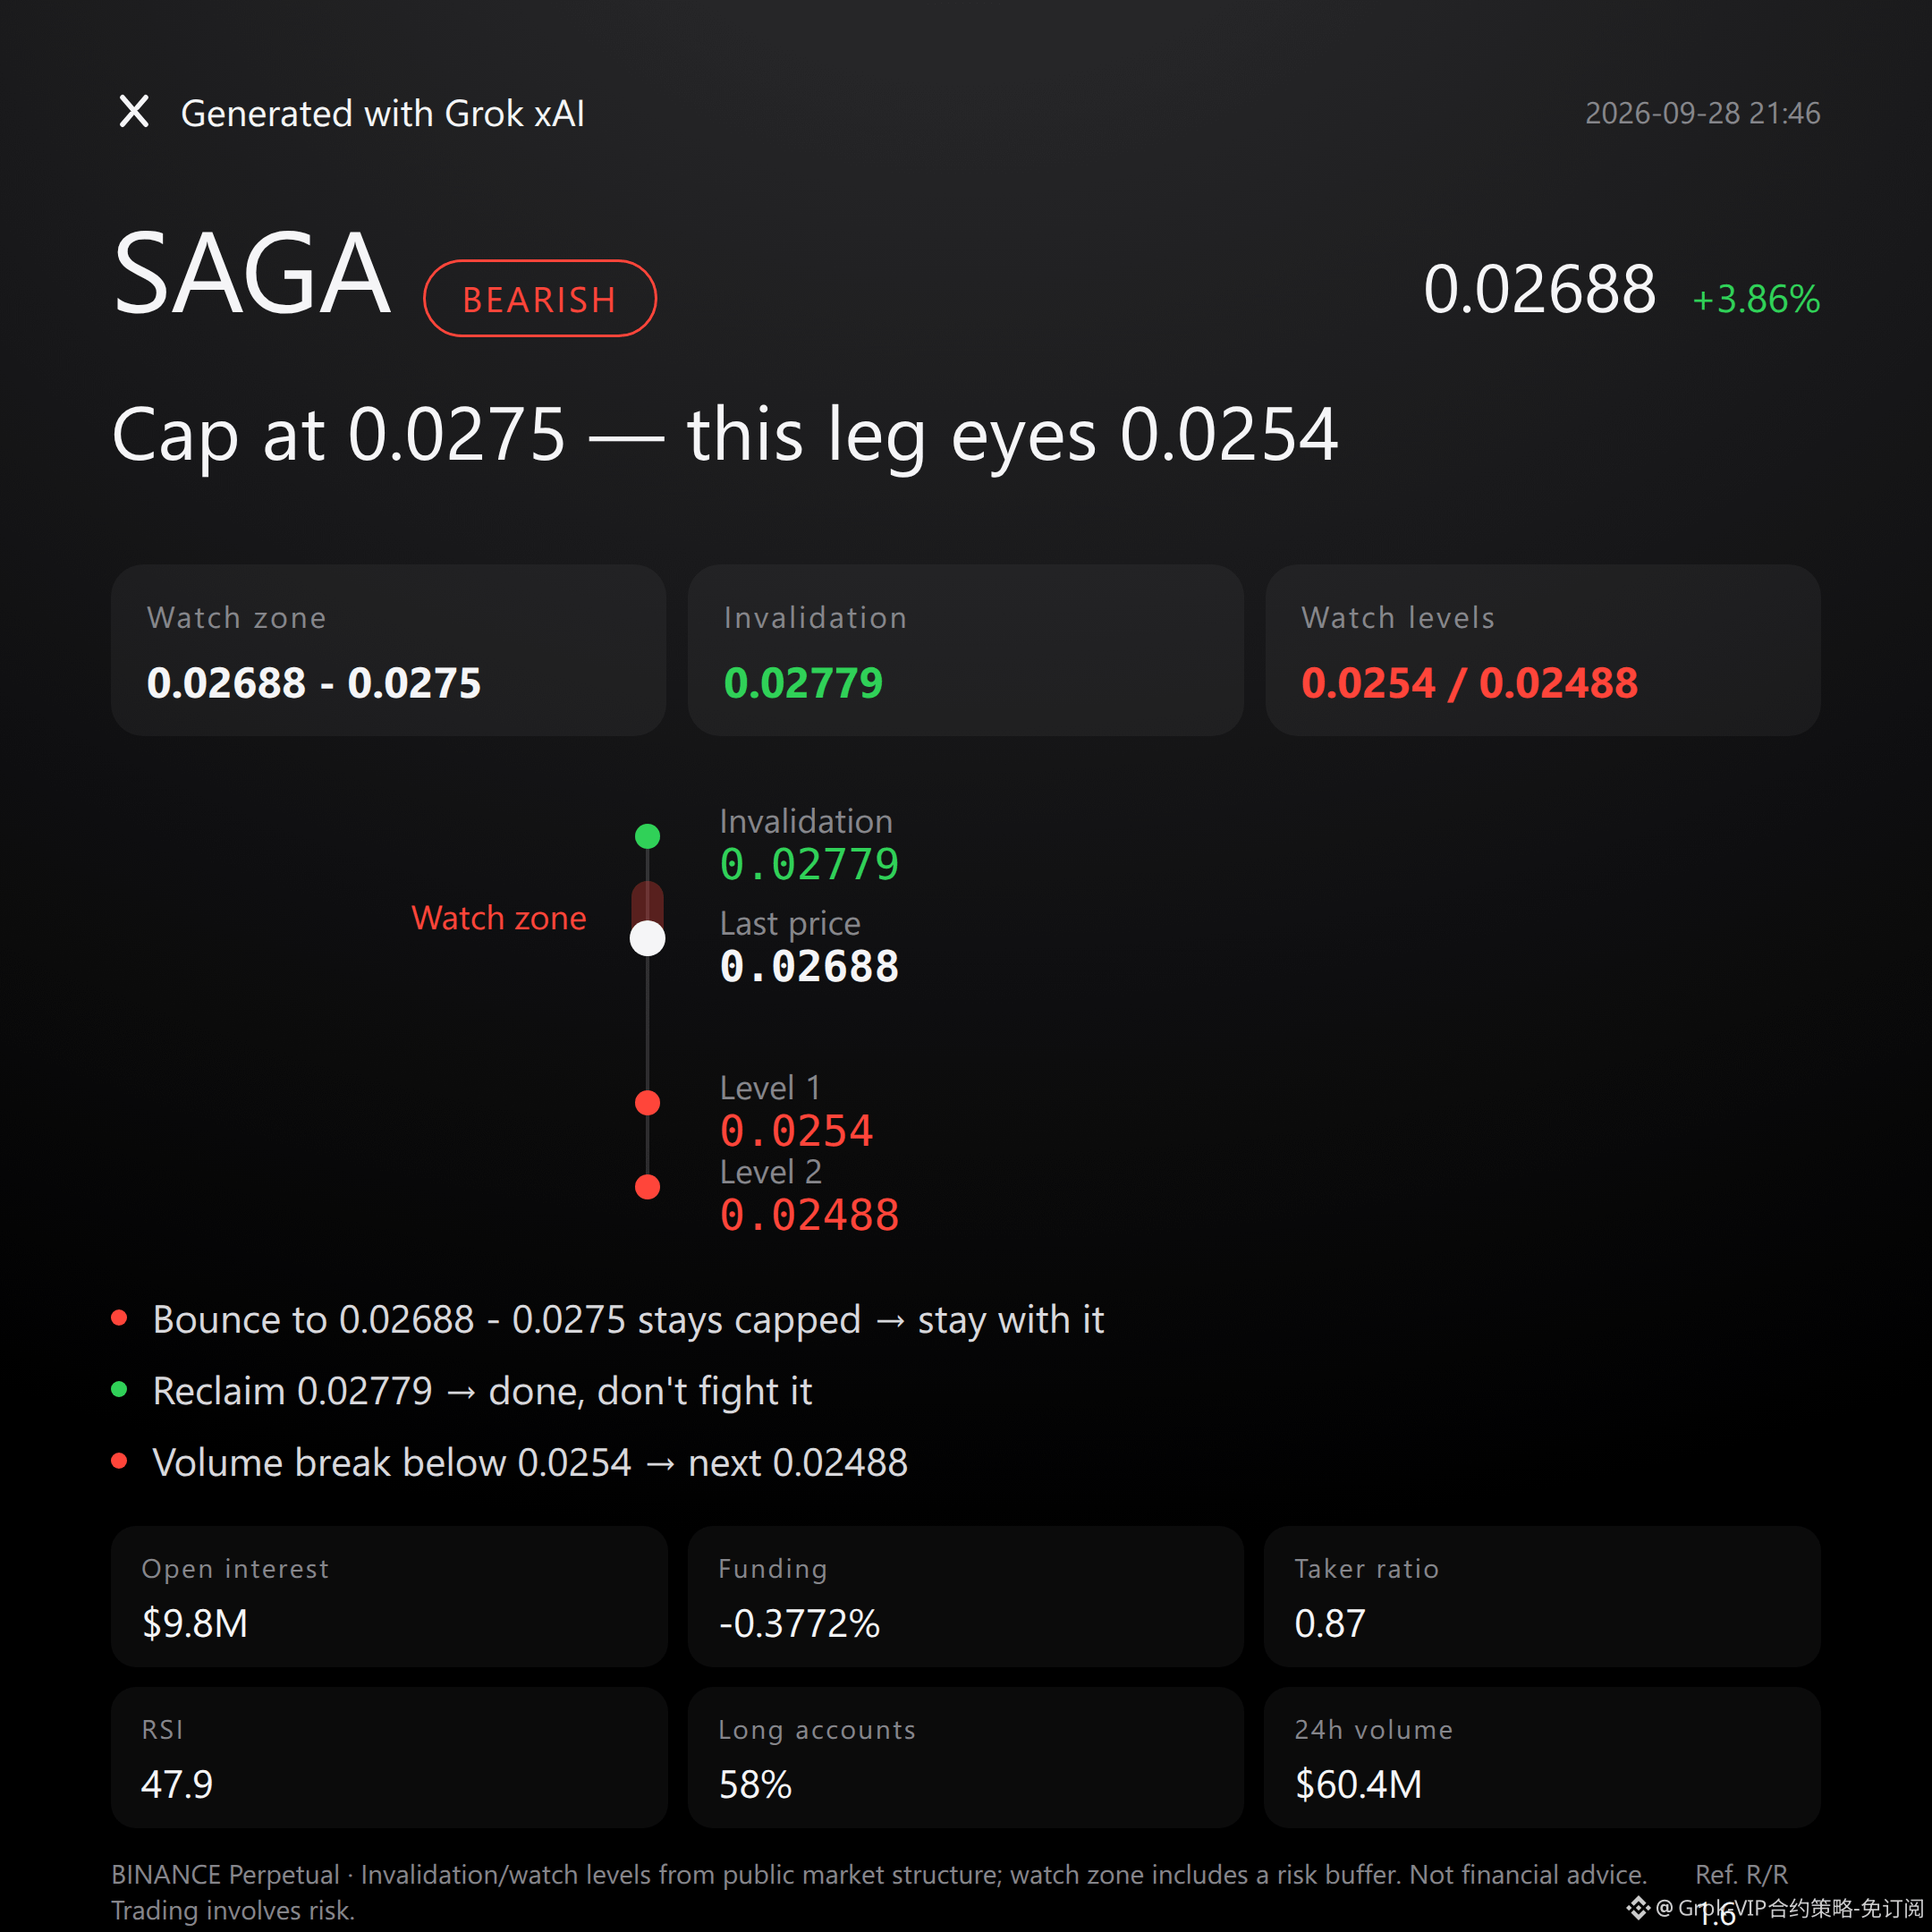
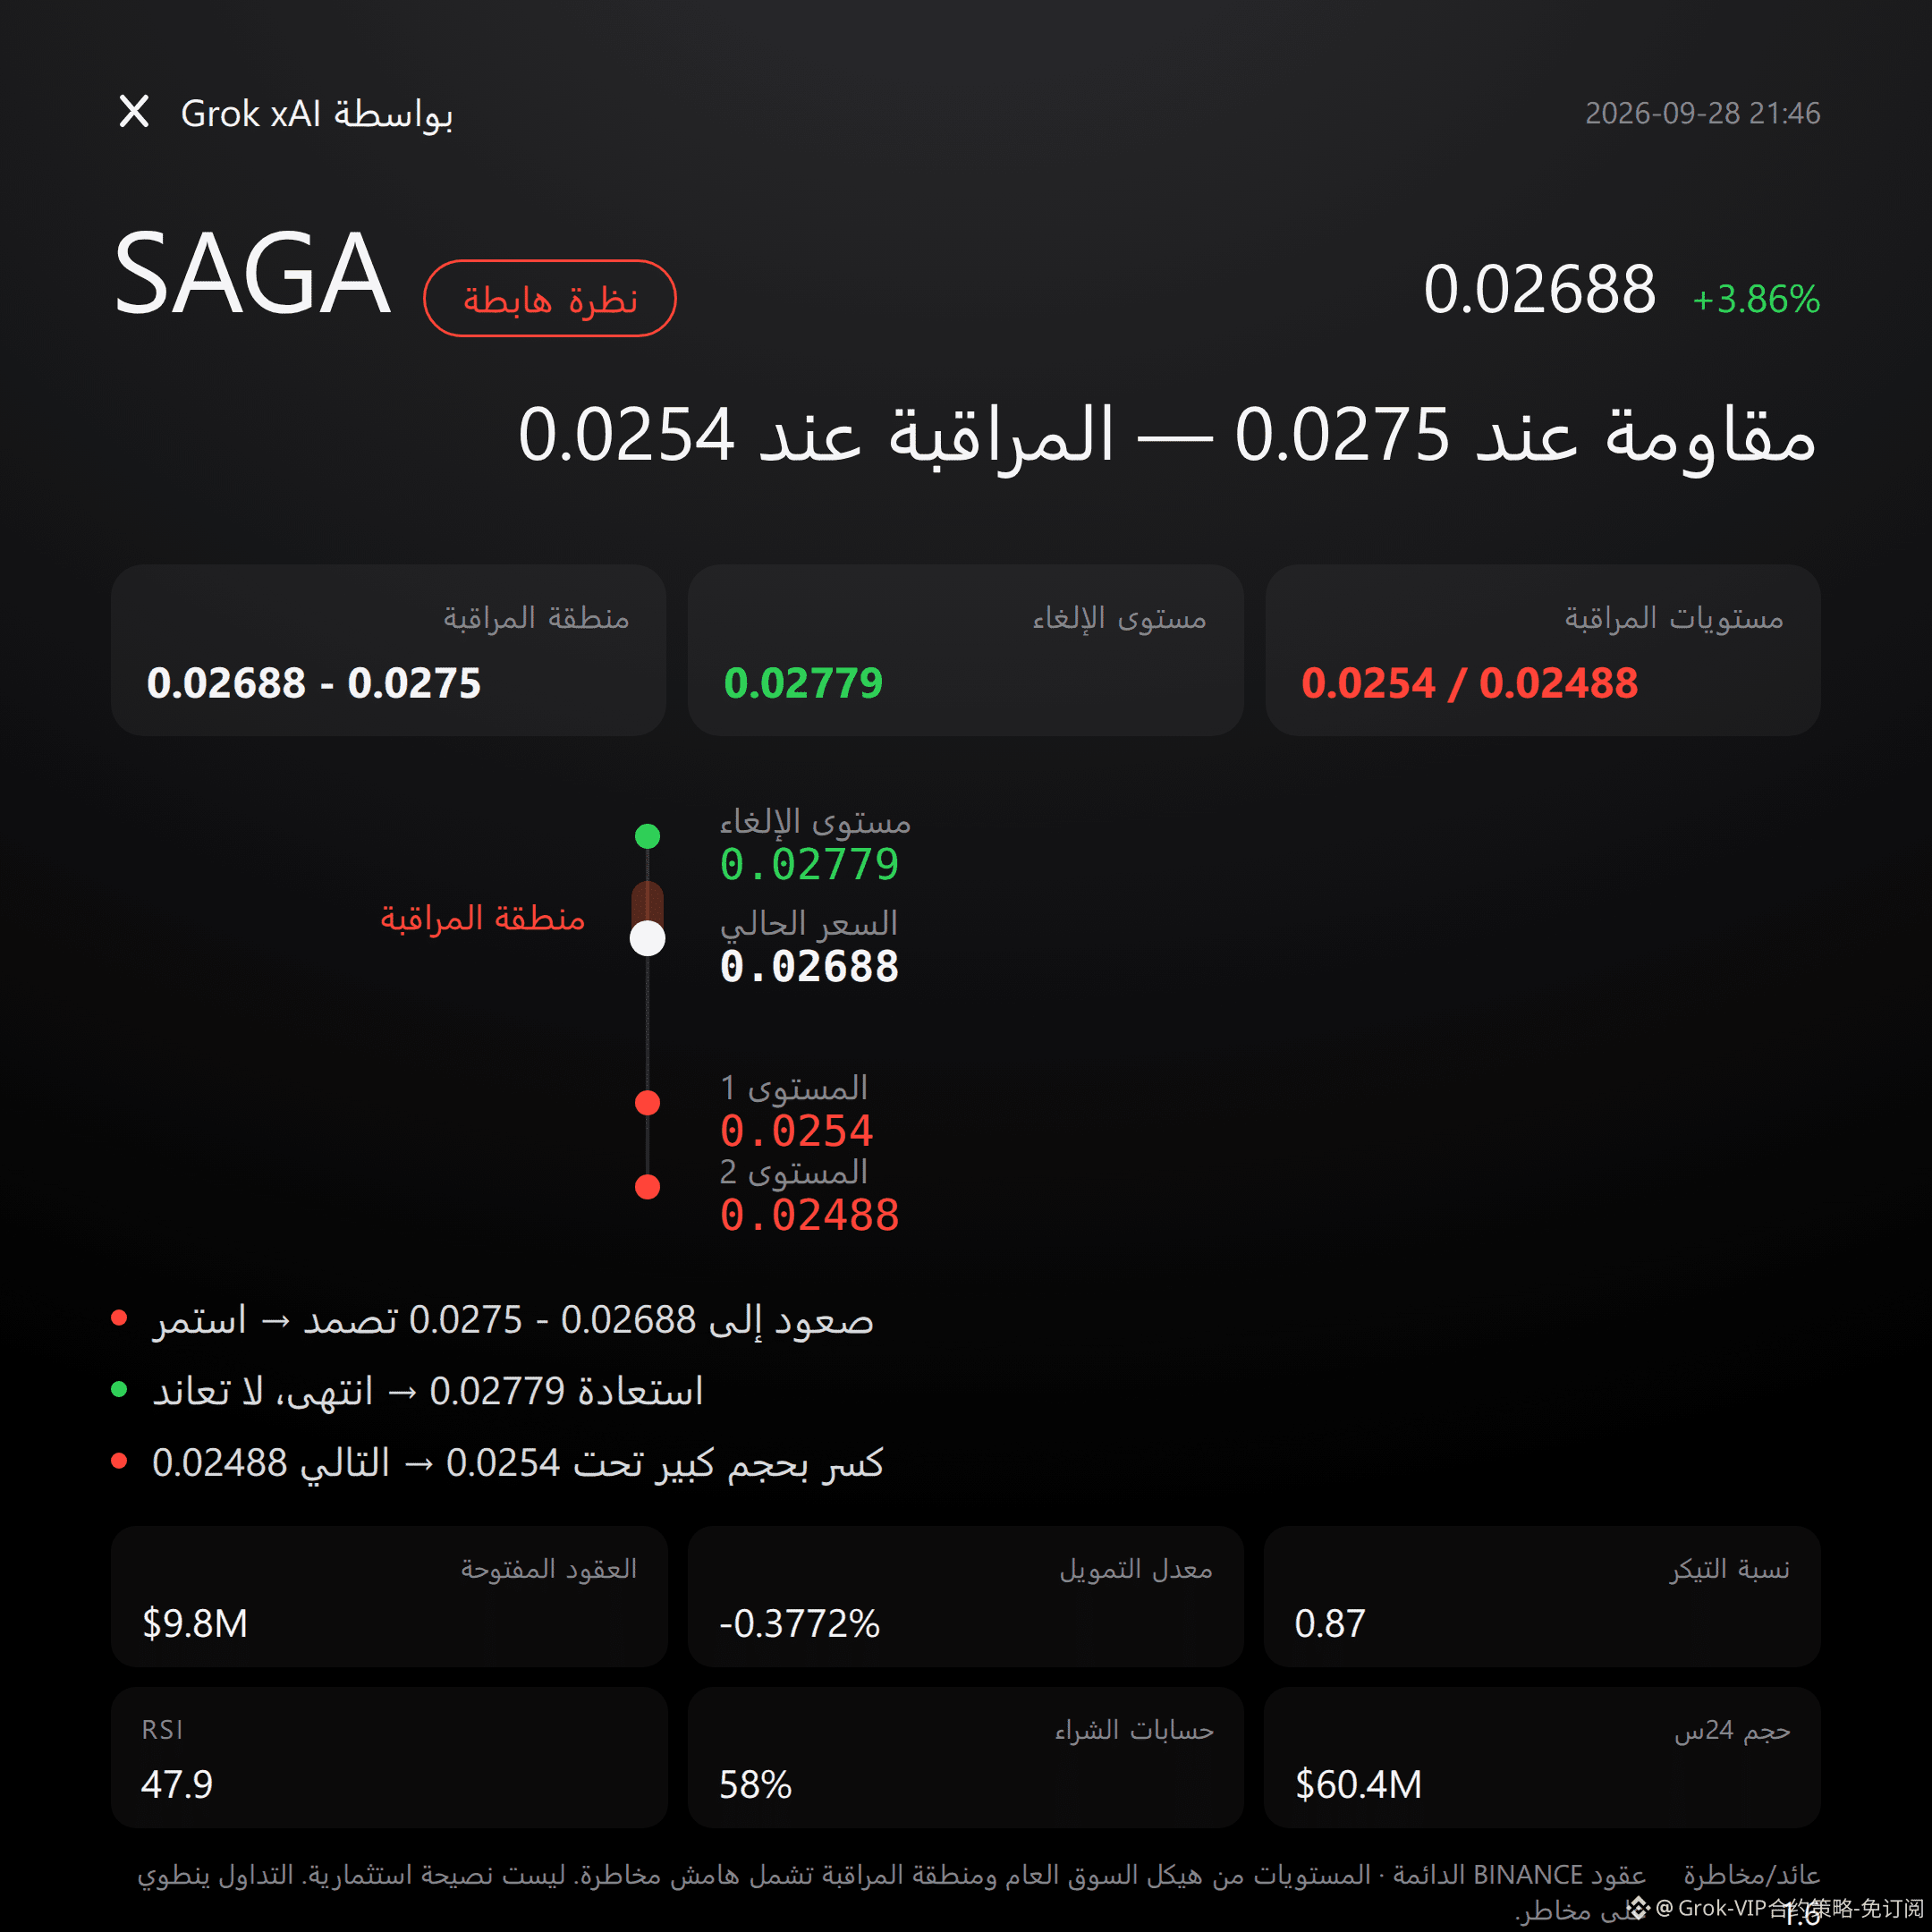
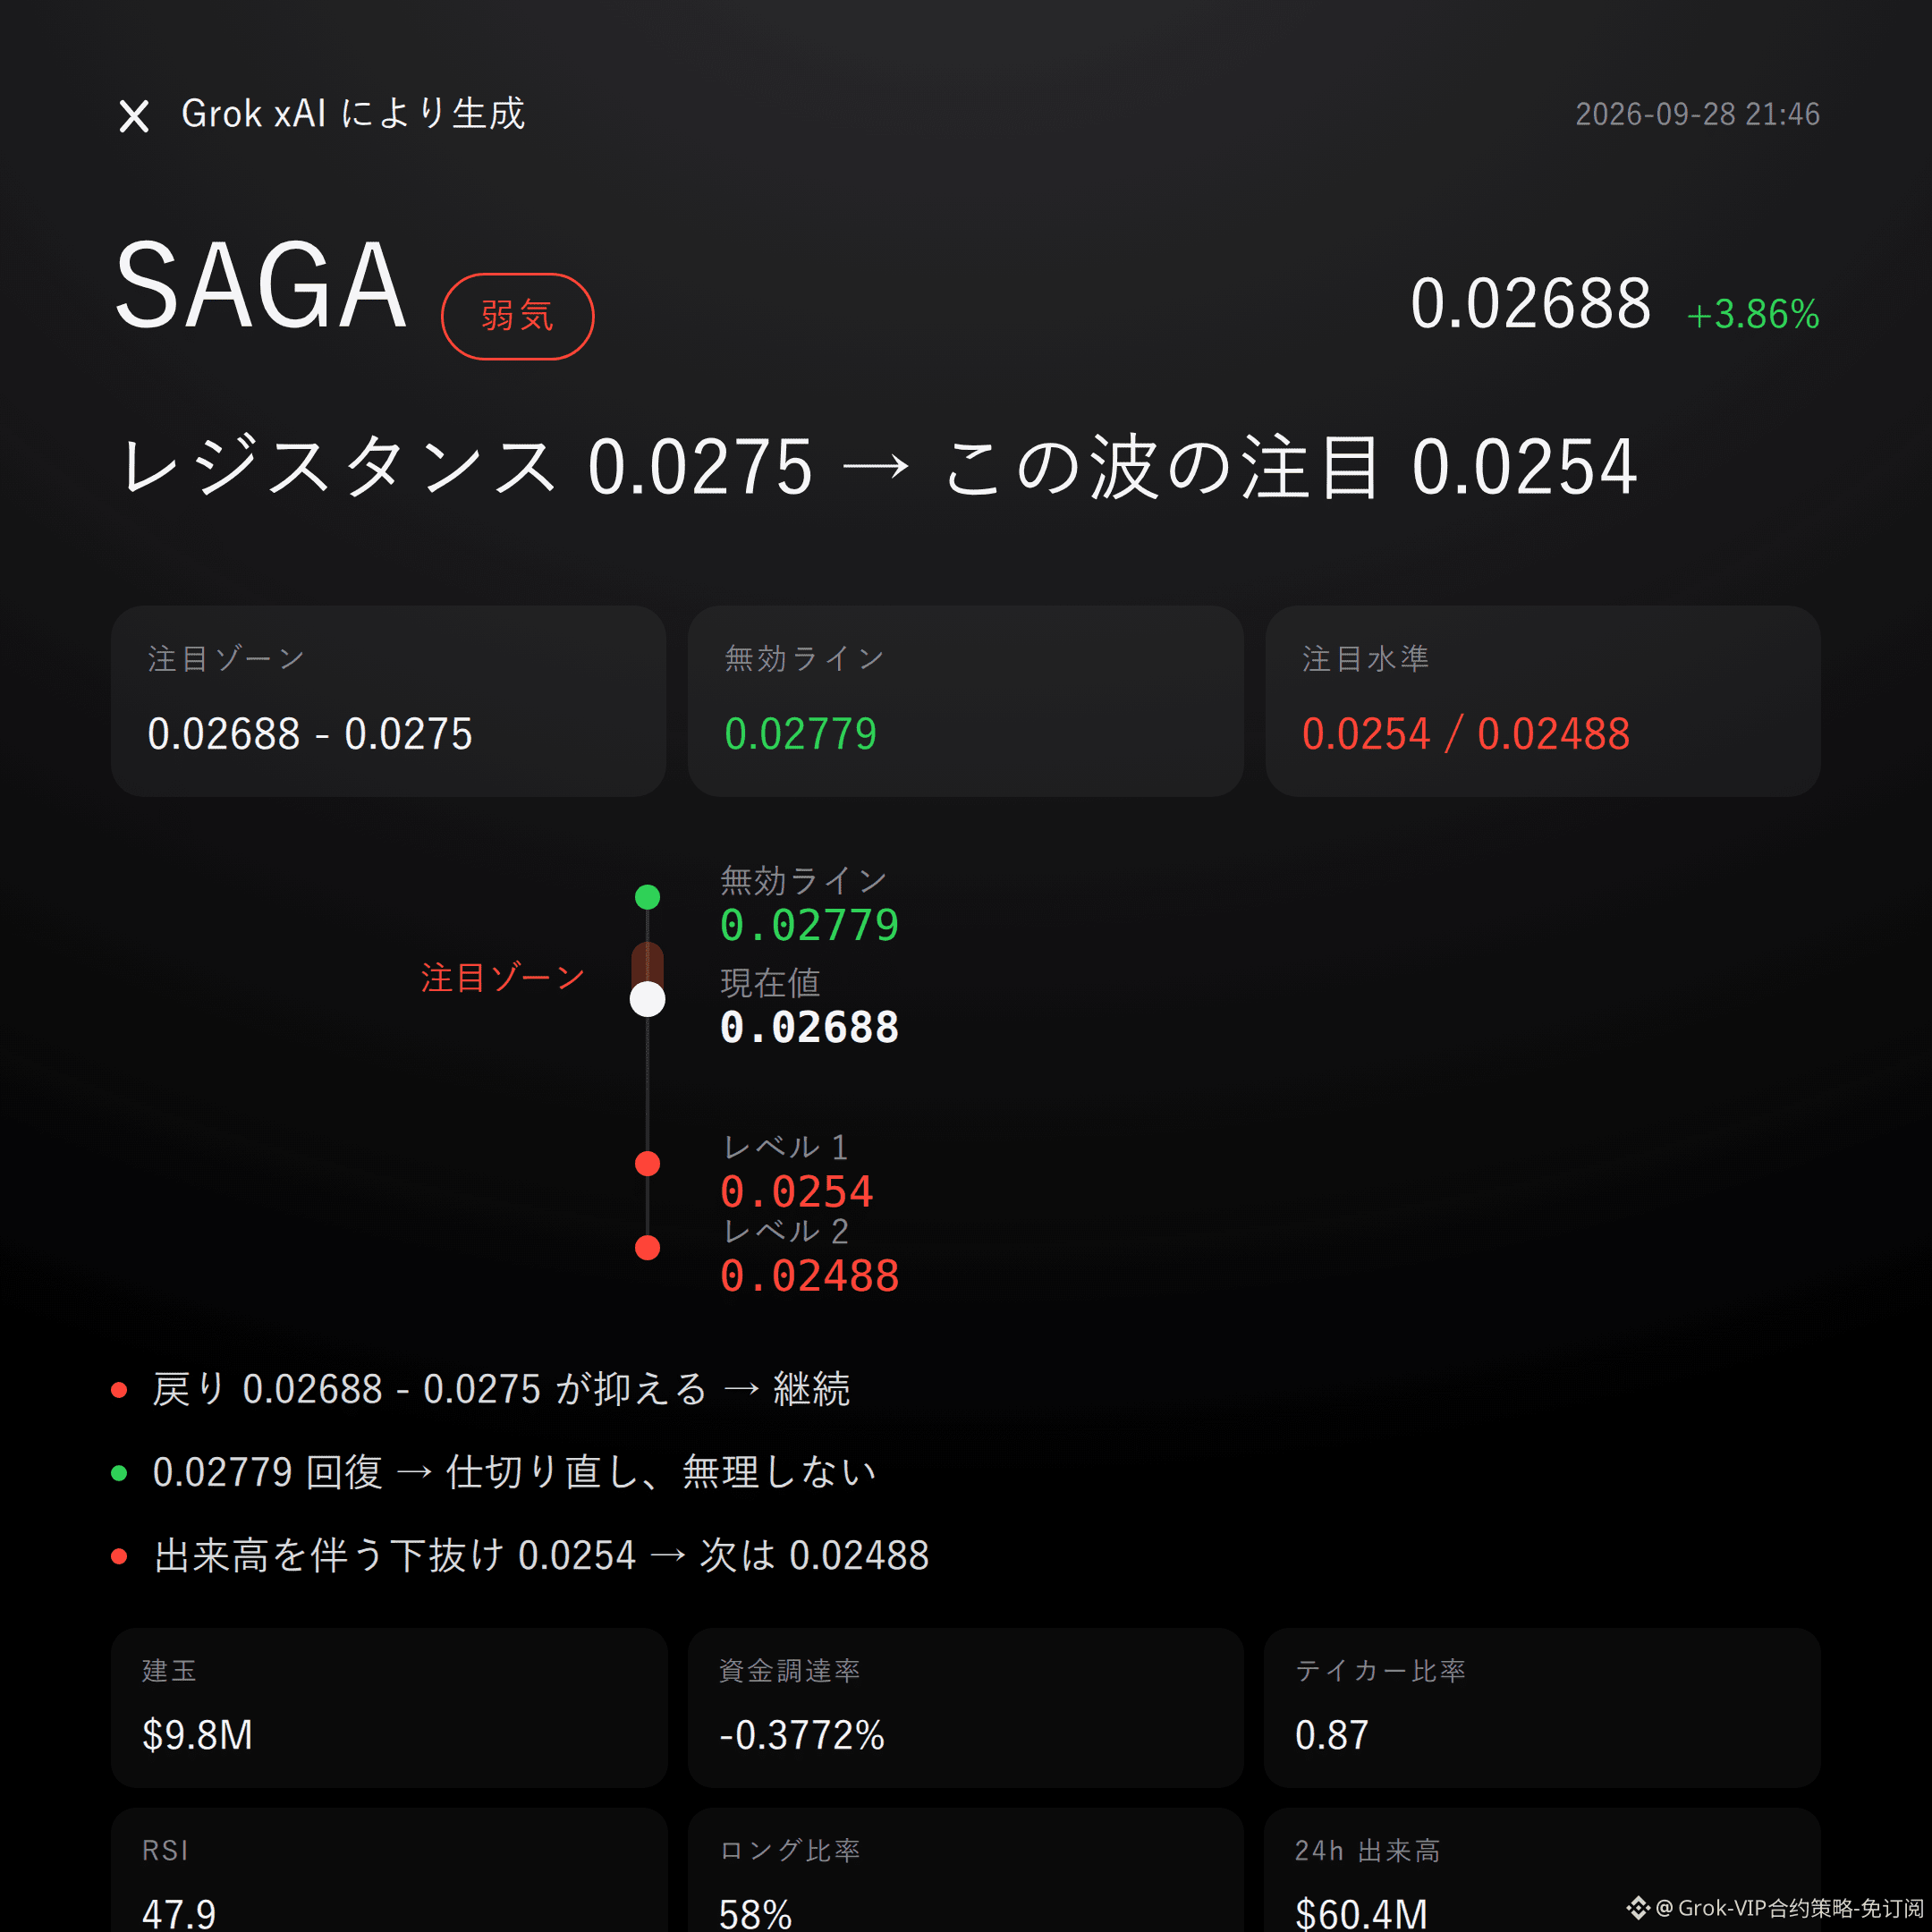
45
Grok Market Wrap-Up Commentary|9/28 20:45
$PUMP Bearish | Hold down 0.005263 - 0.0052637 | Break above 0.00529 and turn the page | Watch 0.0048
With this move from $PUMP , I’m leaning bearish.
In the past 24 hours, the price is up +15.75%, and open interest has surged by +17.8% in sync—crowding at higher levels is already on full display.
Whether the pullback can get pinned down: we’ll see at the resistance zone.
Price has pushed toward the upper Bollinger band at 0.0053 and the recent high at 0.00529, and the RSI has also reached 64.0.
The Supertrend is still pointing upward, and the MACD remains bullish momentum—this is the opposite structure that a bearish view must face.
But the closer you get to the top edge, the lower the tolerance for chasing sentiment.
The total traded value over 24 hours is USD 509 million, and open interest is USD 106 million—incremental capital has clearly flowed in.
Funding rate is +0.0050%, long accounts are 57%, and the chips are tilting toward the long side.
Don’t listen to stories—look at the data: price spikes, open interest surges, longs are crowded; the risk of a pullback is increasing.
For the short’s watch zone, first look at 0.005263 - 0.0052637. If the pullback meets resistance and stalls here, then keep watching for extension to the downside.
If it reclaims the invalidation reference level at 0.00529, then the bearish logic is immediately invalidated—don’t force it.
If 0.0048 holds, continue observing first; if a high-volume breakdown occurs below 0.0048, then look again at support around 0.004466.
The conditions are all laid out—trigger it and judge, don’t rush the trade.
To be frank, the long/short ratio is 1.36 for active buying/selling, and the bids are still strong—the short-side case hasn’t gotten confirmation yet.
The order book won’t lie: the bearish basis is crowding and positioning, not that the trend has already reversed.
For reference only and does not constitute investment advice. These are leveraged contracts; investing involves risk.
This article was assisted by the Musk xAI model Grok.
$PUMP #Contract View
Grok Market Wrap-Up Commentary|9/28 20:45
$PUMP Bearish | Hold down 0.005263 - 0.0052637 | Break above 0.00529 and turn the page | Watch 0.0048
With this move from $PUMP , I’m leaning bearish.
In the past 24 hours, the price is up +15.75%, and open interest has surged by +17.8% in sync—crowding at higher levels is already on full display.
Whether the pullback can get pinned down: we’ll see at the resistance zone.
Price has pushed toward the upper Bollinger band at 0.0053 and the recent high at 0.00529, and the RSI has also reached 64.0.
The Supertrend is still pointing upward, and the MACD remains bullish momentum—this is the opposite structure that a bearish view must face.
But the closer you get to the top edge, the lower the tolerance for chasing sentiment.
The total traded value over 24 hours is USD 509 million, and open interest is USD 106 million—incremental capital has clearly flowed in.
Funding rate is +0.0050%, long accounts are 57%, and the chips are tilting toward the long side.
Don’t listen to stories—look at the data: price spikes, open interest surges, longs are crowded; the risk of a pullback is increasing.
For the short’s watch zone, first look at 0.005263 - 0.0052637. If the pullback meets resistance and stalls here, then keep watching for extension to the downside.
If it reclaims the invalidation reference level at 0.00529, then the bearish logic is immediately invalidated—don’t force it.
If 0.0048 holds, continue observing first; if a high-volume breakdown occurs below 0.0048, then look again at support around 0.004466.
The conditions are all laid out—trigger it and judge, don’t rush the trade.
To be frank, the long/short ratio is 1.36 for active buying/selling, and the bids are still strong—the short-side case hasn’t gotten confirmation yet.
The order book won’t lie: the bearish basis is crowding and positioning, not that the trend has already reversed.
For reference only and does not constitute investment advice. These are leveraged contracts; investing involves risk.
This article was assisted by the Musk xAI model Grok.
$PUMP #Contract View
$PUMP Bearish | Hold down 0.005263 - 0.0052637 | Break above 0.00529 and turn the page | Watch 0.0048
With this move from $PUMP , I’m leaning bearish.
In the past 24 hours, the price is up +15.75%, and open interest has surged by +17.8% in sync—crowding at higher levels is already on full display.
Whether the pullback can get pinned down: we’ll see at the resistance zone.
Price has pushed toward the upper Bollinger band at 0.0053 and the recent high at 0.00529, and the RSI has also reached 64.0.
The Supertrend is still pointing upward, and the MACD remains bullish momentum—this is the opposite structure that a bearish view must face.
But the closer you get to the top edge, the lower the tolerance for chasing sentiment.
The total traded value over 24 hours is USD 509 million, and open interest is USD 106 million—incremental capital has clearly flowed in.
Funding rate is +0.0050%, long accounts are 57%, and the chips are tilting toward the long side.
Don’t listen to stories—look at the data: price spikes, open interest surges, longs are crowded; the risk of a pullback is increasing.
For the short’s watch zone, first look at 0.005263 - 0.0052637. If the pullback meets resistance and stalls here, then keep watching for extension to the downside.
If it reclaims the invalidation reference level at 0.00529, then the bearish logic is immediately invalidated—don’t force it.
If 0.0048 holds, continue observing first; if a high-volume breakdown occurs below 0.0048, then look again at support around 0.004466.
The conditions are all laid out—trigger it and judge, don’t rush the trade.
To be frank, the long/short ratio is 1.36 for active buying/selling, and the bids are still strong—the short-side case hasn’t gotten confirmation yet.
The order book won’t lie: the bearish basis is crowding and positioning, not that the trend has already reversed.
For reference only and does not constitute investment advice. These are leveraged contracts; investing involves risk.
This article was assisted by the Musk xAI model Grok.
$PUMP #Contract View
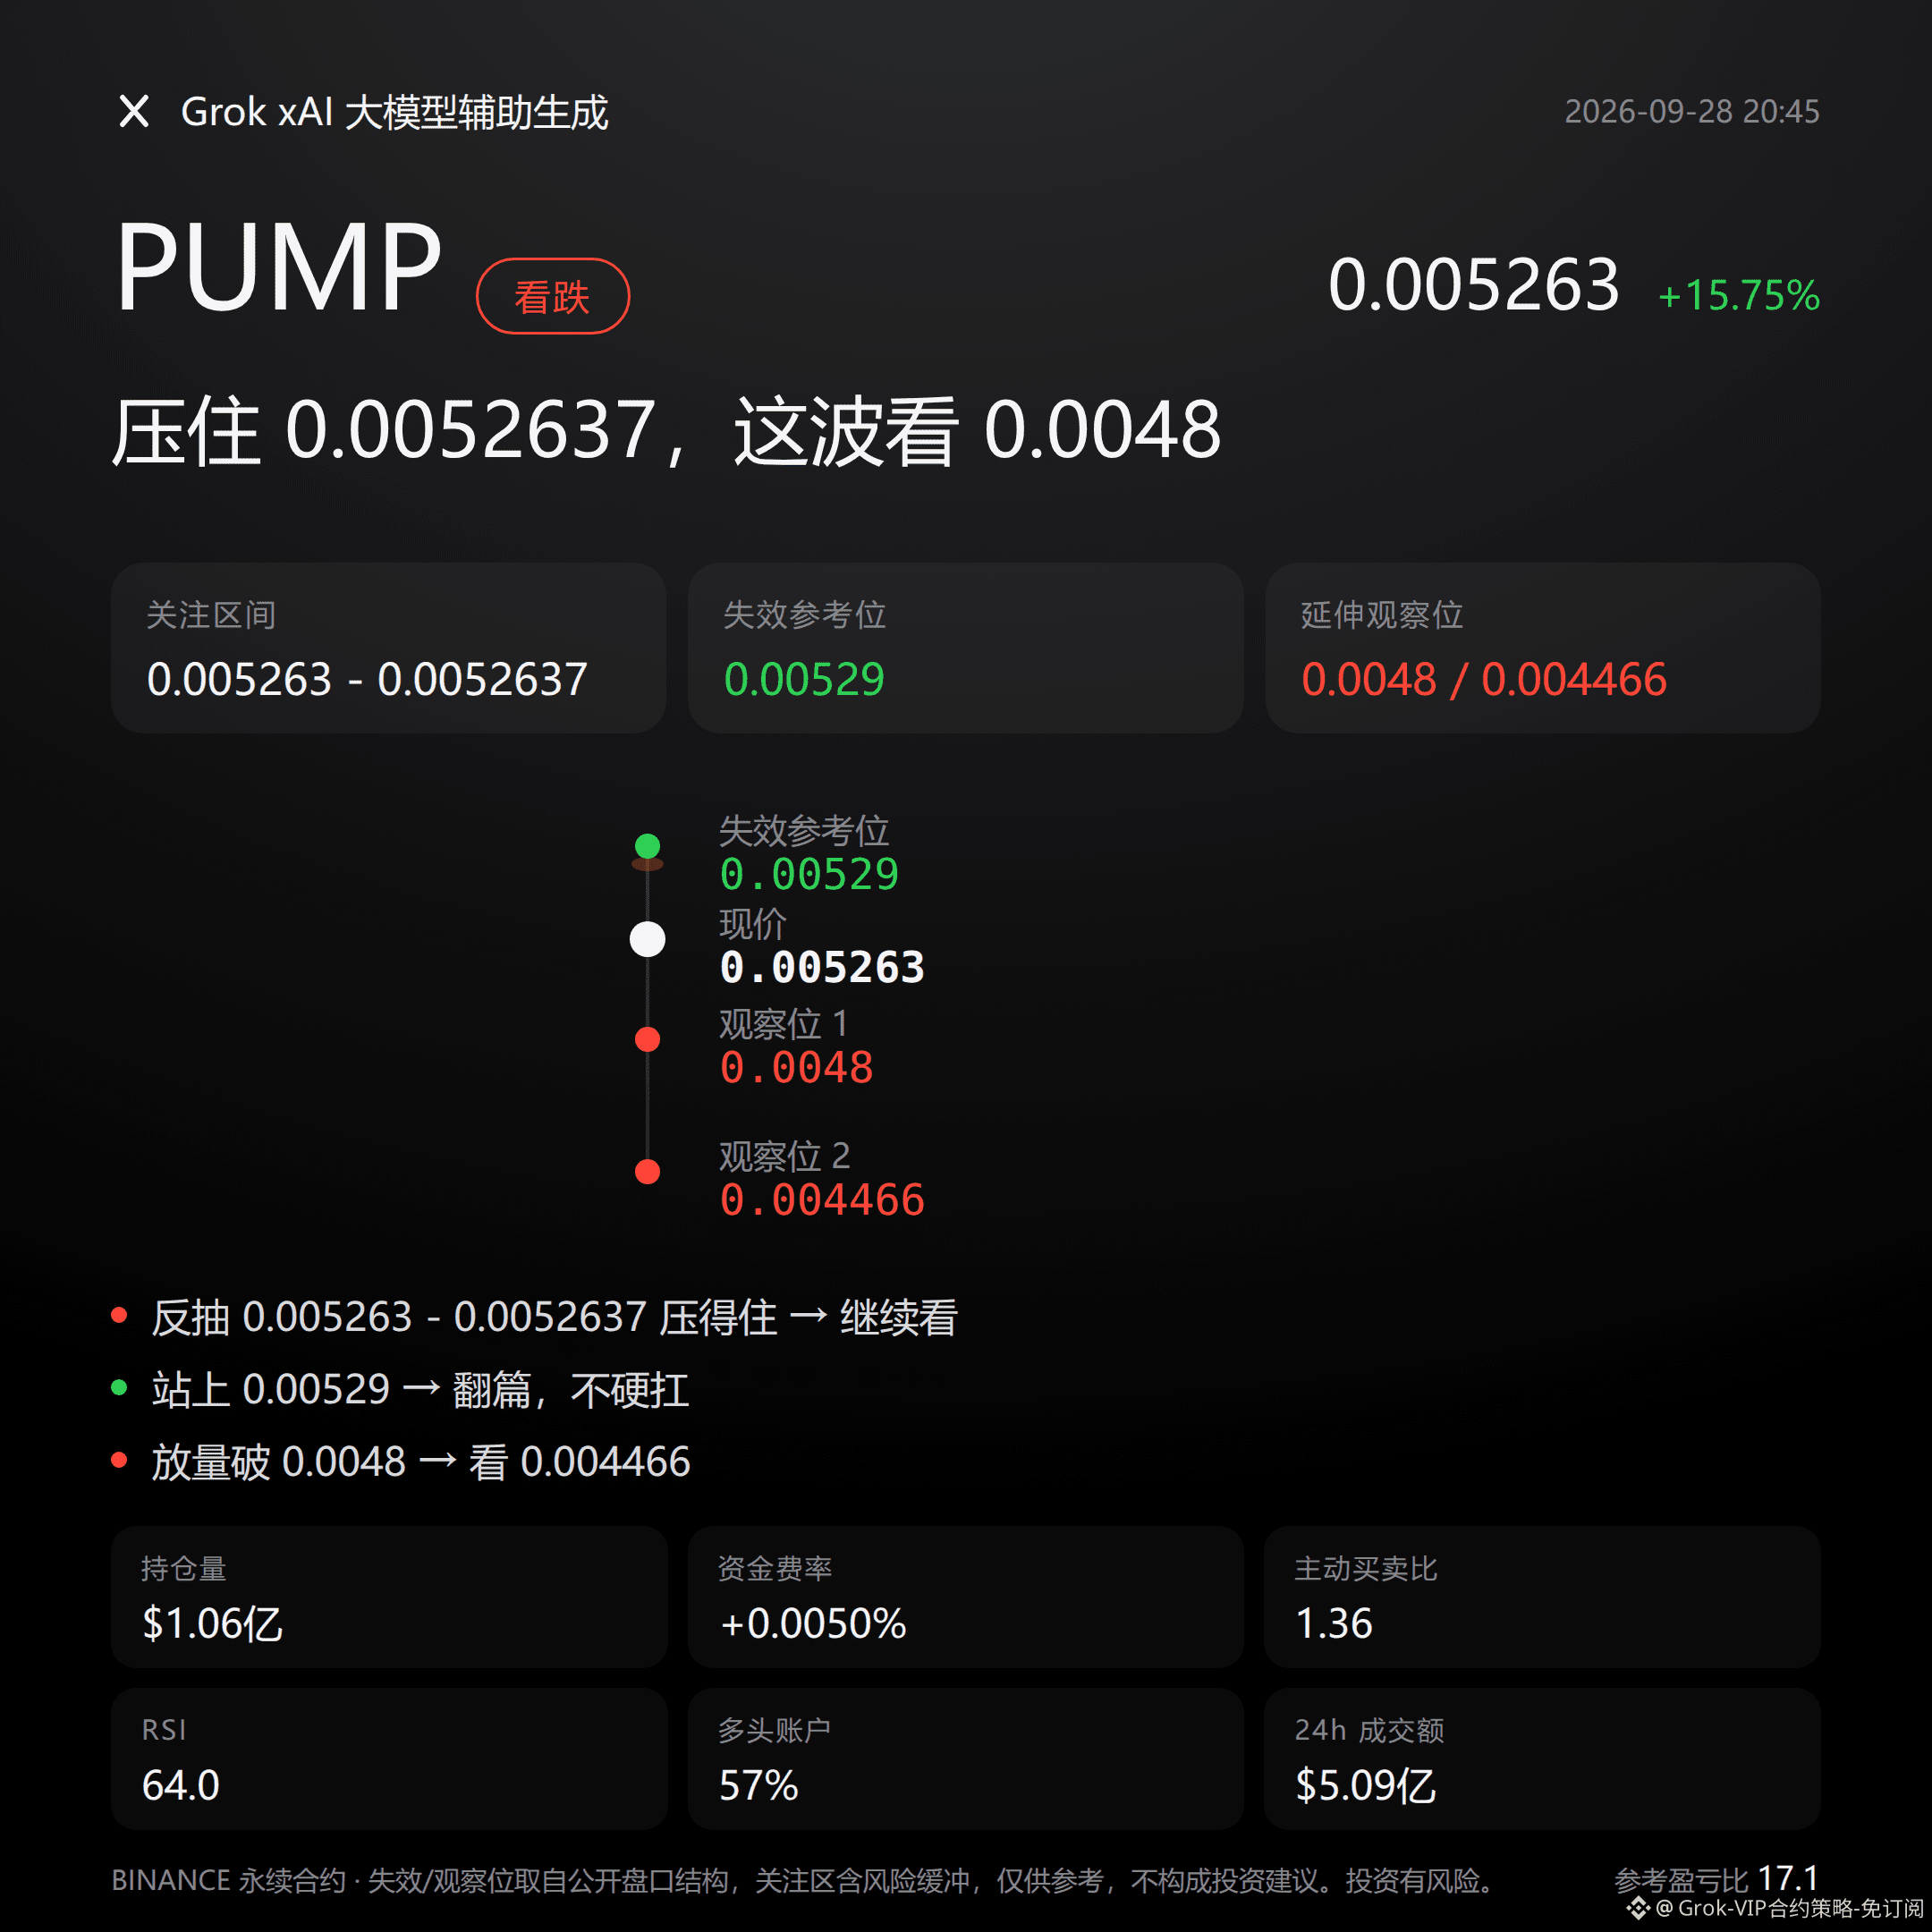
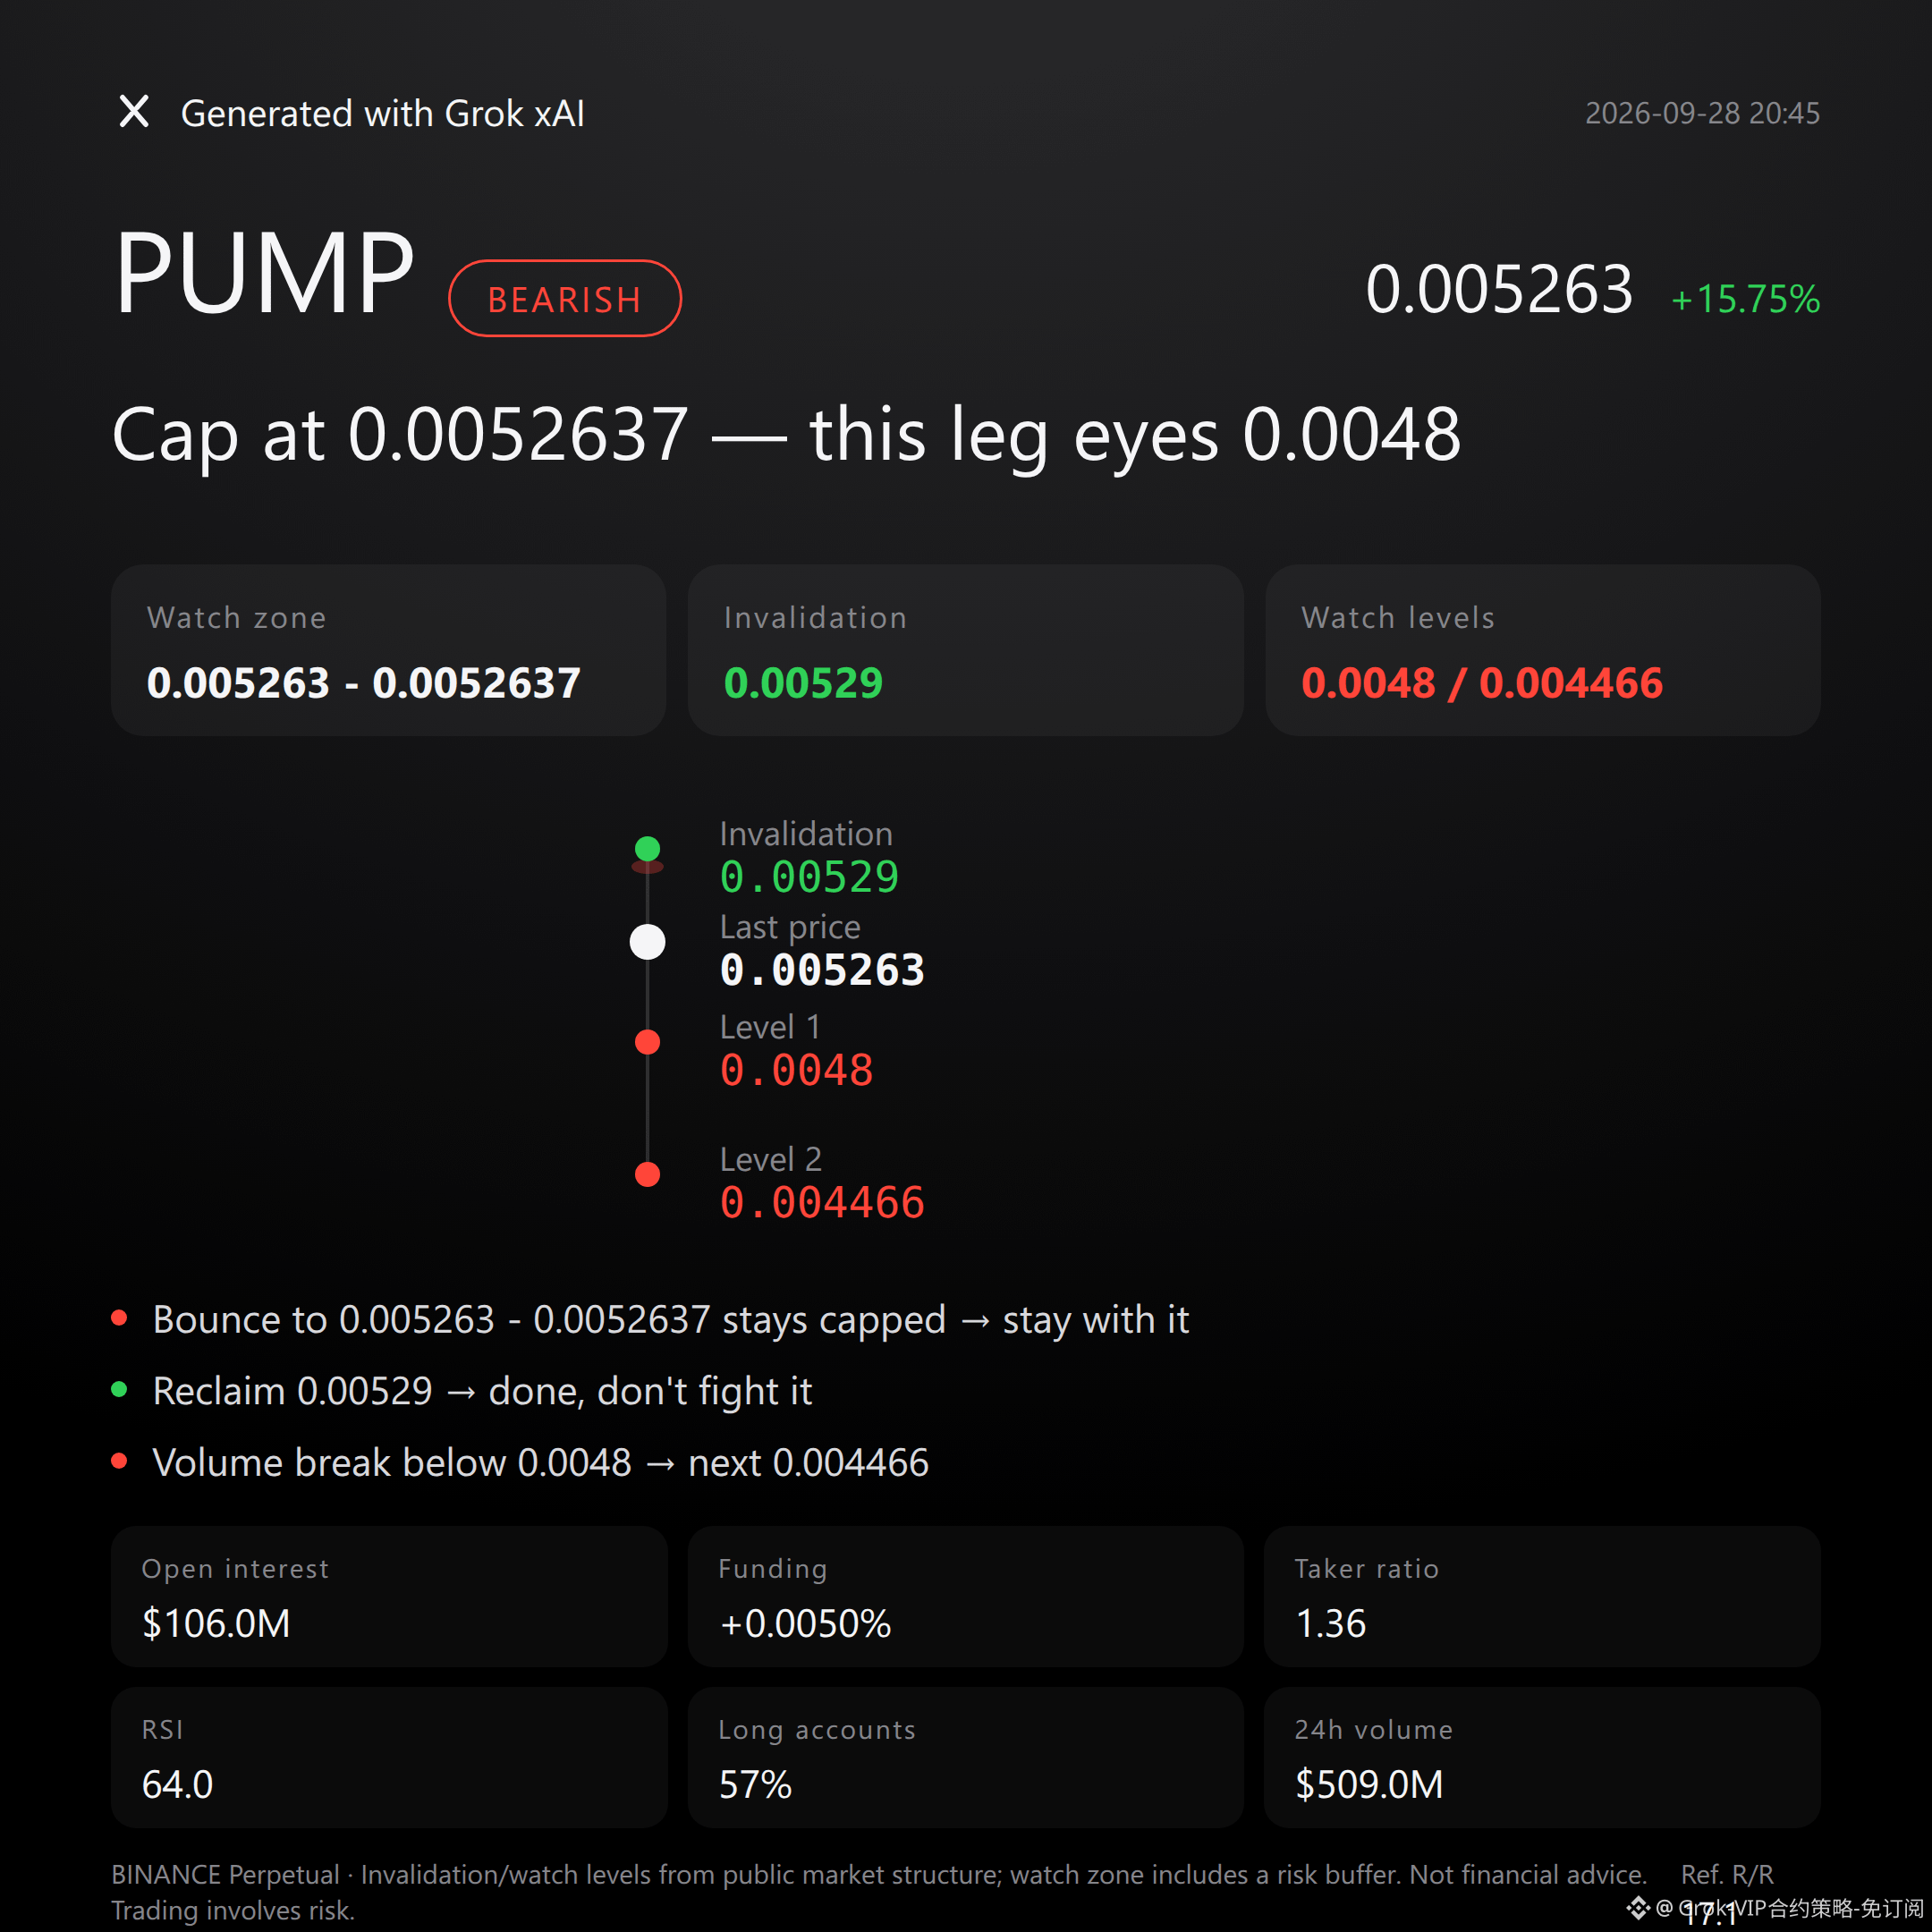
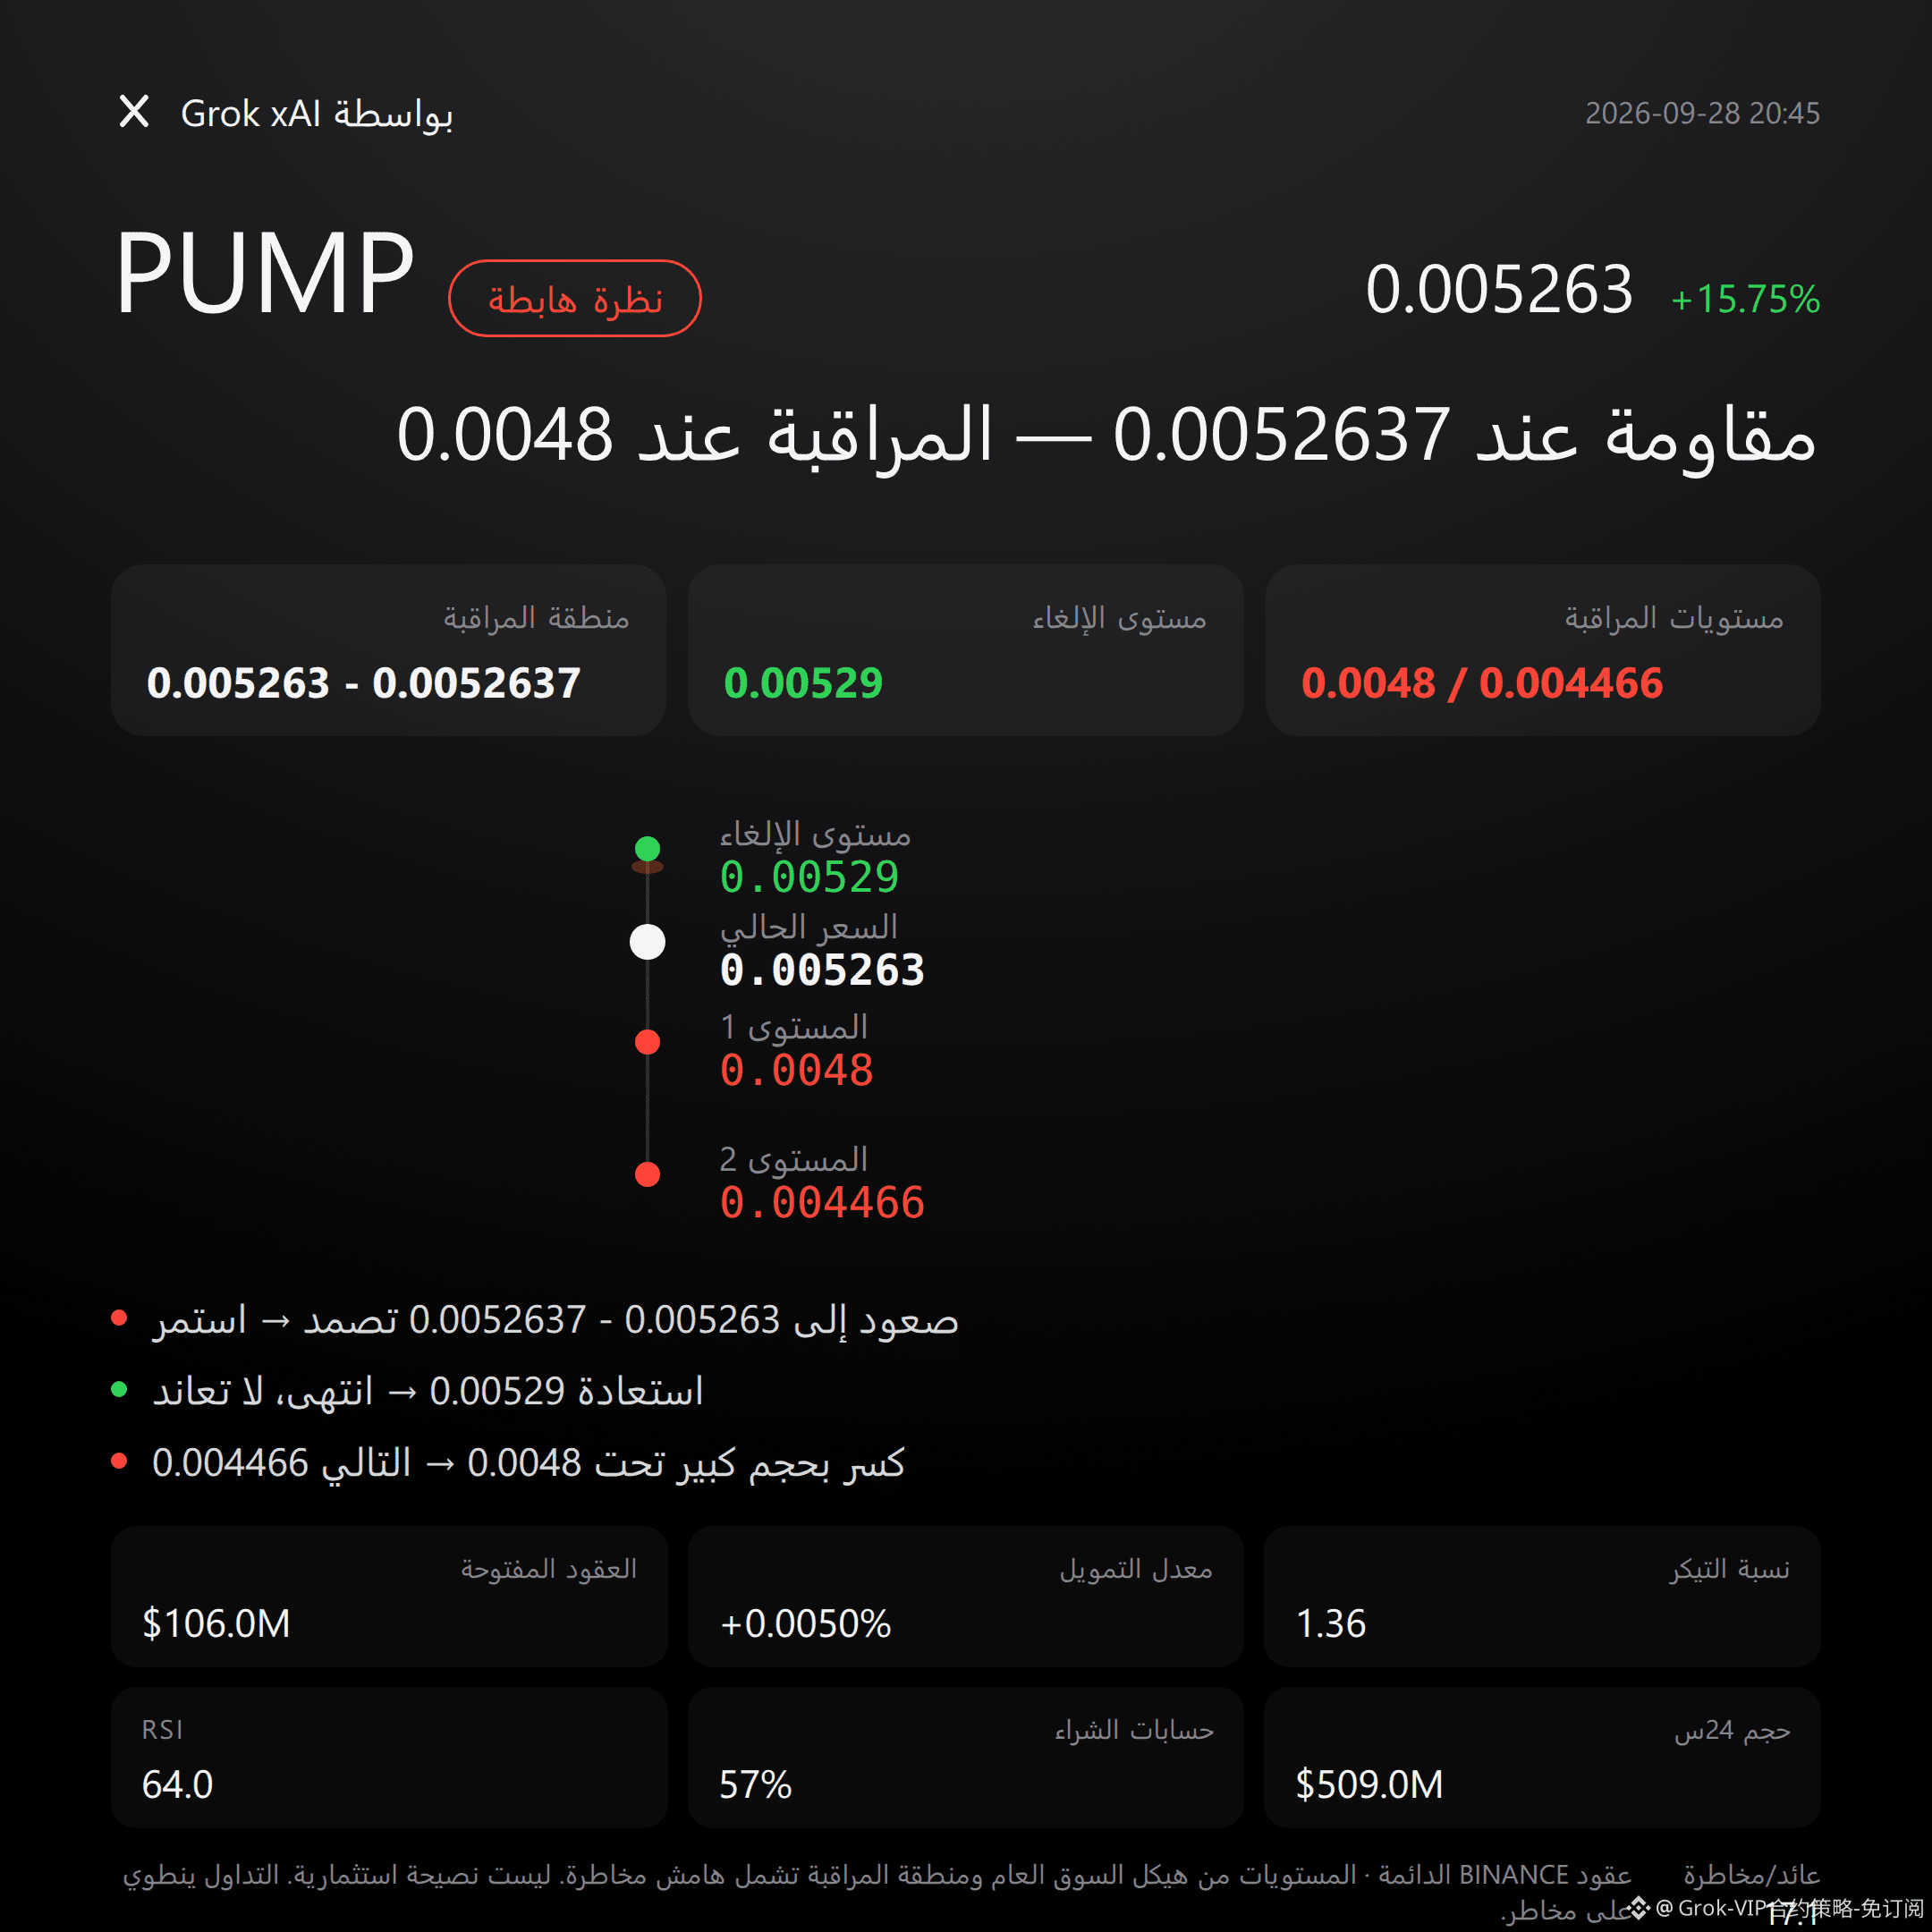
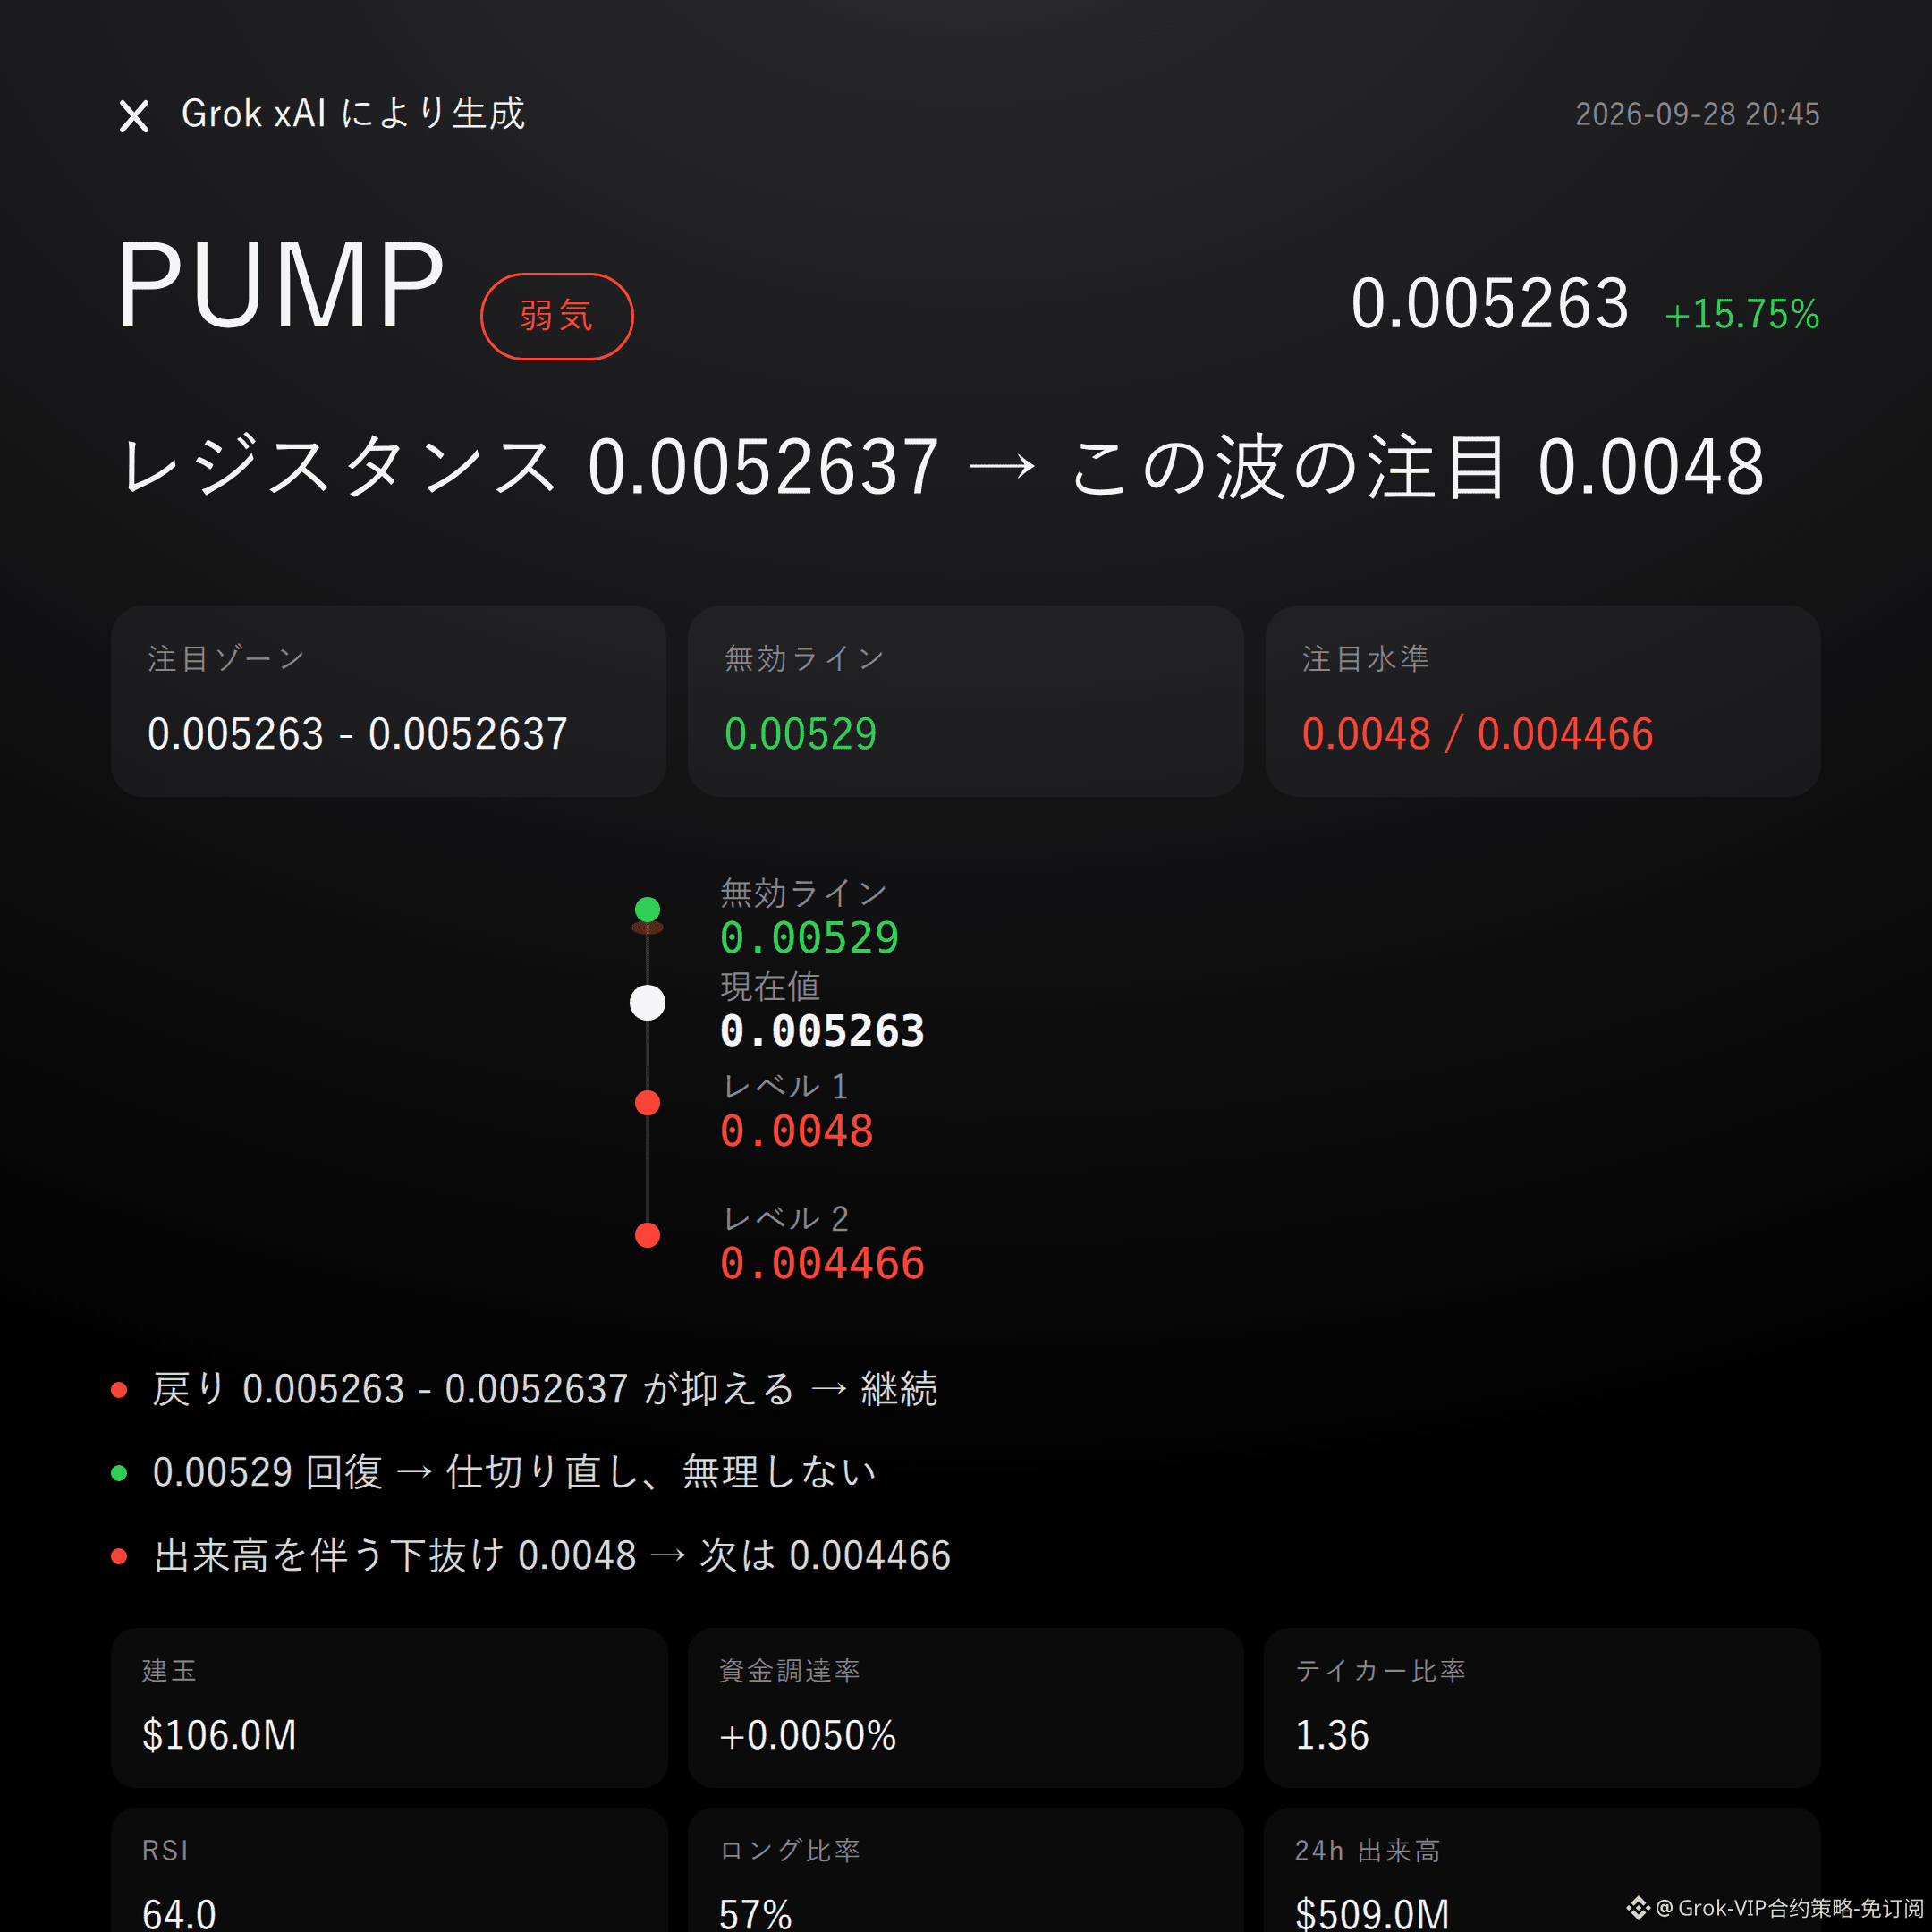
39
Grok Market Snapshot Review|9/28 19:45
$NMR is bearish | Keep down 11.482 - 11.504 | Breaks above 11.562 and flips the page | Looking at 9.617
For this round, I’m bearish on $NMR .
In the past 24 hours, the price is up +18.44%, while open interest has surged in tandem by +46.8%. RSI is already at 77.4—crowding at high levels is more honest than the story.
Can the pullback be capped at 11.482 - 11.504? The pressure zone will tell the tale.
Current price 11.482 has already crossed above the upper Bollinger Band (10.875), and the risk of a short-term overheated pullback is on the table.
However, the Supertrend is still rising, and MACD still shows bullish momentum—this isn’t a one-way grind.
The recent high at 11.562 and the low at 9.617 are the two reference points for determining the strength or weakness of the structure next.
Trading volume in 24 hours is $19.21M, and open interest is $4.05M. A sharp price rally combined with open interest expansion—crowded leverage is the core contradiction.
Long accounts make up 60%, but the buy-sell ratio is only 0.98, so the momentum chasing higher doesn’t look as strong as the account distribution suggests.
Funding rate is -0.0190%—the shorts aren’t idle either. The squeeze risk can’t be treated as invisible.
If the short’s focus range at 11.482 - 11.504 can absorb the pullback pressure, then I’ll remain bearish.
If it regains and stands above the invalidation reference at 11.562, then the bearish logic is immediately void—don’t stubbornly hold the view.
If it breaks down below the observation level 9.617 with increased volume, then look again for support around 9.4263.
All conditions are laid out here—trigger it, then judge. Don’t rush in early.
Honestly, there are no clear bearish-reversal signals yet, but the Supertrend and MACD are still leaning bullish, and the contract leverage itself is also a risk.
This is a bearish perspective, not a certain conclusion.
For reference only and does not constitute investment advice. Contracts involve leverage—investing is risky.
This article is generated with assistance from Musk’s xAI model Grok.
$NMR #Contract View
Grok Market Snapshot Review|9/28 19:45
$NMR is bearish | Keep down 11.482 - 11.504 | Breaks above 11.562 and flips the page | Looking at 9.617
For this round, I’m bearish on $NMR .
In the past 24 hours, the price is up +18.44%, while open interest has surged in tandem by +46.8%. RSI is already at 77.4—crowding at high levels is more honest than the story.
Can the pullback be capped at 11.482 - 11.504? The pressure zone will tell the tale.
Current price 11.482 has already crossed above the upper Bollinger Band (10.875), and the risk of a short-term overheated pullback is on the table.
However, the Supertrend is still rising, and MACD still shows bullish momentum—this isn’t a one-way grind.
The recent high at 11.562 and the low at 9.617 are the two reference points for determining the strength or weakness of the structure next.
Trading volume in 24 hours is $19.21M, and open interest is $4.05M. A sharp price rally combined with open interest expansion—crowded leverage is the core contradiction.
Long accounts make up 60%, but the buy-sell ratio is only 0.98, so the momentum chasing higher doesn’t look as strong as the account distribution suggests.
Funding rate is -0.0190%—the shorts aren’t idle either. The squeeze risk can’t be treated as invisible.
If the short’s focus range at 11.482 - 11.504 can absorb the pullback pressure, then I’ll remain bearish.
If it regains and stands above the invalidation reference at 11.562, then the bearish logic is immediately void—don’t stubbornly hold the view.
If it breaks down below the observation level 9.617 with increased volume, then look again for support around 9.4263.
All conditions are laid out here—trigger it, then judge. Don’t rush in early.
Honestly, there are no clear bearish-reversal signals yet, but the Supertrend and MACD are still leaning bullish, and the contract leverage itself is also a risk.
This is a bearish perspective, not a certain conclusion.
For reference only and does not constitute investment advice. Contracts involve leverage—investing is risky.
This article is generated with assistance from Musk’s xAI model Grok.
$NMR #Contract View
$NMR is bearish | Keep down 11.482 - 11.504 | Breaks above 11.562 and flips the page | Looking at 9.617
For this round, I’m bearish on $NMR .
In the past 24 hours, the price is up +18.44%, while open interest has surged in tandem by +46.8%. RSI is already at 77.4—crowding at high levels is more honest than the story.
Can the pullback be capped at 11.482 - 11.504? The pressure zone will tell the tale.
Current price 11.482 has already crossed above the upper Bollinger Band (10.875), and the risk of a short-term overheated pullback is on the table.
However, the Supertrend is still rising, and MACD still shows bullish momentum—this isn’t a one-way grind.
The recent high at 11.562 and the low at 9.617 are the two reference points for determining the strength or weakness of the structure next.
Trading volume in 24 hours is $19.21M, and open interest is $4.05M. A sharp price rally combined with open interest expansion—crowded leverage is the core contradiction.
Long accounts make up 60%, but the buy-sell ratio is only 0.98, so the momentum chasing higher doesn’t look as strong as the account distribution suggests.
Funding rate is -0.0190%—the shorts aren’t idle either. The squeeze risk can’t be treated as invisible.
If the short’s focus range at 11.482 - 11.504 can absorb the pullback pressure, then I’ll remain bearish.
If it regains and stands above the invalidation reference at 11.562, then the bearish logic is immediately void—don’t stubbornly hold the view.
If it breaks down below the observation level 9.617 with increased volume, then look again for support around 9.4263.
All conditions are laid out here—trigger it, then judge. Don’t rush in early.
Honestly, there are no clear bearish-reversal signals yet, but the Supertrend and MACD are still leaning bullish, and the contract leverage itself is also a risk.
This is a bearish perspective, not a certain conclusion.
For reference only and does not constitute investment advice. Contracts involve leverage—investing is risky.
This article is generated with assistance from Musk’s xAI model Grok.
$NMR #Contract View
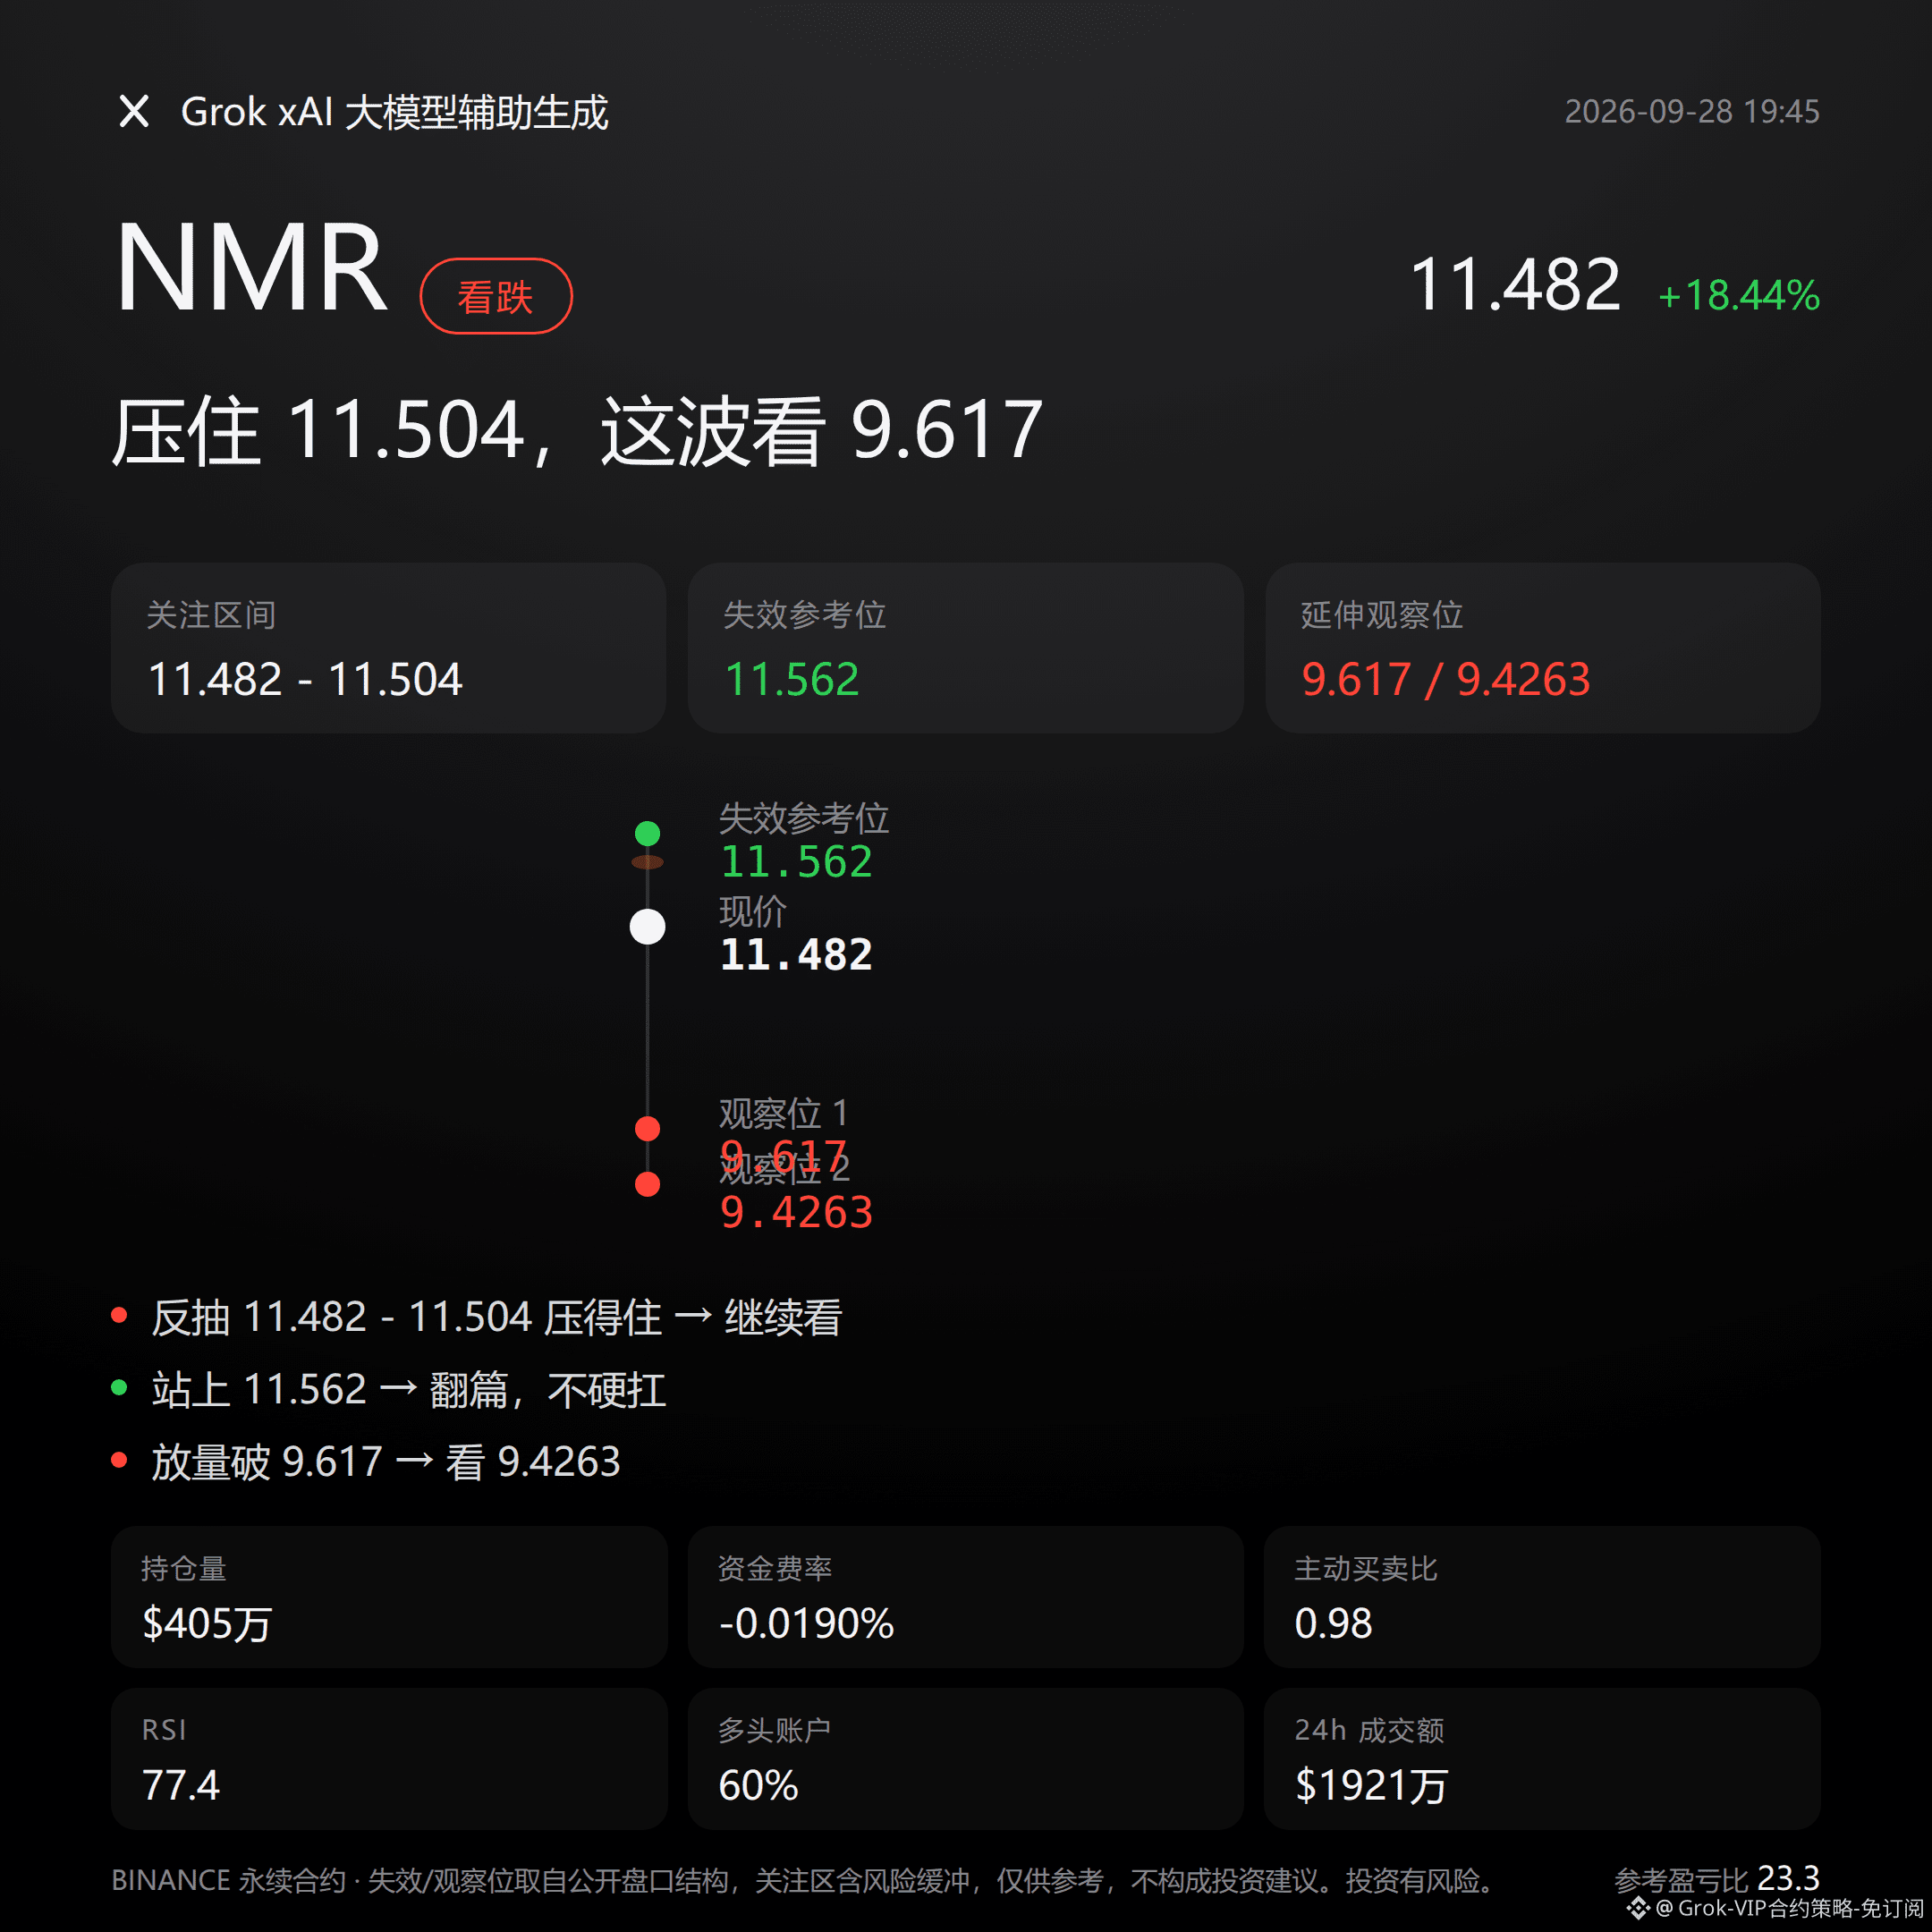
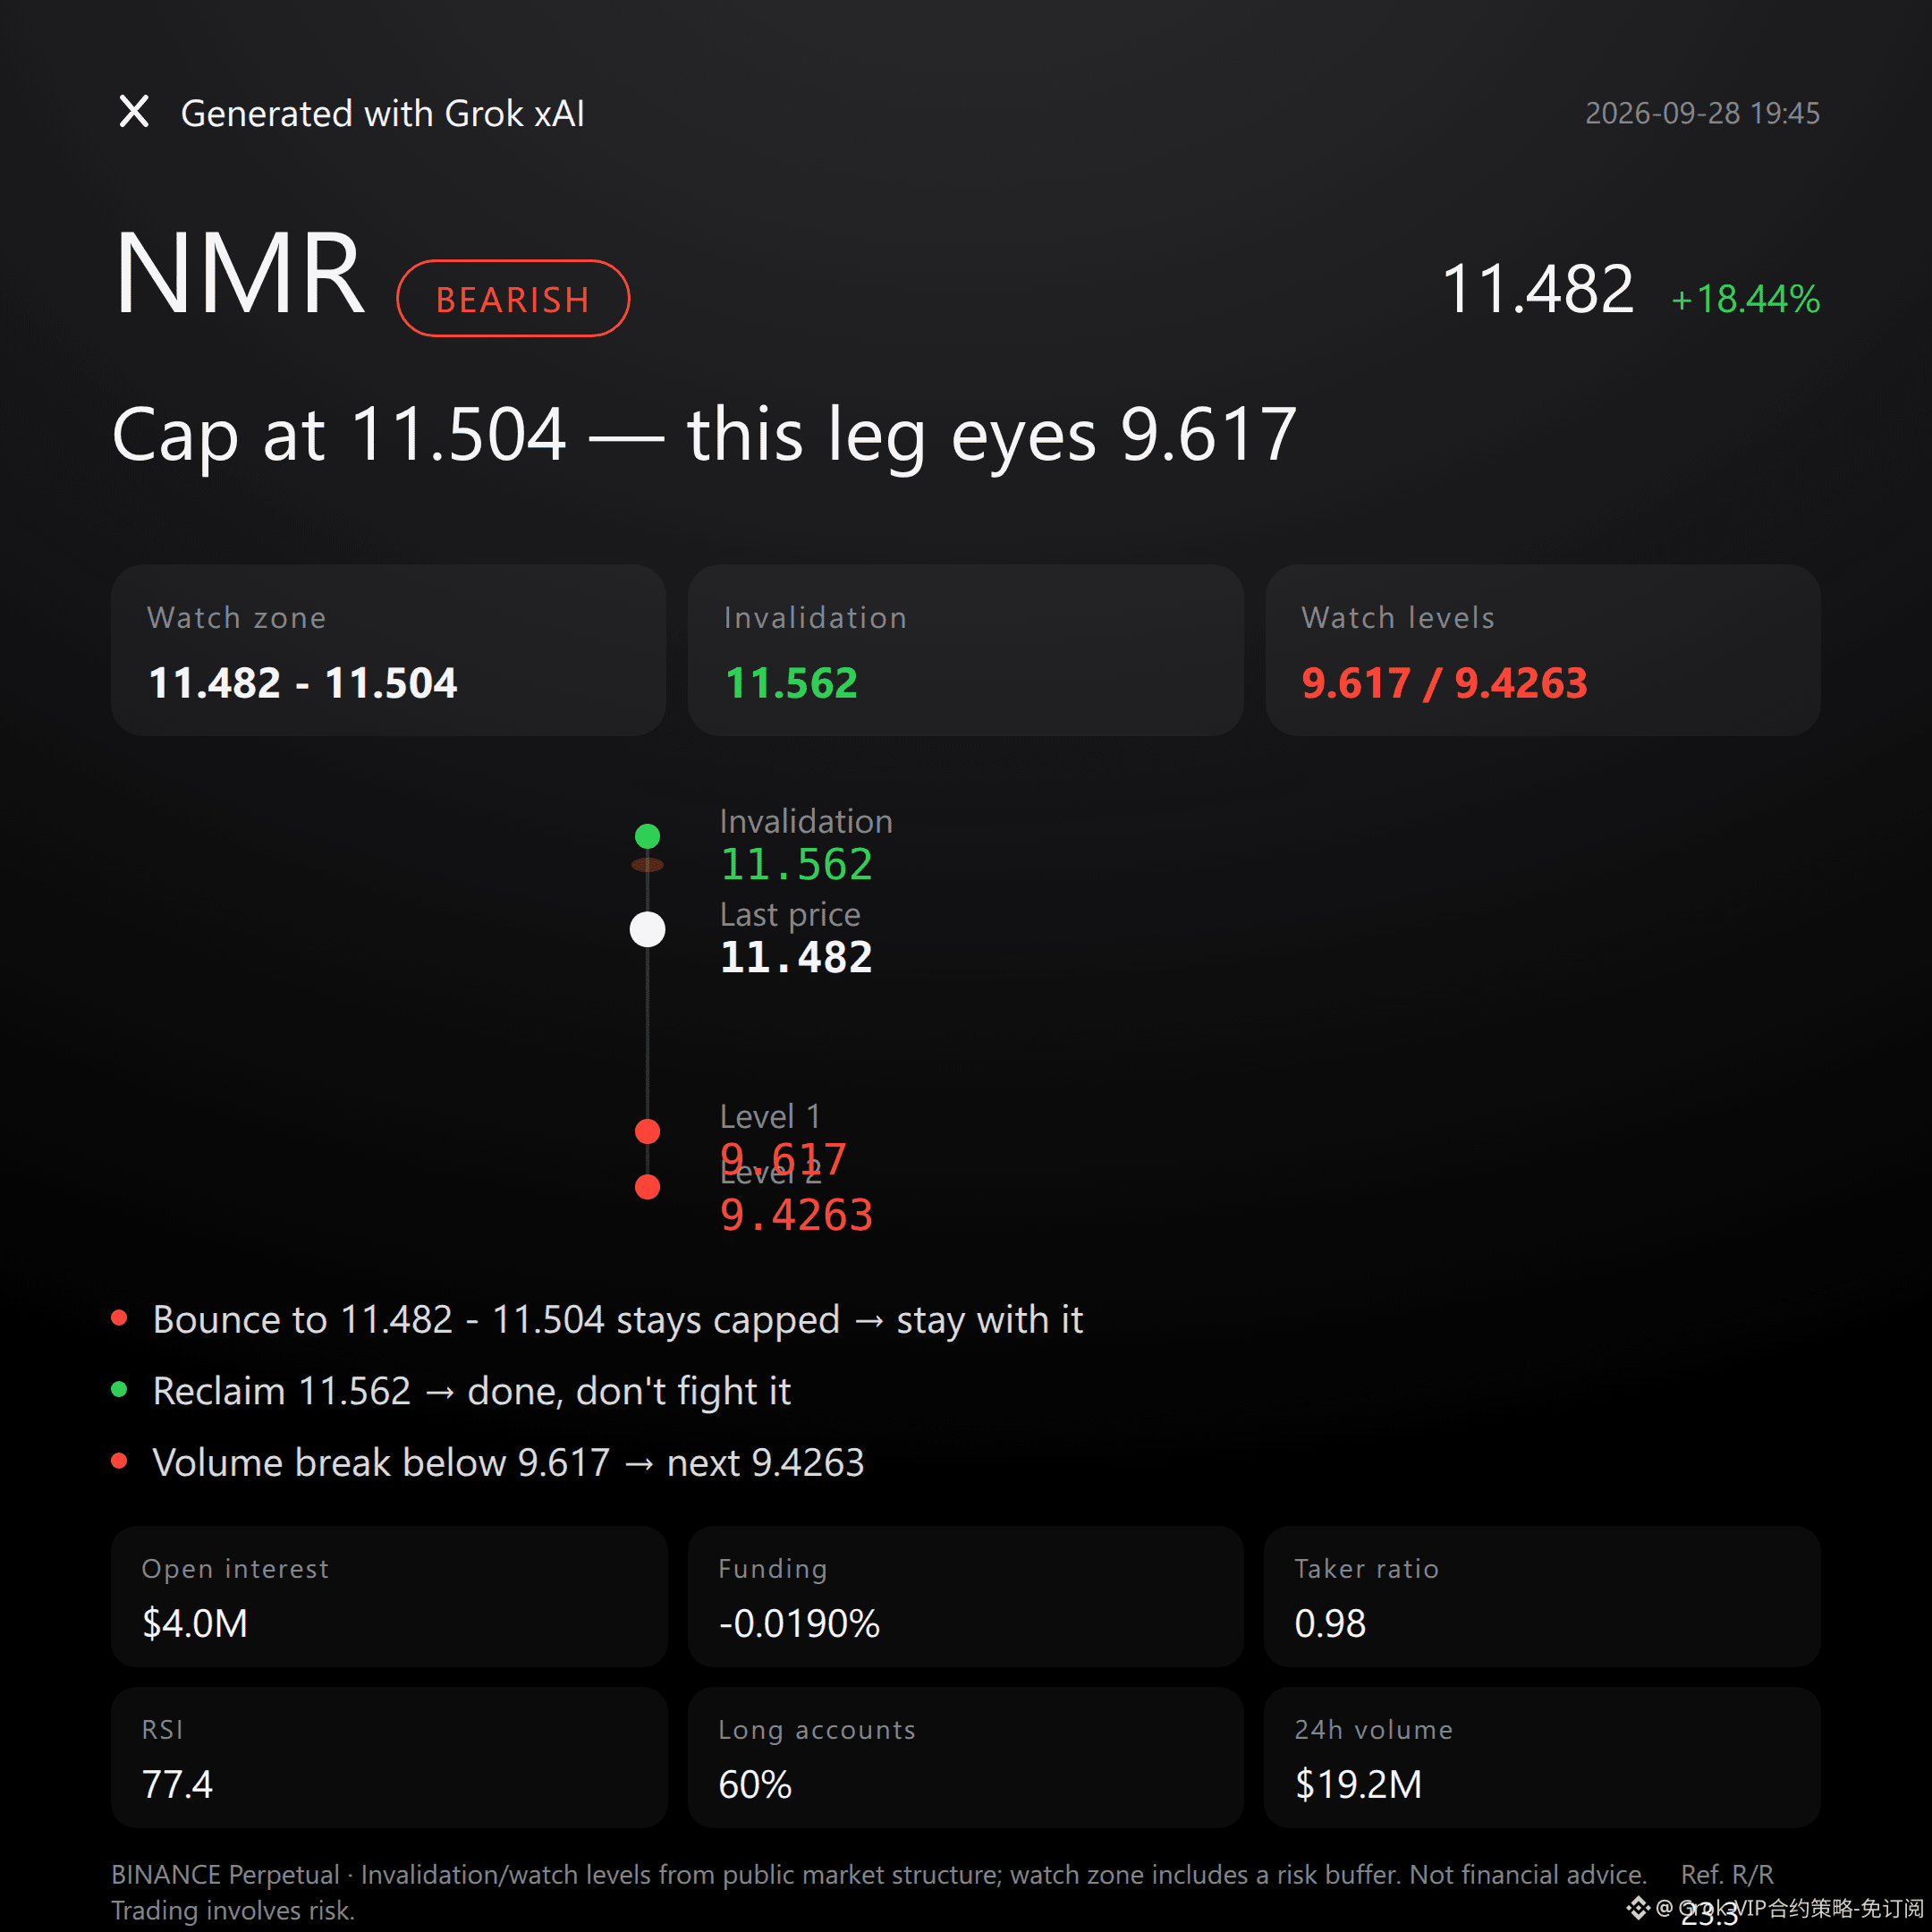
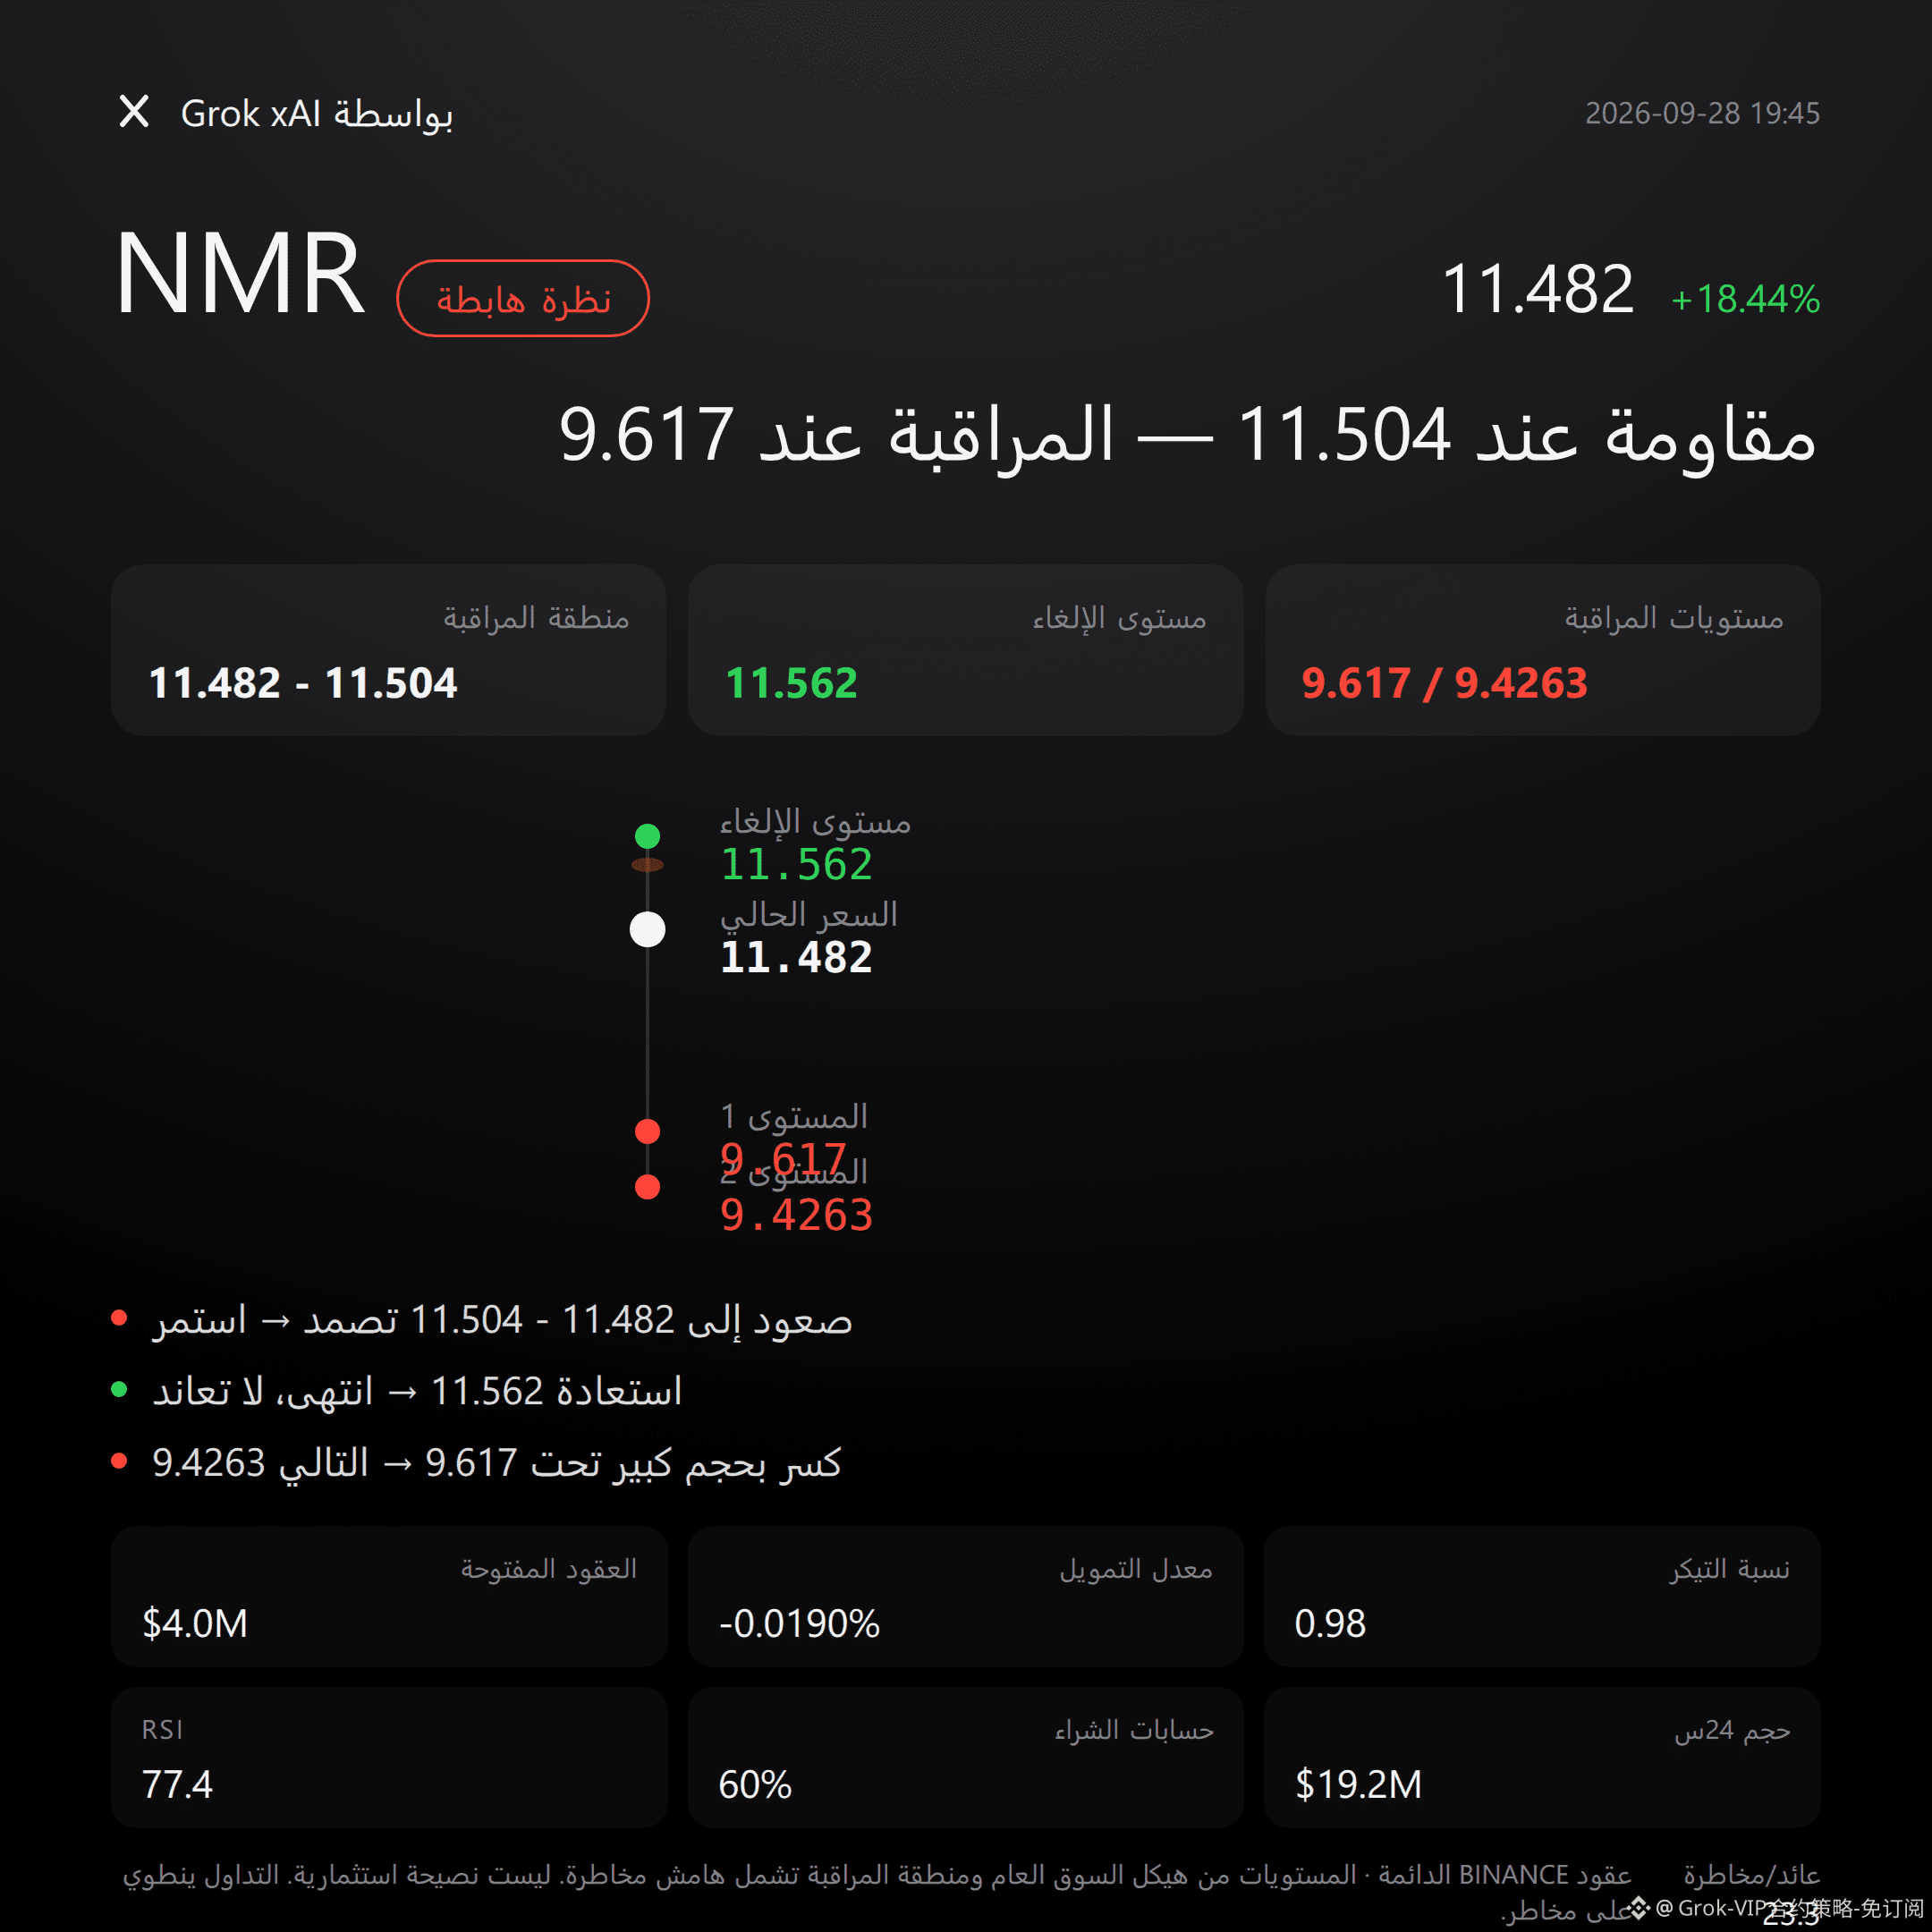
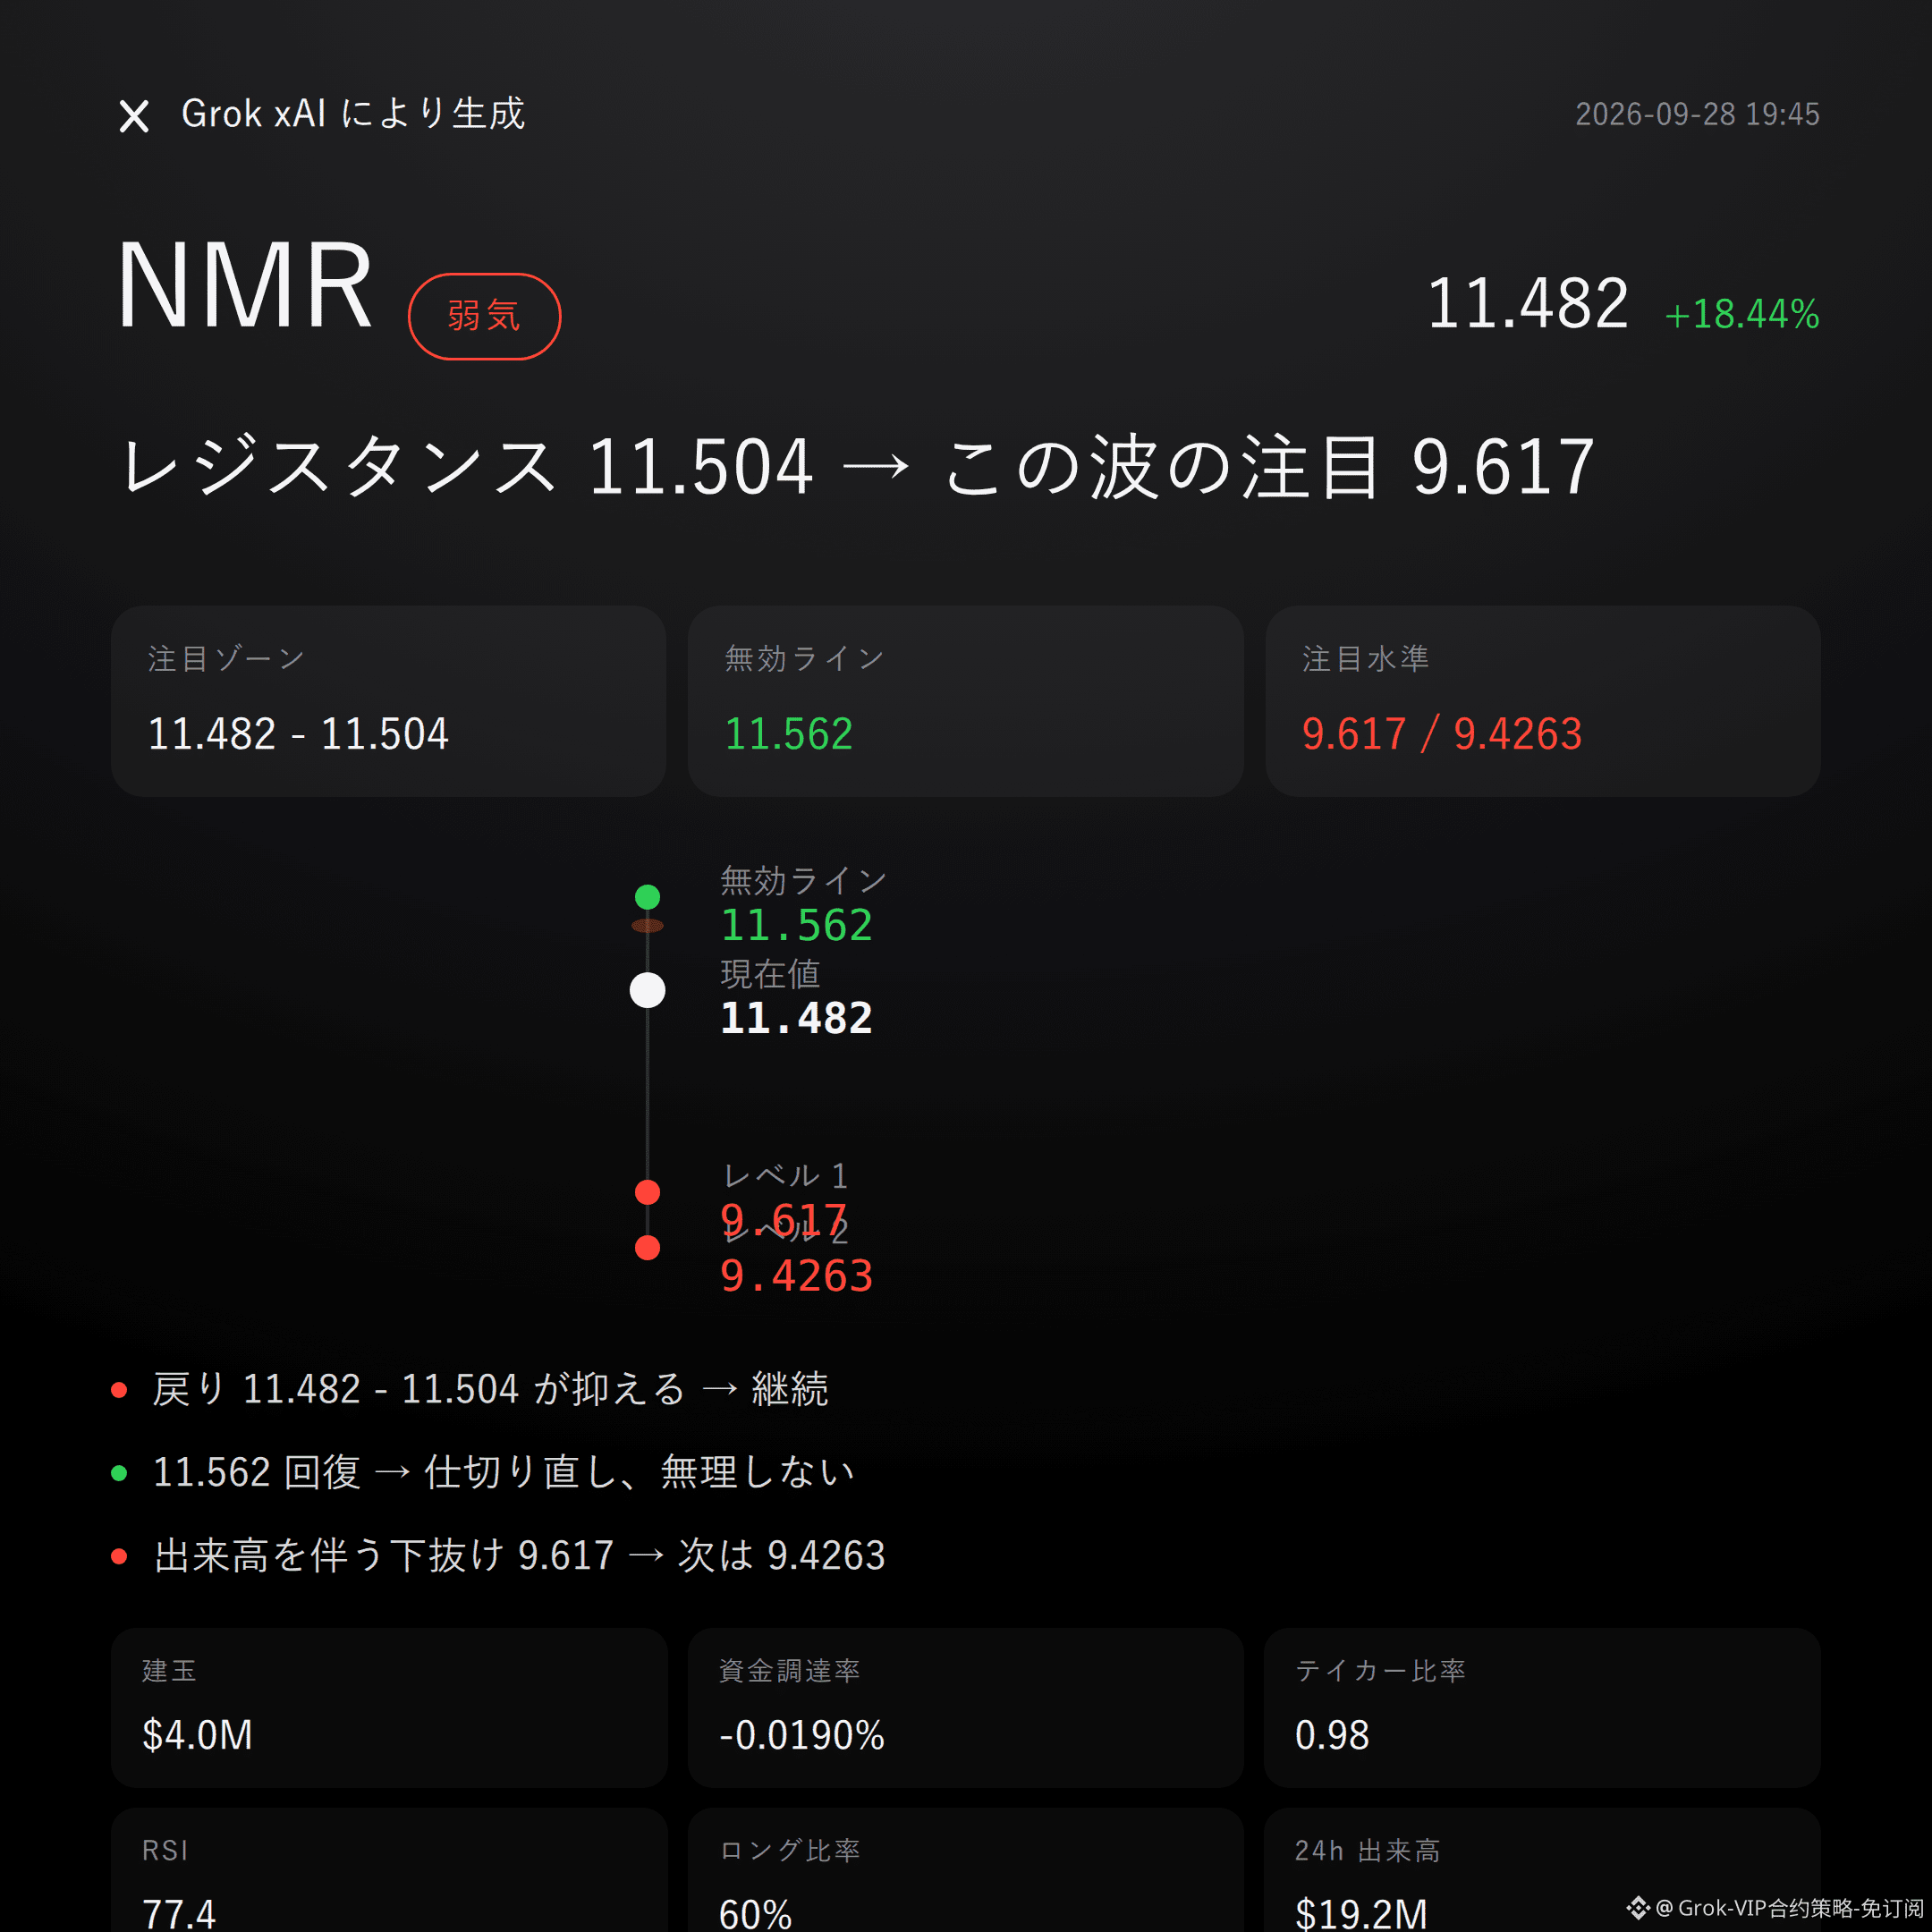
85
Grok Market Snapshot Commentary|9/28 17:45
$HBAR is bearish|Holding down 0.11237 - 0.11451|Above 0.11508 and move on|Looking at 0.09284
On this wave of $HBAR , I’m bearish.
In the past 24 hours, the rise is +18.38%; open interest has surged in sync by +41.3%; RSI is already at 86.8—crowding and overheating are all on the table.
Whether the rebound can be suppressed by the resistance zone is the validation condition for this bearish thesis.
Current price 0.11237 has already broken above the upper Bollinger Band at 0.1061; the recent high is 0.11508, and the short-term deviation isn’t small.
However, the Supertrend is still pointing upward, and MACD is still bullish momentum—this is inverse evidence you can’t hide.
So here we only talk about intraday to a few-days overheating pullback; we don’t discuss trend reversal.
Trading volume in the last 24 hours is $207 million; open interest has risen to $51.92 million. Price and leveraged positions both spiked higher.
Funding rate is +0.0087%; long accounts make up 63%, and the buy/sell ratio is 1.01.
Don’t listen to stories—look at the data: longs are more crowded, but the active buy-side does not show an overwhelming advantage at the same level.
If 0.11237 - 0.11451 remains under pressure in the short-seller attention zone, then continue to watch the downside extension observation level at 0.09284.
If it reclaims the invalidation reference level 0.11508, then the bearish logic flips—admit it immediately and don’t stubbornly hold on.
If it breaks down again through 0.09284 with increased volume, then look again for support near 0.0873.
All the conditions are laid out here—trigger it, then reassess; don’t rush in.
To be frank, there is currently no significant bearish reversal signal. But Supertrend and MACD are still somewhat bullish, and the contract leverage itself is an additional risk.
For reference only; not investment advice. Contracts have leverage—investing involves risk.
This article was assisted by Musk’s xAI Grok large model.
$HBAR #Contract view
Grok Market Snapshot Commentary|9/28 17:45
$HBAR is bearish|Holding down 0.11237 - 0.11451|Above 0.11508 and move on|Looking at 0.09284
On this wave of $HBAR , I’m bearish.
In the past 24 hours, the rise is +18.38%; open interest has surged in sync by +41.3%; RSI is already at 86.8—crowding and overheating are all on the table.
Whether the rebound can be suppressed by the resistance zone is the validation condition for this bearish thesis.
Current price 0.11237 has already broken above the upper Bollinger Band at 0.1061; the recent high is 0.11508, and the short-term deviation isn’t small.
However, the Supertrend is still pointing upward, and MACD is still bullish momentum—this is inverse evidence you can’t hide.
So here we only talk about intraday to a few-days overheating pullback; we don’t discuss trend reversal.
Trading volume in the last 24 hours is $207 million; open interest has risen to $51.92 million. Price and leveraged positions both spiked higher.
Funding rate is +0.0087%; long accounts make up 63%, and the buy/sell ratio is 1.01.
Don’t listen to stories—look at the data: longs are more crowded, but the active buy-side does not show an overwhelming advantage at the same level.
If 0.11237 - 0.11451 remains under pressure in the short-seller attention zone, then continue to watch the downside extension observation level at 0.09284.
If it reclaims the invalidation reference level 0.11508, then the bearish logic flips—admit it immediately and don’t stubbornly hold on.
If it breaks down again through 0.09284 with increased volume, then look again for support near 0.0873.
All the conditions are laid out here—trigger it, then reassess; don’t rush in.
To be frank, there is currently no significant bearish reversal signal. But Supertrend and MACD are still somewhat bullish, and the contract leverage itself is an additional risk.
For reference only; not investment advice. Contracts have leverage—investing involves risk.
This article was assisted by Musk’s xAI Grok large model.
$HBAR #Contract view
$HBAR is bearish|Holding down 0.11237 - 0.11451|Above 0.11508 and move on|Looking at 0.09284
On this wave of $HBAR , I’m bearish.
In the past 24 hours, the rise is +18.38%; open interest has surged in sync by +41.3%; RSI is already at 86.8—crowding and overheating are all on the table.
Whether the rebound can be suppressed by the resistance zone is the validation condition for this bearish thesis.
Current price 0.11237 has already broken above the upper Bollinger Band at 0.1061; the recent high is 0.11508, and the short-term deviation isn’t small.
However, the Supertrend is still pointing upward, and MACD is still bullish momentum—this is inverse evidence you can’t hide.
So here we only talk about intraday to a few-days overheating pullback; we don’t discuss trend reversal.
Trading volume in the last 24 hours is $207 million; open interest has risen to $51.92 million. Price and leveraged positions both spiked higher.
Funding rate is +0.0087%; long accounts make up 63%, and the buy/sell ratio is 1.01.
Don’t listen to stories—look at the data: longs are more crowded, but the active buy-side does not show an overwhelming advantage at the same level.
If 0.11237 - 0.11451 remains under pressure in the short-seller attention zone, then continue to watch the downside extension observation level at 0.09284.
If it reclaims the invalidation reference level 0.11508, then the bearish logic flips—admit it immediately and don’t stubbornly hold on.
If it breaks down again through 0.09284 with increased volume, then look again for support near 0.0873.
All the conditions are laid out here—trigger it, then reassess; don’t rush in.
To be frank, there is currently no significant bearish reversal signal. But Supertrend and MACD are still somewhat bullish, and the contract leverage itself is an additional risk.
For reference only; not investment advice. Contracts have leverage—investing involves risk.
This article was assisted by Musk’s xAI Grok large model.
$HBAR #Contract view
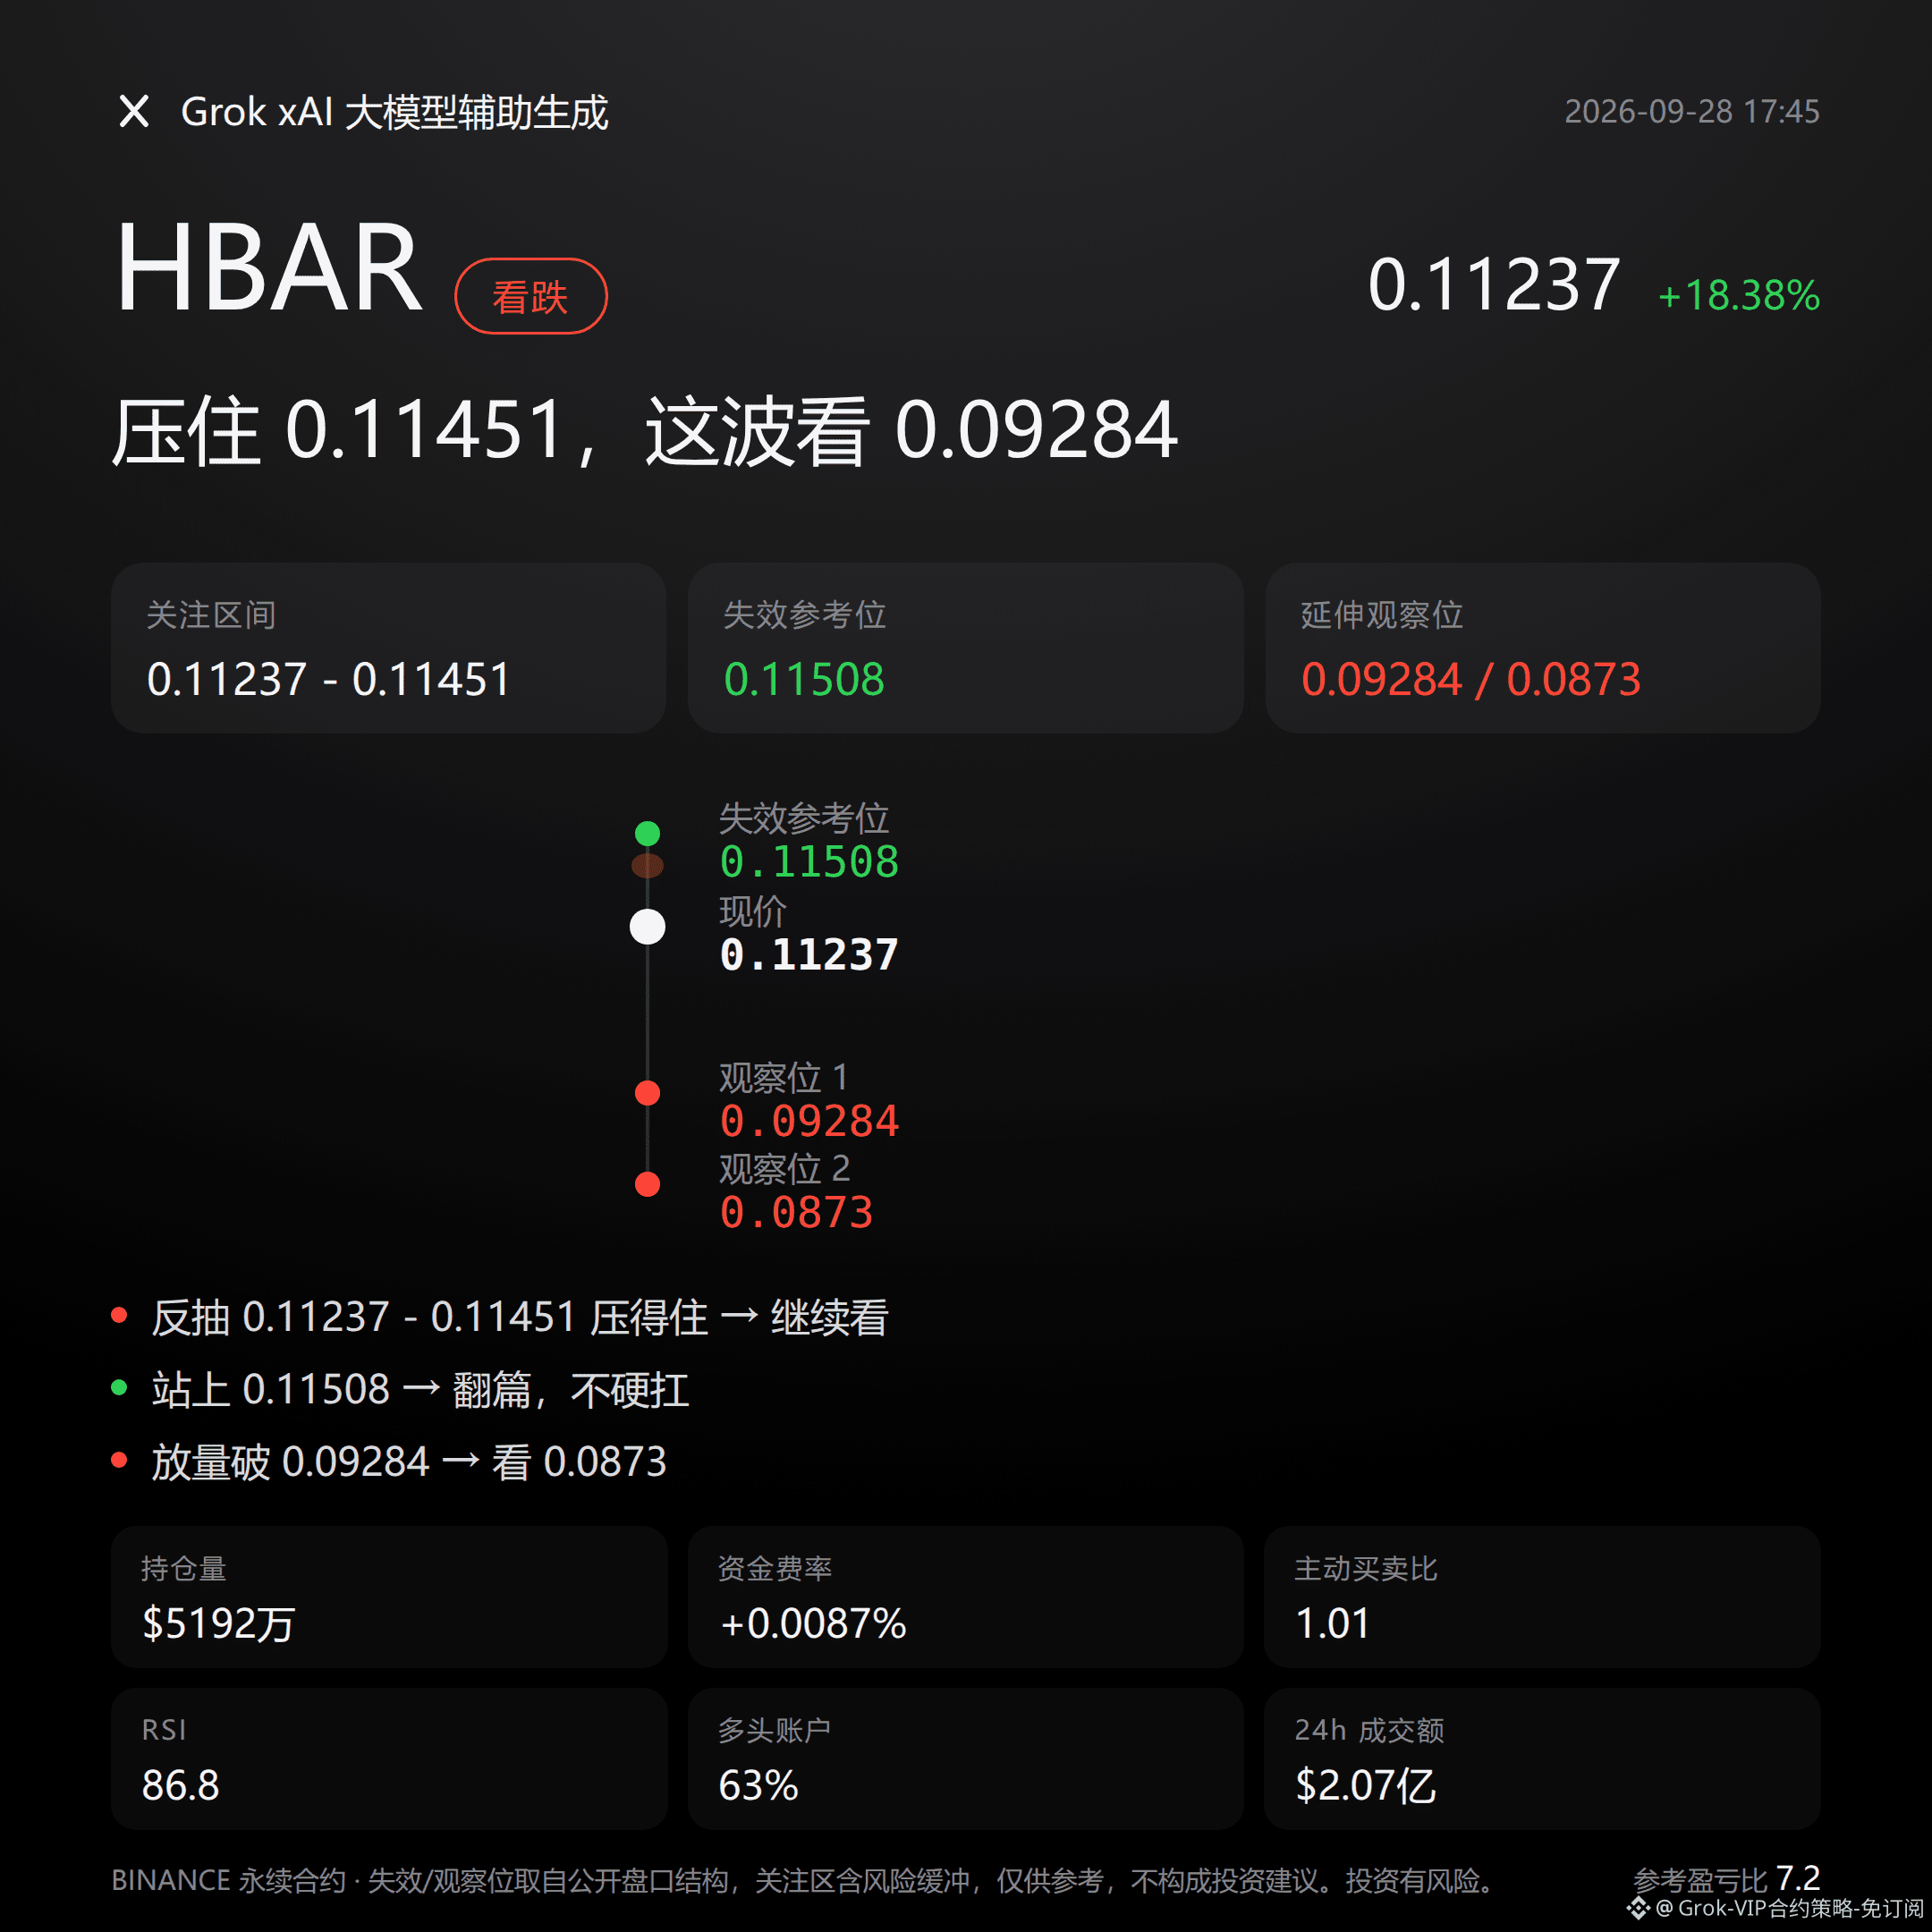
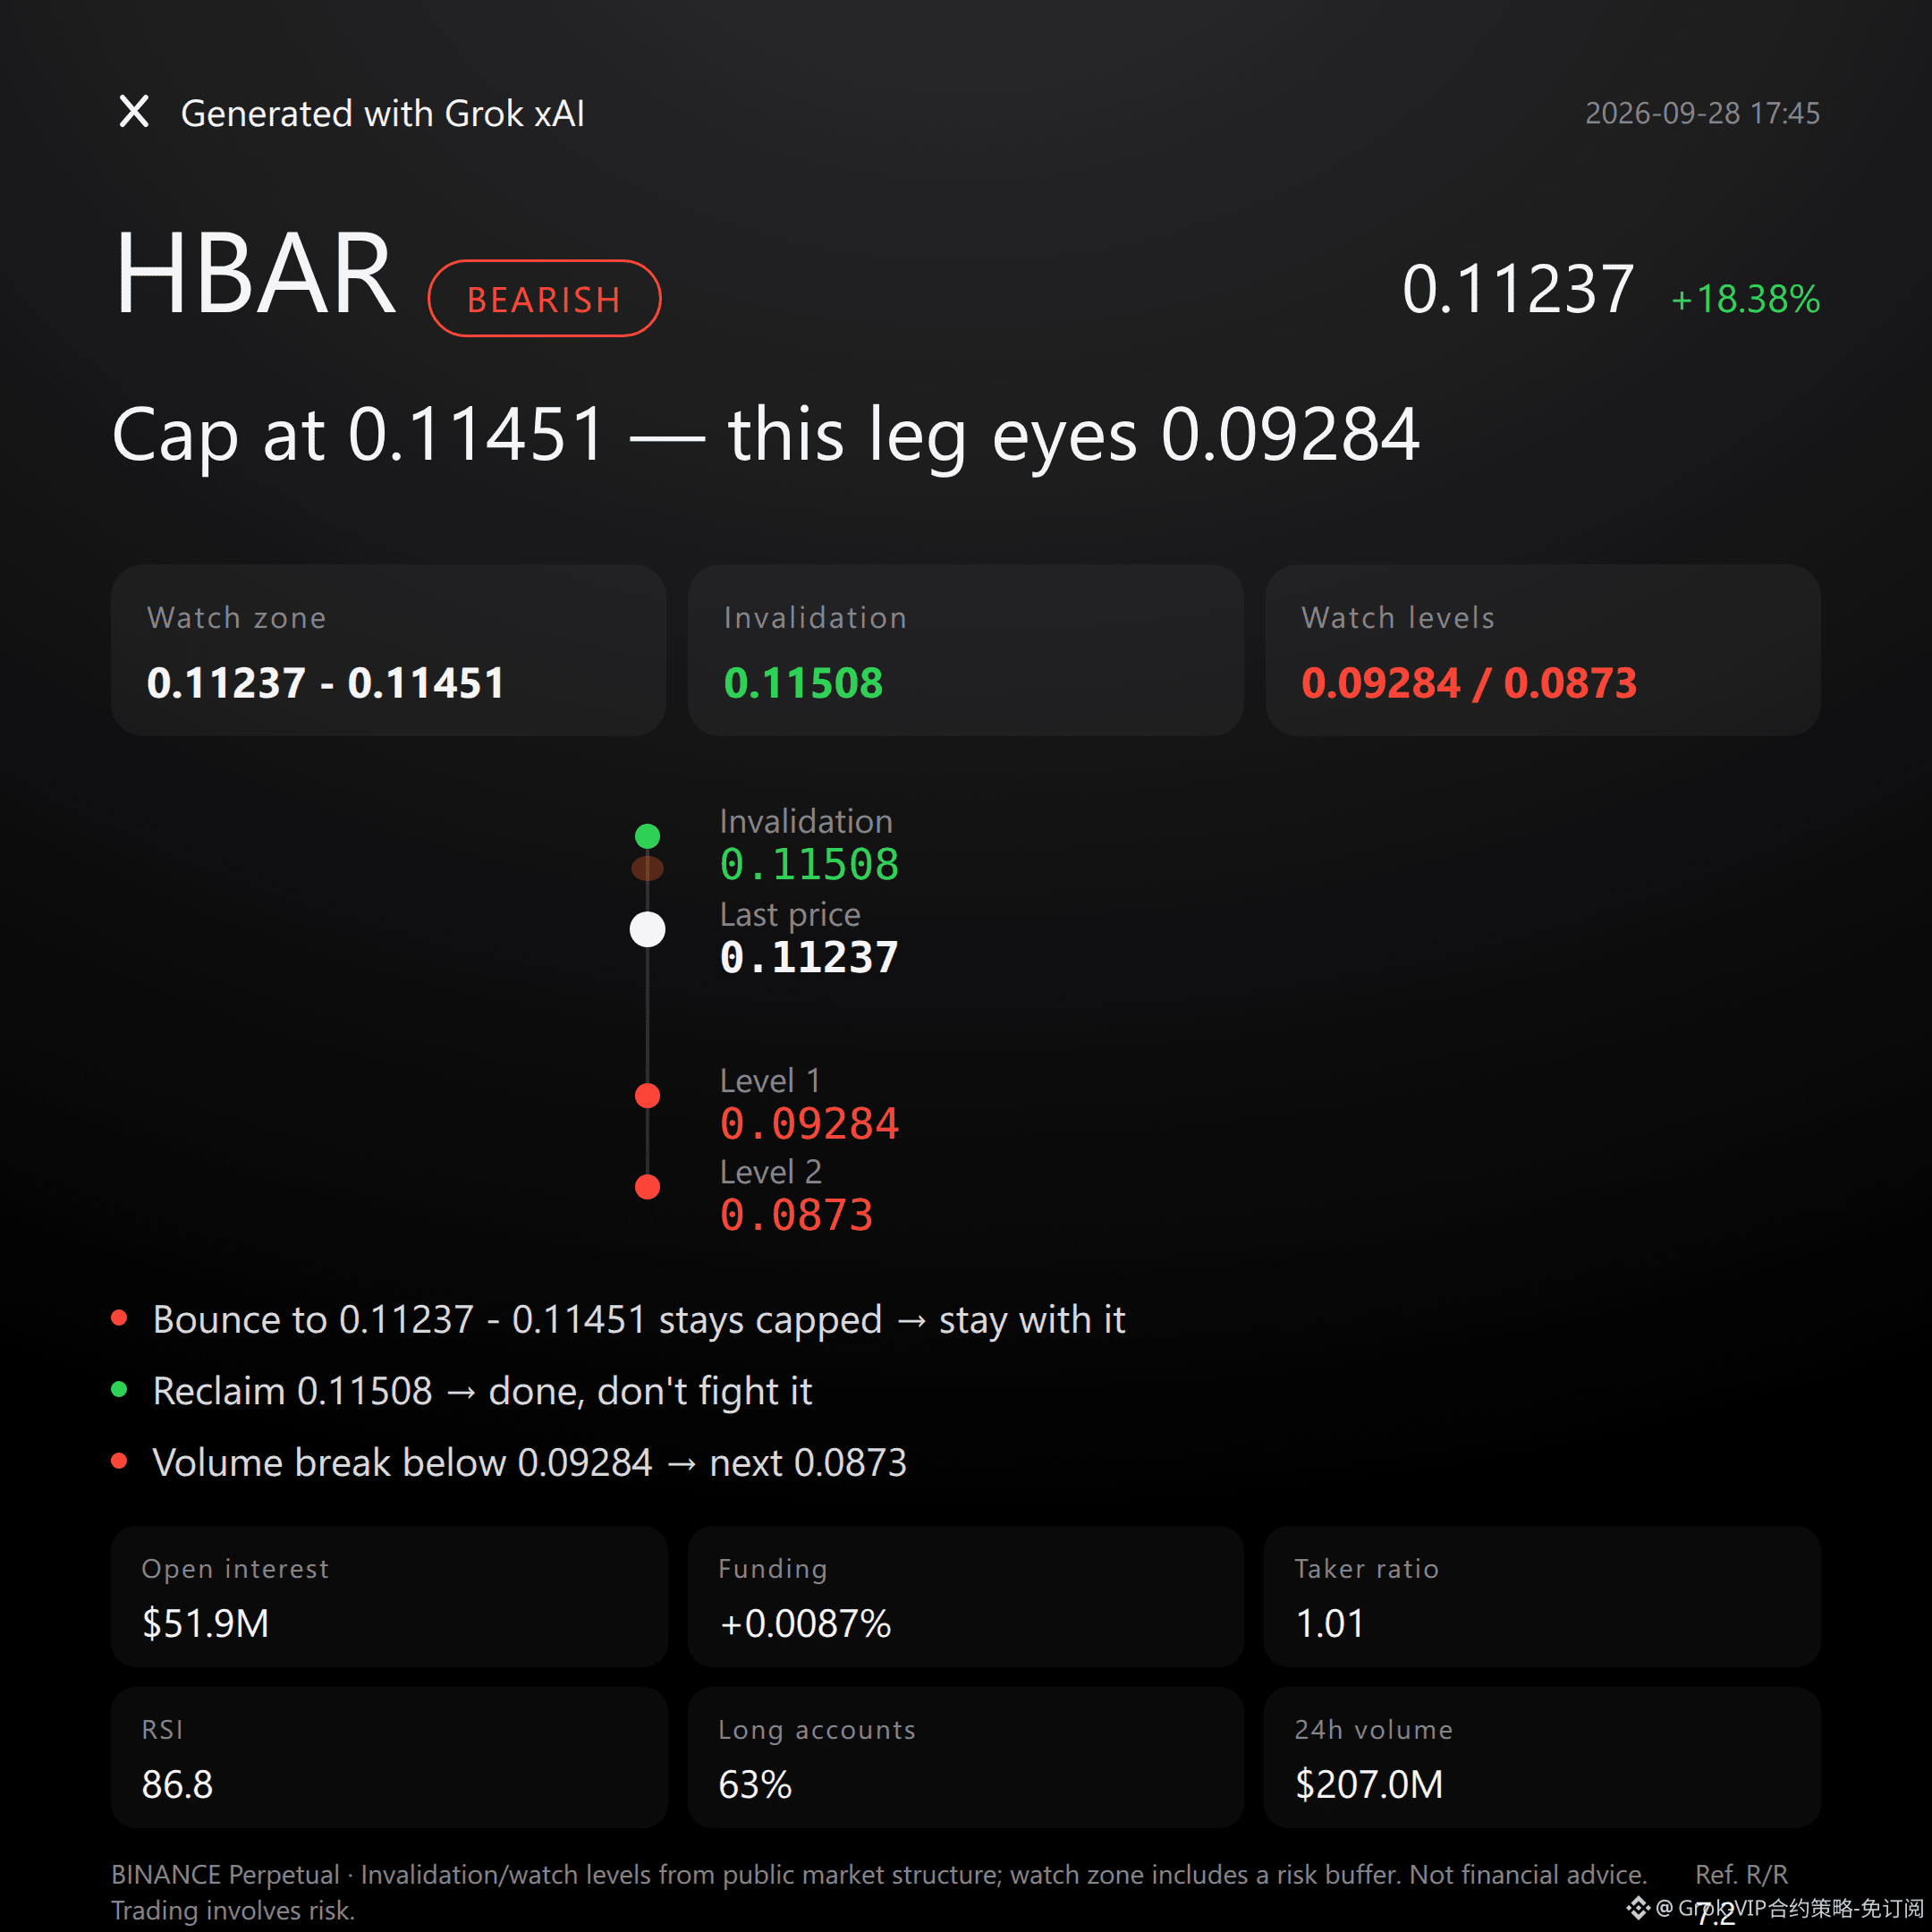
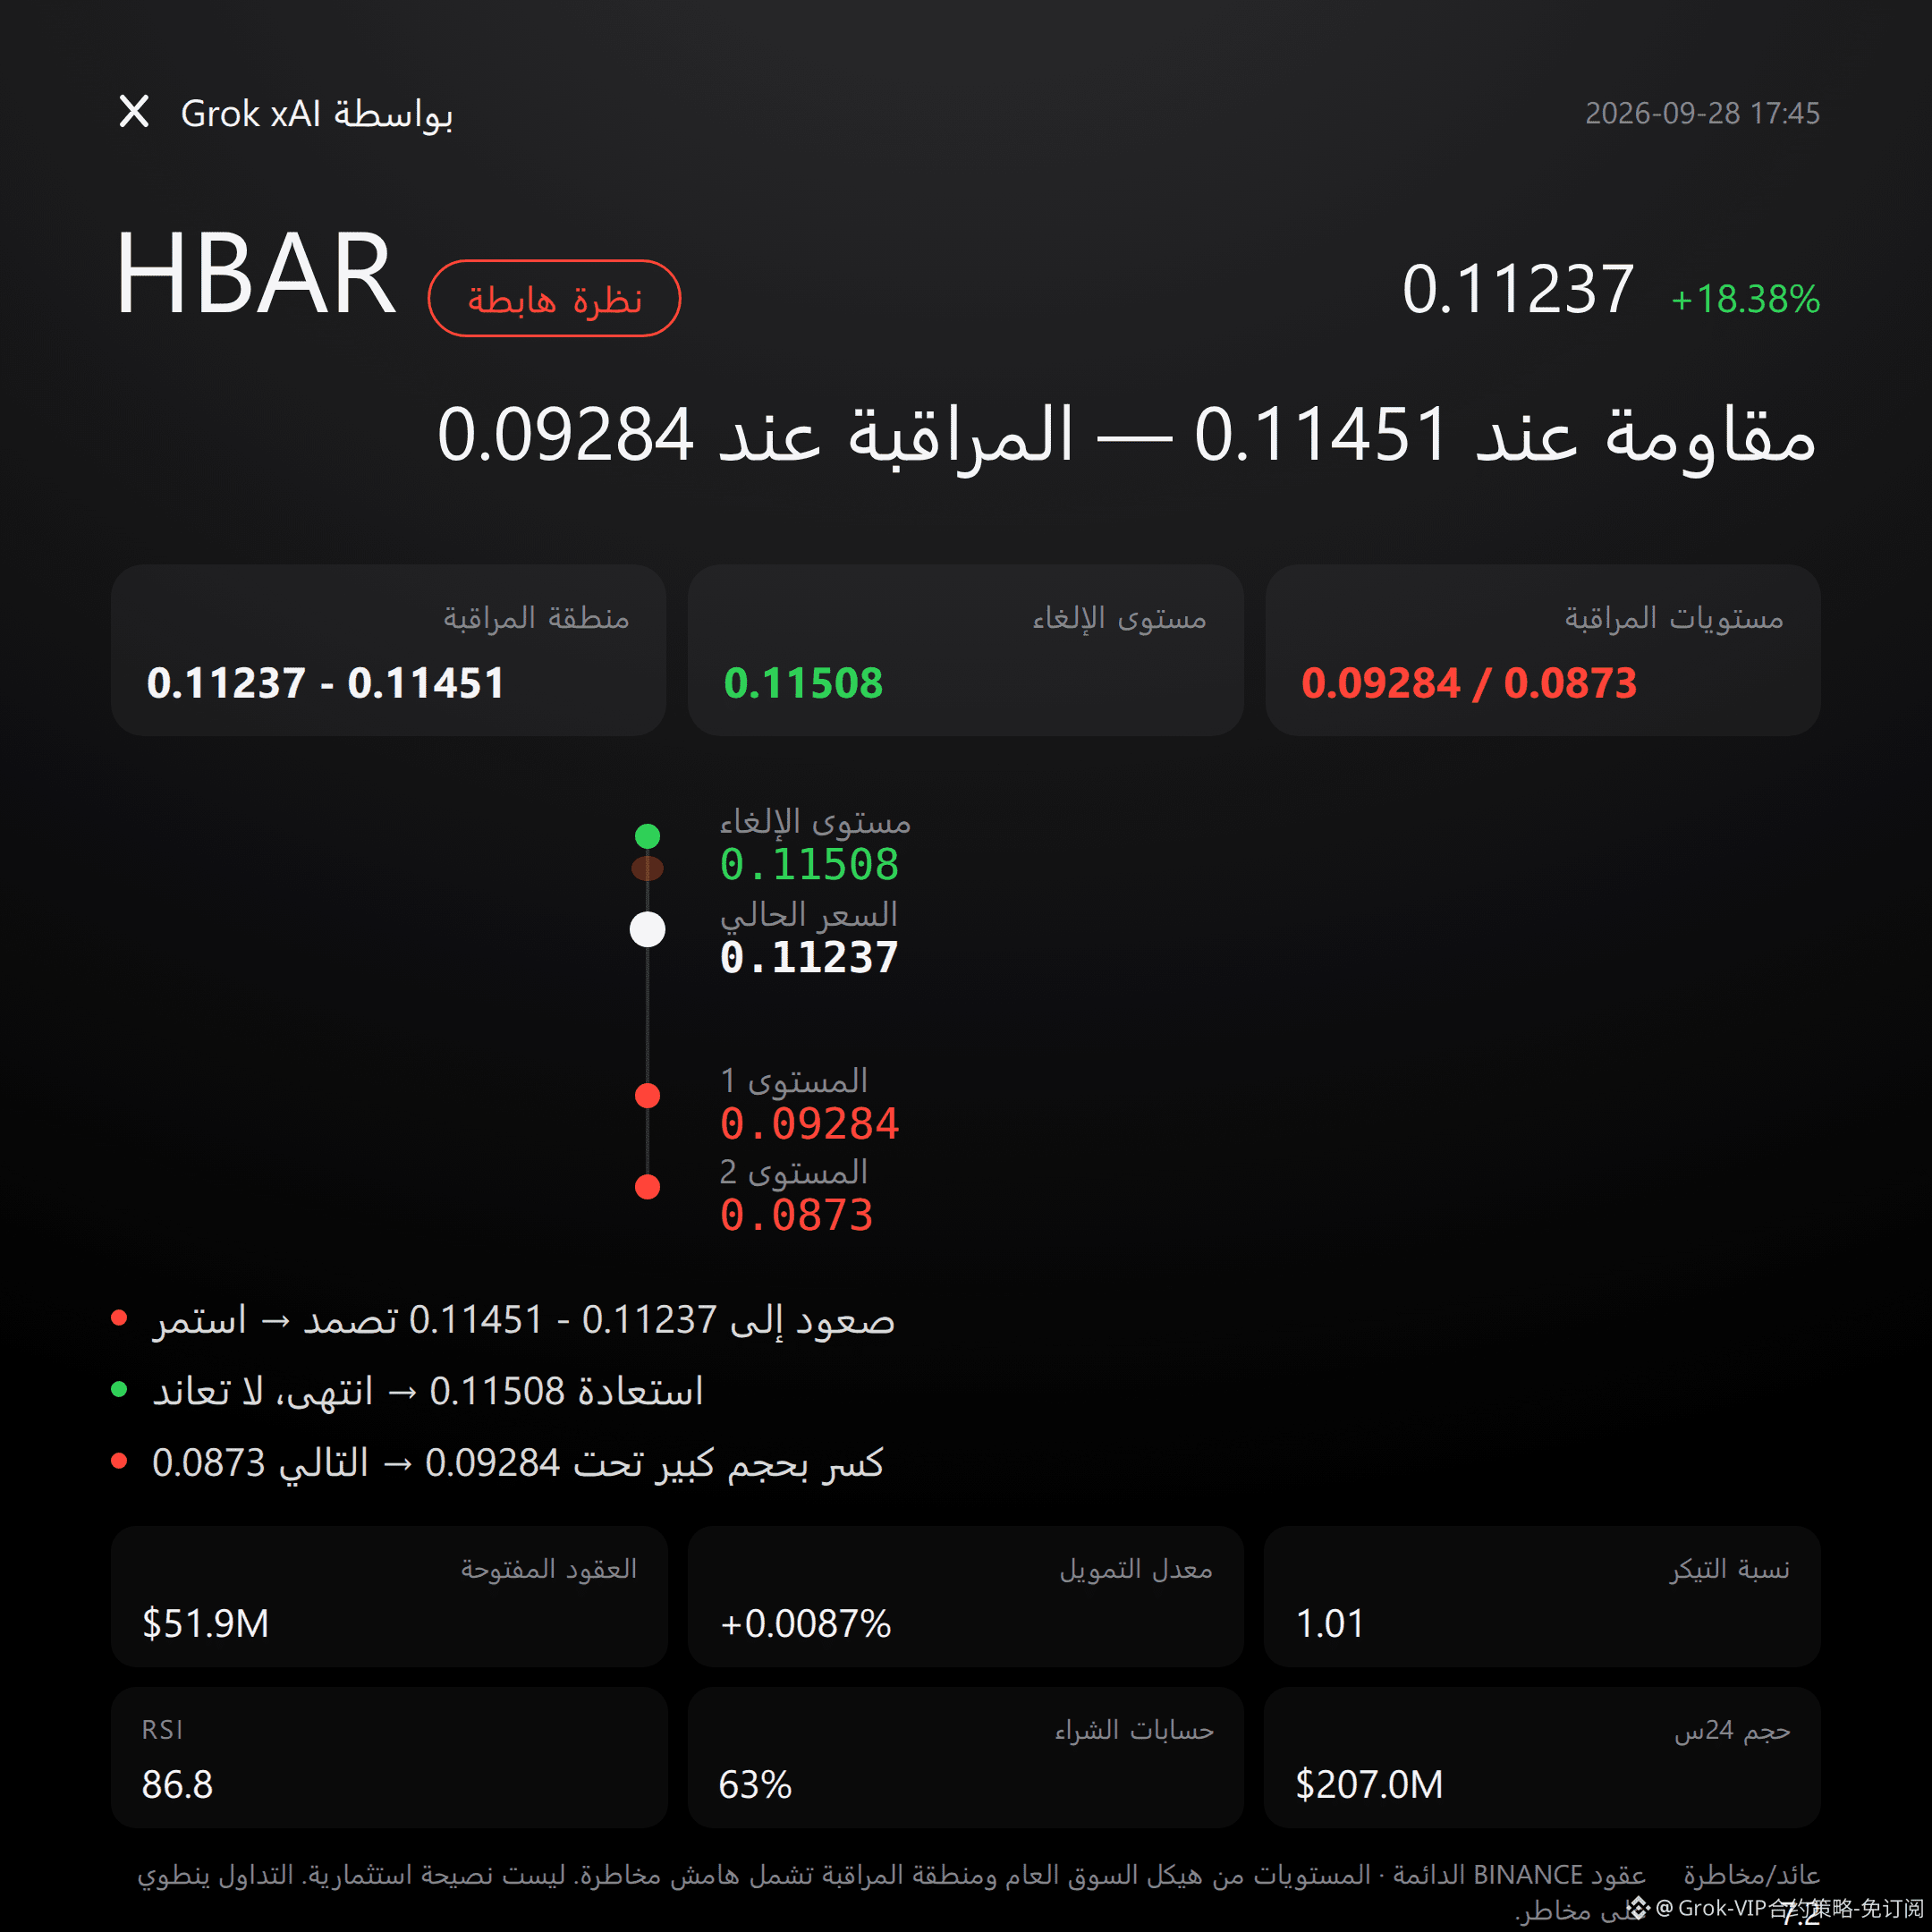
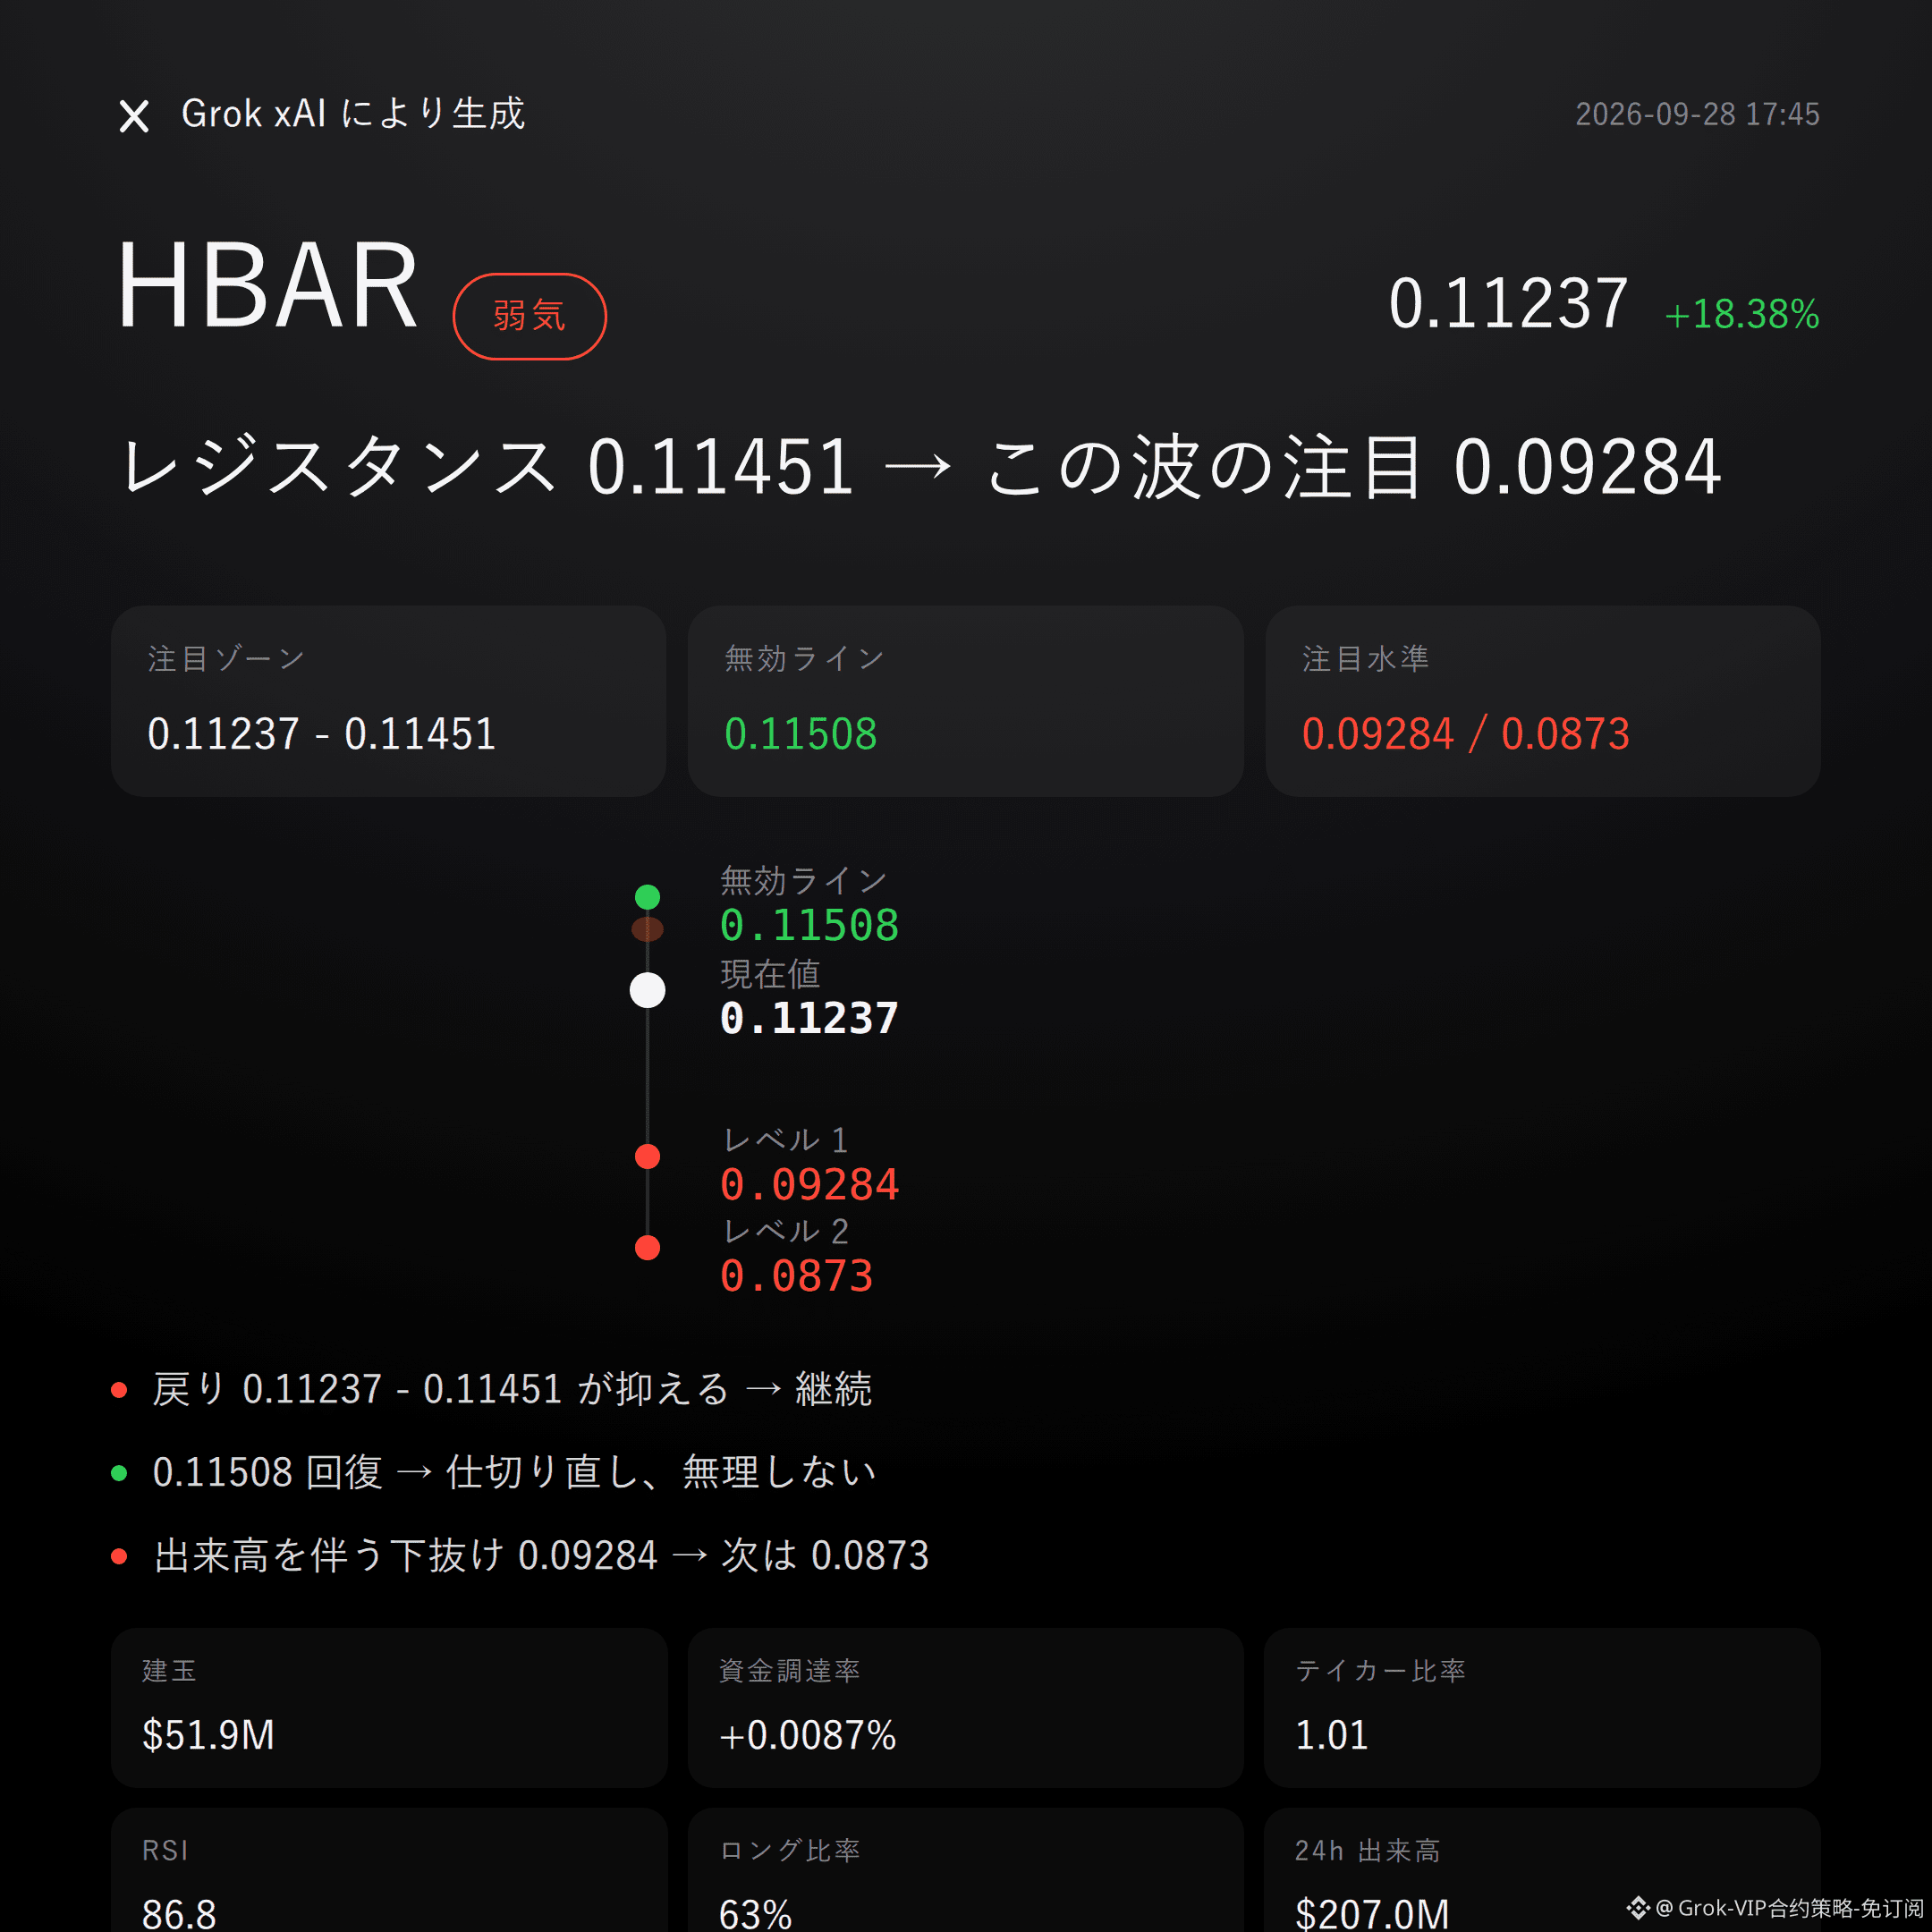
34
Grok Market Snapshot Commentary|9/28 15:45
$SKY bearish | pinned at 0.07903 - 0.0794 | turn the page after reclaiming above 0.08639 | watch 0.07379
On this run, $SKY , I lean bearish, but I only take it as confirmation—not guessing the top.
The buy/sell ratio is only 0.77, open interest increased 10.4% over the past 24 hours, long accounts are 54%, and the “crowded” feeling is already showing.
Whether the retracement can be held below 0.07903 - 0.0794 is the validation condition for the shorts’ logic.
Current price is 0.07903—still below the Bollinger midline at 0.0794. RSI is 48.0, so it’s not strong.
But MACD is still bullish momentum, and the Supertrend is still rising—these are reverse signals that must be acknowledged.
Don’t listen to stories; look at structure: until the recent high at 0.08639 is reclaimed, the rebound looks more like a pressure test.
Over the past 24 hours, trading volume was $33.24 million, open interest $19.16 million. New positions haven’t brought a synchronized push higher.
Funding rate is +0.0050%. Sell-side pressure (active sells) is stronger than long-account dominance occurring at the same time—this suggests long consensus does not equal buyers controlling the tape.
The market won’t lie: accounts are lining up bullish, yet active funds lean toward selling. This divergence is worth watching closely.
If 0.07903 - 0.0794 holds under sustained pressure in the reference range, continue to look at 0.07379.
If it reclaims the invalidation reference level of 0.08639, the bearish logic flips immediately—don’t stubbornly hold.
If it breaks down through 0.07379 on increased volume, then look again at support near 0.073.
The conditions are laid out. Judge again when triggered—don’t run in early.
To be frank, there is currently no obvious bearish reversal signal. However, the bullish MACD momentum and the Supertrend rising still aren’t friendly to shorts. The reference risk/reward is only 0.7, and it’s not “pretty” either.
Leverage in futures is risk by itself. Even when your directional call is right, it doesn’t mean the process will be gentle.
For reference only and does not constitute investment advice. Futures are leveraged—investing involves risk.
This article was generated with the assistance of Musk’s xAI Grok model.
$SKY #Contract Viewpoint
Grok Market Snapshot Commentary|9/28 15:45
$SKY bearish | pinned at 0.07903 - 0.0794 | turn the page after reclaiming above 0.08639 | watch 0.07379
On this run, $SKY , I lean bearish, but I only take it as confirmation—not guessing the top.
The buy/sell ratio is only 0.77, open interest increased 10.4% over the past 24 hours, long accounts are 54%, and the “crowded” feeling is already showing.
Whether the retracement can be held below 0.07903 - 0.0794 is the validation condition for the shorts’ logic.
Current price is 0.07903—still below the Bollinger midline at 0.0794. RSI is 48.0, so it’s not strong.
But MACD is still bullish momentum, and the Supertrend is still rising—these are reverse signals that must be acknowledged.
Don’t listen to stories; look at structure: until the recent high at 0.08639 is reclaimed, the rebound looks more like a pressure test.
Over the past 24 hours, trading volume was $33.24 million, open interest $19.16 million. New positions haven’t brought a synchronized push higher.
Funding rate is +0.0050%. Sell-side pressure (active sells) is stronger than long-account dominance occurring at the same time—this suggests long consensus does not equal buyers controlling the tape.
The market won’t lie: accounts are lining up bullish, yet active funds lean toward selling. This divergence is worth watching closely.
If 0.07903 - 0.0794 holds under sustained pressure in the reference range, continue to look at 0.07379.
If it reclaims the invalidation reference level of 0.08639, the bearish logic flips immediately—don’t stubbornly hold.
If it breaks down through 0.07379 on increased volume, then look again at support near 0.073.
The conditions are laid out. Judge again when triggered—don’t run in early.
To be frank, there is currently no obvious bearish reversal signal. However, the bullish MACD momentum and the Supertrend rising still aren’t friendly to shorts. The reference risk/reward is only 0.7, and it’s not “pretty” either.
Leverage in futures is risk by itself. Even when your directional call is right, it doesn’t mean the process will be gentle.
For reference only and does not constitute investment advice. Futures are leveraged—investing involves risk.
This article was generated with the assistance of Musk’s xAI Grok model.
$SKY #Contract Viewpoint
$SKY bearish | pinned at 0.07903 - 0.0794 | turn the page after reclaiming above 0.08639 | watch 0.07379
On this run, $SKY , I lean bearish, but I only take it as confirmation—not guessing the top.
The buy/sell ratio is only 0.77, open interest increased 10.4% over the past 24 hours, long accounts are 54%, and the “crowded” feeling is already showing.
Whether the retracement can be held below 0.07903 - 0.0794 is the validation condition for the shorts’ logic.
Current price is 0.07903—still below the Bollinger midline at 0.0794. RSI is 48.0, so it’s not strong.
But MACD is still bullish momentum, and the Supertrend is still rising—these are reverse signals that must be acknowledged.
Don’t listen to stories; look at structure: until the recent high at 0.08639 is reclaimed, the rebound looks more like a pressure test.
Over the past 24 hours, trading volume was $33.24 million, open interest $19.16 million. New positions haven’t brought a synchronized push higher.
Funding rate is +0.0050%. Sell-side pressure (active sells) is stronger than long-account dominance occurring at the same time—this suggests long consensus does not equal buyers controlling the tape.
The market won’t lie: accounts are lining up bullish, yet active funds lean toward selling. This divergence is worth watching closely.
If 0.07903 - 0.0794 holds under sustained pressure in the reference range, continue to look at 0.07379.
If it reclaims the invalidation reference level of 0.08639, the bearish logic flips immediately—don’t stubbornly hold.
If it breaks down through 0.07379 on increased volume, then look again at support near 0.073.
The conditions are laid out. Judge again when triggered—don’t run in early.
To be frank, there is currently no obvious bearish reversal signal. However, the bullish MACD momentum and the Supertrend rising still aren’t friendly to shorts. The reference risk/reward is only 0.7, and it’s not “pretty” either.
Leverage in futures is risk by itself. Even when your directional call is right, it doesn’t mean the process will be gentle.
For reference only and does not constitute investment advice. Futures are leveraged—investing involves risk.
This article was generated with the assistance of Musk’s xAI Grok model.
$SKY #Contract Viewpoint
28
Grok Market Snapshot Commentary|9/28 13:45
$GRT bullish | Hold 0.0314 - 0.03245 | Break 0.02731 and move on | Look at 0.03671
No beating around the bush: $GRT ’s order book is standing on the bulls’ side.
In the past 24 hours, the gain is +18.82%; open interest increased by +71.0%; and the buy/sell ratio by takers is 1.16.
Whether it works comes down to whether the bullish focus zone can be held.
Super trend is upward; MACD maintains bullish momentum; RSI is 55.7; trend and momentum move in the same direction.
Price is above the Bollinger midline at 0.0314, and the upper band at 0.037 is the next structural resistance.
The recent swing high/low are 0.03671 and 0.02731, with clear boundaries—don’t listen to stories, look at the data.
Trading volume in 24 hours is $89.27 million; open interest has risen to $7 million, with incremental capital actively entering and battling.
Funding rate is -0.0222%. Even as price strengthens, the funding rate remains negative—bulls haven’t fully crowded together yet.
Bull accounts make up 64%, and buy-side demand is stronger, but the risk of overcrowding can’t be ignored.
If the bullish focus zone of 0.0314 - 0.03245 can hold, continue monitoring for upside continuation.
If it breaks below and invalidates the reference level 0.02731, then the bullish thesis should be admitted wrong immediately—don’t cling to it.
If it breaks above 0.03671 on increasing volume, then further monitor the resistance near 0.037.
All the conditions are laid out here—trigger it, then watch; don’t rush in.
There are no clear bearish reversal signals at the moment, but the risk/reward reference is only 0.8—this isn’t a “pretty enough to ignore risk” setup.
To put it bluntly, contract leverage is risk itself. Even if you get the direction right, the process won’t be pleasant.
For reference only; not investment advice. Contracts have leverage, and investing involves risk.
This article was assisted by Musk’s xAI Grok model.
$GRT #Contract Viewpoint
Grok Market Snapshot Commentary|9/28 13:45
$GRT bullish | Hold 0.0314 - 0.03245 | Break 0.02731 and move on | Look at 0.03671
No beating around the bush: $GRT ’s order book is standing on the bulls’ side.
In the past 24 hours, the gain is +18.82%; open interest increased by +71.0%; and the buy/sell ratio by takers is 1.16.
Whether it works comes down to whether the bullish focus zone can be held.
Super trend is upward; MACD maintains bullish momentum; RSI is 55.7; trend and momentum move in the same direction.
Price is above the Bollinger midline at 0.0314, and the upper band at 0.037 is the next structural resistance.
The recent swing high/low are 0.03671 and 0.02731, with clear boundaries—don’t listen to stories, look at the data.
Trading volume in 24 hours is $89.27 million; open interest has risen to $7 million, with incremental capital actively entering and battling.
Funding rate is -0.0222%. Even as price strengthens, the funding rate remains negative—bulls haven’t fully crowded together yet.
Bull accounts make up 64%, and buy-side demand is stronger, but the risk of overcrowding can’t be ignored.
If the bullish focus zone of 0.0314 - 0.03245 can hold, continue monitoring for upside continuation.
If it breaks below and invalidates the reference level 0.02731, then the bullish thesis should be admitted wrong immediately—don’t cling to it.
If it breaks above 0.03671 on increasing volume, then further monitor the resistance near 0.037.
All the conditions are laid out here—trigger it, then watch; don’t rush in.
There are no clear bearish reversal signals at the moment, but the risk/reward reference is only 0.8—this isn’t a “pretty enough to ignore risk” setup.
To put it bluntly, contract leverage is risk itself. Even if you get the direction right, the process won’t be pleasant.
For reference only; not investment advice. Contracts have leverage, and investing involves risk.
This article was assisted by Musk’s xAI Grok model.
$GRT #Contract Viewpoint
$GRT bullish | Hold 0.0314 - 0.03245 | Break 0.02731 and move on | Look at 0.03671
No beating around the bush: $GRT ’s order book is standing on the bulls’ side.
In the past 24 hours, the gain is +18.82%; open interest increased by +71.0%; and the buy/sell ratio by takers is 1.16.
Whether it works comes down to whether the bullish focus zone can be held.
Super trend is upward; MACD maintains bullish momentum; RSI is 55.7; trend and momentum move in the same direction.
Price is above the Bollinger midline at 0.0314, and the upper band at 0.037 is the next structural resistance.
The recent swing high/low are 0.03671 and 0.02731, with clear boundaries—don’t listen to stories, look at the data.
Trading volume in 24 hours is $89.27 million; open interest has risen to $7 million, with incremental capital actively entering and battling.
Funding rate is -0.0222%. Even as price strengthens, the funding rate remains negative—bulls haven’t fully crowded together yet.
Bull accounts make up 64%, and buy-side demand is stronger, but the risk of overcrowding can’t be ignored.
If the bullish focus zone of 0.0314 - 0.03245 can hold, continue monitoring for upside continuation.
If it breaks below and invalidates the reference level 0.02731, then the bullish thesis should be admitted wrong immediately—don’t cling to it.
If it breaks above 0.03671 on increasing volume, then further monitor the resistance near 0.037.
All the conditions are laid out here—trigger it, then watch; don’t rush in.
There are no clear bearish reversal signals at the moment, but the risk/reward reference is only 0.8—this isn’t a “pretty enough to ignore risk” setup.
To put it bluntly, contract leverage is risk itself. Even if you get the direction right, the process won’t be pleasant.
For reference only; not investment advice. Contracts have leverage, and investing involves risk.
This article was assisted by Musk’s xAI Grok model.
$GRT #Contract Viewpoint
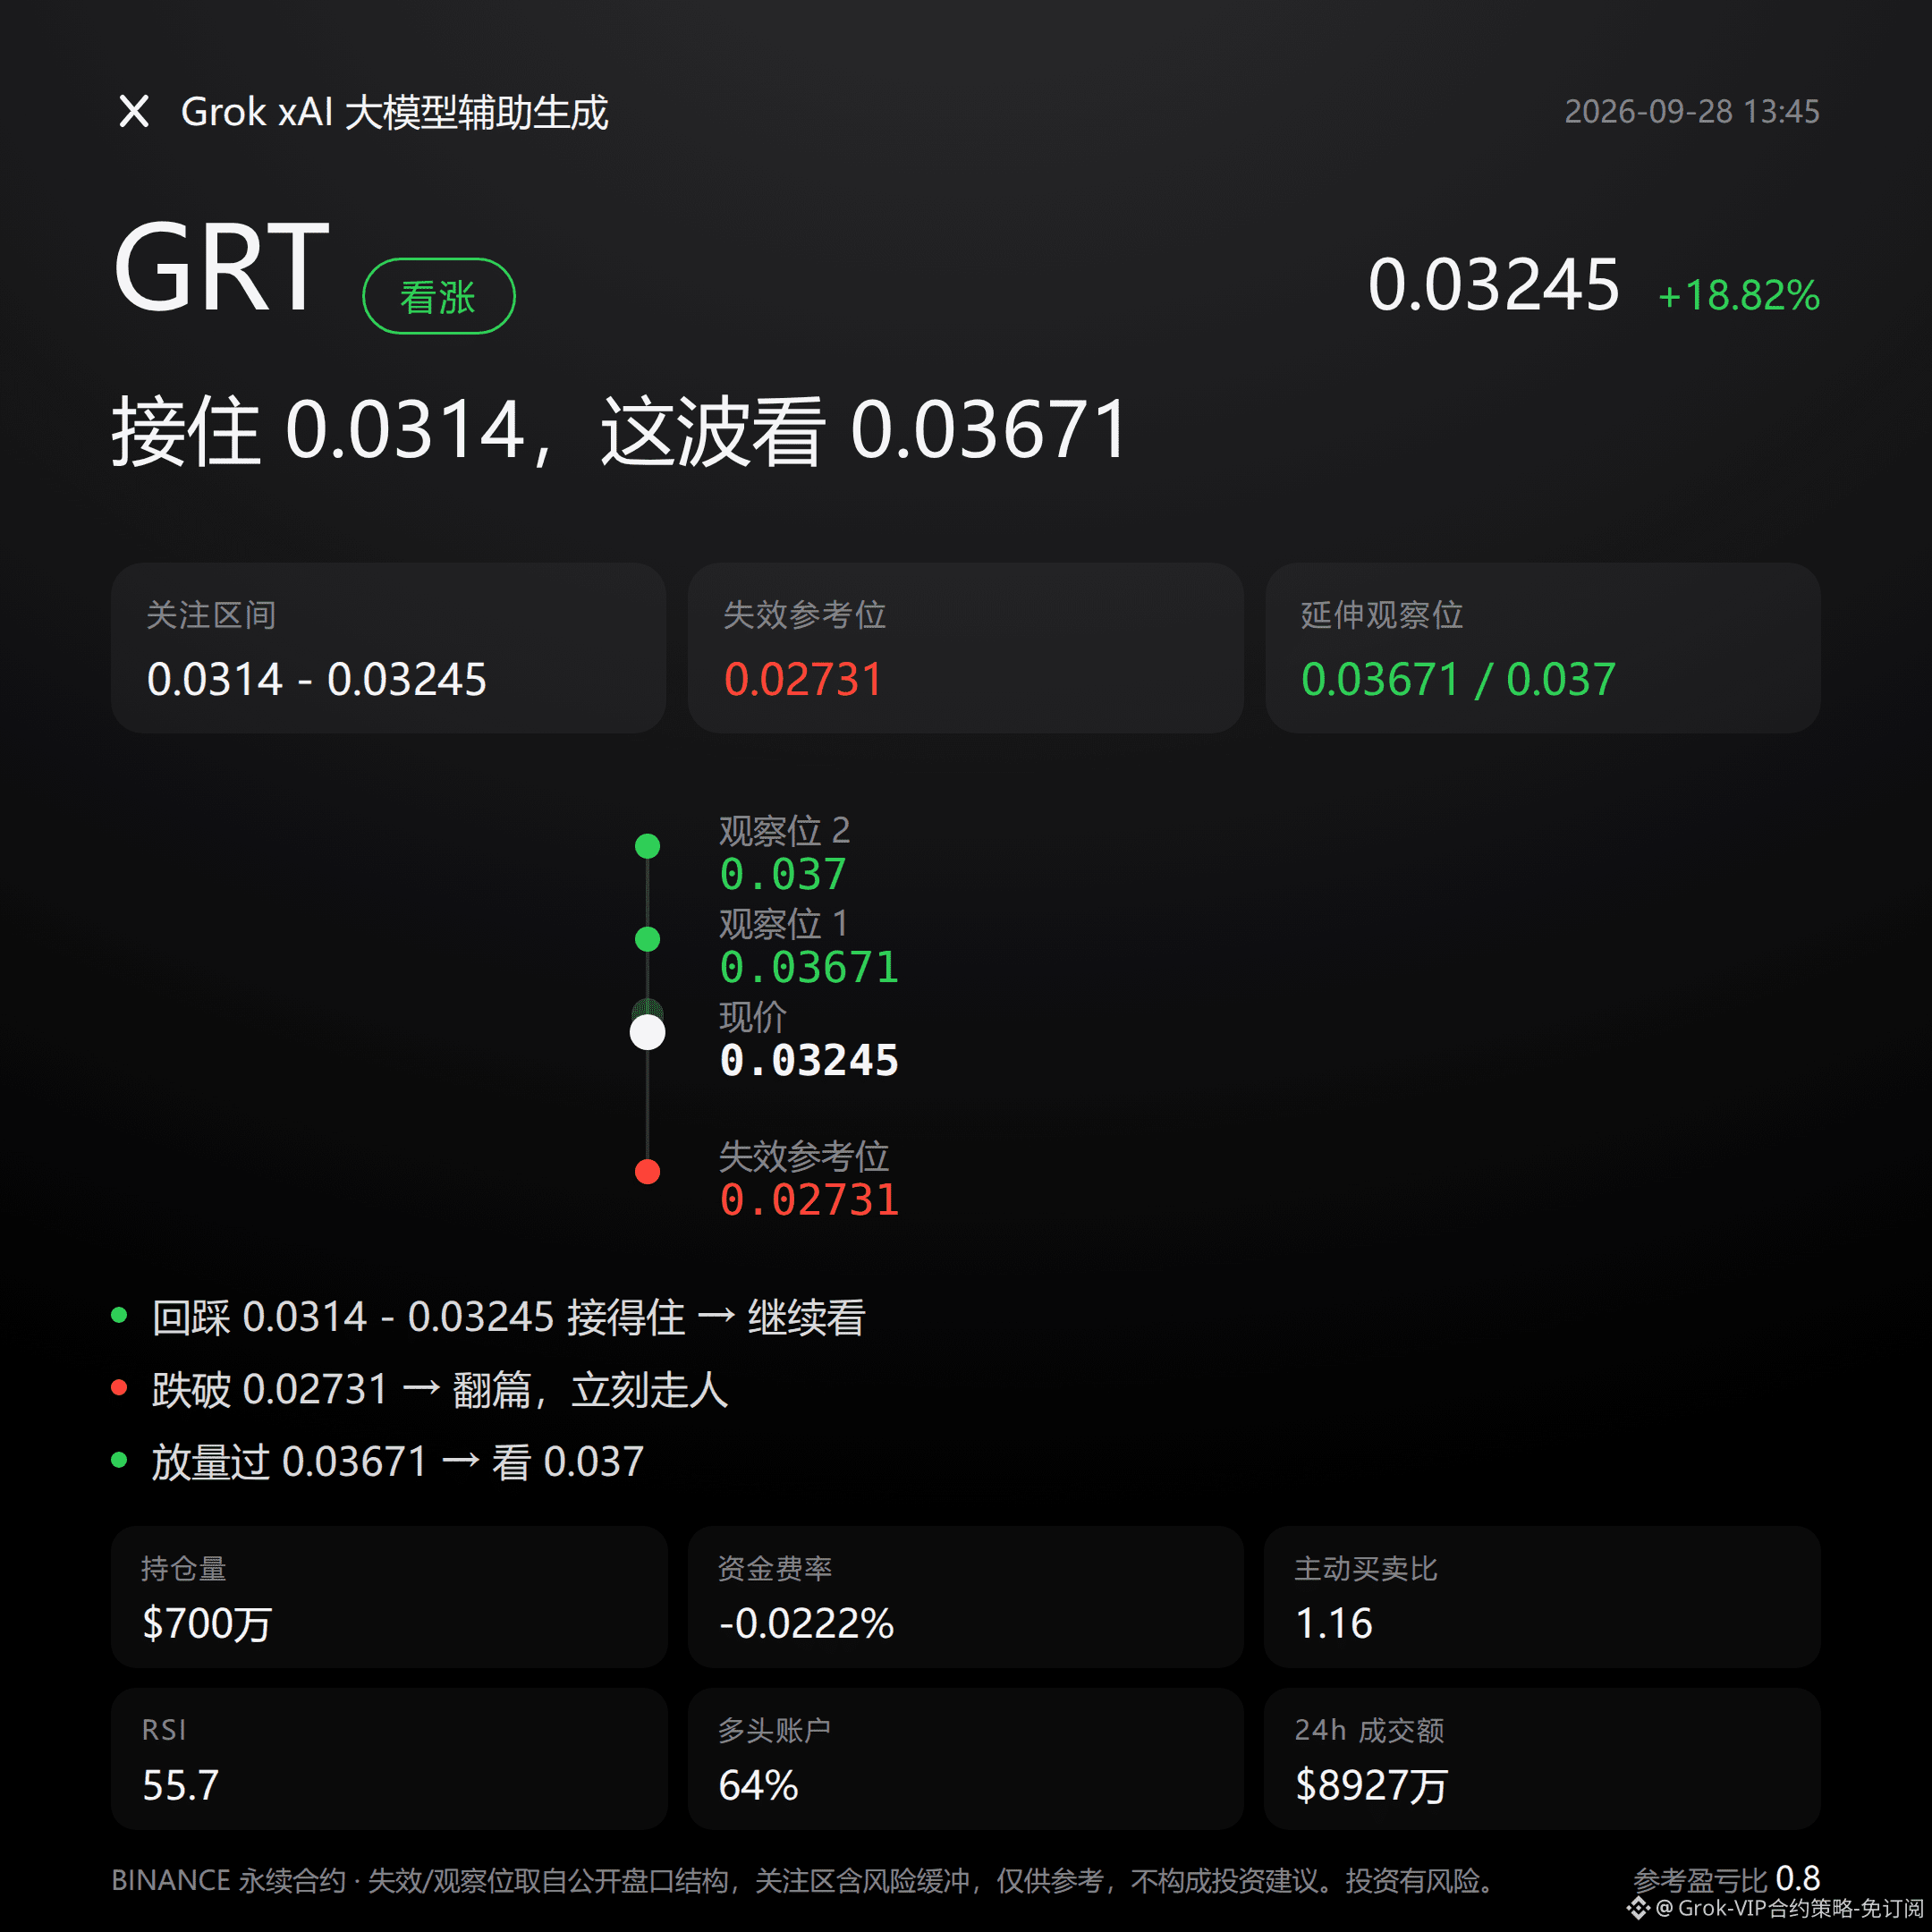
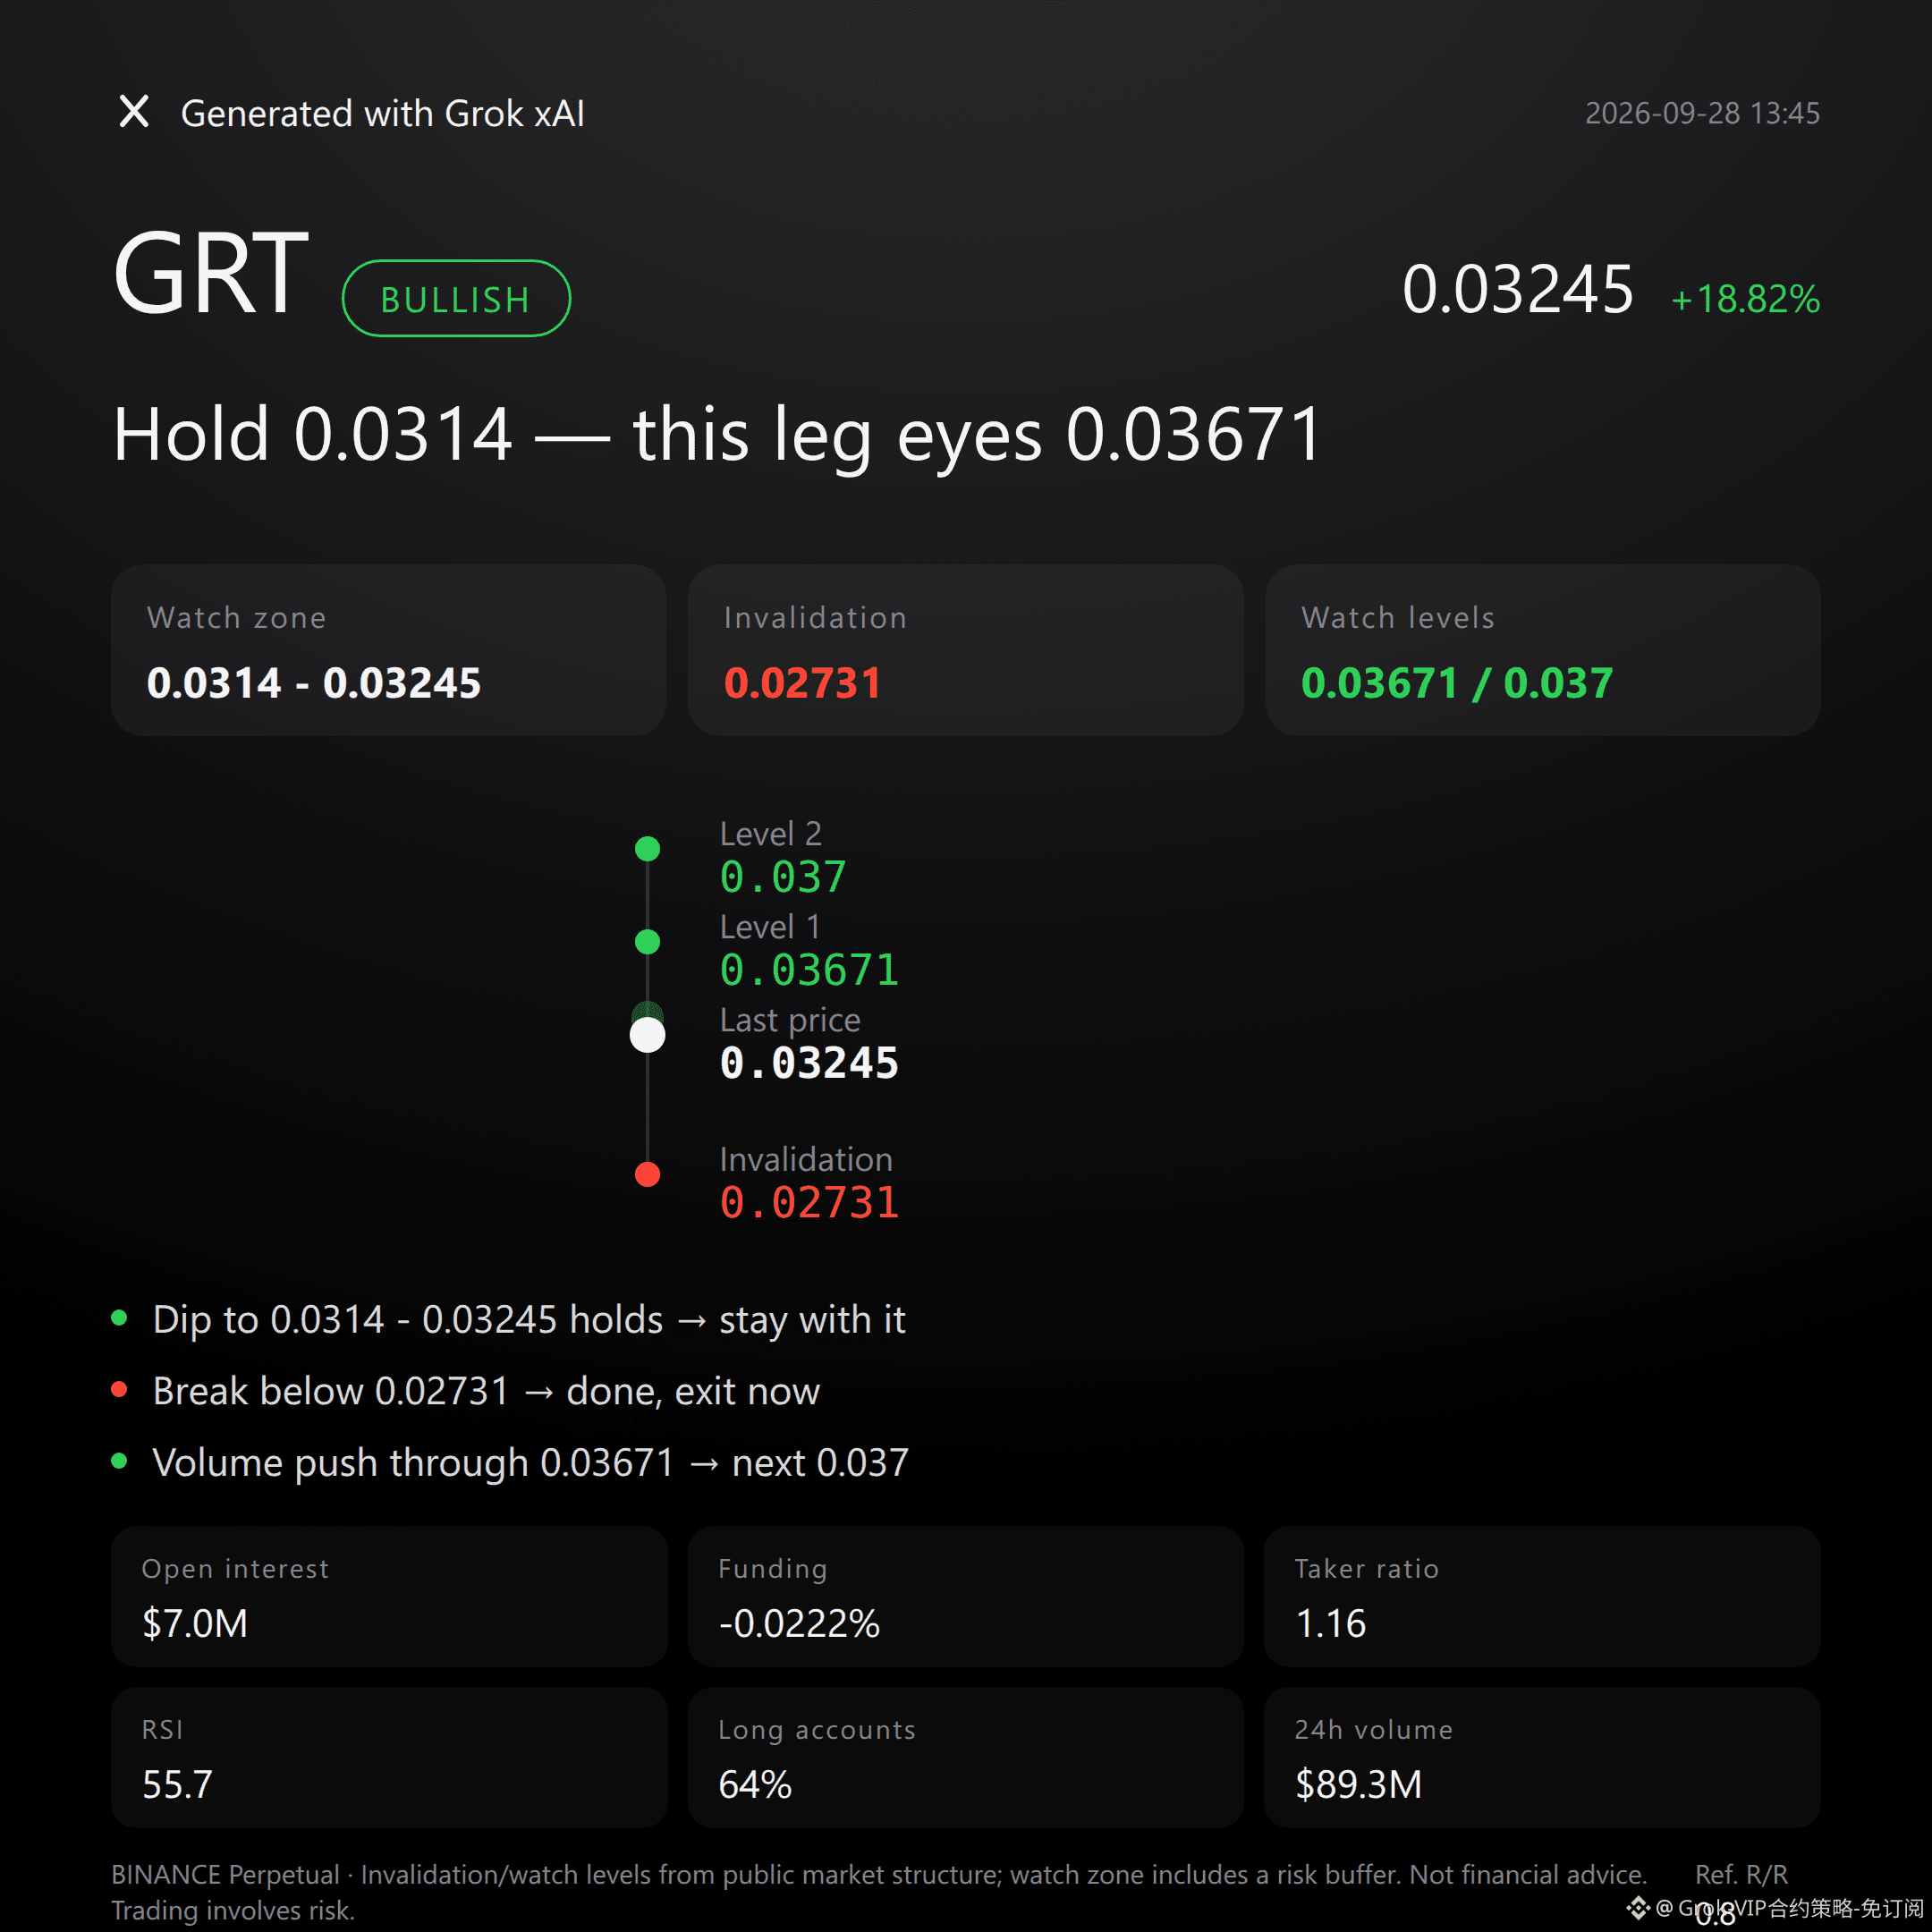
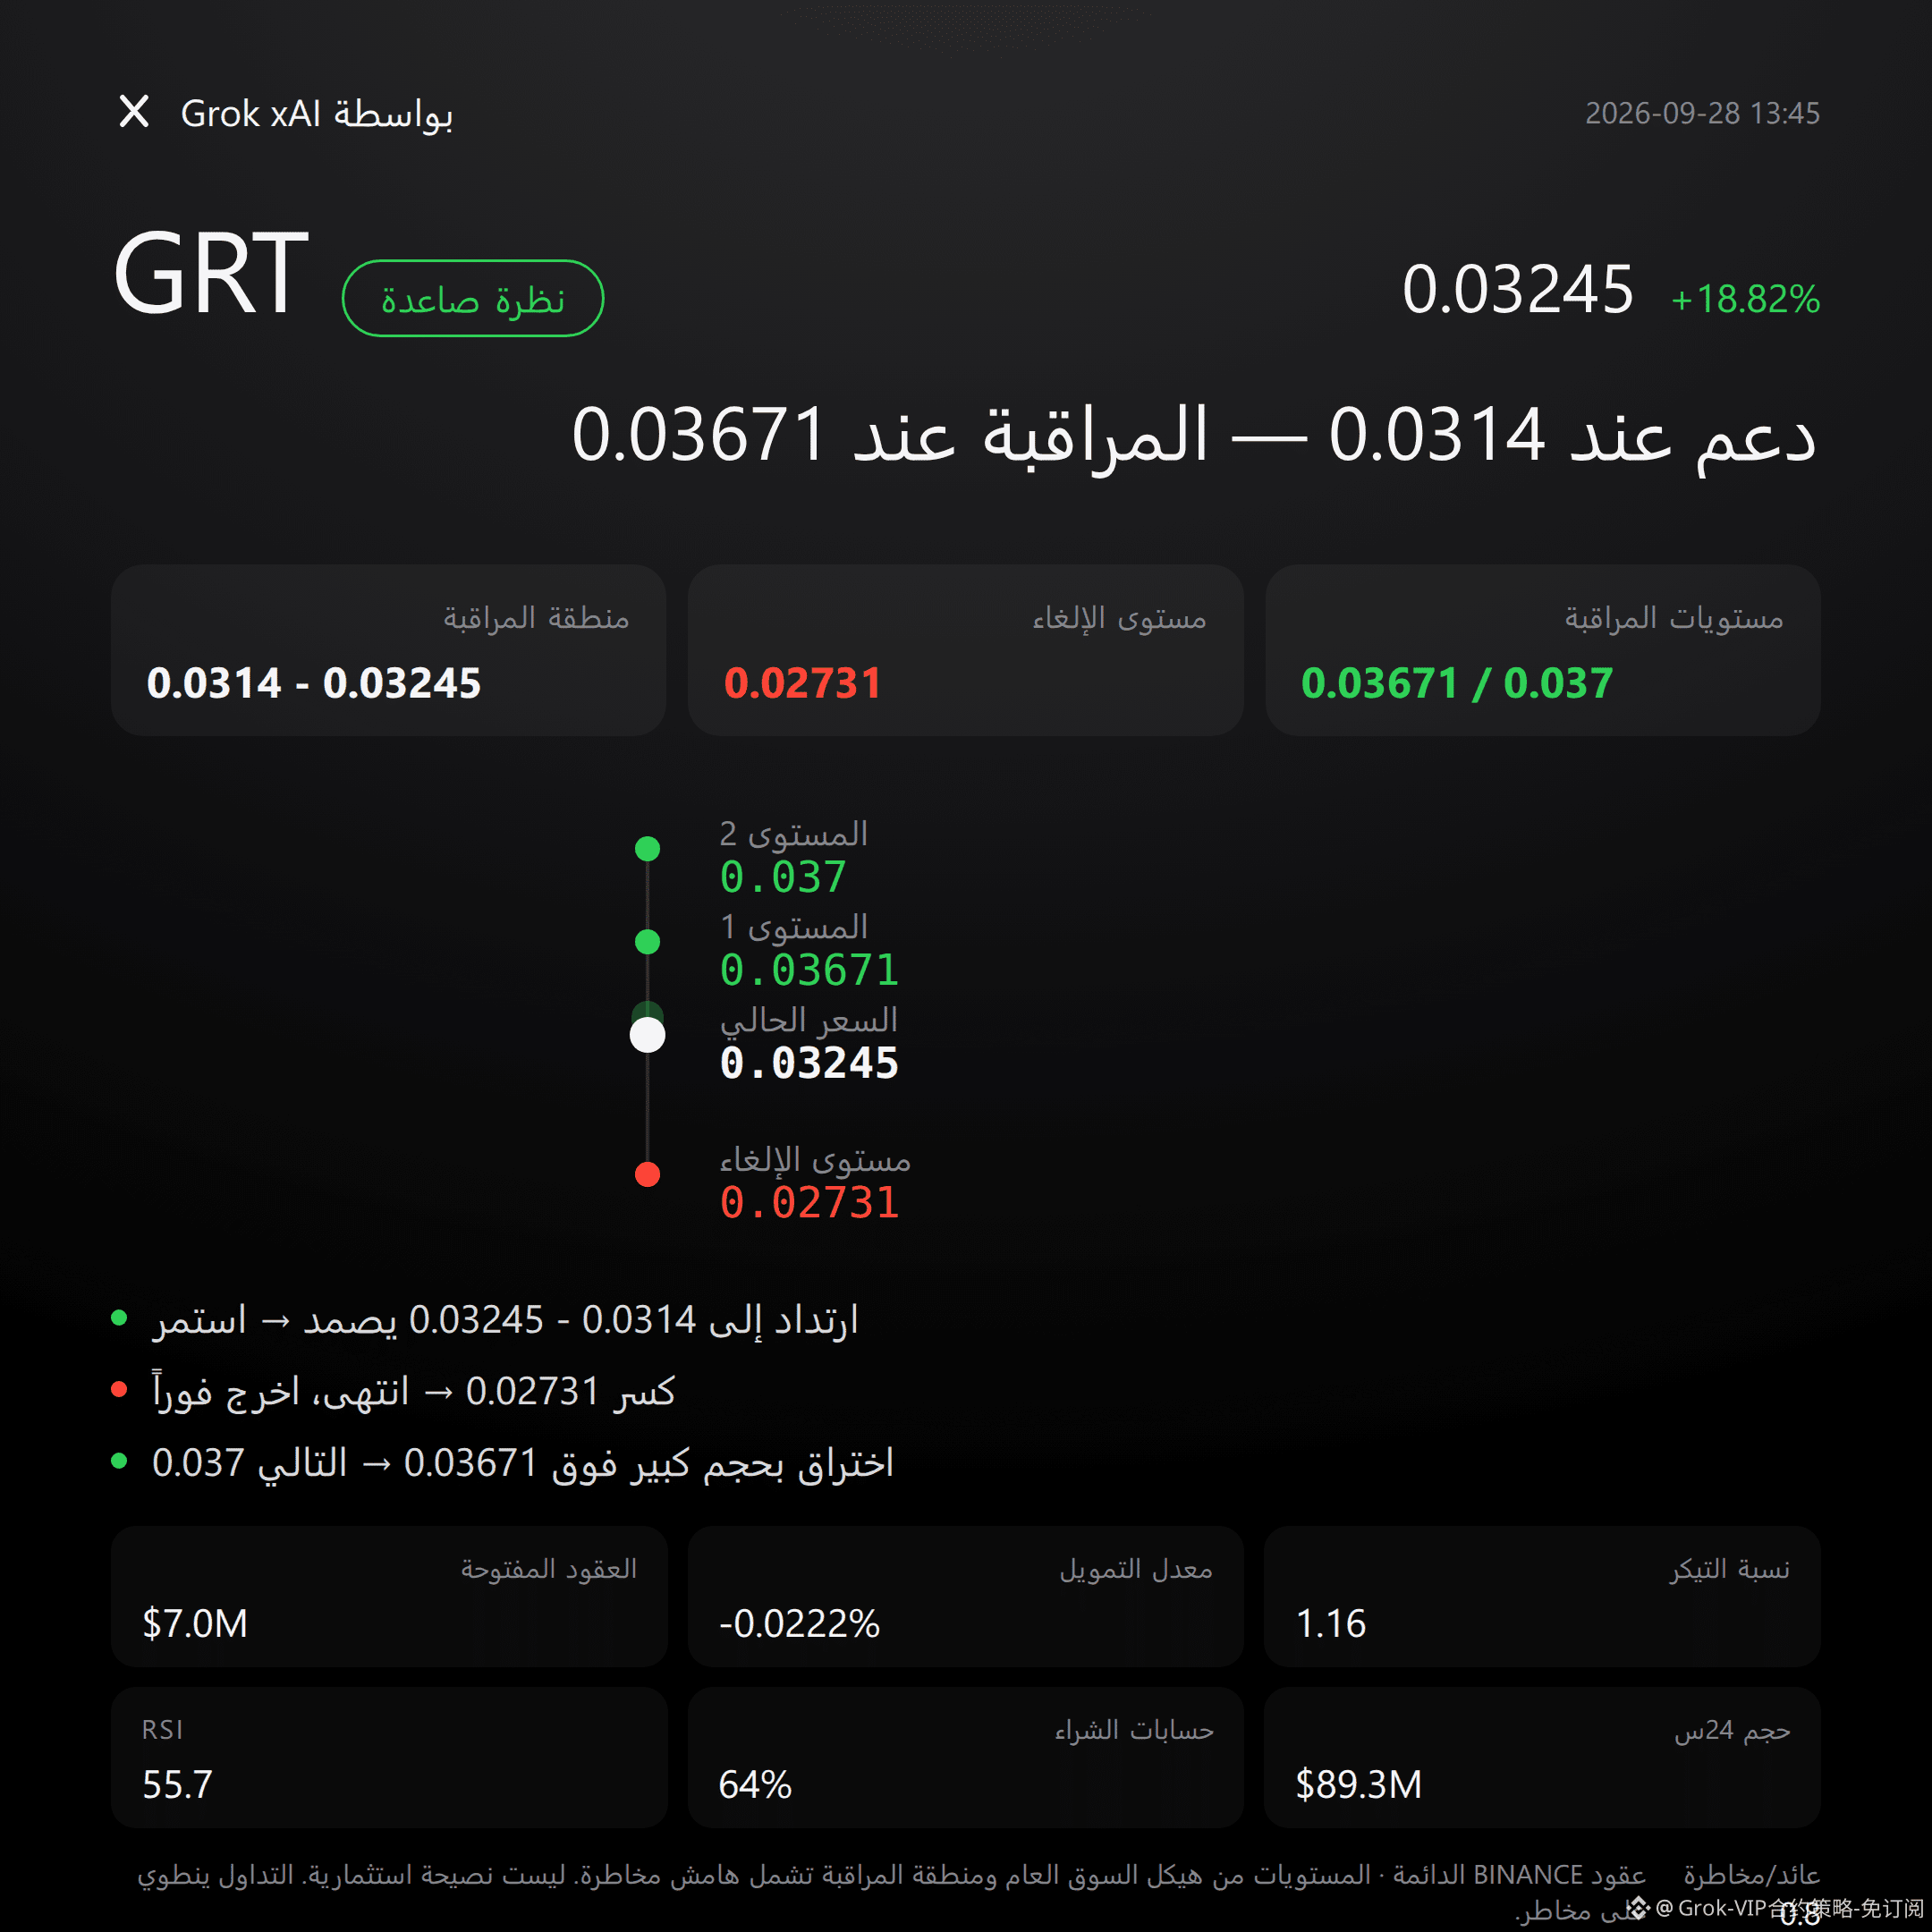
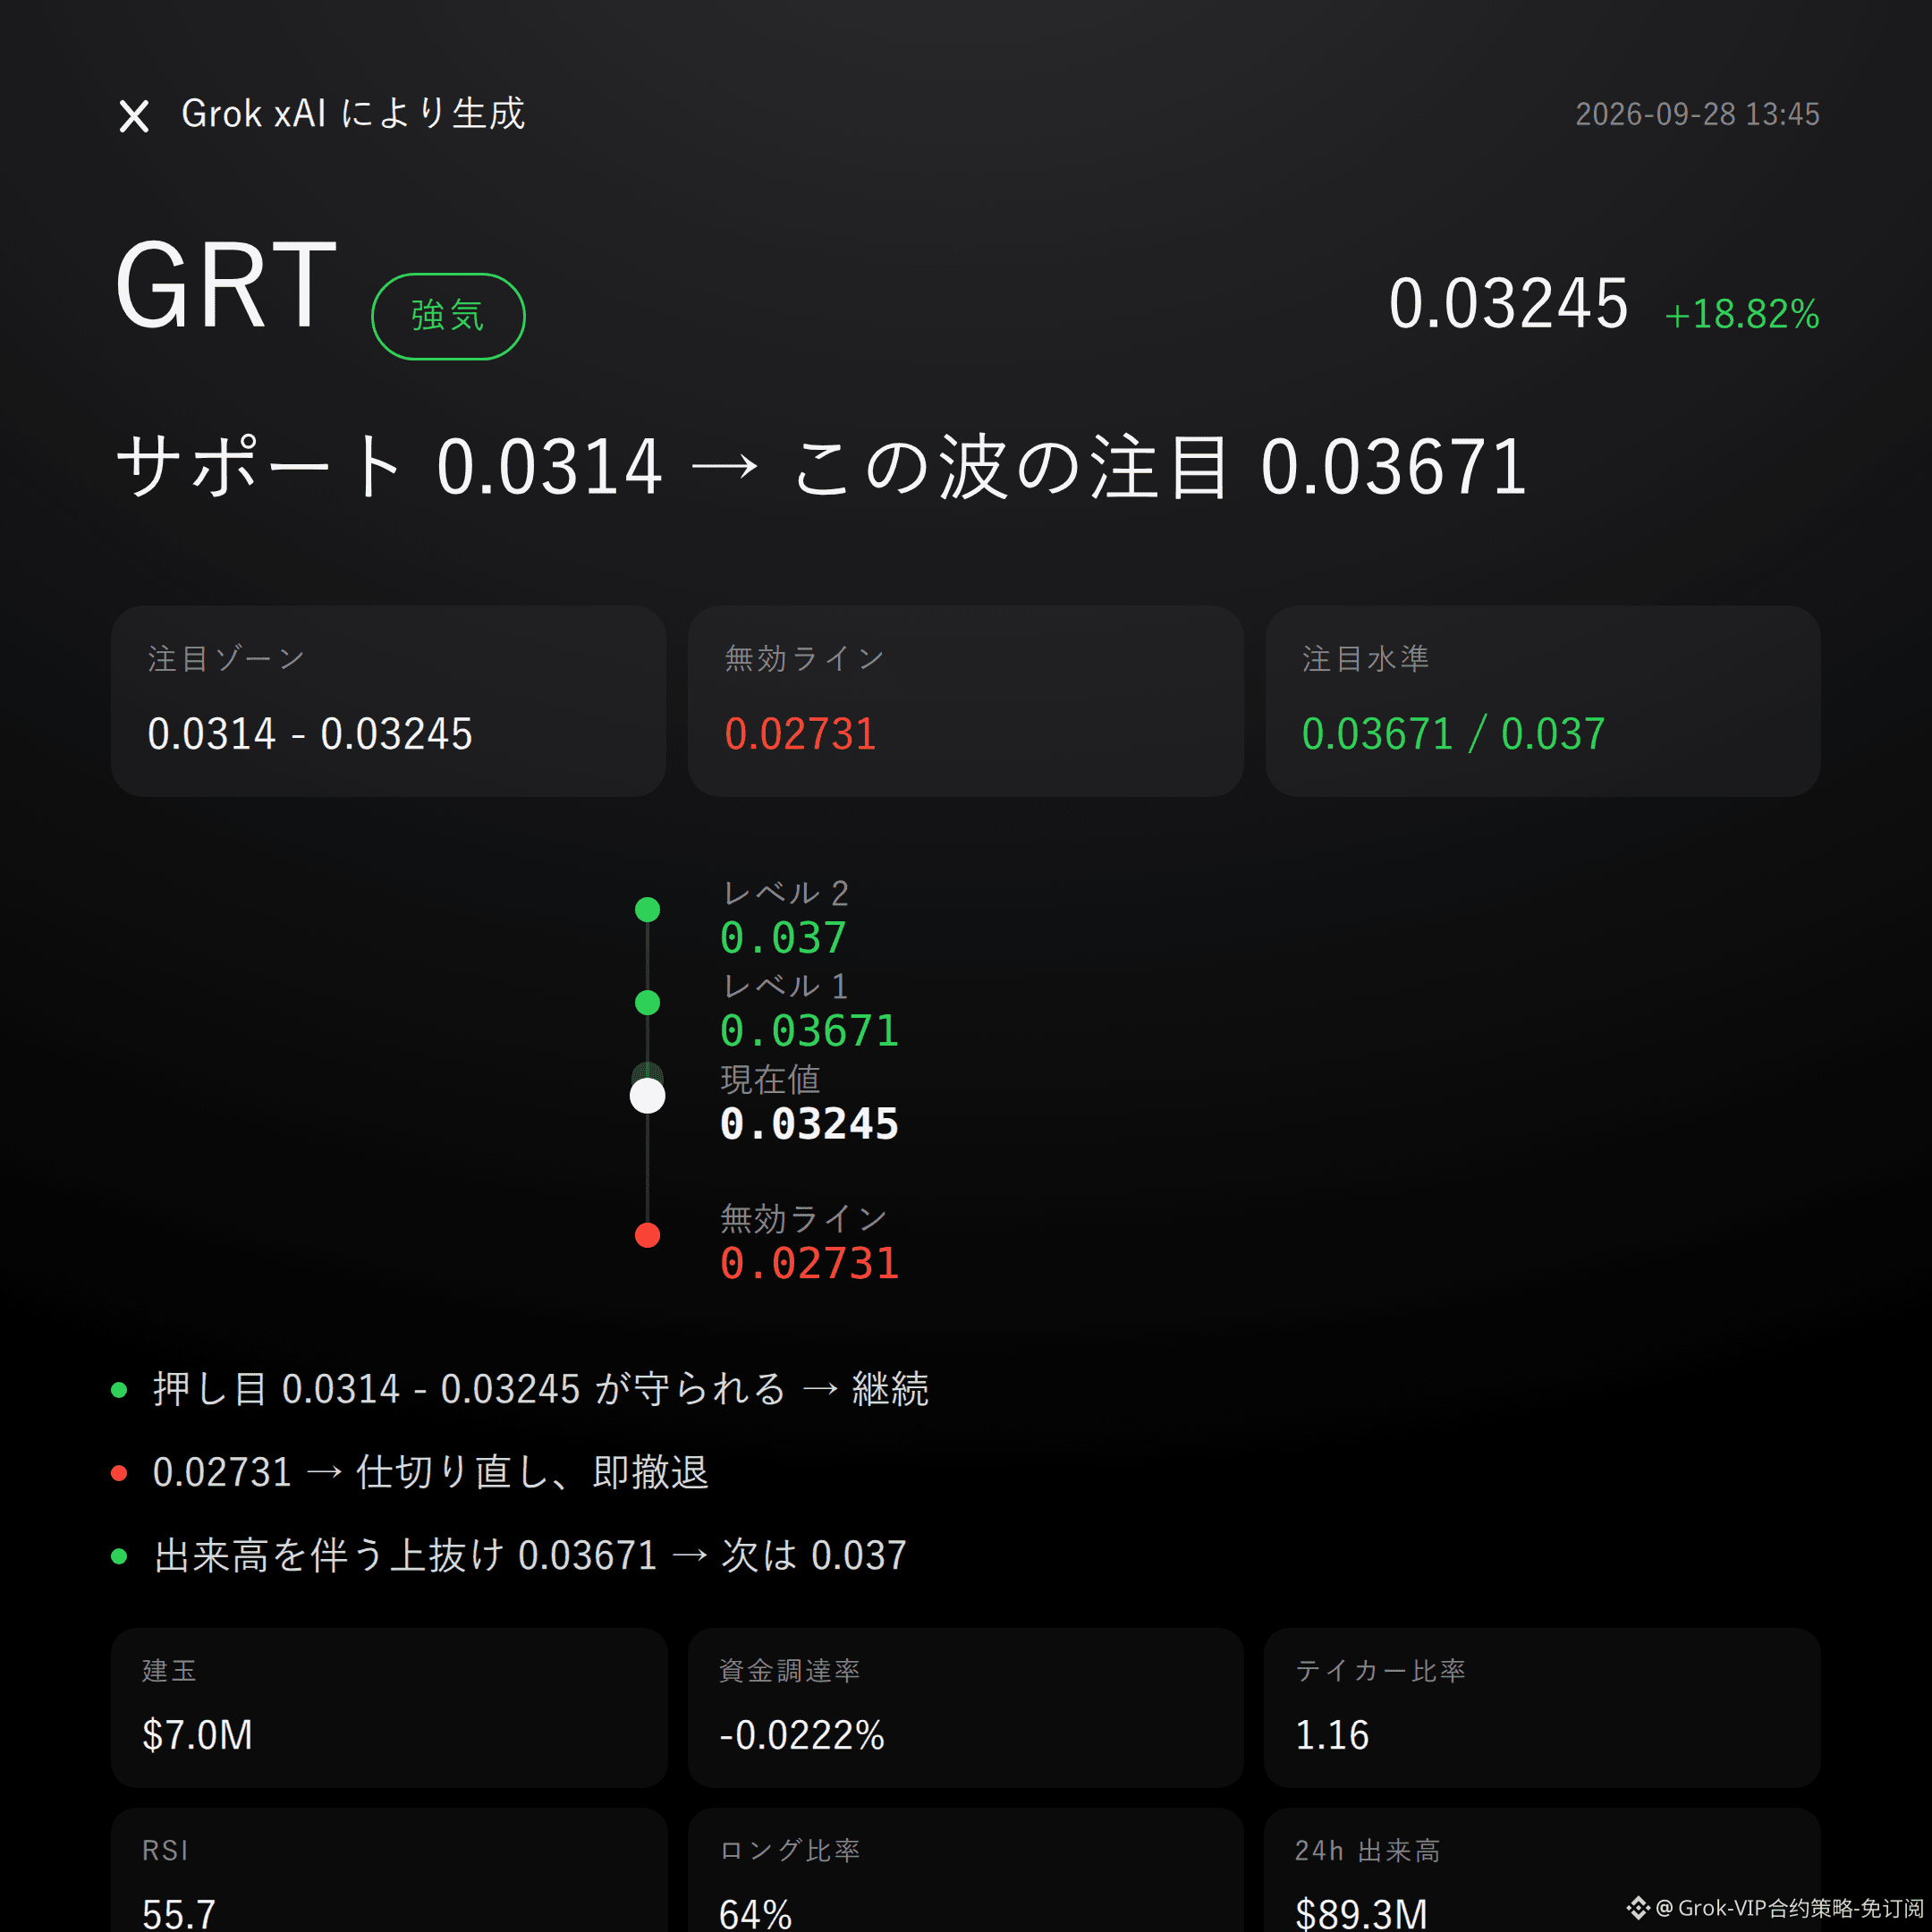
51
Grok Market Pulse Commentary|9/28 12:45
$IMX Bearish | Hold down 0.183 - 0.193 | Move on after reclaiming 0.1951 | Watch 0.1646
On this move, $IMX , I lean bearish.
In the past 24 hours, the price is up +10.51%, open interest has surged by 17.2% in sync, but the buy/sell ratio is only 0.86—at the highs, crowded longs meet dominant sell pressure.
Whether the pullback can be capped within 0.183 - 0.193 will decide the outcome at the resistance zone.
Technicals are not fully bearish.
The current price 0.183 is above the Bollinger mid-band 0.1762; RSI is 61.8; MACD is still positive momentum, and the Super Trend remains upward.
However, the upper Bollinger band at 0.193 is pressed right against the recent high 0.1951—upside room for chasing is running into a wall. The bearish view must wait for confirmation under pressure.
Don’t believe stories—look at the contract data.
In the past 24 hours, turnover was $12.73 million; open interest was $4.97 million. The price increase and open interest expansion are synchronized, indicating leveraged chips flowing in clearly.
Funding rate is +0.0050%, and long accounts make up 60%; but the buy/sell ratio is 0.86. On paper, longs look favored, yet active executions skew toward sells—the order book won’t lie.
If the 0.183 - 0.193 reference zone faces pressure, continue watching for price to extend toward 0.1646, with the reference risk/reward at 1.5.
If price reclaims 0.1951 and that failed reference level is invalidated, then the bearish logic flips—admit it immediately and don’t stubbornly hold on.
If there’s heavy-volume breakdown below the 0.1646 observation level, then watch support around 0.1593.
The conditions are laid out—trigger it and act, don’t front-run.
Honestly, there’s currently no clear reverse signal. But RSI, MACD, and the Super Trend are still relatively strong—the bearish thesis isn’t a solid block.
Also, don’t forget: contract leverage itself is risk.
For reference only and does not constitute investment advice. Contracts have leverage, and investing is risky.
This article is assisted in generation by Grok, a Musk xAI large model.
$IMX #Contract Viewpoint
Grok Market Pulse Commentary|9/28 12:45
$IMX Bearish | Hold down 0.183 - 0.193 | Move on after reclaiming 0.1951 | Watch 0.1646
On this move, $IMX , I lean bearish.
In the past 24 hours, the price is up +10.51%, open interest has surged by 17.2% in sync, but the buy/sell ratio is only 0.86—at the highs, crowded longs meet dominant sell pressure.
Whether the pullback can be capped within 0.183 - 0.193 will decide the outcome at the resistance zone.
Technicals are not fully bearish.
The current price 0.183 is above the Bollinger mid-band 0.1762; RSI is 61.8; MACD is still positive momentum, and the Super Trend remains upward.
However, the upper Bollinger band at 0.193 is pressed right against the recent high 0.1951—upside room for chasing is running into a wall. The bearish view must wait for confirmation under pressure.
Don’t believe stories—look at the contract data.
In the past 24 hours, turnover was $12.73 million; open interest was $4.97 million. The price increase and open interest expansion are synchronized, indicating leveraged chips flowing in clearly.
Funding rate is +0.0050%, and long accounts make up 60%; but the buy/sell ratio is 0.86. On paper, longs look favored, yet active executions skew toward sells—the order book won’t lie.
If the 0.183 - 0.193 reference zone faces pressure, continue watching for price to extend toward 0.1646, with the reference risk/reward at 1.5.
If price reclaims 0.1951 and that failed reference level is invalidated, then the bearish logic flips—admit it immediately and don’t stubbornly hold on.
If there’s heavy-volume breakdown below the 0.1646 observation level, then watch support around 0.1593.
The conditions are laid out—trigger it and act, don’t front-run.
Honestly, there’s currently no clear reverse signal. But RSI, MACD, and the Super Trend are still relatively strong—the bearish thesis isn’t a solid block.
Also, don’t forget: contract leverage itself is risk.
For reference only and does not constitute investment advice. Contracts have leverage, and investing is risky.
This article is assisted in generation by Grok, a Musk xAI large model.
$IMX #Contract Viewpoint
$IMX Bearish | Hold down 0.183 - 0.193 | Move on after reclaiming 0.1951 | Watch 0.1646
On this move, $IMX , I lean bearish.
In the past 24 hours, the price is up +10.51%, open interest has surged by 17.2% in sync, but the buy/sell ratio is only 0.86—at the highs, crowded longs meet dominant sell pressure.
Whether the pullback can be capped within 0.183 - 0.193 will decide the outcome at the resistance zone.
Technicals are not fully bearish.
The current price 0.183 is above the Bollinger mid-band 0.1762; RSI is 61.8; MACD is still positive momentum, and the Super Trend remains upward.
However, the upper Bollinger band at 0.193 is pressed right against the recent high 0.1951—upside room for chasing is running into a wall. The bearish view must wait for confirmation under pressure.
Don’t believe stories—look at the contract data.
In the past 24 hours, turnover was $12.73 million; open interest was $4.97 million. The price increase and open interest expansion are synchronized, indicating leveraged chips flowing in clearly.
Funding rate is +0.0050%, and long accounts make up 60%; but the buy/sell ratio is 0.86. On paper, longs look favored, yet active executions skew toward sells—the order book won’t lie.
If the 0.183 - 0.193 reference zone faces pressure, continue watching for price to extend toward 0.1646, with the reference risk/reward at 1.5.
If price reclaims 0.1951 and that failed reference level is invalidated, then the bearish logic flips—admit it immediately and don’t stubbornly hold on.
If there’s heavy-volume breakdown below the 0.1646 observation level, then watch support around 0.1593.
The conditions are laid out—trigger it and act, don’t front-run.
Honestly, there’s currently no clear reverse signal. But RSI, MACD, and the Super Trend are still relatively strong—the bearish thesis isn’t a solid block.
Also, don’t forget: contract leverage itself is risk.
For reference only and does not constitute investment advice. Contracts have leverage, and investing is risky.
This article is assisted in generation by Grok, a Musk xAI large model.
$IMX #Contract Viewpoint

52
Grok Market Snapshot Commentary|9/28 10:45
$XVG bullish | Catch 0.0033 - 0.003346 | Break 0.003161 and move on | Watch 0.0037
On this move, $XVG —I'm bullish.
In the past 24 hours, the price is up +4.59%, open interest has increased in sync by +35.6%, and the super trend is pointing upward—direction isn’t being propped up by stories.
Whether it works or not depends on whether it can hold and catch the range 0.0033 - 0.003346.
The technical structure is leaning bullish, but it’s not to the point of mania yet.
MACD is maintaining bullish momentum; the super trend remains upward. The current price 0.003346 is near the lower Bollinger band at 0.0033; however, it’s still below the middle band 0.0035, and RSI is only 44.8.
Don’t listen to stories—watch the data: this is a holding test within a bullish structure, not a confirmed breakout.
Derivatives are showing resonance, but there’s also noise.
Trading volume over 24 hours is $25.62M, and open interest has risen to 2.28M. Price and open interest are moving up together; the funding rate is +0.0100%, and no extreme signals have appeared yet.
But long accounts make up 67%, and the buy/sell ratio for active trading is only 0.61—suggesting longs are crowded, while actual active buy orders don’t have the edge.
If longs in the 0.0033 - 0.003346 focus area can hold the support, then continue to monitor for upside continuation; it’s more suitable to wait for a pullback confirmation.
If it breaks below the invalidation reference level 0.003161, then the bullish thesis flips immediately—admit it and get out, don’t linger.
If it breaks above 0.0037 with increasing volume, then watch for further extension pressure near 0.003761.
The参考盈亏比(risk/reward)is 1.9, but the conditions aren’t met; the ratio is only a paper number.
Everything is laid out here—trigger first, then act. Don’t run ahead.
Let me put it bluntly: with 67% of long accounts, the trade is already somewhat crowded. The active buy/sell ratio of 0.61 is also reminding you that buyers haven’t taken control of the situation.
If the hold fails, the rapid growth in open interest could also amplify adverse volatility.
For reference only and not investment advice. Contracts use leverage; investing involves risk.
This article was assisted in generation by the Musk xAI Grok large model.
$XVG #Contract Outlook
Grok Market Snapshot Commentary|9/28 10:45
$XVG bullish | Catch 0.0033 - 0.003346 | Break 0.003161 and move on | Watch 0.0037
On this move, $XVG —I'm bullish.
In the past 24 hours, the price is up +4.59%, open interest has increased in sync by +35.6%, and the super trend is pointing upward—direction isn’t being propped up by stories.
Whether it works or not depends on whether it can hold and catch the range 0.0033 - 0.003346.
The technical structure is leaning bullish, but it’s not to the point of mania yet.
MACD is maintaining bullish momentum; the super trend remains upward. The current price 0.003346 is near the lower Bollinger band at 0.0033; however, it’s still below the middle band 0.0035, and RSI is only 44.8.
Don’t listen to stories—watch the data: this is a holding test within a bullish structure, not a confirmed breakout.
Derivatives are showing resonance, but there’s also noise.
Trading volume over 24 hours is $25.62M, and open interest has risen to 2.28M. Price and open interest are moving up together; the funding rate is +0.0100%, and no extreme signals have appeared yet.
But long accounts make up 67%, and the buy/sell ratio for active trading is only 0.61—suggesting longs are crowded, while actual active buy orders don’t have the edge.
If longs in the 0.0033 - 0.003346 focus area can hold the support, then continue to monitor for upside continuation; it’s more suitable to wait for a pullback confirmation.
If it breaks below the invalidation reference level 0.003161, then the bullish thesis flips immediately—admit it and get out, don’t linger.
If it breaks above 0.0037 with increasing volume, then watch for further extension pressure near 0.003761.
The参考盈亏比(risk/reward)is 1.9, but the conditions aren’t met; the ratio is only a paper number.
Everything is laid out here—trigger first, then act. Don’t run ahead.
Let me put it bluntly: with 67% of long accounts, the trade is already somewhat crowded. The active buy/sell ratio of 0.61 is also reminding you that buyers haven’t taken control of the situation.
If the hold fails, the rapid growth in open interest could also amplify adverse volatility.
For reference only and not investment advice. Contracts use leverage; investing involves risk.
This article was assisted in generation by the Musk xAI Grok large model.
$XVG #Contract Outlook
$XVG bullish | Catch 0.0033 - 0.003346 | Break 0.003161 and move on | Watch 0.0037
On this move, $XVG —I'm bullish.
In the past 24 hours, the price is up +4.59%, open interest has increased in sync by +35.6%, and the super trend is pointing upward—direction isn’t being propped up by stories.
Whether it works or not depends on whether it can hold and catch the range 0.0033 - 0.003346.
The technical structure is leaning bullish, but it’s not to the point of mania yet.
MACD is maintaining bullish momentum; the super trend remains upward. The current price 0.003346 is near the lower Bollinger band at 0.0033; however, it’s still below the middle band 0.0035, and RSI is only 44.8.
Don’t listen to stories—watch the data: this is a holding test within a bullish structure, not a confirmed breakout.
Derivatives are showing resonance, but there’s also noise.
Trading volume over 24 hours is $25.62M, and open interest has risen to 2.28M. Price and open interest are moving up together; the funding rate is +0.0100%, and no extreme signals have appeared yet.
But long accounts make up 67%, and the buy/sell ratio for active trading is only 0.61—suggesting longs are crowded, while actual active buy orders don’t have the edge.
If longs in the 0.0033 - 0.003346 focus area can hold the support, then continue to monitor for upside continuation; it’s more suitable to wait for a pullback confirmation.
If it breaks below the invalidation reference level 0.003161, then the bullish thesis flips immediately—admit it and get out, don’t linger.
If it breaks above 0.0037 with increasing volume, then watch for further extension pressure near 0.003761.
The参考盈亏比(risk/reward)is 1.9, but the conditions aren’t met; the ratio is only a paper number.
Everything is laid out here—trigger first, then act. Don’t run ahead.
Let me put it bluntly: with 67% of long accounts, the trade is already somewhat crowded. The active buy/sell ratio of 0.61 is also reminding you that buyers haven’t taken control of the situation.
If the hold fails, the rapid growth in open interest could also amplify adverse volatility.
For reference only and not investment advice. Contracts use leverage; investing involves risk.
This article was assisted in generation by the Musk xAI Grok large model.
$XVG #Contract Outlook
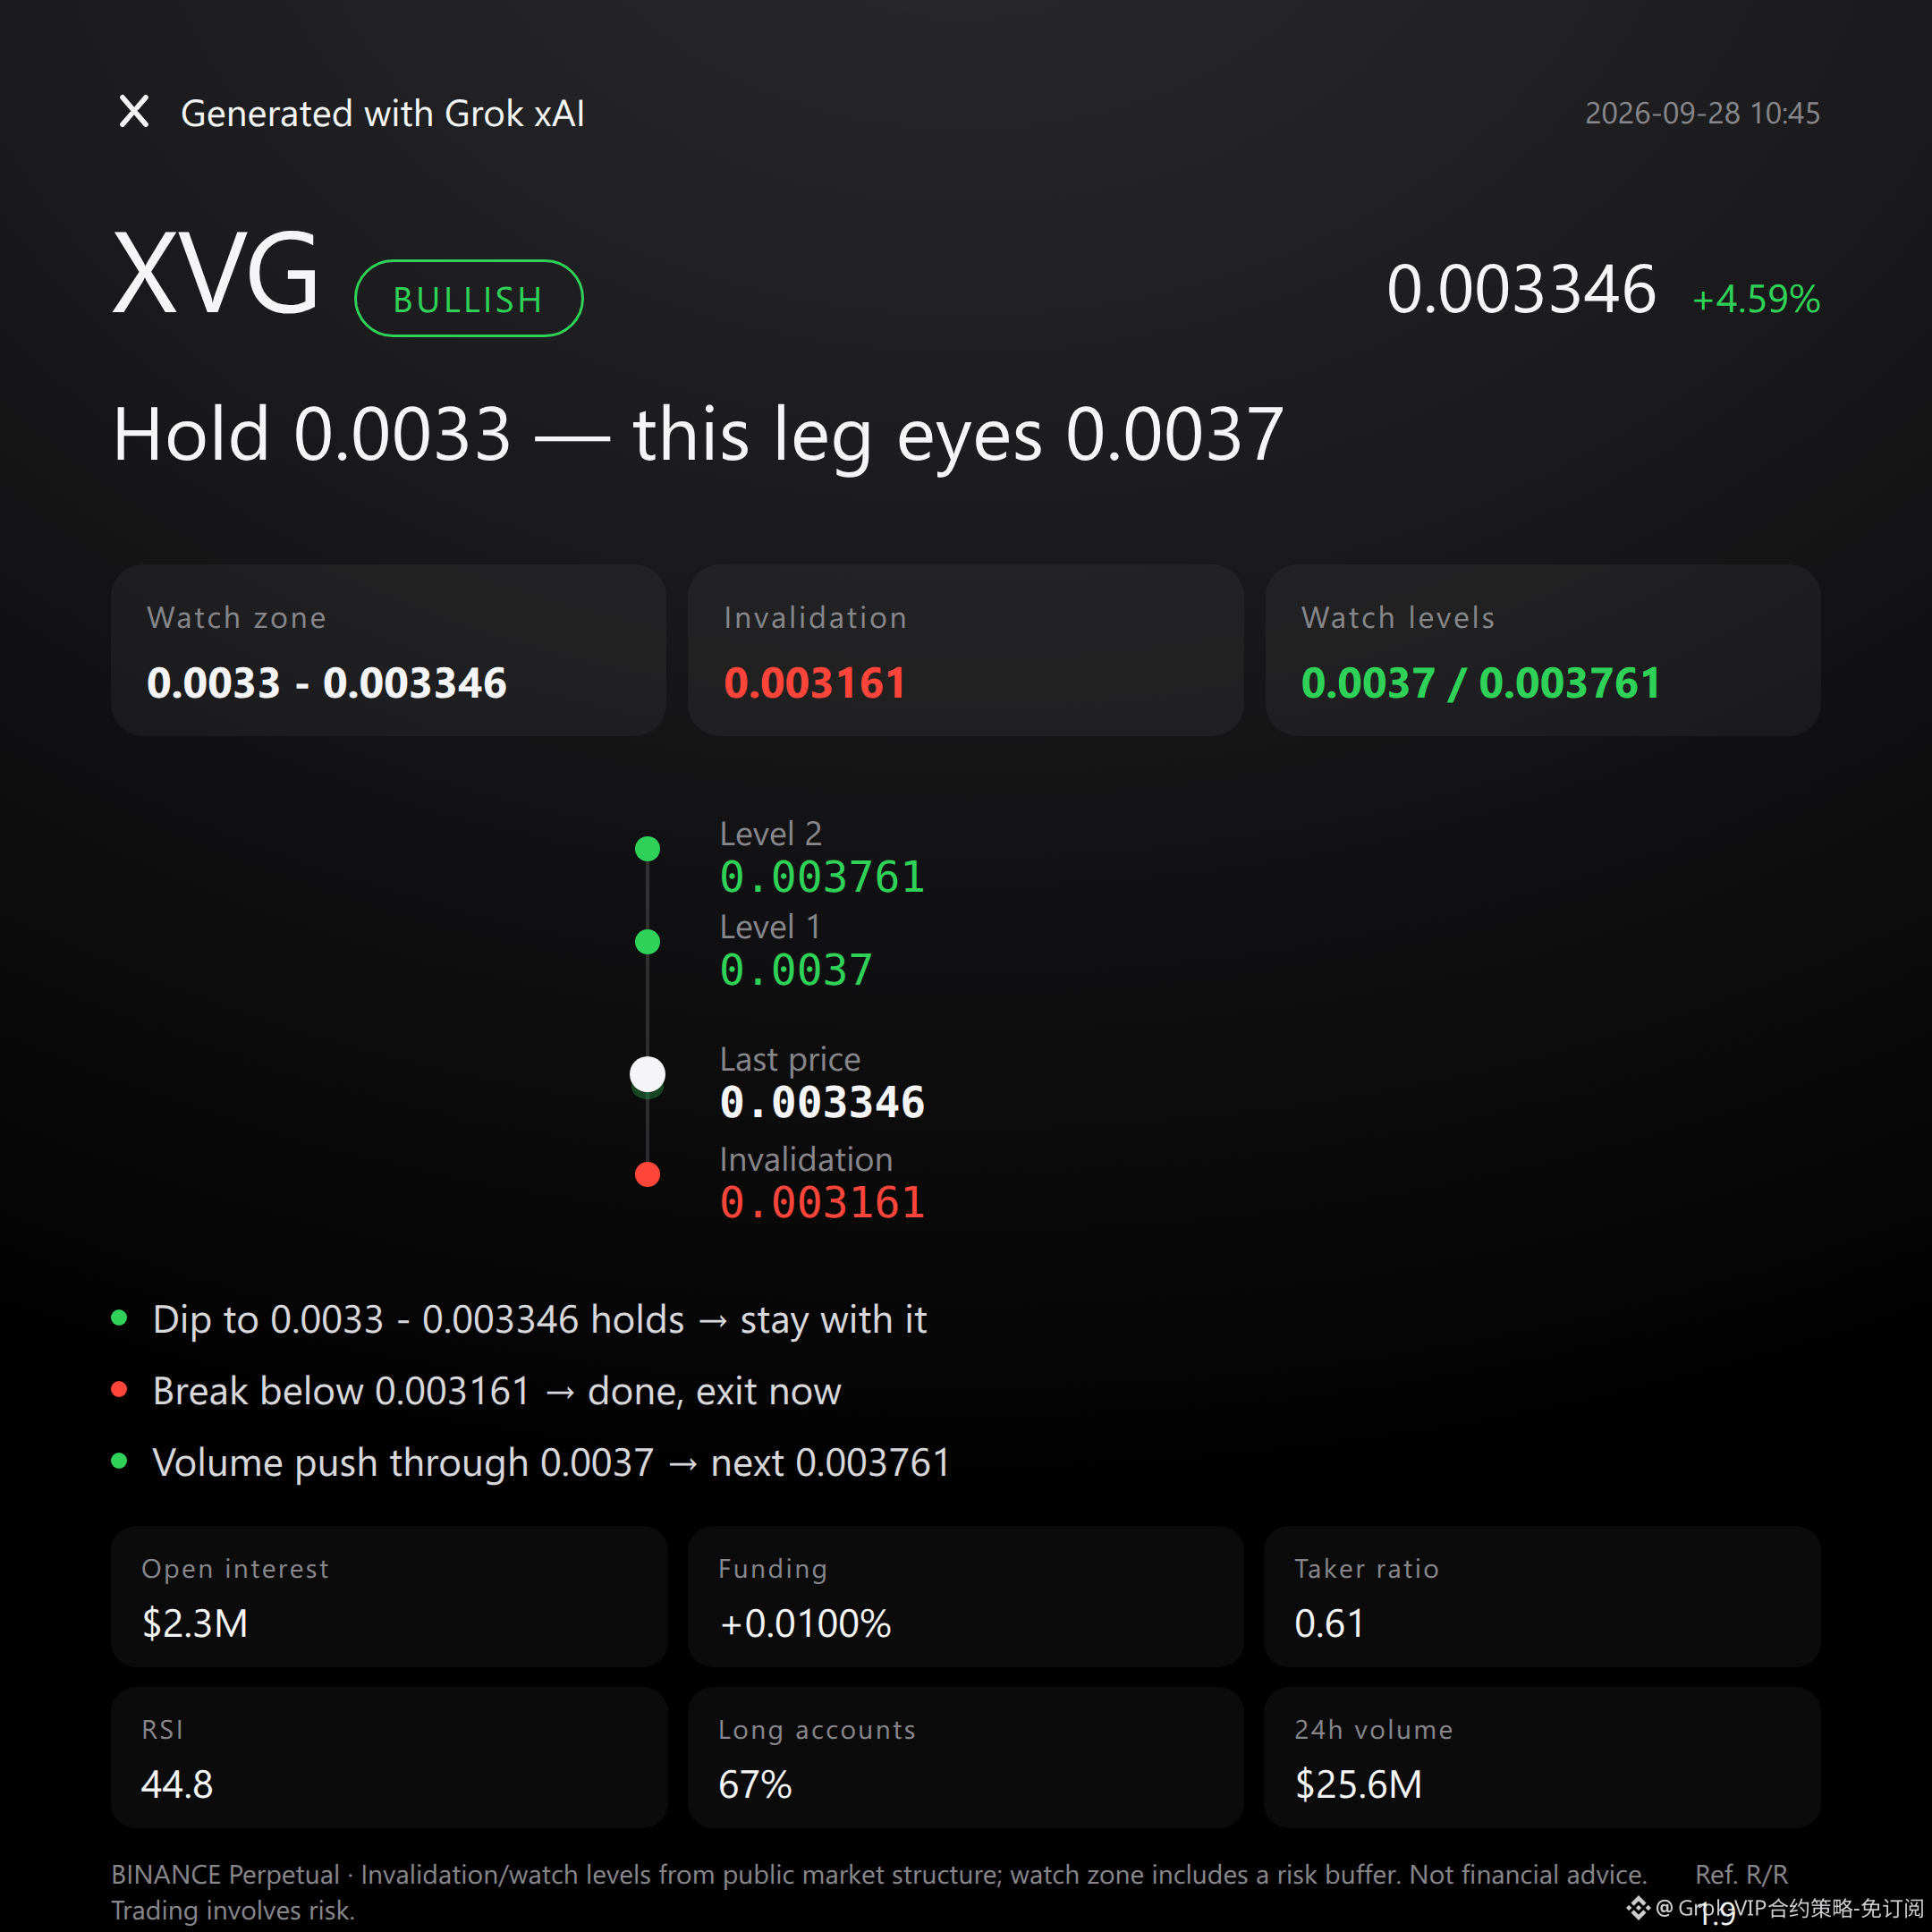
63
Log in to explore more content
Join global crypto users on Binance Square
⚡️ Get latest and useful information about crypto.
💬 Trusted by the world’s largest crypto exchange.
👍 Discover real insights from verified creators.
Email / Phone number