
BaronyOG
54 Posts

BaronyOG
Report
Block User
0 Following
0 Followers
55 Liked
Posts
All
Quotes
·
--
⚖️ XRP at $1.16 — The "Binary Outcome" Trade Nobody Wants to Touch
Ripple vs SEC: Remedies phase ongoing. Judge Torres ruling on penalties ANY DAY. This is the clearest catalyst in crypto — binary, dated, asymmetric.
📊 The Setup:
• Price: $1.1628 (24h: -1.5%)
• 24h Vol: $55.5M (elevated — smart money positioning)
• Market Cap: $66B (7th largest)
• Legal Risk: 80% priced in at $1.15 (analyst consensus)
🎯 The Two Outcomes:
🟢 Ripple Wins (<$130M penalty): $1.15 → $1.80–$2.20 FAST (50-90% in days)
🔴 Ripple Loses (>$500M penalty): $1.15 → $0.75–$0.85 (30-35% drop)
Key Levels:
Resistance: $1.25 (local) → $1.50 (pre-trial) → $2.00 (psych)
Support: $1.10 (range low) → $0.95 (macro) → $0.75 (panic)
3 Scenarios:
🔹 Base (~45%): Ruling delays → chops $1.10–$1.25, vol dies
🔹 Bull (~35%): Favorable ruling → gap up to $1.50, then $2.00+
🔹 Bear (~20%): Harsh penalty → $0.85, then slow grind lower
⚡ The Edge: Options market pricing 65% prob of favorable outcome. Spot market pricing 50%. The discrepancy IS the trade.
Your Bet:
1️⃣ Buying the ruling, selling the news, or staying away?
2️⃣ What penalty number makes you buy/sell?
3️⃣ XRP vs XLM vs HBAR — best "institutional" play?
👇 Ruling expected THIS MONTH. Position accordingly.
$XRP #Ripple #SEC #CryptoAnalysis #BinanceSquare
⚖️ XRP at $1.16 — The "Binary Outcome" Trade Nobody Wants to Touch
Ripple vs SEC: Remedies phase ongoing. Judge Torres ruling on penalties ANY DAY. This is the clearest catalyst in crypto — binary, dated, asymmetric.
📊 The Setup:
• Price: $1.1628 (24h: -1.5%)
• 24h Vol: $55.5M (elevated — smart money positioning)
• Market Cap: $66B (7th largest)
• Legal Risk: 80% priced in at $1.15 (analyst consensus)
🎯 The Two Outcomes:
🟢 Ripple Wins (<$130M penalty): $1.15 → $1.80–$2.20 FAST (50-90% in days)
🔴 Ripple Loses (>$500M penalty): $1.15 → $0.75–$0.85 (30-35% drop)
Key Levels:
Resistance: $1.25 (local) → $1.50 (pre-trial) → $2.00 (psych)
Support: $1.10 (range low) → $0.95 (macro) → $0.75 (panic)
3 Scenarios:
🔹 Base (~45%): Ruling delays → chops $1.10–$1.25, vol dies
🔹 Bull (~35%): Favorable ruling → gap up to $1.50, then $2.00+
🔹 Bear (~20%): Harsh penalty → $0.85, then slow grind lower
⚡ The Edge: Options market pricing 65% prob of favorable outcome. Spot market pricing 50%. The discrepancy IS the trade.
Your Bet:
1️⃣ Buying the ruling, selling the news, or staying away?
2️⃣ What penalty number makes you buy/sell?
3️⃣ XRP vs XLM vs HBAR — best "institutional" play?
👇 Ruling expected THIS MONTH. Position accordingly.
$XRP #Ripple #SEC #CryptoAnalysis #BinanceSquare
Ripple vs SEC: Remedies phase ongoing. Judge Torres ruling on penalties ANY DAY. This is the clearest catalyst in crypto — binary, dated, asymmetric.
📊 The Setup:
• Price: $1.1628 (24h: -1.5%)
• 24h Vol: $55.5M (elevated — smart money positioning)
• Market Cap: $66B (7th largest)
• Legal Risk: 80% priced in at $1.15 (analyst consensus)
🎯 The Two Outcomes:
🟢 Ripple Wins (<$130M penalty): $1.15 → $1.80–$2.20 FAST (50-90% in days)
🔴 Ripple Loses (>$500M penalty): $1.15 → $0.75–$0.85 (30-35% drop)
Key Levels:
Resistance: $1.25 (local) → $1.50 (pre-trial) → $2.00 (psych)
Support: $1.10 (range low) → $0.95 (macro) → $0.75 (panic)
3 Scenarios:
🔹 Base (~45%): Ruling delays → chops $1.10–$1.25, vol dies
🔹 Bull (~35%): Favorable ruling → gap up to $1.50, then $2.00+
🔹 Bear (~20%): Harsh penalty → $0.85, then slow grind lower
⚡ The Edge: Options market pricing 65% prob of favorable outcome. Spot market pricing 50%. The discrepancy IS the trade.
Your Bet:
1️⃣ Buying the ruling, selling the news, or staying away?
2️⃣ What penalty number makes you buy/sell?
3️⃣ XRP vs XLM vs HBAR — best "institutional" play?
👇 Ruling expected THIS MONTH. Position accordingly.
$XRP #Ripple #SEC #CryptoAnalysis #BinanceSquare
1
35
·
--
🔥 BNB at $699 — The Only L1 With REAL Buy Pressure Every Quarter
Binance burns BNB quarterly. Last burn: 1.77M BNB ($1.2B). Next burn in ~40 days. This is programmatic, predictable buy pressure NO other chain has.
📊 The Fundamentals:
• Price: $699.34 (24h: +0.55% — ONLY green major today)
• Quarterly Burn: ~$1.2B equivalent removed from supply
• BNB Chain TVL: $5.8B (3rd after ETH, TRON)
• Launchpad ROI: 15x avg for last 10 projects
• CEX Volume Dominance: Binance = 60%+ global spot
🎯 Technicals:
Resistance: $720 (psych) → $745 (ATH) → $800
Support: $680 (20-day) → $650 (50-day) → $600 (macro)
3 Scenarios:
🔹 Base (~50%): Grinds to $720 pre-burn, sells news → $690
🔹 Bull (~35%): Burn + BTC ATH + Launchpad hype → $780–$850
🔹 Bear (~15%): Regulatory FUD → $620 (but burns still happen)
💡 The Alpha: Buy 2 weeks before burn, sell burn day. Works 7/8 quarters. Next burn ~Dec 15.
Your Strategy:
1️⃣ Holding BNB for the burn or trading the narrative?
2️⃣ BNB vs SOL vs ETH — best risk/reward for Q4?
3️⃣ Do you trust CEX tokens long-term?
👇 Burn countdown: 40 days. Mark your calendar.
$BNB #BNBChain #Binance #CryptoAnalysis #BinanceSquare
🔥 BNB at $699 — The Only L1 With REAL Buy Pressure Every Quarter
Binance burns BNB quarterly. Last burn: 1.77M BNB ($1.2B). Next burn in ~40 days. This is programmatic, predictable buy pressure NO other chain has.
📊 The Fundamentals:
• Price: $699.34 (24h: +0.55% — ONLY green major today)
• Quarterly Burn: ~$1.2B equivalent removed from supply
• BNB Chain TVL: $5.8B (3rd after ETH, TRON)
• Launchpad ROI: 15x avg for last 10 projects
• CEX Volume Dominance: Binance = 60%+ global spot
🎯 Technicals:
Resistance: $720 (psych) → $745 (ATH) → $800
Support: $680 (20-day) → $650 (50-day) → $600 (macro)
3 Scenarios:
🔹 Base (~50%): Grinds to $720 pre-burn, sells news → $690
🔹 Bull (~35%): Burn + BTC ATH + Launchpad hype → $780–$850
🔹 Bear (~15%): Regulatory FUD → $620 (but burns still happen)
💡 The Alpha: Buy 2 weeks before burn, sell burn day. Works 7/8 quarters. Next burn ~Dec 15.
Your Strategy:
1️⃣ Holding BNB for the burn or trading the narrative?
2️⃣ BNB vs SOL vs ETH — best risk/reward for Q4?
3️⃣ Do you trust CEX tokens long-term?
👇 Burn countdown: 40 days. Mark your calendar.
$BNB #BNBChain #Binance #CryptoAnalysis #BinanceSquare
Binance burns BNB quarterly. Last burn: 1.77M BNB ($1.2B). Next burn in ~40 days. This is programmatic, predictable buy pressure NO other chain has.
📊 The Fundamentals:
• Price: $699.34 (24h: +0.55% — ONLY green major today)
• Quarterly Burn: ~$1.2B equivalent removed from supply
• BNB Chain TVL: $5.8B (3rd after ETH, TRON)
• Launchpad ROI: 15x avg for last 10 projects
• CEX Volume Dominance: Binance = 60%+ global spot
🎯 Technicals:
Resistance: $720 (psych) → $745 (ATH) → $800
Support: $680 (20-day) → $650 (50-day) → $600 (macro)
3 Scenarios:
🔹 Base (~50%): Grinds to $720 pre-burn, sells news → $690
🔹 Bull (~35%): Burn + BTC ATH + Launchpad hype → $780–$850
🔹 Bear (~15%): Regulatory FUD → $620 (but burns still happen)
💡 The Alpha: Buy 2 weeks before burn, sell burn day. Works 7/8 quarters. Next burn ~Dec 15.
Your Strategy:
1️⃣ Holding BNB for the burn or trading the narrative?
2️⃣ BNB vs SOL vs ETH — best risk/reward for Q4?
3️⃣ Do you trust CEX tokens long-term?
👇 Burn countdown: 40 days. Mark your calendar.
$BNB #BNBChain #Binance #CryptoAnalysis #BinanceSquare
1
20
·
--
⚡ SOL at $89 — The "Silent Accumulation" Setup
While everyone watches BTC, Solana has printed 3 higher lows since August. Volume is drying up. This is textbook Wyckoff accumulation.
📊 The Evidence:
• Price: $89.20 (24h: -1.25%)
• 24h Vol: $53.5M — LOWEST in 60 days
• RSI(14): 42 — oversold on weekly, neutral daily
• TVL: $8.2B (steady, not fleeing)
• DEX Volume Share: 22% (holding vs Ethereum L2s)
🎯 The Setup:
Resistance: $92 (local) → $105 (range high) → $125 (breakout)
Support: $85 (triple bottom) → $78 (range low)
3 Scenarios:
🔹 Base (~50%): Coils $85–$95, breaks $92 on BTC strength → $105+
🔹 Bull (~30%): Firedancer mainnet + BTC ATH → $125–$150 fast
🔹 Bear (~20%): BTC drops → SOL leads down to $78, flushes weak hands
🔥 Why This Matters: SOL/BTC pair is at 0.00117 — near cycle lows. When alts rotate, SOL leads. The "Ethereum killer" narrative is dead; "high-throughput chain" narrative is alive.
Your Call:
1️⃣ Buying this compression or waiting for $92 break?
2️⃣ SOL vs ETH vs BTC for Q4 — rank them
3️⃣ What's your stop if $85 breaks?
👇 Comment your position size % — I'm curious.
$SOL #Solana #CryptoAnalysis #AltSeason #BinanceSquare
⚡ SOL at $89 — The "Silent Accumulation" Setup
While everyone watches BTC, Solana has printed 3 higher lows since August. Volume is drying up. This is textbook Wyckoff accumulation.
📊 The Evidence:
• Price: $89.20 (24h: -1.25%)
• 24h Vol: $53.5M — LOWEST in 60 days
• RSI(14): 42 — oversold on weekly, neutral daily
• TVL: $8.2B (steady, not fleeing)
• DEX Volume Share: 22% (holding vs Ethereum L2s)
🎯 The Setup:
Resistance: $92 (local) → $105 (range high) → $125 (breakout)
Support: $85 (triple bottom) → $78 (range low)
3 Scenarios:
🔹 Base (~50%): Coils $85–$95, breaks $92 on BTC strength → $105+
🔹 Bull (~30%): Firedancer mainnet + BTC ATH → $125–$150 fast
🔹 Bear (~20%): BTC drops → SOL leads down to $78, flushes weak hands
🔥 Why This Matters: SOL/BTC pair is at 0.00117 — near cycle lows. When alts rotate, SOL leads. The "Ethereum killer" narrative is dead; "high-throughput chain" narrative is alive.
Your Call:
1️⃣ Buying this compression or waiting for $92 break?
2️⃣ SOL vs ETH vs BTC for Q4 — rank them
3️⃣ What's your stop if $85 breaks?
👇 Comment your position size % — I'm curious.
$SOL #Solana #CryptoAnalysis #AltSeason #BinanceSquare
While everyone watches BTC, Solana has printed 3 higher lows since August. Volume is drying up. This is textbook Wyckoff accumulation.
📊 The Evidence:
• Price: $89.20 (24h: -1.25%)
• 24h Vol: $53.5M — LOWEST in 60 days
• RSI(14): 42 — oversold on weekly, neutral daily
• TVL: $8.2B (steady, not fleeing)
• DEX Volume Share: 22% (holding vs Ethereum L2s)
🎯 The Setup:
Resistance: $92 (local) → $105 (range high) → $125 (breakout)
Support: $85 (triple bottom) → $78 (range low)
3 Scenarios:
🔹 Base (~50%): Coils $85–$95, breaks $92 on BTC strength → $105+
🔹 Bull (~30%): Firedancer mainnet + BTC ATH → $125–$150 fast
🔹 Bear (~20%): BTC drops → SOL leads down to $78, flushes weak hands
🔥 Why This Matters: SOL/BTC pair is at 0.00117 — near cycle lows. When alts rotate, SOL leads. The "Ethereum killer" narrative is dead; "high-throughput chain" narrative is alive.
Your Call:
1️⃣ Buying this compression or waiting for $92 break?
2️⃣ SOL vs ETH vs BTC for Q4 — rank them
3️⃣ What's your stop if $85 breaks?
👇 Comment your position size % — I'm curious.
$SOL #Solana #CryptoAnalysis #AltSeason #BinanceSquare
1
59
·
--
📉 ETH/BTC at 0.0295 — The "Flippening" Delay Continues
Ethereum has lost 15% vs Bitcoin since March. The ratio is testing multi-year lows. But here's what nobody talks about:
📊 The Data:
• ETH/BTC: 0.02948 (24h: -0.2%)
• ETH 24h Vol: $135M vs BTC $374M — capital rotating TO BTC
• Staking Yield: ~3.2% vs 0% for BTC — carry trade unwinding
• L2 Fees: Near zero — ETH burn mechanism broken
🎯 Critical Levels:
Resistance: 0.032 (March high) → 0.035 (2024 high)
Support: 0.0285 (2022 low) → 0.026 (cycle low)
3 Scenarios:
🔹 Base (~50%): Grinds sideways 0.0285–0.031, ETH bleeds slowly vs BTC
🔹 Bull (~25%): ETF flows rotate to ETH + Pectra upgrade hype → 0.034+
🔹 Bear (~25%): 0.0285 breaks → fast drop to 0.026, "ETH is dead" narratives return
💡 The Contrarian Take: At 0.0295, ETH is pricing in ZERO upside from upgrades. If Pectra delivers even half the promised throughput, this ratio snaps back violently.
Your Move:
1️⃣ Accumulating ETH here or rotating to BTC?
2️⃣ What catalyst flips this ratio?
3️⃣ Staking ETH or holding BTC for the next 6 months?
👇 Best thesis gets a detailed reply.
$ETH $BTC #Ethereum #Bitcoin #CryptoAnalysis #BinanceSquare
📉 ETH/BTC at 0.0295 — The "Flippening" Delay Continues
Ethereum has lost 15% vs Bitcoin since March. The ratio is testing multi-year lows. But here's what nobody talks about:
📊 The Data:
• ETH/BTC: 0.02948 (24h: -0.2%)
• ETH 24h Vol: $135M vs BTC $374M — capital rotating TO BTC
• Staking Yield: ~3.2% vs 0% for BTC — carry trade unwinding
• L2 Fees: Near zero — ETH burn mechanism broken
🎯 Critical Levels:
Resistance: 0.032 (March high) → 0.035 (2024 high)
Support: 0.0285 (2022 low) → 0.026 (cycle low)
3 Scenarios:
🔹 Base (~50%): Grinds sideways 0.0285–0.031, ETH bleeds slowly vs BTC
🔹 Bull (~25%): ETF flows rotate to ETH + Pectra upgrade hype → 0.034+
🔹 Bear (~25%): 0.0285 breaks → fast drop to 0.026, "ETH is dead" narratives return
💡 The Contrarian Take: At 0.0295, ETH is pricing in ZERO upside from upgrades. If Pectra delivers even half the promised throughput, this ratio snaps back violently.
Your Move:
1️⃣ Accumulating ETH here or rotating to BTC?
2️⃣ What catalyst flips this ratio?
3️⃣ Staking ETH or holding BTC for the next 6 months?
👇 Best thesis gets a detailed reply.
$ETH $BTC #Ethereum #Bitcoin #CryptoAnalysis #BinanceSquare
Ethereum has lost 15% vs Bitcoin since March. The ratio is testing multi-year lows. But here's what nobody talks about:
📊 The Data:
• ETH/BTC: 0.02948 (24h: -0.2%)
• ETH 24h Vol: $135M vs BTC $374M — capital rotating TO BTC
• Staking Yield: ~3.2% vs 0% for BTC — carry trade unwinding
• L2 Fees: Near zero — ETH burn mechanism broken
🎯 Critical Levels:
Resistance: 0.032 (March high) → 0.035 (2024 high)
Support: 0.0285 (2022 low) → 0.026 (cycle low)
3 Scenarios:
🔹 Base (~50%): Grinds sideways 0.0285–0.031, ETH bleeds slowly vs BTC
🔹 Bull (~25%): ETF flows rotate to ETH + Pectra upgrade hype → 0.034+
🔹 Bear (~25%): 0.0285 breaks → fast drop to 0.026, "ETH is dead" narratives return
💡 The Contrarian Take: At 0.0295, ETH is pricing in ZERO upside from upgrades. If Pectra delivers even half the promised throughput, this ratio snaps back violently.
Your Move:
1️⃣ Accumulating ETH here or rotating to BTC?
2️⃣ What catalyst flips this ratio?
3️⃣ Staking ETH or holding BTC for the next 6 months?
👇 Best thesis gets a detailed reply.
$ETH $BTC #Ethereum #Bitcoin #CryptoAnalysis #BinanceSquare
1
42
·
--
🚨 BTC at $75,906 – The $76K Magnet is REAL
Bitcoin is consolidating right at the 2024 yearly high. This isn't random — it's the single biggest liquidity magnet on the chart.
📊 The Numbers Don't Lie:
• 24h Volume: $374M (healthy, not euphoric)
• RSI(14): ~52 — perfectly neutral, room to run
• Distance to ATH: ~3.5% ($78,600)
• Funding Rates: Flat — no leveraged froth
🔑 Key Levels:
Resistance: $76,500 (psychological) → $78,600 (ATH)
Support: $74,200 (weekly open) → $72,000 (20-day MA)
3 Scenarios for This Week:
🔹 Base (~50%): Chops $74.5K–$76.5K, builds energy for breakout
🔹 Bull (~30%): Clears $76.5K on volume → quick run to $78.6K+
🔹 Bear (~20%): Loses $74K → fills CME gap at $72.8K
⚡ The Hook: ETF flows turned positive again yesterday. MicroStrategy bought more. The bid is REAL.
Question for you:
1️⃣ Are we breaking ATH this week or next?
2️⃣ Long, Short, or Waiting for pullback?
3️⃣ What's your invalidation level?
👇 Drop your scenario in comments — I'll reply to every data-backed take.
#BTC $BTC #Bitcoin #CryptoAnalysis #BinanceSquare
🚨 BTC at $75,906 – The $76K Magnet is REAL
Bitcoin is consolidating right at the 2024 yearly high. This isn't random — it's the single biggest liquidity magnet on the chart.
📊 The Numbers Don't Lie:
• 24h Volume: $374M (healthy, not euphoric)
• RSI(14): ~52 — perfectly neutral, room to run
• Distance to ATH: ~3.5% ($78,600)
• Funding Rates: Flat — no leveraged froth
🔑 Key Levels:
Resistance: $76,500 (psychological) → $78,600 (ATH)
Support: $74,200 (weekly open) → $72,000 (20-day MA)
3 Scenarios for This Week:
🔹 Base (~50%): Chops $74.5K–$76.5K, builds energy for breakout
🔹 Bull (~30%): Clears $76.5K on volume → quick run to $78.6K+
🔹 Bear (~20%): Loses $74K → fills CME gap at $72.8K
⚡ The Hook: ETF flows turned positive again yesterday. MicroStrategy bought more. The bid is REAL.
Question for you:
1️⃣ Are we breaking ATH this week or next?
2️⃣ Long, Short, or Waiting for pullback?
3️⃣ What's your invalidation level?
👇 Drop your scenario in comments — I'll reply to every data-backed take.
#BTC $BTC #Bitcoin #CryptoAnalysis #BinanceSquare
Bitcoin is consolidating right at the 2024 yearly high. This isn't random — it's the single biggest liquidity magnet on the chart.
📊 The Numbers Don't Lie:
• 24h Volume: $374M (healthy, not euphoric)
• RSI(14): ~52 — perfectly neutral, room to run
• Distance to ATH: ~3.5% ($78,600)
• Funding Rates: Flat — no leveraged froth
🔑 Key Levels:
Resistance: $76,500 (psychological) → $78,600 (ATH)
Support: $74,200 (weekly open) → $72,000 (20-day MA)
3 Scenarios for This Week:
🔹 Base (~50%): Chops $74.5K–$76.5K, builds energy for breakout
🔹 Bull (~30%): Clears $76.5K on volume → quick run to $78.6K+
🔹 Bear (~20%): Loses $74K → fills CME gap at $72.8K
⚡ The Hook: ETF flows turned positive again yesterday. MicroStrategy bought more. The bid is REAL.
Question for you:
1️⃣ Are we breaking ATH this week or next?
2️⃣ Long, Short, or Waiting for pullback?
3️⃣ What's your invalidation level?
👇 Drop your scenario in comments — I'll reply to every data-backed take.
#BTC $BTC #Bitcoin #CryptoAnalysis #BinanceSquare
1
49
·
--
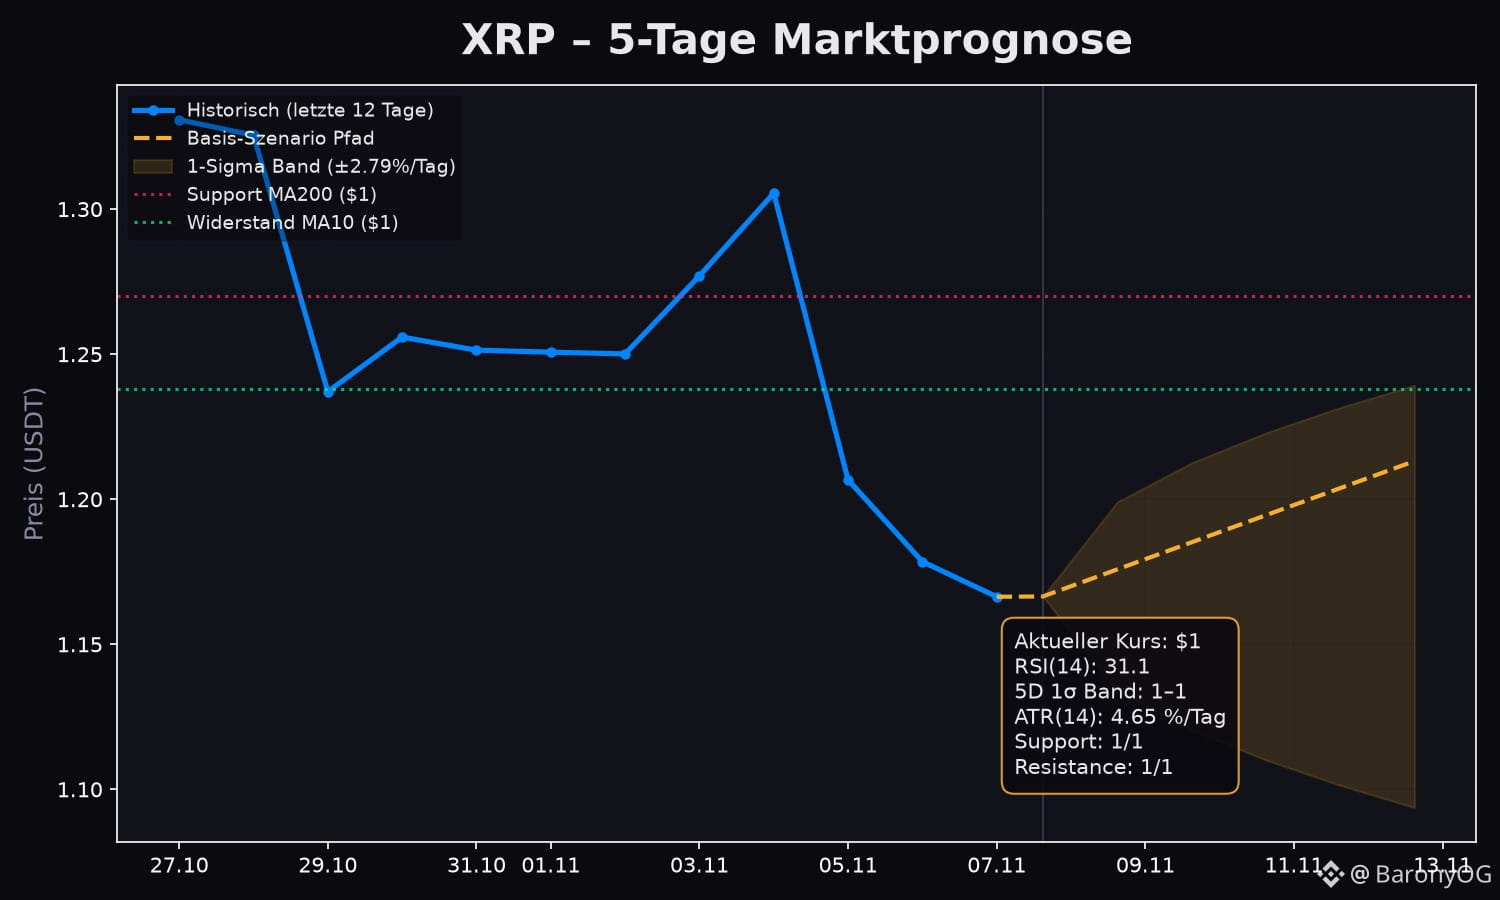
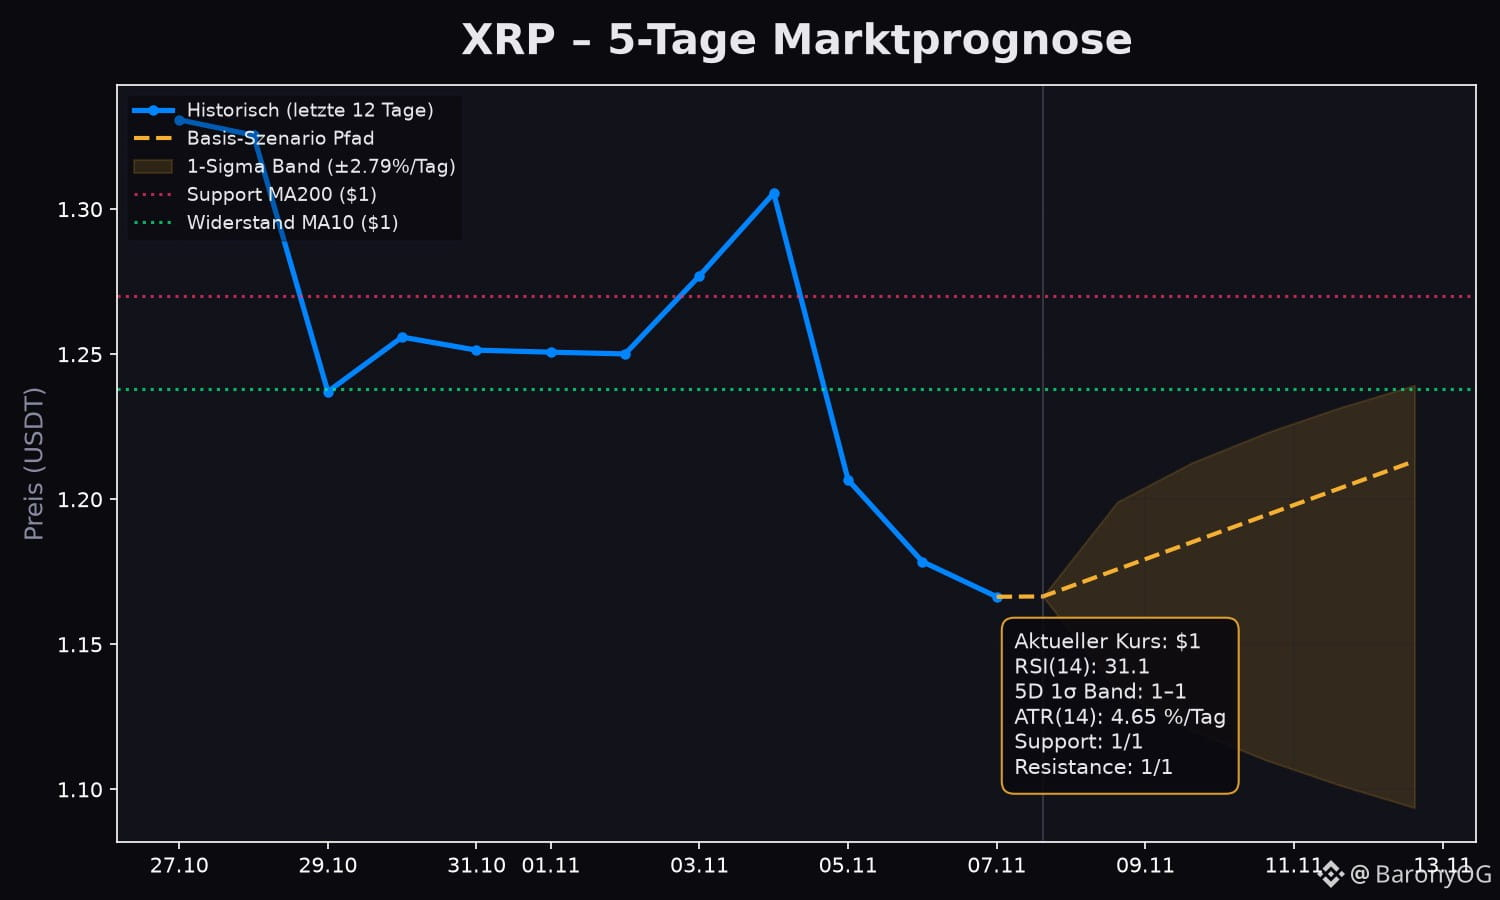
📊 #XRP ($XRP) 5-Day Market Forecast & Technical Analysis
Current Price: ~$1.17 USDT (24h: -1.51%)
1️⃣ Status Quo & Momentum:
• RSI(14): 31.1 – Oversold
• Structure: Golden Cross, MA50 $1.38 / MA200 $1.27, Price below MA20
• Position: 6% from 30-day low – near bottom
2️⃣ 5-Day Volatility Band (1σ / ±2.79% daily SD, ATR 4.65%):
• Expected Trading Range: $1.11 – $1.22
3️⃣ Scenarios for the Next 5 Days:
🔹 Base Scenario (~50%): Consolidation $1.10-$1.18
🔹 Bull Scenario (~30%): Break above $1.18 targets $1.22+
🔹 Bear Scenario (~20%): Drop below $1.10 risks $1.05
Key Levels:
• Support: $1.11 / $1.27 (MA200)
• Resistance: $1.18 (MA20) / $1.22
#XRP $XRP #CryptoAnalysis #BinanceSquare
📊 #XRP ($XRP ) 5-Day Market Forecast & Technical Analysis
Current Price: ~$1.17 USDT (24h: -1.51%)
1️⃣ Status Quo & Momentum:
• RSI(14): 31.1 – Oversold
• Structure: Golden Cross, MA50 $1.38 / MA200 $1.27, Price below MA20
• Position: 6% from 30-day low – near bottom
2️⃣ 5-Day Volatility Band (1σ / ±2.79% daily SD, ATR 4.65%):
• Expected Trading Range: $1.11 – $1.22
3️⃣ Scenarios for the Next 5 Days:
🔹 Base Scenario (~50%): Consolidation $1.10-$1.18
🔹 Bull Scenario (~30%): Break above $1.18 targets $1.22+
🔹 Bear Scenario (~20%): Drop below $1.10 risks $1.05
Key Levels:
• Support: $1.11 / $1.27 (MA200)
• Resistance: $1.18 (MA20) / $1.22
#XRP $XRP #CryptoAnalysis #BinanceSquare
Current Price: ~$1.17 USDT (24h: -1.51%)
1️⃣ Status Quo & Momentum:
• RSI(14): 31.1 – Oversold
• Structure: Golden Cross, MA50 $1.38 / MA200 $1.27, Price below MA20
• Position: 6% from 30-day low – near bottom
2️⃣ 5-Day Volatility Band (1σ / ±2.79% daily SD, ATR 4.65%):
• Expected Trading Range: $1.11 – $1.22
3️⃣ Scenarios for the Next 5 Days:
🔹 Base Scenario (~50%): Consolidation $1.10-$1.18
🔹 Bull Scenario (~30%): Break above $1.18 targets $1.22+
🔹 Bear Scenario (~20%): Drop below $1.10 risks $1.05
Key Levels:
• Support: $1.11 / $1.27 (MA200)
• Resistance: $1.18 (MA20) / $1.22
#XRP $XRP #CryptoAnalysis #BinanceSquare
1
40
·
--
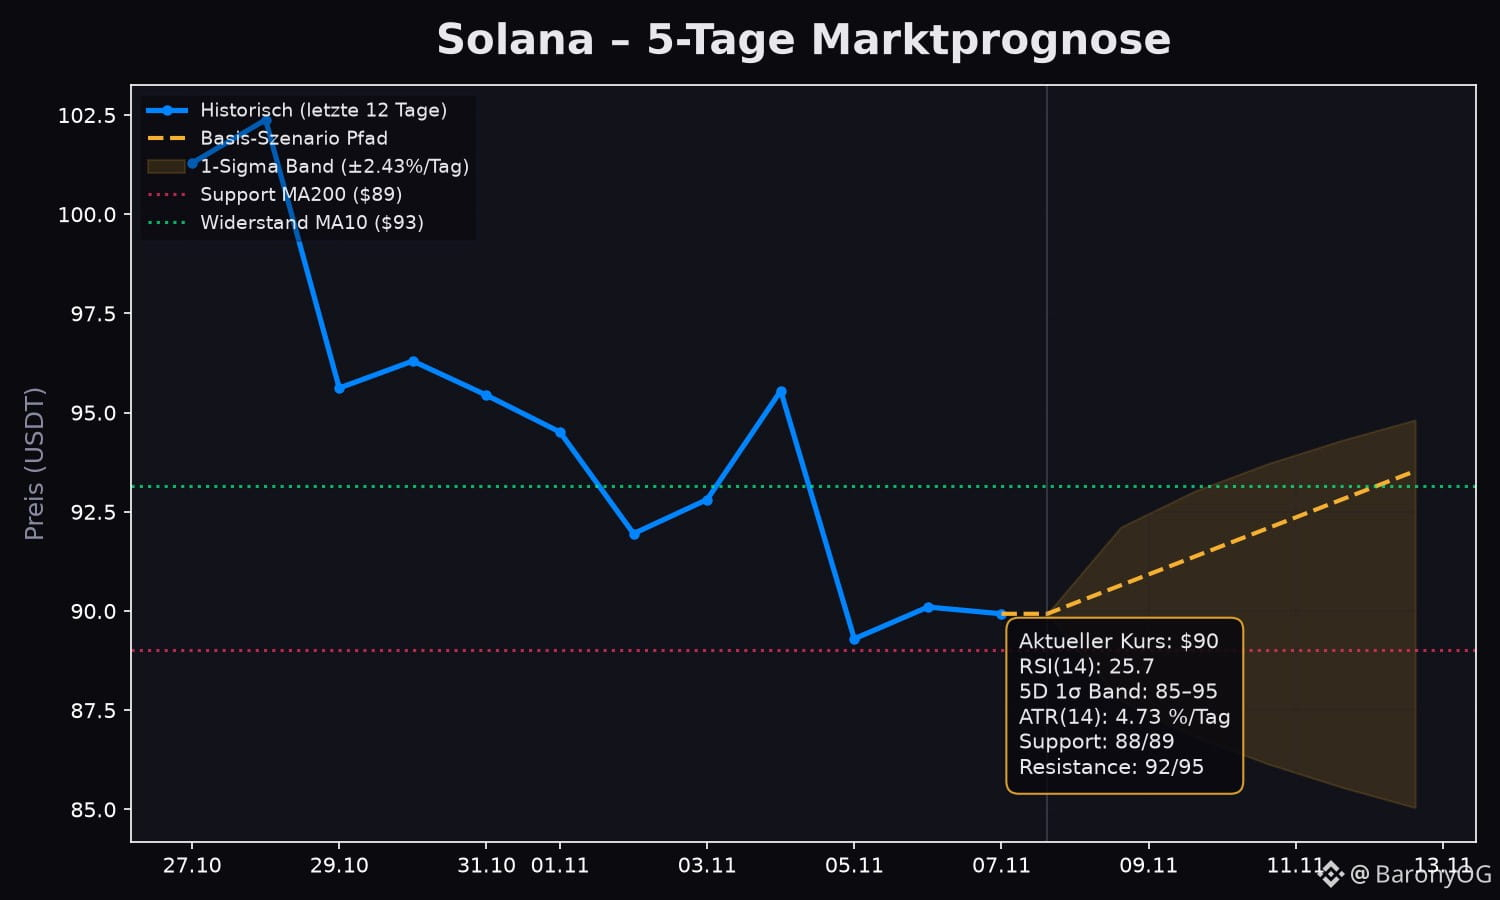
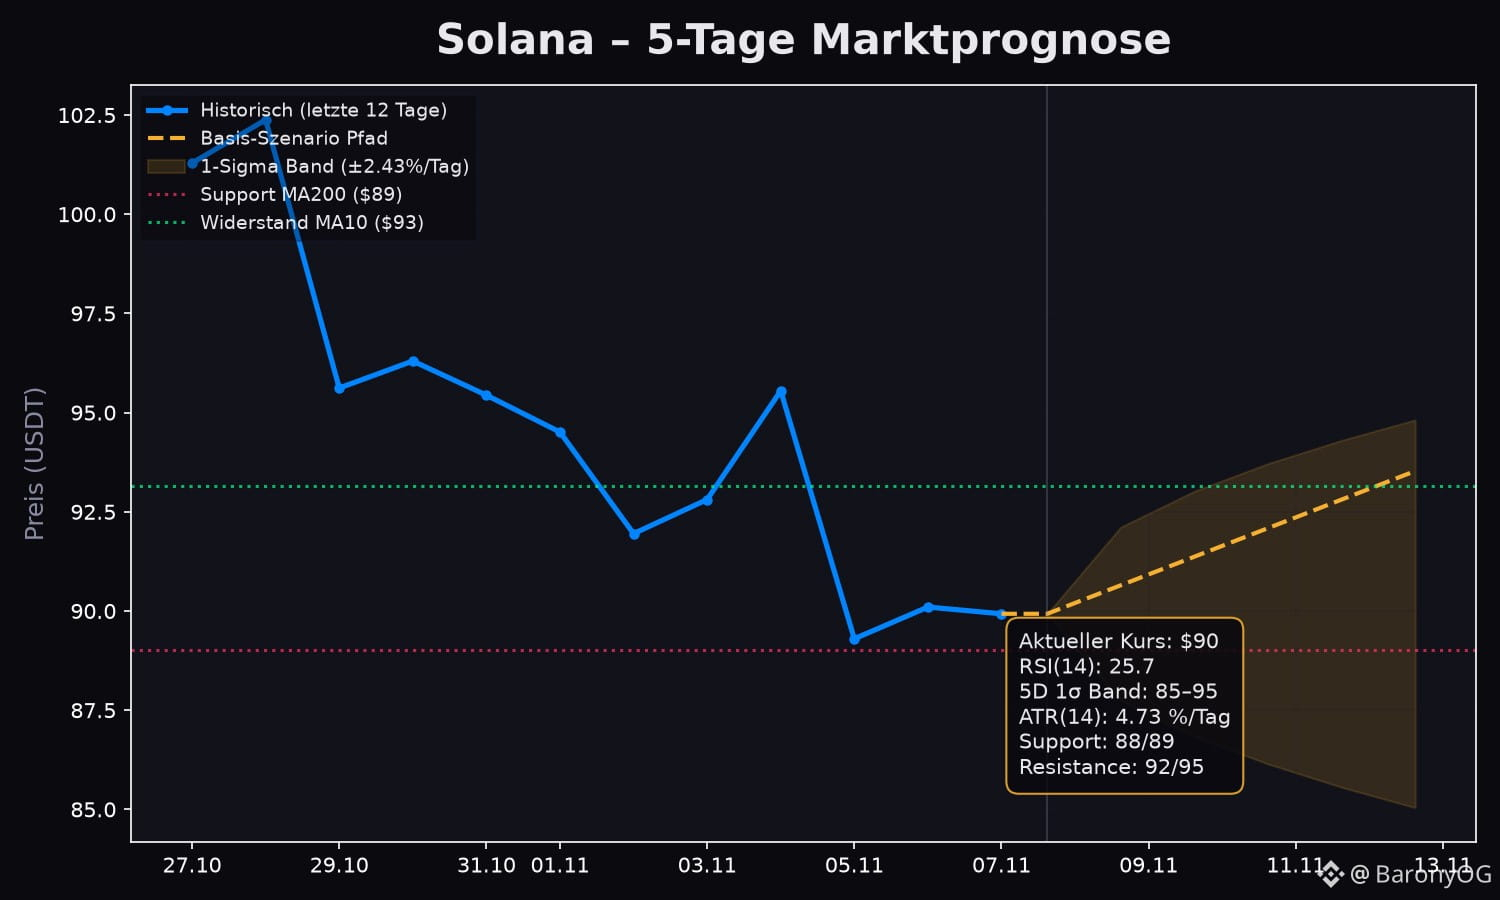
📊 #Solana ($SOL) 5-Day Market Forecast & Technical Analysis
Current Price: ~$89.93 USDT (24h: -1.41%)
1️⃣ Status Quo & Momentum:
• RSI(14): 25.7 – Oversold (<30)
• Structure: Golden Cross, MA50 $107.74 / MA200 $89.01, Price below MA20
• Position: 7% from 30-day low – near recent lows
2️⃣ 5-Day Volatility Band (1σ / ±2.43% daily SD, ATR 4.73%):
• Expected Trading Range: $85 – $95
3️⃣ Scenarios for the Next 5 Days:
🔹 Base Scenario (~50%): Consolidation $85-$92
🔹 Bull Scenario (~30%): Break above $92 targets $95+
🔹 Bear Scenario (~20%): Drop below $85 risks $80
Key Levels:
• Support: $85 / $89.01 (MA200)
• Resistance: $92 (MA20) / $95
#SOL $SOL #CryptoAnalysis #BinanceSquare
📊 #Solana ($SOL ) 5-Day Market Forecast & Technical Analysis
Current Price: ~$89.93 USDT (24h: -1.41%)
1️⃣ Status Quo & Momentum:
• RSI(14): 25.7 – Oversold (<30)
• Structure: Golden Cross, MA50 $107.74 / MA200 $89.01, Price below MA20
• Position: 7% from 30-day low – near recent lows
2️⃣ 5-Day Volatility Band (1σ / ±2.43% daily SD, ATR 4.73%):
• Expected Trading Range: $85 – $95
3️⃣ Scenarios for the Next 5 Days:
🔹 Base Scenario (~50%): Consolidation $85-$92
🔹 Bull Scenario (~30%): Break above $92 targets $95+
🔹 Bear Scenario (~20%): Drop below $85 risks $80
Key Levels:
• Support: $85 / $89.01 (MA200)
• Resistance: $92 (MA20) / $95
#SOL $SOL #CryptoAnalysis #BinanceSquare
Current Price: ~$89.93 USDT (24h: -1.41%)
1️⃣ Status Quo & Momentum:
• RSI(14): 25.7 – Oversold (<30)
• Structure: Golden Cross, MA50 $107.74 / MA200 $89.01, Price below MA20
• Position: 7% from 30-day low – near recent lows
2️⃣ 5-Day Volatility Band (1σ / ±2.43% daily SD, ATR 4.73%):
• Expected Trading Range: $85 – $95
3️⃣ Scenarios for the Next 5 Days:
🔹 Base Scenario (~50%): Consolidation $85-$92
🔹 Bull Scenario (~30%): Break above $92 targets $95+
🔹 Bear Scenario (~20%): Drop below $85 risks $80
Key Levels:
• Support: $85 / $89.01 (MA200)
• Resistance: $92 (MA20) / $95
#SOL $SOL #CryptoAnalysis #BinanceSquare
1
50
·
--
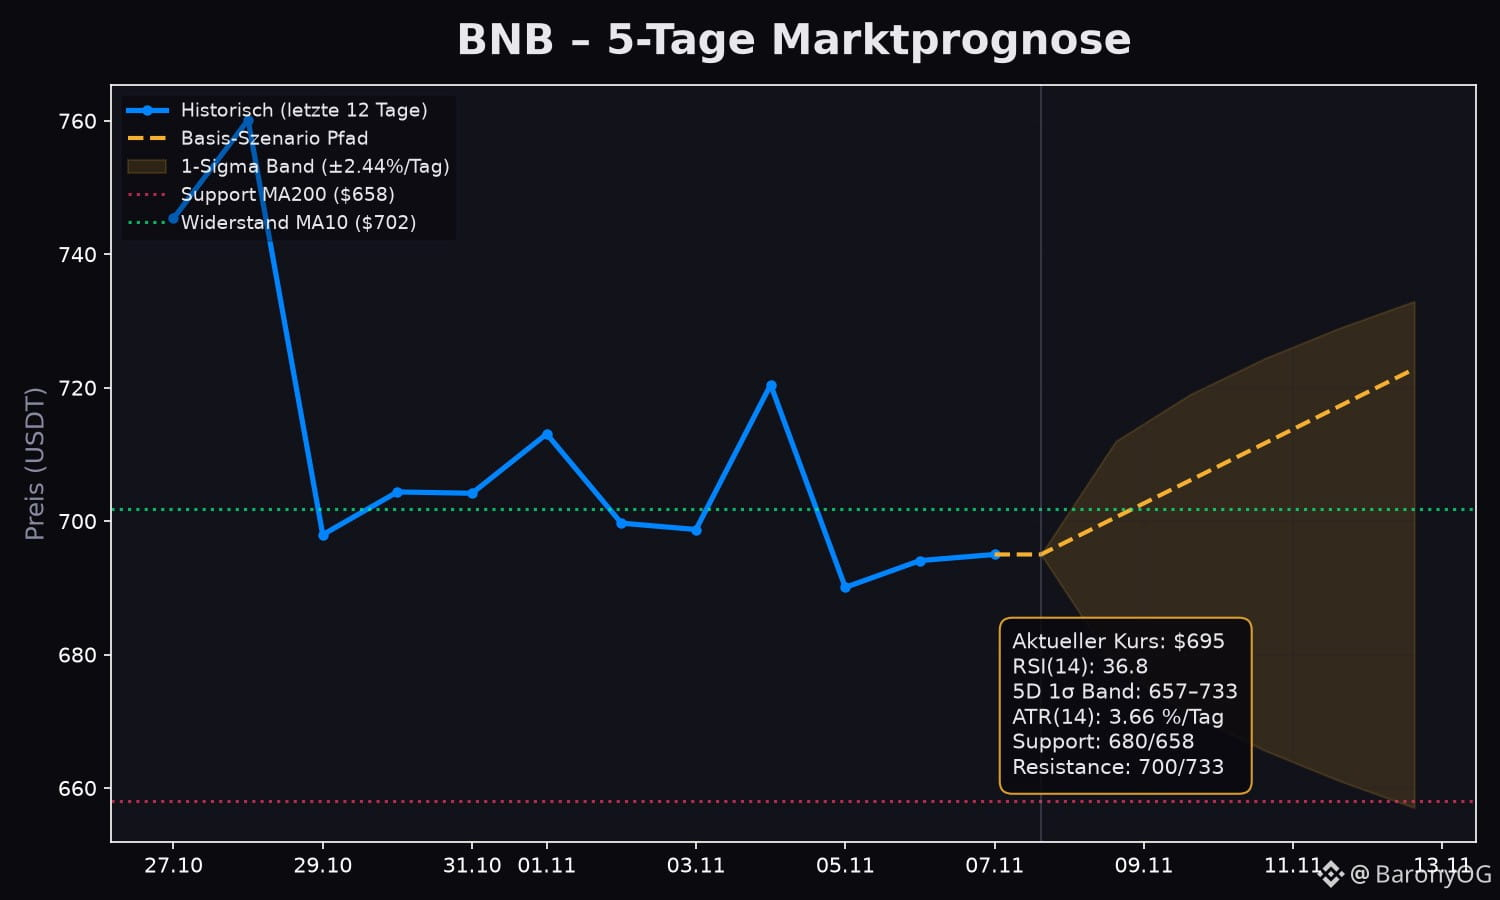
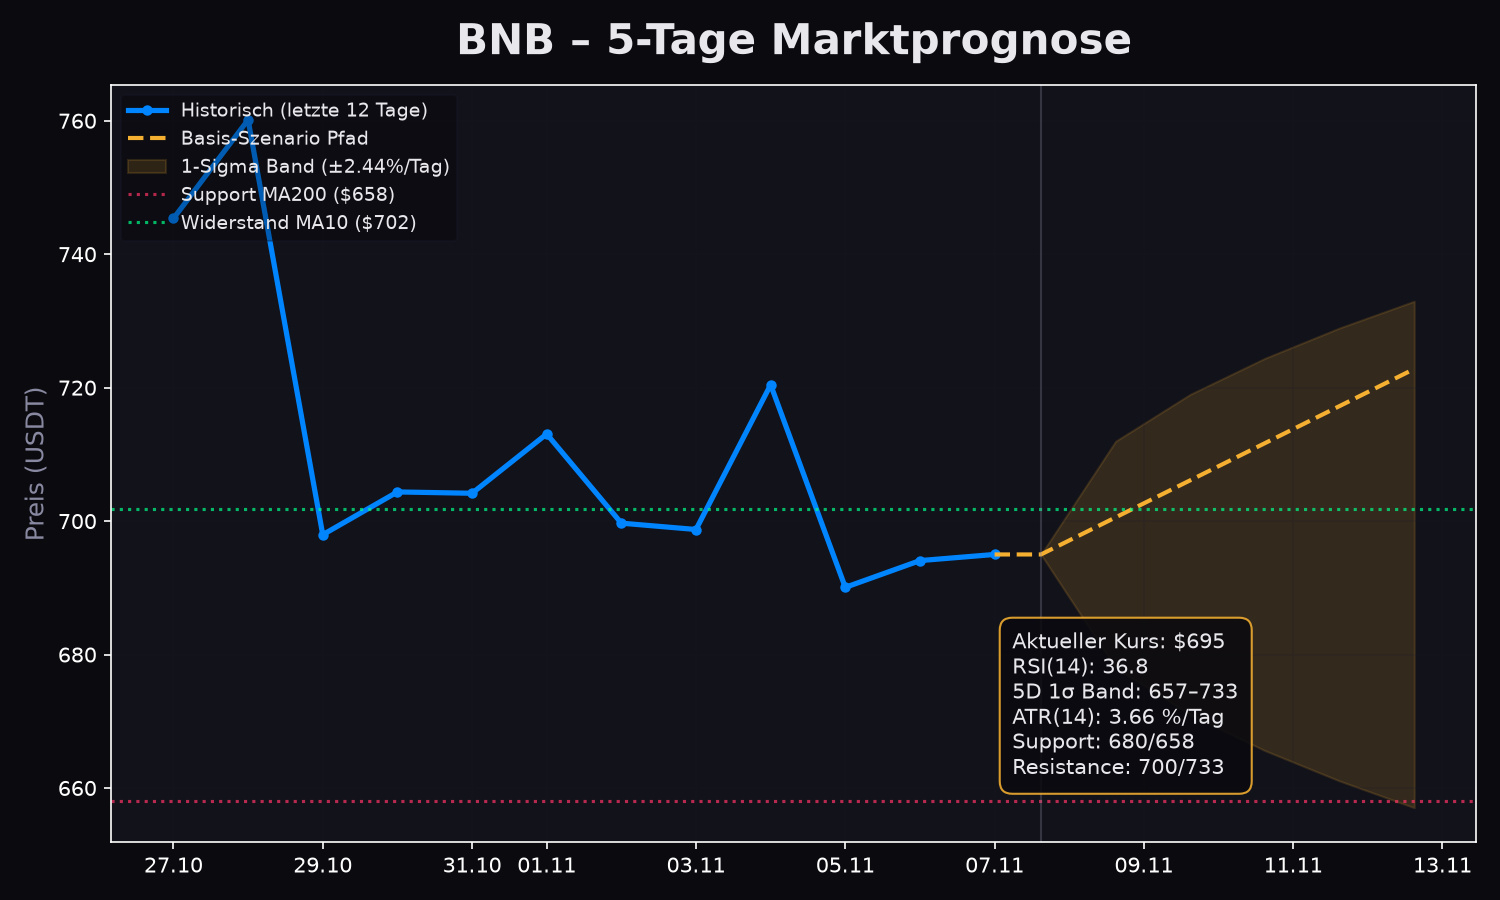
📊 #BNB ($BNB) 5-Day Market Forecast & Technical Analysis
Current Price: ~$695 USDT (24h: -0.33%)
1️⃣ Status Quo & Momentum:
• RSI(14): 36.8 – Oversold (<40)
• Structure: Golden Cross, MA50 $746 / MA200 $658, Price below MA20
• Position: 20% from 30-day low – near bottom of recent range
2️⃣ 5-Day Volatility Band (1σ / ±2.44% daily SD, ATR 3.66%):
• Expected Trading Range: $657 – $733
3️⃣ Scenarios for the Next 5 Days:
🔹 Base Scenario (~50%): Consolidation $670-$710
🔹 Bull Scenario (~30%): Break above $710 targets $733
🔹 Bear Scenario (~20%): Drop below $657 risks $640
Key Levels:
• Support: $657 / $658 (MA200)
• Resistance: $710 (MA20) / $733
#BNB $BNB #CryptoAnalysis #BinanceSquare
📊 #BNB ($BNB ) 5-Day Market Forecast & Technical Analysis
Current Price: ~$695 USDT (24h: -0.33%)
1️⃣ Status Quo & Momentum:
• RSI(14): 36.8 – Oversold (<40)
• Structure: Golden Cross, MA50 $746 / MA200 $658, Price below MA20
• Position: 20% from 30-day low – near bottom of recent range
2️⃣ 5-Day Volatility Band (1σ / ±2.44% daily SD, ATR 3.66%):
• Expected Trading Range: $657 – $733
3️⃣ Scenarios for the Next 5 Days:
🔹 Base Scenario (~50%): Consolidation $670-$710
🔹 Bull Scenario (~30%): Break above $710 targets $733
🔹 Bear Scenario (~20%): Drop below $657 risks $640
Key Levels:
• Support: $657 / $658 (MA200)
• Resistance: $710 (MA20) / $733
#BNB $BNB #CryptoAnalysis #BinanceSquare
Current Price: ~$695 USDT (24h: -0.33%)
1️⃣ Status Quo & Momentum:
• RSI(14): 36.8 – Oversold (<40)
• Structure: Golden Cross, MA50 $746 / MA200 $658, Price below MA20
• Position: 20% from 30-day low – near bottom of recent range
2️⃣ 5-Day Volatility Band (1σ / ±2.44% daily SD, ATR 3.66%):
• Expected Trading Range: $657 – $733
3️⃣ Scenarios for the Next 5 Days:
🔹 Base Scenario (~50%): Consolidation $670-$710
🔹 Bull Scenario (~30%): Break above $710 targets $733
🔹 Bear Scenario (~20%): Drop below $657 risks $640
Key Levels:
• Support: $657 / $658 (MA200)
• Resistance: $710 (MA20) / $733
#BNB $BNB #CryptoAnalysis #BinanceSquare
1
27
·
--
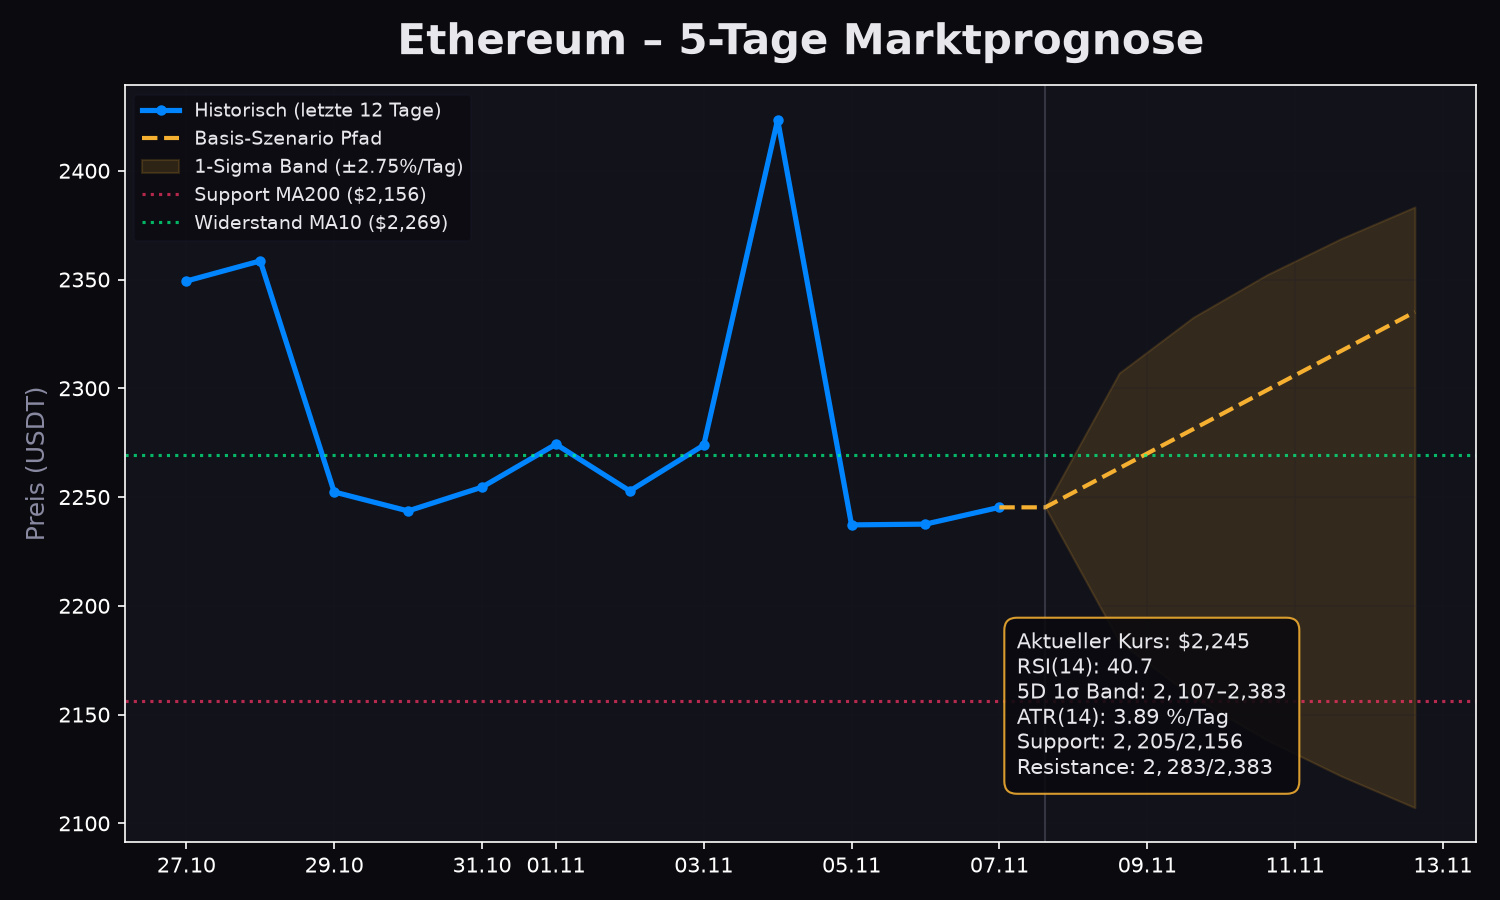
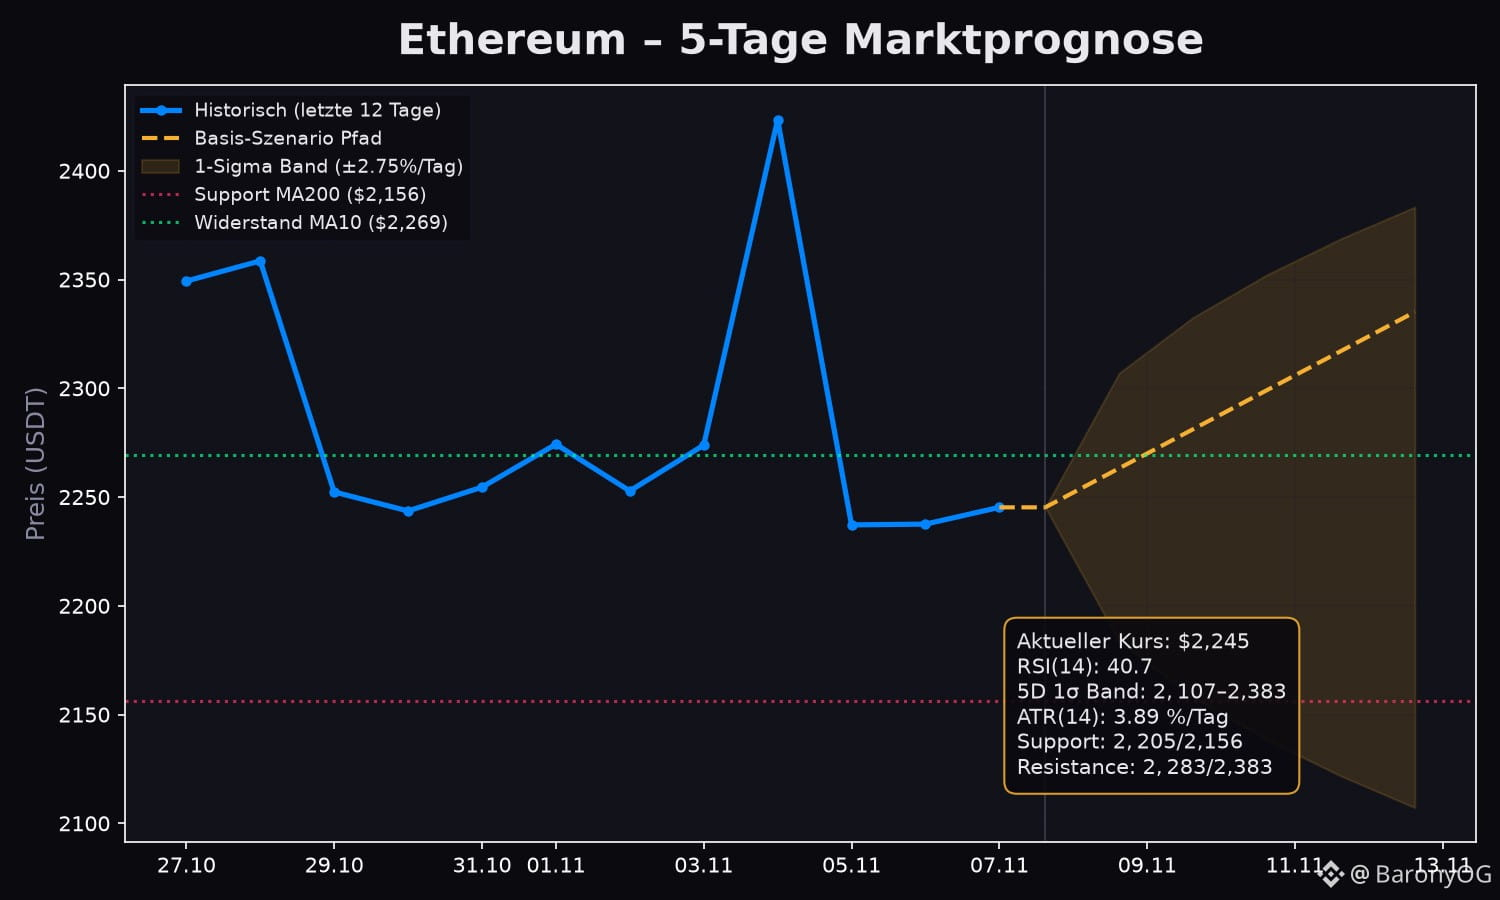
📊 #Ethereum ($ETH) 5-Day Market Forecast & Technical Analysis
Current Price: ~$2,245 USDT (24h: +0.28%)
1️⃣ Status Quo & Momentum:
• RSI(14): 40.7 – Neutral
• Structure: Golden Cross, MA50 $2,492 / MA200 $2,156, Price below MA20
• Position: 18% from 30-day low – near bottom of recent range
2️⃣ 5-Day Volatility Band (1σ / ±2.75% daily SD, ATR 3.89%):
• Expected Trading Range: $2,107 – $2,383
3️⃣ Scenarios for the Next 5 Days:
🔹 Base Scenario (~50%): Range-bound $2,150-$2,300
🔹 Bull Scenario (~30%): Break above $2,300 targets $2,380+
🔹 Bear Scenario (~20%): Drop below $2,100 risks $2,050
Key Levels:
• Support: $2,107 / $2,156 (MA200)
• Resistance: $2,300 (MA20) / $2,383
#ETH $ETH #CryptoAnalysis #BinanceSquare
📊 #Ethereum ($ETH ) 5-Day Market Forecast & Technical Analysis
Current Price: ~$2,245 USDT (24h: +0.28%)
1️⃣ Status Quo & Momentum:
• RSI(14): 40.7 – Neutral
• Structure: Golden Cross, MA50 $2,492 / MA200 $2,156, Price below MA20
• Position: 18% from 30-day low – near bottom of recent range
2️⃣ 5-Day Volatility Band (1σ / ±2.75% daily SD, ATR 3.89%):
• Expected Trading Range: $2,107 – $2,383
3️⃣ Scenarios for the Next 5 Days:
🔹 Base Scenario (~50%): Range-bound $2,150-$2,300
🔹 Bull Scenario (~30%): Break above $2,300 targets $2,380+
🔹 Bear Scenario (~20%): Drop below $2,100 risks $2,050
Key Levels:
• Support: $2,107 / $2,156 (MA200)
• Resistance: $2,300 (MA20) / $2,383
#ETH $ETH #CryptoAnalysis #BinanceSquare
Current Price: ~$2,245 USDT (24h: +0.28%)
1️⃣ Status Quo & Momentum:
• RSI(14): 40.7 – Neutral
• Structure: Golden Cross, MA50 $2,492 / MA200 $2,156, Price below MA20
• Position: 18% from 30-day low – near bottom of recent range
2️⃣ 5-Day Volatility Band (1σ / ±2.75% daily SD, ATR 3.89%):
• Expected Trading Range: $2,107 – $2,383
3️⃣ Scenarios for the Next 5 Days:
🔹 Base Scenario (~50%): Range-bound $2,150-$2,300
🔹 Bull Scenario (~30%): Break above $2,300 targets $2,380+
🔹 Bear Scenario (~20%): Drop below $2,100 risks $2,050
Key Levels:
• Support: $2,107 / $2,156 (MA200)
• Resistance: $2,300 (MA20) / $2,383
#ETH $ETH #CryptoAnalysis #BinanceSquare
1
41
·
--
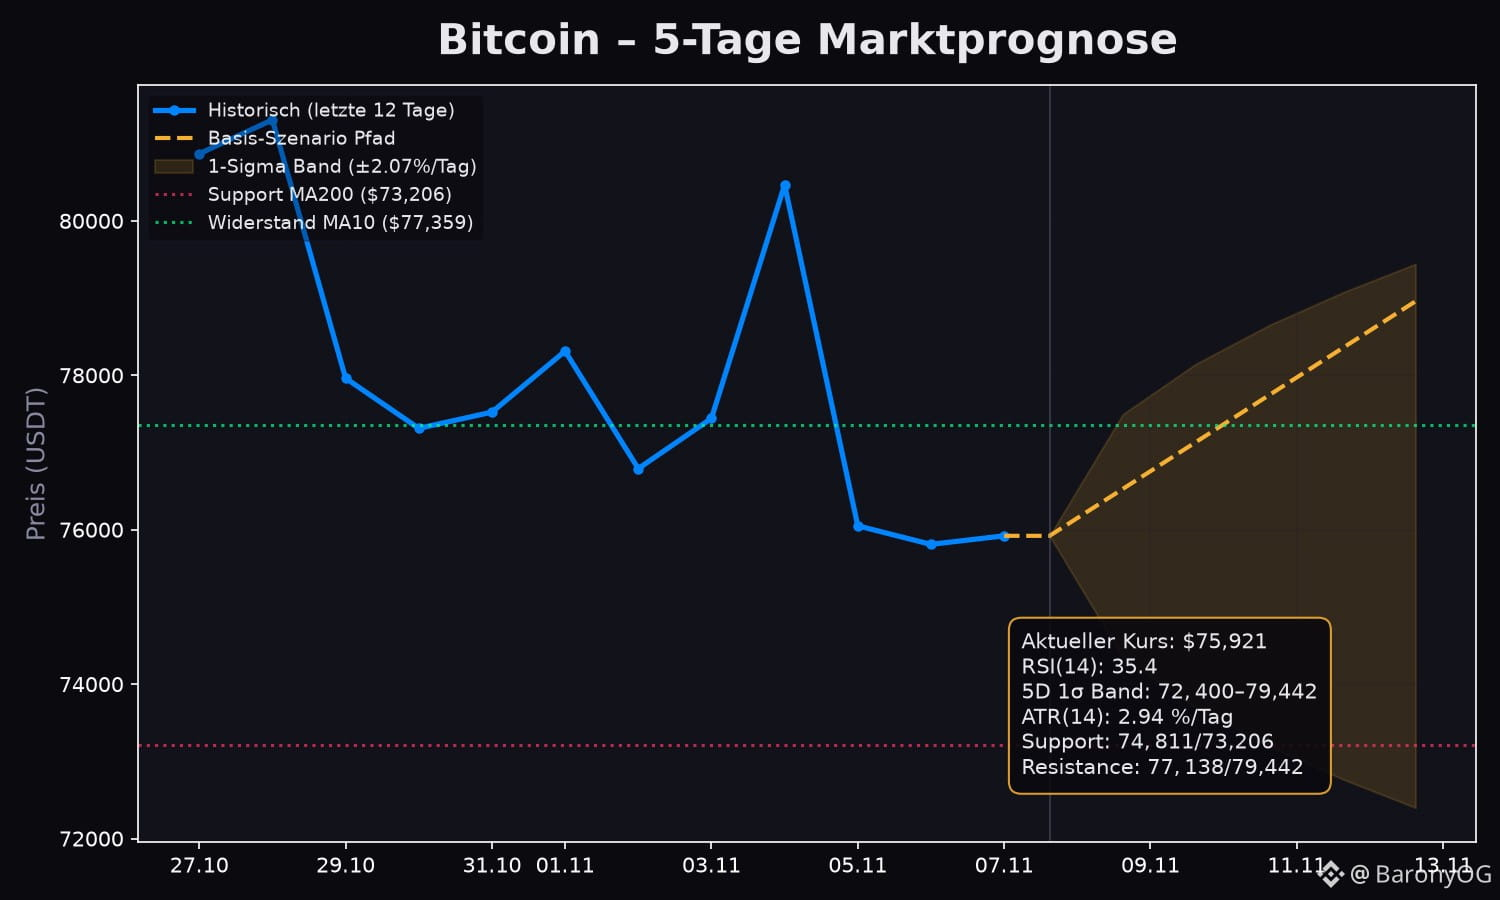
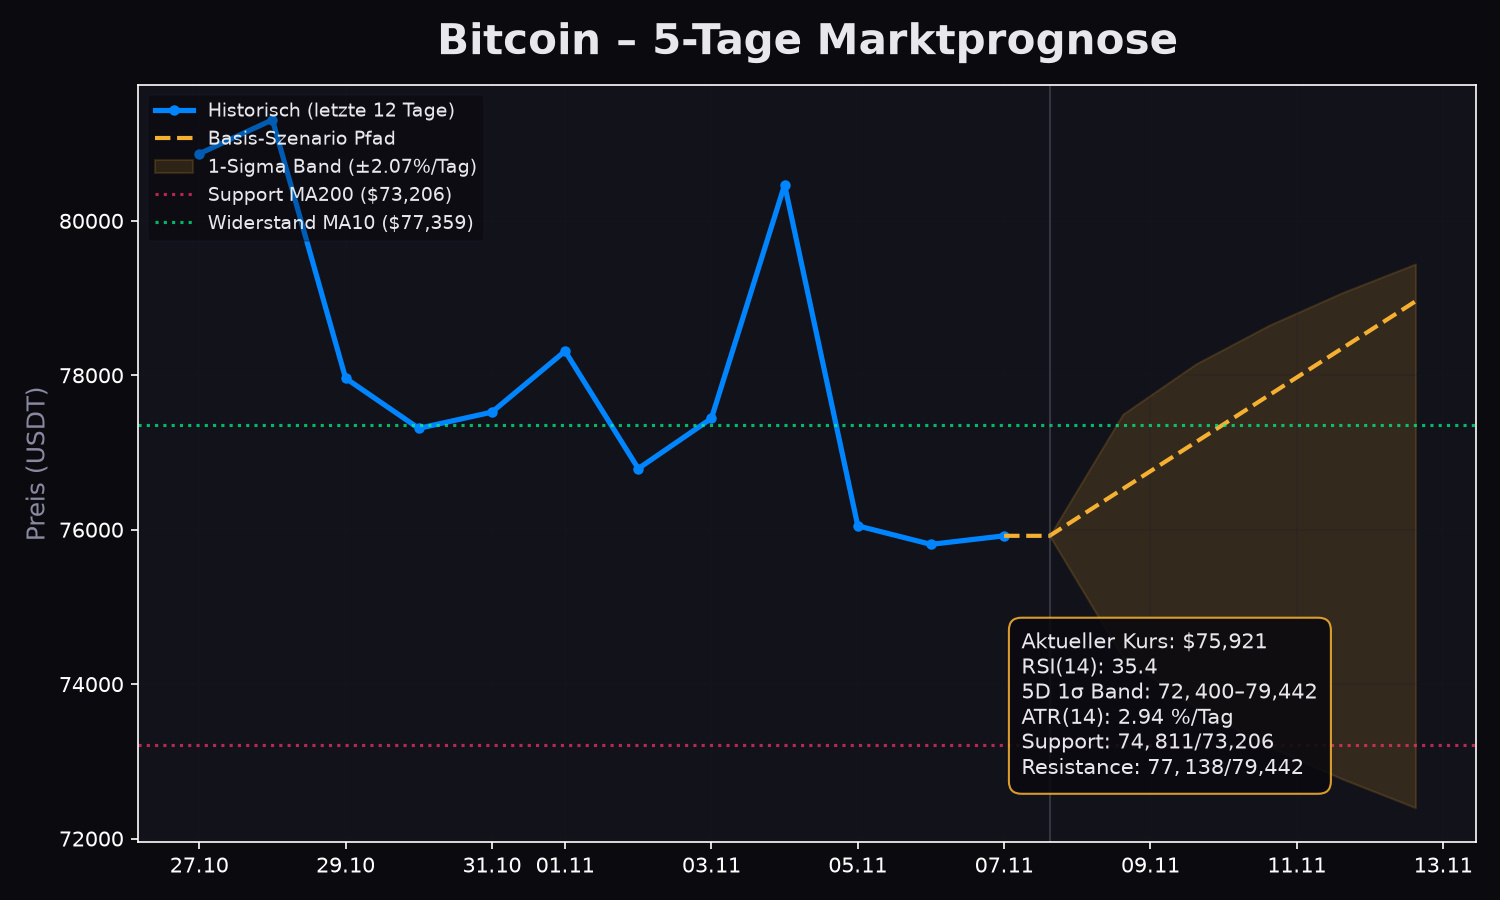
📊 #Bitcoin ($BTC) 5-Day Market Forecast & Technical Analysis
Current Price: ~$75,921 USDT (24h: -0.03%)
1️⃣ Status Quo & Momentum:
• RSI(14): 35.4 – Oversold (<40)
• Structure: Golden Cross, MA50 $81,911 / MA200 $73,206, Price below MA20
• Position: 11% from 30-day low – near bottom of recent range
2️⃣ 5-Day Volatility Band (1σ / ±2.07% daily SD, ATR 2.94%):
• Expected Trading Range: $72,400 – $79,442
3️⃣ Scenarios for the Next 5 Days:
🔹 Base Scenario (~50%): Consolidation $74,000-$77,500, testing MA20
🔹 Bull Scenario (~30%): Break above $77,500 targets $79,400+
🔹 Bear Scenario (~20%): Drop below $72,400 risks $70,000
Key Levels:
• Support: $72,400 / $73,200 (MA200)
• Resistance: $77,500 (MA20) / $79,440
#BTC $BTC #CryptoAnalysis #BinanceSquare
📊 #Bitcoin ($BTC ) 5-Day Market Forecast & Technical Analysis
Current Price: ~$75,921 USDT (24h: -0.03%)
1️⃣ Status Quo & Momentum:
• RSI(14): 35.4 – Oversold (<40)
• Structure: Golden Cross, MA50 $81,911 / MA200 $73,206, Price below MA20
• Position: 11% from 30-day low – near bottom of recent range
2️⃣ 5-Day Volatility Band (1σ / ±2.07% daily SD, ATR 2.94%):
• Expected Trading Range: $72,400 – $79,442
3️⃣ Scenarios for the Next 5 Days:
🔹 Base Scenario (~50%): Consolidation $74,000-$77,500, testing MA20
🔹 Bull Scenario (~30%): Break above $77,500 targets $79,400+
🔹 Bear Scenario (~20%): Drop below $72,400 risks $70,000
Key Levels:
• Support: $72,400 / $73,200 (MA200)
• Resistance: $77,500 (MA20) / $79,440
#BTC $BTC #CryptoAnalysis #BinanceSquare
Current Price: ~$75,921 USDT (24h: -0.03%)
1️⃣ Status Quo & Momentum:
• RSI(14): 35.4 – Oversold (<40)
• Structure: Golden Cross, MA50 $81,911 / MA200 $73,206, Price below MA20
• Position: 11% from 30-day low – near bottom of recent range
2️⃣ 5-Day Volatility Band (1σ / ±2.07% daily SD, ATR 2.94%):
• Expected Trading Range: $72,400 – $79,442
3️⃣ Scenarios for the Next 5 Days:
🔹 Base Scenario (~50%): Consolidation $74,000-$77,500, testing MA20
🔹 Bull Scenario (~30%): Break above $77,500 targets $79,400+
🔹 Bear Scenario (~20%): Drop below $72,400 risks $70,000
Key Levels:
• Support: $72,400 / $73,200 (MA200)
• Resistance: $77,500 (MA20) / $79,440
#BTC $BTC #CryptoAnalysis #BinanceSquare
1
62
·
--
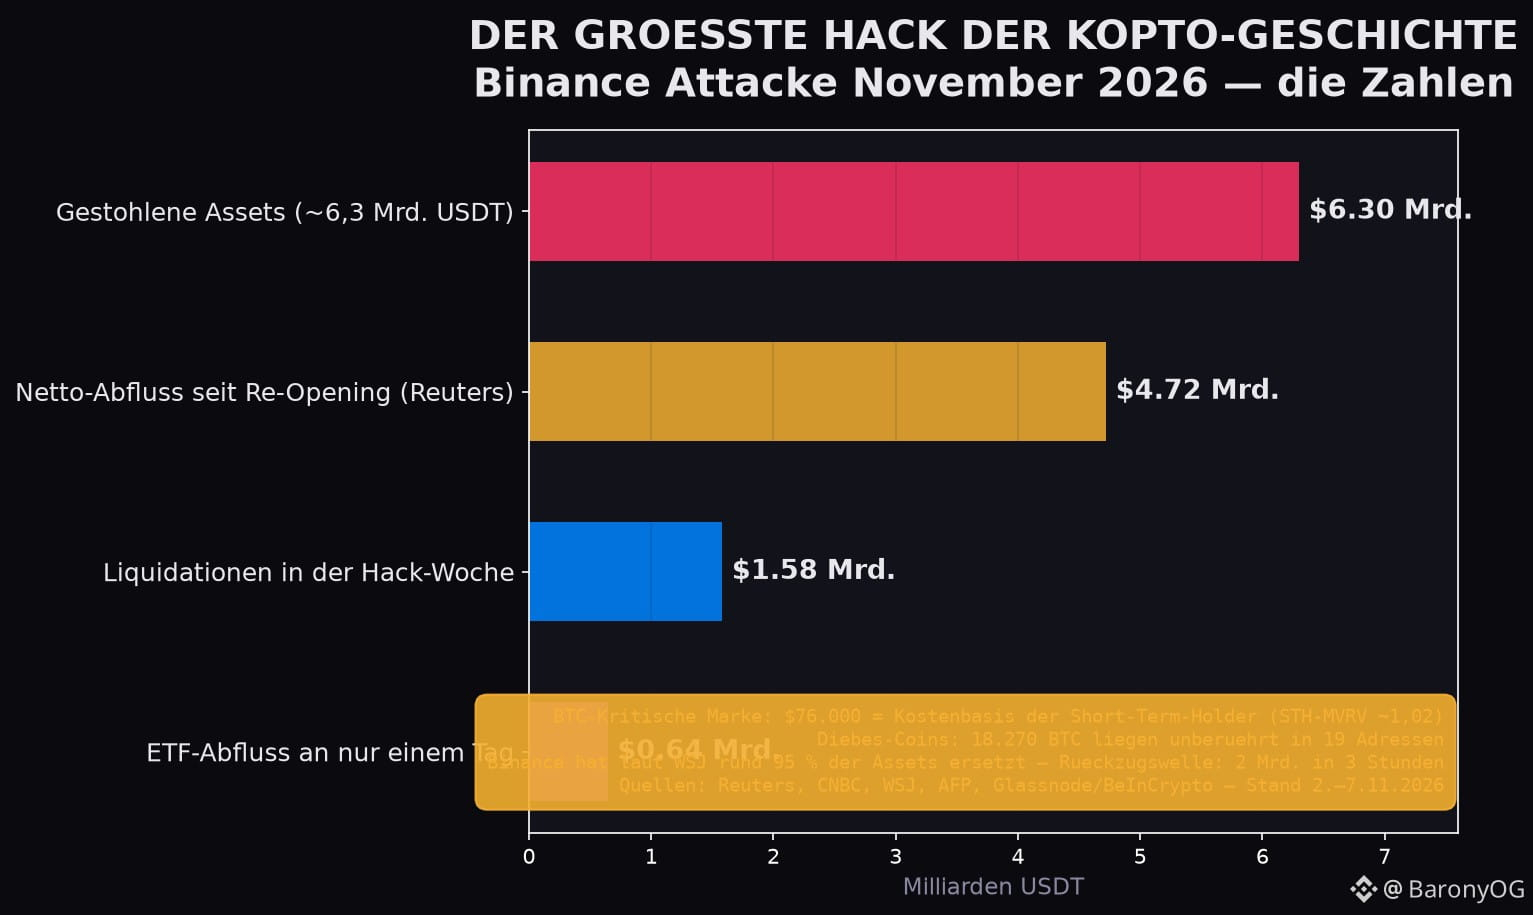
🚨 THE BIGGEST CRYPTO HACK OF ALL TIME — and the market is silent.
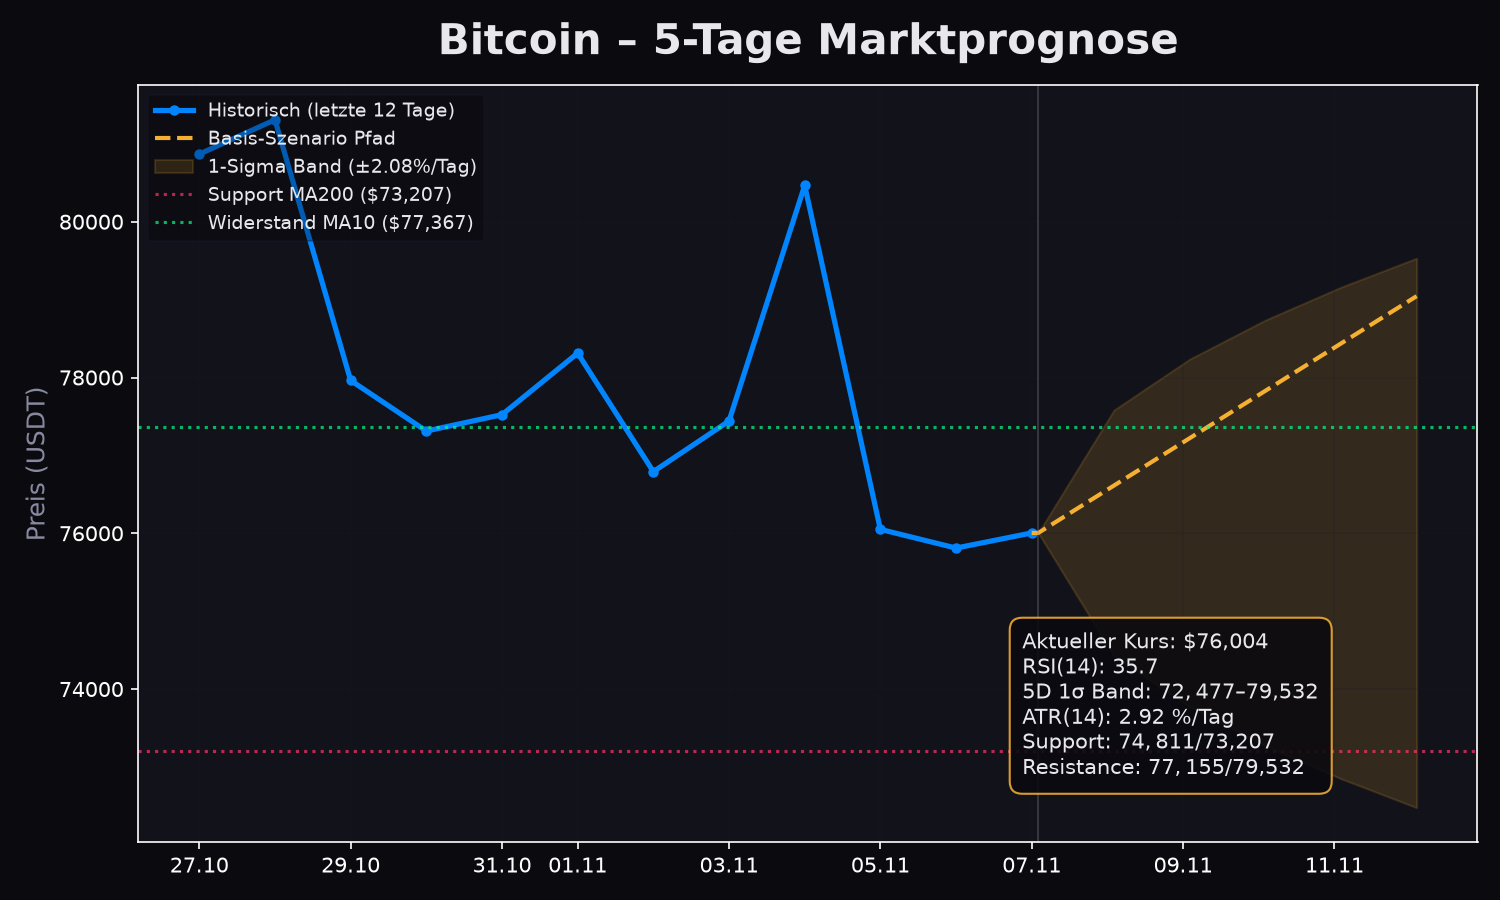
6.3 billion USDT stolen. 4.72 billion net outflow in just a few days (Reuters). 1.58 billion in liquidations. 643 million in ETF outflows in ONE day. And $BTC? Sitting at 76,004 USDT.
📌 WHY 76,000 IS NOW DETERMINING NOVEMBER’S FATE:
Glassnode shows: STH-MVRV ~1.02 — short-term holders have their cost basis at EXACTLY this level, on average. If the zone holds -> Recent Buyers stay profitable. If it breaks -> capitulation like in January and May.
1️⃣ Base case (~50%): Sideways between 72,477–79,532 (5D 1σ band), RSI 35.7 — slightly oversold, buying is possible.
2️⃣ Bull case (~25%): Reclaiming the MA10 at 77,367 -> target 79,500/81,000. The stolen coins (18,270 BTC!) remain quiet.
3️⃣ Bear case (~25%): Daily close below 74,811 -> MA200 at 73,207, then 70,000 is in play. A similar Supertrend flip to May = 25% downside.
⚠️ The real risk layer: As long as the hacker’s 18,270 BTC remain in 19 addresses, any move toward an exchange represents a supply of ~1.4 billion USDT.
What’s your position: Long, short, or sitting out? And where will the stolen coins go first — an exchange or the darknet? Let us know in the comments 👇 I’ll share the deep on-chain analysis (outflow timing + funding) in the first comment.
$BTC #Bitcoin #BinanceSquare #CryptoAnalysis
🚨 THE BIGGEST CRYPTO HACK OF ALL TIME — and the market is silent.
6.3 billion USDT stolen. 4.72 billion net outflow in just a few days (Reuters). 1.58 billion in liquidations. 643 million in ETF outflows in ONE day. And $BTC ? Sitting at 76,004 USDT.
📌 WHY 76,000 IS NOW DETERMINING NOVEMBER’S FATE:
Glassnode shows: STH-MVRV ~1.02 — short-term holders have their cost basis at EXACTLY this level, on average. If the zone holds -> Recent Buyers stay profitable. If it breaks -> capitulation like in January and May.
1️⃣ Base case (~50%): Sideways between 72,477–79,532 (5D 1σ band), RSI 35.7 — slightly oversold, buying is possible.
2️⃣ Bull case (~25%): Reclaiming the MA10 at 77,367 -> target 79,500/81,000. The stolen coins (18,270 BTC!) remain quiet.
3️⃣ Bear case (~25%): Daily close below 74,811 -> MA200 at 73,207, then 70,000 is in play. A similar Supertrend flip to May = 25% downside.
⚠️ The real risk layer: As long as the hacker’s 18,270 BTC remain in 19 addresses, any move toward an exchange represents a supply of ~1.4 billion USDT.
What’s your position: Long, short, or sitting out? And where will the stolen coins go first — an exchange or the darknet? Let us know in the comments 👇 I’ll share the deep on-chain analysis (outflow timing + funding) in the first comment.
$BTC #Bitcoin #BinanceSquare #CryptoAnalysis
6.3 billion USDT stolen. 4.72 billion net outflow in just a few days (Reuters). 1.58 billion in liquidations. 643 million in ETF outflows in ONE day. And $BTC ? Sitting at 76,004 USDT.
📌 WHY 76,000 IS NOW DETERMINING NOVEMBER’S FATE:
Glassnode shows: STH-MVRV ~1.02 — short-term holders have their cost basis at EXACTLY this level, on average. If the zone holds -> Recent Buyers stay profitable. If it breaks -> capitulation like in January and May.
1️⃣ Base case (~50%): Sideways between 72,477–79,532 (5D 1σ band), RSI 35.7 — slightly oversold, buying is possible.
2️⃣ Bull case (~25%): Reclaiming the MA10 at 77,367 -> target 79,500/81,000. The stolen coins (18,270 BTC!) remain quiet.
3️⃣ Bear case (~25%): Daily close below 74,811 -> MA200 at 73,207, then 70,000 is in play. A similar Supertrend flip to May = 25% downside.
⚠️ The real risk layer: As long as the hacker’s 18,270 BTC remain in 19 addresses, any move toward an exchange represents a supply of ~1.4 billion USDT.
What’s your position: Long, short, or sitting out? And where will the stolen coins go first — an exchange or the darknet? Let us know in the comments 👇 I’ll share the deep on-chain analysis (outflow timing + funding) in the first comment.
$BTC #Bitcoin #BinanceSquare #CryptoAnalysis
1
89
·
--
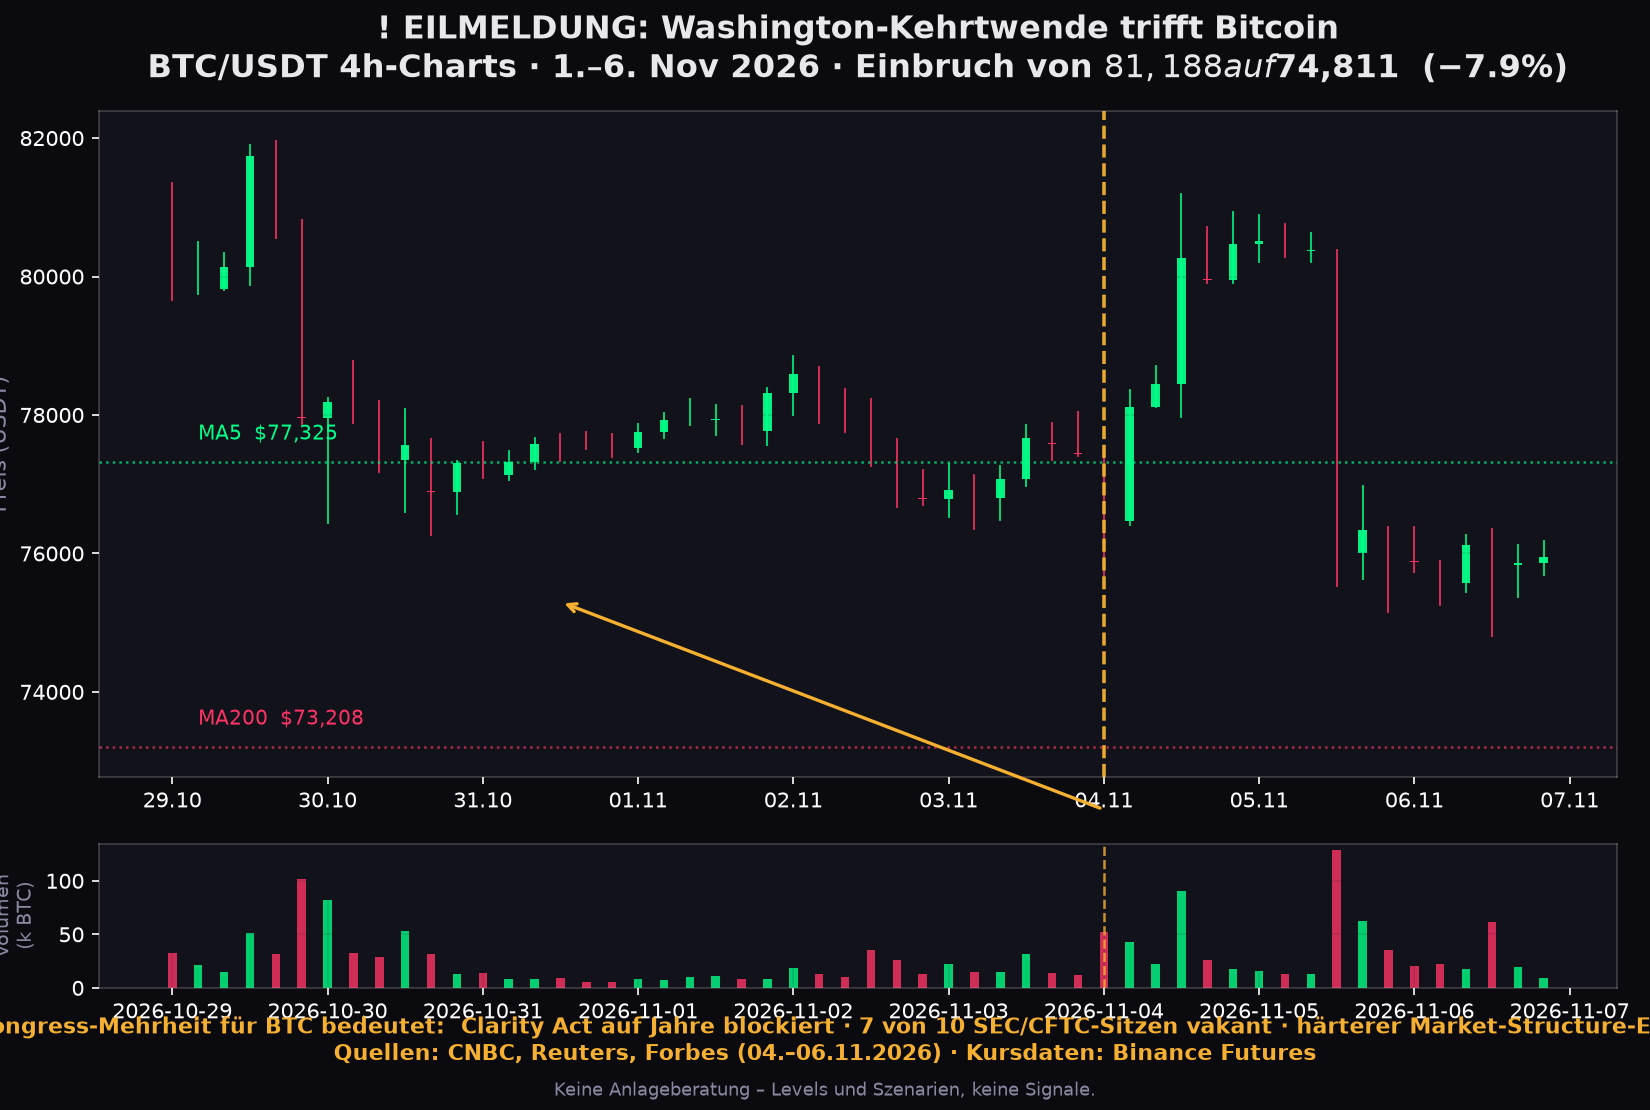
🚨 BREAKING NEWS from Washington: The Midterm Reversal & BTC
Democrats have won the Senate + House. The Clarity Act (market structure bill) is effectively blocked.
🔥 Impact analysis:
• Clarity Act: Little chance of passing over the next 2 years.
• Regulation: A tougher tone is expected; an investigation into Trump's crypto deals is likely.
• Existing measures: The stablecoin bill, ETFs & Bitcoin Reserve are safe.
📉 Market reaction:
BTC has fallen from $81,188 to $74,811 since Election Day (-7.9%).
📊 My analysis for the next 5 days:
1️⃣ 1σ band: $72,000 – $78,700
2️⃣ Key decision level: If $73,200 (MA200) breaks, $70,000 is at risk.
3️⃣ Long/Short: 74% long positions – dangerously high for another flush.
❓ YOUR TAKE:
1. Is your scenario a panic sell-off or HOLD?
2. Where is your support limit? $73,200 or lower?
3. Are you positioned long or short?
Comment now for a fact check (RSI/volume)! 👇
#Bitcoin $BTC #CryptoPolitics #BTCUSDT #BinanceSquare
🚨 BREAKING NEWS from Washington: The Midterm Reversal & BTC
Democrats have won the Senate + House. The Clarity Act (market structure bill) is effectively blocked.
🔥 Impact analysis:
• Clarity Act: Little chance of passing over the next 2 years.
• Regulation: A tougher tone is expected; an investigation into Trump's crypto deals is likely.
• Existing measures: The stablecoin bill, ETFs & Bitcoin Reserve are safe.
📉 Market reaction:
BTC has fallen from $81,188 to $74,811 since Election Day (-7.9%).
📊 My analysis for the next 5 days:
1️⃣ 1σ band: $72,000 – $78,700
2️⃣ Key decision level: If $73,200 (MA200) breaks, $70,000 is at risk.
3️⃣ Long/Short: 74% long positions – dangerously high for another flush.
❓ YOUR TAKE:
1. Is your scenario a panic sell-off or HOLD?
2. Where is your support limit? $73,200 or lower?
3. Are you positioned long or short?
Comment now for a fact check (RSI/volume)! 👇
#Bitcoin $BTC #CryptoPolitics #BTCUSDT #BinanceSquare
Democrats have won the Senate + House. The Clarity Act (market structure bill) is effectively blocked.
🔥 Impact analysis:
• Clarity Act: Little chance of passing over the next 2 years.
• Regulation: A tougher tone is expected; an investigation into Trump's crypto deals is likely.
• Existing measures: The stablecoin bill, ETFs & Bitcoin Reserve are safe.
📉 Market reaction:
BTC has fallen from $81,188 to $74,811 since Election Day (-7.9%).
📊 My analysis for the next 5 days:
1️⃣ 1σ band: $72,000 – $78,700
2️⃣ Key decision level: If $73,200 (MA200) breaks, $70,000 is at risk.
3️⃣ Long/Short: 74% long positions – dangerously high for another flush.
❓ YOUR TAKE:
1. Is your scenario a panic sell-off or HOLD?
2. Where is your support limit? $73,200 or lower?
3. Are you positioned long or short?
Comment now for a fact check (RSI/volume)! 👇
#Bitcoin $BTC #CryptoPolitics #BTCUSDT #BinanceSquare
1
18
·
--
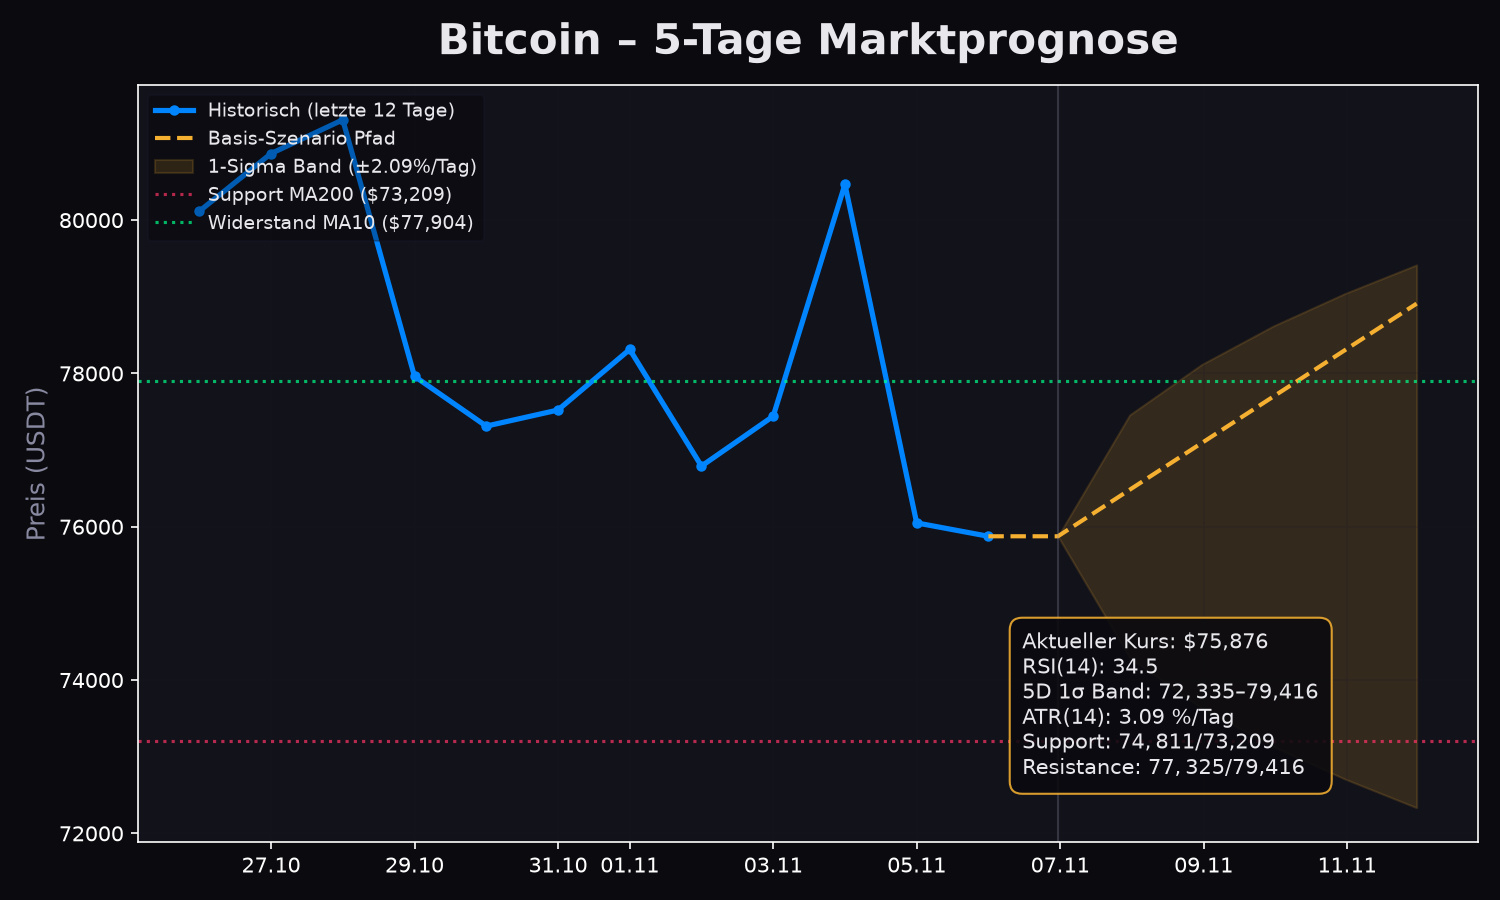
🤔 $BTC at $75,875 – and you?
The price has been stuck in a tight range for 5 days, RSI(14) is at 34.5, 74% of futures accounts are long, and funding is virtually zero (0.009%). That means everyone is waiting for someone to blink first.
I expect a range of $72,300 to $79,400 over the next 5 days (1σ band, ATR 3.1%/day). Support at $74,800 and $73,200 (MA200), resistance at $77,300 / $79,200.
Now I want your opinion—not mine:
1️⃣ Where will $BTC be by Friday?
👉 Comment "%Bull" if you expect it to be above $79k
👉 Comment "%Bear" if you expect it to be below $73k
👉 Comment "%Sideways" if you're betting on consolidation
2️⃣ Are you currently long or short in your portfolio—and at what entry price?
3️⃣ Which number is decisive for you: $73,200 (MA200) or $79,200 (breakout)?
I post every tracker comparison. Anyone who shares their trade or scenario thoughts in the comments will get a fact-check from me, including RSI, volume band, and liquidity zone. 📊
I’ll explain in the first comment why the 74% long ratio is extremely dangerous. 👇
#Bitcoin $BTC #BTCUSDT #CryptoAnalysis #Trading
🤔 $BTC at $75,875 – and you?
The price has been stuck in a tight range for 5 days, RSI(14) is at 34.5, 74% of futures accounts are long, and funding is virtually zero (0.009%). That means everyone is waiting for someone to blink first.
I expect a range of $72,300 to $79,400 over the next 5 days (1σ band, ATR 3.1%/day). Support at $74,800 and $73,200 (MA200), resistance at $77,300 / $79,200.
Now I want your opinion—not mine:
1️⃣ Where will $BTC be by Friday?
👉 Comment "%Bull" if you expect it to be above $79k
👉 Comment "%Bear" if you expect it to be below $73k
👉 Comment "%Sideways" if you're betting on consolidation
2️⃣ Are you currently long or short in your portfolio—and at what entry price?
3️⃣ Which number is decisive for you: $73,200 (MA200) or $79,200 (breakout)?
I post every tracker comparison. Anyone who shares their trade or scenario thoughts in the comments will get a fact-check from me, including RSI, volume band, and liquidity zone. 📊
I’ll explain in the first comment why the 74% long ratio is extremely dangerous. 👇
#Bitcoin $BTC #BTCUSDT #CryptoAnalysis #Trading
The price has been stuck in a tight range for 5 days, RSI(14) is at 34.5, 74% of futures accounts are long, and funding is virtually zero (0.009%). That means everyone is waiting for someone to blink first.
I expect a range of $72,300 to $79,400 over the next 5 days (1σ band, ATR 3.1%/day). Support at $74,800 and $73,200 (MA200), resistance at $77,300 / $79,200.
Now I want your opinion—not mine:
1️⃣ Where will $BTC be by Friday?
👉 Comment "%Bull" if you expect it to be above $79k
👉 Comment "%Bear" if you expect it to be below $73k
👉 Comment "%Sideways" if you're betting on consolidation
2️⃣ Are you currently long or short in your portfolio—and at what entry price?
3️⃣ Which number is decisive for you: $73,200 (MA200) or $79,200 (breakout)?
I post every tracker comparison. Anyone who shares their trade or scenario thoughts in the comments will get a fact-check from me, including RSI, volume band, and liquidity zone. 📊
I’ll explain in the first comment why the 74% long ratio is extremely dangerous. 👇
#Bitcoin $BTC #BTCUSDT #CryptoAnalysis #Trading
1
32
·
--
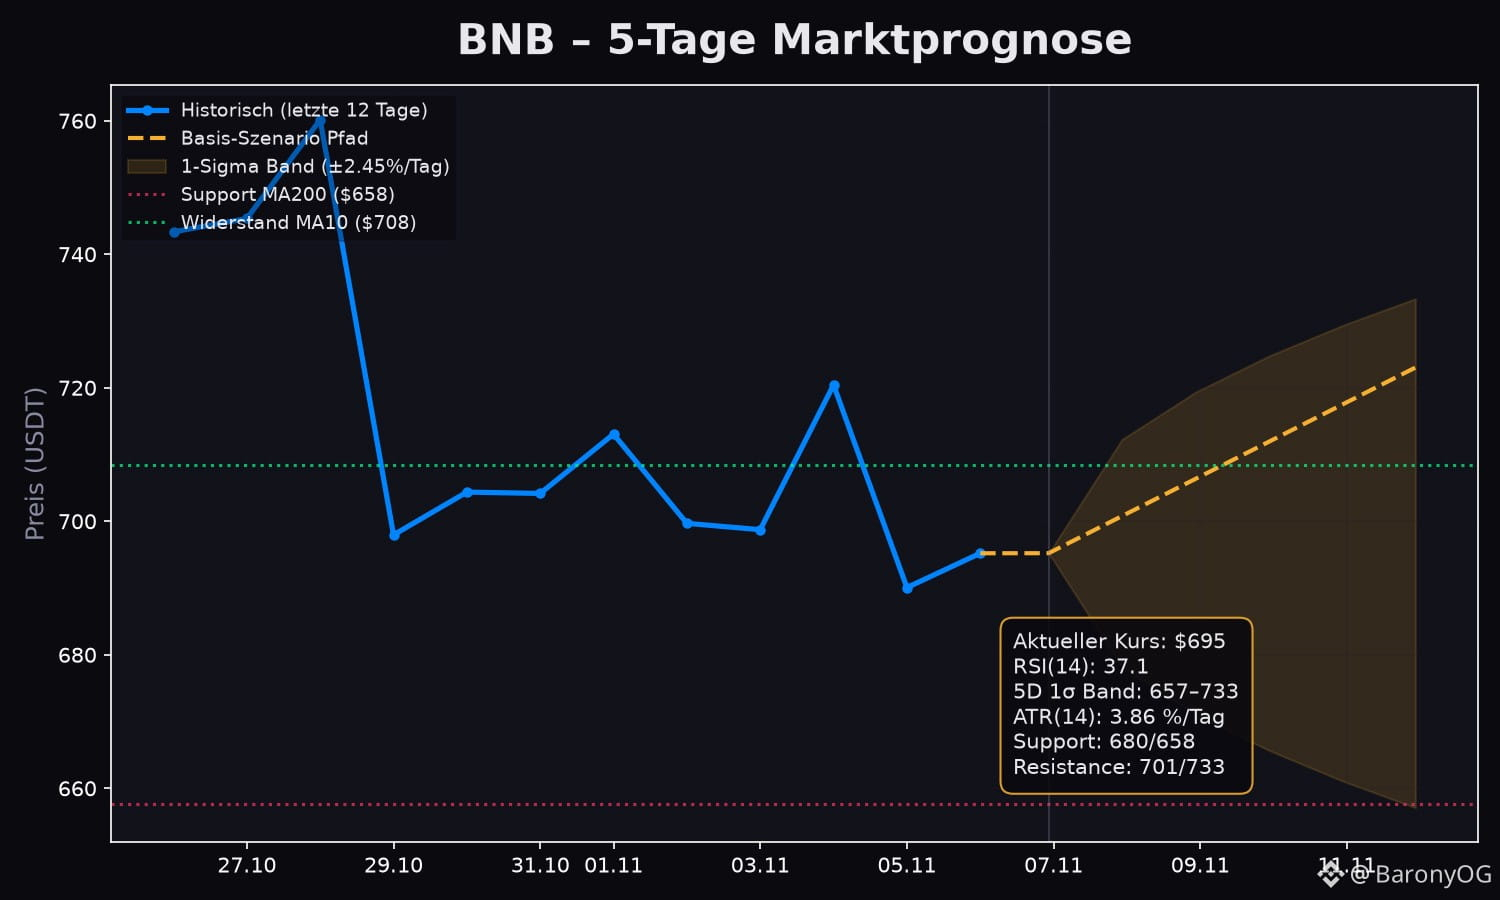
📊 #BNB ($BNB) 5-Day Market Forecast & Technical Analysis
Current Price: ~$695 USDT (24h: +0.76%)
1️⃣ Status Quo & Momentum:
• RSI(14): 37.1 – neutral to slightly weak, not in oversold territory.
• Golden Cross MA50/MA200 intact (MA50 $747 / MA200 $658).
• Price is holding above the MA200 – broader bullish structure.
2️⃣ 5-Day Volatility Band (1σ / ±2.45% daily SD, ATR 3.86%):
• Expected trading range: $657 – $733
3️⃣ Scenarios for the next 5 days:
🔹 Base scenario (~50%): Consolidation at $680 – $720.
🔹 Bull scenario (~30%): Break above $708 (MA10), with a target of $733.
🔹 Bear scenario (~20%): Drop below $680 → test of $657 / MA200.
Key levels:
• Support: $680 / $658 (MA200)
• Resistance: $708 / $733
#BNB $BNB #CryptoAnalysis #BinanceSquare
📊 #BNB ($BNB ) 5-Day Market Forecast & Technical Analysis
Current Price: ~$695 USDT (24h: +0.76%)
1️⃣ Status Quo & Momentum:
• RSI(14): 37.1 – neutral to slightly weak, not in oversold territory.
• Golden Cross MA50/MA200 intact (MA50 $747 / MA200 $658).
• Price is holding above the MA200 – broader bullish structure.
2️⃣ 5-Day Volatility Band (1σ / ±2.45% daily SD, ATR 3.86%):
• Expected trading range: $657 – $733
3️⃣ Scenarios for the next 5 days:
🔹 Base scenario (~50%): Consolidation at $680 – $720.
🔹 Bull scenario (~30%): Break above $708 (MA10), with a target of $733.
🔹 Bear scenario (~20%): Drop below $680 → test of $657 / MA200.
Key levels:
• Support: $680 / $658 (MA200)
• Resistance: $708 / $733
#BNB $BNB #CryptoAnalysis #BinanceSquare
Current Price: ~$695 USDT (24h: +0.76%)
1️⃣ Status Quo & Momentum:
• RSI(14): 37.1 – neutral to slightly weak, not in oversold territory.
• Golden Cross MA50/MA200 intact (MA50 $747 / MA200 $658).
• Price is holding above the MA200 – broader bullish structure.
2️⃣ 5-Day Volatility Band (1σ / ±2.45% daily SD, ATR 3.86%):
• Expected trading range: $657 – $733
3️⃣ Scenarios for the next 5 days:
🔹 Base scenario (~50%): Consolidation at $680 – $720.
🔹 Bull scenario (~30%): Break above $708 (MA10), with a target of $733.
🔹 Bear scenario (~20%): Drop below $680 → test of $657 / MA200.
Key levels:
• Support: $680 / $658 (MA200)
• Resistance: $708 / $733
#BNB $BNB #CryptoAnalysis #BinanceSquare
1
43
·
--
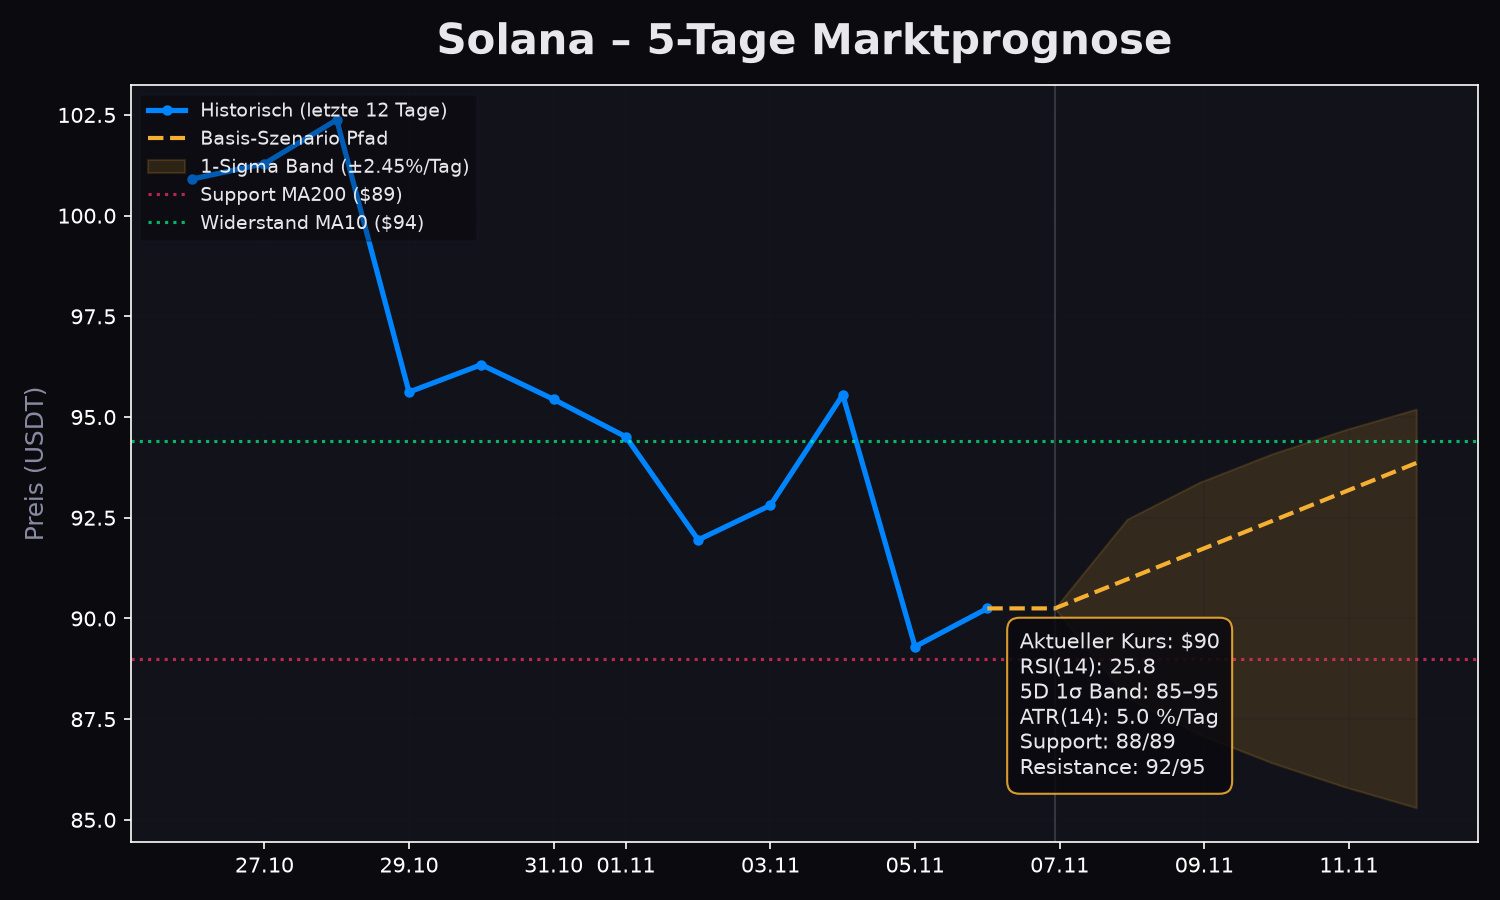
📊 #Solana ($SOL) 5-Day Market Forecast & Technical Analysis
Current price: ~$90.25 USDT (24h: +0.41%)
1️⃣ Status Quo & Momentum:
• RSI(14): 25.8 – clearly oversold; a rebound is likely.
• Weak structure: price below MA50 ($108) and MA20 ($99), with MA200 ($89) approaching.
• Trading near the bottom of the 30-day range (7% above the low).
2️⃣ 5-Day Volatility Band (1σ / ±2.45% daily SD, ATR 5.0%):
• Expected trading range: $85 – $95
3️⃣ Scenarios for the next 5 days:
🔹 Base scenario (~50%): Recovery attempt to $86 – $93.
🔹 Bull scenario (~25%): Rebound above $94.40 (MA10), targeting $99 (MA20).
🔹 Bear scenario (~25%): Break below the $88 zone → test of $85 / $82.
Key levels:
• Support: $88 / $85
• Resistance: $94 / $99
#SOL $SOL #CryptoAnalysis #BinanceSquare
📊 #Solana ($SOL ) 5-Day Market Forecast & Technical Analysis
Current price: ~$90.25 USDT (24h: +0.41%)
1️⃣ Status Quo & Momentum:
• RSI(14): 25.8 – clearly oversold; a rebound is likely.
• Weak structure: price below MA50 ($108) and MA20 ($99), with MA200 ($89) approaching.
• Trading near the bottom of the 30-day range (7% above the low).
2️⃣ 5-Day Volatility Band (1σ / ±2.45% daily SD, ATR 5.0%):
• Expected trading range: $85 – $95
3️⃣ Scenarios for the next 5 days:
🔹 Base scenario (~50%): Recovery attempt to $86 – $93.
🔹 Bull scenario (~25%): Rebound above $94.40 (MA10), targeting $99 (MA20).
🔹 Bear scenario (~25%): Break below the $88 zone → test of $85 / $82.
Key levels:
• Support: $88 / $85
• Resistance: $94 / $99
#SOL $SOL #CryptoAnalysis #BinanceSquare
Current price: ~$90.25 USDT (24h: +0.41%)
1️⃣ Status Quo & Momentum:
• RSI(14): 25.8 – clearly oversold; a rebound is likely.
• Weak structure: price below MA50 ($108) and MA20 ($99), with MA200 ($89) approaching.
• Trading near the bottom of the 30-day range (7% above the low).
2️⃣ 5-Day Volatility Band (1σ / ±2.45% daily SD, ATR 5.0%):
• Expected trading range: $85 – $95
3️⃣ Scenarios for the next 5 days:
🔹 Base scenario (~50%): Recovery attempt to $86 – $93.
🔹 Bull scenario (~25%): Rebound above $94.40 (MA10), targeting $99 (MA20).
🔹 Bear scenario (~25%): Break below the $88 zone → test of $85 / $82.
Key levels:
• Support: $88 / $85
• Resistance: $94 / $99
#SOL $SOL #CryptoAnalysis #BinanceSquare
1
65
·
--
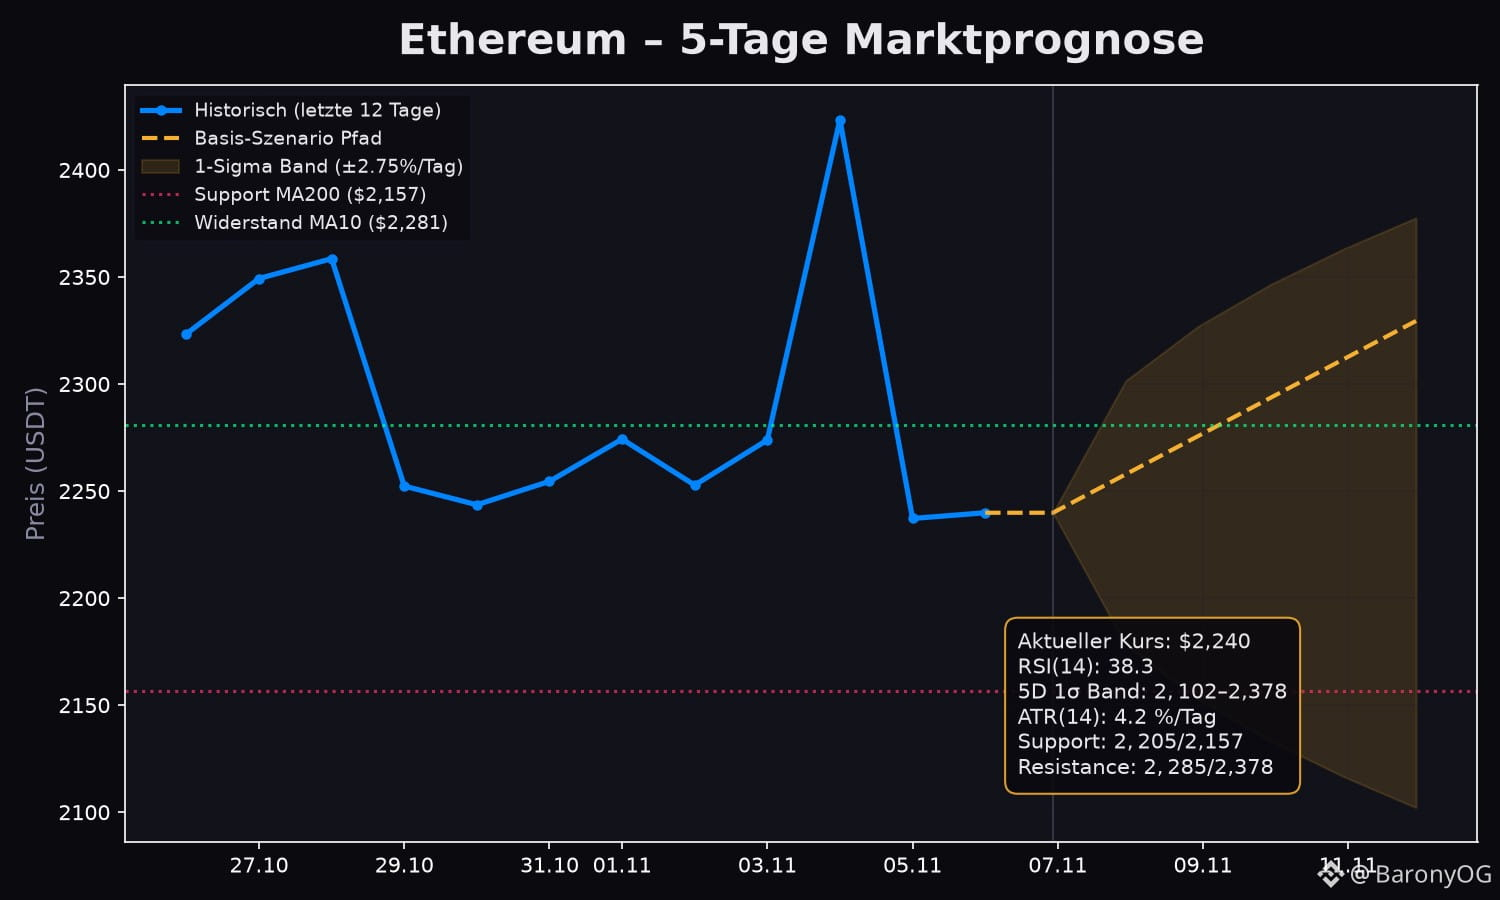
📊 #Ethereum ($ETH) 5-Day Market Forecast & Technical Analysis
Current price: ~$2,240 USDT (24h: +0.25%)
1️⃣ Status Quo & Momentum:
• RSI(14): 38.3 – in the lower range, not yet oversold.
• Golden Cross MA50/MA200 remains intact (MA50 $2,500 / MA200 $2,157).
• Price is trading near the 30-day low → a bottom may be forming.
2️⃣ 5-Day Volatility Band (1σ / ±2.75% daily SD, ATR 4.2%):
• Expected trading range: $2,102 – $2,378
3️⃣ Scenarios for the next 5 days:
🔹 Base scenario (~50%): Consolidation at $2,150 – $2,350.
🔹 Bull scenario (~30%): Breakout above $2,285 (MA5/MA10), with a target of $2,380.
🔹 Bear scenario (~20%): Break below $2,150 → test of MA200 at $2,157 / $2,100.
Key levels:
• Support: $2,205 / $2,100
• Resistance: $2,285 / $2,378
#ETH $ETH #CryptoAnalysis #BinanceSquare
📊 #Ethereum ($ETH ) 5-Day Market Forecast & Technical Analysis
Current price: ~$2,240 USDT (24h: +0.25%)
1️⃣ Status Quo & Momentum:
• RSI(14): 38.3 – in the lower range, not yet oversold.
• Golden Cross MA50/MA200 remains intact (MA50 $2,500 / MA200 $2,157).
• Price is trading near the 30-day low → a bottom may be forming.
2️⃣ 5-Day Volatility Band (1σ / ±2.75% daily SD, ATR 4.2%):
• Expected trading range: $2,102 – $2,378
3️⃣ Scenarios for the next 5 days:
🔹 Base scenario (~50%): Consolidation at $2,150 – $2,350.
🔹 Bull scenario (~30%): Breakout above $2,285 (MA5/MA10), with a target of $2,380.
🔹 Bear scenario (~20%): Break below $2,150 → test of MA200 at $2,157 / $2,100.
Key levels:
• Support: $2,205 / $2,100
• Resistance: $2,285 / $2,378
#ETH $ETH #CryptoAnalysis #BinanceSquare
Current price: ~$2,240 USDT (24h: +0.25%)
1️⃣ Status Quo & Momentum:
• RSI(14): 38.3 – in the lower range, not yet oversold.
• Golden Cross MA50/MA200 remains intact (MA50 $2,500 / MA200 $2,157).
• Price is trading near the 30-day low → a bottom may be forming.
2️⃣ 5-Day Volatility Band (1σ / ±2.75% daily SD, ATR 4.2%):
• Expected trading range: $2,102 – $2,378
3️⃣ Scenarios for the next 5 days:
🔹 Base scenario (~50%): Consolidation at $2,150 – $2,350.
🔹 Bull scenario (~30%): Breakout above $2,285 (MA5/MA10), with a target of $2,380.
🔹 Bear scenario (~20%): Break below $2,150 → test of MA200 at $2,157 / $2,100.
Key levels:
• Support: $2,205 / $2,100
• Resistance: $2,285 / $2,378
#ETH $ETH #CryptoAnalysis #BinanceSquare
1
78
·
--
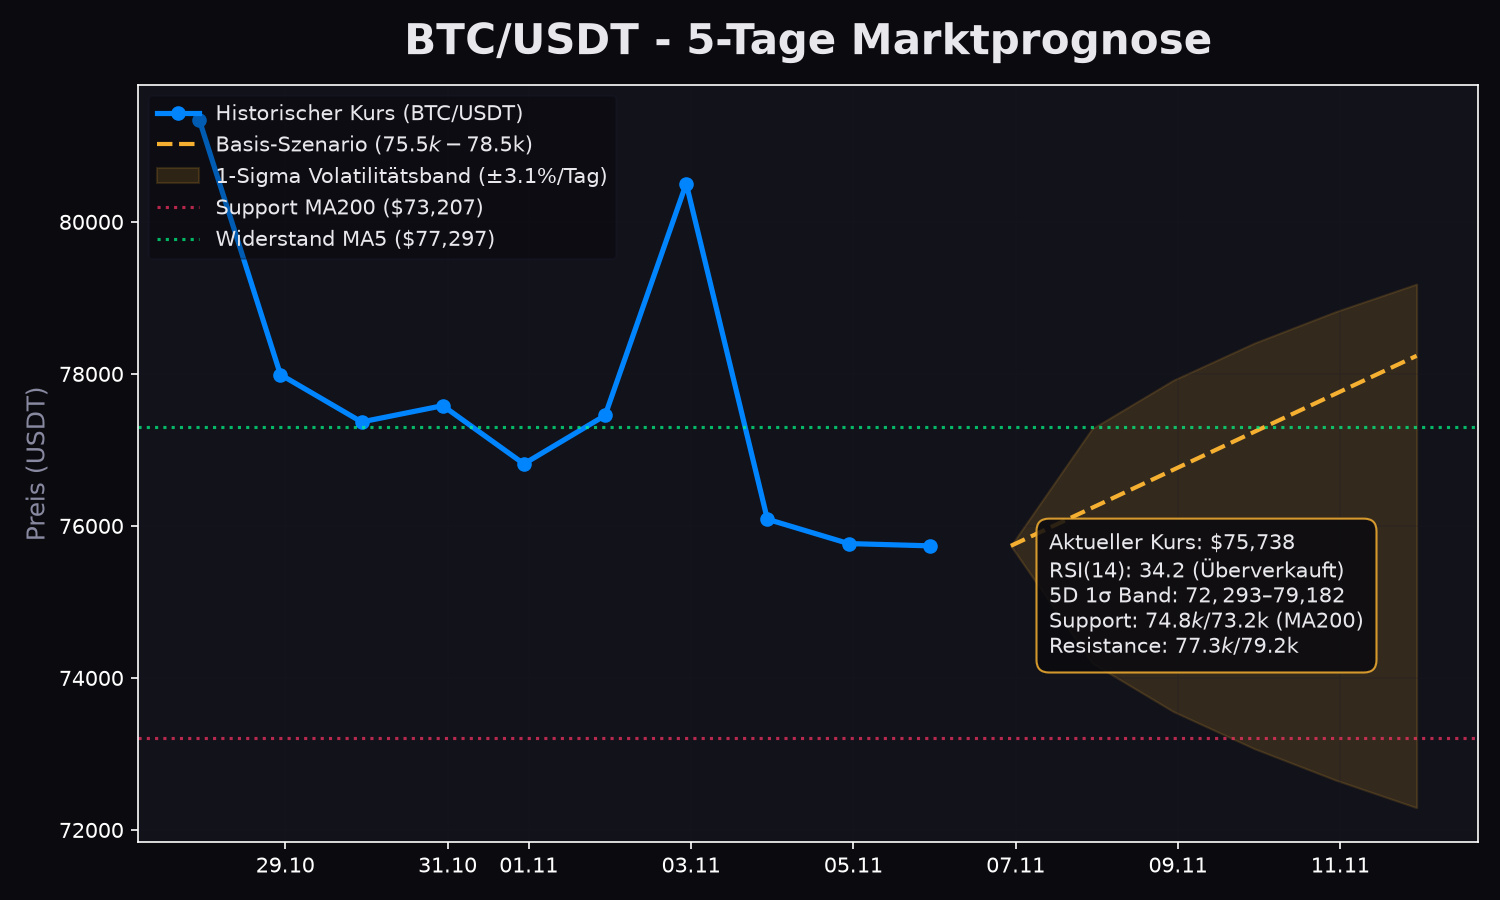
📊 #Bitcoin ($BTC) 5-Day Market Forecast & Technical Analysis
Current price: ~$75,738 USDT
1️⃣ Status Quo & Momentum:
• RSI(14): 34.2 – Slightly oversold territory.
• The broader trend (Golden Cross MA50/MA200) remains intact.
• MA200 at $73,207 provides strong support.
2️⃣ 5-Day Volatility Band (1σ / ±3.1% daily ATR):
• Expected trading range: $72,293 – $79,182
3️⃣ Scenarios for the next 5 days:
🔹 Base scenario (50%): Consolidation & bottom formation in the $74,800 – $78,500 range.
🔹 Bull scenario (30%): Breakout above resistance at $77,300, targeting $79,200.
🔹 Bear scenario (20%): Test of the support area at $74,800 / $73,200 (MA200).
Key levels:
• Support: $74,800 / $73,200
• Resistance: $77,300 / $79,200
#BTC $BTC #CryptoAnalysis #BinanceSquare
📊 #Bitcoin ($BTC ) 5-Day Market Forecast & Technical Analysis
Current price: ~$75,738 USDT
1️⃣ Status Quo & Momentum:
• RSI(14): 34.2 – Slightly oversold territory.
• The broader trend (Golden Cross MA50/MA200) remains intact.
• MA200 at $73,207 provides strong support.
2️⃣ 5-Day Volatility Band (1σ / ±3.1% daily ATR):
• Expected trading range: $72,293 – $79,182
3️⃣ Scenarios for the next 5 days:
🔹 Base scenario (50%): Consolidation & bottom formation in the $74,800 – $78,500 range.
🔹 Bull scenario (30%): Breakout above resistance at $77,300, targeting $79,200.
🔹 Bear scenario (20%): Test of the support area at $74,800 / $73,200 (MA200).
Key levels:
• Support: $74,800 / $73,200
• Resistance: $77,300 / $79,200
#BTC $BTC #CryptoAnalysis #BinanceSquare
Current price: ~$75,738 USDT
1️⃣ Status Quo & Momentum:
• RSI(14): 34.2 – Slightly oversold territory.
• The broader trend (Golden Cross MA50/MA200) remains intact.
• MA200 at $73,207 provides strong support.
2️⃣ 5-Day Volatility Band (1σ / ±3.1% daily ATR):
• Expected trading range: $72,293 – $79,182
3️⃣ Scenarios for the next 5 days:
🔹 Base scenario (50%): Consolidation & bottom formation in the $74,800 – $78,500 range.
🔹 Bull scenario (30%): Breakout above resistance at $77,300, targeting $79,200.
🔹 Bear scenario (20%): Test of the support area at $74,800 / $73,200 (MA200).
Key levels:
• Support: $74,800 / $73,200
• Resistance: $77,300 / $79,200
#BTC $BTC #CryptoAnalysis #BinanceSquare
1
124
·
--
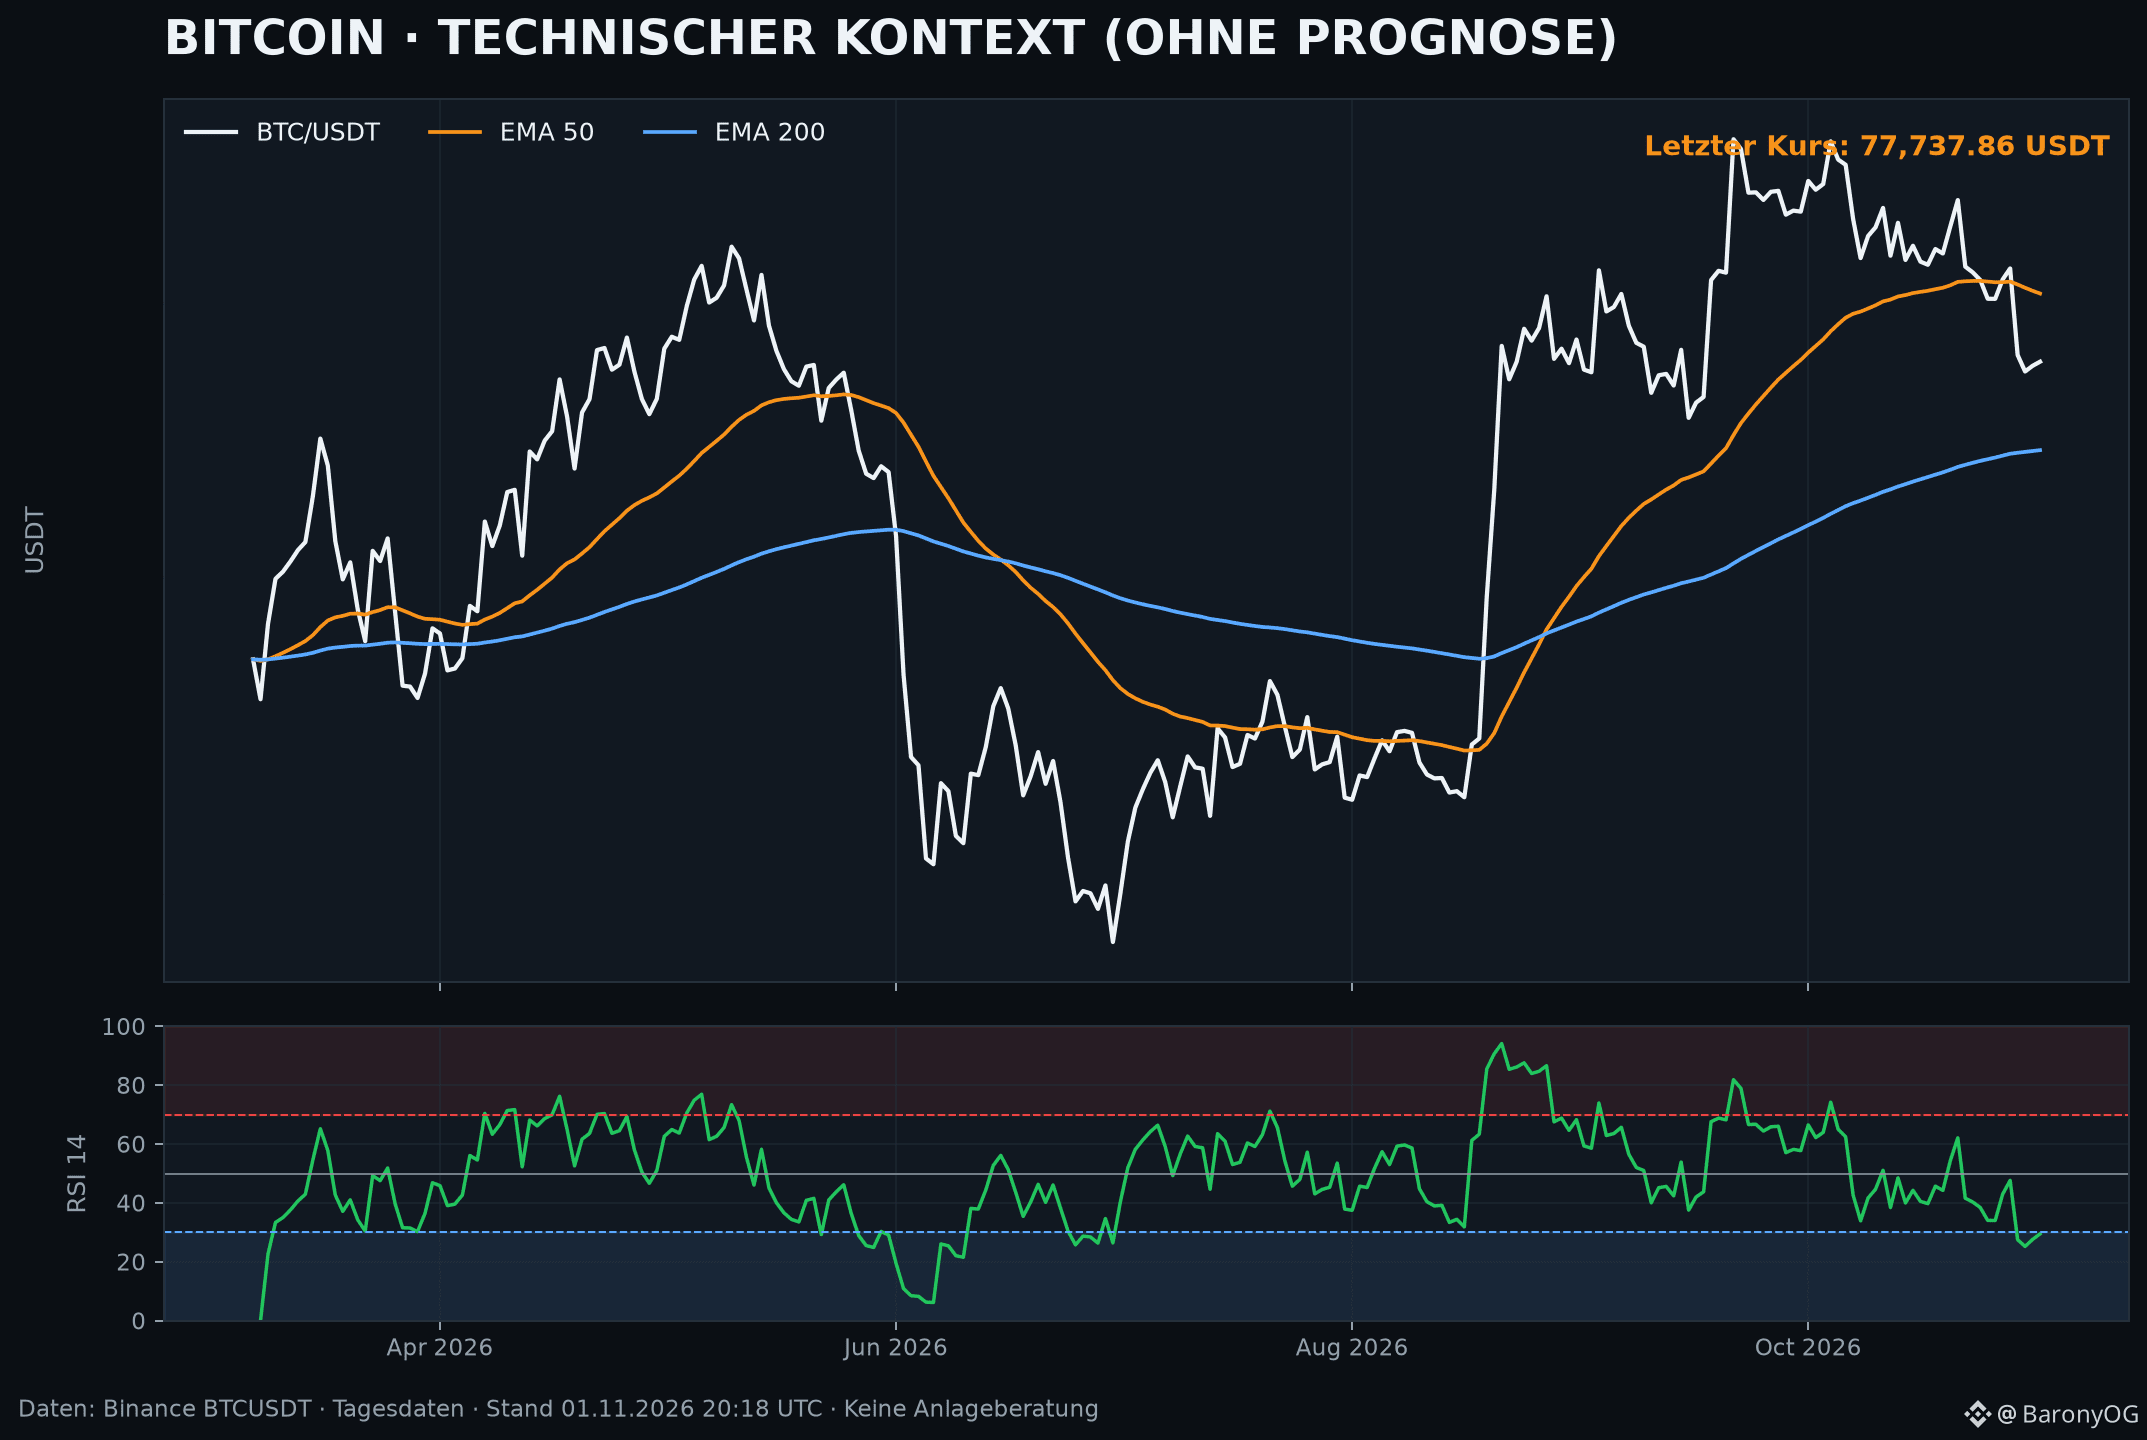
Technical context, not a cursor oracle: BTC/USDT with EMA 50, EMA 200, and RSI 14. The moving averages help put the trend into context; the RSI measures momentum, not the direction of the next price move. The data date and methodology are shown directly in the chart. Not investment advice. #Bitcoin #BTC #TechnicalAnalysis
Technical context, not a cursor oracle: BTC/USDT with EMA 50, EMA 200, and RSI 14. The moving averages help put the trend into context; the RSI measures momentum, not the direction of the next price move. The data date and methodology are shown directly in the chart. Not investment advice. #Bitcoin #BTC #TechnicalAnalysis
1
30
·
--
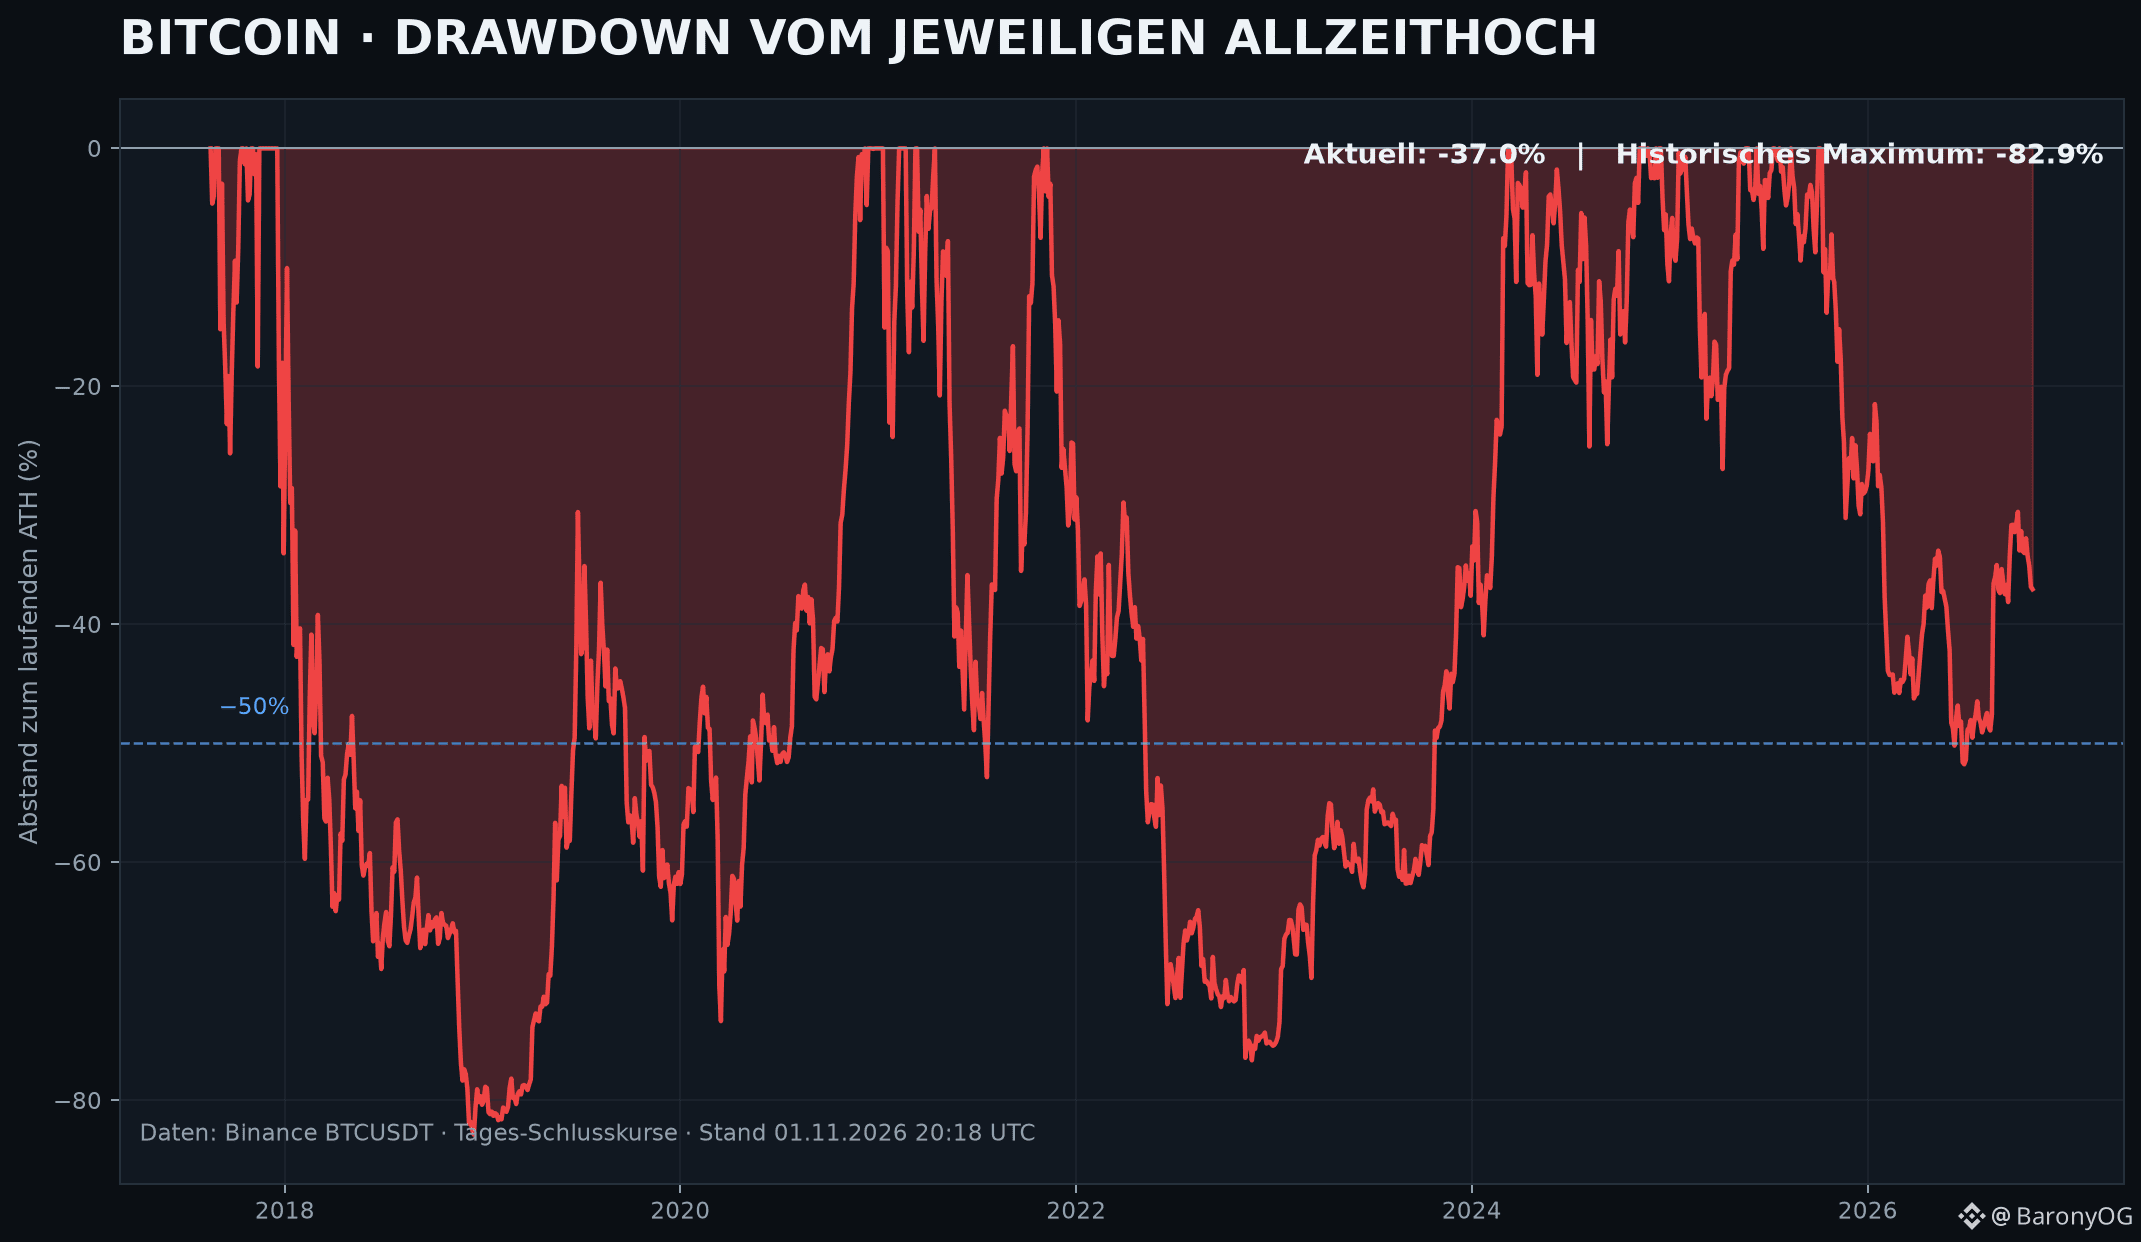
What matters is not just the decline, but how far it is from the previous all-time high. This drawdown chart shows the full Binance-BTCUSDT history and puts the current phase in context relative to earlier cycles. Important: A drawdown describes the past; it is not a buy signal. #Bitcoin #BTC #Market analysis
What matters is not just the decline, but how far it is from the previous all-time high. This drawdown chart shows the full Binance-BTCUSDT history and puts the current phase in context relative to earlier cycles. Important: A drawdown describes the past; it is not a buy signal. #Bitcoin #BTC #Market analysis
1
23
Log in to explore more content
Join global crypto users on Binance Square
⚡️ Get latest and useful information about crypto.
💬 Trusted by the world’s largest crypto exchange.
👍 Discover real insights from verified creators.
Email / Phone number
Trending Topics
SouthKoreaDraftLawTargets15To20%ShareholderCap
228 views
25 Discussing
#SouthKoreaDraftLawTargets15To20%ShareholderCap
🇰🇷 South Korea Eyes Crypto Exchange Ownership Cap 🚨
South Korea's push to limit major shareholders in crypto exchanges is heating up. 🔥 The Financial Services Commission first floated a 15% to 20% cap to avoid conflicts of interest. 📉 Later reports say regulators and lawmakers settled on a 20% cap, with stakes of up to 34% allowed in certain exceptions. ⚖️ (Yahoo Finance) (theblock)
The rule would sit inside the Digital Asset Basic Act, and Bithumb and Gopax would likely need big ownership changes. 🏦 Industry players are pushing back hard. 💬 (theblock)
Will this make the market fairer, or hurt innovation? 🤔
#SouthKorea #Upbit #Bithumb 🚀
#Nadeemgujjar143
@aasho @长风Nova @Eşsiz kimi @Fatima SheRazi Official @Ayeza998
$BTC
$BNB
$ETH
NADEEM Gujjar143
·0 Likes
·58 views
KeplrAdvisesSocialLoginUsersToTransferAssets
5,262 views
154 Discussing
TetherPlans€28.8MForJuventusCapitalIncrease
3,179 views
125 Discussing