
AlphaCryptoSignal
813 Posts

AlphaCryptoSignal
Report
Block User
27 combined years in crypto, surviving drops and lost passwords. Real insights to keep your portfolio thriving | X: @AlphaCryptoSign
5 Following
5.4K+ Followers
1.2K+ Liked
Posts
All
Quotes
·
--
Bullish
Chart Request: #ONDO
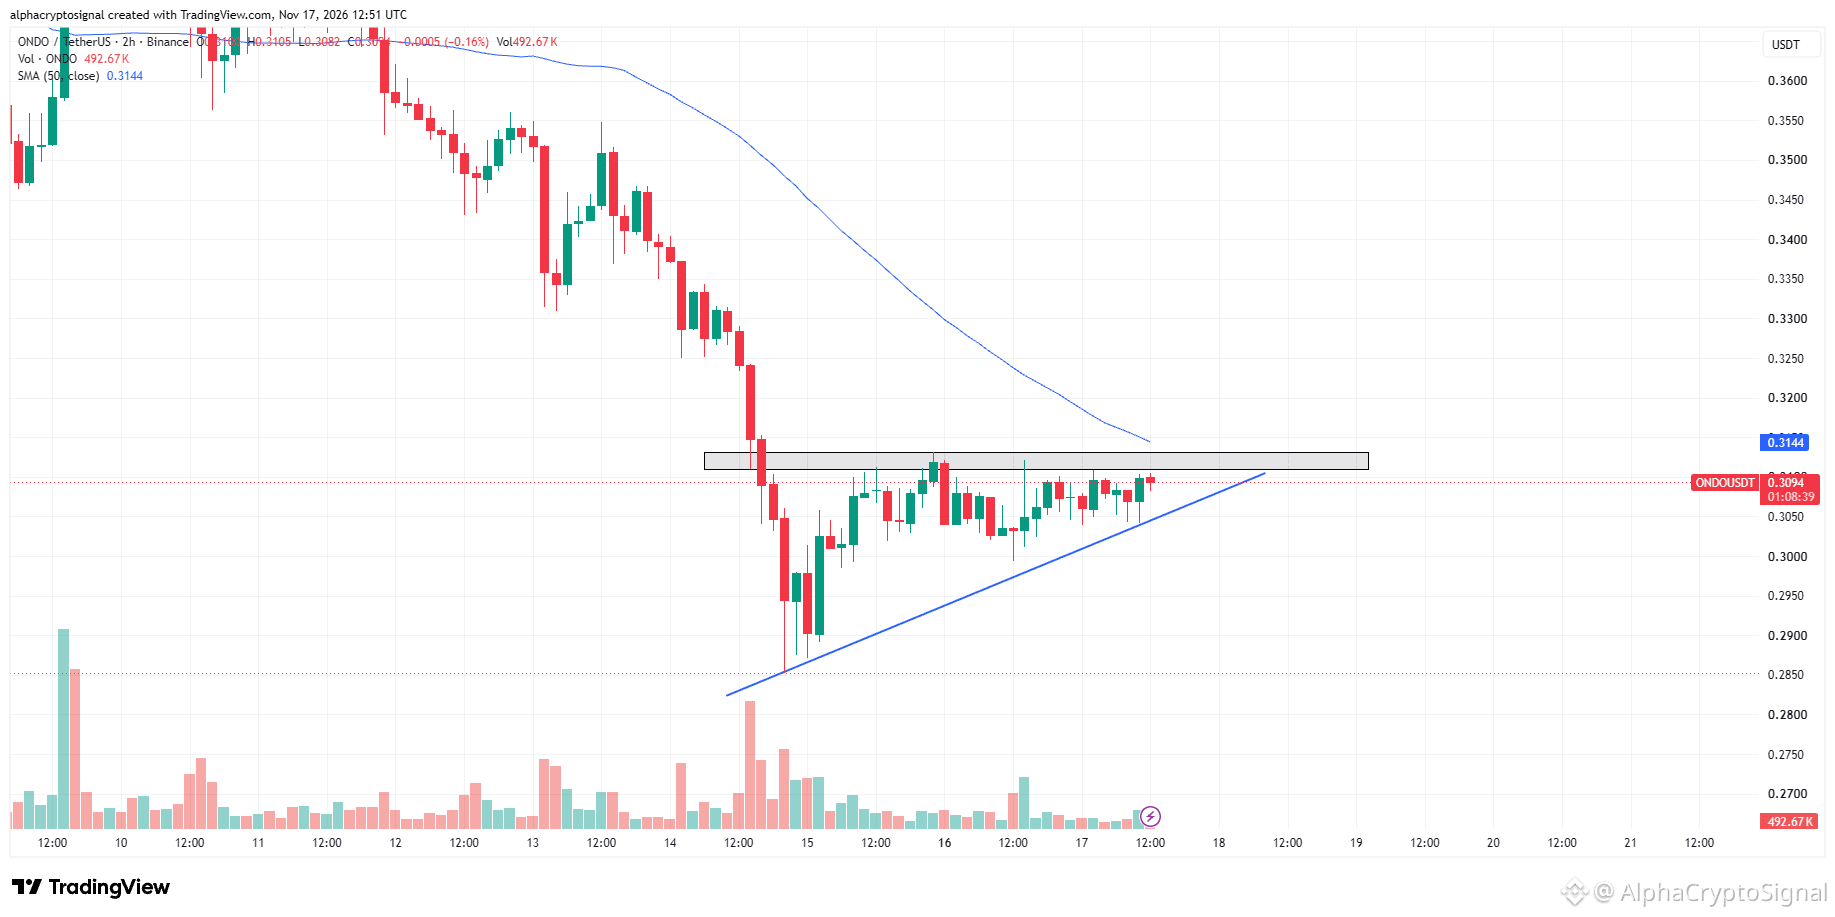
$ONDO is forming an ascending triangle on the lower timeframe, with price making higher lows while repeatedly testing horizontal resistance around $0.31–$0.313. The structure is similar to $NEO, but volume remains relatively subdued.
A confirmed breakout with volume expansion could open the door for a short-term recovery. We will wait for the breakout and retest before considering a long entry. No need to rush.
{future}(ONDOUSDT)
Chart Request: #ONDO
$ONDO is forming an ascending triangle on the lower timeframe, with price making higher lows while repeatedly testing horizontal resistance around $0.31–$0.313. The structure is similar to $NEO, but volume remains relatively subdued.
A confirmed breakout with volume expansion could open the door for a short-term recovery. We will wait for the breakout and retest before considering a long entry. No need to rush.
$ONDO is forming an ascending triangle on the lower timeframe, with price making higher lows while repeatedly testing horizontal resistance around $0.31–$0.313. The structure is similar to $NEO, but volume remains relatively subdued.
A confirmed breakout with volume expansion could open the door for a short-term recovery. We will wait for the breakout and retest before considering a long entry. No need to rush.
1
64
·
--
Bullish
Thoughts on #ZAMA
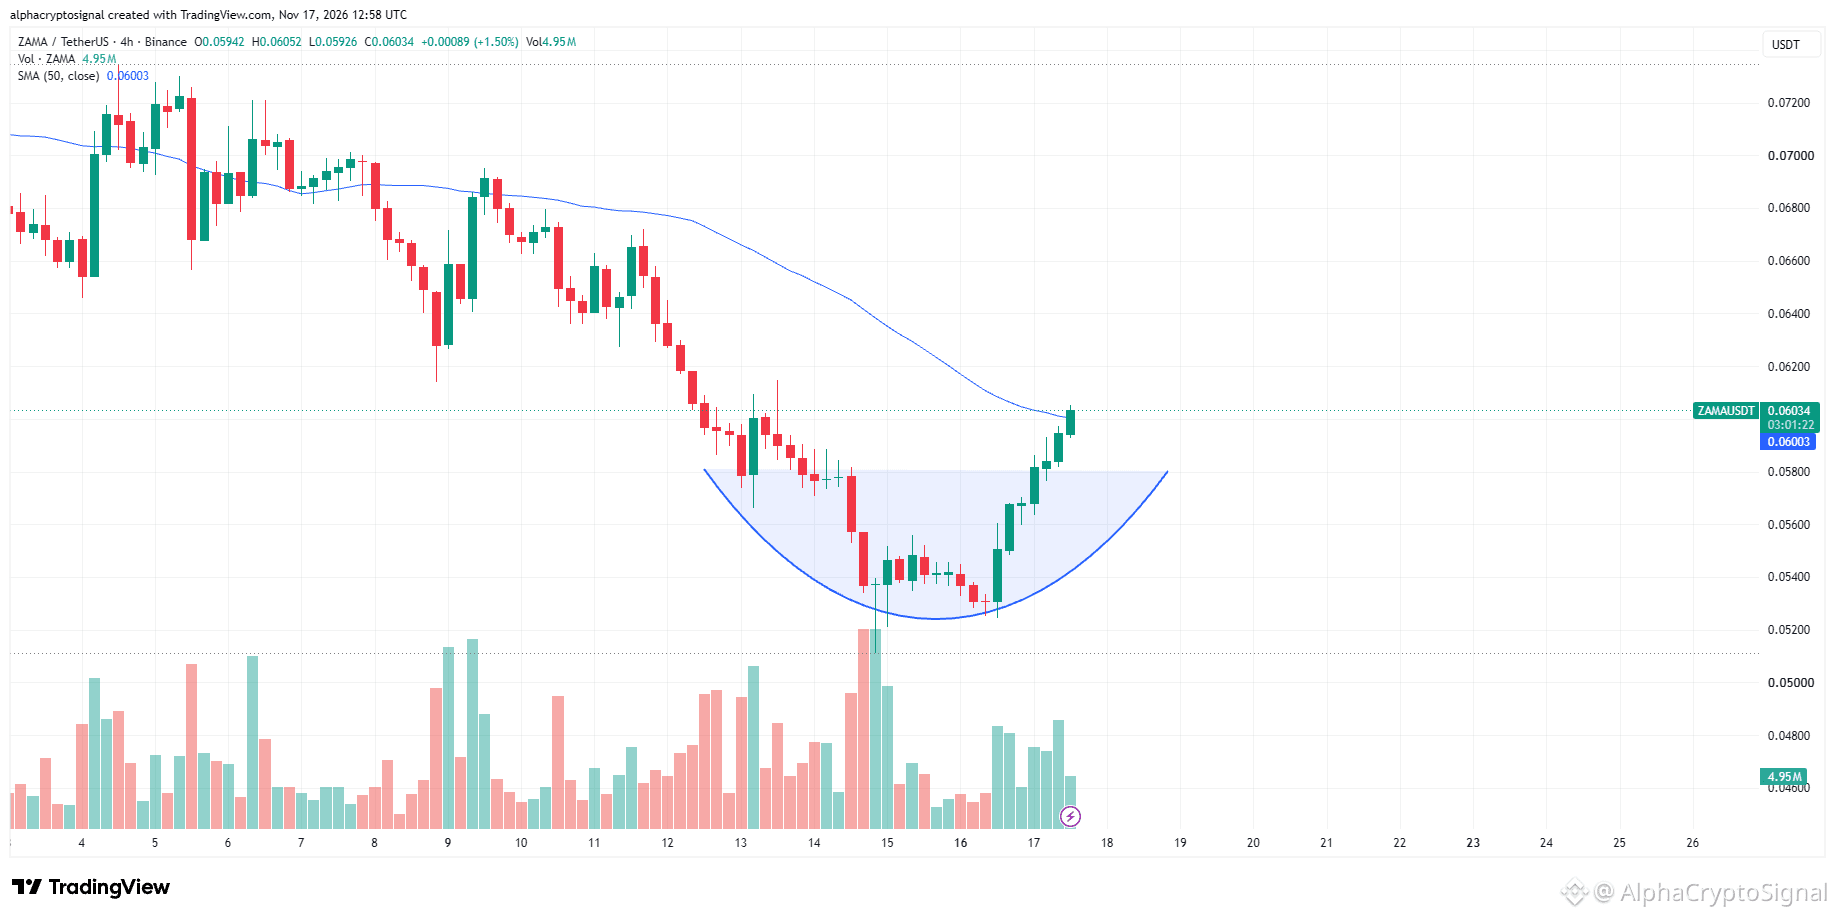
$ZAMA has formed a rounding bottom on the 4H timeframe and is now breaking above its neckline. The breakout looks promising, with bullish momentum picking up and $ZAMA reclaiming the 50 SMA.
Looking for continuation from here. If $ZAMA can hold above the breakout zone, we could see further upside in the coming sessions. Keeping this one on the radar.
{future}(ZAMAUSDT)
Thoughts on #ZAMA
$ZAMA has formed a rounding bottom on the 4H timeframe and is now breaking above its neckline. The breakout looks promising, with bullish momentum picking up and $ZAMA reclaiming the 50 SMA.
Looking for continuation from here. If $ZAMA can hold above the breakout zone, we could see further upside in the coming sessions. Keeping this one on the radar.
$ZAMA has formed a rounding bottom on the 4H timeframe and is now breaking above its neckline. The breakout looks promising, with bullish momentum picking up and $ZAMA reclaiming the 50 SMA.
Looking for continuation from here. If $ZAMA can hold above the breakout zone, we could see further upside in the coming sessions. Keeping this one on the radar.
181
·
--
Bullish
Chart Request: #NEO
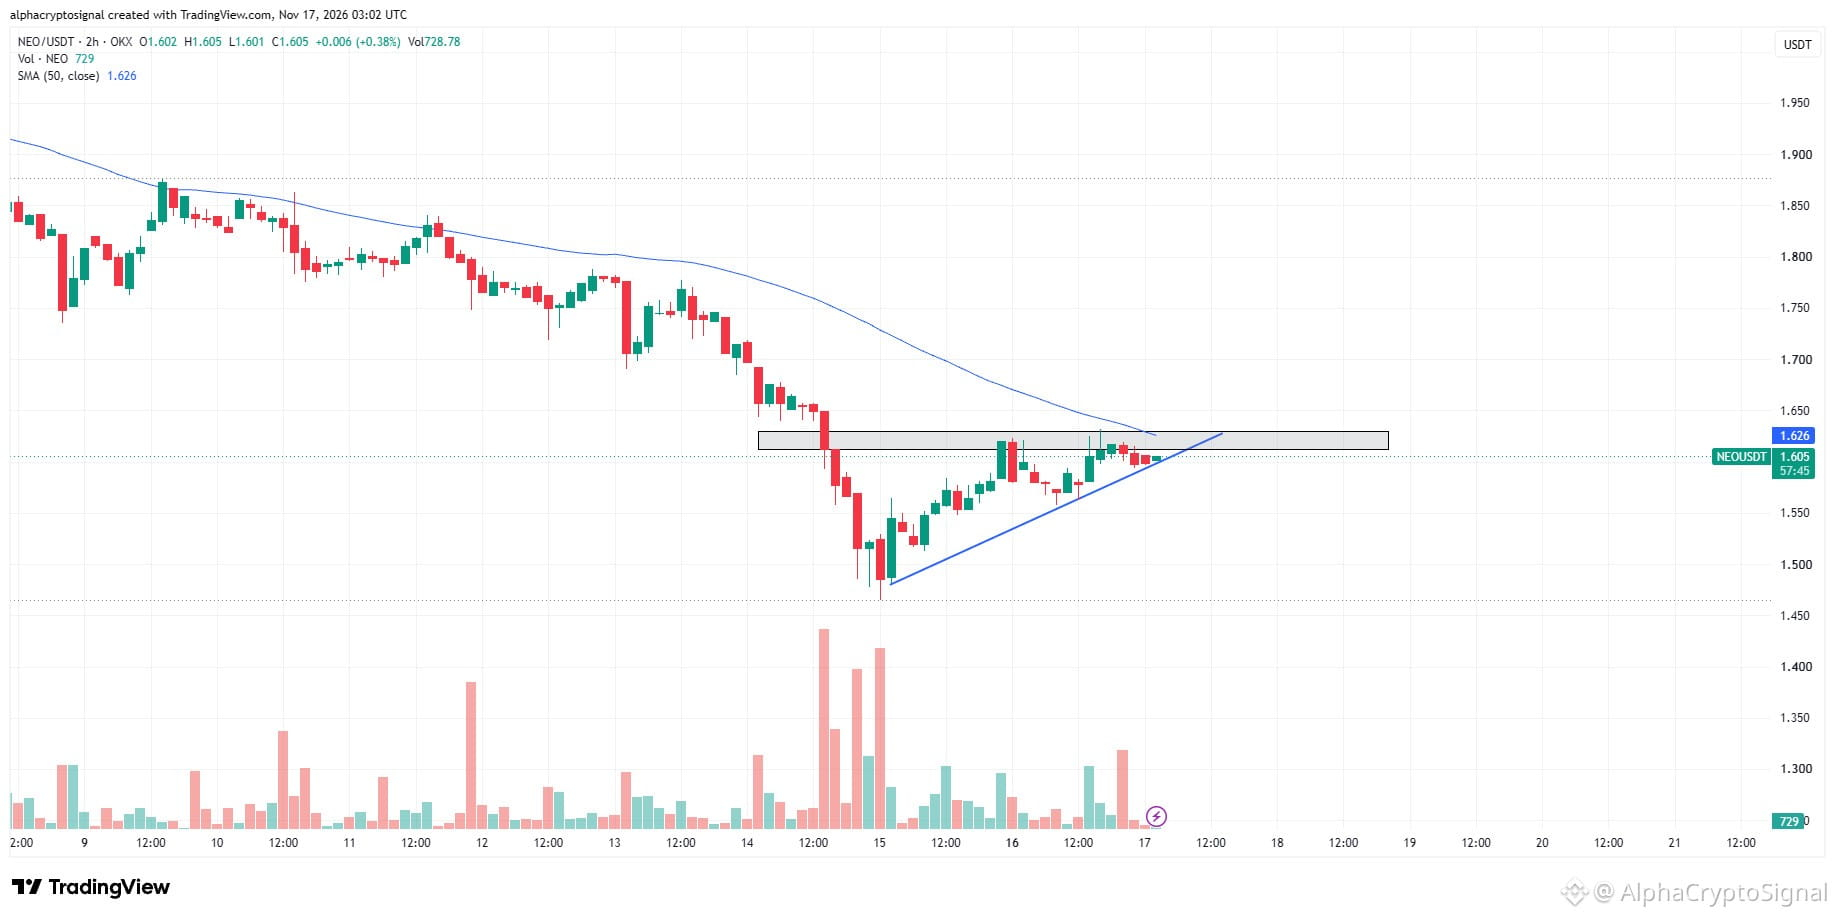
$NEO is forming an ascending triangle on the lower timeframe, with price pressing against horizontal resistance while maintaining higher lows. However, volume remains relatively low, making an immediate breakout less convincing.
We will wait for a confirmed breakout with volume expansion before considering a long entry on $NEO . No need to anticipate the move. Let the price action confirm first.
{future}(NEOUSDT)
Chart Request: #NEO
$NEO is forming an ascending triangle on the lower timeframe, with price pressing against horizontal resistance while maintaining higher lows. However, volume remains relatively low, making an immediate breakout less convincing.
We will wait for a confirmed breakout with volume expansion before considering a long entry on $NEO . No need to anticipate the move. Let the price action confirm first.
$NEO is forming an ascending triangle on the lower timeframe, with price pressing against horizontal resistance while maintaining higher lows. However, volume remains relatively low, making an immediate breakout less convincing.
We will wait for a confirmed breakout with volume expansion before considering a long entry on $NEO . No need to anticipate the move. Let the price action confirm first.
215
·
--
Bullish
#HYPE LTF Analysis:
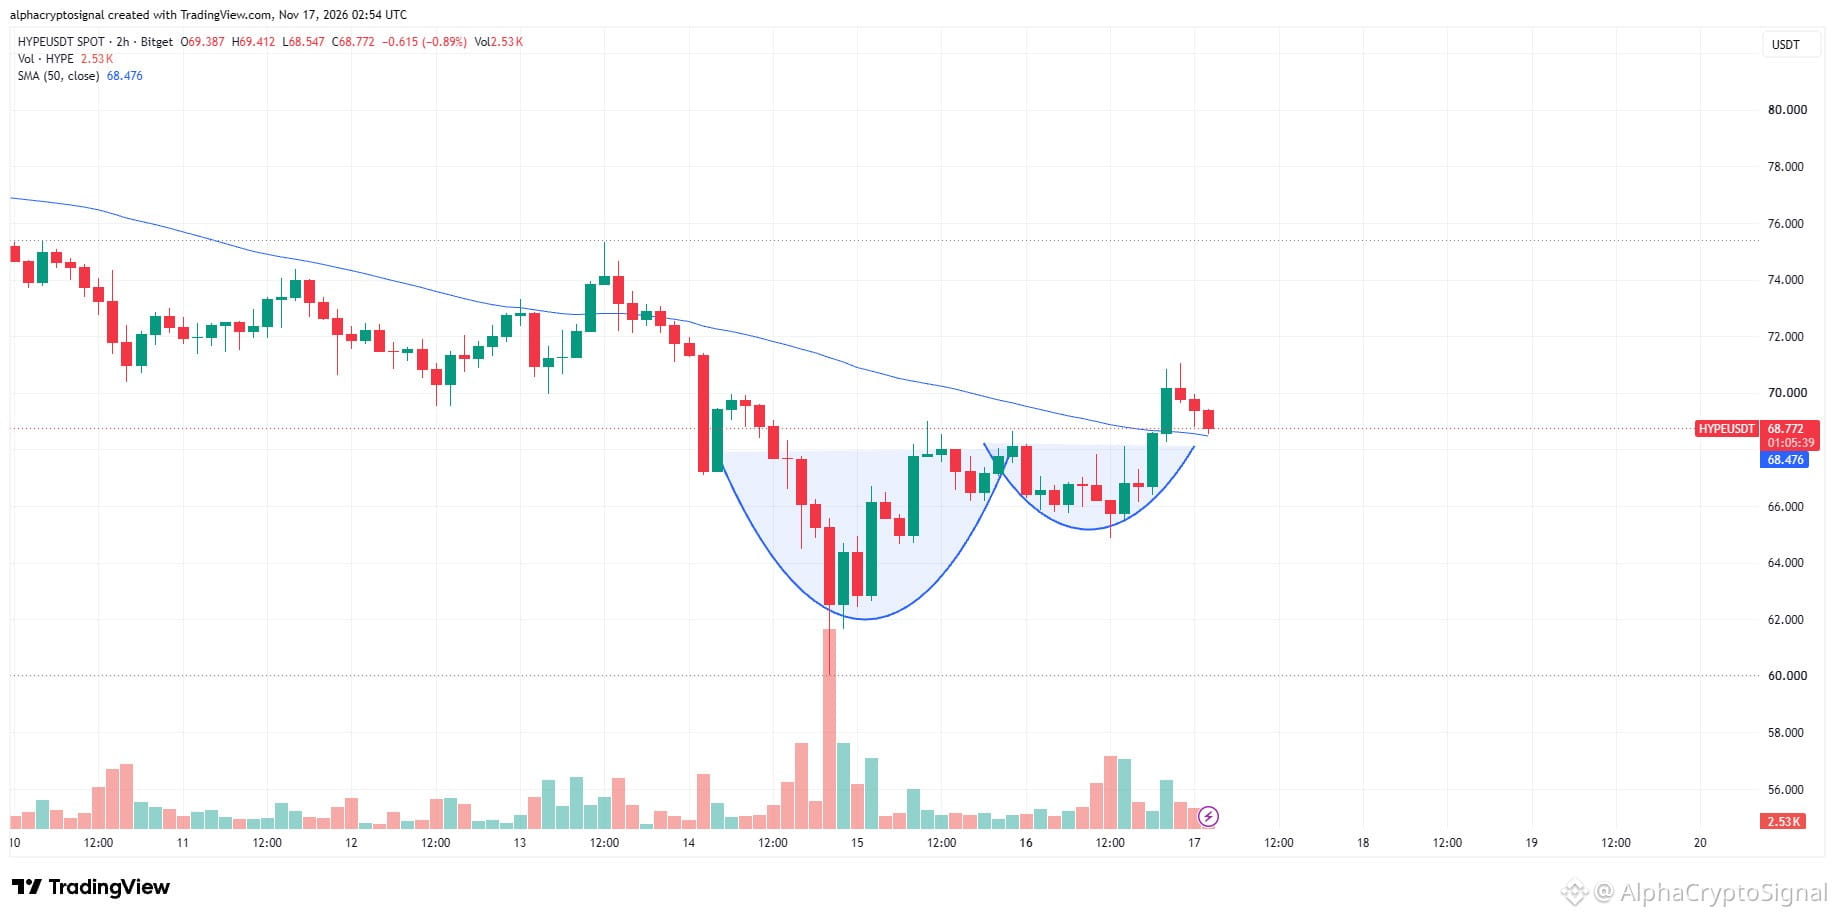
$HYPE has triggered a cup and handle breakout on the lower timeframe, reclaiming the neckline around $68. The breakout looks promising, with $HYPE now pulling back toward the breakout zone.
Looking for a successful retest and continuation from here. If the neckline holds as support, we could see another leg toward $72–74. Keeping $HYPE on the radar.
{future}(HYPEUSDT)
#HYPE LTF Analysis:
$HYPE has triggered a cup and handle breakout on the lower timeframe, reclaiming the neckline around $68. The breakout looks promising, with $HYPE now pulling back toward the breakout zone.
Looking for a successful retest and continuation from here. If the neckline holds as support, we could see another leg toward $72–74. Keeping $HYPE on the radar.
$HYPE has triggered a cup and handle breakout on the lower timeframe, reclaiming the neckline around $68. The breakout looks promising, with $HYPE now pulling back toward the breakout zone.
Looking for a successful retest and continuation from here. If the neckline holds as support, we could see another leg toward $72–74. Keeping $HYPE on the radar.
262
·
--
Bullish
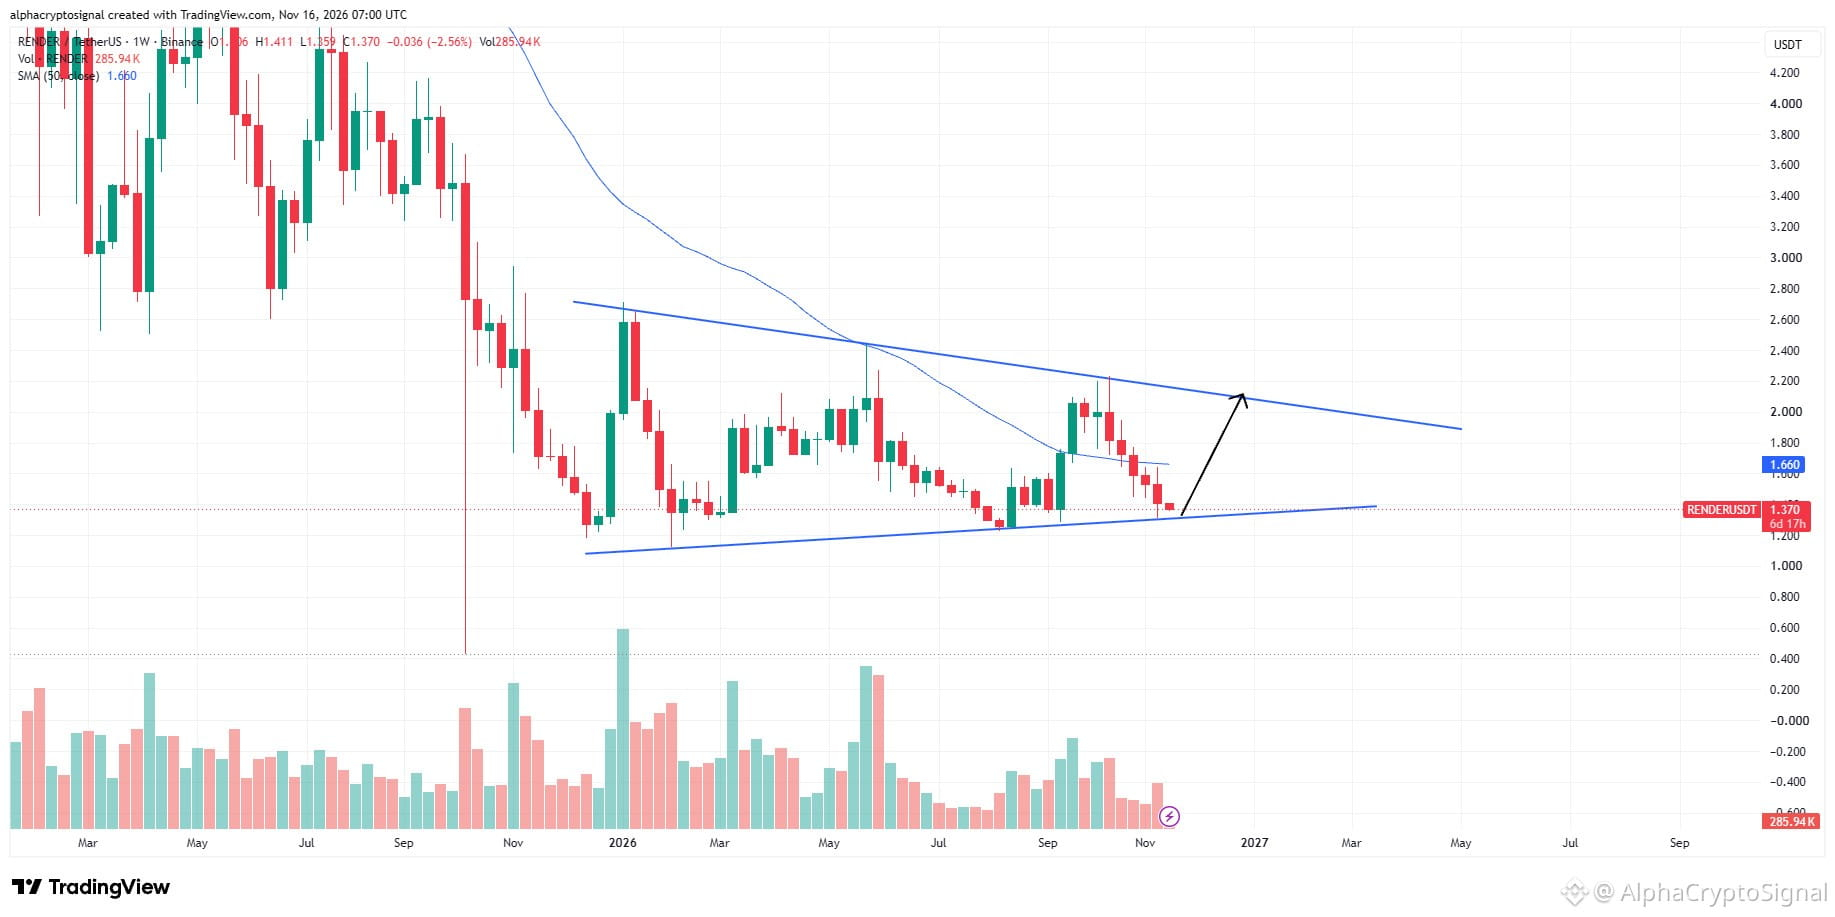
Thoughts on #RENDER
$RENDER is back at the lower trendline support of its weekly symmetrical triangle. $RENDER is approaching a key decision zone, and this could be an interesting spot for a potential reversal.
Looking for a bounce toward the upper trendline around $2.00–$2.10. As always, we need to see buyers step in and defend this support before getting too optimistic.
{future}(RENDERUSDT)
Thoughts on #RENDER
$RENDER is back at the lower trendline support of its weekly symmetrical triangle. $RENDER is approaching a key decision zone, and this could be an interesting spot for a potential reversal.
Looking for a bounce toward the upper trendline around $2.00–$2.10. As always, we need to see buyers step in and defend this support before getting too optimistic.
$RENDER is back at the lower trendline support of its weekly symmetrical triangle. $RENDER is approaching a key decision zone, and this could be an interesting spot for a potential reversal.
Looking for a bounce toward the upper trendline around $2.00–$2.10. As always, we need to see buyers step in and defend this support before getting too optimistic.
65
·
--
Bullish
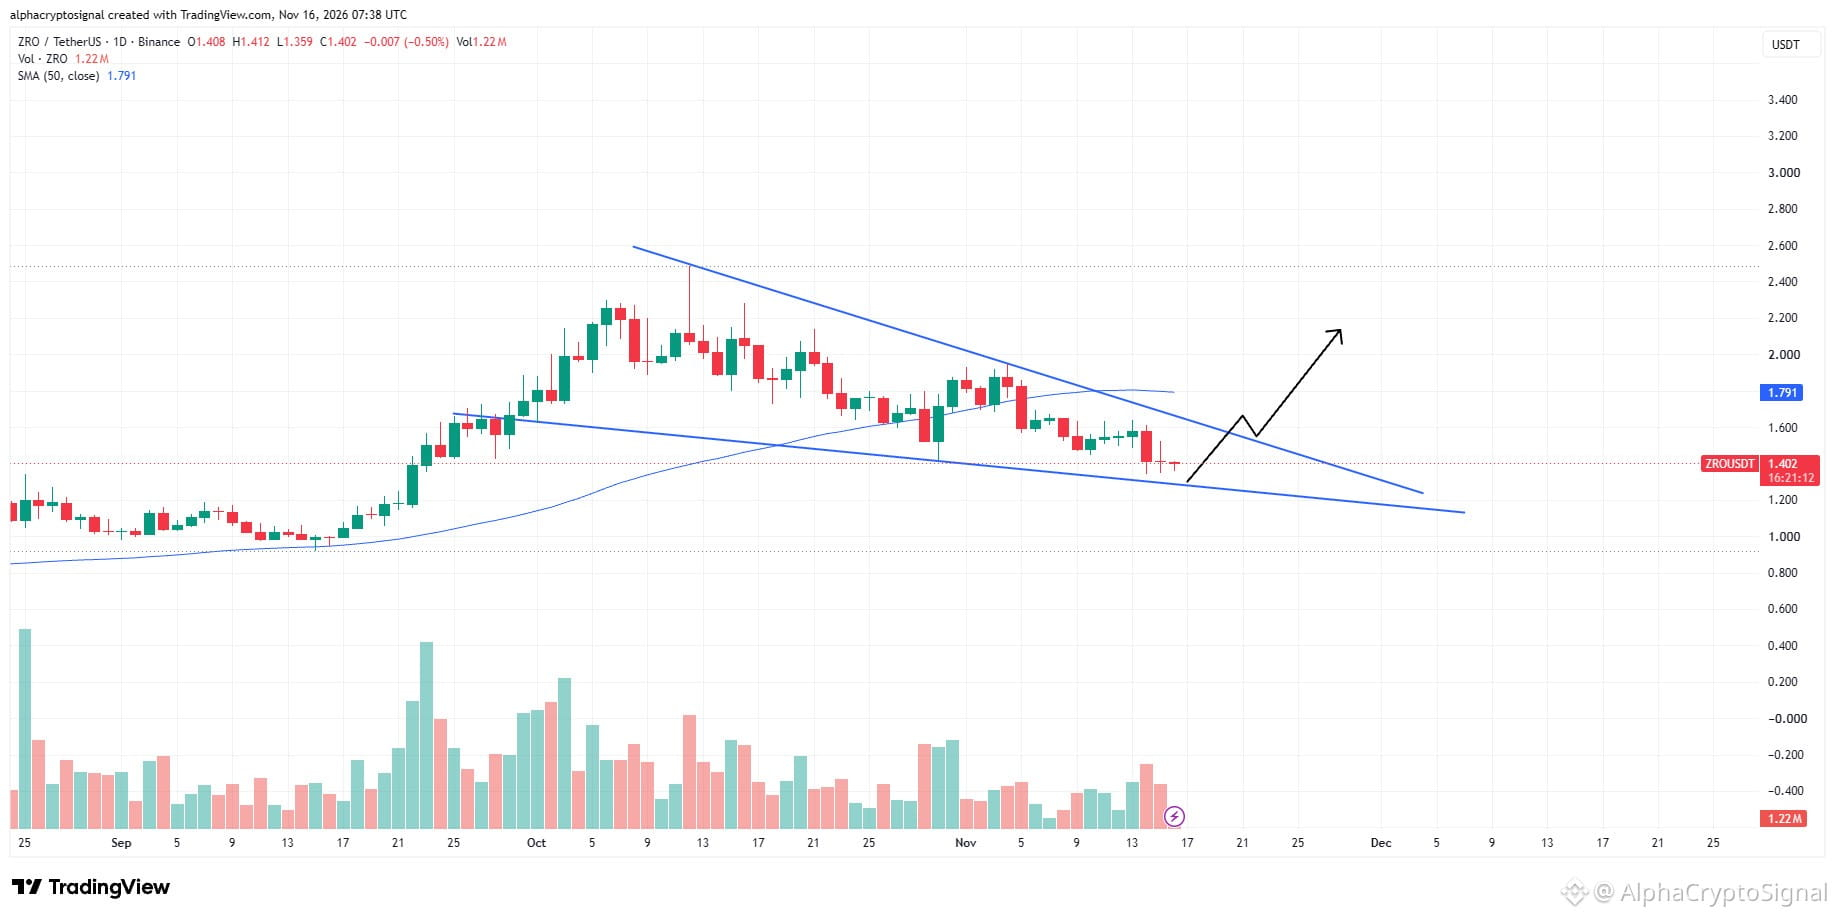
#ZRO HTF Analysis:
$ZRO is forming a falling wedge on the daily timeframe, with price gradually approaching the apex. A breakout above the upper trendline could signal a bullish reversal and open the door for a recovery toward the $1.80–$2.00 region.
Our plan is simple: wait for a confirmed breakout and retest before looking for a long entry. Keeping $ZRO on the radar.
{future}(ZROUSDT)
#ZRO HTF Analysis:
$ZRO is forming a falling wedge on the daily timeframe, with price gradually approaching the apex. A breakout above the upper trendline could signal a bullish reversal and open the door for a recovery toward the $1.80–$2.00 region.
Our plan is simple: wait for a confirmed breakout and retest before looking for a long entry. Keeping $ZRO on the radar.
$ZRO is forming a falling wedge on the daily timeframe, with price gradually approaching the apex. A breakout above the upper trendline could signal a bullish reversal and open the door for a recovery toward the $1.80–$2.00 region.
Our plan is simple: wait for a confirmed breakout and retest before looking for a long entry. Keeping $ZRO on the radar.
77
·
--
Bullish
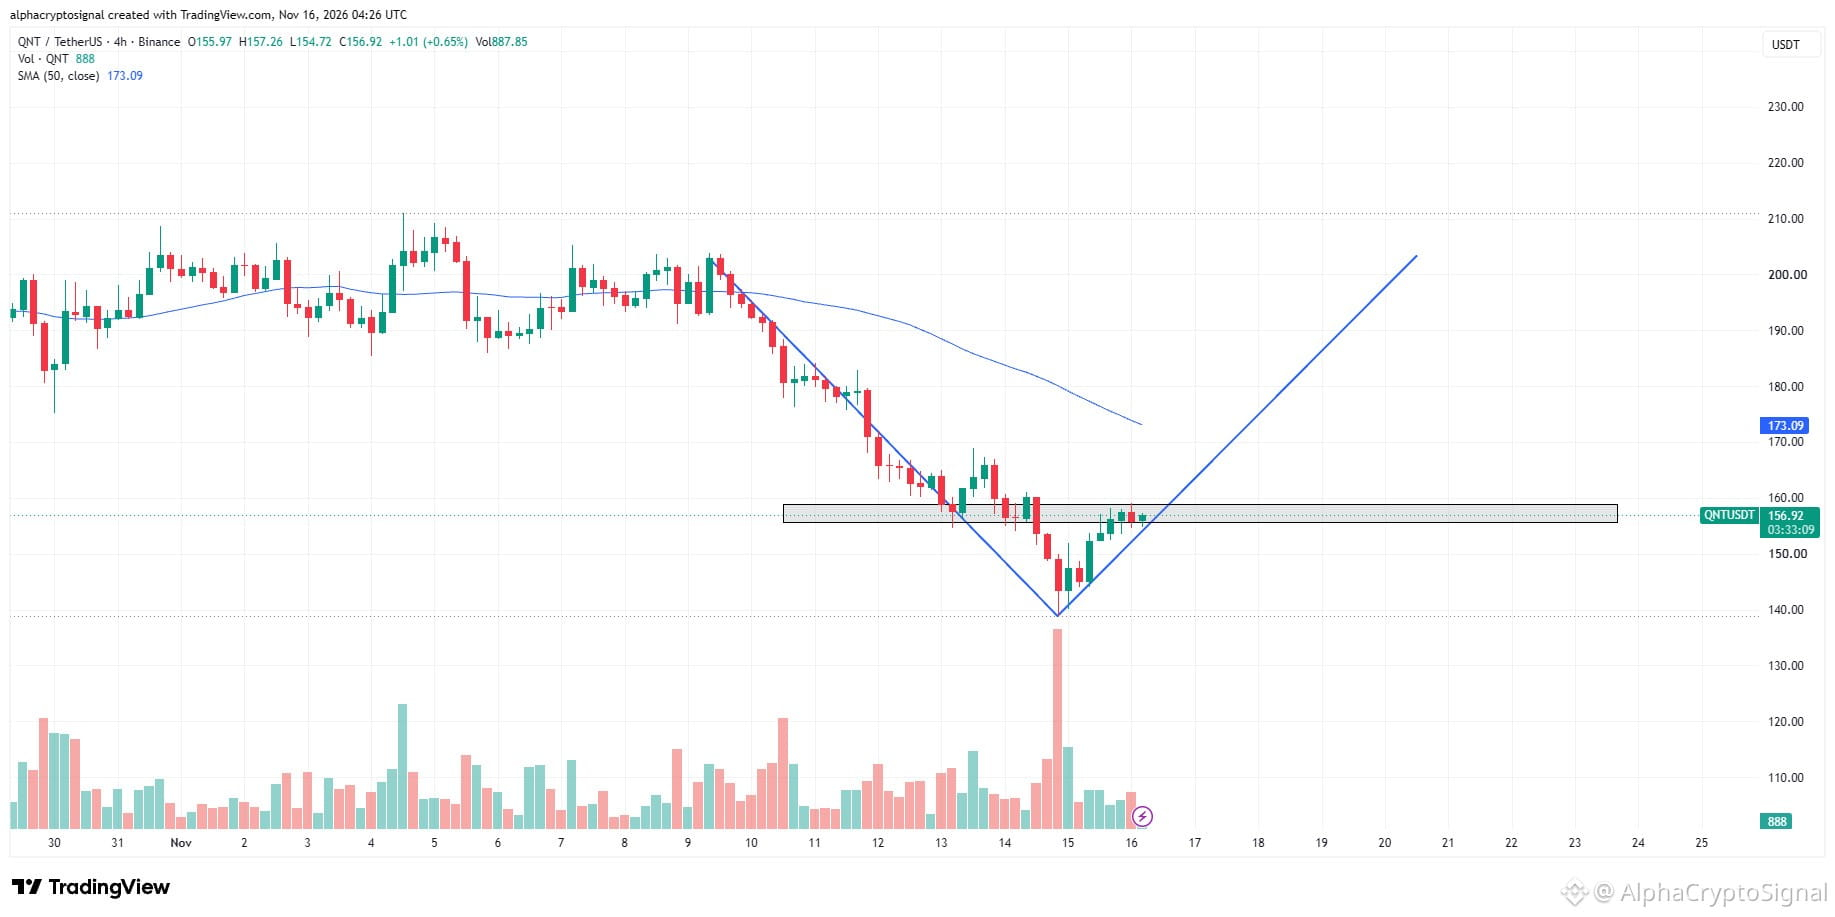
Thoughts on #QNT :
$QNT is shaping up for a potential V-shaped recovery after bouncing strongly from the $140 region. $QNT is now testing the $156–159 horizontal resistance zone.
A clean breakout and hold above this zone could open the door for further upside toward the $170–173 region. Momentum looks promising, but let's wait for confirmation before getting ahead of ourselves.
{future}(QNTUSDT)
Thoughts on #QNT :
$QNT is shaping up for a potential V-shaped recovery after bouncing strongly from the $140 region. $QNT is now testing the $156–159 horizontal resistance zone.
A clean breakout and hold above this zone could open the door for further upside toward the $170–173 region. Momentum looks promising, but let's wait for confirmation before getting ahead of ourselves.
$QNT is shaping up for a potential V-shaped recovery after bouncing strongly from the $140 region. $QNT is now testing the $156–159 horizontal resistance zone.
A clean breakout and hold above this zone could open the door for further upside toward the $170–173 region. Momentum looks promising, but let's wait for confirmation before getting ahead of ourselves.
81
·
--
Bullish
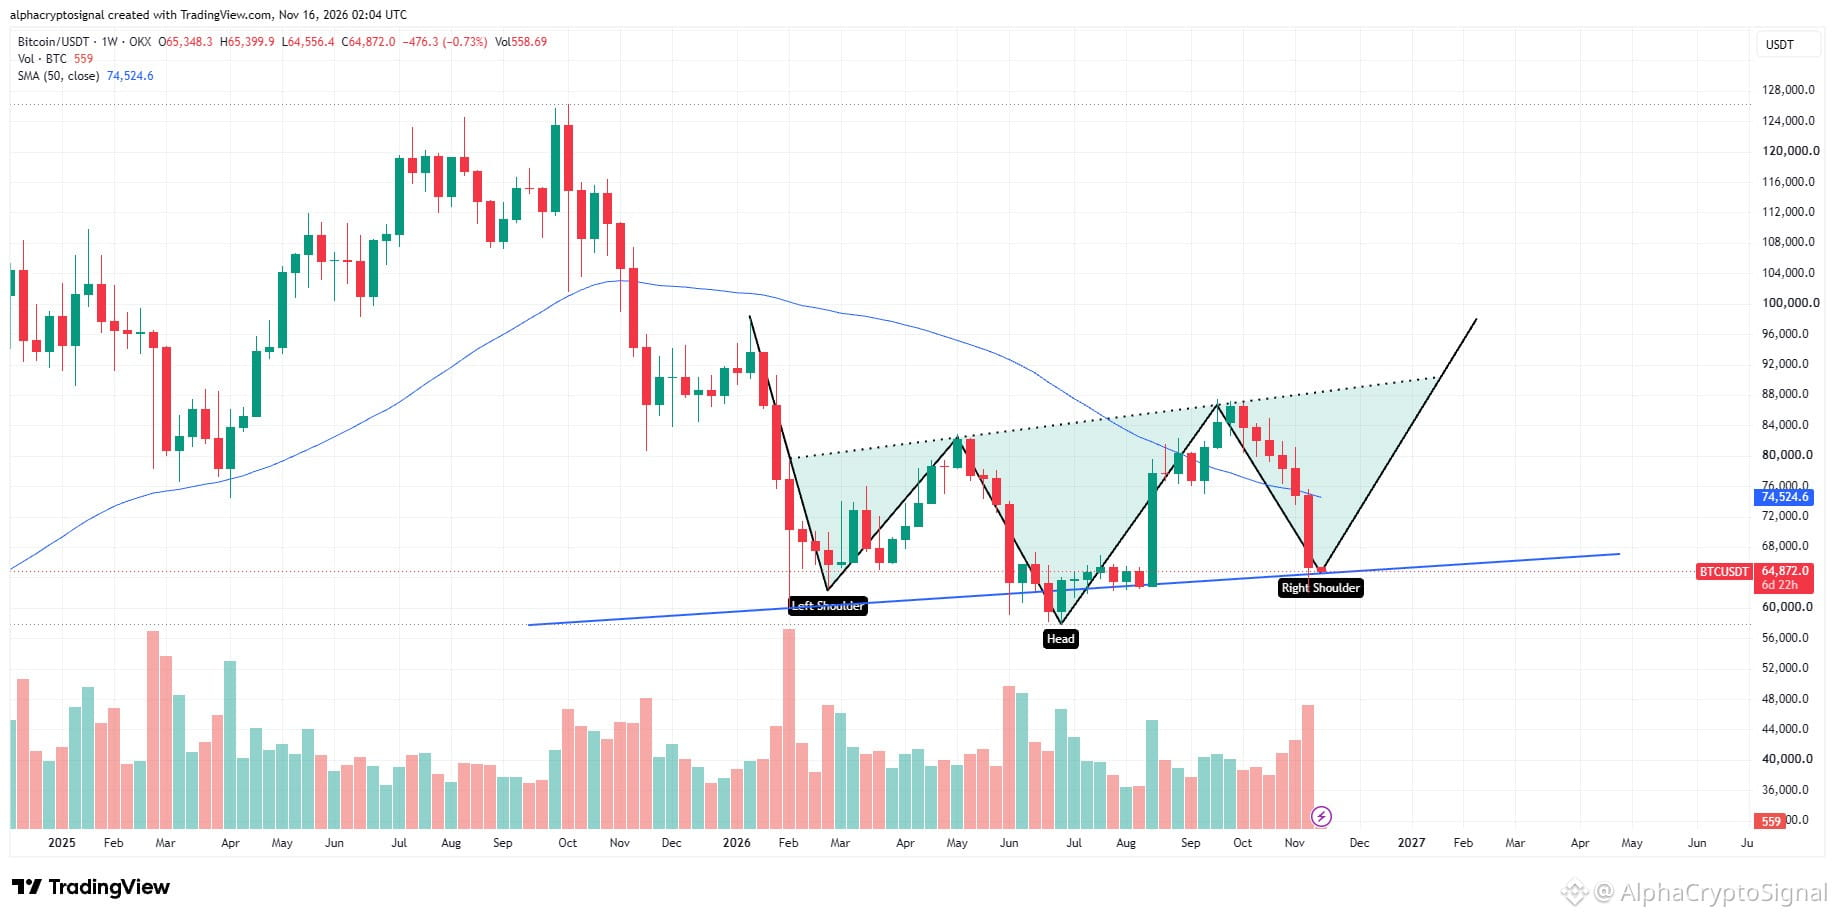
#BTC Update:
$BTC has closed its weekly candle above our marked support zone, keeping the inverse head and shoulders setup intact. Our bottom theory is still valid, with the $64K region holding as expected.
Now we need to see a meaningful reaction from this zone to confirm the reversal. If support holds and momentum returns, this could mark the local bottom of the current correction for $BTC . Let's wait for confirmation before getting aggressive.
{future}(BTCUSDT)
#BTC Update:
$BTC has closed its weekly candle above our marked support zone, keeping the inverse head and shoulders setup intact. Our bottom theory is still valid, with the $64K region holding as expected.
Now we need to see a meaningful reaction from this zone to confirm the reversal. If support holds and momentum returns, this could mark the local bottom of the current correction for $BTC . Let's wait for confirmation before getting aggressive.
$BTC has closed its weekly candle above our marked support zone, keeping the inverse head and shoulders setup intact. Our bottom theory is still valid, with the $64K region holding as expected.
Now we need to see a meaningful reaction from this zone to confirm the reversal. If support holds and momentum returns, this could mark the local bottom of the current correction for $BTC . Let's wait for confirmation before getting aggressive.
1
104
·
--
Bullish
Thoughts on #APT
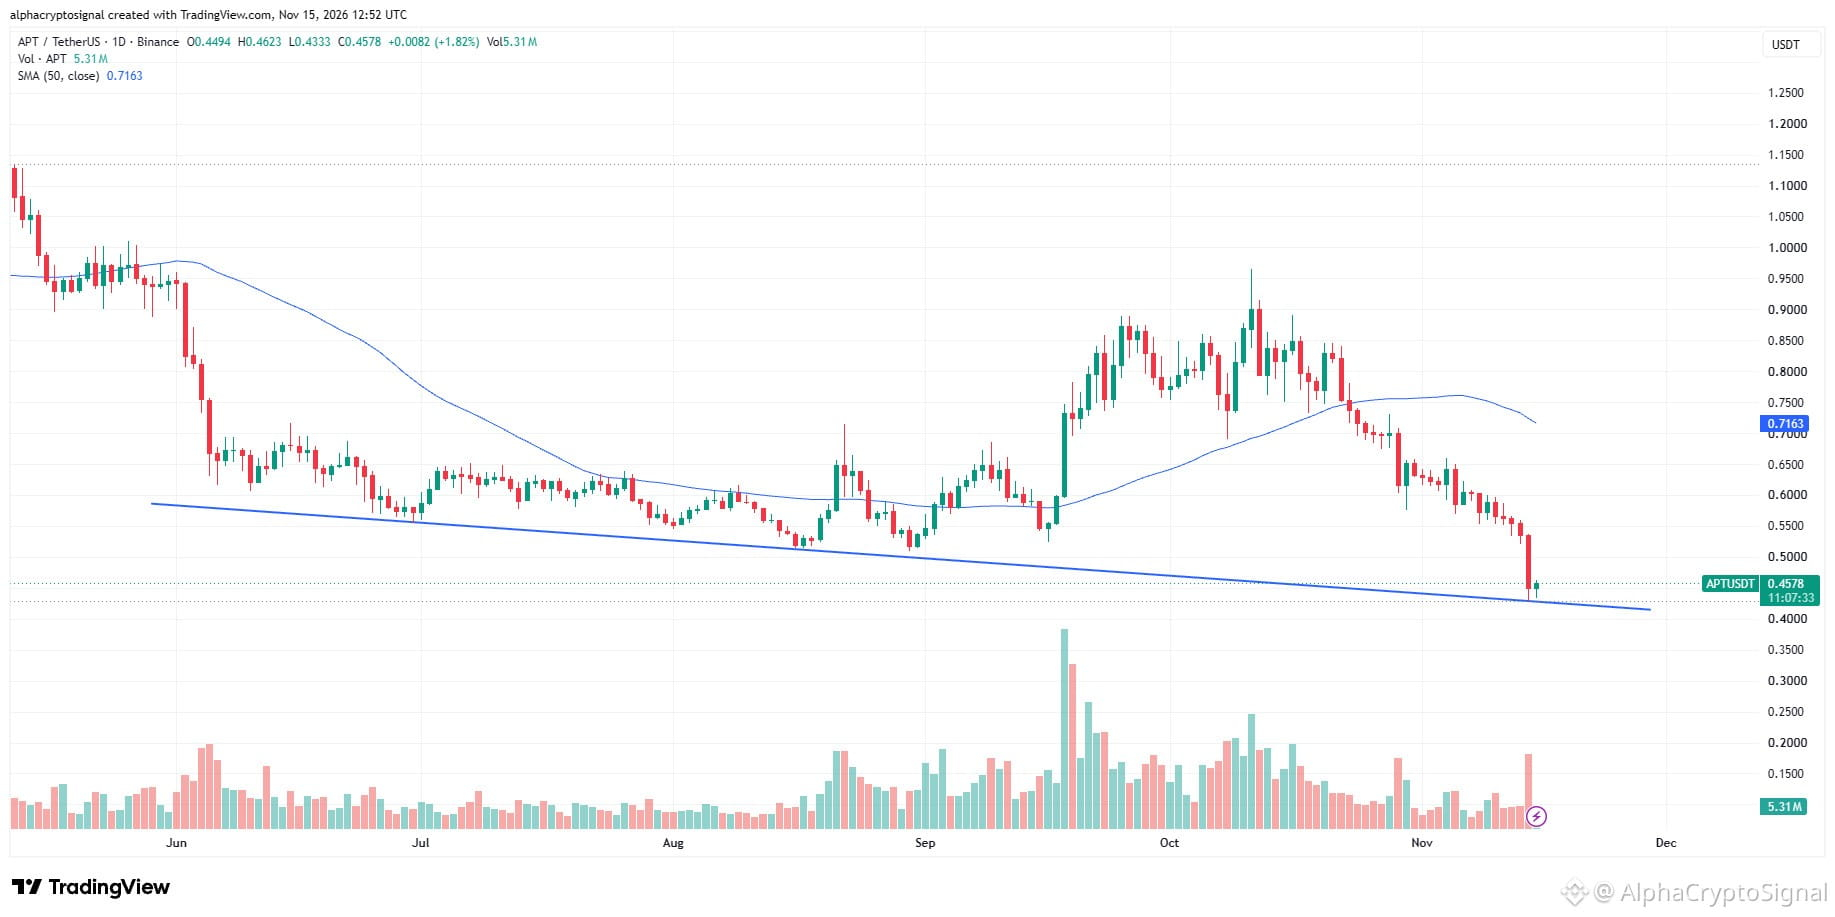
$APT is approaching its all-time low, making this an interesting spot for long-term spot accumulation. $APT is testing a major descending support trendline, and a reaction from here could offer a solid reversal opportunity.
I'm interested in accumulating at these levels, but wouldn't mind another dip to average down further. This is a zone worth keeping on the radar.
{future}(APTUSDT)
Thoughts on #APT
$APT is approaching its all-time low, making this an interesting spot for long-term spot accumulation. $APT is testing a major descending support trendline, and a reaction from here could offer a solid reversal opportunity.
I'm interested in accumulating at these levels, but wouldn't mind another dip to average down further. This is a zone worth keeping on the radar.
$APT is approaching its all-time low, making this an interesting spot for long-term spot accumulation. $APT is testing a major descending support trendline, and a reaction from here could offer a solid reversal opportunity.
I'm interested in accumulating at these levels, but wouldn't mind another dip to average down further. This is a zone worth keeping on the radar.
712
·
--
Bullish
Chart Request: #BCH
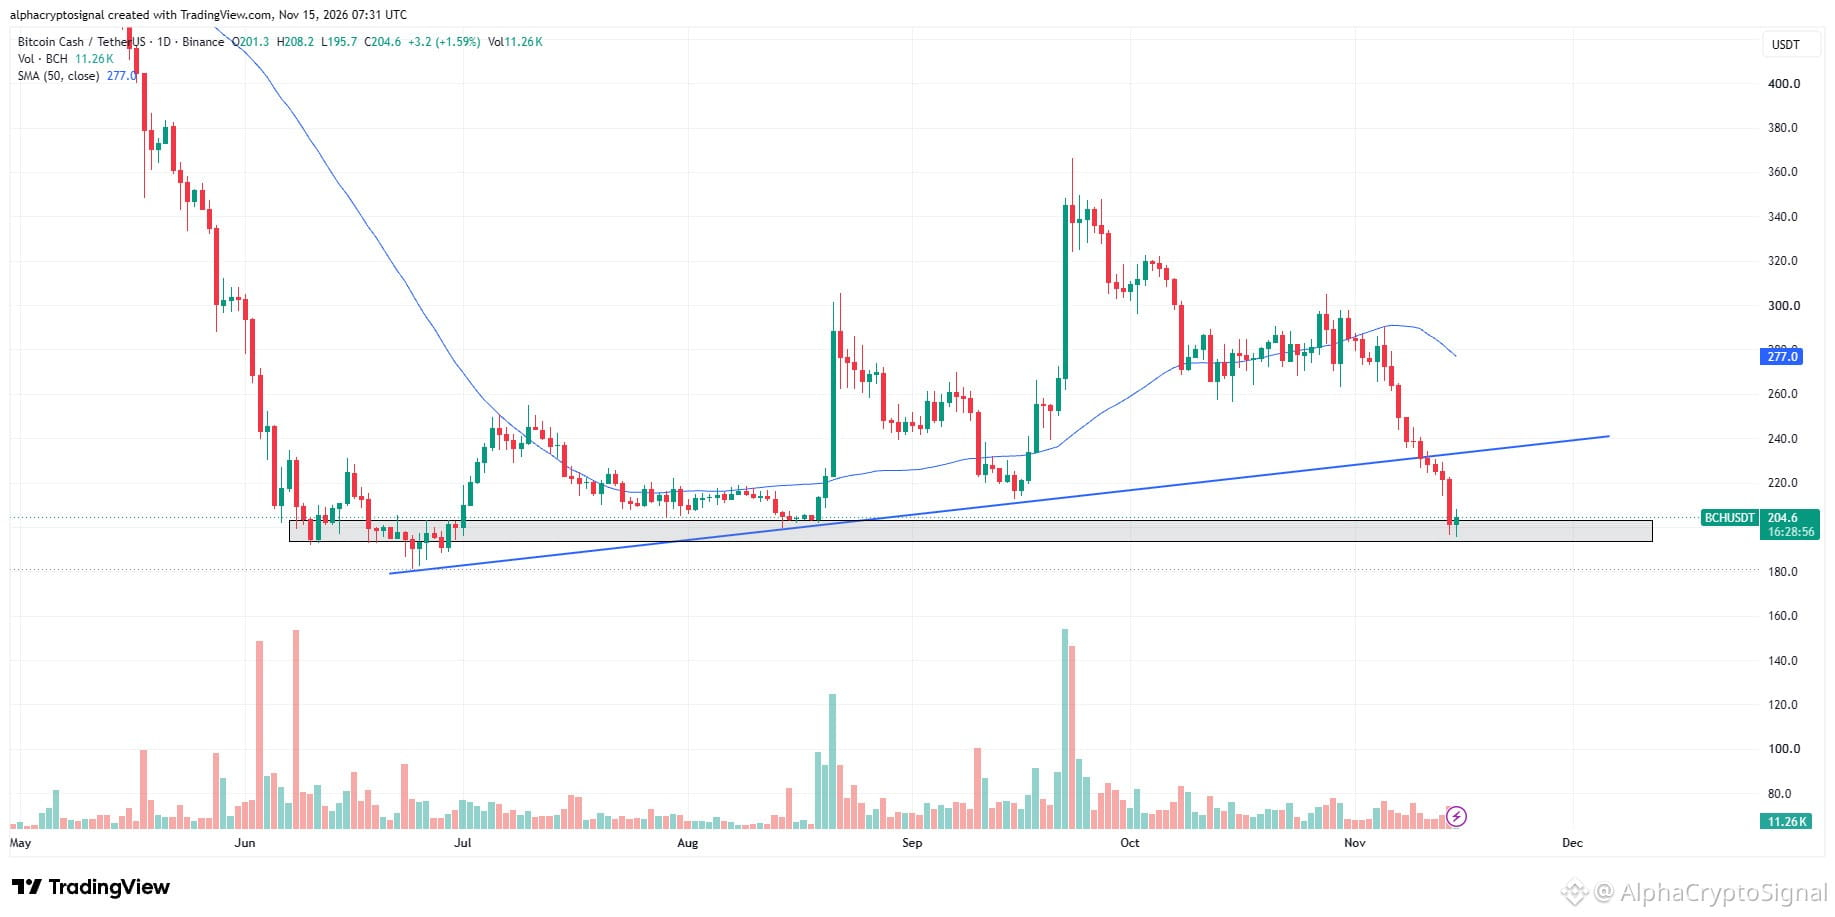
$BCH has broken down its ascending trendline support and is now testing the lower horizontal support zone. The reaction here will be important, but the chart isn't showing anything particularly promising yet.
I'd rather wait for $BTC to stabilize before looking for opportunities in $BCH . No need to rush into anything until the broader market finds its footing.
{future}(BCHUSDT)
Chart Request: #BCH
$BCH has broken down its ascending trendline support and is now testing the lower horizontal support zone. The reaction here will be important, but the chart isn't showing anything particularly promising yet.
I'd rather wait for $BTC to stabilize before looking for opportunities in $BCH . No need to rush into anything until the broader market finds its footing.
$BCH has broken down its ascending trendline support and is now testing the lower horizontal support zone. The reaction here will be important, but the chart isn't showing anything particularly promising yet.
I'd rather wait for $BTC to stabilize before looking for opportunities in $BCH . No need to rush into anything until the broader market finds its footing.
51
·
--
Bullish
#SUI HTF Analysis:
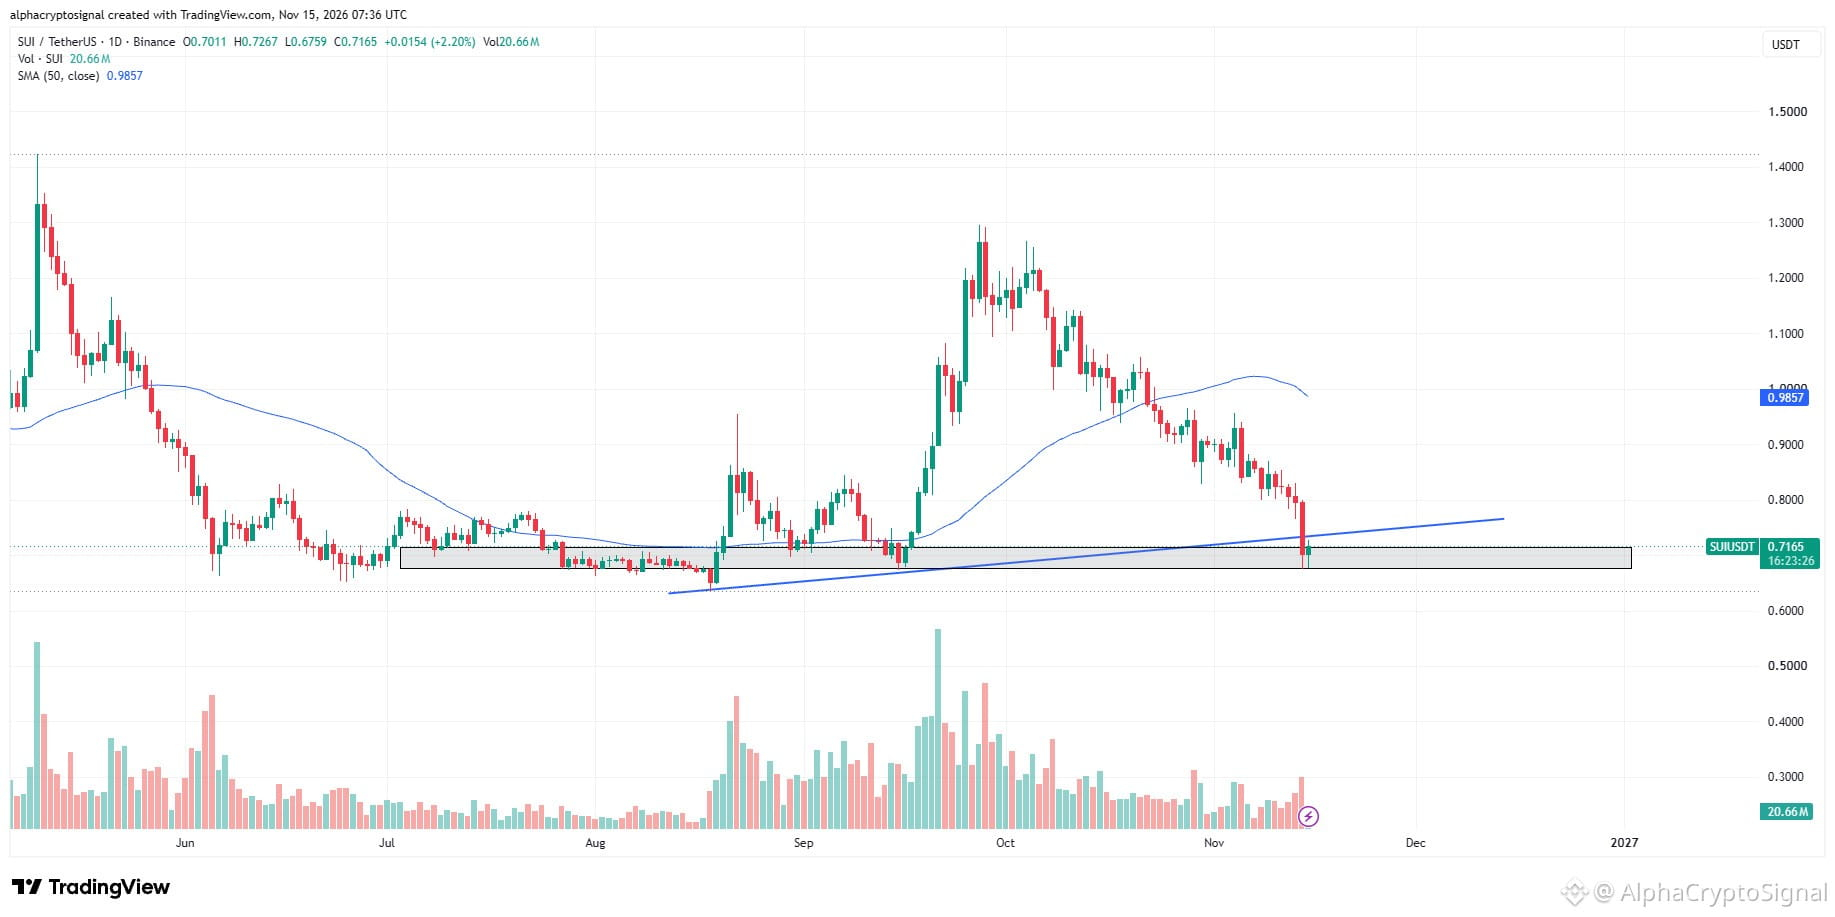
$SUI is back near its cycle lows, revisiting a major horizontal support zone that previously attracted buyers. This area could present an interesting spot accumulation opportunity after the recent correction.
However, with $BTC still testing its potential bottom, there's no need to rush. I'd like to see some stabilization and a positive reaction from this zone before getting more confident. Patience first.
{future}(SUIUSDT)
#SUI HTF Analysis:
$SUI is back near its cycle lows, revisiting a major horizontal support zone that previously attracted buyers. This area could present an interesting spot accumulation opportunity after the recent correction.
However, with $BTC still testing its potential bottom, there's no need to rush. I'd like to see some stabilization and a positive reaction from this zone before getting more confident. Patience first.
$SUI is back near its cycle lows, revisiting a major horizontal support zone that previously attracted buyers. This area could present an interesting spot accumulation opportunity after the recent correction.
However, with $BTC still testing its potential bottom, there's no need to rush. I'd like to see some stabilization and a positive reaction from this zone before getting more confident. Patience first.
192
·
--
Bullish
#BTC Update:
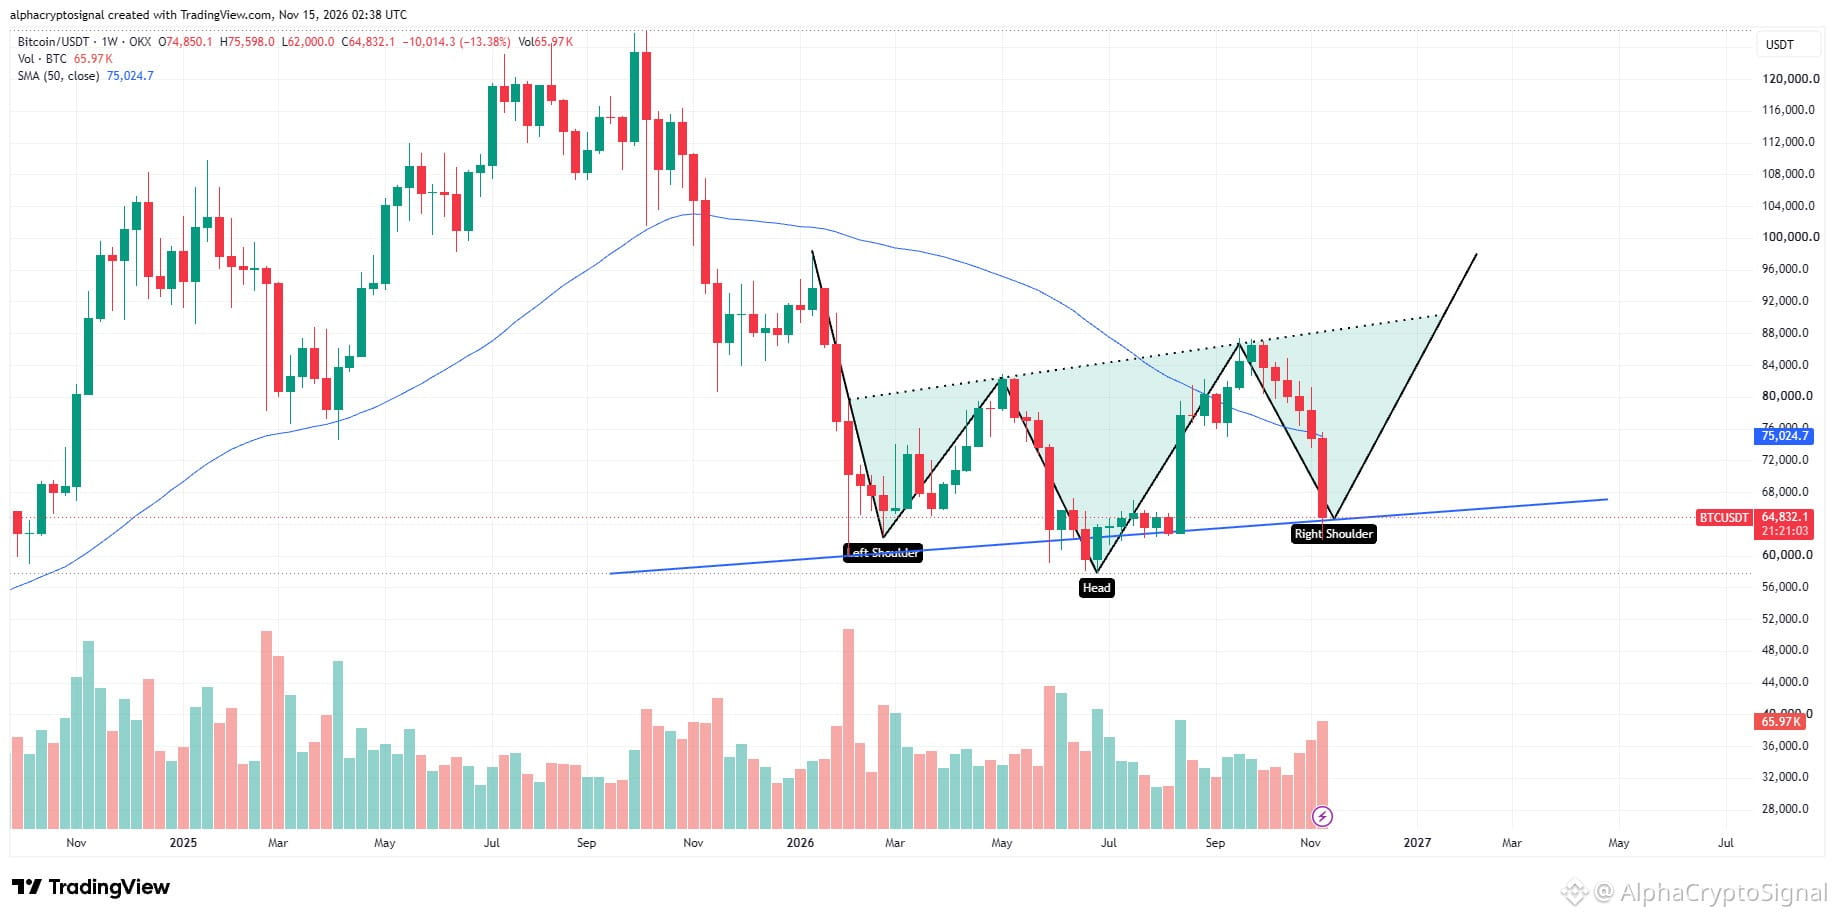
$BTC has finally tested the 64K region, even wicking below 62K before reclaiming the level. This is the zone we've been watching, and the reaction so far gives us a reason to stay cautiously optimistic about a potential local bottom.
For now, let's see how $BTC reacts around this level before taking any new positions. If 64K holds, we could finally see some relief. But if it fails, things could get ugly. No need to rush into anything just yet.
{future}(BTCUSDT)
#BTC Update:
$BTC has finally tested the 64K region, even wicking below 62K before reclaiming the level. This is the zone we've been watching, and the reaction so far gives us a reason to stay cautiously optimistic about a potential local bottom.
For now, let's see how $BTC reacts around this level before taking any new positions. If 64K holds, we could finally see some relief. But if it fails, things could get ugly. No need to rush into anything just yet.
$BTC has finally tested the 64K region, even wicking below 62K before reclaiming the level. This is the zone we've been watching, and the reaction so far gives us a reason to stay cautiously optimistic about a potential local bottom.
For now, let's see how $BTC reacts around this level before taking any new positions. If 64K holds, we could finally see some relief. But if it fails, things could get ugly. No need to rush into anything just yet.
117
·
--
Bullish
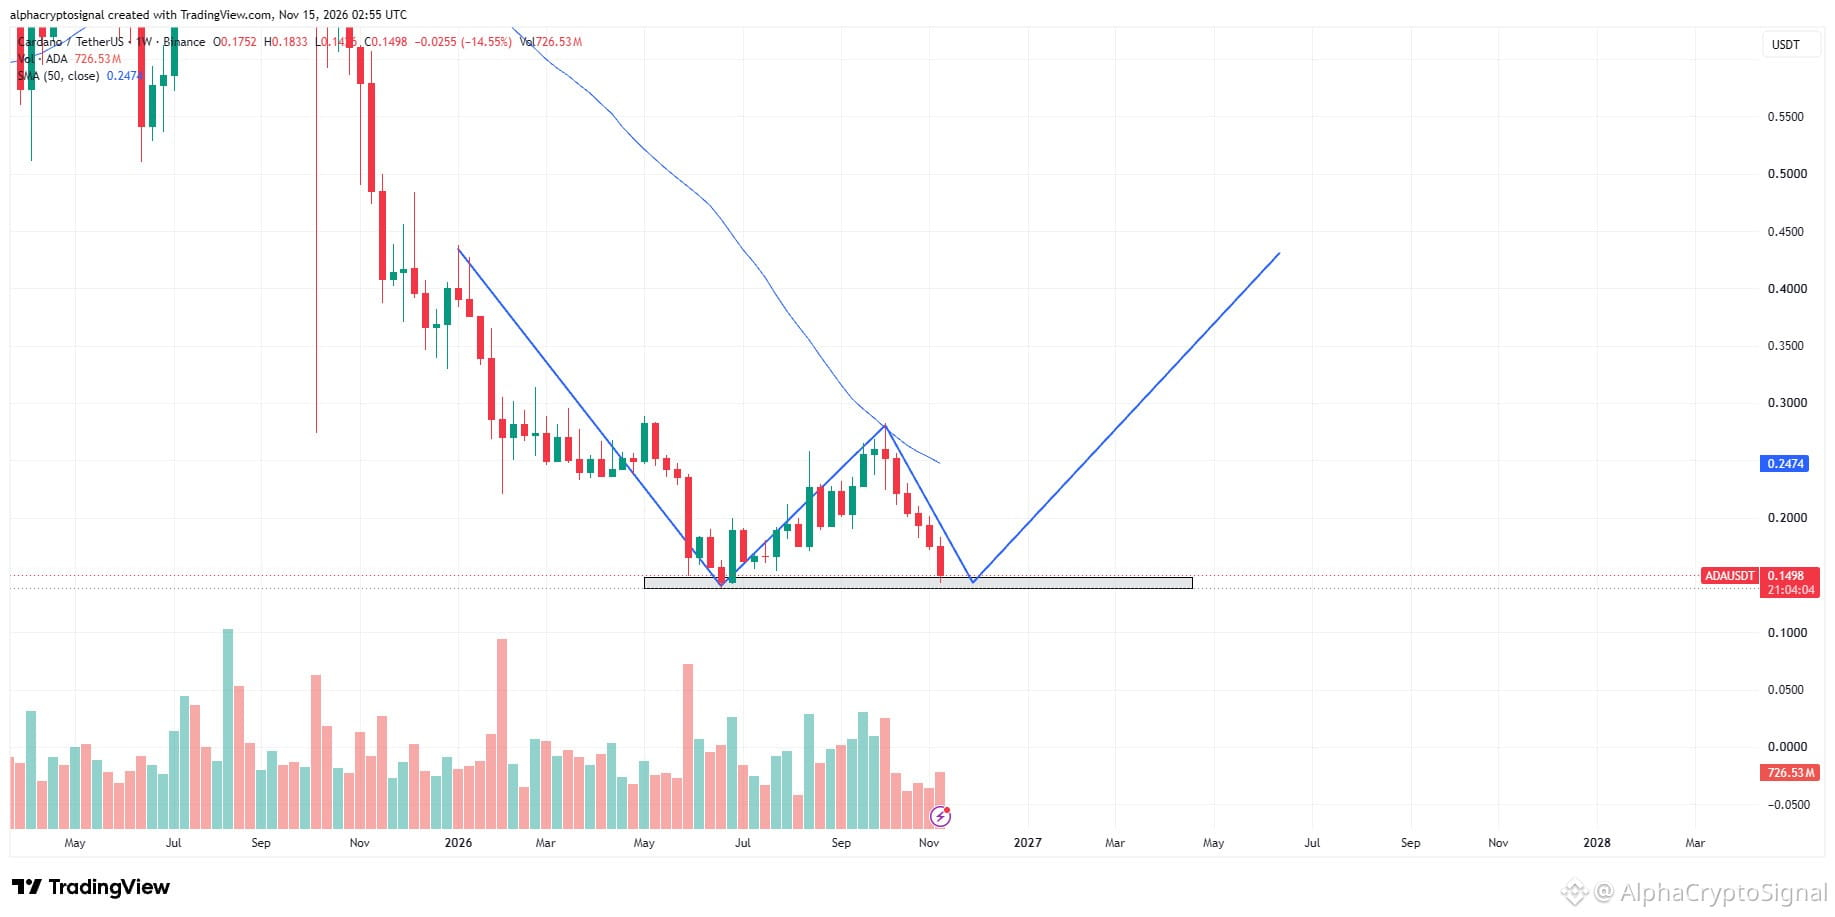
#ADA HTF Analysis:
$ADA is back at its lower horizontal support zone, where we could potentially see a W-shaped reversal develop. If $BTC manages to hold the 64K level, this setup could get interesting and open the door for a recovery.
However, everything still depends on how $BTC reacts around its bottom zone. No need to rush into positions just yet. Let the market confirm before making any moves.
{future}(ADAUSDT)
#ADA HTF Analysis:
$ADA is back at its lower horizontal support zone, where we could potentially see a W-shaped reversal develop. If $BTC manages to hold the 64K level, this setup could get interesting and open the door for a recovery.
However, everything still depends on how $BTC reacts around its bottom zone. No need to rush into positions just yet. Let the market confirm before making any moves.
$ADA is back at its lower horizontal support zone, where we could potentially see a W-shaped reversal develop. If $BTC manages to hold the 64K level, this setup could get interesting and open the door for a recovery.
However, everything still depends on how $BTC reacts around its bottom zone. No need to rush into positions just yet. Let the market confirm before making any moves.
208
·
--
Bullish
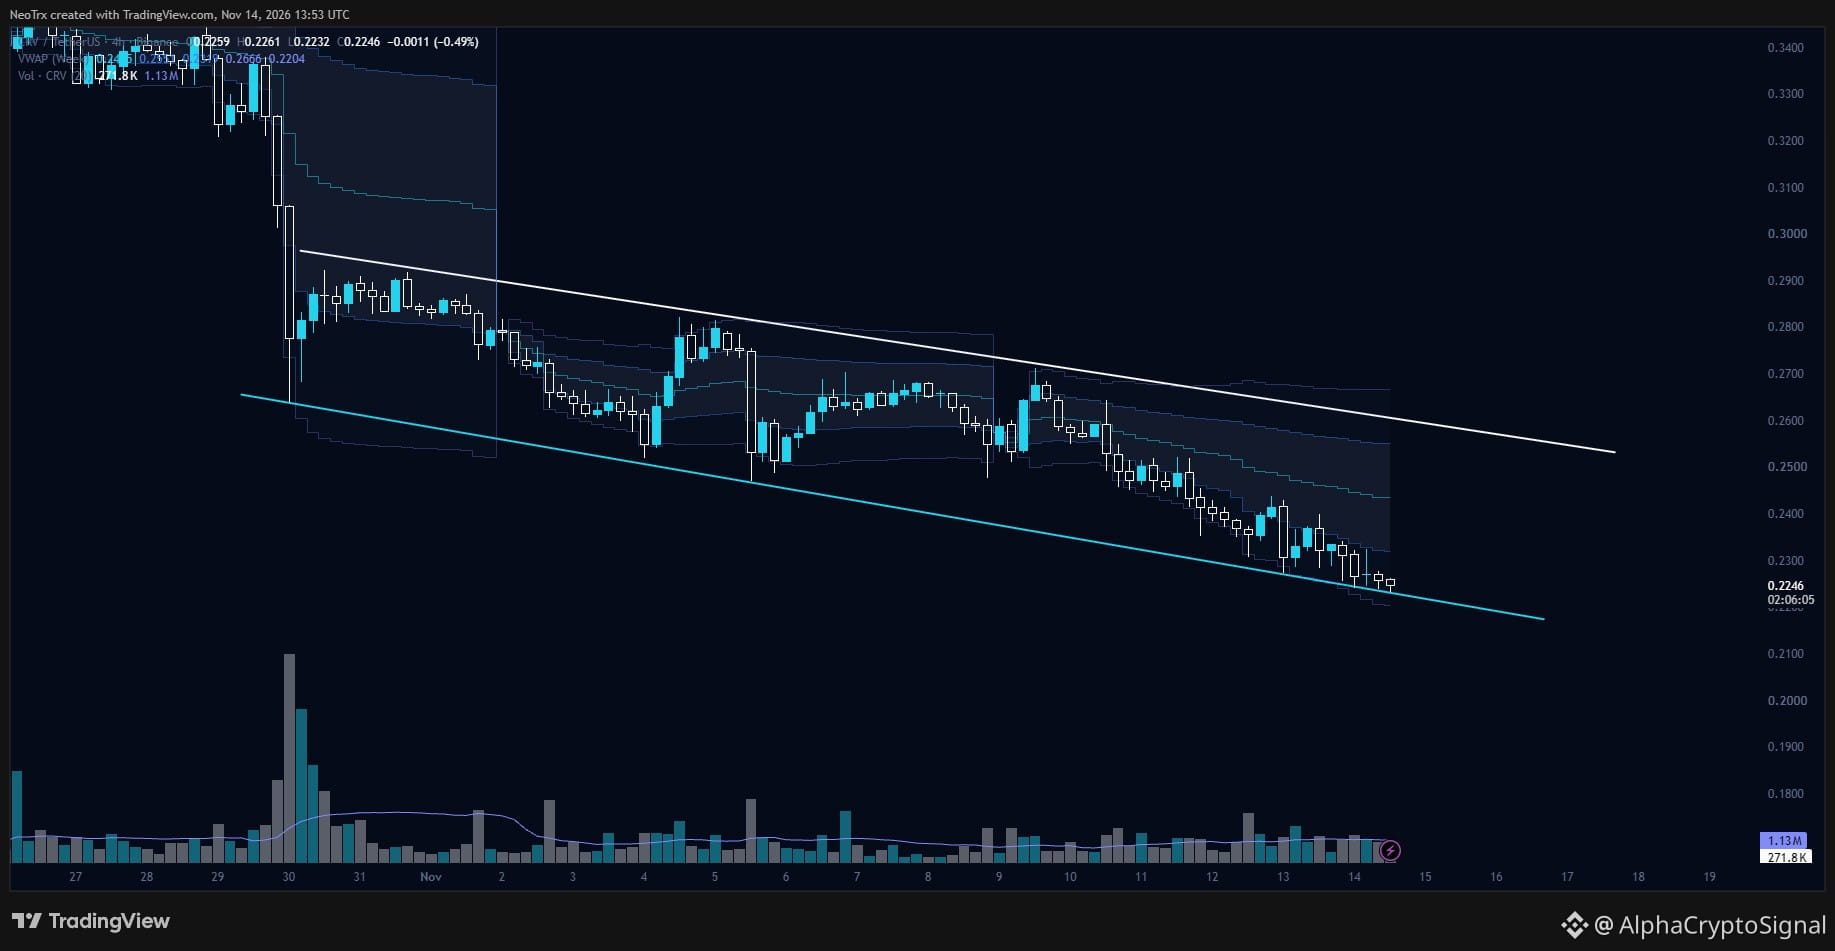
#CRV LTF Analysis:
$CRV is trading inside a descending broadening wedge on the 4H and is now sitting right on the lower boundary (~$0.222). The decline has been steady, but volume has been fading as $CRV grinds lower, which often shows selling pressure drying up.
This pattern usually resolves to the upside, so I'm watching for a bounce off this boundary and then a break above the upper trendline (~$0.26). A 4H close below $0.22 would invalidate the $CRV setup.
{future}(CRVUSDT)
#CRV LTF Analysis:
$CRV is trading inside a descending broadening wedge on the 4H and is now sitting right on the lower boundary (~$0.222). The decline has been steady, but volume has been fading as $CRV grinds lower, which often shows selling pressure drying up.
This pattern usually resolves to the upside, so I'm watching for a bounce off this boundary and then a break above the upper trendline (~$0.26). A 4H close below $0.22 would invalidate the $CRV setup.
$CRV is trading inside a descending broadening wedge on the 4H and is now sitting right on the lower boundary (~$0.222). The decline has been steady, but volume has been fading as $CRV grinds lower, which often shows selling pressure drying up.
This pattern usually resolves to the upside, so I'm watching for a bounce off this boundary and then a break above the upper trendline (~$0.26). A 4H close below $0.22 would invalidate the $CRV setup.
304
·
--
Bullish
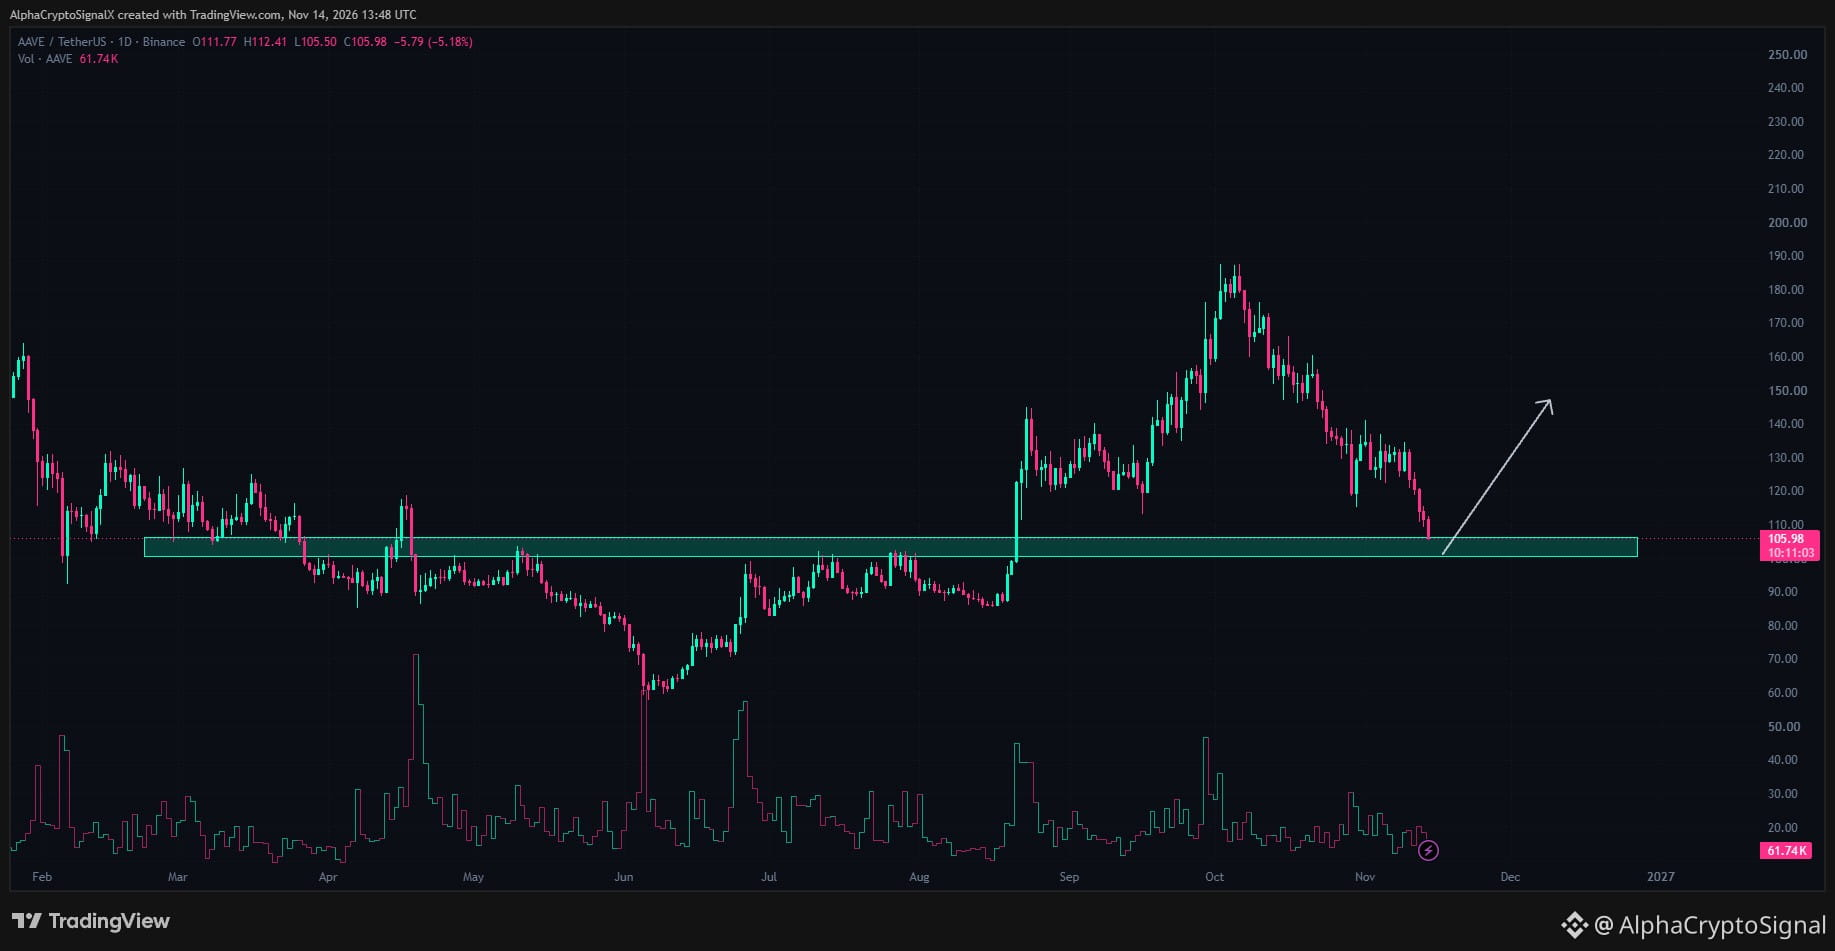
#AAVE HTF Analysis:
$AAVE has pulled back into a major daily horizontal demand zone at $100.00–$106.00, currently trading near $105.98.
Holding above $100.00 on a daily close preserves the bullish structure and sets up a reversal bounce toward $130.00 and $145.00–$150.00. A decisive daily breakdown below $100.00 invalidates the bounce and exposes $85.00–$90.00 for $AAVE
{future}(AAVEUSDT)
#AAVE HTF Analysis:
$AAVE has pulled back into a major daily horizontal demand zone at $100.00–$106.00, currently trading near $105.98.
Holding above $100.00 on a daily close preserves the bullish structure and sets up a reversal bounce toward $130.00 and $145.00–$150.00. A decisive daily breakdown below $100.00 invalidates the bounce and exposes $85.00–$90.00 for $AAVE
$AAVE has pulled back into a major daily horizontal demand zone at $100.00–$106.00, currently trading near $105.98.
Holding above $100.00 on a daily close preserves the bullish structure and sets up a reversal bounce toward $130.00 and $145.00–$150.00. A decisive daily breakdown below $100.00 invalidates the bounce and exposes $85.00–$90.00 for $AAVE
2
2
68
·
--
Bullish
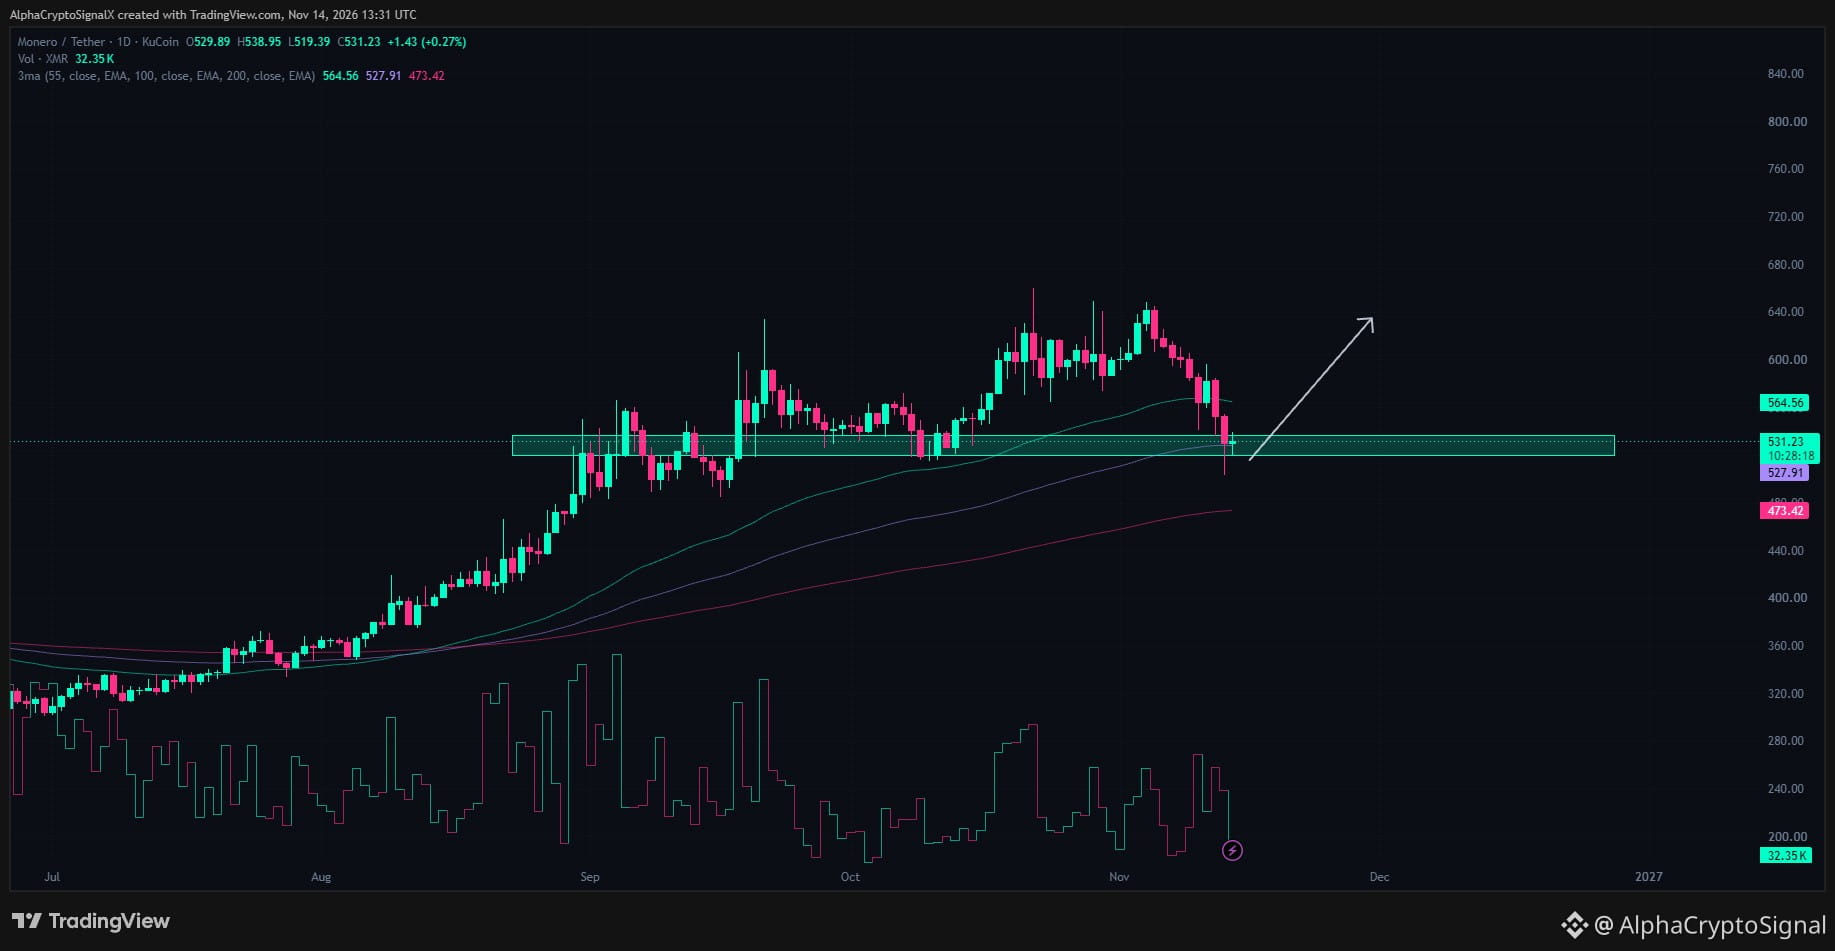
Thoughts on #XMR
$XMR is testing a major horizontal demand zone around $520–$532 on the daily timeframe, aligning directly with dynamic support at the 100 EMA (~$527.92) while the 200 EMA sits lower at ~$473.42.
Holding above this $520–$528 confluence zone confirms a bullish bounce setup on $XMR , targeting a reclaim of the 55 EMA (~$564.58) and a continuation push back toward the $630–$640 range highs. Losing $520 on a daily close invalidates the bounce and exposes the 200 EMA near $473.
{future}(XMRUSDT)
Thoughts on #XMR
$XMR is testing a major horizontal demand zone around $520–$532 on the daily timeframe, aligning directly with dynamic support at the 100 EMA (~$527.92) while the 200 EMA sits lower at ~$473.42.
Holding above this $520–$528 confluence zone confirms a bullish bounce setup on $XMR , targeting a reclaim of the 55 EMA (~$564.58) and a continuation push back toward the $630–$640 range highs. Losing $520 on a daily close invalidates the bounce and exposes the 200 EMA near $473.
$XMR is testing a major horizontal demand zone around $520–$532 on the daily timeframe, aligning directly with dynamic support at the 100 EMA (~$527.92) while the 200 EMA sits lower at ~$473.42.
Holding above this $520–$528 confluence zone confirms a bullish bounce setup on $XMR , targeting a reclaim of the 55 EMA (~$564.58) and a continuation push back toward the $630–$640 range highs. Losing $520 on a daily close invalidates the bounce and exposes the 200 EMA near $473.
89
·
--
Bullish
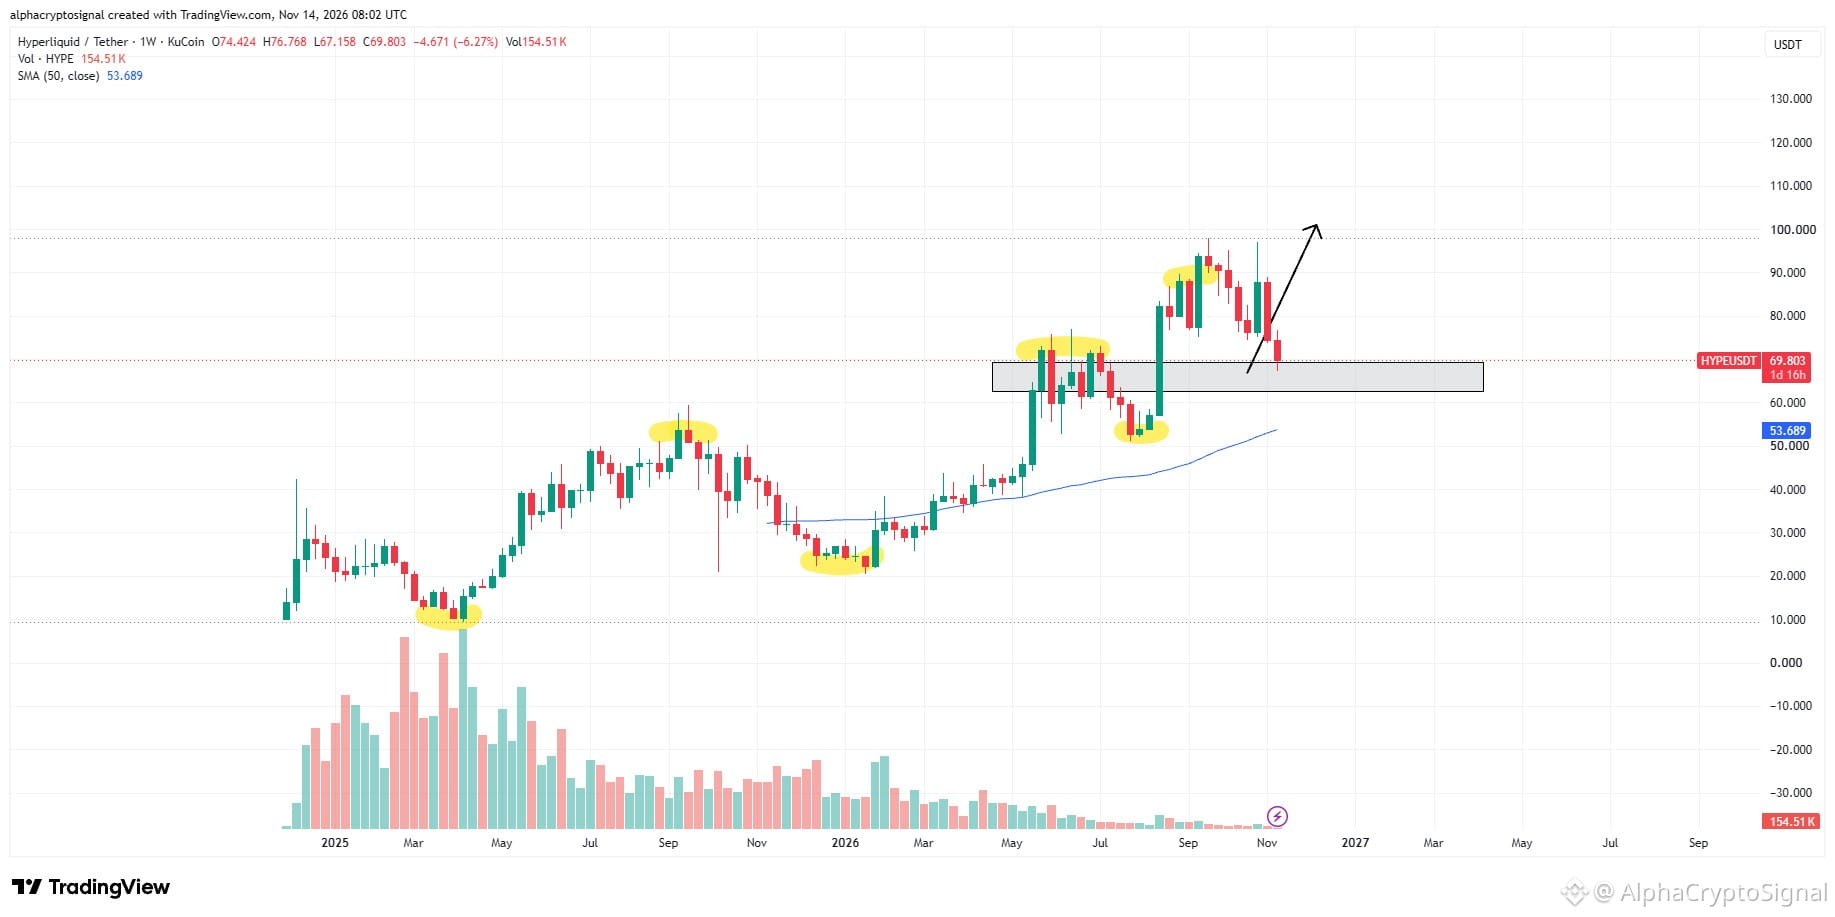
#HYPE Update:
$HYPE has finally tapped our long-awaited buying zone after the recent correction. We're looking at this area as a potential accumulation opportunity, with the weekly structure still holding up.
We've started loading $HYPE on spot around this zone. Now watching how price reacts here and whether buyers can step in to support the next move higher.
{future}(HYPEUSDT)
#HYPE Update:
$HYPE has finally tapped our long-awaited buying zone after the recent correction. We're looking at this area as a potential accumulation opportunity, with the weekly structure still holding up.
We've started loading $HYPE on spot around this zone. Now watching how price reacts here and whether buyers can step in to support the next move higher.
$HYPE has finally tapped our long-awaited buying zone after the recent correction. We're looking at this area as a potential accumulation opportunity, with the weekly structure still holding up.
We've started loading $HYPE on spot around this zone. Now watching how price reacts here and whether buyers can step in to support the next move higher.
65
·
--
Bullish
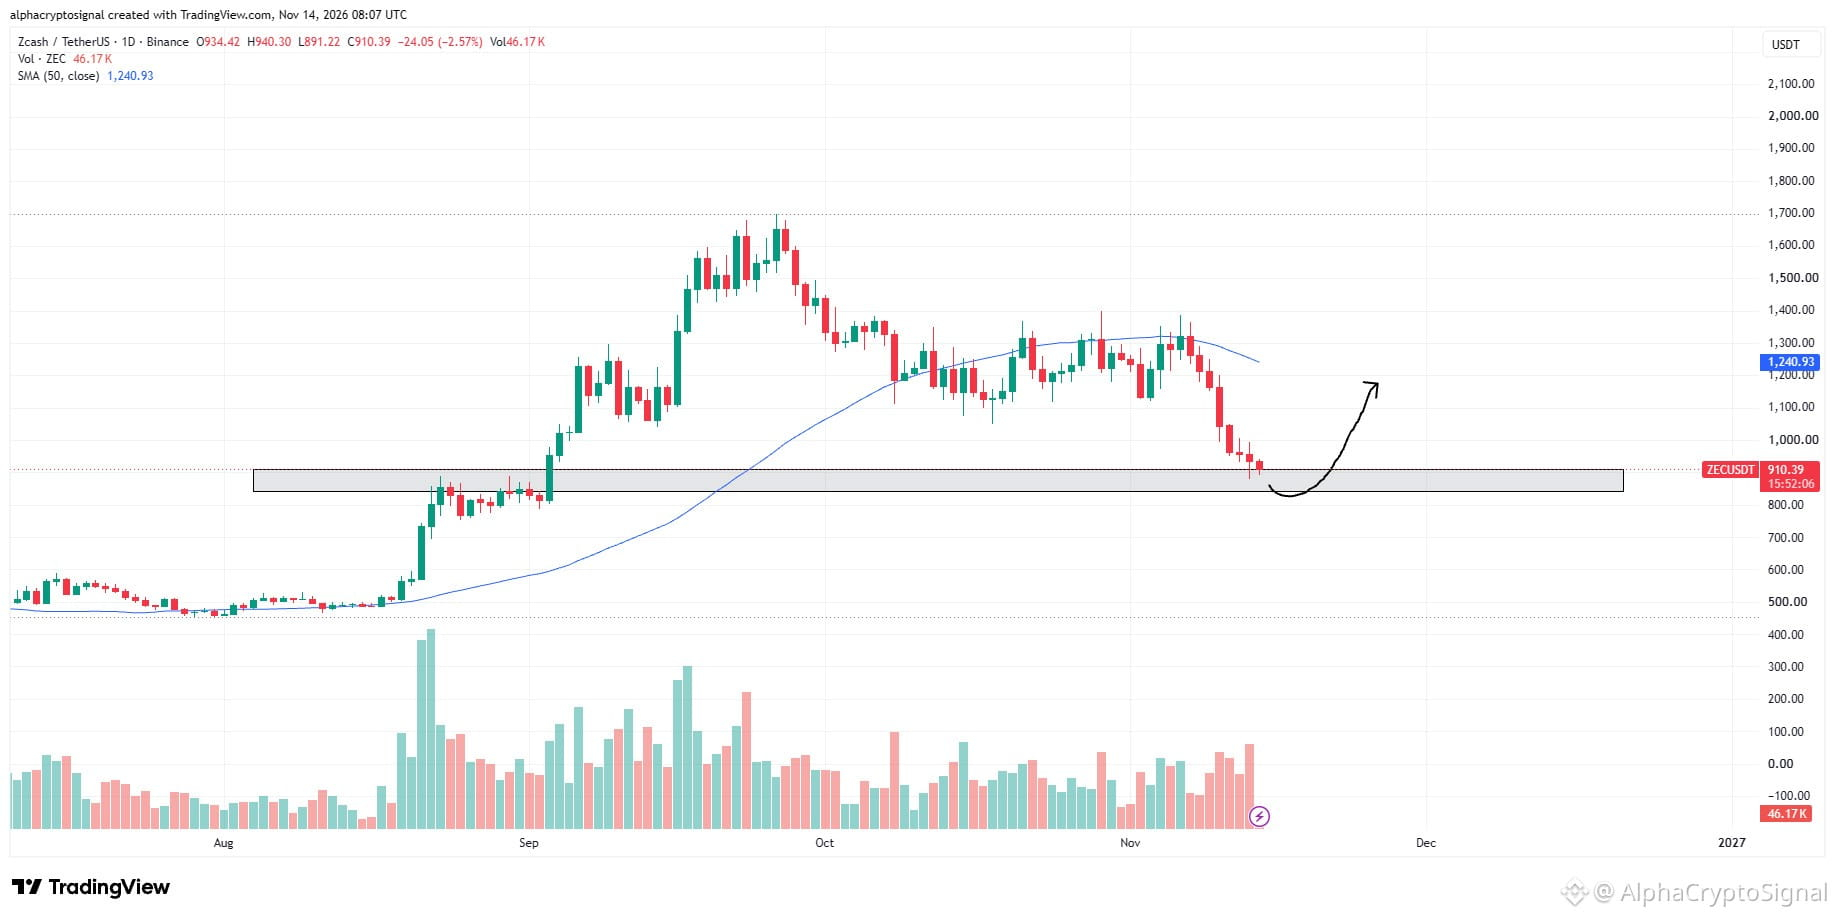
Thoughts on #ZEC
$ZEC is approaching a major horizontal support zone after an extended correction. This area previously acted as resistance before the breakout, making it an important level to watch.
Expecting a potential reversal from this zone, with a move toward the $1,200 region if buyers step in and confirm the bounce. Let's see how $ZEC reacts.
{future}(ZECUSDT)
Thoughts on #ZEC
$ZEC is approaching a major horizontal support zone after an extended correction. This area previously acted as resistance before the breakout, making it an important level to watch.
Expecting a potential reversal from this zone, with a move toward the $1,200 region if buyers step in and confirm the bounce. Let's see how $ZEC reacts.
$ZEC is approaching a major horizontal support zone after an extended correction. This area previously acted as resistance before the breakout, making it an important level to watch.
Expecting a potential reversal from this zone, with a move toward the $1,200 region if buyers step in and confirm the bounce. Let's see how $ZEC reacts.
550
·
--
Bullish
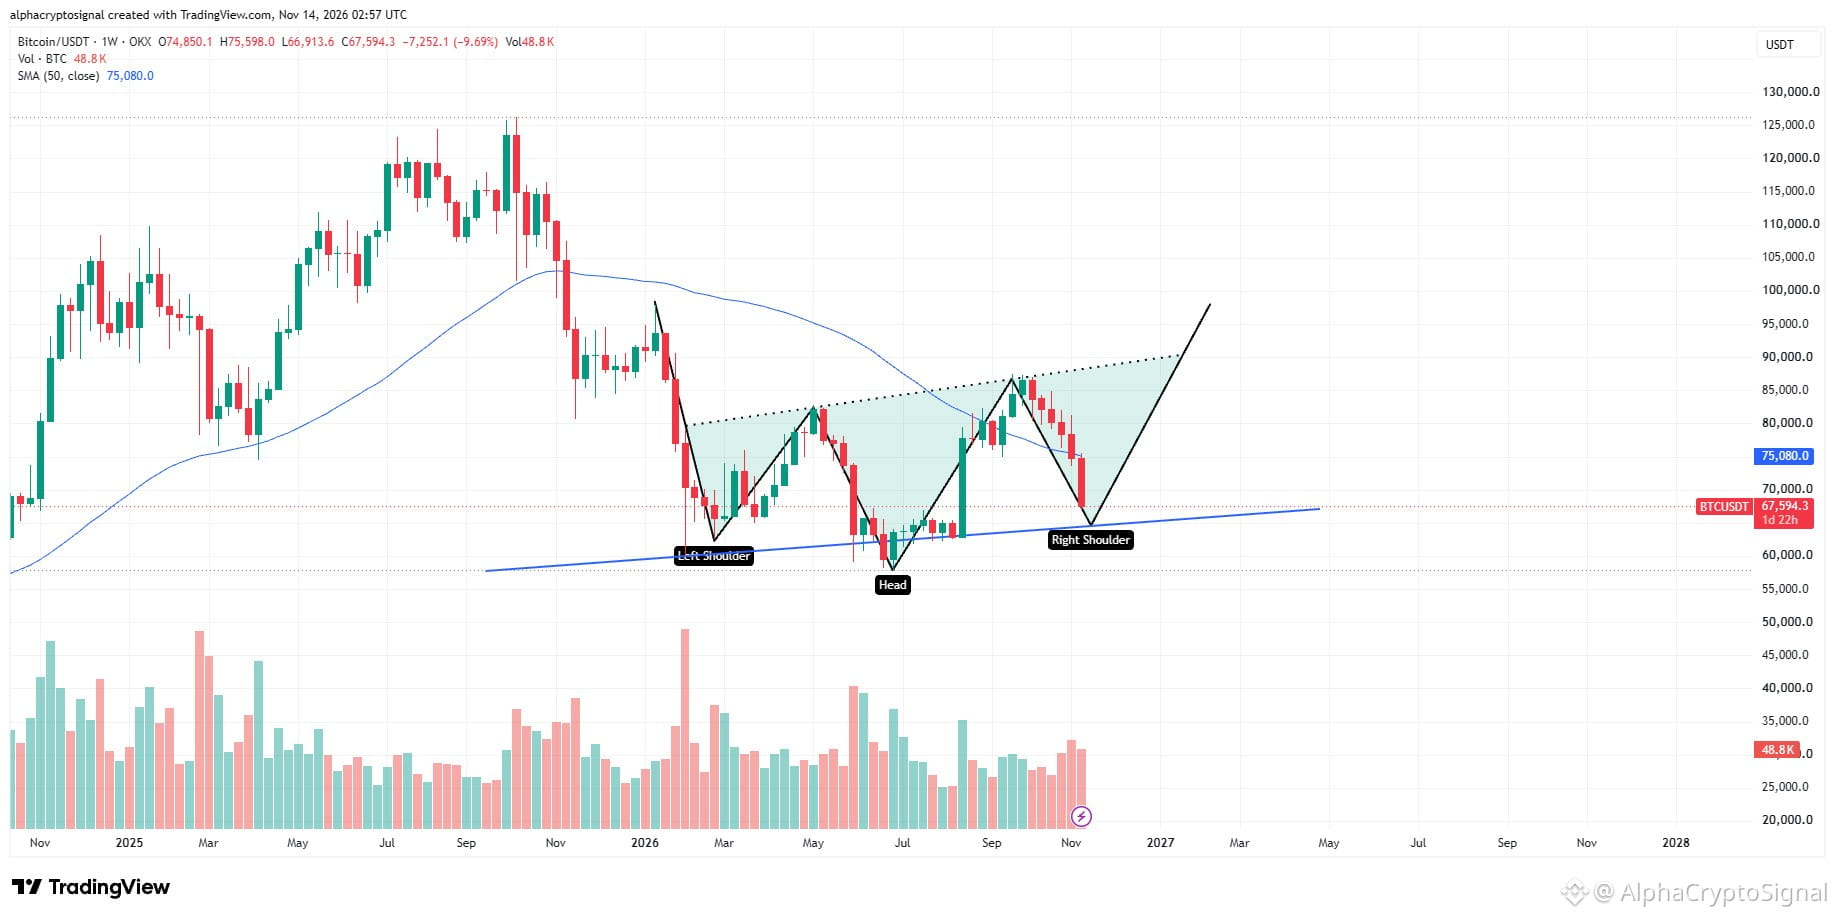
Thoughts on #BTC
$BTC could be approaching the bottom of this corrective leg, with a potential inverse head and shoulders formation developing on the weekly chart. I'm watching the $64K region for a possible right shoulder to form.
If that zone holds, it could mark the local bottom and set the stage for a recovery. Still, we need confirmation before calling the reversal. Keep an eye on the $BTC structure.
{future}(BTCUSDT)
Thoughts on #BTC
$BTC could be approaching the bottom of this corrective leg, with a potential inverse head and shoulders formation developing on the weekly chart. I'm watching the $64K region for a possible right shoulder to form.
If that zone holds, it could mark the local bottom and set the stage for a recovery. Still, we need confirmation before calling the reversal. Keep an eye on the $BTC structure.
$BTC could be approaching the bottom of this corrective leg, with a potential inverse head and shoulders formation developing on the weekly chart. I'm watching the $64K region for a possible right shoulder to form.
If that zone holds, it could mark the local bottom and set the stage for a recovery. Still, we need confirmation before calling the reversal. Keep an eye on the $BTC structure.
100
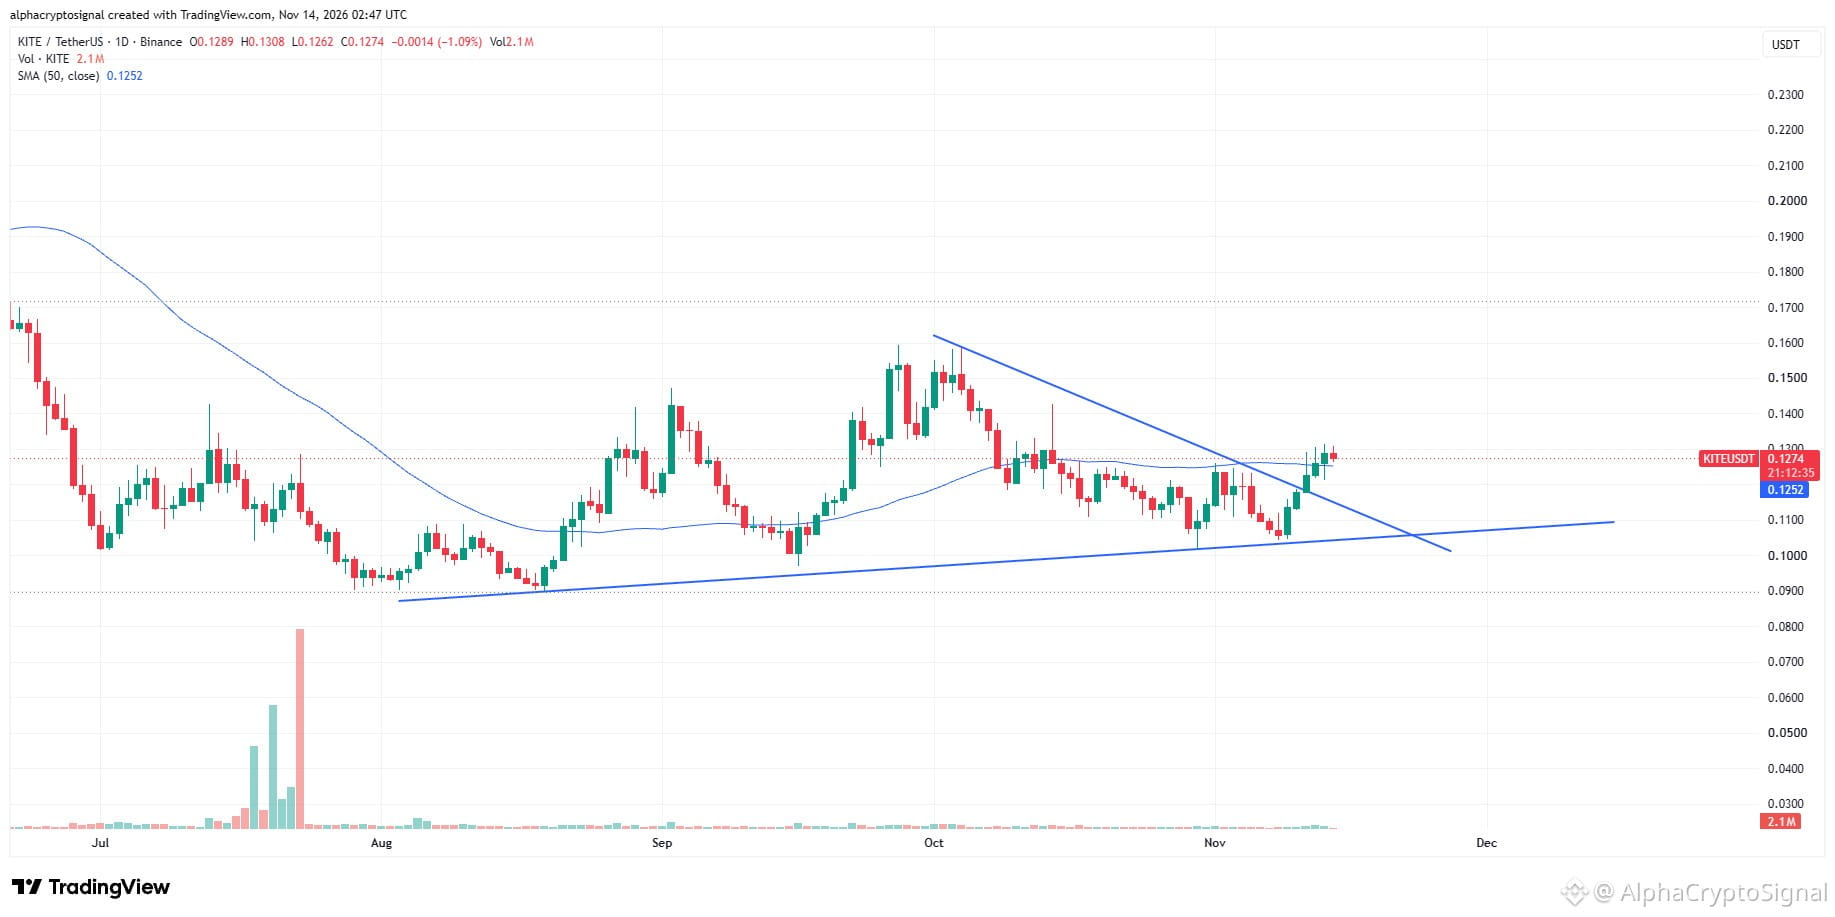
Chart Request: #KITE
$KITE has broken out of its symmetrical triangle on the daily timeframe, reclaiming the MA50 in the process. The structure is starting to look increasingly bullish.
Looking for continuation from here, with the breakout and MA50 reclaim holding as support. Momentum is shifting in favor of the bulls on $KITE
{future}(KITEUSDT)
Chart Request: #KITE
$KITE has broken out of its symmetrical triangle on the daily timeframe, reclaiming the MA50 in the process. The structure is starting to look increasingly bullish.
Looking for continuation from here, with the breakout and MA50 reclaim holding as support. Momentum is shifting in favor of the bulls on $KITE
$KITE has broken out of its symmetrical triangle on the daily timeframe, reclaiming the MA50 in the process. The structure is starting to look increasingly bullish.
Looking for continuation from here, with the breakout and MA50 reclaim holding as support. Momentum is shifting in favor of the bulls on $KITE
108
Log in to explore more content
Join global crypto users on Binance Square
⚡️ Get latest and useful information about crypto.
💬 Trusted by the world’s largest crypto exchange.
👍 Discover real insights from verified creators.
Email / Phone number
Trending Topics
NvidiaBeatsEstimatesAICloudStocksRiseAfterHours
3,646 views
61 Discussing
Nvidia Beats With $115.8 Billion in Revenue, Guides to $130 Billion and Adds $150 Billion Buyback
Binance News
·4 Likes
·7.8k views
A Packed Week of Earnings and Data Tests Markets
151,543 views
667 Discussing
AnthropicIPOTestsInvestorAppetiteForAI
334,787 views
2,920 Discussing