
Chipsmaker 籌碼與鏈上研究
1.1k Posts

Chipsmaker 籌碼與鏈上研究
Report
Block User
Open Trade

BTC Holder
High-Frequency Trader
5.8 Years
33 Following
118 Followers
33 Liked
Posts
Portfolio
All
Quotes
My browser tabs are in the teens again—exchanges, data sites, and Twitter all crammed together.
Every time I want to close one, I worry I’ll miss something. In the end, I only actually look at two or three.
Tonight, I’ll try keeping just one data page open. The rest can wait until I wake up.
$BTC
My browser tabs are in the teens again—exchanges, data sites, and Twitter all crammed together.
Every time I want to close one, I worry I’ll miss something. In the end, I only actually look at two or three.
Tonight, I’ll try keeping just one data page open. The rest can wait until I wake up.
$BTC
Every time I want to close one, I worry I’ll miss something. In the end, I only actually look at two or three.
Tonight, I’ll try keeping just one data page open. The rest can wait until I wake up.
$BTC
256
Even major banks are starting to lower their expectations, suggesting that institutional buying has pulled back faster than expected in this downturn.
According to reports, Citigroup lowered its 12-month price targets for Bitcoin and Ether on November 18. Bitcoin’s target was cut from $113,000 to $99,532, a decrease of about 12%. Ether’s target was lowered from $3,028 to $2,838.
The report was led by analyst Alex Saunders and reportedly cited three reasons:
1. Year-to-date flows into U.S. spot Bitcoin ETFs have turned net negative, while Ether funds have seen redemptions for multiple consecutive weeks.
2. Bitcoin fell below its 200-day moving average, prompting Citigroup to lower its short-term outlook for fund flows to “neutral.”
3. The dollar has strengthened, real yields have risen, and stock market volatility has increased.
What stands out to me isn’t the new price targets, but the reasons behind them. The targets are still far above current prices—based on a Binance spot price of about $63,000, Bitcoin still has more than 50% upside. But the bank itself has downgraded its outlook for fund flows, showing that ETF buying is not providing support for now.
Ether is in a more difficult position. Its spot price is around $1,770, much farther from Citigroup’s new target, and with ETFs seeing consecutive redemptions, there’s little new buying to fuel a rebound. Bitcoin, at least, has the psychological $60,000 level to hold.
One thing to note: reports like this typically follow price corrections rather than lead them. Citigroup lowered its target only after Bitcoin had already fallen below its moving average, effectively confirming the trend rather than predicting a reversal. The market is looking at the same set of figures: ETF outflows, a break below the moving average, and a stronger dollar.
My view: This report’s bearish case won’t be invalidated until Bitcoin reclaims its 200-day moving average and U.S. spot Bitcoin ETFs see net inflows for several consecutive days. Until both happen, I’ll treat any rebound as merely a technical bounce.
Personal views and information summary, not investment advice. DYOR.
$BTC $ETH
Even major banks are starting to lower their expectations, suggesting that institutional buying has pulled back faster than expected in this downturn.
According to reports, Citigroup lowered its 12-month price targets for Bitcoin and Ether on November 18. Bitcoin’s target was cut from $113,000 to $99,532, a decrease of about 12%. Ether’s target was lowered from $3,028 to $2,838.
The report was led by analyst Alex Saunders and reportedly cited three reasons:
1. Year-to-date flows into U.S. spot Bitcoin ETFs have turned net negative, while Ether funds have seen redemptions for multiple consecutive weeks.
2. Bitcoin fell below its 200-day moving average, prompting Citigroup to lower its short-term outlook for fund flows to “neutral.”
3. The dollar has strengthened, real yields have risen, and stock market volatility has increased.
What stands out to me isn’t the new price targets, but the reasons behind them. The targets are still far above current prices—based on a Binance spot price of about $63,000, Bitcoin still has more than 50% upside. But the bank itself has downgraded its outlook for fund flows, showing that ETF buying is not providing support for now.
Ether is in a more difficult position. Its spot price is around $1,770, much farther from Citigroup’s new target, and with ETFs seeing consecutive redemptions, there’s little new buying to fuel a rebound. Bitcoin, at least, has the psychological $60,000 level to hold.
One thing to note: reports like this typically follow price corrections rather than lead them. Citigroup lowered its target only after Bitcoin had already fallen below its moving average, effectively confirming the trend rather than predicting a reversal. The market is looking at the same set of figures: ETF outflows, a break below the moving average, and a stronger dollar.
My view: This report’s bearish case won’t be invalidated until Bitcoin reclaims its 200-day moving average and U.S. spot Bitcoin ETFs see net inflows for several consecutive days. Until both happen, I’ll treat any rebound as merely a technical bounce.
Personal views and information summary, not investment advice. DYOR.
$BTC $ETH
According to reports, Citigroup lowered its 12-month price targets for Bitcoin and Ether on November 18. Bitcoin’s target was cut from $113,000 to $99,532, a decrease of about 12%. Ether’s target was lowered from $3,028 to $2,838.
The report was led by analyst Alex Saunders and reportedly cited three reasons:
1. Year-to-date flows into U.S. spot Bitcoin ETFs have turned net negative, while Ether funds have seen redemptions for multiple consecutive weeks.
2. Bitcoin fell below its 200-day moving average, prompting Citigroup to lower its short-term outlook for fund flows to “neutral.”
3. The dollar has strengthened, real yields have risen, and stock market volatility has increased.
What stands out to me isn’t the new price targets, but the reasons behind them. The targets are still far above current prices—based on a Binance spot price of about $63,000, Bitcoin still has more than 50% upside. But the bank itself has downgraded its outlook for fund flows, showing that ETF buying is not providing support for now.
Ether is in a more difficult position. Its spot price is around $1,770, much farther from Citigroup’s new target, and with ETFs seeing consecutive redemptions, there’s little new buying to fuel a rebound. Bitcoin, at least, has the psychological $60,000 level to hold.
One thing to note: reports like this typically follow price corrections rather than lead them. Citigroup lowered its target only after Bitcoin had already fallen below its moving average, effectively confirming the trend rather than predicting a reversal. The market is looking at the same set of figures: ETF outflows, a break below the moving average, and a stronger dollar.
My view: This report’s bearish case won’t be invalidated until Bitcoin reclaims its 200-day moving average and U.S. spot Bitcoin ETFs see net inflows for several consecutive days. Until both happen, I’ll treat any rebound as merely a technical bounce.
Personal views and information summary, not investment advice. DYOR.
$BTC $ETH
448
Watching the market late at night: Bitcoin is currently around $63,663, down 1.71% over the past 24 hours (Binance spot data).
I find this kind of market—small daily dips and low volume—more exhausting than a sudden crash. It can easily make you restless and tempt you to act impulsively.
If you had to choose just one move tonight: buy in installments according to your plan, stay in cash and wait, or simply close your trading app and go to sleep?
Not investment advice. Please assess the risks for yourself.
$BTC
Watching the market late at night: Bitcoin is currently around $63,663, down 1.71% over the past 24 hours (Binance spot data).
I find this kind of market—small daily dips and low volume—more exhausting than a sudden crash. It can easily make you restless and tempt you to act impulsively.
If you had to choose just one move tonight: buy in installments according to your plan, stay in cash and wait, or simply close your trading app and go to sleep?
Not investment advice. Please assess the risks for yourself.
$BTC
I find this kind of market—small daily dips and low volume—more exhausting than a sudden crash. It can easily make you restless and tempt you to act impulsively.
If you had to choose just one move tonight: buy in installments according to your plan, stay in cash and wait, or simply close your trading app and go to sleep?
Not investment advice. Please assess the risks for yourself.
$BTC
242
Someone makes money on three trades in a row and decides their method has been proven, then doubles their position on the next trade.
Core principle: When evaluating a trade, look at the decision-making process at the time—not whether it ultimately made or lost money.
Why do people think this way? Our brains naturally judge decisions in hindsight based on their outcomes. This is called outcome bias. If we make money, we think our judgment was right; if we lose money, we think we were stupid.
But short-term results are heavily influenced by luck. Let’s check the math: A method with zero expected value has a 50% win rate on each trade. The probability of winning three trades in a row is 0.5 × 0.5 × 0.5 = 12.5%—that is, on average, one such streak will occur in every eight sets of three trades.
In other words, three wins in a row don’t prove you have an edge; you may simply have drawn a lucky hand. Conversely, three losses in a row are just as common with a method that genuinely has an edge. It doesn’t mean the method is broken.
What to do instead:
1. Review profitable trades too. Ask yourself: Was the reason for entry part of the plan? Did I set a stop-loss? Was the position size within the rules? If you missed even one of these, that trade was a lucky one.
2. Label each trade as one of four types: good decision, profit; good decision, loss; bad decision, profit; bad decision, loss. The third type is the most dangerous—it’s the easiest to get rewarded for and repeat.
3. Let sample size speak. Accumulate at least a few dozen trades using the same rules before evaluating the method. Three to five trades aren’t enough to draw conclusions.
4. Increase your position based on rules, not winning streaks. For example, set the risk on each trade at a fixed 1% of your account, and don’t raise it even after consecutive wins.
5. Before changing your strategy, check whether your process has drifted. Don’t overturn the whole method because of a single loss.
For example: With a $10,000 account, risking 1% per trade means risking $100. After three consecutive wins, you still risk only $100. If the fourth trade loses, the loss is within expectations, so there’s no need for an emotional reaction.
Good results can be encouraging, but what lasts is a repeatable process.
Personal opinion and information summary only; not investment advice. DYOR.
$BTC
Someone makes money on three trades in a row and decides their method has been proven, then doubles their position on the next trade.
Core principle: When evaluating a trade, look at the decision-making process at the time—not whether it ultimately made or lost money.
Why do people think this way? Our brains naturally judge decisions in hindsight based on their outcomes. This is called outcome bias. If we make money, we think our judgment was right; if we lose money, we think we were stupid.
But short-term results are heavily influenced by luck. Let’s check the math: A method with zero expected value has a 50% win rate on each trade. The probability of winning three trades in a row is 0.5 × 0.5 × 0.5 = 12.5%—that is, on average, one such streak will occur in every eight sets of three trades.
In other words, three wins in a row don’t prove you have an edge; you may simply have drawn a lucky hand. Conversely, three losses in a row are just as common with a method that genuinely has an edge. It doesn’t mean the method is broken.
What to do instead:
1. Review profitable trades too. Ask yourself: Was the reason for entry part of the plan? Did I set a stop-loss? Was the position size within the rules? If you missed even one of these, that trade was a lucky one.
2. Label each trade as one of four types: good decision, profit; good decision, loss; bad decision, profit; bad decision, loss. The third type is the most dangerous—it’s the easiest to get rewarded for and repeat.
3. Let sample size speak. Accumulate at least a few dozen trades using the same rules before evaluating the method. Three to five trades aren’t enough to draw conclusions.
4. Increase your position based on rules, not winning streaks. For example, set the risk on each trade at a fixed 1% of your account, and don’t raise it even after consecutive wins.
5. Before changing your strategy, check whether your process has drifted. Don’t overturn the whole method because of a single loss.
For example: With a $10,000 account, risking 1% per trade means risking $100. After three consecutive wins, you still risk only $100. If the fourth trade loses, the loss is within expectations, so there’s no need for an emotional reaction.
Good results can be encouraging, but what lasts is a repeatable process.
Personal opinion and information summary only; not investment advice. DYOR.
$BTC
Core principle: When evaluating a trade, look at the decision-making process at the time—not whether it ultimately made or lost money.
Why do people think this way? Our brains naturally judge decisions in hindsight based on their outcomes. This is called outcome bias. If we make money, we think our judgment was right; if we lose money, we think we were stupid.
But short-term results are heavily influenced by luck. Let’s check the math: A method with zero expected value has a 50% win rate on each trade. The probability of winning three trades in a row is 0.5 × 0.5 × 0.5 = 12.5%—that is, on average, one such streak will occur in every eight sets of three trades.
In other words, three wins in a row don’t prove you have an edge; you may simply have drawn a lucky hand. Conversely, three losses in a row are just as common with a method that genuinely has an edge. It doesn’t mean the method is broken.
What to do instead:
1. Review profitable trades too. Ask yourself: Was the reason for entry part of the plan? Did I set a stop-loss? Was the position size within the rules? If you missed even one of these, that trade was a lucky one.
2. Label each trade as one of four types: good decision, profit; good decision, loss; bad decision, profit; bad decision, loss. The third type is the most dangerous—it’s the easiest to get rewarded for and repeat.
3. Let sample size speak. Accumulate at least a few dozen trades using the same rules before evaluating the method. Three to five trades aren’t enough to draw conclusions.
4. Increase your position based on rules, not winning streaks. For example, set the risk on each trade at a fixed 1% of your account, and don’t raise it even after consecutive wins.
5. Before changing your strategy, check whether your process has drifted. Don’t overturn the whole method because of a single loss.
For example: With a $10,000 account, risking 1% per trade means risking $100. After three consecutive wins, you still risk only $100. If the fourth trade loses, the loss is within expectations, so there’s no need for an emotional reaction.
Good results can be encouraging, but what lasts is a repeatable process.
Personal opinion and information summary only; not investment advice. DYOR.
$BTC

117
Solana has dropped the “mainnet beta” label it had used for more than six years.
According to BlockTempo, the Solana Foundation announced on Monday that it will use “Solana 1.0” as the network-wide protocol version number, decoupled from the versions of individual validator clients. The official explanation is that this is merely a naming simplification, not a hard fork. Token holders and account owners don’t need to take any action, and new features will only take effect once they are released by the respective clients.
My take: The name change itself won’t alter SOL’s fundamentals, but it adds to the institutional narrative. Reports say DTCC plans to bring its tokenization services to Solana in the second half of 2027. Developments like these are what could actually drive demand.
What to watch: Whether Firedancer’s share of validators continues to rise. Only when single-client risk declines will “1.0” be truly convincing.
Personal opinions and information roundup, not investment advice. DYOR.
$SOL
Solana has dropped the “mainnet beta” label it had used for more than six years.
According to BlockTempo, the Solana Foundation announced on Monday that it will use “Solana 1.0” as the network-wide protocol version number, decoupled from the versions of individual validator clients. The official explanation is that this is merely a naming simplification, not a hard fork. Token holders and account owners don’t need to take any action, and new features will only take effect once they are released by the respective clients.
My take: The name change itself won’t alter SOL’s fundamentals, but it adds to the institutional narrative. Reports say DTCC plans to bring its tokenization services to Solana in the second half of 2027. Developments like these are what could actually drive demand.
What to watch: Whether Firedancer’s share of validators continues to rise. Only when single-client risk declines will “1.0” be truly convincing.
Personal opinions and information roundup, not investment advice. DYOR.
$SOL
According to BlockTempo, the Solana Foundation announced on Monday that it will use “Solana 1.0” as the network-wide protocol version number, decoupled from the versions of individual validator clients. The official explanation is that this is merely a naming simplification, not a hard fork. Token holders and account owners don’t need to take any action, and new features will only take effect once they are released by the respective clients.
My take: The name change itself won’t alter SOL’s fundamentals, but it adds to the institutional narrative. Reports say DTCC plans to bring its tokenization services to Solana in the second half of 2027. Developments like these are what could actually drive demand.
What to watch: Whether Firedancer’s share of validators continues to rise. Only when single-client risk declines will “1.0” be truly convincing.
Personal opinions and information roundup, not investment advice. DYOR.
$SOL
76
According to Binance spot data, SOL is up about 3.4% over the past 24 hours, while BTC is up just 0.24% and ETH 0.15%.
The broader market is still trading in a narrow range, and funds are moving into SOL first. I think this looks more like short-term rotation than a strengthening trend.
If you could choose only one coin to add to your watchlist right now, would you choose SOL, ETH, or keep watching BTC? Why?
Personal views and information summary only; not investment advice. DYOR.
$SOL $ETH
According to Binance spot data, SOL is up about 3.4% over the past 24 hours, while BTC is up just 0.24% and ETH 0.15%.
The broader market is still trading in a narrow range, and funds are moving into SOL first. I think this looks more like short-term rotation than a strengthening trend.
If you could choose only one coin to add to your watchlist right now, would you choose SOL, ETH, or keep watching BTC? Why?
Personal views and information summary only; not investment advice. DYOR.
$SOL $ETH
The broader market is still trading in a narrow range, and funds are moving into SOL first. I think this looks more like short-term rotation than a strengthening trend.
If you could choose only one coin to add to your watchlist right now, would you choose SOL, ETH, or keep watching BTC? Why?
Personal views and information summary only; not investment advice. DYOR.
$SOL $ETH
260
Sky (formerly MakerDAO) is an overcollateralized stablecoin lending protocol that issues USDS and DAI. SKY has fallen about 25% over the past 30 days (according to CoinGecko), and discussion has picked up recently about whether buybacks and revenue can support its valuation.
Revenue and Value Capture
According to DefiLlama, Sky's TVL is about $3.6 billion. Protocol revenue was about $13.6 million over the past 30 days and about $189 million over the past year. Revenue mainly comes from stability fees on vault borrowing and yields from RWA Treasury investments.
SKY is used for governance and can also be staked to earn rewards. Surplus funds are used to provide staking rewards and buy back SKY on the market. Reportedly, cumulative buybacks have exceeded $26 million. I couldn't verify this on the official site, so treat it as a reference only.
Tokenomics
According to CoinGecko, SKY's circulating supply is about 23.4 billion tokens, with a total supply of about 23.45 billion. Its circulating market cap is about $1.22 billion, nearly the same as its FDV. In other words, there are no major unlocks looming, which is uncommon among major DeFi tokens.
Bull Case
1. The revenue is real. Annualized revenue is about $190 million. Compared with a $1.2 billion market cap, that means the market cap is a little over 6 times annualized revenue—not expensive.
2. No unlocks, combined with ongoing buybacks, means supply is relatively tight.
Bear Case
1. Revenue over the past 30 days was about $13.6 million, or about $165 million annualized—already below the past year's average, suggesting revenue is slowing.
2. Buybacks are relatively small compared with the market cap and need USDS supply growth to scale up. When the price falls, buybacks provide only a limited cushion against selling pressure.
My Take
I'll be watching Sky's 30-day revenue on DefiLlama. If it returns to above $15 million in the coming weeks, concerns about slowing revenue will ease. If it falls below $12 million, the first point in the bear case will be confirmed.
Data sources: CoinGecko, DefiLlama. Date checked: 2026-11-18.
Personal opinions and information summary; not investment advice. DYOR.
$SKY
Sky (formerly MakerDAO) is an overcollateralized stablecoin lending protocol that issues USDS and DAI. SKY has fallen about 25% over the past 30 days (according to CoinGecko), and discussion has picked up recently about whether buybacks and revenue can support its valuation.
Revenue and Value Capture
According to DefiLlama, Sky's TVL is about $3.6 billion. Protocol revenue was about $13.6 million over the past 30 days and about $189 million over the past year. Revenue mainly comes from stability fees on vault borrowing and yields from RWA Treasury investments.
SKY is used for governance and can also be staked to earn rewards. Surplus funds are used to provide staking rewards and buy back SKY on the market. Reportedly, cumulative buybacks have exceeded $26 million. I couldn't verify this on the official site, so treat it as a reference only.
Tokenomics
According to CoinGecko, SKY's circulating supply is about 23.4 billion tokens, with a total supply of about 23.45 billion. Its circulating market cap is about $1.22 billion, nearly the same as its FDV. In other words, there are no major unlocks looming, which is uncommon among major DeFi tokens.
Bull Case
1. The revenue is real. Annualized revenue is about $190 million. Compared with a $1.2 billion market cap, that means the market cap is a little over 6 times annualized revenue—not expensive.
2. No unlocks, combined with ongoing buybacks, means supply is relatively tight.
Bear Case
1. Revenue over the past 30 days was about $13.6 million, or about $165 million annualized—already below the past year's average, suggesting revenue is slowing.
2. Buybacks are relatively small compared with the market cap and need USDS supply growth to scale up. When the price falls, buybacks provide only a limited cushion against selling pressure.
My Take
I'll be watching Sky's 30-day revenue on DefiLlama. If it returns to above $15 million in the coming weeks, concerns about slowing revenue will ease. If it falls below $12 million, the first point in the bear case will be confirmed.
Data sources: CoinGecko, DefiLlama. Date checked: 2026-11-18.
Personal opinions and information summary; not investment advice. DYOR.
$SKY
Revenue and Value Capture
According to DefiLlama, Sky's TVL is about $3.6 billion. Protocol revenue was about $13.6 million over the past 30 days and about $189 million over the past year. Revenue mainly comes from stability fees on vault borrowing and yields from RWA Treasury investments.
SKY is used for governance and can also be staked to earn rewards. Surplus funds are used to provide staking rewards and buy back SKY on the market. Reportedly, cumulative buybacks have exceeded $26 million. I couldn't verify this on the official site, so treat it as a reference only.
Tokenomics
According to CoinGecko, SKY's circulating supply is about 23.4 billion tokens, with a total supply of about 23.45 billion. Its circulating market cap is about $1.22 billion, nearly the same as its FDV. In other words, there are no major unlocks looming, which is uncommon among major DeFi tokens.
Bull Case
1. The revenue is real. Annualized revenue is about $190 million. Compared with a $1.2 billion market cap, that means the market cap is a little over 6 times annualized revenue—not expensive.
2. No unlocks, combined with ongoing buybacks, means supply is relatively tight.
Bear Case
1. Revenue over the past 30 days was about $13.6 million, or about $165 million annualized—already below the past year's average, suggesting revenue is slowing.
2. Buybacks are relatively small compared with the market cap and need USDS supply growth to scale up. When the price falls, buybacks provide only a limited cushion against selling pressure.
My Take
I'll be watching Sky's 30-day revenue on DefiLlama. If it returns to above $15 million in the coming weeks, concerns about slowing revenue will ease. If it falls below $12 million, the first point in the bear case will be confirmed.
Data sources: CoinGecko, DefiLlama. Date checked: 2026-11-18.
Personal opinions and information summary; not investment advice. DYOR.
$SKY

350
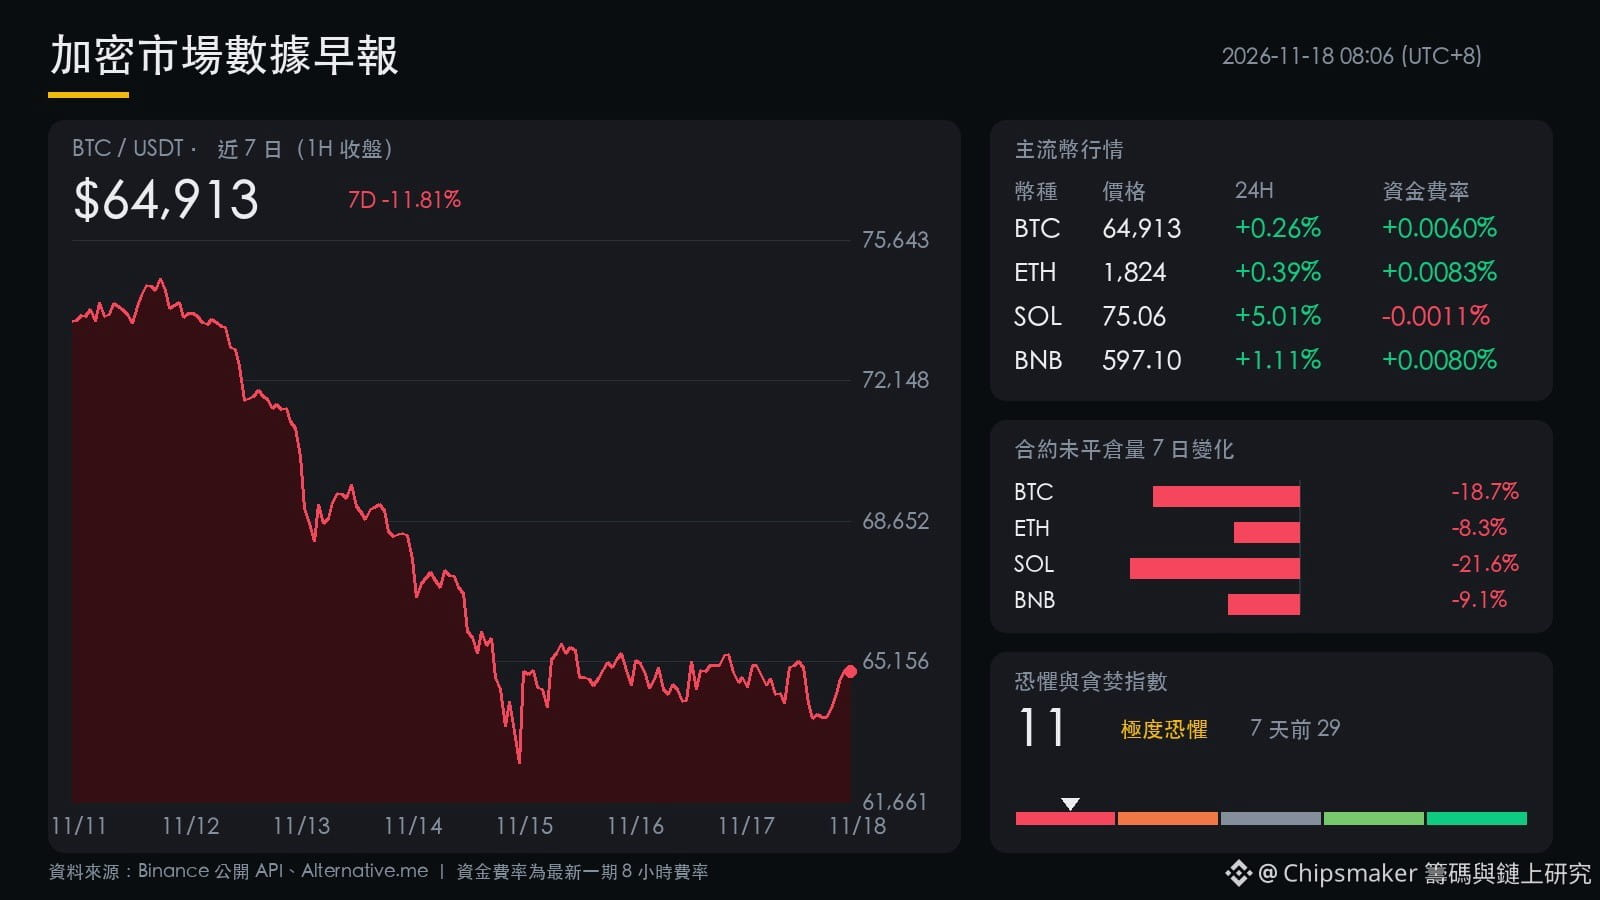
Fear is at 11, but prices aren’t making new lows: today feels like a pause where the bears are running out of steam and the bulls haven’t returned yet.
Bitcoin is at 64,913, up 0.26% in 24 hours. It’s down 11.81% over the past 7 days, with a range high of 74,679 and a low of 62,625. The current price is just a short distance above the low, and the rebound has been limited.
The clearest signal is open interest. Bitcoin futures open interest fell 18.66% over 7 days and another 0.49% in 24 hours. That’s leverage exiting, not new money piling into shorts. SOL’s open interest contracted 21.65% over 7 days, an even bigger drop.
Funding rates are fairly neutral. Bitcoin is at 0.006% and Ethereum at 0.0083%, with no crowding on the long side. SOL is at -0.0011%, giving shorts a slight edge, but SOL is up 5.01% today, so short positions may be forced to cover.
As for sentiment, the Fear & Greed Index is at 11, down from 29 a week ago. That’s an 18-point drop in a week, putting it firmly in the Extreme Fear zone. Data from Alternative.me.
One thing to watch today: can Bitcoin hold 62,625? If it does, the 7-day low could become a short-term bottom. If it breaks below, leverage that was just cleared out may have to be flushed again.
Data sources: Binance public API / Alternative.me.
Personal views and information summary only; not investment advice. DYOR.
$BTC $SOL
Fear is at 11, but prices aren’t making new lows: today feels like a pause where the bears are running out of steam and the bulls haven’t returned yet.
Bitcoin is at 64,913, up 0.26% in 24 hours. It’s down 11.81% over the past 7 days, with a range high of 74,679 and a low of 62,625. The current price is just a short distance above the low, and the rebound has been limited.
The clearest signal is open interest. Bitcoin futures open interest fell 18.66% over 7 days and another 0.49% in 24 hours. That’s leverage exiting, not new money piling into shorts. SOL’s open interest contracted 21.65% over 7 days, an even bigger drop.
Funding rates are fairly neutral. Bitcoin is at 0.006% and Ethereum at 0.0083%, with no crowding on the long side. SOL is at -0.0011%, giving shorts a slight edge, but SOL is up 5.01% today, so short positions may be forced to cover.
As for sentiment, the Fear & Greed Index is at 11, down from 29 a week ago. That’s an 18-point drop in a week, putting it firmly in the Extreme Fear zone. Data from Alternative.me.
One thing to watch today: can Bitcoin hold 62,625? If it does, the 7-day low could become a short-term bottom. If it breaks below, leverage that was just cleared out may have to be flushed again.
Data sources: Binance public API / Alternative.me.
Personal views and information summary only; not investment advice. DYOR.
$BTC $SOL
Bitcoin is at 64,913, up 0.26% in 24 hours. It’s down 11.81% over the past 7 days, with a range high of 74,679 and a low of 62,625. The current price is just a short distance above the low, and the rebound has been limited.
The clearest signal is open interest. Bitcoin futures open interest fell 18.66% over 7 days and another 0.49% in 24 hours. That’s leverage exiting, not new money piling into shorts. SOL’s open interest contracted 21.65% over 7 days, an even bigger drop.
Funding rates are fairly neutral. Bitcoin is at 0.006% and Ethereum at 0.0083%, with no crowding on the long side. SOL is at -0.0011%, giving shorts a slight edge, but SOL is up 5.01% today, so short positions may be forced to cover.
As for sentiment, the Fear & Greed Index is at 11, down from 29 a week ago. That’s an 18-point drop in a week, putting it firmly in the Extreme Fear zone. Data from Alternative.me.
One thing to watch today: can Bitcoin hold 62,625? If it does, the 7-day low could become a short-term bottom. If it breaks below, leverage that was just cleared out may have to be flushed again.
Data sources: Binance public API / Alternative.me.
Personal views and information summary only; not investment advice. DYOR.
$BTC $SOL
1
415
I took a look at Binance spot prices late at night. ETH was down about 3.39% over 24 hours to $1,759, a steeper drop than BTC’s 1.57%.
My take is that ETH takes a bigger hit than BTC every time the market pulls back, and right now the market still seems to favor sticking with the big brother first.
Will you keep holding the ETH you have, or swap some of it for BTC while you wait to see which way the wind blows?
Not investment advice. Please assess the risks for yourself.
$ETH $BTC
I took a look at Binance spot prices late at night. ETH was down about 3.39% over 24 hours to $1,759, a steeper drop than BTC’s 1.57%.
My take is that ETH takes a bigger hit than BTC every time the market pulls back, and right now the market still seems to favor sticking with the big brother first.
Will you keep holding the ETH you have, or swap some of it for BTC while you wait to see which way the wind blows?
Not investment advice. Please assess the risks for yourself.
$ETH $BTC
My take is that ETH takes a bigger hit than BTC every time the market pulls back, and right now the market still seems to favor sticking with the big brother first.
Will you keep holding the ETH you have, or swap some of it for BTC while you wait to see which way the wind blows?
Not investment advice. Please assess the risks for yourself.
$ETH $BTC
98
Why, when BTC is quoted at one price, can the average execution price for a large order be worse?
The answer is order book depth and slippage.
An order book is a queue of limit orders. Sell orders are arranged from lowest to highest, and buy orders from highest to lowest. When you place a market buy order, it takes the cheapest sell orders first, then moves up to the next price level.
Think of it this way: there are only three baskets of cheap tomatoes left at the market, but you want to buy ten. You’ll have to pay a higher price for the remaining seven baskets. The more you buy, the higher your average cost. That difference is slippage.
Depth is the amount of volume available at each price level. When the book is deep, a large order moves the price only a little. When it’s thin, the same order can push the price much further.
Here’s an example. According to Binance spot market data, BTC is quoted at around $64,932, with about $1.72 billion in 24-hour trading volume. ETH is around $1,822, with about $590 million in volume. SOL is around $73.71, with about $215 million in volume.
Lower trading volume usually means fewer orders on the book. A market order of the same size will often experience more noticeable slippage on a smaller coin. The actual difference depends on the order book at the time you place your order—I won’t guess for you.
A common misconception is that high trading volume means there will never be slippage. In reality, depth changes. When news breaks or the market moves sharply, market makers often pull their orders, and a book that was deep can quickly become thin.
The right approach is to check the depth before placing a large order, use limit orders, or enter in batches.
In short: the quoted price is just a starting point. Your execution price depends on how deep the order book is.
Personal opinion and information summary, not investment advice. DYOR.
$BTC $ETH $SOL
Why, when BTC is quoted at one price, can the average execution price for a large order be worse?
The answer is order book depth and slippage.
An order book is a queue of limit orders. Sell orders are arranged from lowest to highest, and buy orders from highest to lowest. When you place a market buy order, it takes the cheapest sell orders first, then moves up to the next price level.
Think of it this way: there are only three baskets of cheap tomatoes left at the market, but you want to buy ten. You’ll have to pay a higher price for the remaining seven baskets. The more you buy, the higher your average cost. That difference is slippage.
Depth is the amount of volume available at each price level. When the book is deep, a large order moves the price only a little. When it’s thin, the same order can push the price much further.
Here’s an example. According to Binance spot market data, BTC is quoted at around $64,932, with about $1.72 billion in 24-hour trading volume. ETH is around $1,822, with about $590 million in volume. SOL is around $73.71, with about $215 million in volume.
Lower trading volume usually means fewer orders on the book. A market order of the same size will often experience more noticeable slippage on a smaller coin. The actual difference depends on the order book at the time you place your order—I won’t guess for you.
A common misconception is that high trading volume means there will never be slippage. In reality, depth changes. When news breaks or the market moves sharply, market makers often pull their orders, and a book that was deep can quickly become thin.
The right approach is to check the depth before placing a large order, use limit orders, or enter in batches.
In short: the quoted price is just a starting point. Your execution price depends on how deep the order book is.
Personal opinion and information summary, not investment advice. DYOR.
$BTC $ETH $SOL
The answer is order book depth and slippage.
An order book is a queue of limit orders. Sell orders are arranged from lowest to highest, and buy orders from highest to lowest. When you place a market buy order, it takes the cheapest sell orders first, then moves up to the next price level.
Think of it this way: there are only three baskets of cheap tomatoes left at the market, but you want to buy ten. You’ll have to pay a higher price for the remaining seven baskets. The more you buy, the higher your average cost. That difference is slippage.
Depth is the amount of volume available at each price level. When the book is deep, a large order moves the price only a little. When it’s thin, the same order can push the price much further.
Here’s an example. According to Binance spot market data, BTC is quoted at around $64,932, with about $1.72 billion in 24-hour trading volume. ETH is around $1,822, with about $590 million in volume. SOL is around $73.71, with about $215 million in volume.
Lower trading volume usually means fewer orders on the book. A market order of the same size will often experience more noticeable slippage on a smaller coin. The actual difference depends on the order book at the time you place your order—I won’t guess for you.
A common misconception is that high trading volume means there will never be slippage. In reality, depth changes. When news breaks or the market moves sharply, market makers often pull their orders, and a book that was deep can quickly become thin.
The right approach is to check the depth before placing a large order, use limit orders, or enter in batches.
In short: the quoted price is just a starting point. Your execution price depends on how deep the order book is.
Personal opinion and information summary, not investment advice. DYOR.
$BTC $ETH $SOL
247
A state charter alone isn’t enough to connect directly to the Federal Reserve’s payment system.
On November 16, the U.S. Supreme Court declined to hear Custodia’s appeal. The Wyoming-chartered crypto bank has been seeking a Federal Reserve master account since 2020 and has been fighting in court ever since the Federal Reserve Bank of Kansas City rejected its application. According to BlockTempo, the lower court ruling now stands: regional Reserve Banks have the authority to decide for themselves whether to grant access.
This means crypto banks will still have to rely on traditional banks as intermediaries to access dollar clearing in the near term. The impact on BTC is limited; this is a long-term institutional development, not a price catalyst.
My take: Watch over the next few months to see whether any other crypto banks or stablecoin issuers obtain limited Federal Reserve accounts. If they do, that would signal a shift; if not, institutions will continue entering the market through ETFs and custody services.
Personal views and information summary, not investment advice. DYOR.
$BTC
A state charter alone isn’t enough to connect directly to the Federal Reserve’s payment system.
On November 16, the U.S. Supreme Court declined to hear Custodia’s appeal. The Wyoming-chartered crypto bank has been seeking a Federal Reserve master account since 2020 and has been fighting in court ever since the Federal Reserve Bank of Kansas City rejected its application. According to BlockTempo, the lower court ruling now stands: regional Reserve Banks have the authority to decide for themselves whether to grant access.
This means crypto banks will still have to rely on traditional banks as intermediaries to access dollar clearing in the near term. The impact on BTC is limited; this is a long-term institutional development, not a price catalyst.
My take: Watch over the next few months to see whether any other crypto banks or stablecoin issuers obtain limited Federal Reserve accounts. If they do, that would signal a shift; if not, institutions will continue entering the market through ETFs and custody services.
Personal views and information summary, not investment advice. DYOR.
$BTC
On November 16, the U.S. Supreme Court declined to hear Custodia’s appeal. The Wyoming-chartered crypto bank has been seeking a Federal Reserve master account since 2020 and has been fighting in court ever since the Federal Reserve Bank of Kansas City rejected its application. According to BlockTempo, the lower court ruling now stands: regional Reserve Banks have the authority to decide for themselves whether to grant access.
This means crypto banks will still have to rely on traditional banks as intermediaries to access dollar clearing in the near term. The impact on BTC is limited; this is a long-term institutional development, not a price catalyst.
My take: Watch over the next few months to see whether any other crypto banks or stablecoin issuers obtain limited Federal Reserve accounts. If they do, that would signal a shift; if not, institutions will continue entering the market through ETFs and custody services.
Personal views and information summary, not investment advice. DYOR.
$BTC
88
A quick look at 6 p.m.: Bitcoin has moved just 0.03% in the past 24 hours, hovering around $64,000. Ethereum is at about $1,810, up 0.6% (according to Binance spot data).
BTC trading volume is about $1.7 billion. With volume this low, I think it’s more like the market is waiting for the next piece of news—not that nobody wants to make a move.
For your current positions, are you planning to wait for a breakout before following along, or have you already set your price and are waiting for a pullback?
Not investment advice. Please assess the risks for yourself.
$BTC $ETH
A quick look at 6 p.m.: Bitcoin has moved just 0.03% in the past 24 hours, hovering around $64,000. Ethereum is at about $1,810, up 0.6% (according to Binance spot data).
BTC trading volume is about $1.7 billion. With volume this low, I think it’s more like the market is waiting for the next piece of news—not that nobody wants to make a move.
For your current positions, are you planning to wait for a breakout before following along, or have you already set your price and are waiting for a pullback?
Not investment advice. Please assess the risks for yourself.
$BTC $ETH
BTC trading volume is about $1.7 billion. With volume this low, I think it’s more like the market is waiting for the next piece of news—not that nobody wants to make a move.
For your current positions, are you planning to wait for a breakout before following along, or have you already set your price and are waiting for a pullback?
Not investment advice. Please assess the risks for yourself.
$BTC $ETH
1
266
Hyperliquid is an on-chain perpetuals exchange. HYPE is up about 6% over the past 24 hours on Binance Spot today, trading at around $70, so let’s break it down.
Revenue and value capture
HYPE is the native asset of the Hyperliquid chain, used for gas, staking, and fee discounts.
The protocol earns money from perpetuals trading fees. According to Hyperliquid’s official documentation, most fees go into the Assistance Fund, which buys back HYPE on the market.
According to public data-tracking pages, cumulative revenue has exceeded $1.4 billion, with recent monthly revenue generally between $70 million and $90 million. This is real revenue, and it flows back into the token.
Tokenomics
The maximum supply is 1 billion tokens. At the current price, FDV is about $70 billion, in line with figures from CoinGecko and Tokenomist.
Circulating supply figures vary by source, ranging from about 240 million to 300 million tokens, putting circulating market cap at around $17 billion to $21 billion.
About 50 million tokens have been burned to date, or roughly 5% of the maximum supply (based on public data; figures vary by source).
Unlocks happen monthly, and individual unlocks are reportedly on the scale of tens of millions of tokens. Check Tokenomist for exact dates; I won’t state them here.
Two bullish points
1. Revenue is real, and buybacks are ongoing. Few protocols can turn fees into buying pressure in a bear market.
2. Trading volume rises on volatile days, and protocol revenue rises with it.
Two bearish points
1. FDV is 3 to 4 times the circulating market cap. Ongoing unlocks mean ongoing selling pressure, which buybacks first have to absorb.
2. Revenue depends heavily on perpetuals trading volume. When the market cools, monthly revenue will shrink, and buyback power will fall with it.
My conclusion
I’d watch the monthly buyback amount as a proportion of the market value of tokens unlocked that month. If it stays below 1 over the long term, it means buybacks can’t absorb the unlocks, and the valuation will have to be propped up by a story.
Personal opinions and information summary, not investment advice. DYOR.
$HYPE
Hyperliquid is an on-chain perpetuals exchange. HYPE is up about 6% over the past 24 hours on Binance Spot today, trading at around $70, so let’s break it down.
Revenue and value capture
HYPE is the native asset of the Hyperliquid chain, used for gas, staking, and fee discounts.
The protocol earns money from perpetuals trading fees. According to Hyperliquid’s official documentation, most fees go into the Assistance Fund, which buys back HYPE on the market.
According to public data-tracking pages, cumulative revenue has exceeded $1.4 billion, with recent monthly revenue generally between $70 million and $90 million. This is real revenue, and it flows back into the token.
Tokenomics
The maximum supply is 1 billion tokens. At the current price, FDV is about $70 billion, in line with figures from CoinGecko and Tokenomist.
Circulating supply figures vary by source, ranging from about 240 million to 300 million tokens, putting circulating market cap at around $17 billion to $21 billion.
About 50 million tokens have been burned to date, or roughly 5% of the maximum supply (based on public data; figures vary by source).
Unlocks happen monthly, and individual unlocks are reportedly on the scale of tens of millions of tokens. Check Tokenomist for exact dates; I won’t state them here.
Two bullish points
1. Revenue is real, and buybacks are ongoing. Few protocols can turn fees into buying pressure in a bear market.
2. Trading volume rises on volatile days, and protocol revenue rises with it.
Two bearish points
1. FDV is 3 to 4 times the circulating market cap. Ongoing unlocks mean ongoing selling pressure, which buybacks first have to absorb.
2. Revenue depends heavily on perpetuals trading volume. When the market cools, monthly revenue will shrink, and buyback power will fall with it.
My conclusion
I’d watch the monthly buyback amount as a proportion of the market value of tokens unlocked that month. If it stays below 1 over the long term, it means buybacks can’t absorb the unlocks, and the valuation will have to be propped up by a story.
Personal opinions and information summary, not investment advice. DYOR.
$HYPE
Revenue and value capture
HYPE is the native asset of the Hyperliquid chain, used for gas, staking, and fee discounts.
The protocol earns money from perpetuals trading fees. According to Hyperliquid’s official documentation, most fees go into the Assistance Fund, which buys back HYPE on the market.
According to public data-tracking pages, cumulative revenue has exceeded $1.4 billion, with recent monthly revenue generally between $70 million and $90 million. This is real revenue, and it flows back into the token.
Tokenomics
The maximum supply is 1 billion tokens. At the current price, FDV is about $70 billion, in line with figures from CoinGecko and Tokenomist.
Circulating supply figures vary by source, ranging from about 240 million to 300 million tokens, putting circulating market cap at around $17 billion to $21 billion.
About 50 million tokens have been burned to date, or roughly 5% of the maximum supply (based on public data; figures vary by source).
Unlocks happen monthly, and individual unlocks are reportedly on the scale of tens of millions of tokens. Check Tokenomist for exact dates; I won’t state them here.
Two bullish points
1. Revenue is real, and buybacks are ongoing. Few protocols can turn fees into buying pressure in a bear market.
2. Trading volume rises on volatile days, and protocol revenue rises with it.
Two bearish points
1. FDV is 3 to 4 times the circulating market cap. Ongoing unlocks mean ongoing selling pressure, which buybacks first have to absorb.
2. Revenue depends heavily on perpetuals trading volume. When the market cools, monthly revenue will shrink, and buyback power will fall with it.
My conclusion
I’d watch the monthly buyback amount as a proportion of the market value of tokens unlocked that month. If it stays below 1 over the long term, it means buybacks can’t absorb the unlocks, and the valuation will have to be propped up by a story.
Personal opinions and information summary, not investment advice. DYOR.
$HYPE
75
A user says their account on Aster DEX was drained without them signing any transactions.
According to BlockTempo, the user alleged that on November 12, over a 44-minute period, 33 BTC in their account were sold off in batches, and about $4.56 million in USDT was transferred to an unknown account. They said their private key was not compromised, and all the signatures pointed to the system’s default “delegate key.”
For now, this is only the user’s account of events, along with on-chain screenshots. Aster has reportedly set up an investigation team, but no official report has been released yet.
My take: If true, this points to a permissions-design issue, not an isolated incident. Delegate keys are meant to make order placement smoother, but overly broad permissions can turn them into a backdoor. The risk for ASTER now is a trust discount. We’ll have to see what the official investigation finds and whether compensation is offered.
What to watch: If there’s no official report or compensation announcement within a week, I’ll consider this an unresolved risk.
Personal opinion and information summary, not investment advice. DYOR.
$ASTER $BTC
A user says their account on Aster DEX was drained without them signing any transactions.
According to BlockTempo, the user alleged that on November 12, over a 44-minute period, 33 BTC in their account were sold off in batches, and about $4.56 million in USDT was transferred to an unknown account. They said their private key was not compromised, and all the signatures pointed to the system’s default “delegate key.”
For now, this is only the user’s account of events, along with on-chain screenshots. Aster has reportedly set up an investigation team, but no official report has been released yet.
My take: If true, this points to a permissions-design issue, not an isolated incident. Delegate keys are meant to make order placement smoother, but overly broad permissions can turn them into a backdoor. The risk for ASTER now is a trust discount. We’ll have to see what the official investigation finds and whether compensation is offered.
What to watch: If there’s no official report or compensation announcement within a week, I’ll consider this an unresolved risk.
Personal opinion and information summary, not investment advice. DYOR.
$ASTER $BTC
According to BlockTempo, the user alleged that on November 12, over a 44-minute period, 33 BTC in their account were sold off in batches, and about $4.56 million in USDT was transferred to an unknown account. They said their private key was not compromised, and all the signatures pointed to the system’s default “delegate key.”
For now, this is only the user’s account of events, along with on-chain screenshots. Aster has reportedly set up an investigation team, but no official report has been released yet.
My take: If true, this points to a permissions-design issue, not an isolated incident. Delegate keys are meant to make order placement smoother, but overly broad permissions can turn them into a backdoor. The risk for ASTER now is a trust discount. We’ll have to see what the official investigation finds and whether compensation is offered.
What to watch: If there’s no official report or compensation announcement within a week, I’ll consider this an unresolved risk.
Personal opinion and information summary, not investment advice. DYOR.
$ASTER $BTC
126
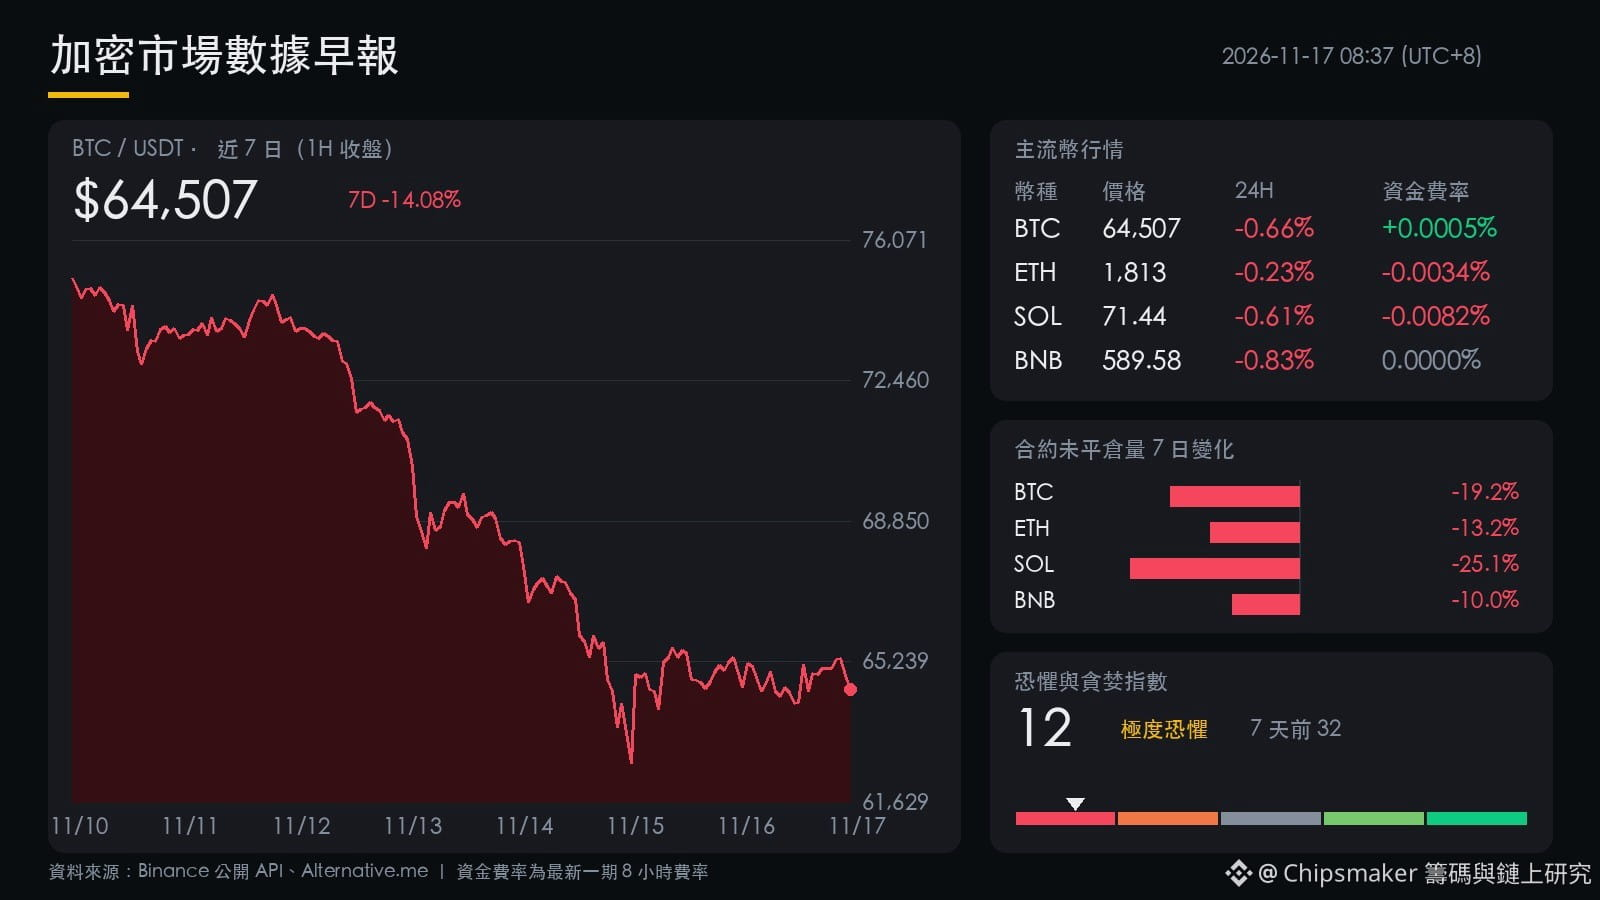
After a week of leverage being flushed from the market, trading has entered a low-volume sideways phase. Following the sharp drop, positions are now being consolidated. Bearish selling pressure is easing, but spot buyers are still sitting on the sidelines.
According to public Binance API data, BTC is currently at $64,507, down slightly by 0.66% over the past 24 hours. It has fallen 14.08% over the past 7 days, trading between a high of $75,075 and a low of $62,625. Major altcoins are also moving in a narrow range: ETH is at $1,813 (down 0.23%), SOL at $71.44 (down 0.61%), and BNB at $589.58 (down 0.83%).
Leverage in futures markets continues to unwind. BTC open interest (OI) has fallen to $6.003 billion, down another 1.74% in a day and 19.17% over 7 days. SOL has seen the sharpest deleveraging: its open interest is now $624 million, down 4.06% over 24 hours and 25.13% over 7 days.
Funding rates show a split between bulls and bears. BTC's latest 8-hour rate remains slightly positive at 0.0005%, while BNB's rate is flat at 0%. By contrast, rates for ETH (-0.0034%) and SOL (-0.0082%) have both turned negative. This suggests some short-term futures traders are betting against weaker coins, while also adding fuel for a potential short squeeze.
According to Alternative.me, the Fear and Greed Index has plunged from 32 a week ago to 12, deep in “Extreme Fear” territory, reflecting strong risk aversion among retail investors.
Today, keep a close eye on BTC's 7-day low of $62,625 as support, and whether SOL can hold its current price of $71.44 and rebound after its negative funding rate and significant decline in open interest.
Personal views and information summary only; not investment advice. DYOR.
$BTC $SOL #Market Data
After a week of leverage being flushed from the market, trading has entered a low-volume sideways phase. Following the sharp drop, positions are now being consolidated. Bearish selling pressure is easing, but spot buyers are still sitting on the sidelines.
According to public Binance API data, BTC is currently at $64,507, down slightly by 0.66% over the past 24 hours. It has fallen 14.08% over the past 7 days, trading between a high of $75,075 and a low of $62,625. Major altcoins are also moving in a narrow range: ETH is at $1,813 (down 0.23%), SOL at $71.44 (down 0.61%), and BNB at $589.58 (down 0.83%).
Leverage in futures markets continues to unwind. BTC open interest (OI) has fallen to $6.003 billion, down another 1.74% in a day and 19.17% over 7 days. SOL has seen the sharpest deleveraging: its open interest is now $624 million, down 4.06% over 24 hours and 25.13% over 7 days.
Funding rates show a split between bulls and bears. BTC's latest 8-hour rate remains slightly positive at 0.0005%, while BNB's rate is flat at 0%. By contrast, rates for ETH (-0.0034%) and SOL (-0.0082%) have both turned negative. This suggests some short-term futures traders are betting against weaker coins, while also adding fuel for a potential short squeeze.
According to Alternative.me, the Fear and Greed Index has plunged from 32 a week ago to 12, deep in “Extreme Fear” territory, reflecting strong risk aversion among retail investors.
Today, keep a close eye on BTC's 7-day low of $62,625 as support, and whether SOL can hold its current price of $71.44 and rebound after its negative funding rate and significant decline in open interest.
Personal views and information summary only; not investment advice. DYOR.
$BTC $SOL #Market Data
According to public Binance API data, BTC is currently at $64,507, down slightly by 0.66% over the past 24 hours. It has fallen 14.08% over the past 7 days, trading between a high of $75,075 and a low of $62,625. Major altcoins are also moving in a narrow range: ETH is at $1,813 (down 0.23%), SOL at $71.44 (down 0.61%), and BNB at $589.58 (down 0.83%).
Leverage in futures markets continues to unwind. BTC open interest (OI) has fallen to $6.003 billion, down another 1.74% in a day and 19.17% over 7 days. SOL has seen the sharpest deleveraging: its open interest is now $624 million, down 4.06% over 24 hours and 25.13% over 7 days.
Funding rates show a split between bulls and bears. BTC's latest 8-hour rate remains slightly positive at 0.0005%, while BNB's rate is flat at 0%. By contrast, rates for ETH (-0.0034%) and SOL (-0.0082%) have both turned negative. This suggests some short-term futures traders are betting against weaker coins, while also adding fuel for a potential short squeeze.
According to Alternative.me, the Fear and Greed Index has plunged from 32 a week ago to 12, deep in “Extreme Fear” territory, reflecting strong risk aversion among retail investors.
Today, keep a close eye on BTC's 7-day low of $62,625 as support, and whether SOL can hold its current price of $71.44 and rebound after its negative funding rate and significant decline in open interest.
Personal views and information summary only; not investment advice. DYOR.
$BTC $SOL #Market Data
3
Retail investors watch the day-to-day ups and downs in recent candlestick charts, while the records left behind by Wall Street giants reveal their quarterly positions.
As pessimism has spread through the market recently amid consecutive outflows from ETFs, the latest holdings report filed by Bank of America has revealed the true scale of traditional financial giants’ buying spree in the third quarter.
【BofA’s IBIT holdings surge 741%】
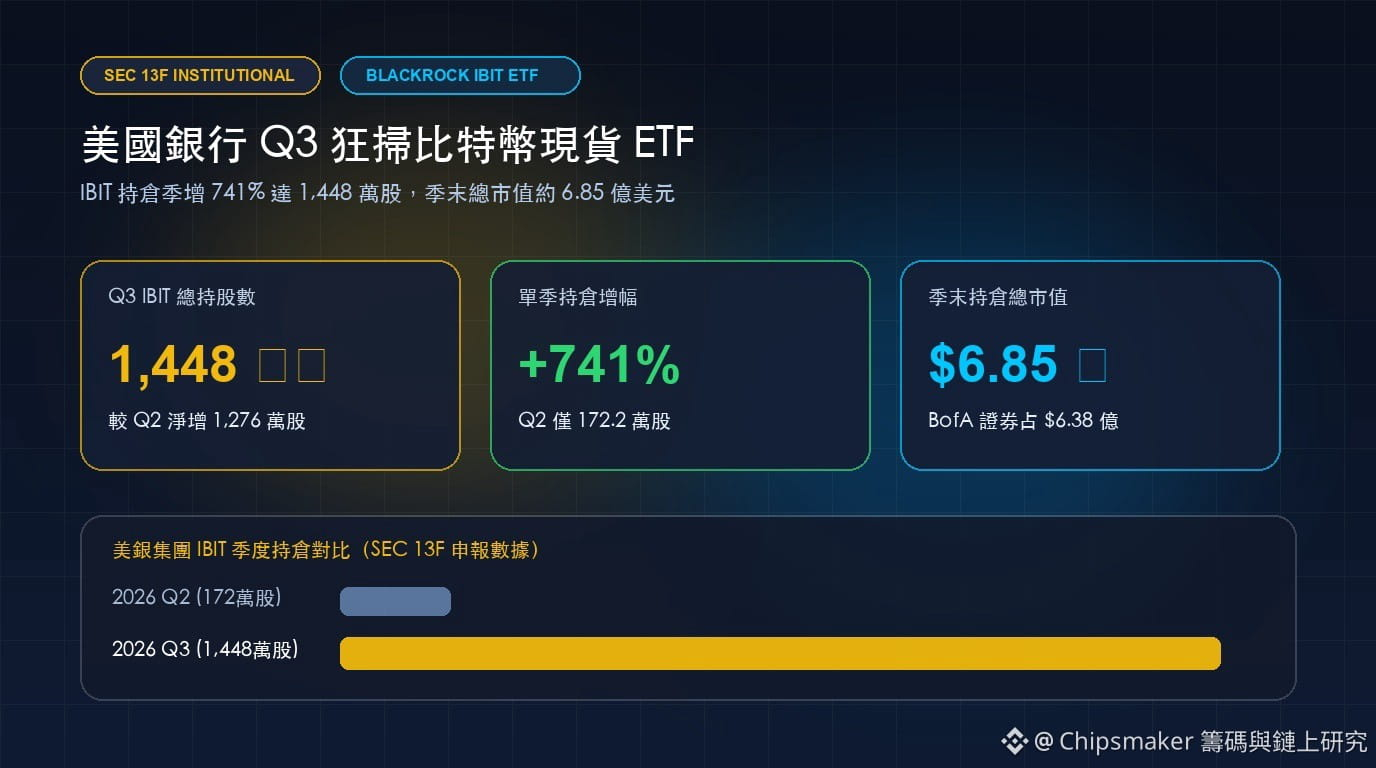
According to reports by BlockTempo and the 13F institutional holdings filing disclosed by the U.S. Securities and Exchange Commission (SEC) on November 16, as of September 30, 2026, Bank of America Corporation reported holding a total of 14,479,277 shares of BlackRock’s spot Bitcoin ETF (IBIT). The position had a market value of approximately $685 million at quarter-end.
Compared with the 1,721,943 shares reported at the end of the second quarter on June 30 this year, BofA increased its holdings by a net 12,757,334 shares in a single quarter—a 741% increase in the number of shares. A breakdown of the group’s holdings shows that the expansion was concentrated in its subsidiary BofA Securities, whose position surged from 743,000 shares at the end of the second quarter to 13.468 million shares, worth approximately $638 million. The remaining holdings were split between Bank of America itself (approximately 982,000 shares) and Merrill Lynch (approximately 28,000 shares).
【Distinguishing proprietary buying from market-making allocations】
A sevenfold increase in holdings should not be oversimplified as “the bank going all-in on a bullish bet with its own money.” Under SEC 13F filing rules, these figures include institutional positions over which the filer has investment discretion as well as client wealth-management accounts, and are highly concentrated in the brokerage division.
This has two practical implications for Bitcoin’s (BTC) supply-and-demand dynamics. First, BofA’s wealth-management channels and institutional clients are rapidly absorbing Bitcoin through regulated channels and incorporating it into standard portfolio allocations. Second, the surge in the brokerage division’s holdings also reflects a significant expansion in the inventory held by Wall Street firms acting as ETF authorized participants and market makers. According to Binance spot market data, BTC is currently fluctuating around $64,735. The two-way liquidity pool traditional brokerages have built between $60,000 and $70,000 has objectively raised the floor for long-term holdings.
【Lagging indicators versus current-quarter flows】
It is important to recognize that the 13F report is a static snapshot from the end of the third quarter, with a time lag of approximately 45 days. Since November began, the 10-year U.S. Treasury yield has climbed above 5.1%, leading to a period of capital adjustments in spot ETFs.
Therefore, the key indicator for determining whether this institutional buying is weakening is whether IBIT’s daily flows can turn positive this week as BTC retests the $64,000 level. If IBIT stabilizes and sees net inflows again after the Federal Reserve minutes are released this week, that would indicate that Wall Street wealth-management clients are still buying the dip. Conversely, if outflows intensify, it would suggest that some brokerage market-making and hedging positions are being deleveraged in line with the trend.
These are personal views and do not constitute investment advice.
$BTC
Retail investors watch the day-to-day ups and downs in recent candlestick charts, while the records left behind by Wall Street giants reveal their quarterly positions.
As pessimism has spread through the market recently amid consecutive outflows from ETFs, the latest holdings report filed by Bank of America has revealed the true scale of traditional financial giants’ buying spree in the third quarter.
【BofA’s IBIT holdings surge 741%】
According to reports by BlockTempo and the 13F institutional holdings filing disclosed by the U.S. Securities and Exchange Commission (SEC) on November 16, as of September 30, 2026, Bank of America Corporation reported holding a total of 14,479,277 shares of BlackRock’s spot Bitcoin ETF (IBIT). The position had a market value of approximately $685 million at quarter-end.
Compared with the 1,721,943 shares reported at the end of the second quarter on June 30 this year, BofA increased its holdings by a net 12,757,334 shares in a single quarter—a 741% increase in the number of shares. A breakdown of the group’s holdings shows that the expansion was concentrated in its subsidiary BofA Securities, whose position surged from 743,000 shares at the end of the second quarter to 13.468 million shares, worth approximately $638 million. The remaining holdings were split between Bank of America itself (approximately 982,000 shares) and Merrill Lynch (approximately 28,000 shares).
【Distinguishing proprietary buying from market-making allocations】
A sevenfold increase in holdings should not be oversimplified as “the bank going all-in on a bullish bet with its own money.” Under SEC 13F filing rules, these figures include institutional positions over which the filer has investment discretion as well as client wealth-management accounts, and are highly concentrated in the brokerage division.
This has two practical implications for Bitcoin’s (BTC) supply-and-demand dynamics. First, BofA’s wealth-management channels and institutional clients are rapidly absorbing Bitcoin through regulated channels and incorporating it into standard portfolio allocations. Second, the surge in the brokerage division’s holdings also reflects a significant expansion in the inventory held by Wall Street firms acting as ETF authorized participants and market makers. According to Binance spot market data, BTC is currently fluctuating around $64,735. The two-way liquidity pool traditional brokerages have built between $60,000 and $70,000 has objectively raised the floor for long-term holdings.
【Lagging indicators versus current-quarter flows】
It is important to recognize that the 13F report is a static snapshot from the end of the third quarter, with a time lag of approximately 45 days. Since November began, the 10-year U.S. Treasury yield has climbed above 5.1%, leading to a period of capital adjustments in spot ETFs.
Therefore, the key indicator for determining whether this institutional buying is weakening is whether IBIT’s daily flows can turn positive this week as BTC retests the $64,000 level. If IBIT stabilizes and sees net inflows again after the Federal Reserve minutes are released this week, that would indicate that Wall Street wealth-management clients are still buying the dip. Conversely, if outflows intensify, it would suggest that some brokerage market-making and hedging positions are being deleveraged in line with the trend.
These are personal views and do not constitute investment advice.
$BTC
As pessimism has spread through the market recently amid consecutive outflows from ETFs, the latest holdings report filed by Bank of America has revealed the true scale of traditional financial giants’ buying spree in the third quarter.
【BofA’s IBIT holdings surge 741%】
According to reports by BlockTempo and the 13F institutional holdings filing disclosed by the U.S. Securities and Exchange Commission (SEC) on November 16, as of September 30, 2026, Bank of America Corporation reported holding a total of 14,479,277 shares of BlackRock’s spot Bitcoin ETF (IBIT). The position had a market value of approximately $685 million at quarter-end.
Compared with the 1,721,943 shares reported at the end of the second quarter on June 30 this year, BofA increased its holdings by a net 12,757,334 shares in a single quarter—a 741% increase in the number of shares. A breakdown of the group’s holdings shows that the expansion was concentrated in its subsidiary BofA Securities, whose position surged from 743,000 shares at the end of the second quarter to 13.468 million shares, worth approximately $638 million. The remaining holdings were split between Bank of America itself (approximately 982,000 shares) and Merrill Lynch (approximately 28,000 shares).
【Distinguishing proprietary buying from market-making allocations】
A sevenfold increase in holdings should not be oversimplified as “the bank going all-in on a bullish bet with its own money.” Under SEC 13F filing rules, these figures include institutional positions over which the filer has investment discretion as well as client wealth-management accounts, and are highly concentrated in the brokerage division.
This has two practical implications for Bitcoin’s (BTC) supply-and-demand dynamics. First, BofA’s wealth-management channels and institutional clients are rapidly absorbing Bitcoin through regulated channels and incorporating it into standard portfolio allocations. Second, the surge in the brokerage division’s holdings also reflects a significant expansion in the inventory held by Wall Street firms acting as ETF authorized participants and market makers. According to Binance spot market data, BTC is currently fluctuating around $64,735. The two-way liquidity pool traditional brokerages have built between $60,000 and $70,000 has objectively raised the floor for long-term holdings.
【Lagging indicators versus current-quarter flows】
It is important to recognize that the 13F report is a static snapshot from the end of the third quarter, with a time lag of approximately 45 days. Since November began, the 10-year U.S. Treasury yield has climbed above 5.1%, leading to a period of capital adjustments in spot ETFs.
Therefore, the key indicator for determining whether this institutional buying is weakening is whether IBIT’s daily flows can turn positive this week as BTC retests the $64,000 level. If IBIT stabilizes and sees net inflows again after the Federal Reserve minutes are released this week, that would indicate that Wall Street wealth-management clients are still buying the dip. Conversely, if outflows intensify, it would suggest that some brokerage market-making and hedging positions are being deleveraged in line with the trend.
These are personal views and do not constitute investment advice.
$BTC
67
On a charting platform, when a high-volume long bearish candle crashes through a key moving average, most people’s instinctive reaction isn’t to assess the structure clearly, but to immediately calculate “how far it’s fallen from the high, and how much I could make if I buy now and it rebounds 5%.” Only after getting trapped in a position do they realize that what they called support has long since become a heavy overhead resistance zone full of underwater holders.
After a breakdown, until price reclaims the structure, treat a rebound primarily as an opportunity to reduce positions, not as a signal to add to them.
The psychology behind this is “loss aversion” and “anchoring to a reference point.” Traders’ brains tend to treat the price level where the market consolidated before breaking down as fair value. Once the price falls below it, it can create the visual illusion of a “discount.” But looking at the supply-and-demand dynamics of the order book, suppose a certain level originally had $50 million in buy orders and long positions. If price breaks below it on high volume and stays beneath it, those $50 million in long positions are all underwater. When price rebounds to the original level, sell orders from holders eager to “break even and get out” will alone form a natural wall of supply.
Let’s check this using expected value: suppose the win rate for going long in a with-trend support zone is 55%, with a reward-to-risk ratio of 2 (make $200, lose $100). The expected value per trade is `0.55 × 200 - 0.45 × 100 = +65` dollars. But if you try to catch a falling knife and bet on a rebound in a bearish structure that has broken down, with overhead resistance packed with sellers looking to break even, the win rate often falls below 30%. The rebound is also likely to stall at the previous low, shrinking the reward-to-risk ratio to 0.8 (make $80, lose $100). The expected value per trade then becomes `0.30 × 80 - 0.70 × 100 = -46` dollars. Repeating this over the long term will only slowly eat away at your capital.
To avoid false-rebound traps during a breakdown, you can take these four practical steps:
- First, draw a “bull-bear flip line”: When a high-volume trading zone on the daily or 4-hour chart is broken by a long bearish candle, immediately redraw that line from green support to red resistance, forcing yourself to shift your visual perspective between bullish and bearish.
- Set a two-part confirmation rule: “reclaim, then retest.” Don’t buy the first lower wick after a breakdown. Require price to first close back above the former support on high volume, then hold it on the next pullback, before entering a trial position with half your originally planned size.
- Check the volume ratio: Watch the volume on rebound candles. Suppose the 4-hour trading volume during the breakdown sell-off was $300 million, while the subsequent rebound was only $80 million (less than a third of the sell-off volume). That indicates short covering rather than accumulation by major players, so chasing the price is strictly off-limits.
- Reduce leverage on trapped positions during a rebound: If you still have long positions without stop-losses when a breakdown occurs, reduce your position by 50% without exception when the rebound reaches the former support level, bringing your margin ratio back to a safe level. Give up the wishful thinking of “waiting until I can exit with a small profit.”
As an example of current market conditions: according to Binance spot market data, Bitcoin recently broke below $70,000 and is now fluctuating around $64,735, while Ethereum is also trading around $1,818. The $68,000–$70,000 zone, which previously saw heavy trading, has now accumulated a large number of short-term holders waiting to break even. Until we see a high-volume recovery, treating every low-volume rebound as a test of resistance is much safer than blindly trying to call the bottom.
There will always be another train. Keeping your capital in a clearly structured market moving in your favor is what gives you real options.
This is solely my personal analysis. Please do your own research before investing (DYOR).
$BTC $ETH
On a charting platform, when a high-volume long bearish candle crashes through a key moving average, most people’s instinctive reaction isn’t to assess the structure clearly, but to immediately calculate “how far it’s fallen from the high, and how much I could make if I buy now and it rebounds 5%.” Only after getting trapped in a position do they realize that what they called support has long since become a heavy overhead resistance zone full of underwater holders.
After a breakdown, until price reclaims the structure, treat a rebound primarily as an opportunity to reduce positions, not as a signal to add to them.
The psychology behind this is “loss aversion” and “anchoring to a reference point.” Traders’ brains tend to treat the price level where the market consolidated before breaking down as fair value. Once the price falls below it, it can create the visual illusion of a “discount.” But looking at the supply-and-demand dynamics of the order book, suppose a certain level originally had $50 million in buy orders and long positions. If price breaks below it on high volume and stays beneath it, those $50 million in long positions are all underwater. When price rebounds to the original level, sell orders from holders eager to “break even and get out” will alone form a natural wall of supply.
Let’s check this using expected value: suppose the win rate for going long in a with-trend support zone is 55%, with a reward-to-risk ratio of 2 (make $200, lose $100). The expected value per trade is `0.55 × 200 - 0.45 × 100 = +65` dollars. But if you try to catch a falling knife and bet on a rebound in a bearish structure that has broken down, with overhead resistance packed with sellers looking to break even, the win rate often falls below 30%. The rebound is also likely to stall at the previous low, shrinking the reward-to-risk ratio to 0.8 (make $80, lose $100). The expected value per trade then becomes `0.30 × 80 - 0.70 × 100 = -46` dollars. Repeating this over the long term will only slowly eat away at your capital.
To avoid false-rebound traps during a breakdown, you can take these four practical steps:
- First, draw a “bull-bear flip line”: When a high-volume trading zone on the daily or 4-hour chart is broken by a long bearish candle, immediately redraw that line from green support to red resistance, forcing yourself to shift your visual perspective between bullish and bearish.
- Set a two-part confirmation rule: “reclaim, then retest.” Don’t buy the first lower wick after a breakdown. Require price to first close back above the former support on high volume, then hold it on the next pullback, before entering a trial position with half your originally planned size.
- Check the volume ratio: Watch the volume on rebound candles. Suppose the 4-hour trading volume during the breakdown sell-off was $300 million, while the subsequent rebound was only $80 million (less than a third of the sell-off volume). That indicates short covering rather than accumulation by major players, so chasing the price is strictly off-limits.
- Reduce leverage on trapped positions during a rebound: If you still have long positions without stop-losses when a breakdown occurs, reduce your position by 50% without exception when the rebound reaches the former support level, bringing your margin ratio back to a safe level. Give up the wishful thinking of “waiting until I can exit with a small profit.”
As an example of current market conditions: according to Binance spot market data, Bitcoin recently broke below $70,000 and is now fluctuating around $64,735, while Ethereum is also trading around $1,818. The $68,000–$70,000 zone, which previously saw heavy trading, has now accumulated a large number of short-term holders waiting to break even. Until we see a high-volume recovery, treating every low-volume rebound as a test of resistance is much safer than blindly trying to call the bottom.
There will always be another train. Keeping your capital in a clearly structured market moving in your favor is what gives you real options.
This is solely my personal analysis. Please do your own research before investing (DYOR).
$BTC $ETH
After a breakdown, until price reclaims the structure, treat a rebound primarily as an opportunity to reduce positions, not as a signal to add to them.
The psychology behind this is “loss aversion” and “anchoring to a reference point.” Traders’ brains tend to treat the price level where the market consolidated before breaking down as fair value. Once the price falls below it, it can create the visual illusion of a “discount.” But looking at the supply-and-demand dynamics of the order book, suppose a certain level originally had $50 million in buy orders and long positions. If price breaks below it on high volume and stays beneath it, those $50 million in long positions are all underwater. When price rebounds to the original level, sell orders from holders eager to “break even and get out” will alone form a natural wall of supply.
Let’s check this using expected value: suppose the win rate for going long in a with-trend support zone is 55%, with a reward-to-risk ratio of 2 (make $200, lose $100). The expected value per trade is `0.55 × 200 - 0.45 × 100 = +65` dollars. But if you try to catch a falling knife and bet on a rebound in a bearish structure that has broken down, with overhead resistance packed with sellers looking to break even, the win rate often falls below 30%. The rebound is also likely to stall at the previous low, shrinking the reward-to-risk ratio to 0.8 (make $80, lose $100). The expected value per trade then becomes `0.30 × 80 - 0.70 × 100 = -46` dollars. Repeating this over the long term will only slowly eat away at your capital.
To avoid false-rebound traps during a breakdown, you can take these four practical steps:
- First, draw a “bull-bear flip line”: When a high-volume trading zone on the daily or 4-hour chart is broken by a long bearish candle, immediately redraw that line from green support to red resistance, forcing yourself to shift your visual perspective between bullish and bearish.
- Set a two-part confirmation rule: “reclaim, then retest.” Don’t buy the first lower wick after a breakdown. Require price to first close back above the former support on high volume, then hold it on the next pullback, before entering a trial position with half your originally planned size.
- Check the volume ratio: Watch the volume on rebound candles. Suppose the 4-hour trading volume during the breakdown sell-off was $300 million, while the subsequent rebound was only $80 million (less than a third of the sell-off volume). That indicates short covering rather than accumulation by major players, so chasing the price is strictly off-limits.
- Reduce leverage on trapped positions during a rebound: If you still have long positions without stop-losses when a breakdown occurs, reduce your position by 50% without exception when the rebound reaches the former support level, bringing your margin ratio back to a safe level. Give up the wishful thinking of “waiting until I can exit with a small profit.”
As an example of current market conditions: according to Binance spot market data, Bitcoin recently broke below $70,000 and is now fluctuating around $64,735, while Ethereum is also trading around $1,818. The $68,000–$70,000 zone, which previously saw heavy trading, has now accumulated a large number of short-term holders waiting to break even. Until we see a high-volume recovery, treating every low-volume rebound as a test of resistance is much safer than blindly trying to call the bottom.
There will always be another train. Keeping your capital in a clearly structured market moving in your favor is what gives you real options.
This is solely my personal analysis. Please do your own research before investing (DYOR).
$BTC $ETH
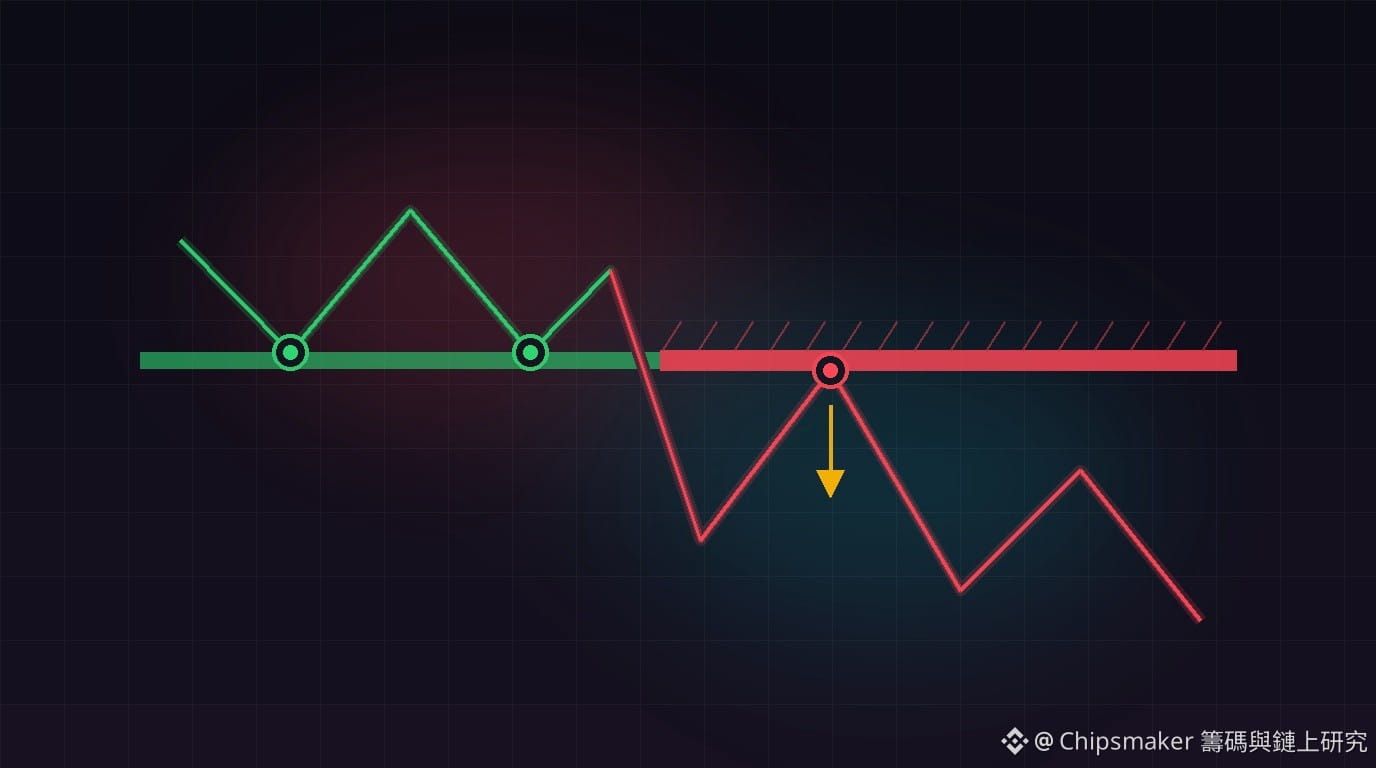
117
The central theme in this week's crypto market is whether capital is still willing to take risks amid the double pressure of “expectations of high interest rates” and “volatility in AI computing-power stocks.” According to reports from Dongqu and publicly available data, here are this week's key events:
- 11/16 (Monday) Token unlocks and governance vote: Arbitrum will unlock approximately $13.48 million (1.53% of circulating supply), while Cronos will unlock approximately $55.02 million. Also on this day, voting closes on an Arbitrum DAO proposal for approximately $25 million in compensation for a vulnerability, testing the market's ability to absorb short-term selling pressure.
- 11/17 (Tuesday) New Russian rules for retail crypto purchases and retail sales data: The Central Bank of Russia will allow non-qualified investors to buy BTC, ETH, and USDT through intermediaries, subject to annual limits. At 21:30, U.S. October retail sales will be released (forecast: 0% month over month; previous: 0.8%). A stronger-than-expected figure would deepen concerns about a December rate hike.
- 11/18 (Wednesday) Nvidia earnings and UK regulatory consultation: Nvidia's first earnings report since Jensen Huang stepped down as CEO is due early in the morning, with the market expecting earnings per share of $2.47. The results will directly affect the valuations of crypto miners transitioning to AI data centers. The UK's FCA consultation on crypto regulation also closes that day.
- 11/19 (Thursday) Federal Reserve FOMC meeting minutes: Minutes from the October meeting will be released at 03:00. The benchmark interest rate currently stands at 3.75% to 4%. Governors Waller and Logan, a voting member, have previously expressed support for another one to two quarter-point rate hikes, and markets are watching closely to see whether the hawkish camp within the decision-making circle grows.
- 11/20 (Friday) ZRO unlock and inflation expectations: LayerZero will unlock approximately $36.55 million (3.69% of circulating supply). The University of Michigan's final consumer sentiment reading and one-year inflation expectations (previous: 4.3%) will be released in the evening.
The most important event this week is the FOMC meeting minutes early Thursday morning. The 10-year U.S. Treasury yield is already above 5.1%. If the minutes show that even officials who favor waiting support another rate hike in December, tightening macro liquidity will continue to constrain Bitcoin's potential rebound.
Personal views and information summary only; not investment advice. DYOR.
$BTC $ARB
The central theme in this week's crypto market is whether capital is still willing to take risks amid the double pressure of “expectations of high interest rates” and “volatility in AI computing-power stocks.” According to reports from Dongqu and publicly available data, here are this week's key events:
- 11/16 (Monday) Token unlocks and governance vote: Arbitrum will unlock approximately $13.48 million (1.53% of circulating supply), while Cronos will unlock approximately $55.02 million. Also on this day, voting closes on an Arbitrum DAO proposal for approximately $25 million in compensation for a vulnerability, testing the market's ability to absorb short-term selling pressure.
- 11/17 (Tuesday) New Russian rules for retail crypto purchases and retail sales data: The Central Bank of Russia will allow non-qualified investors to buy BTC, ETH, and USDT through intermediaries, subject to annual limits. At 21:30, U.S. October retail sales will be released (forecast: 0% month over month; previous: 0.8%). A stronger-than-expected figure would deepen concerns about a December rate hike.
- 11/18 (Wednesday) Nvidia earnings and UK regulatory consultation: Nvidia's first earnings report since Jensen Huang stepped down as CEO is due early in the morning, with the market expecting earnings per share of $2.47. The results will directly affect the valuations of crypto miners transitioning to AI data centers. The UK's FCA consultation on crypto regulation also closes that day.
- 11/19 (Thursday) Federal Reserve FOMC meeting minutes: Minutes from the October meeting will be released at 03:00. The benchmark interest rate currently stands at 3.75% to 4%. Governors Waller and Logan, a voting member, have previously expressed support for another one to two quarter-point rate hikes, and markets are watching closely to see whether the hawkish camp within the decision-making circle grows.
- 11/20 (Friday) ZRO unlock and inflation expectations: LayerZero will unlock approximately $36.55 million (3.69% of circulating supply). The University of Michigan's final consumer sentiment reading and one-year inflation expectations (previous: 4.3%) will be released in the evening.
The most important event this week is the FOMC meeting minutes early Thursday morning. The 10-year U.S. Treasury yield is already above 5.1%. If the minutes show that even officials who favor waiting support another rate hike in December, tightening macro liquidity will continue to constrain Bitcoin's potential rebound.
Personal views and information summary only; not investment advice. DYOR.
$BTC $ARB
- 11/16 (Monday) Token unlocks and governance vote: Arbitrum will unlock approximately $13.48 million (1.53% of circulating supply), while Cronos will unlock approximately $55.02 million. Also on this day, voting closes on an Arbitrum DAO proposal for approximately $25 million in compensation for a vulnerability, testing the market's ability to absorb short-term selling pressure.
- 11/17 (Tuesday) New Russian rules for retail crypto purchases and retail sales data: The Central Bank of Russia will allow non-qualified investors to buy BTC, ETH, and USDT through intermediaries, subject to annual limits. At 21:30, U.S. October retail sales will be released (forecast: 0% month over month; previous: 0.8%). A stronger-than-expected figure would deepen concerns about a December rate hike.
- 11/18 (Wednesday) Nvidia earnings and UK regulatory consultation: Nvidia's first earnings report since Jensen Huang stepped down as CEO is due early in the morning, with the market expecting earnings per share of $2.47. The results will directly affect the valuations of crypto miners transitioning to AI data centers. The UK's FCA consultation on crypto regulation also closes that day.
- 11/19 (Thursday) Federal Reserve FOMC meeting minutes: Minutes from the October meeting will be released at 03:00. The benchmark interest rate currently stands at 3.75% to 4%. Governors Waller and Logan, a voting member, have previously expressed support for another one to two quarter-point rate hikes, and markets are watching closely to see whether the hawkish camp within the decision-making circle grows.
- 11/20 (Friday) ZRO unlock and inflation expectations: LayerZero will unlock approximately $36.55 million (3.69% of circulating supply). The University of Michigan's final consumer sentiment reading and one-year inflation expectations (previous: 4.3%) will be released in the evening.
The most important event this week is the FOMC meeting minutes early Thursday morning. The 10-year U.S. Treasury yield is already above 5.1%. If the minutes show that even officials who favor waiting support another rate hike in December, tightening macro liquidity will continue to constrain Bitcoin's potential rebound.
Personal views and information summary only; not investment advice. DYOR.
$BTC $ARB

191
The first thing I do when I turn on my computer in the morning is quickly scan on-chain fund flows and open interest. I only open the candlestick chart afterward.
I first take a clear look at how positions shifted after the U.S. stock market closed last night. Having an objective baseline in mind keeps me from getting swept up in short-term price swings first thing in the morning.
Reversing the order in which I check the market really helps me stay calmer.
$BTC
The first thing I do when I turn on my computer in the morning is quickly scan on-chain fund flows and open interest. I only open the candlestick chart afterward.
I first take a clear look at how positions shifted after the U.S. stock market closed last night. Having an objective baseline in mind keeps me from getting swept up in short-term price swings first thing in the morning.
Reversing the order in which I check the market really helps me stay calmer.
$BTC
I first take a clear look at how positions shifted after the U.S. stock market closed last night. Having an objective baseline in mind keeps me from getting swept up in short-term price swings first thing in the morning.
Reversing the order in which I check the market really helps me stay calmer.
$BTC
86
Log in to explore more content
Join global crypto users on Binance Square
⚡️ Get latest and useful information about crypto.
💬 Trusted by the world’s largest crypto exchange.
👍 Discover real insights from verified creators.
Email / Phone number
Trending Topics
MoreHikesExpectedIsBTCUnderPressure
16,874 views
190 Discussing
FOMC Minutes | Fed Minutes Show Almost All Officials Expect More Rate Hikes, With Some Open to a Larger December Move
Binance News
·25 Likes
·30.2k views
NvidiaBeatsEstimatesWith$130BQ4Outlook
82,783 views
318 Discussing
AnthropicIPOPriceCouldExceed$80
79,027 views
262 Discussing