

Abo Malak
1.9k Posts

Abo Malak
 Square Verified+
Report
Block User
ابسط لك الأسواق المالية والاستثمار رائد محتوى اقتصادي ومؤثر مالي معتمد ومسجل لدى SCA في الإمارات قناة التيلجرام @AboMalllak
33 Following
37.1K+ Followers
15.8K+ Liked
Posts
All
Quotes
Videos
Live
PINNED
·
--
One year in the UAE changed my life | From visitor to golden residency
One year in the UAE was enough to change my life 180 degrees…
I entered the country as an ordinary visitor, and today I am a content creator, a graduate of the New Media Academy, and holder of the golden residency for creators for 10 years.
One year in the UAE changed my life | From visitor to golden residency
One year in the UAE was enough to change my life 180 degrees…
I entered the country as an ordinary visitor, and today I am a content creator, a graduate of the New Media Academy, and holder of the golden residency for creators for 10 years.
One year in the UAE was enough to change my life 180 degrees…
I entered the country as an ordinary visitor, and today I am a content creator, a graduate of the New Media Academy, and holder of the golden residency for creators for 10 years.
34
15
151
12.7k
·
--
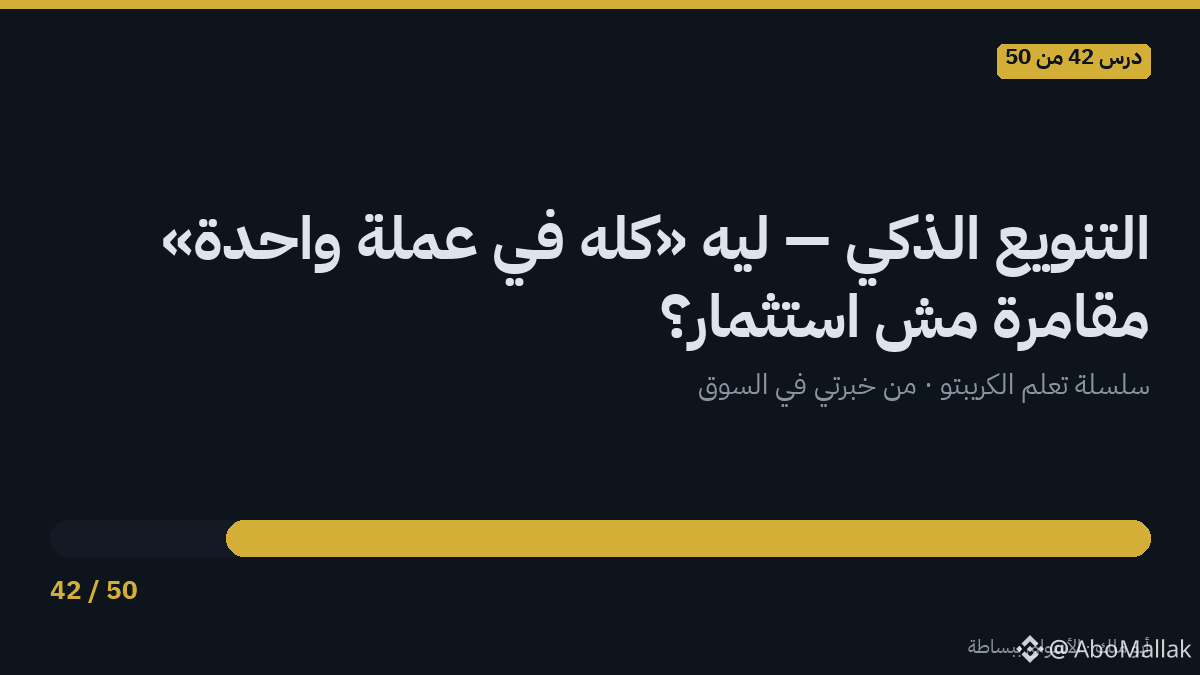
Lesson 42 of 50 — From my experience in the market
Smart diversification — why “putting it all in one coin” is gambling, not investing?
Old wisdom: “Don’t put all your eggs in one basket” — but applying it to crypto has details that many people miss.
The first mistake — fake diversification: someone holds ten small meme coins and thinks they’re diversified. That’s still one basket: they all move together and fall together. Real diversification is between different behavior categories: established leaders ≠ infrastructure projects ≠ emerging sectors.
The second mistake — over-diversification: dozens of small coins means you can’t follow any of them seriously. Excess diversification—beyond what’s needed—is simply called distraction.
The balanced approach for beginners:
· The big share for large, established assets
· A calculated portion for strong projects from the second tier
· And a very small part—if you want— for bold ideas, with money you can afford to lose without it bothering you
And the exact percentages? That’s your decision based on your situation—the important thing is a conscious, written allocation, not stacked random coincidences.
Summary: diversify across truly different categories, not ten nearly identical coins—and excess diversification turns out to be distraction, not a virtue.
If you have a question about this point, write it in the comments 👇
#العملات_الرقمية #تعلم_الكريبتو #Binance
⚠️ Educational content — not investment advice
Lesson 42 of 50 — From my experience in the market
Smart diversification — why “putting it all in one coin” is gambling, not investing?
Old wisdom: “Don’t put all your eggs in one basket” — but applying it to crypto has details that many people miss.
The first mistake — fake diversification: someone holds ten small meme coins and thinks they’re diversified. That’s still one basket: they all move together and fall together. Real diversification is between different behavior categories: established leaders ≠ infrastructure projects ≠ emerging sectors.
The second mistake — over-diversification: dozens of small coins means you can’t follow any of them seriously. Excess diversification—beyond what’s needed—is simply called distraction.
The balanced approach for beginners:
· The big share for large, established assets
· A calculated portion for strong projects from the second tier
· And a very small part—if you want— for bold ideas, with money you can afford to lose without it bothering you
And the exact percentages? That’s your decision based on your situation—the important thing is a conscious, written allocation, not stacked random coincidences.
Summary: diversify across truly different categories, not ten nearly identical coins—and excess diversification turns out to be distraction, not a virtue.
If you have a question about this point, write it in the comments 👇
#العملات_الرقمية #تعلم_الكريبتو #Binance
⚠️ Educational content — not investment advice
Smart diversification — why “putting it all in one coin” is gambling, not investing?
Old wisdom: “Don’t put all your eggs in one basket” — but applying it to crypto has details that many people miss.
The first mistake — fake diversification: someone holds ten small meme coins and thinks they’re diversified. That’s still one basket: they all move together and fall together. Real diversification is between different behavior categories: established leaders ≠ infrastructure projects ≠ emerging sectors.
The second mistake — over-diversification: dozens of small coins means you can’t follow any of them seriously. Excess diversification—beyond what’s needed—is simply called distraction.
The balanced approach for beginners:
· The big share for large, established assets
· A calculated portion for strong projects from the second tier
· And a very small part—if you want— for bold ideas, with money you can afford to lose without it bothering you
And the exact percentages? That’s your decision based on your situation—the important thing is a conscious, written allocation, not stacked random coincidences.
Summary: diversify across truly different categories, not ten nearly identical coins—and excess diversification turns out to be distraction, not a virtue.
If you have a question about this point, write it in the comments 👇
#العملات_الرقمية #تعلم_الكريبتو #Binance
⚠️ Educational content — not investment advice
1
286
·
--
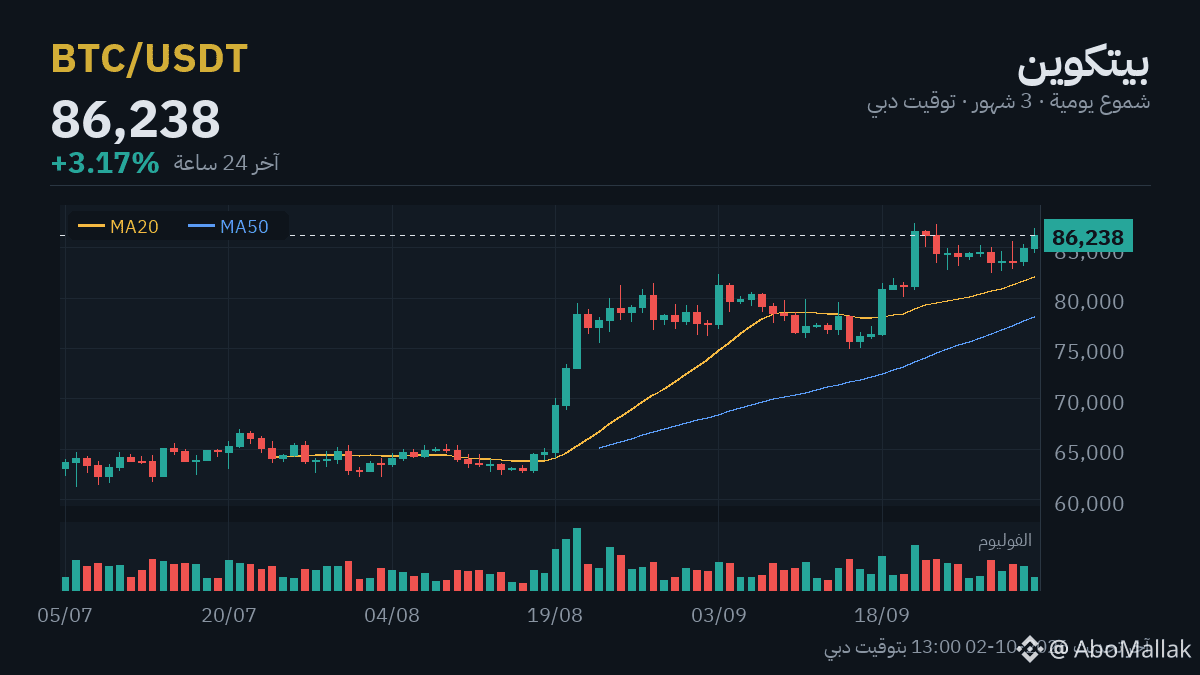
$BTC at $86,236 (+3.2%) · $ETH at $2,754 (+2.5%)
Keep your eye on $85,707 in the market. That’s the level the whole movement is revolving around.
A rise on weak volume makes me read the move cautiously, not with excitement.
The first defense line is at $83,619 and the second at $82,359. Above your head: $85,707 then $86,534.
The sign that says this reading is wrong is a break of $83,619 on volume.
If you’re planning to enter Bitcoin, entering in batches protects you:
1- First batch if it returns to $83,649
2- Second at $81,062
3- Third at $78,475
And if it closes below $75,888, then the plan has failed and you should exit. In that case, your loss is about 6% of the amount, not all of it.
The distance between batches is 3% because it’s the average daily movement of Bitcoin over the last 14 days.
Do your own research (DYOR) — that’s a risk-management approach, not an investment recommendation.
Are you with this reading, or do you see something else?
💛 Join Abu Malek’s team: sign up on Binance with code ABOMALAK — permanent discount on trading fees plus benefit from our services and offers
#CryptoNews #العملات_الرقمية #Binance
⚠️ Educational content for follow-up — not investment advice and your decision is your responsibility
$BTC at $86,236 (+3.2%) · $ETH at $2,754 (+2.5%)
Keep your eye on $85,707 in the market. That’s the level the whole movement is revolving around.
A rise on weak volume makes me read the move cautiously, not with excitement.
The first defense line is at $83,619 and the second at $82,359. Above your head: $85,707 then $86,534.
The sign that says this reading is wrong is a break of $83,619 on volume.
If you’re planning to enter Bitcoin, entering in batches protects you:
1- First batch if it returns to $83,649
2- Second at $81,062
3- Third at $78,475
And if it closes below $75,888, then the plan has failed and you should exit. In that case, your loss is about 6% of the amount, not all of it.
The distance between batches is 3% because it’s the average daily movement of Bitcoin over the last 14 days.
Do your own research (DYOR) — that’s a risk-management approach, not an investment recommendation.
Are you with this reading, or do you see something else?
💛 Join Abu Malek’s team: sign up on Binance with code ABOMALAK — permanent discount on trading fees plus benefit from our services and offers
#CryptoNews #العملات_الرقمية #Binance
⚠️ Educational content for follow-up — not investment advice and your decision is your responsibility
Keep your eye on $85,707 in the market. That’s the level the whole movement is revolving around.
A rise on weak volume makes me read the move cautiously, not with excitement.
The first defense line is at $83,619 and the second at $82,359. Above your head: $85,707 then $86,534.
The sign that says this reading is wrong is a break of $83,619 on volume.
If you’re planning to enter Bitcoin, entering in batches protects you:
1- First batch if it returns to $83,649
2- Second at $81,062
3- Third at $78,475
And if it closes below $75,888, then the plan has failed and you should exit. In that case, your loss is about 6% of the amount, not all of it.
The distance between batches is 3% because it’s the average daily movement of Bitcoin over the last 14 days.
Do your own research (DYOR) — that’s a risk-management approach, not an investment recommendation.
Are you with this reading, or do you see something else?
💛 Join Abu Malek’s team: sign up on Binance with code ABOMALAK — permanent discount on trading fees plus benefit from our services and offers
#CryptoNews #العملات_الرقمية #Binance
⚠️ Educational content for follow-up — not investment advice and your decision is your responsibility
3
585
·
--
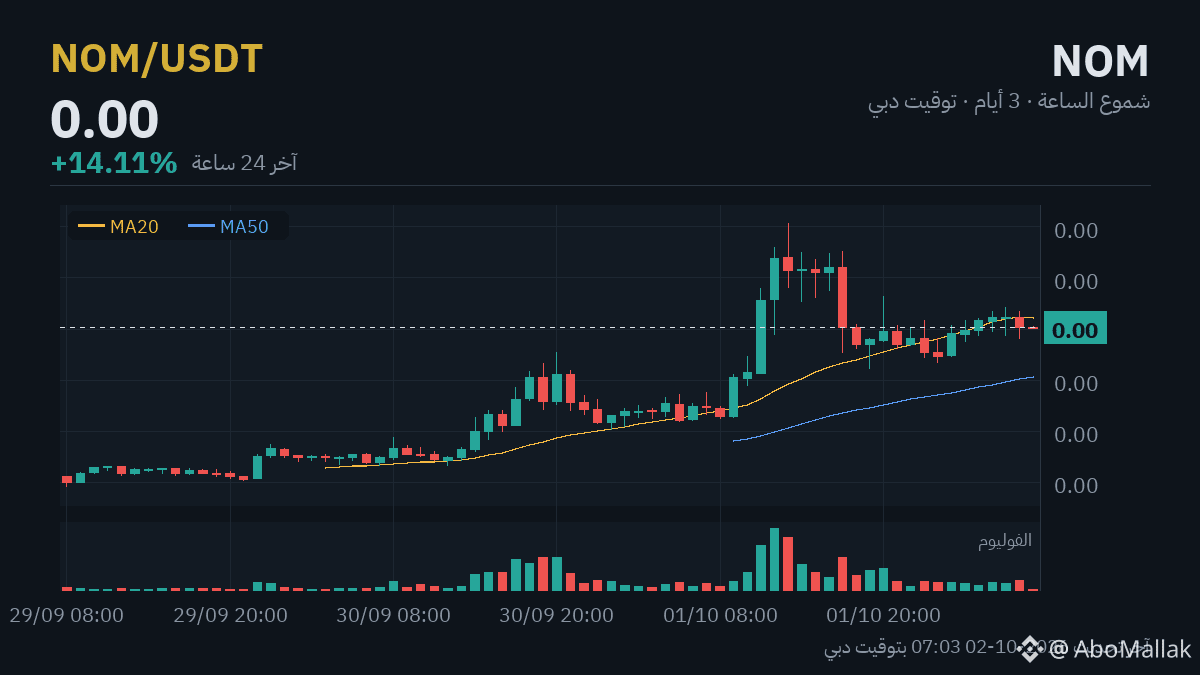
🚀 Pump Watch: $NOM up +14.2% in 24 hours
Momentum Strength: 72/100
✅ Liquidity $21M | ✅ Holds 96% from its peak | ✅ Volume is accompanying
▪️ Price now: $0.002755
📊 Levels controlling the move:
▪️ Holding above $0.0023033333 = the move is still ongoing
▪️ Breaking $0.0032723333 upward = the door for continuation is open
▪️ Falling back below $0.0024130048 (the start of the wave) = consider it finished
Quick scan of NOM’s movement: the coin rose +14.2% over 24 hours with liquidity reaching $21M, and the price is currently at $0.002755.
First scenario: if the price manages to break the resistance $0.0032733 with continuous trading volume and supportive liquidity, this would be a sign that the bullish momentum could continue and open the door for another wave.
Second scenario: if the price fails to break out and instead breaks support $0.0023033, that would indicate the momentum is weakening and the move may have reached a correction stage.
What happens in the coming days will clarify which of the two scenarios is truly playing out.
If you plan to enter after a move like this, entering in portions protects you from going all-in at the top:
1- First portion if it retraces to $0.0026695012
2- Second at $0.0025840024
3- Third at $0.0024985036
And if it closes below $0.0024130048, then the plan has failed and you should exit. In that case, your loss would be about 7% of the amount—not all of it.
The exit level is the start of the wave above—below it, the movement is considered finished.
Do your own research (DYOR) — this is a risk-management approach, not investment advice.
Is this move continuing, or was that the top? The chart is in front of you 👇 $NOM
⚠️ Pump moves are violent in both directions—late entries are more dangerous than missing it.
📉 Market around it: $BTC moving +2.4% in the same hours.
#NOM #Altcoins #Digital_Assets
⚠️ Educational content for follow-up — not investment advice; your decision is your responsibility
🚀 Pump Watch: $NOM up +14.2% in 24 hours
Momentum Strength: 72/100
✅ Liquidity $21M | ✅ Holds 96% from its peak | ✅ Volume is accompanying
▪️ Price now: $0.002755
📊 Levels controlling the move:
▪️ Holding above $0.0023033333 = the move is still ongoing
▪️ Breaking $0.0032723333 upward = the door for continuation is open
▪️ Falling back below $0.0024130048 (the start of the wave) = consider it finished
Quick scan of NOM’s movement: the coin rose +14.2% over 24 hours with liquidity reaching $21M, and the price is currently at $0.002755.
First scenario: if the price manages to break the resistance $0.0032733 with continuous trading volume and supportive liquidity, this would be a sign that the bullish momentum could continue and open the door for another wave.
Second scenario: if the price fails to break out and instead breaks support $0.0023033, that would indicate the momentum is weakening and the move may have reached a correction stage.
What happens in the coming days will clarify which of the two scenarios is truly playing out.
If you plan to enter after a move like this, entering in portions protects you from going all-in at the top:
1- First portion if it retraces to $0.0026695012
2- Second at $0.0025840024
3- Third at $0.0024985036
And if it closes below $0.0024130048, then the plan has failed and you should exit. In that case, your loss would be about 7% of the amount—not all of it.
The exit level is the start of the wave above—below it, the movement is considered finished.
Do your own research (DYOR) — this is a risk-management approach, not investment advice.
Is this move continuing, or was that the top? The chart is in front of you 👇 $NOM
⚠️ Pump moves are violent in both directions—late entries are more dangerous than missing it.
📉 Market around it: $BTC moving +2.4% in the same hours.
#NOM #Altcoins #Digital_Assets
⚠️ Educational content for follow-up — not investment advice; your decision is your responsibility
Momentum Strength: 72/100
✅ Liquidity $21M | ✅ Holds 96% from its peak | ✅ Volume is accompanying
▪️ Price now: $0.002755
📊 Levels controlling the move:
▪️ Holding above $0.0023033333 = the move is still ongoing
▪️ Breaking $0.0032723333 upward = the door for continuation is open
▪️ Falling back below $0.0024130048 (the start of the wave) = consider it finished
Quick scan of NOM’s movement: the coin rose +14.2% over 24 hours with liquidity reaching $21M, and the price is currently at $0.002755.
First scenario: if the price manages to break the resistance $0.0032733 with continuous trading volume and supportive liquidity, this would be a sign that the bullish momentum could continue and open the door for another wave.
Second scenario: if the price fails to break out and instead breaks support $0.0023033, that would indicate the momentum is weakening and the move may have reached a correction stage.
What happens in the coming days will clarify which of the two scenarios is truly playing out.
If you plan to enter after a move like this, entering in portions protects you from going all-in at the top:
1- First portion if it retraces to $0.0026695012
2- Second at $0.0025840024
3- Third at $0.0024985036
And if it closes below $0.0024130048, then the plan has failed and you should exit. In that case, your loss would be about 7% of the amount—not all of it.
The exit level is the start of the wave above—below it, the movement is considered finished.
Do your own research (DYOR) — this is a risk-management approach, not investment advice.
Is this move continuing, or was that the top? The chart is in front of you 👇 $NOM
⚠️ Pump moves are violent in both directions—late entries are more dangerous than missing it.
📉 Market around it: $BTC moving +2.4% in the same hours.
#NOM #Altcoins #Digital_Assets
⚠️ Educational content for follow-up — not investment advice; your decision is your responsibility
1
3
674
·
--
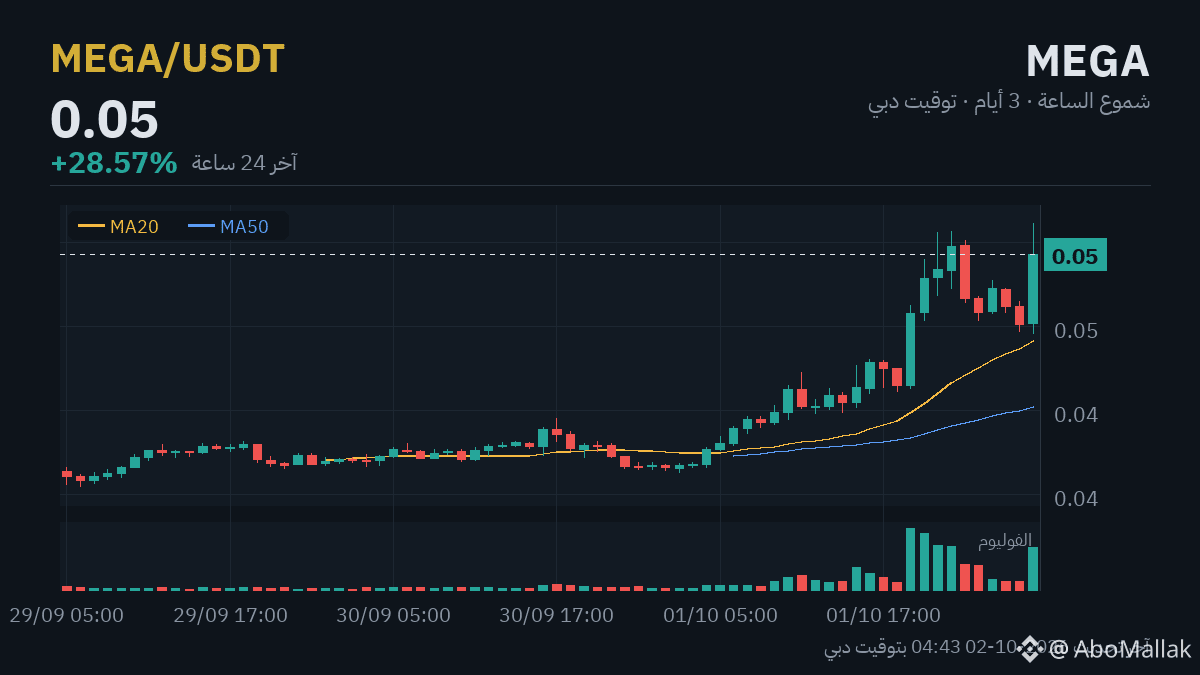
🚀 Bomb Watch: $MEGA is up +28.7% in 24 hours
Momentum strength: 74/100
✅ Liquidity $18M | ✅ Holds 96% of its peak | ✅ Volume is accompanying
▪️ Price now: $0.05431
📊 The levels controlling the move:
▪️ Holding above $0.042613 = the move is still ongoing
▪️ Breaking above $0.056703 = the continuation door is open
▪️ Falling back under $0.042213 (the start of the wave) = consider it finished
MEGA is recording a jump of +28.7% within 24 hours with liquidity reaching $18 million, and the price is currently at $0.05431.
First scenario: continued upward momentum depends on a clear breakout of the resistance level at $0.056703, with confirmation via a close above it and supportive trading volume—this is what could open the way for another bullish wave.
Second scenario: a sign of weakening movement or its end will appear if the price fails to break the resistance and starts dropping below $0.042613; this is a direct test of the strength of support and may indicate that the current upward momentum is stopping.
The move is still in the testing phase between these two levels; following the price action and liquidity is what will determine the direction of the next trend.
If you plan to enter after a move like this, entering in batches protects you from going in all at the top:
1- First batch if it retraces to $0.051286
2- Second batch at $0.048262
3- Third batch at $0.045238
If it closes below $0.042213, then the plan has failed and you should exit. At that point, your loss would be about 12% of the amount—not all of it.
The exit level is the start of the wave above—below it, the move is considered finished.
Do your own research (DYOR)—this is a risk-management approach, not a recommendation.
Will this keep running or is this the top? The chart is in front of you 👇 $MEGA
⚠️ Pump moves like this move violently in both directions—late entries are more dangerous than missing out
📉 About it: $BTC moving +1.6% in the same hours.
#MEGA #Altcoins #Digital_Currencies
⚠️ Educational content for follow-up—not investment advice and your decision is your responsibility
🚀 Bomb Watch: $MEGA is up +28.7% in 24 hours
Momentum strength: 74/100
✅ Liquidity $18M | ✅ Holds 96% of its peak | ✅ Volume is accompanying
▪️ Price now: $0.05431
📊 The levels controlling the move:
▪️ Holding above $0.042613 = the move is still ongoing
▪️ Breaking above $0.056703 = the continuation door is open
▪️ Falling back under $0.042213 (the start of the wave) = consider it finished
MEGA is recording a jump of +28.7% within 24 hours with liquidity reaching $18 million, and the price is currently at $0.05431.
First scenario: continued upward momentum depends on a clear breakout of the resistance level at $0.056703, with confirmation via a close above it and supportive trading volume—this is what could open the way for another bullish wave.
Second scenario: a sign of weakening movement or its end will appear if the price fails to break the resistance and starts dropping below $0.042613; this is a direct test of the strength of support and may indicate that the current upward momentum is stopping.
The move is still in the testing phase between these two levels; following the price action and liquidity is what will determine the direction of the next trend.
If you plan to enter after a move like this, entering in batches protects you from going in all at the top:
1- First batch if it retraces to $0.051286
2- Second batch at $0.048262
3- Third batch at $0.045238
If it closes below $0.042213, then the plan has failed and you should exit. At that point, your loss would be about 12% of the amount—not all of it.
The exit level is the start of the wave above—below it, the move is considered finished.
Do your own research (DYOR)—this is a risk-management approach, not a recommendation.
Will this keep running or is this the top? The chart is in front of you 👇 $MEGA
⚠️ Pump moves like this move violently in both directions—late entries are more dangerous than missing out
📉 About it: $BTC moving +1.6% in the same hours.
#MEGA #Altcoins #Digital_Currencies
⚠️ Educational content for follow-up—not investment advice and your decision is your responsibility
Momentum strength: 74/100
✅ Liquidity $18M | ✅ Holds 96% of its peak | ✅ Volume is accompanying
▪️ Price now: $0.05431
📊 The levels controlling the move:
▪️ Holding above $0.042613 = the move is still ongoing
▪️ Breaking above $0.056703 = the continuation door is open
▪️ Falling back under $0.042213 (the start of the wave) = consider it finished
MEGA is recording a jump of +28.7% within 24 hours with liquidity reaching $18 million, and the price is currently at $0.05431.
First scenario: continued upward momentum depends on a clear breakout of the resistance level at $0.056703, with confirmation via a close above it and supportive trading volume—this is what could open the way for another bullish wave.
Second scenario: a sign of weakening movement or its end will appear if the price fails to break the resistance and starts dropping below $0.042613; this is a direct test of the strength of support and may indicate that the current upward momentum is stopping.
The move is still in the testing phase between these two levels; following the price action and liquidity is what will determine the direction of the next trend.
If you plan to enter after a move like this, entering in batches protects you from going in all at the top:
1- First batch if it retraces to $0.051286
2- Second batch at $0.048262
3- Third batch at $0.045238
If it closes below $0.042213, then the plan has failed and you should exit. At that point, your loss would be about 12% of the amount—not all of it.
The exit level is the start of the wave above—below it, the move is considered finished.
Do your own research (DYOR)—this is a risk-management approach, not a recommendation.
Will this keep running or is this the top? The chart is in front of you 👇 $MEGA
⚠️ Pump moves like this move violently in both directions—late entries are more dangerous than missing out
📉 About it: $BTC moving +1.6% in the same hours.
#MEGA #Altcoins #Digital_Currencies
⚠️ Educational content for follow-up—not investment advice and your decision is your responsibility
1
283
·
--
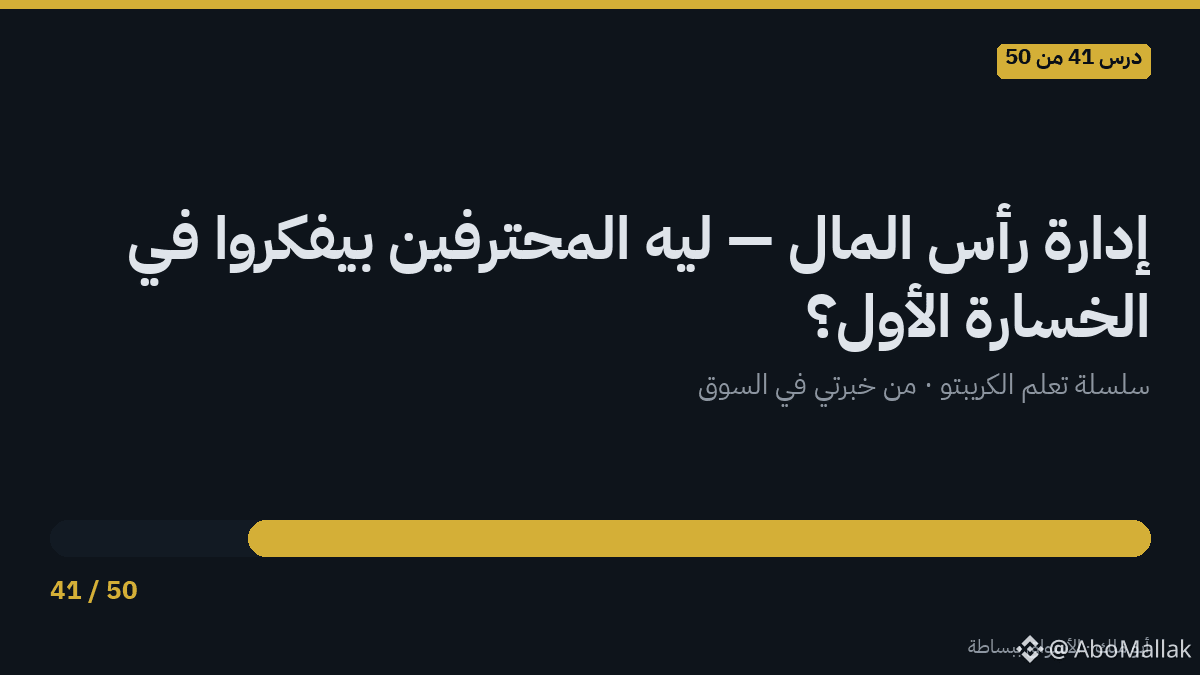
Lesson 41 of 50 — From my experience in the market
Capital management — why do professionals think about the first loss?
The real difference between someone who survives in the market for years and someone who gets wiped out in the first wave of decline—it's not intelligence or predictions: it's capital management.
The beginner asks: “How much will I make if I enter?” — the professional asks first: “How much will I lose if I’m wrong?” And this order changes everything.
Golden rules:
1️⃣ Determine a small percentage of your portfolio to risk on any single idea. Many professionals operate near very tight limits that don’t exceed small percentages of their capital.
2️⃣ Don’t add to a losing position to “lower the average” without a pre-written plan. This is the most famous way to turn a small loss into a disaster.
3️⃣ Know the maximum loss you can tolerate in a month—and if you reach it, truly close the screen.
The equation that governs the market: the one who loses half of their portfolio needs to double what remains just to get back to the starting point. Protecting capital isn’t cowardice—it's the game itself.
Summary: Specify a small percentage of your portfolio to risk in any one idea—the one who protects their capital stays in the game.
Which number do you fall into? Write it in the comments 👇
#العملات_الرقمية #تعلم_الكريبتو #Binance
⚠️ Educational content — not investment advice
Lesson 41 of 50 — From my experience in the market
Capital management — why do professionals think about the first loss?
The real difference between someone who survives in the market for years and someone who gets wiped out in the first wave of decline—it's not intelligence or predictions: it's capital management.
The beginner asks: “How much will I make if I enter?” — the professional asks first: “How much will I lose if I’m wrong?” And this order changes everything.
Golden rules:
1️⃣ Determine a small percentage of your portfolio to risk on any single idea. Many professionals operate near very tight limits that don’t exceed small percentages of their capital.
2️⃣ Don’t add to a losing position to “lower the average” without a pre-written plan. This is the most famous way to turn a small loss into a disaster.
3️⃣ Know the maximum loss you can tolerate in a month—and if you reach it, truly close the screen.
The equation that governs the market: the one who loses half of their portfolio needs to double what remains just to get back to the starting point. Protecting capital isn’t cowardice—it's the game itself.
Summary: Specify a small percentage of your portfolio to risk in any one idea—the one who protects their capital stays in the game.
Which number do you fall into? Write it in the comments 👇
#العملات_الرقمية #تعلم_الكريبتو #Binance
⚠️ Educational content — not investment advice
Capital management — why do professionals think about the first loss?
The real difference between someone who survives in the market for years and someone who gets wiped out in the first wave of decline—it's not intelligence or predictions: it's capital management.
The beginner asks: “How much will I make if I enter?” — the professional asks first: “How much will I lose if I’m wrong?” And this order changes everything.
Golden rules:
1️⃣ Determine a small percentage of your portfolio to risk on any single idea. Many professionals operate near very tight limits that don’t exceed small percentages of their capital.
2️⃣ Don’t add to a losing position to “lower the average” without a pre-written plan. This is the most famous way to turn a small loss into a disaster.
3️⃣ Know the maximum loss you can tolerate in a month—and if you reach it, truly close the screen.
The equation that governs the market: the one who loses half of their portfolio needs to double what remains just to get back to the starting point. Protecting capital isn’t cowardice—it's the game itself.
Summary: Specify a small percentage of your portfolio to risk in any one idea—the one who protects their capital stays in the game.
Which number do you fall into? Write it in the comments 👇
#العملات_الرقمية #تعلم_الكريبتو #Binance
⚠️ Educational content — not investment advice
2
633
·
--
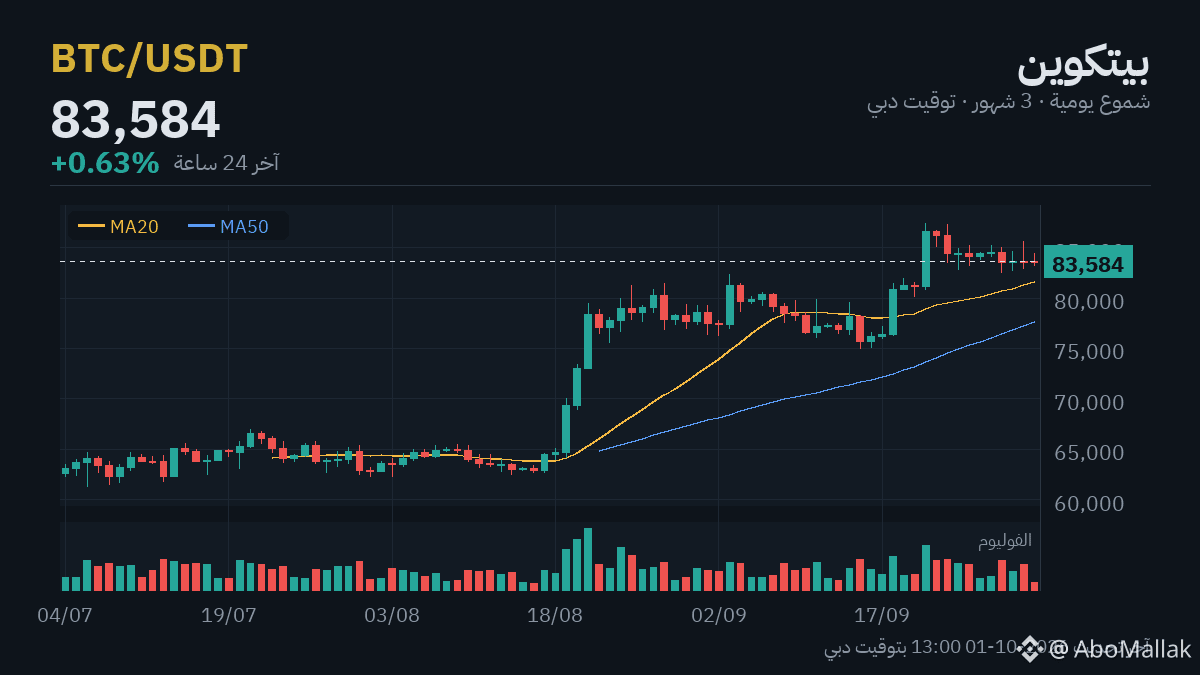
$BTC At $83,567 (+0.6%) · $ETH At $2,687 (+0.6%)
The market is choppy, and the repeated question is: should we wait or has the picture become clear?
First line of defense at $82,503 and the second at $81,383. Above your head: $85,197, then $86,770.
A rise on weak volume makes me read the move cautiously, not with excitement.
If $85,197 is broken with a close, the chart changes for the better.
If you plan to enter Bitcoin, entering in batches protects you:
1- First batch if it returns to $81,060
2- The second at $78,553
3- The third at $76,046
And if it closes below $73,539, the plan has failed and you should exit. In that case, your loss is about 6% of the amount, not all of it.
The distance between batches is 3% because it’s the average daily movement of Bitcoin over the last 14 days.
Do your own research (DYOR) — this is a risk-management approach, not a recommendation.
Are you with this reading, or do you see something else?
💛 Join Abu Malak’s team: register on Binance with code ABOMALAK — permanent discount on trading fees, and benefit from our services and offers
#CryptoNews #العملات_الرقمية #Binance
⚠️ Educational content for follow-up — not investment advice; your decision is your responsibility
$BTC At $83,567 (+0.6%) · $ETH At $2,687 (+0.6%)
The market is choppy, and the repeated question is: should we wait or has the picture become clear?
First line of defense at $82,503 and the second at $81,383. Above your head: $85,197, then $86,770.
A rise on weak volume makes me read the move cautiously, not with excitement.
If $85,197 is broken with a close, the chart changes for the better.
If you plan to enter Bitcoin, entering in batches protects you:
1- First batch if it returns to $81,060
2- The second at $78,553
3- The third at $76,046
And if it closes below $73,539, the plan has failed and you should exit. In that case, your loss is about 6% of the amount, not all of it.
The distance between batches is 3% because it’s the average daily movement of Bitcoin over the last 14 days.
Do your own research (DYOR) — this is a risk-management approach, not a recommendation.
Are you with this reading, or do you see something else?
💛 Join Abu Malak’s team: register on Binance with code ABOMALAK — permanent discount on trading fees, and benefit from our services and offers
#CryptoNews #العملات_الرقمية #Binance
⚠️ Educational content for follow-up — not investment advice; your decision is your responsibility
The market is choppy, and the repeated question is: should we wait or has the picture become clear?
First line of defense at $82,503 and the second at $81,383. Above your head: $85,197, then $86,770.
A rise on weak volume makes me read the move cautiously, not with excitement.
If $85,197 is broken with a close, the chart changes for the better.
If you plan to enter Bitcoin, entering in batches protects you:
1- First batch if it returns to $81,060
2- The second at $78,553
3- The third at $76,046
And if it closes below $73,539, the plan has failed and you should exit. In that case, your loss is about 6% of the amount, not all of it.
The distance between batches is 3% because it’s the average daily movement of Bitcoin over the last 14 days.
Do your own research (DYOR) — this is a risk-management approach, not a recommendation.
Are you with this reading, or do you see something else?
💛 Join Abu Malak’s team: register on Binance with code ABOMALAK — permanent discount on trading fees, and benefit from our services and offers
#CryptoNews #العملات_الرقمية #Binance
⚠️ Educational content for follow-up — not investment advice; your decision is your responsibility
1
2
1.3k
·
--
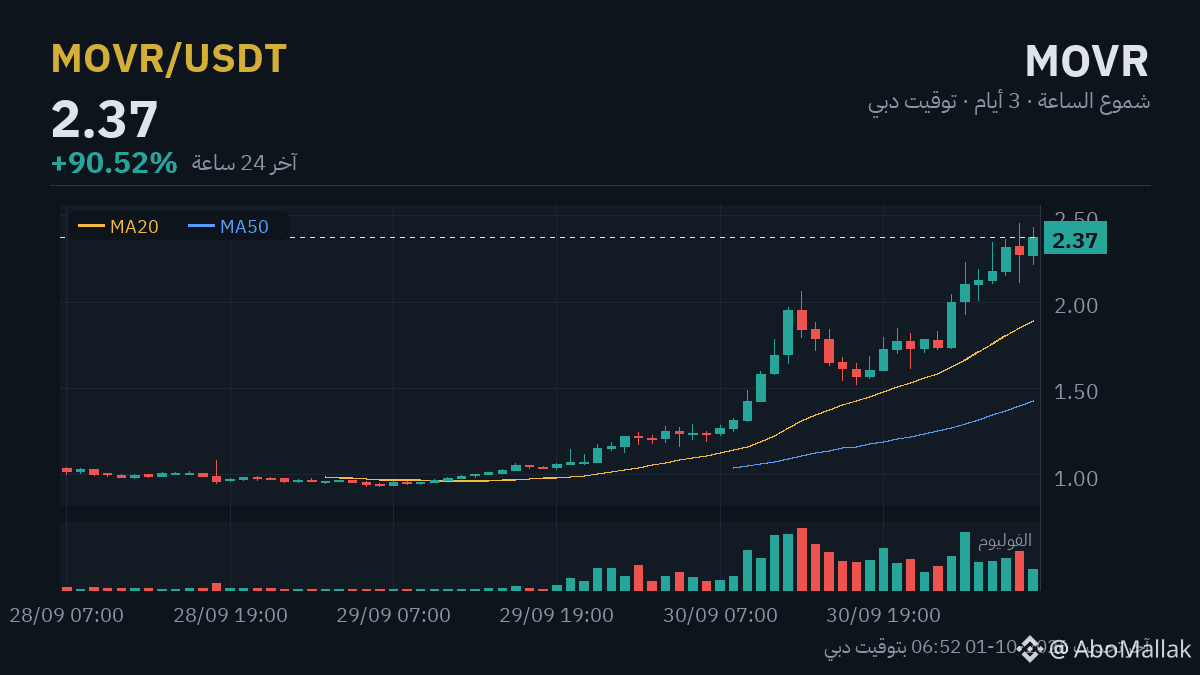
🚀 Bomb Watch: $MOVR up +89.8% in 24 hours
Momentum Power: 83/100
✅ Liquidity $64M | ✅ Holds 96% of its peak | ✅ Volume is accompanying
▪️ Price now: $2.37
📊 Levels that control the move:
▪️ Holding above $1.45 = the move is still ongoing
▪️ Break above $2.63 = the door to continuation is open
▪️ Retrace below $1.25 (start of the wave) = consider it finished
MOVR is recording a strong jump of +89.8% over 24 hours, and the liquidity reaching $64 million signals that there’s real interest behind this move—not just a passing hype.
First scenario: if the price manages to break the $2.63 level and holds above it with continuous trading volume, it could open the way for the upward momentum to continue and attract additional liquidity.
Second scenario: if the price fails to break through the resistance and starts to fall back below $1.45, that would be an indicator of weakening momentum and the possibility of the project entering a corrective wave after the sharp rise.
In both cases, a fast move like this opens the door to sharp swings in both directions—so monitoring liquidity and price action around these levels remains the most important indicator of where the next move is headed.
If you plan to enter after a move like this, entering in batches protects you from buying everything right at the top:
1- First batch if it retests $2.09
2- The second at $1.81
3- The third at $1.53
If it closes below $1.25, then the plan has failed and you should exit. Your loss would be about 30% of the amount—not all of it.
The exit level is the start of the wave above—below it, the move is considered finished.
Do your own research (DYOR)—this is a risk-management approach, not a recommendation.
Will this move continue or is this the top? The chart is in front of you 👇 $MOVR
⚠️ These pump moves move violently in both directions—getting in late is more dangerous than missing it.
📉 Market around it: $BTC moving +0.0% in the same hours.
#MOVR #Altcoins #Digital_Currencies
⚠️ Educational content for follow-up — not investment advice, and your decision is your responsibility
🚀 Bomb Watch: $MOVR up +89.8% in 24 hours
Momentum Power: 83/100
✅ Liquidity $64M | ✅ Holds 96% of its peak | ✅ Volume is accompanying
▪️ Price now: $2.37
📊 Levels that control the move:
▪️ Holding above $1.45 = the move is still ongoing
▪️ Break above $2.63 = the door to continuation is open
▪️ Retrace below $1.25 (start of the wave) = consider it finished
MOVR is recording a strong jump of +89.8% over 24 hours, and the liquidity reaching $64 million signals that there’s real interest behind this move—not just a passing hype.
First scenario: if the price manages to break the $2.63 level and holds above it with continuous trading volume, it could open the way for the upward momentum to continue and attract additional liquidity.
Second scenario: if the price fails to break through the resistance and starts to fall back below $1.45, that would be an indicator of weakening momentum and the possibility of the project entering a corrective wave after the sharp rise.
In both cases, a fast move like this opens the door to sharp swings in both directions—so monitoring liquidity and price action around these levels remains the most important indicator of where the next move is headed.
If you plan to enter after a move like this, entering in batches protects you from buying everything right at the top:
1- First batch if it retests $2.09
2- The second at $1.81
3- The third at $1.53
If it closes below $1.25, then the plan has failed and you should exit. Your loss would be about 30% of the amount—not all of it.
The exit level is the start of the wave above—below it, the move is considered finished.
Do your own research (DYOR)—this is a risk-management approach, not a recommendation.
Will this move continue or is this the top? The chart is in front of you 👇 $MOVR
⚠️ These pump moves move violently in both directions—getting in late is more dangerous than missing it.
📉 Market around it: $BTC moving +0.0% in the same hours.
#MOVR #Altcoins #Digital_Currencies
⚠️ Educational content for follow-up — not investment advice, and your decision is your responsibility
Momentum Power: 83/100
✅ Liquidity $64M | ✅ Holds 96% of its peak | ✅ Volume is accompanying
▪️ Price now: $2.37
📊 Levels that control the move:
▪️ Holding above $1.45 = the move is still ongoing
▪️ Break above $2.63 = the door to continuation is open
▪️ Retrace below $1.25 (start of the wave) = consider it finished
MOVR is recording a strong jump of +89.8% over 24 hours, and the liquidity reaching $64 million signals that there’s real interest behind this move—not just a passing hype.
First scenario: if the price manages to break the $2.63 level and holds above it with continuous trading volume, it could open the way for the upward momentum to continue and attract additional liquidity.
Second scenario: if the price fails to break through the resistance and starts to fall back below $1.45, that would be an indicator of weakening momentum and the possibility of the project entering a corrective wave after the sharp rise.
In both cases, a fast move like this opens the door to sharp swings in both directions—so monitoring liquidity and price action around these levels remains the most important indicator of where the next move is headed.
If you plan to enter after a move like this, entering in batches protects you from buying everything right at the top:
1- First batch if it retests $2.09
2- The second at $1.81
3- The third at $1.53
If it closes below $1.25, then the plan has failed and you should exit. Your loss would be about 30% of the amount—not all of it.
The exit level is the start of the wave above—below it, the move is considered finished.
Do your own research (DYOR)—this is a risk-management approach, not a recommendation.
Will this move continue or is this the top? The chart is in front of you 👇 $MOVR
⚠️ These pump moves move violently in both directions—getting in late is more dangerous than missing it.
📉 Market around it: $BTC moving +0.0% in the same hours.
#MOVR #Altcoins #Digital_Currencies
⚠️ Educational content for follow-up — not investment advice, and your decision is your responsibility
1
3
1.7k
·
--
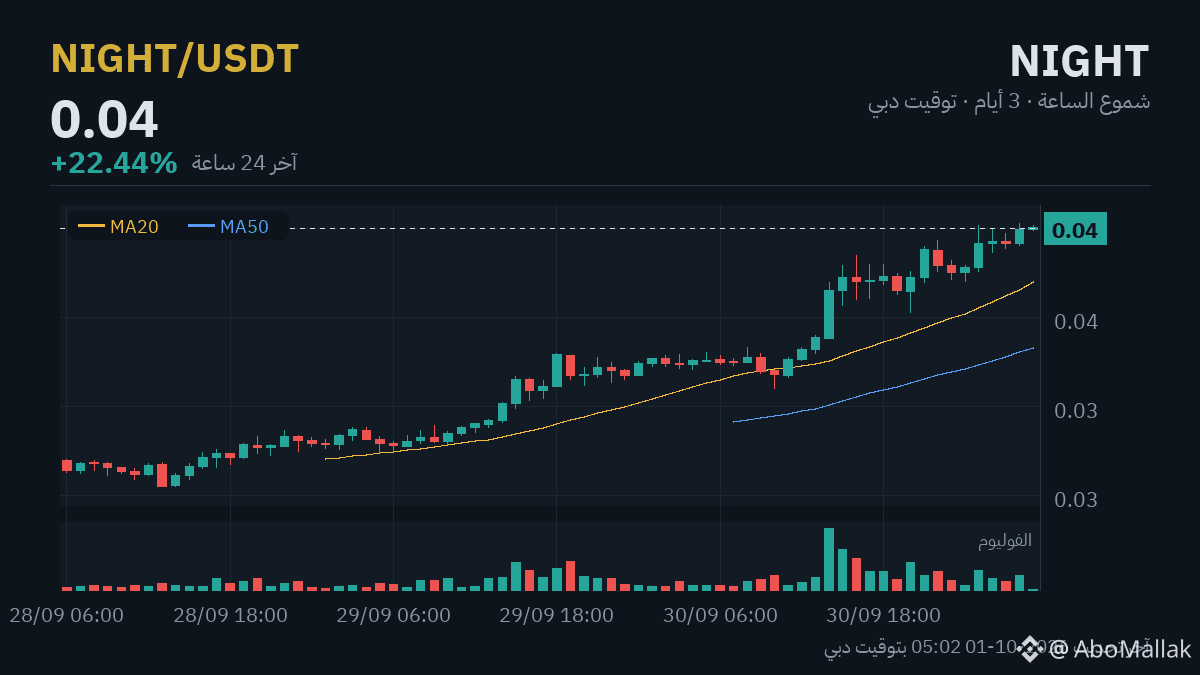
🚀 Bomb Watch: $NIGHT up +22.5% in 24 hours
Momentum Strength: 74/100
✅ Liquidity $16M | ✅ Holding 99% of its peak | ✅ Volume is accompanying
▪️ Price now: $0.04005
📊 Key levels that control the move:
▪️ Holding above $0.033403 = the move is still ongoing
▪️ Break above $0.042593 = continuation door is open
▪️ Falling back below $0.03269 (wave start) = consider it over
NIGHT is recording a notable rise of +22.5% within 24 hours, supported by liquidity reaching $16 million and the current price at $0.04005.
First scenario: Continuing upward momentum depends on breaking the nearby resistance level at $0.042593 and holding it steadily, while maintaining (or increasing) the current liquidity volume—this signals real demand, not just a temporary move.
Second scenario: Signs of exhaustion appear if the price fails to break resistance and starts to fall below the support level at $0.033403, especially if the decline comes with a noticeable drop in liquidity—this indicates weakening momentum and a return of supply to control the situation.
If you plan to enter after a move like this, entering in portions protects you from going all-in at the top:
1- First portion if it retraces to $0.03821
2- Second at $0.03637
3- Third at $0.03453
If it closes below $0.03269, then the plan failed and you should exit. Your loss would be about 10% of the amount—not all of it.
The exit level is the start of the wave above—below it, the move is considered over.
Do your own research (DYOR)—this is a risk-management approach, not investment advice.
Is this move continuing or is this the top? The chart is in front of you 👇 $NIGHT
⚠️ Pump moves like this move violently in both directions—late entries are more dangerous than missing the move.
📉 Around the market: $BTC moving +0.1% in the same hours.
#NIGHT #Altcoins #Digital_Currencies
⚠️ Educational content to follow—not investment advice and your decision is your responsibility
🚀 Bomb Watch: $NIGHT up +22.5% in 24 hours
Momentum Strength: 74/100
✅ Liquidity $16M | ✅ Holding 99% of its peak | ✅ Volume is accompanying
▪️ Price now: $0.04005
📊 Key levels that control the move:
▪️ Holding above $0.033403 = the move is still ongoing
▪️ Break above $0.042593 = continuation door is open
▪️ Falling back below $0.03269 (wave start) = consider it over
NIGHT is recording a notable rise of +22.5% within 24 hours, supported by liquidity reaching $16 million and the current price at $0.04005.
First scenario: Continuing upward momentum depends on breaking the nearby resistance level at $0.042593 and holding it steadily, while maintaining (or increasing) the current liquidity volume—this signals real demand, not just a temporary move.
Second scenario: Signs of exhaustion appear if the price fails to break resistance and starts to fall below the support level at $0.033403, especially if the decline comes with a noticeable drop in liquidity—this indicates weakening momentum and a return of supply to control the situation.
If you plan to enter after a move like this, entering in portions protects you from going all-in at the top:
1- First portion if it retraces to $0.03821
2- Second at $0.03637
3- Third at $0.03453
If it closes below $0.03269, then the plan failed and you should exit. Your loss would be about 10% of the amount—not all of it.
The exit level is the start of the wave above—below it, the move is considered over.
Do your own research (DYOR)—this is a risk-management approach, not investment advice.
Is this move continuing or is this the top? The chart is in front of you 👇 $NIGHT
⚠️ Pump moves like this move violently in both directions—late entries are more dangerous than missing the move.
📉 Around the market: $BTC moving +0.1% in the same hours.
#NIGHT #Altcoins #Digital_Currencies
⚠️ Educational content to follow—not investment advice and your decision is your responsibility
Momentum Strength: 74/100
✅ Liquidity $16M | ✅ Holding 99% of its peak | ✅ Volume is accompanying
▪️ Price now: $0.04005
📊 Key levels that control the move:
▪️ Holding above $0.033403 = the move is still ongoing
▪️ Break above $0.042593 = continuation door is open
▪️ Falling back below $0.03269 (wave start) = consider it over
NIGHT is recording a notable rise of +22.5% within 24 hours, supported by liquidity reaching $16 million and the current price at $0.04005.
First scenario: Continuing upward momentum depends on breaking the nearby resistance level at $0.042593 and holding it steadily, while maintaining (or increasing) the current liquidity volume—this signals real demand, not just a temporary move.
Second scenario: Signs of exhaustion appear if the price fails to break resistance and starts to fall below the support level at $0.033403, especially if the decline comes with a noticeable drop in liquidity—this indicates weakening momentum and a return of supply to control the situation.
If you plan to enter after a move like this, entering in portions protects you from going all-in at the top:
1- First portion if it retraces to $0.03821
2- Second at $0.03637
3- Third at $0.03453
If it closes below $0.03269, then the plan failed and you should exit. Your loss would be about 10% of the amount—not all of it.
The exit level is the start of the wave above—below it, the move is considered over.
Do your own research (DYOR)—this is a risk-management approach, not investment advice.
Is this move continuing or is this the top? The chart is in front of you 👇 $NIGHT
⚠️ Pump moves like this move violently in both directions—late entries are more dangerous than missing the move.
📉 Around the market: $BTC moving +0.1% in the same hours.
#NIGHT #Altcoins #Digital_Currencies
⚠️ Educational content to follow—not investment advice and your decision is your responsibility
2
534
·
--
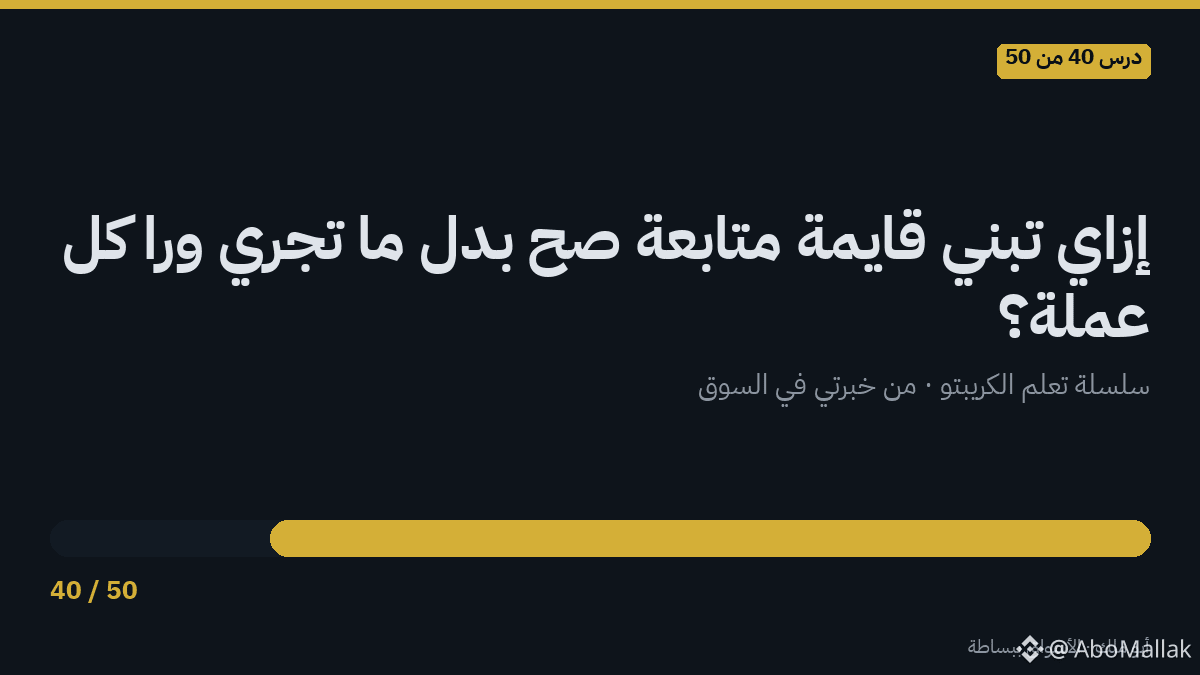
Lesson 40 of 50 — From my experience in the market
How do you build a proper watchlist instead of chasing every coin?
The problem with every beginner: the market has thousands of coins, and every day there’s a “new opportunity” that starts shining — the result is distraction and random decisions.
The solution is a simple tool: a watchlist. Not just a list of names — it’s a full method:
1️⃣ Small by right: 10 to 15 coins at most. Any more means you’re not truly monitoring — you’re just collecting names.
2️⃣ Each coin has a written reason: why this one in particular? (A strong project you’re waiting for at a better price? A sector you believe in? A technical breakout coming soon?) If you can’t write the reason in a line — remove it.
3️⃣ It has exit conditions: the coin should leave the watchlist if the entry reason changes — the team dissolved, the project stopped, a competitor swept the market. A living watchlist is constantly cleaned.
4️⃣ Review it weekly, not every hour: monitoring isn’t just sticking your eyes to the screen — a structured weekly look is deeper than a thousand distracting glances.
“Every day a coin” gives you prepared candidates with analysis — your watchlist is built from them and from your research.
Bottom line: a small watchlist you know well is better than 100 coins you chase — every coin has a reason for being added and a reason for being removed.
Which number do you end up falling into? Write it in the comments 👇
#العملات_الرقمية #تعلم_الكريبتو #Binance
⚠️ Educational content — not investment advice
Lesson 40 of 50 — From my experience in the market
How do you build a proper watchlist instead of chasing every coin?
The problem with every beginner: the market has thousands of coins, and every day there’s a “new opportunity” that starts shining — the result is distraction and random decisions.
The solution is a simple tool: a watchlist. Not just a list of names — it’s a full method:
1️⃣ Small by right: 10 to 15 coins at most. Any more means you’re not truly monitoring — you’re just collecting names.
2️⃣ Each coin has a written reason: why this one in particular? (A strong project you’re waiting for at a better price? A sector you believe in? A technical breakout coming soon?) If you can’t write the reason in a line — remove it.
3️⃣ It has exit conditions: the coin should leave the watchlist if the entry reason changes — the team dissolved, the project stopped, a competitor swept the market. A living watchlist is constantly cleaned.
4️⃣ Review it weekly, not every hour: monitoring isn’t just sticking your eyes to the screen — a structured weekly look is deeper than a thousand distracting glances.
“Every day a coin” gives you prepared candidates with analysis — your watchlist is built from them and from your research.
Bottom line: a small watchlist you know well is better than 100 coins you chase — every coin has a reason for being added and a reason for being removed.
Which number do you end up falling into? Write it in the comments 👇
#العملات_الرقمية #تعلم_الكريبتو #Binance
⚠️ Educational content — not investment advice
How do you build a proper watchlist instead of chasing every coin?
The problem with every beginner: the market has thousands of coins, and every day there’s a “new opportunity” that starts shining — the result is distraction and random decisions.
The solution is a simple tool: a watchlist. Not just a list of names — it’s a full method:
1️⃣ Small by right: 10 to 15 coins at most. Any more means you’re not truly monitoring — you’re just collecting names.
2️⃣ Each coin has a written reason: why this one in particular? (A strong project you’re waiting for at a better price? A sector you believe in? A technical breakout coming soon?) If you can’t write the reason in a line — remove it.
3️⃣ It has exit conditions: the coin should leave the watchlist if the entry reason changes — the team dissolved, the project stopped, a competitor swept the market. A living watchlist is constantly cleaned.
4️⃣ Review it weekly, not every hour: monitoring isn’t just sticking your eyes to the screen — a structured weekly look is deeper than a thousand distracting glances.
“Every day a coin” gives you prepared candidates with analysis — your watchlist is built from them and from your research.
Bottom line: a small watchlist you know well is better than 100 coins you chase — every coin has a reason for being added and a reason for being removed.
Which number do you end up falling into? Write it in the comments 👇
#العملات_الرقمية #تعلم_الكريبتو #Binance
⚠️ Educational content — not investment advice
2
14
3.9k
·
--
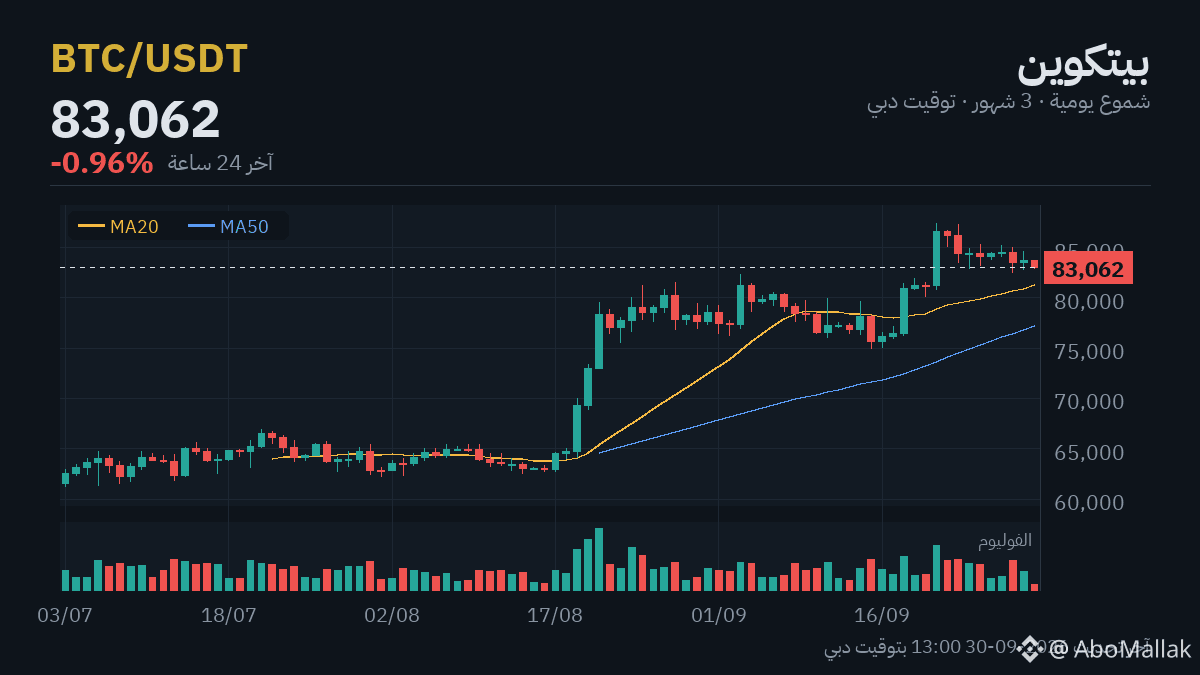
$BTC at $83,062 (-1.0%) · $ETH at $2,671 (-1.4%)
The market is choppy, and the recurring question is: do we wait, or has the picture become clear?
The levels I’m watching:
Above $84,560 the road opens to $85,456
And below $82,772 we go back to test $81,880
What keeps me neutral—not bullish—is that this rise has lower volume than its average.
The signal that tells me this reading is wrong is a break of $82,772 on volume.
If you’re planning to enter Bitcoin, entering in batches will protect you:
1- First batch if it returns to $80,571
2- Second at $78,079
3- Third at $75,587
And if it closes below $73,095, then the plan failed and you should exit. Then your loss is about 6% of the amount—not all of it.
The distance between batches is 3% because that’s the average daily movement of Bitcoin over the last 14 days.
Do your own research (DYOR)—this is a risk-management approach, not financial advice.
Where do you think the market is headed? Write your opinion.
💛 Join Abu Malak’s team: sign up on Binance with code ABOMALAK — permanent discount on trading fees, plus benefit from our services and offers
#CryptoNews #العملات_الرقمية #Binance
⚠️ Educational content to follow — not investment advice; your decision is your responsibility
$BTC at $83,062 (-1.0%) · $ETH at $2,671 (-1.4%)
The market is choppy, and the recurring question is: do we wait, or has the picture become clear?
The levels I’m watching:
Above $84,560 the road opens to $85,456
And below $82,772 we go back to test $81,880
What keeps me neutral—not bullish—is that this rise has lower volume than its average.
The signal that tells me this reading is wrong is a break of $82,772 on volume.
If you’re planning to enter Bitcoin, entering in batches will protect you:
1- First batch if it returns to $80,571
2- Second at $78,079
3- Third at $75,587
And if it closes below $73,095, then the plan failed and you should exit. Then your loss is about 6% of the amount—not all of it.
The distance between batches is 3% because that’s the average daily movement of Bitcoin over the last 14 days.
Do your own research (DYOR)—this is a risk-management approach, not financial advice.
Where do you think the market is headed? Write your opinion.
💛 Join Abu Malak’s team: sign up on Binance with code ABOMALAK — permanent discount on trading fees, plus benefit from our services and offers
#CryptoNews #العملات_الرقمية #Binance
⚠️ Educational content to follow — not investment advice; your decision is your responsibility
The market is choppy, and the recurring question is: do we wait, or has the picture become clear?
The levels I’m watching:
Above $84,560 the road opens to $85,456
And below $82,772 we go back to test $81,880
What keeps me neutral—not bullish—is that this rise has lower volume than its average.
The signal that tells me this reading is wrong is a break of $82,772 on volume.
If you’re planning to enter Bitcoin, entering in batches will protect you:
1- First batch if it returns to $80,571
2- Second at $78,079
3- Third at $75,587
And if it closes below $73,095, then the plan failed and you should exit. Then your loss is about 6% of the amount—not all of it.
The distance between batches is 3% because that’s the average daily movement of Bitcoin over the last 14 days.
Do your own research (DYOR)—this is a risk-management approach, not financial advice.
Where do you think the market is headed? Write your opinion.
💛 Join Abu Malak’s team: sign up on Binance with code ABOMALAK — permanent discount on trading fees, plus benefit from our services and offers
#CryptoNews #العملات_الرقمية #Binance
⚠️ Educational content to follow — not investment advice; your decision is your responsibility
1.1k
·
--
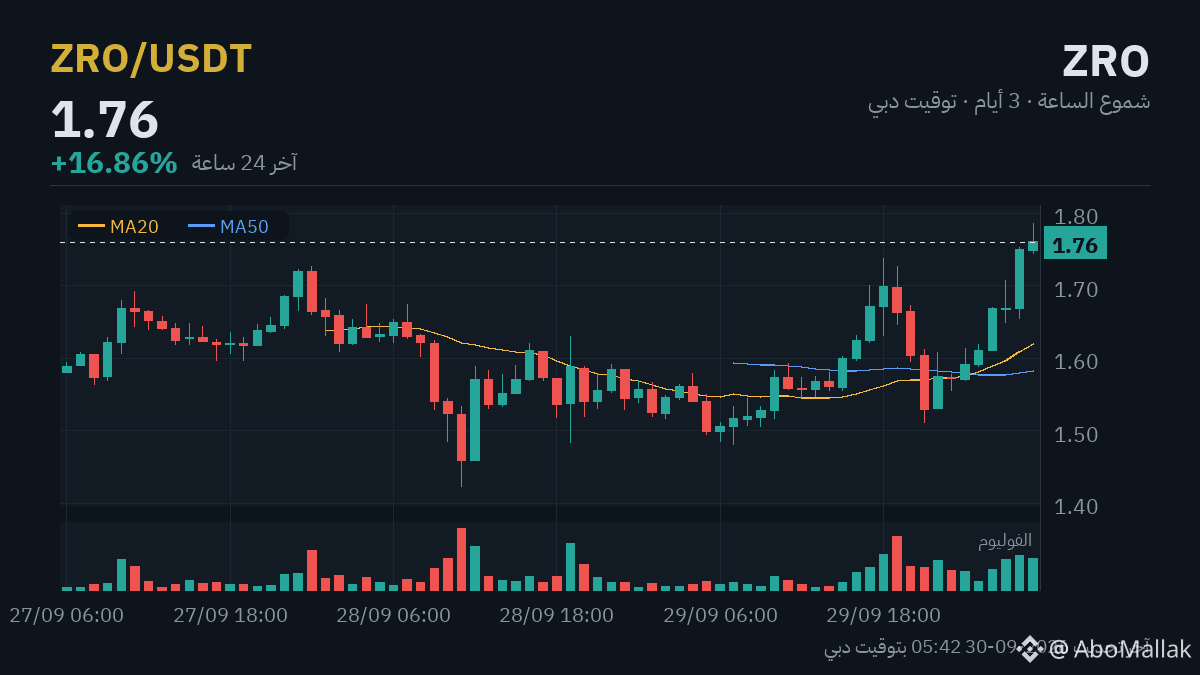
🚀 Bomb watch: $ZRO up +17.0% in 24 hours
Momentum strength: 77/100
✅ Liquidity $17M | ✅ Holding 98% of its peak | ✅ Volume is accompanying
▪️ Price now: $1.76
📊 Levels controlling the move:
▪️ Holding above $1.52 = the move is still ongoing
▪️ Breaking above $1.78 = the continuation door is open
▪️ Retracing back below $1.50 (start of the wave) = consider it finished
📊 ZRO is recording a notable rise of +17.0% over the past 24 hours, and the price reached $1.76 with trading liquidity around $17 million.
First scenario: If the price manages to break the resistance level at $1.78 with strong, sustained volume, it could give an indication of the bullish momentum continuing for a longer period.
Second scenario: If the price starts to pull back below $1.52 (the support level), that would be a potential sign that the pump’s strength is fading and the trend could change.
Watching the price action and liquidity in the coming hours will paint a clearer picture, and caution is always required during high-volatility like this.
If you’re planning to enter after a move like this, entering in batches protects you from putting everything in at the top:
1- First batch if it comes back to $1.70
2- Second at $1.63
3- Third at $1.57
And if it closes below $1.50, then the plan failed and you should exit. At that time, your loss would be about 8% of the amount—not all of it.
The exit level is the start of the wave above—below it, the move is considered over.
Do your own research (DYOR) — this is a risk-management approach, not a recommendation
Is the move continuing or is this the top? The chart is in front of you 👇 $ZRO
⚠️ Pump moves move aggressively in both directions—being late to enter is more dangerous than missing it
📉 Around it: $BTC is moving +0.5% in the same hours.
#ZRO #Altcoins #Digital_Currencies
⚠️ Educational content to follow — not investment advice; your decision is your responsibility
🚀 Bomb watch: $ZRO up +17.0% in 24 hours
Momentum strength: 77/100
✅ Liquidity $17M | ✅ Holding 98% of its peak | ✅ Volume is accompanying
▪️ Price now: $1.76
📊 Levels controlling the move:
▪️ Holding above $1.52 = the move is still ongoing
▪️ Breaking above $1.78 = the continuation door is open
▪️ Retracing back below $1.50 (start of the wave) = consider it finished
📊 ZRO is recording a notable rise of +17.0% over the past 24 hours, and the price reached $1.76 with trading liquidity around $17 million.
First scenario: If the price manages to break the resistance level at $1.78 with strong, sustained volume, it could give an indication of the bullish momentum continuing for a longer period.
Second scenario: If the price starts to pull back below $1.52 (the support level), that would be a potential sign that the pump’s strength is fading and the trend could change.
Watching the price action and liquidity in the coming hours will paint a clearer picture, and caution is always required during high-volatility like this.
If you’re planning to enter after a move like this, entering in batches protects you from putting everything in at the top:
1- First batch if it comes back to $1.70
2- Second at $1.63
3- Third at $1.57
And if it closes below $1.50, then the plan failed and you should exit. At that time, your loss would be about 8% of the amount—not all of it.
The exit level is the start of the wave above—below it, the move is considered over.
Do your own research (DYOR) — this is a risk-management approach, not a recommendation
Is the move continuing or is this the top? The chart is in front of you 👇 $ZRO
⚠️ Pump moves move aggressively in both directions—being late to enter is more dangerous than missing it
📉 Around it: $BTC is moving +0.5% in the same hours.
#ZRO #Altcoins #Digital_Currencies
⚠️ Educational content to follow — not investment advice; your decision is your responsibility
Momentum strength: 77/100
✅ Liquidity $17M | ✅ Holding 98% of its peak | ✅ Volume is accompanying
▪️ Price now: $1.76
📊 Levels controlling the move:
▪️ Holding above $1.52 = the move is still ongoing
▪️ Breaking above $1.78 = the continuation door is open
▪️ Retracing back below $1.50 (start of the wave) = consider it finished
📊 ZRO is recording a notable rise of +17.0% over the past 24 hours, and the price reached $1.76 with trading liquidity around $17 million.
First scenario: If the price manages to break the resistance level at $1.78 with strong, sustained volume, it could give an indication of the bullish momentum continuing for a longer period.
Second scenario: If the price starts to pull back below $1.52 (the support level), that would be a potential sign that the pump’s strength is fading and the trend could change.
Watching the price action and liquidity in the coming hours will paint a clearer picture, and caution is always required during high-volatility like this.
If you’re planning to enter after a move like this, entering in batches protects you from putting everything in at the top:
1- First batch if it comes back to $1.70
2- Second at $1.63
3- Third at $1.57
And if it closes below $1.50, then the plan failed and you should exit. At that time, your loss would be about 8% of the amount—not all of it.
The exit level is the start of the wave above—below it, the move is considered over.
Do your own research (DYOR) — this is a risk-management approach, not a recommendation
Is the move continuing or is this the top? The chart is in front of you 👇 $ZRO
⚠️ Pump moves move aggressively in both directions—being late to enter is more dangerous than missing it
📉 Around it: $BTC is moving +0.5% in the same hours.
#ZRO #Altcoins #Digital_Currencies
⚠️ Educational content to follow — not investment advice; your decision is your responsibility
5
1.5k
·
--
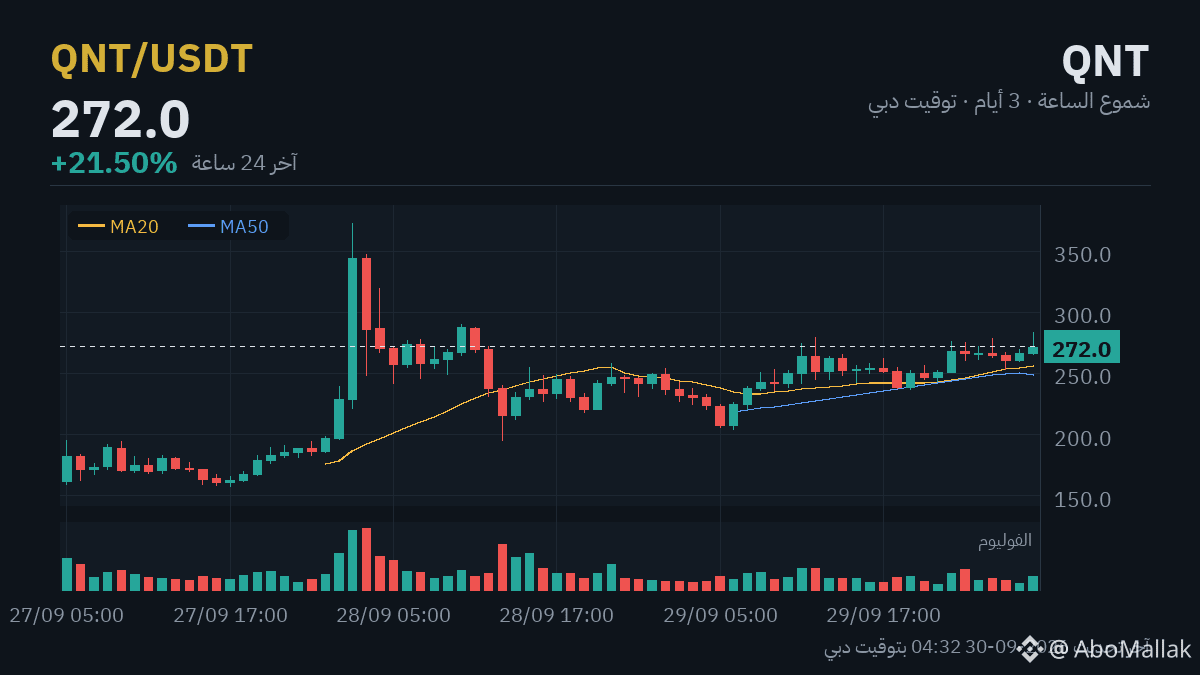
🚀 Bomb Watch: $QNT up +21.4% in 24 hours
Momentum Strength: 81/100
✅ Liquidity $165M | ✅ Holding 95% of its peak | ✅ Volume is accompanying
▪️ Price now: $271.96
📊 Levels controlling the move:
▪️ Holding above $220.87 = the move is still ongoing
▪️ Breaking $296.29 upward = the continuation door is open
▪️ Falling back below $224.05 (start of the wave) = consider it finished
📊 QNT movement tracking
The coin recorded a jump of +21.4% within 24 hours amid strong liquidity of $165 million, with the current price at $271.96.
First scenario: The upward momentum depends on the price’s ability to break the $296.29 level with stability and with the same liquidity strength—which is what could open the way for an additional upwave.
Second scenario: The move may lose momentum if the price fails to approach the resistance and starts to retreat below $220.87. Here, support becomes the last line of defense before a deeper correction.
Following liquidity and price behavior around these two levels is what will shape the next phase, and ultimately the market decides.
If you’re planning to enter after a move like this, entering in batches protects you from going all-in at the top:
1- First batch if it returns to $259.98
2- Second at $248.01
3- Third at $236.03
If it closes below $224.05, then the plan failed and you should exit. Your loss would be around 10% of the amount—not all of it.
The exit level is the start of the wave above—below it, the move is considered finished.
Do your own research (DYOR)—this is a risk-management approach, not an investment recommendation.
Will the move continue or is this the top? The chart is in front of you 👇 $QNT
⚠️ These pump moves swing violently in both directions—late entry is more dangerous than missing it.
📉 Market around it: $BTC moving +0.1% in the same hours.
#QNT #Altcoins #Digital_Currencies
⚠️ Educational content for follow-up — not investment advice and your decision is your responsibility
🚀 Bomb Watch: $QNT up +21.4% in 24 hours
Momentum Strength: 81/100
✅ Liquidity $165M | ✅ Holding 95% of its peak | ✅ Volume is accompanying
▪️ Price now: $271.96
📊 Levels controlling the move:
▪️ Holding above $220.87 = the move is still ongoing
▪️ Breaking $296.29 upward = the continuation door is open
▪️ Falling back below $224.05 (start of the wave) = consider it finished
📊 QNT movement tracking
The coin recorded a jump of +21.4% within 24 hours amid strong liquidity of $165 million, with the current price at $271.96.
First scenario: The upward momentum depends on the price’s ability to break the $296.29 level with stability and with the same liquidity strength—which is what could open the way for an additional upwave.
Second scenario: The move may lose momentum if the price fails to approach the resistance and starts to retreat below $220.87. Here, support becomes the last line of defense before a deeper correction.
Following liquidity and price behavior around these two levels is what will shape the next phase, and ultimately the market decides.
If you’re planning to enter after a move like this, entering in batches protects you from going all-in at the top:
1- First batch if it returns to $259.98
2- Second at $248.01
3- Third at $236.03
If it closes below $224.05, then the plan failed and you should exit. Your loss would be around 10% of the amount—not all of it.
The exit level is the start of the wave above—below it, the move is considered finished.
Do your own research (DYOR)—this is a risk-management approach, not an investment recommendation.
Will the move continue or is this the top? The chart is in front of you 👇 $QNT
⚠️ These pump moves swing violently in both directions—late entry is more dangerous than missing it.
📉 Market around it: $BTC moving +0.1% in the same hours.
#QNT #Altcoins #Digital_Currencies
⚠️ Educational content for follow-up — not investment advice and your decision is your responsibility
Momentum Strength: 81/100
✅ Liquidity $165M | ✅ Holding 95% of its peak | ✅ Volume is accompanying
▪️ Price now: $271.96
📊 Levels controlling the move:
▪️ Holding above $220.87 = the move is still ongoing
▪️ Breaking $296.29 upward = the continuation door is open
▪️ Falling back below $224.05 (start of the wave) = consider it finished
📊 QNT movement tracking
The coin recorded a jump of +21.4% within 24 hours amid strong liquidity of $165 million, with the current price at $271.96.
First scenario: The upward momentum depends on the price’s ability to break the $296.29 level with stability and with the same liquidity strength—which is what could open the way for an additional upwave.
Second scenario: The move may lose momentum if the price fails to approach the resistance and starts to retreat below $220.87. Here, support becomes the last line of defense before a deeper correction.
Following liquidity and price behavior around these two levels is what will shape the next phase, and ultimately the market decides.
If you’re planning to enter after a move like this, entering in batches protects you from going all-in at the top:
1- First batch if it returns to $259.98
2- Second at $248.01
3- Third at $236.03
If it closes below $224.05, then the plan failed and you should exit. Your loss would be around 10% of the amount—not all of it.
The exit level is the start of the wave above—below it, the move is considered finished.
Do your own research (DYOR)—this is a risk-management approach, not an investment recommendation.
Will the move continue or is this the top? The chart is in front of you 👇 $QNT
⚠️ These pump moves swing violently in both directions—late entry is more dangerous than missing it.
📉 Market around it: $BTC moving +0.1% in the same hours.
#QNT #Altcoins #Digital_Currencies
⚠️ Educational content for follow-up — not investment advice and your decision is your responsibility
1
5
2.8k
·
--
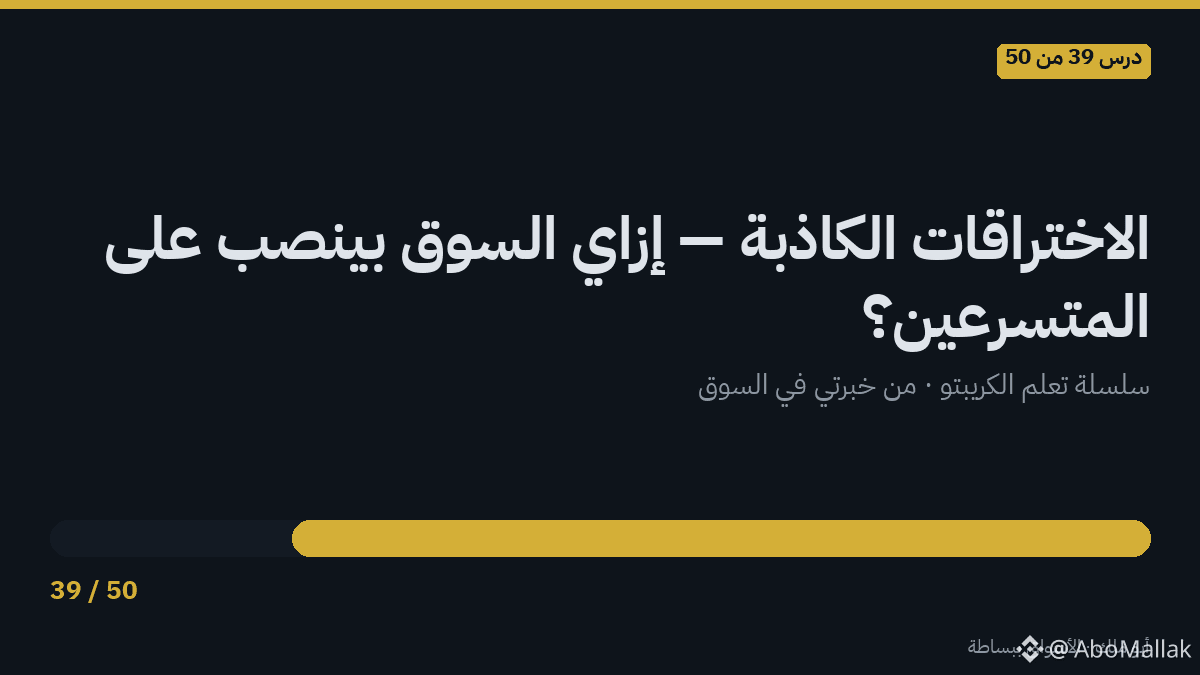
Lesson 39 of 50 — From My Experience in the Market
False Breakouts — How Does the Market Trap the Impatient?
One of the most costly traps that eats beginners’ money is the false breakout.
The common scenario: the price breaks an important resistance that everyone gets excited about “we’re off!” and they buy — then suddenly the price reverses, plunges hard, and those who entered on the breakout get trapped above it. The same thing happens in reverse with support breaks.
Why does this happen? Sometimes it’s natural (a failed attempt and that’s it), and sometimes it’s intentional: big players push the price above the resistance to gather liquidity from the excited traders, then sell into them.
How do you protect yourself?
· Don’t believe the breakout from the first touch — wait for a candle to close above the level for real (on the timeframe you’re trading)
· Look at the volume: a real break has clear money behind it — a break with weak volume is a big question mark
· Wait for the retest pause: a respectable breakout often comes back to retouch the broken level and continue — that pullback is a calmer opportunity than chasing the first candle.
In summary: false breakouts catch the ones who run behind the first move — wait for the close and the volume before you trust any breakout.
If you have a question about this point, write it in the comments 👇
#العملات_الرقمية #تعلم_الكريبتو #Binance
⚠️ Educational content — not investment advice
Lesson 39 of 50 — From My Experience in the Market
False Breakouts — How Does the Market Trap the Impatient?
One of the most costly traps that eats beginners’ money is the false breakout.
The common scenario: the price breaks an important resistance that everyone gets excited about “we’re off!” and they buy — then suddenly the price reverses, plunges hard, and those who entered on the breakout get trapped above it. The same thing happens in reverse with support breaks.
Why does this happen? Sometimes it’s natural (a failed attempt and that’s it), and sometimes it’s intentional: big players push the price above the resistance to gather liquidity from the excited traders, then sell into them.
How do you protect yourself?
· Don’t believe the breakout from the first touch — wait for a candle to close above the level for real (on the timeframe you’re trading)
· Look at the volume: a real break has clear money behind it — a break with weak volume is a big question mark
· Wait for the retest pause: a respectable breakout often comes back to retouch the broken level and continue — that pullback is a calmer opportunity than chasing the first candle.
In summary: false breakouts catch the ones who run behind the first move — wait for the close and the volume before you trust any breakout.
If you have a question about this point, write it in the comments 👇
#العملات_الرقمية #تعلم_الكريبتو #Binance
⚠️ Educational content — not investment advice
False Breakouts — How Does the Market Trap the Impatient?
One of the most costly traps that eats beginners’ money is the false breakout.
The common scenario: the price breaks an important resistance that everyone gets excited about “we’re off!” and they buy — then suddenly the price reverses, plunges hard, and those who entered on the breakout get trapped above it. The same thing happens in reverse with support breaks.
Why does this happen? Sometimes it’s natural (a failed attempt and that’s it), and sometimes it’s intentional: big players push the price above the resistance to gather liquidity from the excited traders, then sell into them.
How do you protect yourself?
· Don’t believe the breakout from the first touch — wait for a candle to close above the level for real (on the timeframe you’re trading)
· Look at the volume: a real break has clear money behind it — a break with weak volume is a big question mark
· Wait for the retest pause: a respectable breakout often comes back to retouch the broken level and continue — that pullback is a calmer opportunity than chasing the first candle.
In summary: false breakouts catch the ones who run behind the first move — wait for the close and the volume before you trust any breakout.
If you have a question about this point, write it in the comments 👇
#العملات_الرقمية #تعلم_الكريبتو #Binance
⚠️ Educational content — not investment advice
1
4
1.2k
·
--
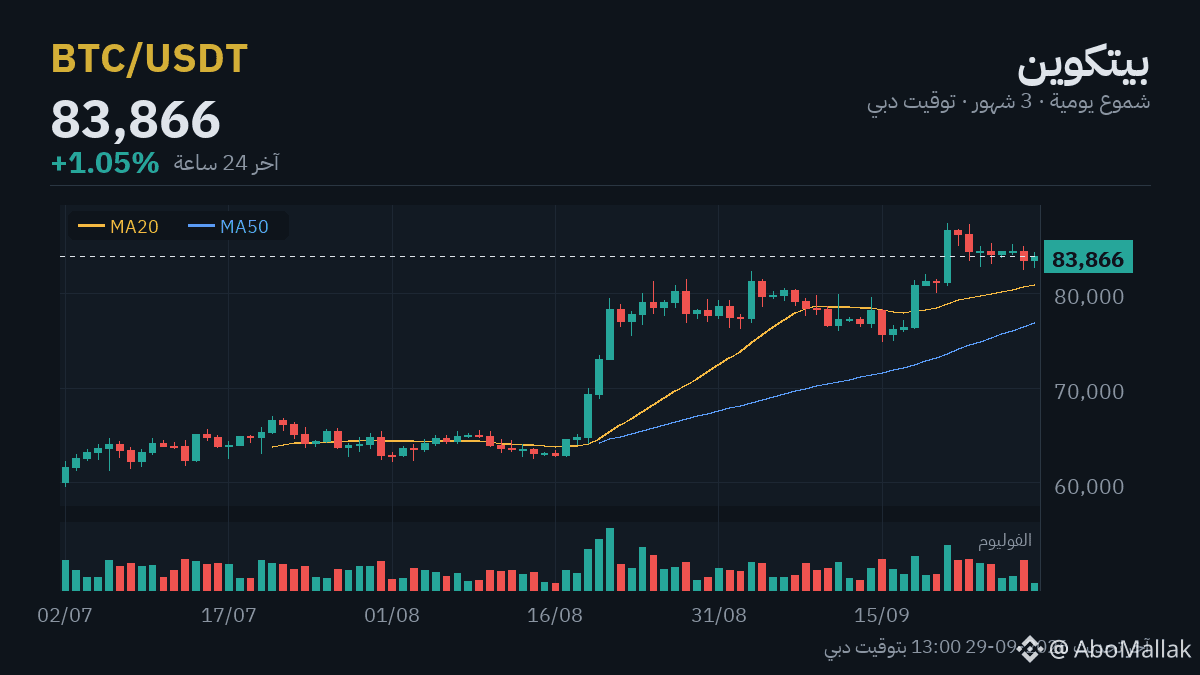
$BTC at $83,874 (+1.1%) · $ETH at $2,709 (+2.2%)
The market is volatile, and the recurring question is: should we wait or is the picture clearer?
Resistance: $84,812 then $86,123
Support: $82,376 then $81,251
An uptrend on weak volume makes me read the move cautiously, not with excitement.
What would change my view: a drop and consolidation below $81,251.
If you plan to enter Bitcoin, entering in batches protects you:
1- First batch if it returns to $81,358
2- Second at $78,842
3- Third at $76,325
If it closes below $73,809, then the plan has failed and you should exit. At that point, your loss is about 6% of the amount—not all of it.
The distance between the entries is 3% because it’s the average daily movement of Bitcoin over the last 14 days.
Do your own research (DYOR) — this is a risk-management approach, not an investment recommendation.
What level am I watching?
💛 Join Abu Malak’s team: sign up on Binance with code ABOMALAK — a permanent discount on trading fees, and access to our services and offers
#CryptoNews #العملات_الرقمية #Binance
⚠️ Educational content to follow — not investment advice; your decision and responsibility are yours
$BTC at $83,874 (+1.1%) · $ETH at $2,709 (+2.2%)
The market is volatile, and the recurring question is: should we wait or is the picture clearer?
Resistance: $84,812 then $86,123
Support: $82,376 then $81,251
An uptrend on weak volume makes me read the move cautiously, not with excitement.
What would change my view: a drop and consolidation below $81,251.
If you plan to enter Bitcoin, entering in batches protects you:
1- First batch if it returns to $81,358
2- Second at $78,842
3- Third at $76,325
If it closes below $73,809, then the plan has failed and you should exit. At that point, your loss is about 6% of the amount—not all of it.
The distance between the entries is 3% because it’s the average daily movement of Bitcoin over the last 14 days.
Do your own research (DYOR) — this is a risk-management approach, not an investment recommendation.
What level am I watching?
💛 Join Abu Malak’s team: sign up on Binance with code ABOMALAK — a permanent discount on trading fees, and access to our services and offers
#CryptoNews #العملات_الرقمية #Binance
⚠️ Educational content to follow — not investment advice; your decision and responsibility are yours
The market is volatile, and the recurring question is: should we wait or is the picture clearer?
Resistance: $84,812 then $86,123
Support: $82,376 then $81,251
An uptrend on weak volume makes me read the move cautiously, not with excitement.
What would change my view: a drop and consolidation below $81,251.
If you plan to enter Bitcoin, entering in batches protects you:
1- First batch if it returns to $81,358
2- Second at $78,842
3- Third at $76,325
If it closes below $73,809, then the plan has failed and you should exit. At that point, your loss is about 6% of the amount—not all of it.
The distance between the entries is 3% because it’s the average daily movement of Bitcoin over the last 14 days.
Do your own research (DYOR) — this is a risk-management approach, not an investment recommendation.
What level am I watching?
💛 Join Abu Malak’s team: sign up on Binance with code ABOMALAK — a permanent discount on trading fees, and access to our services and offers
#CryptoNews #العملات_الرقمية #Binance
⚠️ Educational content to follow — not investment advice; your decision and responsibility are yours
1
3
427
·
--
🚀 Bomb Watch: $CRV up +16.0% in 24 hours
Momentum Strength: 73/100
✅ Liquidity $11M | ✅ Holding 98% of its peak | ✅ Volume is accompanying
▪️ Price now: $0.3872
📊 Levels that control the move:
▪️ Holding above $0.3391 = the move is still ongoing
▪️ Breaking above $0.402 = the continuation door is open
▪️ Falling back below $0.333756 (the start of the wave) = consider it finished
**CRV Move Watch**
CRV is recording a notable rise of +16.0% over the last 24 hours, with traded liquidity of $11 million at the current price of $0.3872.
**Continuation scenario:** If the price manages to break the resistance level at $0.402 with strong trading volume and supportive liquidity, it could open the door for the bullish momentum to continue and signal that buyers are still in control of the market.
**Completion scenario:** On the other hand, if the price fails to break the resistance and starts falling below the support level at $0.3391, that would indicate weakening momentum and the likelihood of a correction or taking profit from those who entered early.
Tracking liquidity and the price reaction at these levels is what will determine the next direction.
If you plan to enter after a move like this, entering in portions protects you from going all-in at the top:
1- First tranche if it returns to $0.373839
2- Second at $0.360478
3- Third at $0.347117
And if it closes below $0.333756, then the plan failed and you should exit. Your loss would be about 7% of the amount, not all of it.
The exit level is the start of the wave above—below it, the move is considered finished.
Do your own research (DYOR)—this is a risk-management approach, not an investment recommendation.
Is the move continuing or is this the top? The chart is in front of you 👇 $CRV
⚠️ These pump moves move violently in both directions—late entries are more dangerous than missing them.
📉 Around it: $BTC moving -0.2% in the same hours.
#CRV #Altcoins #Digital_Currencies
⚠️ Educational content to follow—not investment advice and your decision is your responsibility
🚀 Bomb Watch: $CRV up +16.0% in 24 hours
Momentum Strength: 73/100
✅ Liquidity $11M | ✅ Holding 98% of its peak | ✅ Volume is accompanying
▪️ Price now: $0.3872
📊 Levels that control the move:
▪️ Holding above $0.3391 = the move is still ongoing
▪️ Breaking above $0.402 = the continuation door is open
▪️ Falling back below $0.333756 (the start of the wave) = consider it finished
**CRV Move Watch**
CRV is recording a notable rise of +16.0% over the last 24 hours, with traded liquidity of $11 million at the current price of $0.3872.
**Continuation scenario:** If the price manages to break the resistance level at $0.402 with strong trading volume and supportive liquidity, it could open the door for the bullish momentum to continue and signal that buyers are still in control of the market.
**Completion scenario:** On the other hand, if the price fails to break the resistance and starts falling below the support level at $0.3391, that would indicate weakening momentum and the likelihood of a correction or taking profit from those who entered early.
Tracking liquidity and the price reaction at these levels is what will determine the next direction.
If you plan to enter after a move like this, entering in portions protects you from going all-in at the top:
1- First tranche if it returns to $0.373839
2- Second at $0.360478
3- Third at $0.347117
And if it closes below $0.333756, then the plan failed and you should exit. Your loss would be about 7% of the amount, not all of it.
The exit level is the start of the wave above—below it, the move is considered finished.
Do your own research (DYOR)—this is a risk-management approach, not an investment recommendation.
Is the move continuing or is this the top? The chart is in front of you 👇 $CRV
⚠️ These pump moves move violently in both directions—late entries are more dangerous than missing them.
📉 Around it: $BTC moving -0.2% in the same hours.
#CRV #Altcoins #Digital_Currencies
⚠️ Educational content to follow—not investment advice and your decision is your responsibility
Momentum Strength: 73/100
✅ Liquidity $11M | ✅ Holding 98% of its peak | ✅ Volume is accompanying
▪️ Price now: $0.3872
📊 Levels that control the move:
▪️ Holding above $0.3391 = the move is still ongoing
▪️ Breaking above $0.402 = the continuation door is open
▪️ Falling back below $0.333756 (the start of the wave) = consider it finished
**CRV Move Watch**
CRV is recording a notable rise of +16.0% over the last 24 hours, with traded liquidity of $11 million at the current price of $0.3872.
**Continuation scenario:** If the price manages to break the resistance level at $0.402 with strong trading volume and supportive liquidity, it could open the door for the bullish momentum to continue and signal that buyers are still in control of the market.
**Completion scenario:** On the other hand, if the price fails to break the resistance and starts falling below the support level at $0.3391, that would indicate weakening momentum and the likelihood of a correction or taking profit from those who entered early.
Tracking liquidity and the price reaction at these levels is what will determine the next direction.
If you plan to enter after a move like this, entering in portions protects you from going all-in at the top:
1- First tranche if it returns to $0.373839
2- Second at $0.360478
3- Third at $0.347117
And if it closes below $0.333756, then the plan failed and you should exit. Your loss would be about 7% of the amount, not all of it.
The exit level is the start of the wave above—below it, the move is considered finished.
Do your own research (DYOR)—this is a risk-management approach, not an investment recommendation.
Is the move continuing or is this the top? The chart is in front of you 👇 $CRV
⚠️ These pump moves move violently in both directions—late entries are more dangerous than missing them.
📉 Around it: $BTC moving -0.2% in the same hours.
#CRV #Altcoins #Digital_Currencies
⚠️ Educational content to follow—not investment advice and your decision is your responsibility
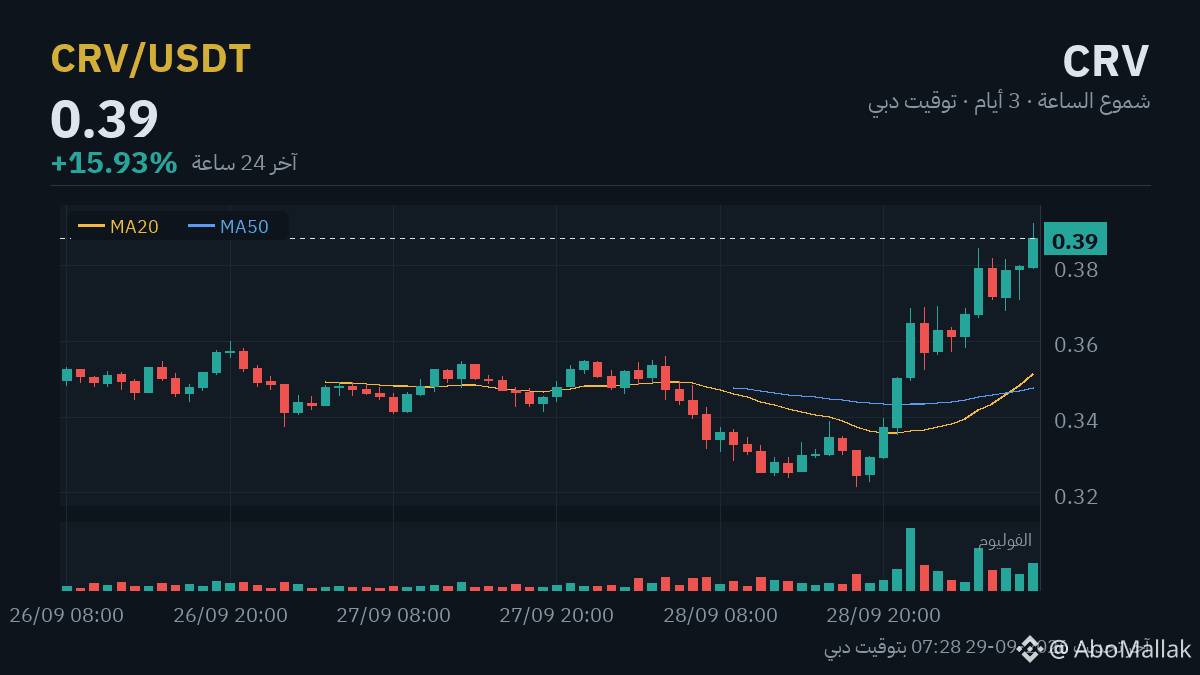
752
·
--
🚀 Bomb Watch: $ALGO up +13.1% in 24 hours
Momentum strength: 77/100
✅ Liquidity $30M | ✅ Holding 98% of its peak | ✅ Volume is accompanying
▪️ Price now: $0.1346
📊 Levels that control the move:
▪️ Staying above $0.1206 = the move is still ongoing
▪️ Breaking above $0.1457 = the continuation gate is open
▪️ Falling back below $0.119012 (wave start) = consider it finished
Technical watch for ALGO movement: The coin is up +13.1% over 24 hours with trading liquidity reaching $30 million, and the current price is $0.1346.
First scenario: For the upward momentum to continue, the price needs to hold above the $0.1206 area as support, while maintaining or increasing liquidity. This could open the way toward testing the $0.1457 resistance.
Second scenario: Signs of weakness appear if there is a bounce and a break of the $0.1206 support level, along with a clear drop in trading liquidity—this would indicate that the current momentum is starting to lose strength.
Watching both price and liquidity together is what will determine which scenario actually plays out.
If you plan to enter after a move like this, entering in batches protects you from going all-in at the top:
1- First batch if it returns to $0.130703
2- Second at $0.126806
3- Third at $0.122909
And if it closes below $0.119012, then the plan failed and you should exit. In that case, your loss is about 6% of the amount—not all of it.
The exit level is the start of the wave above—below it, the move is considered finished.
Do your own research (DYOR)—this is a risk-management style, not an investment recommendation.
Will this keep going or is this the top? The chart is in front of you 👇 $ALGO
⚠️ These pump moves are violent in both directions—late entries are more dangerous than missing them.
📉 Around the market: $BTC is moving -0.7% during the same hours.
#ALGO #Altcoins #Digital_Currencies
⚠️ Educational content for follow-up—not investment advice. Your decision is your responsibility
🚀 Bomb Watch: $ALGO up +13.1% in 24 hours
Momentum strength: 77/100
✅ Liquidity $30M | ✅ Holding 98% of its peak | ✅ Volume is accompanying
▪️ Price now: $0.1346
📊 Levels that control the move:
▪️ Staying above $0.1206 = the move is still ongoing
▪️ Breaking above $0.1457 = the continuation gate is open
▪️ Falling back below $0.119012 (wave start) = consider it finished
Technical watch for ALGO movement: The coin is up +13.1% over 24 hours with trading liquidity reaching $30 million, and the current price is $0.1346.
First scenario: For the upward momentum to continue, the price needs to hold above the $0.1206 area as support, while maintaining or increasing liquidity. This could open the way toward testing the $0.1457 resistance.
Second scenario: Signs of weakness appear if there is a bounce and a break of the $0.1206 support level, along with a clear drop in trading liquidity—this would indicate that the current momentum is starting to lose strength.
Watching both price and liquidity together is what will determine which scenario actually plays out.
If you plan to enter after a move like this, entering in batches protects you from going all-in at the top:
1- First batch if it returns to $0.130703
2- Second at $0.126806
3- Third at $0.122909
And if it closes below $0.119012, then the plan failed and you should exit. In that case, your loss is about 6% of the amount—not all of it.
The exit level is the start of the wave above—below it, the move is considered finished.
Do your own research (DYOR)—this is a risk-management style, not an investment recommendation.
Will this keep going or is this the top? The chart is in front of you 👇 $ALGO
⚠️ These pump moves are violent in both directions—late entries are more dangerous than missing them.
📉 Around the market: $BTC is moving -0.7% during the same hours.
#ALGO #Altcoins #Digital_Currencies
⚠️ Educational content for follow-up—not investment advice. Your decision is your responsibility
Momentum strength: 77/100
✅ Liquidity $30M | ✅ Holding 98% of its peak | ✅ Volume is accompanying
▪️ Price now: $0.1346
📊 Levels that control the move:
▪️ Staying above $0.1206 = the move is still ongoing
▪️ Breaking above $0.1457 = the continuation gate is open
▪️ Falling back below $0.119012 (wave start) = consider it finished
Technical watch for ALGO movement: The coin is up +13.1% over 24 hours with trading liquidity reaching $30 million, and the current price is $0.1346.
First scenario: For the upward momentum to continue, the price needs to hold above the $0.1206 area as support, while maintaining or increasing liquidity. This could open the way toward testing the $0.1457 resistance.
Second scenario: Signs of weakness appear if there is a bounce and a break of the $0.1206 support level, along with a clear drop in trading liquidity—this would indicate that the current momentum is starting to lose strength.
Watching both price and liquidity together is what will determine which scenario actually plays out.
If you plan to enter after a move like this, entering in batches protects you from going all-in at the top:
1- First batch if it returns to $0.130703
2- Second at $0.126806
3- Third at $0.122909
And if it closes below $0.119012, then the plan failed and you should exit. In that case, your loss is about 6% of the amount—not all of it.
The exit level is the start of the wave above—below it, the move is considered finished.
Do your own research (DYOR)—this is a risk-management style, not an investment recommendation.
Will this keep going or is this the top? The chart is in front of you 👇 $ALGO
⚠️ These pump moves are violent in both directions—late entries are more dangerous than missing them.
📉 Around the market: $BTC is moving -0.7% during the same hours.
#ALGO #Altcoins #Digital_Currencies
⚠️ Educational content for follow-up—not investment advice. Your decision is your responsibility
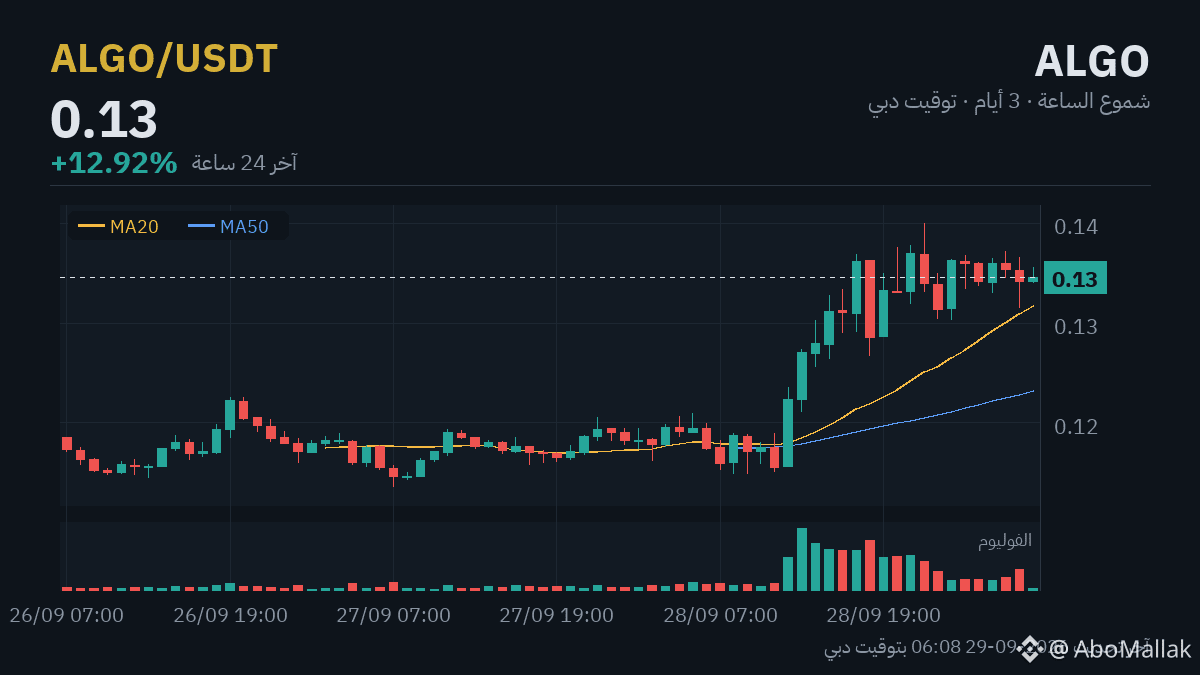
735
·
--
If you were among the people who bought gold in the past period and are now losing after gold fell today, let me tell you exactly what happened: how gold dropped, and how you can get your money back with a profit if you want to sell in the nearest time.
First: what happened? 3 reasons with no fourth.
Iran offered to reopen the Strait of Hormuz within 7 days, and Trump rejected the offer and threatened new strikes—because he believes Iran is losing and is playing a bigger role than its size, and negotiations will return only if it changes its terms.
At the same time, oil crossed $100, and the US dollar index rose above 101 points.
The result is that gold fell today by about 2.5% and broke the $4,200 level—its lowest point since early August.
If you were among the people who bought gold in the past period and are now losing after gold fell today, let me tell you exactly what happened: how gold dropped, and how you can get your money back with a profit if you want to sell in the nearest time.
First: what happened? 3 reasons with no fourth.
Iran offered to reopen the Strait of Hormuz within 7 days, and Trump rejected the offer and threatened new strikes—because he believes Iran is losing and is playing a bigger role than its size, and negotiations will return only if it changes its terms.
At the same time, oil crossed $100, and the US dollar index rose above 101 points.
The result is that gold fell today by about 2.5% and broke the $4,200 level—its lowest point since early August.
First: what happened? 3 reasons with no fourth.
Iran offered to reopen the Strait of Hormuz within 7 days, and Trump rejected the offer and threatened new strikes—because he believes Iran is losing and is playing a bigger role than its size, and negotiations will return only if it changes its terms.
At the same time, oil crossed $100, and the US dollar index rose above 101 points.
The result is that gold fell today by about 2.5% and broke the $4,200 level—its lowest point since early August.
1
1
11
5.2k
·
--
Lesson 38 of 50 — From my experience in the market
Why does crypto move with global markets?
Back then, there was a theory that crypto is “isolated” from traditional markets—these past years have proven the exact opposite.
So why is it now connected? Because the big players stayed the same: funds and institutions distribute their money across all assets—so when conditions get tighter, they reduce risk everywhere at once, and crypto is the first to get reduced.
The three most important relationships to understand:
· Global liquidity: when central banks make more money available, it searches for opportunities, and part of that reaches crypto—when they tighten, it’s the opposite
· The US dollar: historically, its strong value puts pressure on all risky assets—its weakness does the same in reverse (remember our dominance and dollar alerts in our channels? That’s the story)
· Overall risk appetite: when tech stocks drop hard, crypto is rarely doing well
Conclusion: don’t look at the crypto chart alone—look at the bigger picture, since it’s part of it.
Do you see it this way too, or do you have a different opinion? Write it in the comments 👇
#العملات_الرقمية #تعلم_الكريبتو #Binance
⚠️ Educational content — not investment advice
Lesson 38 of 50 — From my experience in the market
Why does crypto move with global markets?
Back then, there was a theory that crypto is “isolated” from traditional markets—these past years have proven the exact opposite.
So why is it now connected? Because the big players stayed the same: funds and institutions distribute their money across all assets—so when conditions get tighter, they reduce risk everywhere at once, and crypto is the first to get reduced.
The three most important relationships to understand:
· Global liquidity: when central banks make more money available, it searches for opportunities, and part of that reaches crypto—when they tighten, it’s the opposite
· The US dollar: historically, its strong value puts pressure on all risky assets—its weakness does the same in reverse (remember our dominance and dollar alerts in our channels? That’s the story)
· Overall risk appetite: when tech stocks drop hard, crypto is rarely doing well
Conclusion: don’t look at the crypto chart alone—look at the bigger picture, since it’s part of it.
Do you see it this way too, or do you have a different opinion? Write it in the comments 👇
#العملات_الرقمية #تعلم_الكريبتو #Binance
⚠️ Educational content — not investment advice
Why does crypto move with global markets?
Back then, there was a theory that crypto is “isolated” from traditional markets—these past years have proven the exact opposite.
So why is it now connected? Because the big players stayed the same: funds and institutions distribute their money across all assets—so when conditions get tighter, they reduce risk everywhere at once, and crypto is the first to get reduced.
The three most important relationships to understand:
· Global liquidity: when central banks make more money available, it searches for opportunities, and part of that reaches crypto—when they tighten, it’s the opposite
· The US dollar: historically, its strong value puts pressure on all risky assets—its weakness does the same in reverse (remember our dominance and dollar alerts in our channels? That’s the story)
· Overall risk appetite: when tech stocks drop hard, crypto is rarely doing well
Conclusion: don’t look at the crypto chart alone—look at the bigger picture, since it’s part of it.
Do you see it this way too, or do you have a different opinion? Write it in the comments 👇
#العملات_الرقمية #تعلم_الكريبتو #Binance
⚠️ Educational content — not investment advice
1
5
894
·
--
$BTC At $82,962 (-2.2%) · $ETH At $2,651 (-2.3%)
The market is volatile, and the recurring question is: do we wait, or has the picture become clear?
If you want to summarize the picture in two numbers: $84,016 below and $85,043 above. What happens outside them is what will determine what comes next.
The reason I’m neutral is that I’m not excited about this upward move, because its volume is lower than its average.
If $85,043 is broken with a close, then the picture changes for the better.
If you’re planning to enter Bitcoin, entering in batches protects you:
1- First batch if it returns to $80,473
2- Second at $77,984
3- Third at $75,495
And if it closes below $73,007, then the plan has failed and you exit. In that case, your loss is about 6% of the amount—not all of it.
The distance between the batches is 3% because that’s Bitcoin’s average daily movement over the last 14 days.
Do your own research (DYOR) — this is a risk-management approach, not an investment recommendation.
If you have another level you’re watching in the market, write it down.
💛 Join Abu Malak’s team: Register on Binance with code ABOMALAK — permanent discount on trading fees, and benefit from our services and offers
#CryptoNews #العملات_الرقمية #Binance
⚠️ Educational content for follow-up — not investment advice; your decision is your responsibility
$BTC At $82,962 (-2.2%) · $ETH At $2,651 (-2.3%)
The market is volatile, and the recurring question is: do we wait, or has the picture become clear?
If you want to summarize the picture in two numbers: $84,016 below and $85,043 above. What happens outside them is what will determine what comes next.
The reason I’m neutral is that I’m not excited about this upward move, because its volume is lower than its average.
If $85,043 is broken with a close, then the picture changes for the better.
If you’re planning to enter Bitcoin, entering in batches protects you:
1- First batch if it returns to $80,473
2- Second at $77,984
3- Third at $75,495
And if it closes below $73,007, then the plan has failed and you exit. In that case, your loss is about 6% of the amount—not all of it.
The distance between the batches is 3% because that’s Bitcoin’s average daily movement over the last 14 days.
Do your own research (DYOR) — this is a risk-management approach, not an investment recommendation.
If you have another level you’re watching in the market, write it down.
💛 Join Abu Malak’s team: Register on Binance with code ABOMALAK — permanent discount on trading fees, and benefit from our services and offers
#CryptoNews #العملات_الرقمية #Binance
⚠️ Educational content for follow-up — not investment advice; your decision is your responsibility
The market is volatile, and the recurring question is: do we wait, or has the picture become clear?
If you want to summarize the picture in two numbers: $84,016 below and $85,043 above. What happens outside them is what will determine what comes next.
The reason I’m neutral is that I’m not excited about this upward move, because its volume is lower than its average.
If $85,043 is broken with a close, then the picture changes for the better.
If you’re planning to enter Bitcoin, entering in batches protects you:
1- First batch if it returns to $80,473
2- Second at $77,984
3- Third at $75,495
And if it closes below $73,007, then the plan has failed and you exit. In that case, your loss is about 6% of the amount—not all of it.
The distance between the batches is 3% because that’s Bitcoin’s average daily movement over the last 14 days.
Do your own research (DYOR) — this is a risk-management approach, not an investment recommendation.
If you have another level you’re watching in the market, write it down.
💛 Join Abu Malak’s team: Register on Binance with code ABOMALAK — permanent discount on trading fees, and benefit from our services and offers
#CryptoNews #العملات_الرقمية #Binance
⚠️ Educational content for follow-up — not investment advice; your decision is your responsibility
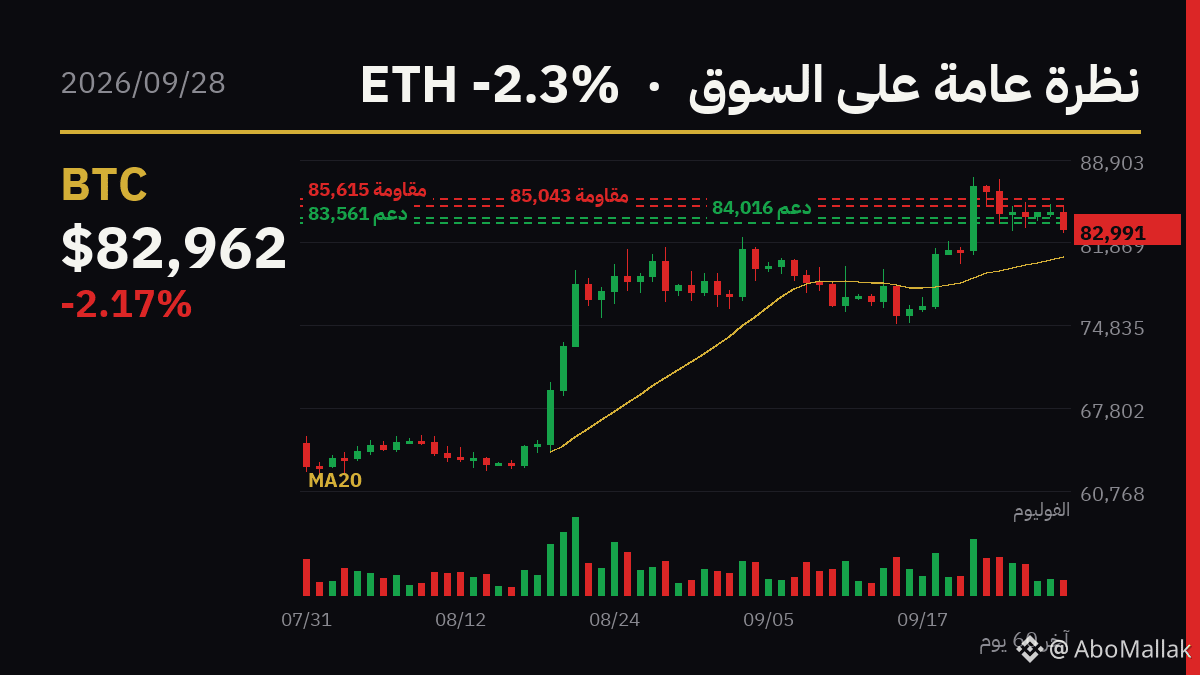
2
936
Log in to explore more content
Join global crypto users on Binance Square
⚡️ Get latest and useful information about crypto.
💬 Trusted by the world’s largest crypto exchange.
👍 Discover real insights from verified creators.
Email / Phone number