
91videoeth
635 Posts

91videoeth
Report
Block User
阿酒社区主理人,喜欢分享自己的观点,谢谢你这么帅气漂亮还关注我!
62 Following
10.3K+ Followers
2.3K+ Liked
Posts
All
Quotes
Videos
PINNED
·
--
Bullish
Regarding the belief in $SOL, SOL is one of the strongest betas in this cycle in my opinion. So I opened a position at 30 and a heavy position at 40. I kept adding to my position and never reduced my position.
I was chatting with my parents in the car a few days ago, and they asked me what I was most optimistic about this round. I answered $SOL without hesitation.
I said if you want a stable annual return of 20%, buy U.S. Bond ETFs; if you want a doubling opportunity, choose BTC; if you want 5 to 10 times, choose $SOL.
It took a 30-minute drive to convince them, so they bought SOL at a price of 100. I'm looking forward to the day when he gets his ATH.
Regarding the belief in $SOL , SOL is one of the strongest betas in this cycle in my opinion. So I opened a position at 30 and a heavy position at 40. I kept adding to my position and never reduced my position.
I was chatting with my parents in the car a few days ago, and they asked me what I was most optimistic about this round. I answered $SOL without hesitation.
I said if you want a stable annual return of 20%, buy U.S. Bond ETFs; if you want a doubling opportunity, choose BTC; if you want 5 to 10 times, choose $SOL .
It took a 30-minute drive to convince them, so they bought SOL at a price of 100. I'm looking forward to the day when he gets his ATH.
I was chatting with my parents in the car a few days ago, and they asked me what I was most optimistic about this round. I answered $SOL without hesitation.
I said if you want a stable annual return of 20%, buy U.S. Bond ETFs; if you want a doubling opportunity, choose BTC; if you want 5 to 10 times, choose $SOL .
It took a 30-minute drive to convince them, so they bought SOL at a price of 100. I'm looking forward to the day when he gets his ATH.
75
2
40
126k
·
--
Circle is about to release its earnings report. Does issuing more stablecoins mean it can earn more?
First, how does it make money? Basically, it earns interest passively!
Circle’s core business model is actually very simple and straightforward: earning interest on USDC reserves.
People exchange dollars for USDC, and Circle uses that money to buy short-term U.S. Treasury bills or deposit it in banks.
The more USDC in circulation, the larger the reserve pool—and naturally, the more interest it can earn. Interest is its main source of revenue.
This strategy works great when interest rates are rising. But once the Fed starts cutting rates, interest income shrinks—even if the amount of USDC in circulation stays the same.
Earning more doesn’t mean more money ends up in its pocket. Some of it gets shared.
When reading the earnings report, don’t just look at total revenue. You also need to see how much is left at the end!
Building such a large USDC ecosystem depends on customer acquisition channels like Coinbase. Circle has to share a substantial portion of its interest income with these partners, which adds up to a lot of money.
Add compliance, technology maintenance, and ecosystem incentives, and even when the business grows, there may not be much net profit left.
So, can it keep delivering returns going forward?
The market isn’t concerned with how long it can earn interest. It wants to know whether Circle can scale and stabilize its business!
Regulations are becoming clearer around the world, and many traditional financial institutions and cross-border businesses are starting to feel comfortable settling transactions with USDC. This is real, tangible demand.
What will ultimately determine its success is whether it can expand into non-interest revenue streams, such as payment gateway services and software fees, instead of being entirely at the mercy of the Fed’s interest rates$CRCL
#circle
{future}(CRCLUSDT)
Circle is about to release its earnings report. Does issuing more stablecoins mean it can earn more?
First, how does it make money? Basically, it earns interest passively!
Circle’s core business model is actually very simple and straightforward: earning interest on USDC reserves.
People exchange dollars for USDC, and Circle uses that money to buy short-term U.S. Treasury bills or deposit it in banks.
The more USDC in circulation, the larger the reserve pool—and naturally, the more interest it can earn. Interest is its main source of revenue.
This strategy works great when interest rates are rising. But once the Fed starts cutting rates, interest income shrinks—even if the amount of USDC in circulation stays the same.
Earning more doesn’t mean more money ends up in its pocket. Some of it gets shared.
When reading the earnings report, don’t just look at total revenue. You also need to see how much is left at the end!
Building such a large USDC ecosystem depends on customer acquisition channels like Coinbase. Circle has to share a substantial portion of its interest income with these partners, which adds up to a lot of money.
Add compliance, technology maintenance, and ecosystem incentives, and even when the business grows, there may not be much net profit left.
So, can it keep delivering returns going forward?
The market isn’t concerned with how long it can earn interest. It wants to know whether Circle can scale and stabilize its business!
Regulations are becoming clearer around the world, and many traditional financial institutions and cross-border businesses are starting to feel comfortable settling transactions with USDC. This is real, tangible demand.
What will ultimately determine its success is whether it can expand into non-interest revenue streams, such as payment gateway services and software fees, instead of being entirely at the mercy of the Fed’s interest rates$CRCL
#circle
First, how does it make money? Basically, it earns interest passively!
Circle’s core business model is actually very simple and straightforward: earning interest on USDC reserves.
People exchange dollars for USDC, and Circle uses that money to buy short-term U.S. Treasury bills or deposit it in banks.
The more USDC in circulation, the larger the reserve pool—and naturally, the more interest it can earn. Interest is its main source of revenue.
This strategy works great when interest rates are rising. But once the Fed starts cutting rates, interest income shrinks—even if the amount of USDC in circulation stays the same.
Earning more doesn’t mean more money ends up in its pocket. Some of it gets shared.
When reading the earnings report, don’t just look at total revenue. You also need to see how much is left at the end!
Building such a large USDC ecosystem depends on customer acquisition channels like Coinbase. Circle has to share a substantial portion of its interest income with these partners, which adds up to a lot of money.
Add compliance, technology maintenance, and ecosystem incentives, and even when the business grows, there may not be much net profit left.
So, can it keep delivering returns going forward?
The market isn’t concerned with how long it can earn interest. It wants to know whether Circle can scale and stabilize its business!
Regulations are becoming clearer around the world, and many traditional financial institutions and cross-border businesses are starting to feel comfortable settling transactions with USDC. This is real, tangible demand.
What will ultimately determine its success is whether it can expand into non-interest revenue streams, such as payment gateway services and software fees, instead of being entirely at the mercy of the Fed’s interest rates$CRCL
#circle
341
·
--
$ETH You're a veteran actor too. Good night!
{future}(ETHUSDT)
$ETH You're a veteran actor too. Good night!
1.1k
1
50
1.1k
·
--
$BTC I feel like I'm getting hard. I'm going to sleep. Good night!
{future}(BTCUSDT)
$BTC I feel like I'm getting hard. I'm going to sleep. Good night!
77
1
4
480
·
--
How many U do you think this needs?
$BNB
{future}(BNBUSDT)
How many U do you think this needs?
$BNB
$BNB

2
1.6k
·
--
Driven by the U.S. midterm elections, the crypto market has been highly volatile amid macro-political uncertainty and net outflows
The midterm elections’ deeper impact on the market is reflected in three main areas:
I. Macro and market dynamics: expectations priced in and sentiment taking shape
1. Historical patterns and risk unwinding: Ahead of elections, risk aversion often drives defensive pullbacks of 5%–10%. Liquidations of leveraged long positions are part of the market shakeout under extreme uncertainty.
2. Prediction markets and the resolution of uncertainty: Prediction markets have already priced in the political landscape with high probability. Once the political uncertainty is resolved, the easing of short-term risk aversion could help the market stage a temporary recovery.
3. Alignment with the cycle and macro trends: Midterm elections usually fall in the middle to latter part of Bitcoin’s halving cycle. The Fed’s interest-rate path, global liquidity, and risk appetite in U.S. equities have a greater influence on the medium- to long-term trend than any single political election.
II. Funding and technical factors: fund redemptions and key lines of defense
1. ETF fund flows: Large single-day net outflows from spot ETFs reflect institutional investors’ wait-and-see stance ahead of the election. The key question is whether ETF flows will return to net inflows after Election Day.
2. $BTC key structural support: The $70,000–$71,000 range is a psychological line of defense for maintaining the broader bull-market structure; the $75,000–$76,400 range marks key support at the moving averages and lower boundary. A breach could trigger a second test of the lows.
III. Policy and regulation: Congressional composition determines the legislative path
1. Unified control: If one party controls both chambers, progress on market-structure legislation clarifying regulatory responsibilities is likely to accelerate, helping establish a clear framework for institutional participation.
2. Divided government: If the president and Congress are controlled by different parties, or the two chambers are split, legislative progress may slow or stall. The industry’s focus would then shift to proactive regulatory guidance from agencies and the organic development of areas such as RWAs and stablecoins.
The market is currently characterized by political catalysts playing a secondary role, with liquidity and market structure taking center stage. Given cyclical indicators that lack clear stop-loss levels or trigger signals, a prudent strategy would be to reduce leverage and avoid periods of extreme volatility, while paying close attention to changes in ETF flows after the election is confirmed and to price action around key support zones.
#美国中期选举倒计时,美股博弈窗口已开启?
{future}(BTCUSDT)
Driven by the U.S. midterm elections, the crypto market has been highly volatile amid macro-political uncertainty and net outflows
The midterm elections’ deeper impact on the market is reflected in three main areas:
I. Macro and market dynamics: expectations priced in and sentiment taking shape
1. Historical patterns and risk unwinding: Ahead of elections, risk aversion often drives defensive pullbacks of 5%–10%. Liquidations of leveraged long positions are part of the market shakeout under extreme uncertainty.
2. Prediction markets and the resolution of uncertainty: Prediction markets have already priced in the political landscape with high probability. Once the political uncertainty is resolved, the easing of short-term risk aversion could help the market stage a temporary recovery.
3. Alignment with the cycle and macro trends: Midterm elections usually fall in the middle to latter part of Bitcoin’s halving cycle. The Fed’s interest-rate path, global liquidity, and risk appetite in U.S. equities have a greater influence on the medium- to long-term trend than any single political election.
II. Funding and technical factors: fund redemptions and key lines of defense
1. ETF fund flows: Large single-day net outflows from spot ETFs reflect institutional investors’ wait-and-see stance ahead of the election. The key question is whether ETF flows will return to net inflows after Election Day.
2. $BTC key structural support: The $70,000–$71,000 range is a psychological line of defense for maintaining the broader bull-market structure; the $75,000–$76,400 range marks key support at the moving averages and lower boundary. A breach could trigger a second test of the lows.
III. Policy and regulation: Congressional composition determines the legislative path
1. Unified control: If one party controls both chambers, progress on market-structure legislation clarifying regulatory responsibilities is likely to accelerate, helping establish a clear framework for institutional participation.
2. Divided government: If the president and Congress are controlled by different parties, or the two chambers are split, legislative progress may slow or stall. The industry’s focus would then shift to proactive regulatory guidance from agencies and the organic development of areas such as RWAs and stablecoins.
The market is currently characterized by political catalysts playing a secondary role, with liquidity and market structure taking center stage. Given cyclical indicators that lack clear stop-loss levels or trigger signals, a prudent strategy would be to reduce leverage and avoid periods of extreme volatility, while paying close attention to changes in ETF flows after the election is confirmed and to price action around key support zones.
#美国中期选举倒计时,美股博弈窗口已开启?
The midterm elections’ deeper impact on the market is reflected in three main areas:
I. Macro and market dynamics: expectations priced in and sentiment taking shape
1. Historical patterns and risk unwinding: Ahead of elections, risk aversion often drives defensive pullbacks of 5%–10%. Liquidations of leveraged long positions are part of the market shakeout under extreme uncertainty.
2. Prediction markets and the resolution of uncertainty: Prediction markets have already priced in the political landscape with high probability. Once the political uncertainty is resolved, the easing of short-term risk aversion could help the market stage a temporary recovery.
3. Alignment with the cycle and macro trends: Midterm elections usually fall in the middle to latter part of Bitcoin’s halving cycle. The Fed’s interest-rate path, global liquidity, and risk appetite in U.S. equities have a greater influence on the medium- to long-term trend than any single political election.
II. Funding and technical factors: fund redemptions and key lines of defense
1. ETF fund flows: Large single-day net outflows from spot ETFs reflect institutional investors’ wait-and-see stance ahead of the election. The key question is whether ETF flows will return to net inflows after Election Day.
2. $BTC key structural support: The $70,000–$71,000 range is a psychological line of defense for maintaining the broader bull-market structure; the $75,000–$76,400 range marks key support at the moving averages and lower boundary. A breach could trigger a second test of the lows.
III. Policy and regulation: Congressional composition determines the legislative path
1. Unified control: If one party controls both chambers, progress on market-structure legislation clarifying regulatory responsibilities is likely to accelerate, helping establish a clear framework for institutional participation.
2. Divided government: If the president and Congress are controlled by different parties, or the two chambers are split, legislative progress may slow or stall. The industry’s focus would then shift to proactive regulatory guidance from agencies and the organic development of areas such as RWAs and stablecoins.
The market is currently characterized by political catalysts playing a secondary role, with liquidity and market structure taking center stage. Given cyclical indicators that lack clear stop-loss levels or trigger signals, a prudent strategy would be to reduce leverage and avoid periods of extreme volatility, while paying close attention to changes in ETF flows after the election is confirmed and to price action around key support zones.
#美国中期选举倒计时,美股博弈窗口已开启?
3.6k
·
--
ZEC is down about 6%—what happened?
ZEC has given back around 6% in price, mainly due to a combination of short-term profit-taking and rising macroeconomic risk aversion.
ZEC had previously rallied sharply on expectations of a technical upgrade, building up substantial unrealized gains. As short-term positive news was priced in, some highly leveraged traders took profits and exited at higher prices.
Meanwhile, the broader market has entered a choppy consolidation phase, and risk aversion has increased, further intensifying the pressure from cascading liquidations in the derivatives market.
The upcoming activation of the NU7 network upgrade has prompted miners and node operators to adjust their positions in advance. The wind-down of legacy pools has also caused short-term liquidity disruptions.
Discussions about the future allocation of the ZCG development fund are ongoing, and policy uncertainty has led some buyers to wait on the sidelines.
Bitcoin and major tokens have broadly weakened, and sector-wide moves have caused privacy coins to lead the market decline.
Downside support: The first major support zone is $1,220–$1,228. If prices continue to fall below this range, the key psychological and technical support is at $1,200, with the last line of defense near $1,150.
Upside resistance: The first major resistance on a rebound is at $1,270. A break above this level could pave the way for another test of the interim high resistance at $1,320.
$ZEC #币安将恢复更多资产提现
{future}(ZECUSDT)
ZEC is down about 6%—what happened?
ZEC has given back around 6% in price, mainly due to a combination of short-term profit-taking and rising macroeconomic risk aversion.
ZEC had previously rallied sharply on expectations of a technical upgrade, building up substantial unrealized gains. As short-term positive news was priced in, some highly leveraged traders took profits and exited at higher prices.
Meanwhile, the broader market has entered a choppy consolidation phase, and risk aversion has increased, further intensifying the pressure from cascading liquidations in the derivatives market.
The upcoming activation of the NU7 network upgrade has prompted miners and node operators to adjust their positions in advance. The wind-down of legacy pools has also caused short-term liquidity disruptions.
Discussions about the future allocation of the ZCG development fund are ongoing, and policy uncertainty has led some buyers to wait on the sidelines.
Bitcoin and major tokens have broadly weakened, and sector-wide moves have caused privacy coins to lead the market decline.
Downside support: The first major support zone is $1,220–$1,228. If prices continue to fall below this range, the key psychological and technical support is at $1,200, with the last line of defense near $1,150.
Upside resistance: The first major resistance on a rebound is at $1,270. A break above this level could pave the way for another test of the interim high resistance at $1,320.
$ZEC #币安将恢复更多资产提现
ZEC has given back around 6% in price, mainly due to a combination of short-term profit-taking and rising macroeconomic risk aversion.
ZEC had previously rallied sharply on expectations of a technical upgrade, building up substantial unrealized gains. As short-term positive news was priced in, some highly leveraged traders took profits and exited at higher prices.
Meanwhile, the broader market has entered a choppy consolidation phase, and risk aversion has increased, further intensifying the pressure from cascading liquidations in the derivatives market.
The upcoming activation of the NU7 network upgrade has prompted miners and node operators to adjust their positions in advance. The wind-down of legacy pools has also caused short-term liquidity disruptions.
Discussions about the future allocation of the ZCG development fund are ongoing, and policy uncertainty has led some buyers to wait on the sidelines.
Bitcoin and major tokens have broadly weakened, and sector-wide moves have caused privacy coins to lead the market decline.
Downside support: The first major support zone is $1,220–$1,228. If prices continue to fall below this range, the key psychological and technical support is at $1,200, with the last line of defense near $1,150.
Upside resistance: The first major resistance on a rebound is at $1,270. A break above this level could pave the way for another test of the interim high resistance at $1,320.
$ZEC #币安将恢复更多资产提现
320
·
--
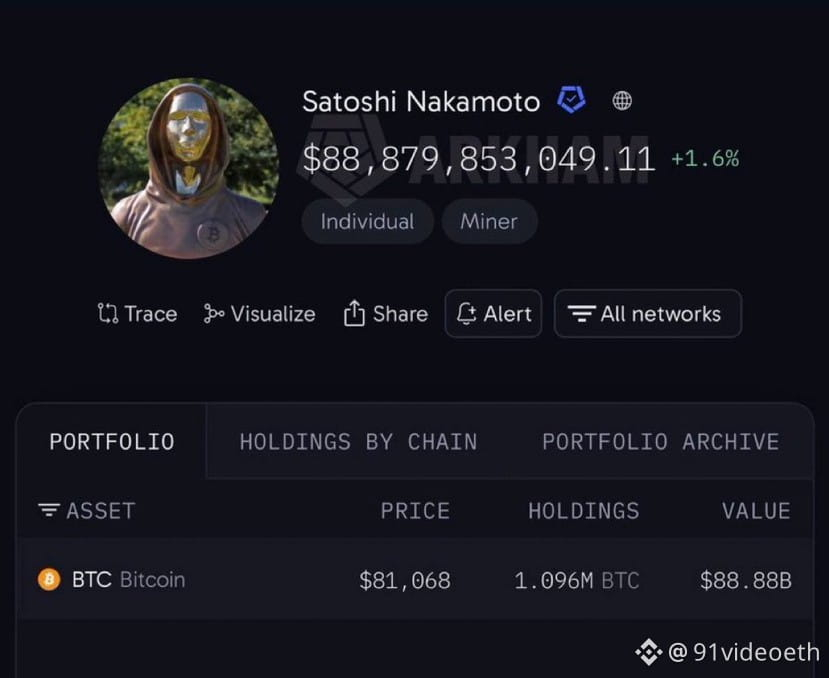
Why don't hackers steal Satoshi Nakamoto's $BTC ?
Look, there are so many $BTC in his wallet.
{future}(BTCUSDT)
Why don't hackers steal Satoshi Nakamoto's $BTC ?
Look, there are so many $BTC in his wallet.
Look, there are so many $BTC in his wallet.
7
4
19.1k
·
--
Bullish
Are Binance withdrawals back? Beware of scammers taking advantage of the situation!
Scammers have been very active since Binance recently resumed withdrawals.
They love impersonating official customer service representatives and posting messages in various groups. They use excuses like needing to verify your account, a withdrawal being stuck, or a system upgrade to trick you into clicking phishing websites and handing over your verification codes or private keys.
Remember, the official team will never ask you for your password or private keys. Handle everything through the app.
Never click unfamiliar links. Stay alert, and don't let them swindle you out of your hard-earned money!
$BNB #提现服务恢复期间警惕诈骗
{future}(BNBUSDT)
Are Binance withdrawals back? Beware of scammers taking advantage of the situation!
Scammers have been very active since Binance recently resumed withdrawals.
They love impersonating official customer service representatives and posting messages in various groups. They use excuses like needing to verify your account, a withdrawal being stuck, or a system upgrade to trick you into clicking phishing websites and handing over your verification codes or private keys.
Remember, the official team will never ask you for your password or private keys. Handle everything through the app.
Never click unfamiliar links. Stay alert, and don't let them swindle you out of your hard-earned money!
$BNB #提现服务恢复期间警惕诈骗
Scammers have been very active since Binance recently resumed withdrawals.
They love impersonating official customer service representatives and posting messages in various groups. They use excuses like needing to verify your account, a withdrawal being stuck, or a system upgrade to trick you into clicking phishing websites and handing over your verification codes or private keys.
Remember, the official team will never ask you for your password or private keys. Handle everything through the app.
Never click unfamiliar links. Stay alert, and don't let them swindle you out of your hard-earned money!
$BNB #提现服务恢复期间警惕诈骗
2.5k
·
--
ETH Market Brief and Quick Overview of Trading Levels
With the broader market choppy and relatively weak, and capital flowing away from the mainnet ecosystem, ETH has recently traded within a narrow range of $2850–$2920.
Bulls and bears are locked in a tug-of-war near key psychological levels. The market lacks a clear, independent trend, and is generally in a phase of consolidation as it awaits its next move.
$ETH The bulls and bears both seem to have a point!
Bearish factors: Staking growth has slowed, while Layer 2 networks are diverting mainnet fee revenue, weakening the deflationary impact of token burns in the short term.
Bullish factors: On-chain DeFi total value locked remains relatively stable, and the key support zone has attracted some long-term institutions and value investors looking to buy the dip.
Consider a light-position range-trading strategy and strictly limit leverage. Avoid chasing prices higher. Consider small short-term entries near the key support level, while adhering strictly to risk-management rules.
Entry zone: Around $2650–$2750
Stop-loss: $2580 (exit if price falls below this level)
Take-profit zone: Around $3100–$3200
#美国中期选举倒计时,美股博弈窗口已开启?
{future}(ETHUSDT)
ETH Market Brief and Quick Overview of Trading Levels
With the broader market choppy and relatively weak, and capital flowing away from the mainnet ecosystem, ETH has recently traded within a narrow range of $2850–$2920.
Bulls and bears are locked in a tug-of-war near key psychological levels. The market lacks a clear, independent trend, and is generally in a phase of consolidation as it awaits its next move.
$ETH The bulls and bears both seem to have a point!
Bearish factors: Staking growth has slowed, while Layer 2 networks are diverting mainnet fee revenue, weakening the deflationary impact of token burns in the short term.
Bullish factors: On-chain DeFi total value locked remains relatively stable, and the key support zone has attracted some long-term institutions and value investors looking to buy the dip.
Consider a light-position range-trading strategy and strictly limit leverage. Avoid chasing prices higher. Consider small short-term entries near the key support level, while adhering strictly to risk-management rules.
Entry zone: Around $2650–$2750
Stop-loss: $2580 (exit if price falls below this level)
Take-profit zone: Around $3100–$3200
#美国中期选举倒计时,美股博弈窗口已开启?
With the broader market choppy and relatively weak, and capital flowing away from the mainnet ecosystem, ETH has recently traded within a narrow range of $2850–$2920.
Bulls and bears are locked in a tug-of-war near key psychological levels. The market lacks a clear, independent trend, and is generally in a phase of consolidation as it awaits its next move.
$ETH The bulls and bears both seem to have a point!
Bearish factors: Staking growth has slowed, while Layer 2 networks are diverting mainnet fee revenue, weakening the deflationary impact of token burns in the short term.
Bullish factors: On-chain DeFi total value locked remains relatively stable, and the key support zone has attracted some long-term institutions and value investors looking to buy the dip.
Consider a light-position range-trading strategy and strictly limit leverage. Avoid chasing prices higher. Consider small short-term entries near the key support level, while adhering strictly to risk-management rules.
Entry zone: Around $2650–$2750
Stop-loss: $2580 (exit if price falls below this level)
Take-profit zone: Around $3100–$3200
#美国中期选举倒计时,美股博弈窗口已开启?
509
·
--
BTC Market Overview and Quick Guide to Trading Levels
Following the recent exchange security incident and macro-driven selling pressure, BTC is currently consolidating around $77,500–$78,200, broadly in a bottom-building phase while choosing a direction.
$BTC Bears and bulls both have their arguments!
Bearish factors: Deleveraging in derivatives and a temporary outflow of large sums of capital
Bullish factors: The decline has triggered some dip buying, and long-term support levels are showing some buying interest.
For now, consider light-position range trading. Strictly avoid chasing rallies or selling into dips; wait for a right-side signal with increased volume. For fun only.
Potential entry: Around $74,000–$76,000
Stop-loss: $72,500 (exit if it falls below this level)
Take-profit: Around $82,000–$83,000
{future}(BTCUSDT)
#美国10月非农出炉:降息还有戏吗?
BTC Market Overview and Quick Guide to Trading Levels
Following the recent exchange security incident and macro-driven selling pressure, BTC is currently consolidating around $77,500–$78,200, broadly in a bottom-building phase while choosing a direction.
$BTC Bears and bulls both have their arguments!
Bearish factors: Deleveraging in derivatives and a temporary outflow of large sums of capital
Bullish factors: The decline has triggered some dip buying, and long-term support levels are showing some buying interest.
For now, consider light-position range trading. Strictly avoid chasing rallies or selling into dips; wait for a right-side signal with increased volume. For fun only.
Potential entry: Around $74,000–$76,000
Stop-loss: $72,500 (exit if it falls below this level)
Take-profit: Around $82,000–$83,000
#美国10月非农出炉:降息还有戏吗?
Following the recent exchange security incident and macro-driven selling pressure, BTC is currently consolidating around $77,500–$78,200, broadly in a bottom-building phase while choosing a direction.
$BTC Bears and bulls both have their arguments!
Bearish factors: Deleveraging in derivatives and a temporary outflow of large sums of capital
Bullish factors: The decline has triggered some dip buying, and long-term support levels are showing some buying interest.
For now, consider light-position range trading. Strictly avoid chasing rallies or selling into dips; wait for a right-side signal with increased volume. For fun only.
Potential entry: Around $74,000–$76,000
Stop-loss: $72,500 (exit if it falls below this level)
Take-profit: Around $82,000–$83,000
#美国10月非农出炉:降息还有戏吗?
458
·
--
Today $ETH is still feeling sluggish. I can't get anything going. Time for bed—good night!
Today $ETH is still feeling sluggish. I can't get anything going. Time for bed—good night!
69
6
473
·
--
This year, $BTC is half-dead again. Sigh, time for bed. Good night!
This year, $BTC is half-dead again. Sigh, time for bed. Good night!
33
4
96
·
--
Apple (AAPL) Earnings Expectations, Stock Analysis, and Trading Levels
I. Key Earnings Expectations
The market generally expects Apple to report fourth-quarter revenue of approximately $113.46 billion and earnings per share of around $2.00.
New CEO John Ternus will host the earnings call for the first time. Key areas of focus include early sales conversion for the next-generation iPhone, growth in the Services business, and potential pressure on gross margins from rising costs of hardware components such as memory.
II. Fundamental and Market Assessment
Apple has demonstrated remarkable resilience this year and is viewed by investors as a relatively safe haven. Although its current valuation is relatively high by historical standards, its stable free cash flow and vast hardware ecosystem form a deep competitive moat. The stock has traded in a narrower range ahead of the earnings announcement as the market awaits guidance.
III. Trading Strategy and Risk Management
Around earnings announcements, implied volatility tends to be high, so blindly making large directional bets is inadvisable. A more cautious strategy is to wait until the results are out and the initial after-hours reaction has settled, then trade in the direction indicated by the strength of the guidance. Short-term traders should keep position sizes strictly controlled and use options or technical support levels for quick trades, while guarding against profit-taking if guidance falls short of expectations.
IV. Reference Price Levels
Support / potential entry zone: Around $228.00–$232.00 (a recent high-volume trading zone and strong moving-average support band)
Stop-loss: $219.50 (Exit if the key medium-term uptrend line breaks or the lower edge of the earnings gap is breached.)
Take-profit: First target at $245.00; strong resistance around $252.00 (take profits in stages and close the position)
$AAPLB $AAPL #苹果第四季度财报
{future}(AAPLUSDT)
{spot}(AAPLBUSDT)
Apple (AAPL) Earnings Expectations, Stock Analysis, and Trading Levels
I. Key Earnings Expectations
The market generally expects Apple to report fourth-quarter revenue of approximately $113.46 billion and earnings per share of around $2.00.
New CEO John Ternus will host the earnings call for the first time. Key areas of focus include early sales conversion for the next-generation iPhone, growth in the Services business, and potential pressure on gross margins from rising costs of hardware components such as memory.
II. Fundamental and Market Assessment
Apple has demonstrated remarkable resilience this year and is viewed by investors as a relatively safe haven. Although its current valuation is relatively high by historical standards, its stable free cash flow and vast hardware ecosystem form a deep competitive moat. The stock has traded in a narrower range ahead of the earnings announcement as the market awaits guidance.
III. Trading Strategy and Risk Management
Around earnings announcements, implied volatility tends to be high, so blindly making large directional bets is inadvisable. A more cautious strategy is to wait until the results are out and the initial after-hours reaction has settled, then trade in the direction indicated by the strength of the guidance. Short-term traders should keep position sizes strictly controlled and use options or technical support levels for quick trades, while guarding against profit-taking if guidance falls short of expectations.
IV. Reference Price Levels
Support / potential entry zone: Around $228.00–$232.00 (a recent high-volume trading zone and strong moving-average support band)
Stop-loss: $219.50 (Exit if the key medium-term uptrend line breaks or the lower edge of the earnings gap is breached.)
Take-profit: First target at $245.00; strong resistance around $252.00 (take profits in stages and close the position)
$AAPLB $AAPL #苹果第四季度财报
I. Key Earnings Expectations
The market generally expects Apple to report fourth-quarter revenue of approximately $113.46 billion and earnings per share of around $2.00.
New CEO John Ternus will host the earnings call for the first time. Key areas of focus include early sales conversion for the next-generation iPhone, growth in the Services business, and potential pressure on gross margins from rising costs of hardware components such as memory.
II. Fundamental and Market Assessment
Apple has demonstrated remarkable resilience this year and is viewed by investors as a relatively safe haven. Although its current valuation is relatively high by historical standards, its stable free cash flow and vast hardware ecosystem form a deep competitive moat. The stock has traded in a narrower range ahead of the earnings announcement as the market awaits guidance.
III. Trading Strategy and Risk Management
Around earnings announcements, implied volatility tends to be high, so blindly making large directional bets is inadvisable. A more cautious strategy is to wait until the results are out and the initial after-hours reaction has settled, then trade in the direction indicated by the strength of the guidance. Short-term traders should keep position sizes strictly controlled and use options or technical support levels for quick trades, while guarding against profit-taking if guidance falls short of expectations.
IV. Reference Price Levels
Support / potential entry zone: Around $228.00–$232.00 (a recent high-volume trading zone and strong moving-average support band)
Stop-loss: $219.50 (Exit if the key medium-term uptrend line breaks or the lower edge of the earnings gap is breached.)
Take-profit: First target at $245.00; strong resistance around $252.00 (take profits in stages and close the position)
$AAPLB $AAPL #苹果第四季度财报
153
·
--
Verified
XPL Flash Crash: Analysis and Short-Term Trading Strategy
I. Analysis of the Flash Crash
Before XPL plunged, 12 to 16 linked wallets coordinated to withdraw margin, cashing out over $2 million in USDC. As liquidations of long positions triggered a liquidity crunch, the price suddenly dropped by about 18%.
Hyperliquid’s HLP protocol was forced to take over approximately $12.2 million in positions with losses exceeding collateral, and incurred a loss of about $556,000—a typical liquidity run.
II. Market Anomalies and Assessment
The highly concentrated withdrawals show signs of manipulation, but the analysis leans toward attributing them to a highly leveraged liquidity crisis rather than an attack.
Differences in reporting methodologies reflect the dispersion of fund flows. Until transparent disclosures are available, this highlights the derivatives pool’s vulnerability when facing sudden capital withdrawals.
III. Trading Guidelines and Risk Management
The chart shows only sporadic test buys, with no fundamental support. Treat any trade as an aggressive short-term position; do not attempt to catch a falling knife or build a long-term position. Use small positions and move in and out quickly, set strict stop-losses, and guard against the risk of a second round of withdrawals.
IV. Suggested Reference Price Levels
Test-buy zone: Around $0.0735 - $0.0750 (a consolidation range above the low reached during the plunge)
Stop-loss: $0.0690 (if the previous low of $0.0700 is breached, exit unconditionally)
Take-profit levels: First target $0.0810; second target $0.0850 (take profits in stages and close the position)
$XPL
{future}(XPLUSDT)
XPL Flash Crash: Analysis and Short-Term Trading Strategy
I. Analysis of the Flash Crash
Before XPL plunged, 12 to 16 linked wallets coordinated to withdraw margin, cashing out over $2 million in USDC. As liquidations of long positions triggered a liquidity crunch, the price suddenly dropped by about 18%.
Hyperliquid’s HLP protocol was forced to take over approximately $12.2 million in positions with losses exceeding collateral, and incurred a loss of about $556,000—a typical liquidity run.
II. Market Anomalies and Assessment
The highly concentrated withdrawals show signs of manipulation, but the analysis leans toward attributing them to a highly leveraged liquidity crisis rather than an attack.
Differences in reporting methodologies reflect the dispersion of fund flows. Until transparent disclosures are available, this highlights the derivatives pool’s vulnerability when facing sudden capital withdrawals.
III. Trading Guidelines and Risk Management
The chart shows only sporadic test buys, with no fundamental support. Treat any trade as an aggressive short-term position; do not attempt to catch a falling knife or build a long-term position. Use small positions and move in and out quickly, set strict stop-losses, and guard against the risk of a second round of withdrawals.
IV. Suggested Reference Price Levels
Test-buy zone: Around $0.0735 - $0.0750 (a consolidation range above the low reached during the plunge)
Stop-loss: $0.0690 (if the previous low of $0.0700 is breached, exit unconditionally)
Take-profit levels: First target $0.0810; second target $0.0850 (take profits in stages and close the position)
$XPL
I. Analysis of the Flash Crash
Before XPL plunged, 12 to 16 linked wallets coordinated to withdraw margin, cashing out over $2 million in USDC. As liquidations of long positions triggered a liquidity crunch, the price suddenly dropped by about 18%.
Hyperliquid’s HLP protocol was forced to take over approximately $12.2 million in positions with losses exceeding collateral, and incurred a loss of about $556,000—a typical liquidity run.
II. Market Anomalies and Assessment
The highly concentrated withdrawals show signs of manipulation, but the analysis leans toward attributing them to a highly leveraged liquidity crisis rather than an attack.
Differences in reporting methodologies reflect the dispersion of fund flows. Until transparent disclosures are available, this highlights the derivatives pool’s vulnerability when facing sudden capital withdrawals.
III. Trading Guidelines and Risk Management
The chart shows only sporadic test buys, with no fundamental support. Treat any trade as an aggressive short-term position; do not attempt to catch a falling knife or build a long-term position. Use small positions and move in and out quickly, set strict stop-losses, and guard against the risk of a second round of withdrawals.
IV. Suggested Reference Price Levels
Test-buy zone: Around $0.0735 - $0.0750 (a consolidation range above the low reached during the plunge)
Stop-loss: $0.0690 (if the previous low of $0.0700 is breached, exit unconditionally)
Take-profit levels: First target $0.0810; second target $0.0850 (take profits in stages and close the position)
$XPL
2
1.5k
·
--
$ETH didn't perform well today either. Good night!
$ETH didn't perform well today either. Good night!
1.2k
3
63
1.2k
·
--
$BTC Still feeling so lifeless. I'm going to bed. Good night!
$BTC Still feeling so lifeless. I'm going to bed. Good night!
219
2
5
382
·
--
THORChain suffers sudden outage, halting multichain services
An Ethereum chain reorganization caused THORChain to issue duplicate refunds totaling 10 ETH. It urgently suspended swap services on 12 of 13 external chains, and RUNE fell 6.1%.
Co-founder Chad said node operators have no access to nonpublic information; all on-chain data is fully public and verifiable. He urged the market to assess the situation rationally.
While the protocol is paused, cross-chain swaps are fully disrupted, directly impacting related fee revenue. The extent of the impact depends largely on how long it takes to resume services.
The priority now is to fix the vulnerability and restore the network. The incident highlights the vulnerability of cross-chain protocols to underlying chain reorganizations and the urgent need to improve and upgrade security mechanisms.
$ETH
{future}(ETHUSDT)
#美国现货ETHETF连续23日净流出
THORChain suffers sudden outage, halting multichain services
An Ethereum chain reorganization caused THORChain to issue duplicate refunds totaling 10 ETH. It urgently suspended swap services on 12 of 13 external chains, and RUNE fell 6.1%.
Co-founder Chad said node operators have no access to nonpublic information; all on-chain data is fully public and verifiable. He urged the market to assess the situation rationally.
While the protocol is paused, cross-chain swaps are fully disrupted, directly impacting related fee revenue. The extent of the impact depends largely on how long it takes to resume services.
The priority now is to fix the vulnerability and restore the network. The incident highlights the vulnerability of cross-chain protocols to underlying chain reorganizations and the urgent need to improve and upgrade security mechanisms.
$ETH
#美国现货ETHETF连续23日净流出
An Ethereum chain reorganization caused THORChain to issue duplicate refunds totaling 10 ETH. It urgently suspended swap services on 12 of 13 external chains, and RUNE fell 6.1%.
Co-founder Chad said node operators have no access to nonpublic information; all on-chain data is fully public and verifiable. He urged the market to assess the situation rationally.
While the protocol is paused, cross-chain swaps are fully disrupted, directly impacting related fee revenue. The extent of the impact depends largely on how long it takes to resume services.
The priority now is to fix the vulnerability and restore the network. The incident highlights the vulnerability of cross-chain protocols to underlying chain reorganizations and the urgent need to improve and upgrade security mechanisms.
$ETH
#美国现货ETHETF连续23日净流出
916
·
--
ETH Ethereum ETFs dump holdings for 23 straight days! Market alarm bells ring as critical levels are mapped out
Heavy outflows for 23 straight days; institutional flight to safety hits a record
U.S. spot Ethereum ETFs are experiencing their longest outflow streak since launch, setting a record with net outflows for 23 consecutive trading days
Leading funds, including BlackRock's ETHA and Grayscale's ETHE, have been dumping holdings and fleeing. This signals that traditional financial institutions' confidence in allocating to Ethereum has hit rock bottom, with intense risk-off liquidation sentiment
Buying demand collapses and panic selling takes hold; $ETH faces a momentum crisis
Nearly a month of institutional outflows has severely drained the market's incremental buying power, leaving it unable to absorb selling pressure
These persistent outflow figures are also fueling concern among retail investors and on-chain communities, intensifying wait-and-see attitudes and panic selling. As a result, ETH continues to underperform the broader crypto market and faces serious downside risks in the short term
Critical support below: $2,220 under pressure, with the $2,150 defense in focus
The price is approaching an extremely dangerous support zone:
First support zone: The price is currently testing $2,220–$2,264. Although the RSI is nearing oversold territory, suggesting the potential for a short-term rebound, selling pressure remains significant
Key line in the sand: Around $2,150 (the 200-day moving average). If this support gives way, the medium- to long-term technical structure will break down, and bears may drive the price all the way to the $2,000 mark.
Heavy resistance overhead: Reclaiming $2,500 is the only route to safety
For bulls to win this turnaround battle, they need both a technical recovery and a return of ETF inflows
Short-term relief level: The price must first break through resistance at $2,320–$2,350 to ease immediate downside pressure
Reversal threshold: The top priority is reclaiming the $2,500 level (where the 50-day moving average coincides with a high-volume trading zone). Only a sustained hold above $2,500 alongside continued net ETF inflows will mark the end of this outflow wave
Ultimate strategy: Don't blindly buy the dip; wait for confirmation
The market is currently caught in an intense tug-of-war between persistent institutional selling and technically oversold conditions
Until ETF institutional flows show clear signs of bottoming and recovering, do not blindly make large left-side dip buys!
Closely monitor the strength of support at $2,150 and patiently wait for ETF flows to stabilize before entering on the right side
{future}(ETHUSDT)
#美国现货ETHETF连续23日净流出
ETH Ethereum ETFs dump holdings for 23 straight days! Market alarm bells ring as critical levels are mapped out
Heavy outflows for 23 straight days; institutional flight to safety hits a record
U.S. spot Ethereum ETFs are experiencing their longest outflow streak since launch, setting a record with net outflows for 23 consecutive trading days
Leading funds, including BlackRock's ETHA and Grayscale's ETHE, have been dumping holdings and fleeing. This signals that traditional financial institutions' confidence in allocating to Ethereum has hit rock bottom, with intense risk-off liquidation sentiment
Buying demand collapses and panic selling takes hold; $ETH faces a momentum crisis
Nearly a month of institutional outflows has severely drained the market's incremental buying power, leaving it unable to absorb selling pressure
These persistent outflow figures are also fueling concern among retail investors and on-chain communities, intensifying wait-and-see attitudes and panic selling. As a result, ETH continues to underperform the broader crypto market and faces serious downside risks in the short term
Critical support below: $2,220 under pressure, with the $2,150 defense in focus
The price is approaching an extremely dangerous support zone:
First support zone: The price is currently testing $2,220–$2,264. Although the RSI is nearing oversold territory, suggesting the potential for a short-term rebound, selling pressure remains significant
Key line in the sand: Around $2,150 (the 200-day moving average). If this support gives way, the medium- to long-term technical structure will break down, and bears may drive the price all the way to the $2,000 mark.
Heavy resistance overhead: Reclaiming $2,500 is the only route to safety
For bulls to win this turnaround battle, they need both a technical recovery and a return of ETF inflows
Short-term relief level: The price must first break through resistance at $2,320–$2,350 to ease immediate downside pressure
Reversal threshold: The top priority is reclaiming the $2,500 level (where the 50-day moving average coincides with a high-volume trading zone). Only a sustained hold above $2,500 alongside continued net ETF inflows will mark the end of this outflow wave
Ultimate strategy: Don't blindly buy the dip; wait for confirmation
The market is currently caught in an intense tug-of-war between persistent institutional selling and technically oversold conditions
Until ETF institutional flows show clear signs of bottoming and recovering, do not blindly make large left-side dip buys!
Closely monitor the strength of support at $2,150 and patiently wait for ETF flows to stabilize before entering on the right side
#美国现货ETHETF连续23日净流出
Heavy outflows for 23 straight days; institutional flight to safety hits a record
U.S. spot Ethereum ETFs are experiencing their longest outflow streak since launch, setting a record with net outflows for 23 consecutive trading days
Leading funds, including BlackRock's ETHA and Grayscale's ETHE, have been dumping holdings and fleeing. This signals that traditional financial institutions' confidence in allocating to Ethereum has hit rock bottom, with intense risk-off liquidation sentiment
Buying demand collapses and panic selling takes hold; $ETH faces a momentum crisis
Nearly a month of institutional outflows has severely drained the market's incremental buying power, leaving it unable to absorb selling pressure
These persistent outflow figures are also fueling concern among retail investors and on-chain communities, intensifying wait-and-see attitudes and panic selling. As a result, ETH continues to underperform the broader crypto market and faces serious downside risks in the short term
Critical support below: $2,220 under pressure, with the $2,150 defense in focus
The price is approaching an extremely dangerous support zone:
First support zone: The price is currently testing $2,220–$2,264. Although the RSI is nearing oversold territory, suggesting the potential for a short-term rebound, selling pressure remains significant
Key line in the sand: Around $2,150 (the 200-day moving average). If this support gives way, the medium- to long-term technical structure will break down, and bears may drive the price all the way to the $2,000 mark.
Heavy resistance overhead: Reclaiming $2,500 is the only route to safety
For bulls to win this turnaround battle, they need both a technical recovery and a return of ETF inflows
Short-term relief level: The price must first break through resistance at $2,320–$2,350 to ease immediate downside pressure
Reversal threshold: The top priority is reclaiming the $2,500 level (where the 50-day moving average coincides with a high-volume trading zone). Only a sustained hold above $2,500 alongside continued net ETF inflows will mark the end of this outflow wave
Ultimate strategy: Don't blindly buy the dip; wait for confirmation
The market is currently caught in an intense tug-of-war between persistent institutional selling and technically oversold conditions
Until ETF institutional flows show clear signs of bottoming and recovering, do not blindly make large left-side dip buys!
Closely monitor the strength of support at $2,150 and patiently wait for ETF flows to stabilize before entering on the right side
#美国现货ETHETF连续23日净流出
ETH+2.26%
ETHAETF+1.16%
1
7.5k
Log in to explore more content
Join global crypto users on Binance Square
⚡️ Get latest and useful information about crypto.
💬 Trusted by the world’s largest crypto exchange.
👍 Discover real insights from verified creators.
Email / Phone number
Trending Topics
USMidterms-WhatAreMarketsExpecting?
61,802 views
641 Discussing
Democratic Congressional Sweep Shakes Trump Trades in AI Stocks and Crypto
Binance News
·9 Likes
·3.7k views
USOctoberNFP-AreRateCutsStillPossible
232,020 views
1,852 Discussing
AMDBeatsExpectations-AINarrativeContinues
13,733 views
229 Discussing