
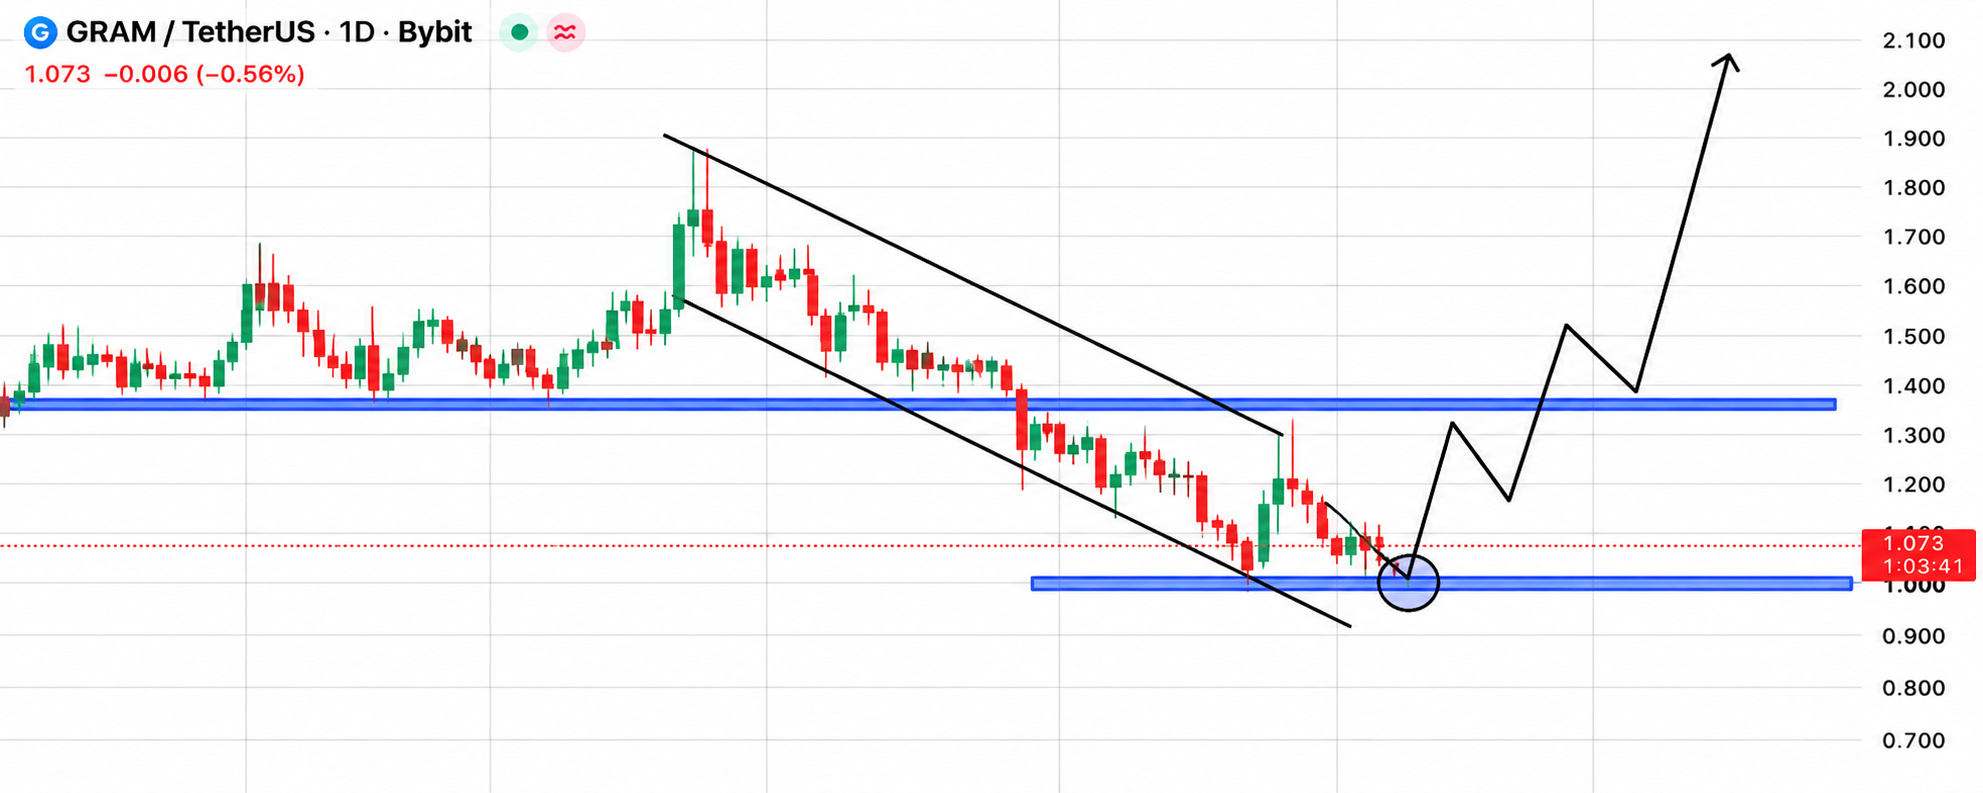

Gram is currently trading around $1.015, showing a decline of approximately 5.31%. Despite the recent correction, GRAM is approaching an important technical support area that could become a potential accumulation zone. 📊 Market Overview: - Current Price: $1.015 - Market Cap: $2.92 Billion - Fully Diluted Market Cap: $5.37 Billion - 24H Volume: $92.23 Million - Market Rank: #27 🔥 Technical Outlook: The daily chart shows a descending channel, with price approaching the important $1.00 support zone. A successful bounce could trigger a recovery toward the $1.30 resistance level. A confirmed breakout above this level may open the door for a stronger bullish move. 🎯 Potential Entry Zone:
$1.00–$1.05 🎯 Take Profit Targets: - TP1: $1.30 - TP2: $1.50 - TP3: $1.75 - TP4: $2.00 🛑 Stop Loss: Below $0.95 (risk-management reference). ⚡ Bullish Confirmation: A strong daily close above $1.30 with increasing trading volume could confirm a breakout. ⚠️ If GRAM loses the $1.00 support, further downside remains possible. These targets are speculative scenarios, not guaranteed outcomes. Always manage risk carefully. Can GRAM reach $2.00 in the next bullish move? #WSOT2026 $GRAM