
#wsot2026
wsot2026
918 views
10 Discussing
Hot
Latest

·
--
Article
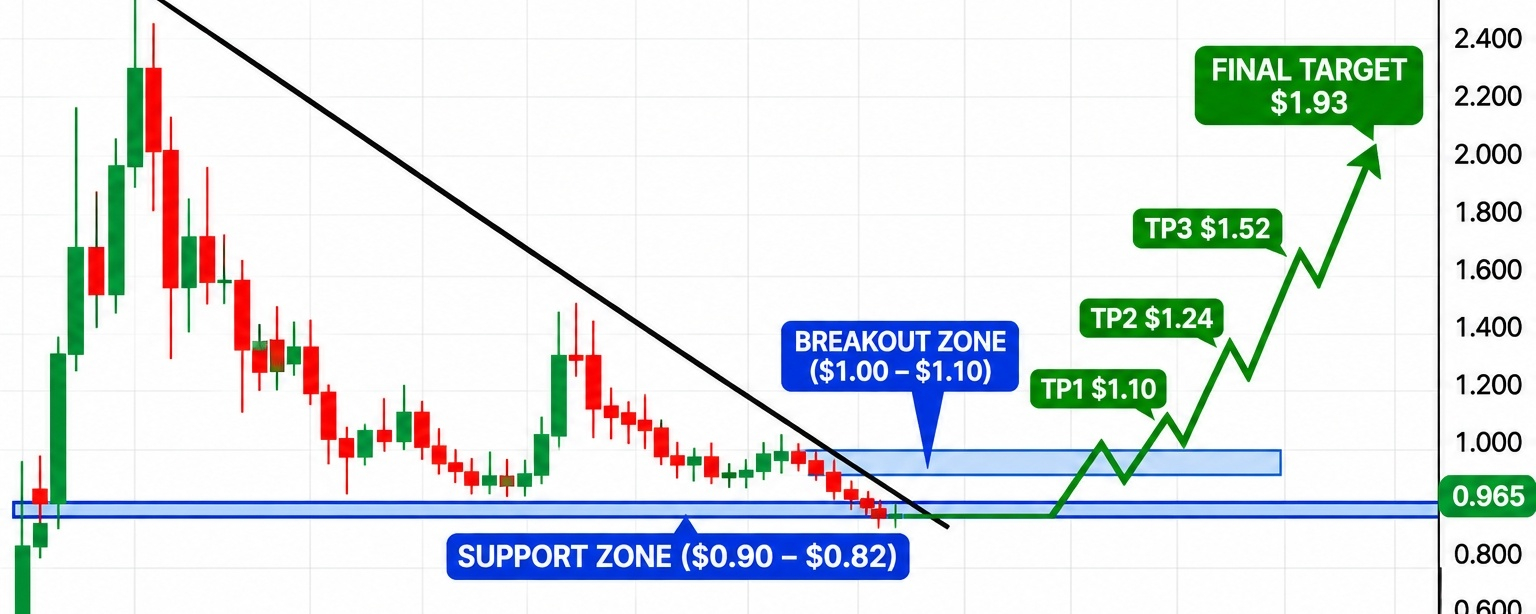
🚀 SHOWS A SMALL RECOVERY — CAN THE BULLS TAKE CONTROL?$TRUMP is showing a possible recovery after an extended period of heavy selling pressure. According to the supplied Bybit screenshot, the token is trading at $0.965, up 2.01%, with a 24-hour high of $0.965 and a low of $0.916. The daily chart tells an important story. previously traded near $2.28 before entering a prolonged downtrend. Sellers dominated the market, pushing the price toward the $0.90 area. However, recent candles show a small attempt by buyers to defend the lower levels. 📊 KEY MARKET DATA - Current Price: $0.965 - 24H High: $0.965 - 24H Low: $0.916 - 24H Volume: $289.98M - Market Cap shown: $754.3M - All-Time High: $75.35 🔥 IMPORTANT PRICE LEVELS The first challenge for buyers is to reclaim the $1.00 psychological level. A sustained move above it could improve short-term momentum. Potential Upside Targets: - TP1: $1.10 - TP2: $1.24 - TP3: $1.58 - Final Target: $1.93 These are speculative chart-based levels, not guaranteed outcomes. ⚠️ WHAT COULD GO WRONG? The broader trend remains bearish. If loses the $0.916 support area, sellers could push the token toward its recent low around $0.896. A break below that level would increase downside risk. Market sentiment also matters. Recent reporting highlights fading interest in the token's latest holder dinner contest, adding another challenge for bullish momentum. MY VIEW: is approaching an important decision zone. A strong recovery above $1.00 could attract fresh attention, but confirmation and volume are essential. Would you buy at $0.965, or wait for a stronger breakout? #WSOT2026 #A Packed Week of Earnings and Data Tests Markets
{spot}(TRUMPUSDT)
$TRUMP
🚀 SHOWS A SMALL RECOVERY — CAN THE BULLS TAKE CONTROL?
$TRUMP is showing a possible recovery after an extended period of heavy selling pressure. According to the supplied Bybit screenshot, the token is trading at $0.965, up 2.01%, with a 24-hour high of $0.965 and a low of $0.916. The daily chart tells an important story. previously traded near $2.28 before entering a prolonged downtrend. Sellers dominated the market, pushing the price toward the $0.90 area. However, recent candles show a small attempt by buyers to defend the lower levels. 📊 KEY MARKET DATA - Current Price: $0.965 - 24H High: $0.965 - 24H Low: $0.916 - 24H Volume: $289.98M - Market Cap shown: $754.3M - All-Time High: $75.35 🔥 IMPORTANT PRICE LEVELS The first challenge for buyers is to reclaim the $1.00 psychological level. A sustained move above it could improve short-term momentum. Potential Upside Targets: - TP1: $1.10 - TP2: $1.24 - TP3: $1.58 - Final Target: $1.93 These are speculative chart-based levels, not guaranteed outcomes. ⚠️ WHAT COULD GO WRONG? The broader trend remains bearish. If loses the $0.916 support area, sellers could push the token toward its recent low around $0.896. A break below that level would increase downside risk. Market sentiment also matters. Recent reporting highlights fading interest in the token's latest holder dinner contest, adding another challenge for bullish momentum. MY VIEW: is approaching an important decision zone. A strong recovery above $1.00 could attract fresh attention, but confirmation and volume are essential. Would you buy at $0.965, or wait for a stronger breakout? #WSOT2026 #A Packed Week of Earnings and Data Tests Markets
$TRUMP
$TRUMP
Trong_Hatachi:
The $TRUMP bounce from $0.90 is worth watching after that long slide. Do you see buyers gaining momentum? Follow me back if you enjoy discussing these setups!
1
1.2k
·
--
Article
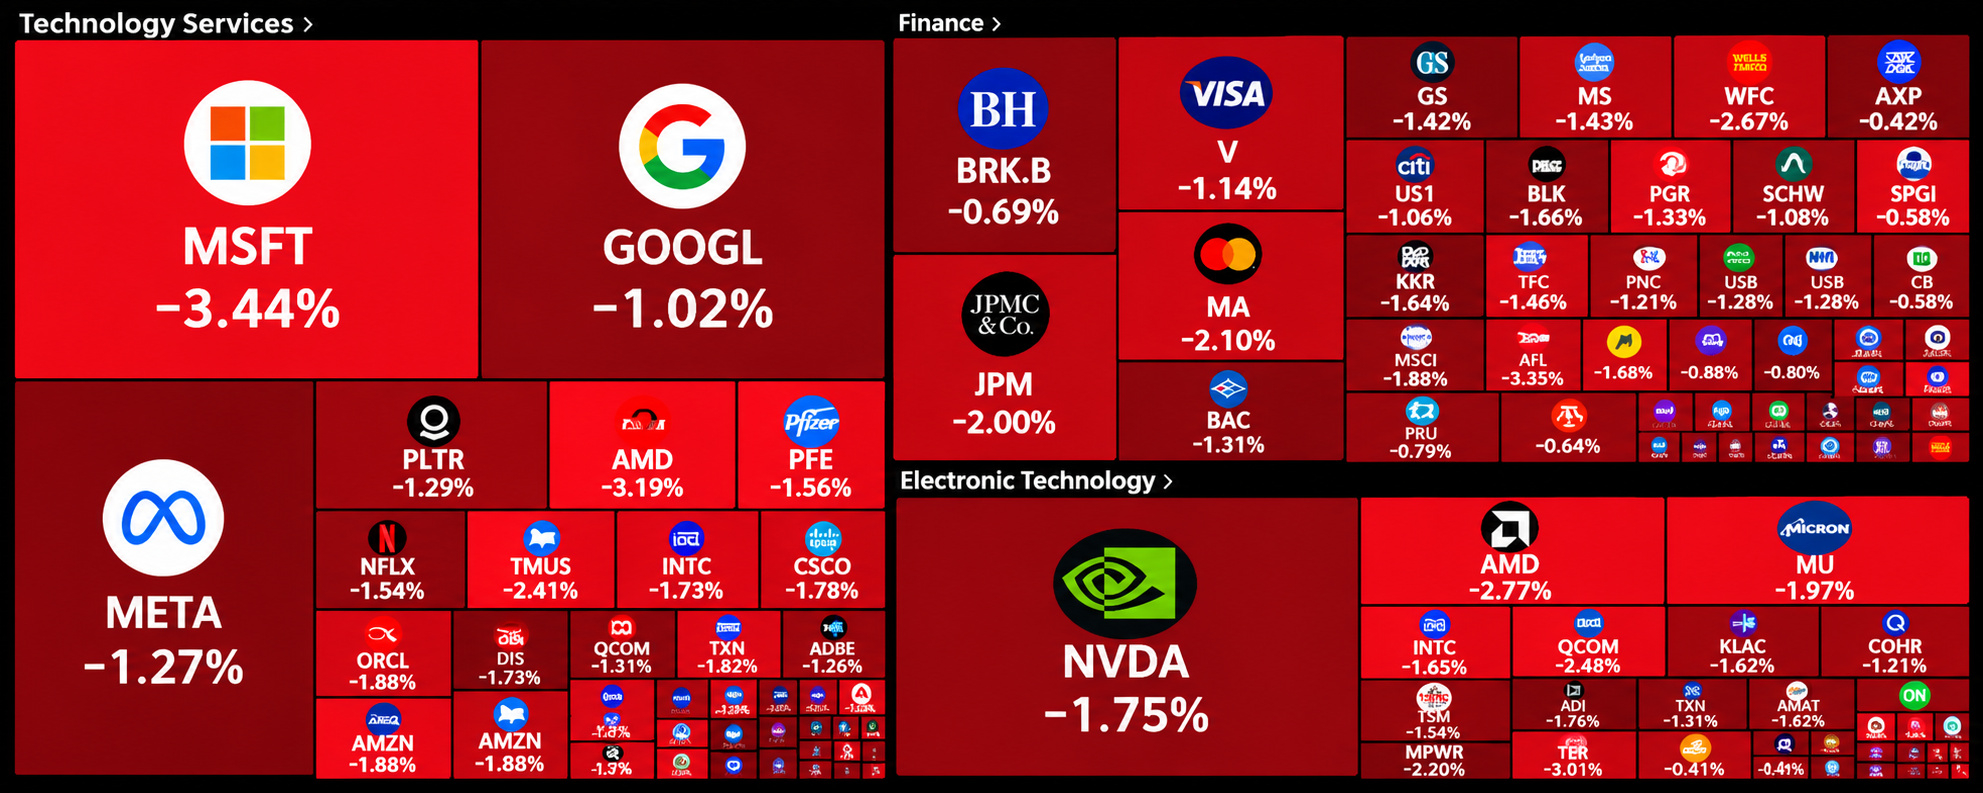
🚨 OVER $1 TRILLION WIPED OUT FROM THE US STOCK MARKET! The market is turning red, and the pressure is spreading across financial markets. 🇺🇸📉 The shared stock market heatmap shows widespread losses across major technology, finance, and semiconductor companies. Microsoft (MSFT), NVIDIA (NVDA), AMD, Meta, Google, and several financial stocks are all trading in negative territory. And crypto isn't escaping the pressure. ₿ BITCOIN UNDER SELLING PRESSURE According to the shared BTC chart, Bitcoin is trading around $63,379, following a sharp downward move from the $65,000 area. This kind of market-wide weakness can increase fear among investors, trigger liquidations, and make traders more cautious. ⚠️ WHAT COULD HAPPEN NEXT? If selling pressure continues, Bitcoin could test lower support levels before any meaningful recovery. However, if buyers step in and reclaim important resistance levels, a relief bounce could develop. 📊 MY MARKET WATCHLIST • BTC: Watch the $63K support area • US Stocks: Monitor technology-sector recovery • Crypto: Watch trading volume and liquidation activity • Market Sentiment: Look for signs of stabilization 🔥 MOONVEMBER IS NOT LOOKING LIKE A WINNING MONTH SO FAR! But remember, sharp corrections are part of financial markets. Avoid emotional decisions, manage risk carefully, and don't assume every dip is automatically a buying opportunity. Do you think this is a temporary correction or the beginning of a deeper market crash? 👀 #WSOT2026 $BTC $NVDAB #AnthropicIPOTestsInvestorAppetiteForAI #BTC走势分析
{spot}(NVDABUSDT)
{spot}(BTCUSDT)
🚨 OVER $1 TRILLION WIPED OUT FROM THE US STOCK MARKET!
The market is turning red, and the pressure is spreading across financial markets. 🇺🇸📉 The shared stock market heatmap shows widespread losses across major technology, finance, and semiconductor companies. Microsoft (MSFT), NVIDIA (NVDA), AMD, Meta, Google, and several financial stocks are all trading in negative territory. And crypto isn't escaping the pressure. ₿ BITCOIN UNDER SELLING PRESSURE According to the shared BTC chart, Bitcoin is trading around $63,379, following a sharp downward move from the $65,000 area. This kind of market-wide weakness can increase fear among investors, trigger liquidations, and make traders more cautious. ⚠️ WHAT COULD HAPPEN NEXT? If selling pressure continues, Bitcoin could test lower support levels before any meaningful recovery. However, if buyers step in and reclaim important resistance levels, a relief bounce could develop. 📊 MY MARKET WATCHLIST • BTC: Watch the $63K support area • US Stocks: Monitor technology-sector recovery • Crypto: Watch trading volume and liquidation activity • Market Sentiment: Look for signs of stabilization 🔥 MOONVEMBER IS NOT LOOKING LIKE A WINNING MONTH SO FAR! But remember, sharp corrections are part of financial markets. Avoid emotional decisions, manage risk carefully, and don't assume every dip is automatically a buying opportunity. Do you think this is a temporary correction or the beginning of a deeper market crash? 👀 #WSOT2026 $BTC $NVDAB #AnthropicIPOTestsInvestorAppetiteForAI #BTC走势分析
219
·
--

Article
🚨MAJOR INSTITUTIONAL INTEREST IN HYPERLIQUID!🐋 Healthcare of Ontario Pension Plan Trust Fund, a major Canadian pension manager with approximately $62 billion in reported assets, disclosed a $35.33 million position in Hyperliquid Strategies. According to its November 13 filing, the fund held 2,879,300 shares as of September 30, 2026. Important detail: this is an investment in the company, not proof of direct HYPE token purchases. 📊 HYPE MARKET UPDATE: - Current Price: $70.37 - 24H Change: -2.89% - 24H Low: $69.48 - 24H High: $75.32 - Market Cap: $17.85B 🏦 Institutional exposure could strengthen confidence in the Hyperliquid ecosystem, but it does not guarantee a token rally. Is this a bullish signal for $HYPE ? #WSOT2026 #TradFiForBeginners $HYPE
🚨MAJOR INSTITUTIONAL INTEREST IN HYPERLIQUID!
🐋 Healthcare of Ontario Pension Plan Trust Fund, a major Canadian pension manager with approximately $62 billion in reported assets, disclosed a $35.33 million position in Hyperliquid Strategies. According to its November 13 filing, the fund held 2,879,300 shares as of September 30, 2026. Important detail: this is an investment in the company, not proof of direct HYPE token purchases. 📊 HYPE MARKET UPDATE: - Current Price: $70.37 - 24H Change: -2.89% - 24H Low: $69.48 - 24H High: $75.32 - Market Cap: $17.85B 🏦 Institutional exposure could strengthen confidence in the Hyperliquid ecosystem, but it does not guarantee a token rally. Is this a bullish signal for $HYPE ? #WSOT2026 #TradFiForBeginners $HYPE
302
·
--
Article
🔴 CRYPTO MARKET FACES SIXTH CONSECUTIVE RED WEEK! The crypto market is experiencing intense selling pressure, with Bitcoin heading toward its sixth consecutive weekly loss. Major cryptocurrencies are falling together, raising concerns among investors. 📉 LATEST PRICE SNAPSHOT (NOV 13): - BTC: $66,456 — down 8.99% weekly - ETH: $1,878.00 — down 12.6% weekly - SOL: $74.85 — down 10.96% weekly - XRP: Around $1.00 ⚠️ WHAT'S DRIVING THE DUMP? More than $1 billion flowed out of Bitcoin ETFs during the week, while approximately $1.56 billion in BTC positions were liquidated. A stronger dollar, higher interest-rate expectations, and weak risk appetite are adding pressure. Is this market manipulation? The synchronized decline looks alarming, but these figures alone do not prove manipulation. Could this sell-off become a major accumulation opportunity, or is more downside coming? #WSOT2026 $BTC $SOL #MANTRAPausesUnstakingFor7DaysAfterKeplrSecurityIncident #WhatWillDriveCryptoandStocks’NextRebound? #USCryptoETFsLose$1.48BInFiveDays
🔴 CRYPTO MARKET FACES SIXTH CONSECUTIVE RED WEEK!
The crypto market is experiencing intense selling pressure, with Bitcoin heading toward its sixth consecutive weekly loss. Major cryptocurrencies are falling together, raising concerns among investors. 📉 LATEST PRICE SNAPSHOT (NOV 13): - BTC: $66,456 — down 8.99% weekly - ETH: $1,878.00 — down 12.6% weekly - SOL: $74.85 — down 10.96% weekly - XRP: Around $1.00 ⚠️ WHAT'S DRIVING THE DUMP? More than $1 billion flowed out of Bitcoin ETFs during the week, while approximately $1.56 billion in BTC positions were liquidated. A stronger dollar, higher interest-rate expectations, and weak risk appetite are adding pressure. Is this market manipulation? The synchronized decline looks alarming, but these figures alone do not prove manipulation. Could this sell-off become a major accumulation opportunity, or is more downside coming? #WSOT2026 $BTC $SOL #MANTRAPausesUnstakingFor7DaysAfterKeplrSecurityIncident #WhatWillDriveCryptoandStocks’NextRebound? #USCryptoETFsLose$1.48BInFiveDays
238

·
--
🚨BREAKING: $140 BILLION IN GOLD MARKET VALUE REPORTEDLY WIPED OUT! A dramatic claim is circulating that approximately $140 billion in gold market value disappeared in just one minute, highlighting the extreme volatility shaking precious-metal markets.
Gold has faced significant selling pressure, recently falling below the important $4,000 per ounce level. On November 12, Reuters reported gold trading around $3,948.82 per ounce, as a stronger US dollar and rising expectations of Federal Reserve rate hikes weighed on prices.
IMPORTANT: The one-minute $140 billion figure has not been independently verified. Market-value losses represent estimated changes in valuation, not necessarily actual money withdrawn.
Will gold recover, or could more downside be ahead?
#WSOT2026 $XAUT #USDT🔥🔥🔥 $BTC $USDT
🚨BREAKING: $140 BILLION IN GOLD MARKET VALUE REPORTEDLY WIPED OUT! A dramatic claim is circulating that approximately $140 billion in gold market value disappeared in just one minute, highlighting the extreme volatility shaking precious-metal markets.
Gold has faced significant selling pressure, recently falling below the important $4,000 per ounce level. On November 12, Reuters reported gold trading around $3,948.82 per ounce, as a stronger US dollar and rising expectations of Federal Reserve rate hikes weighed on prices.
IMPORTANT: The one-minute $140 billion figure has not been independently verified. Market-value losses represent estimated changes in valuation, not necessarily actual money withdrawn.
Will gold recover, or could more downside be ahead?
#WSOT2026 $XAUT #USDT🔥🔥🔥 $BTC $USDT
Gold has faced significant selling pressure, recently falling below the important $4,000 per ounce level. On November 12, Reuters reported gold trading around $3,948.82 per ounce, as a stronger US dollar and rising expectations of Federal Reserve rate hikes weighed on prices.
IMPORTANT: The one-minute $140 billion figure has not been independently verified. Market-value losses represent estimated changes in valuation, not necessarily actual money withdrawn.
Will gold recover, or could more downside be ahead?
#WSOT2026 $XAUT #USDT🔥🔥🔥 $BTC $USDT

290

·
--
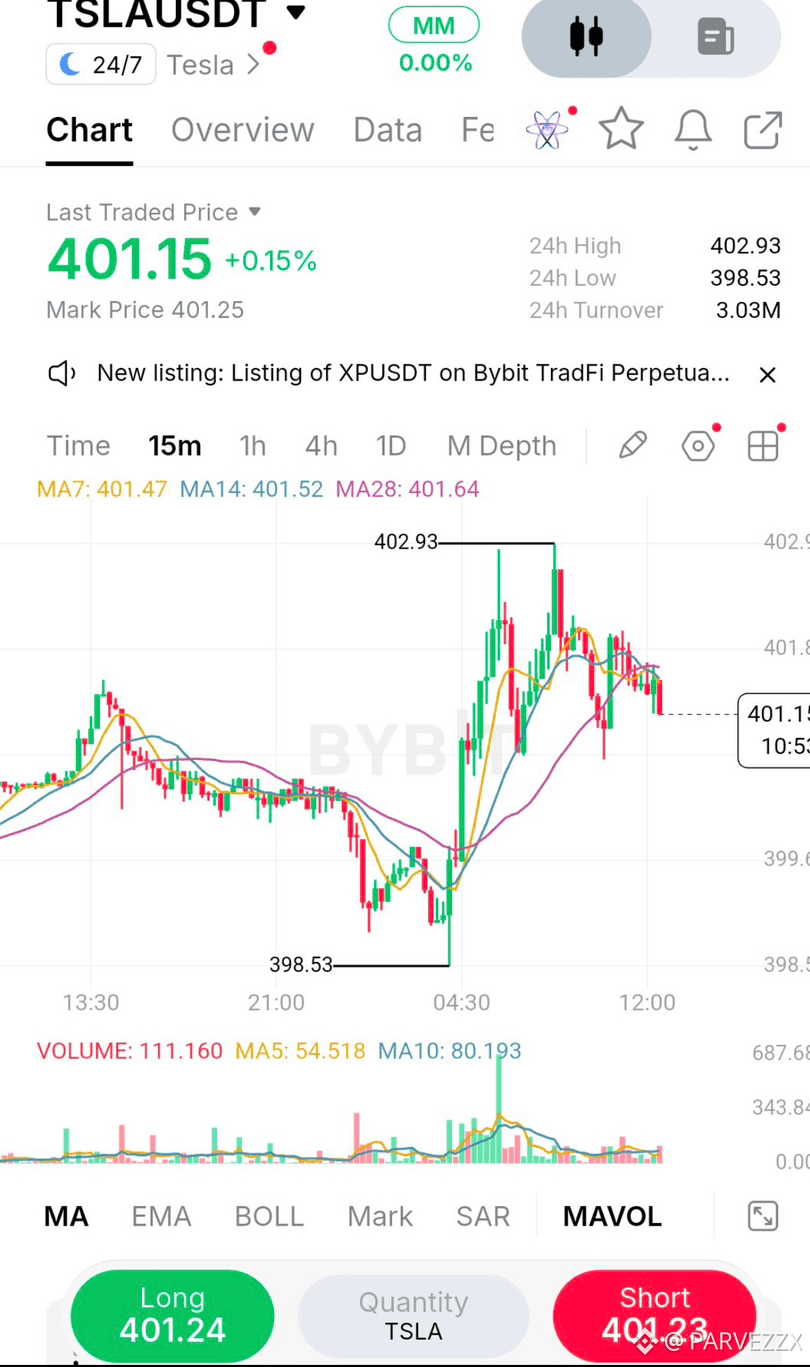
I watched that sharp spike off 398.53 and chose not to chase it. Right now, on the 15m TSLAUSDT chart, price is compressing between 400.50 and the 402.93 high. What stands out is the faded volume following the initial impulse usually a sign buyers are exhausted and a pullback is brewing.
When volume dries up at the highs, it rarely means the move is over; it usually means the market is taking a breath. But if that breath turns into a heavy sell-off without buyers stepping in, the structure shifts quickly. I've been burned before by assuming every tight consolidation is just a pause before continuation. That's why I'm letting the chart come to me instead of forcing an entry mid-range.
I'm waiting for a lower-risk test of structure rather than buying the top. A pullback into 399.50-
400.50 would let me align with the 15m moving averages (currently pinching around 401.50) and the midpoint of that impulse leg. If price pushes straight to 406 without a retest, I simply miss the trade. I'm okay with that. There will be another setup.
Bias: LONG
Entry Zone: $399.50 - $400.50
Confirmation: A bullish 15m close (rejection wick) inside the zone.
Stop / Invalidation: $398.40 (Just below the recent swing low)
TP1: $402.50
TP2: $406.00
R:R: 1:2
The main risk? A complete rejection at 402.93 leaving a double top, or a slow bleed that slices right through 398.53. I won't blindly catch a falling knife; I need to see buyers step in first. My personal rule here: waiting for a retest typically provides a tighter stop and better R:R than entering mid-range. Are you buying this breakout or waiting for the dip?
$TSLAB $BTC
#IMPACTbyTrade #WSOT2026
{spot}(TSLABUSDT)
{future}(BTCUSDT)
I watched that sharp spike off 398.53 and chose not to chase it. Right now, on the 15m TSLAUSDT chart, price is compressing between 400.50 and the 402.93 high. What stands out is the faded volume following the initial impulse usually a sign buyers are exhausted and a pullback is brewing.
When volume dries up at the highs, it rarely means the move is over; it usually means the market is taking a breath. But if that breath turns into a heavy sell-off without buyers stepping in, the structure shifts quickly. I've been burned before by assuming every tight consolidation is just a pause before continuation. That's why I'm letting the chart come to me instead of forcing an entry mid-range.
I'm waiting for a lower-risk test of structure rather than buying the top. A pullback into 399.50-
400.50 would let me align with the 15m moving averages (currently pinching around 401.50) and the midpoint of that impulse leg. If price pushes straight to 406 without a retest, I simply miss the trade. I'm okay with that. There will be another setup.
Bias: LONG
Entry Zone: $399.50 - $400.50
Confirmation: A bullish 15m close (rejection wick) inside the zone.
Stop / Invalidation: $398.40 (Just below the recent swing low)
TP1: $402.50
TP2: $406.00
R:R: 1:2
The main risk? A complete rejection at 402.93 leaving a double top, or a slow bleed that slices right through 398.53. I won't blindly catch a falling knife; I need to see buyers step in first. My personal rule here: waiting for a retest typically provides a tighter stop and better R:R than entering mid-range. Are you buying this breakout or waiting for the dip?
$TSLAB $BTC
#IMPACTbyTrade #WSOT2026
When volume dries up at the highs, it rarely means the move is over; it usually means the market is taking a breath. But if that breath turns into a heavy sell-off without buyers stepping in, the structure shifts quickly. I've been burned before by assuming every tight consolidation is just a pause before continuation. That's why I'm letting the chart come to me instead of forcing an entry mid-range.
I'm waiting for a lower-risk test of structure rather than buying the top. A pullback into 399.50-
400.50 would let me align with the 15m moving averages (currently pinching around 401.50) and the midpoint of that impulse leg. If price pushes straight to 406 without a retest, I simply miss the trade. I'm okay with that. There will be another setup.
Bias: LONG
Entry Zone: $399.50 - $400.50
Confirmation: A bullish 15m close (rejection wick) inside the zone.
Stop / Invalidation: $398.40 (Just below the recent swing low)
TP1: $402.50
TP2: $406.00
R:R: 1:2
The main risk? A complete rejection at 402.93 leaving a double top, or a slow bleed that slices right through 398.53. I won't blindly catch a falling knife; I need to see buyers step in first. My personal rule here: waiting for a retest typically provides a tighter stop and better R:R than entering mid-range. Are you buying this breakout or waiting for the dip?
$TSLAB $BTC
#IMPACTbyTrade #WSOT2026
99
Log in to explore more content
Join global crypto users on Binance Square
⚡️ Get latest and useful information about crypto.
💬 Trusted by the world’s largest crypto exchange.
👍 Discover real insights from verified creators.
Email / Phone number
Trending Topics
1
#NvidiaBeatsEstimatesWith$130BQ4Outlook
17,261 views
197 Discussing
2
#AnthropicIPOPriceCouldExceed$80
22,019 views
171 Discussing
3
#RussiaCentralBankAddsAlfaBankToCryptoExchangeRegister
0 views
5 Discussing
4
#RussianCentralBankPlansToAllowFundsToHoldCryptoIn2027
0 views
2 Discussing
5
#VisaPlansStablecoinPrefundingForAPACCrossBorderPayments
0 views
4 Discussing
6
#CanNvidia’sDataCenterGrowthContinue?
65,350 views
889 Discussing
7
#CanadaAndUSLaunchOperationNiagaraAgainstApprovalPhishing
5,807 views
46 Discussing
8
#BankOfEnglandUnveilsClearingHousePathwayCoveringDLTFirms
2,628 views
54 Discussing
9
#DBSAndCirclePartnerToExpandAsianInstitutionsUSDCAccess
3,856 views
60 Discussing
10
#LedgerHardwareImplantReportsExtendToDubai
31,123 views
412 Discussing