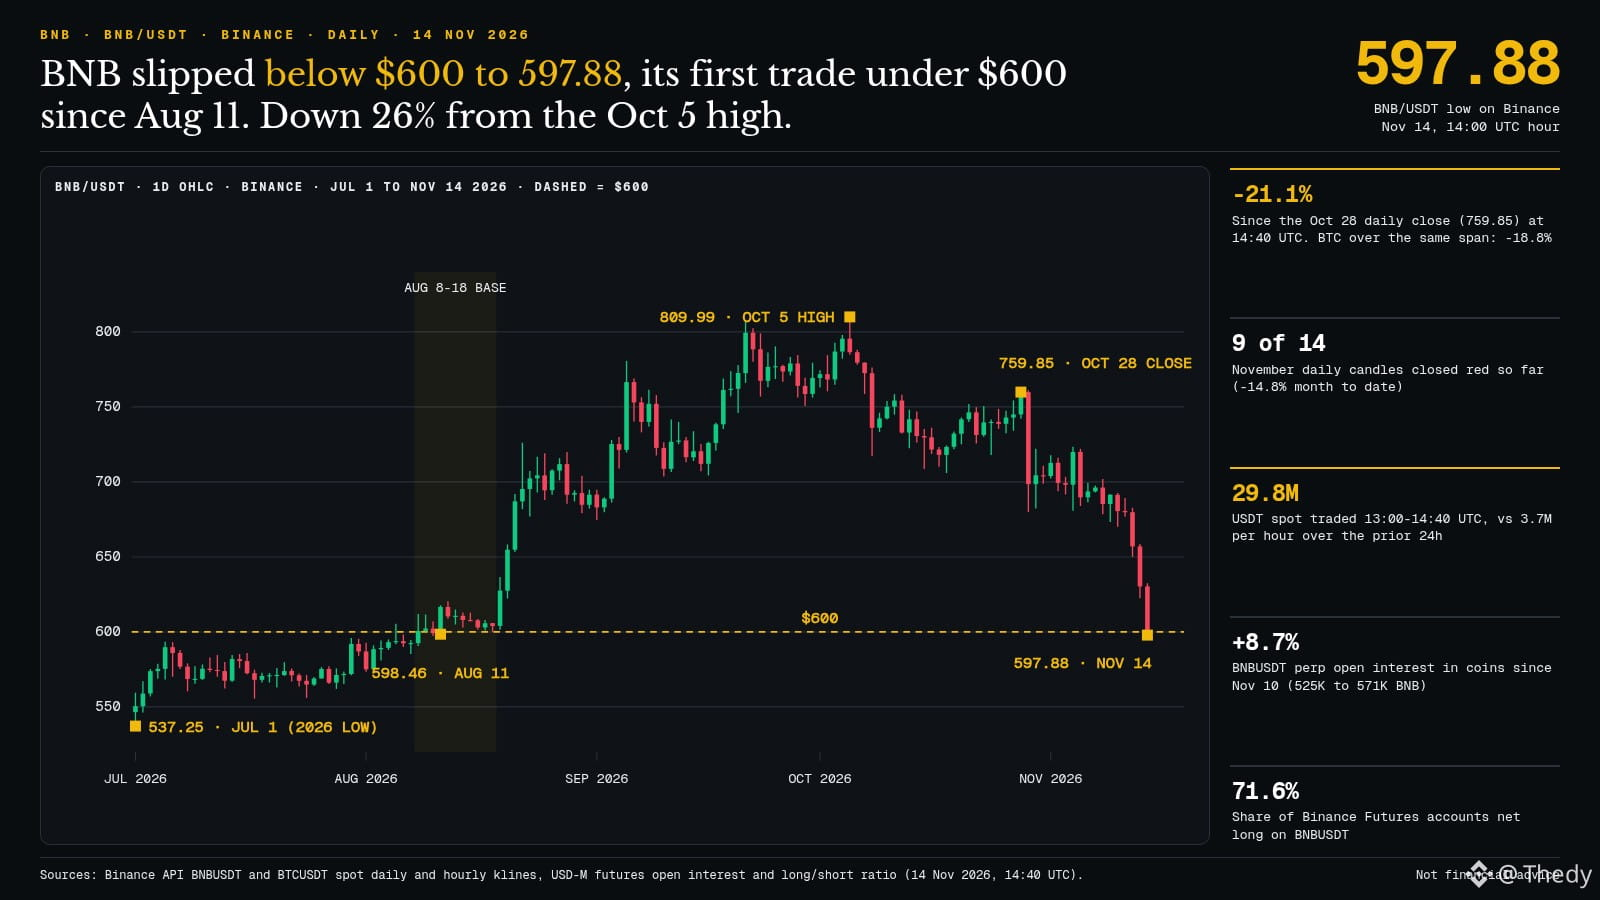
The $BNB fell back below $600 this Saturday, 14/11, on Binance: it hit a low of $597.88 during the 14:00 UTC hour, the first time since August 11. On Thursday, I noted that losing $650 would put the August low near $622 back in play. Both levels have since given way.
The last time BNB was trading at this price, the backdrop was very different.
In August, it spent 11 sessions (from 08/08 to 18/08) hovering around $600, with a floor of $597.32 on 10/08. Selling was absorbed. On 19/08, it took off: from $603.94 to $726.08 on 22/08, up 20% in four days.
This time, it’s coming down from above, and accelerating. Since the 28/10 close ($759.85), it has fallen 21.1% as of 14:40 UTC, compared with -18.8% for $BTC . November has seen 9 red daily candles out of 14. Between 13:00 and 14:40 UTC, $29.8M was traded on BNB/USDT, compared with an average of $3.7M per hour over the previous 24 hours.
Another difference is derivatives. BNBUSDT perpetual open interest has risen from 525,000 to 571,000 BNB since 10/11 (+8.7%) during the drop, and 71.6% of Binance Futures accounts remain long, with funding at 0.00%. So many longs were opened during the decline, which could accelerate moves if the price slips further.
My take: without a daily close above $600, the August zone remains a test, not support. Below $597, the next reference point is the July zone ($555–$575), followed by the 2026 low of $537.25 (01/07). A quick move back above $622 would change the tone.
Do you see $600 as a base like in August, or just a stop on the way to a long squeeze?
#BNB #Binance
Sources: Binance API, BNBUSDT and BTCUSDT (spot, open interest, long/short ratio, funding, 14/11 14:40 UTC). Not financial advice.
The last time BNB was trading at this price, the backdrop was very different.
In August, it spent 11 sessions (from 08/08 to 18/08) hovering around $600, with a floor of $597.32 on 10/08. Selling was absorbed. On 19/08, it took off: from $603.94 to $726.08 on 22/08, up 20% in four days.
This time, it’s coming down from above, and accelerating. Since the 28/10 close ($759.85), it has fallen 21.1% as of 14:40 UTC, compared with -18.8% for $BTC . November has seen 9 red daily candles out of 14. Between 13:00 and 14:40 UTC, $29.8M was traded on BNB/USDT, compared with an average of $3.7M per hour over the previous 24 hours.
Another difference is derivatives. BNBUSDT perpetual open interest has risen from 525,000 to 571,000 BNB since 10/11 (+8.7%) during the drop, and 71.6% of Binance Futures accounts remain long, with funding at 0.00%. So many longs were opened during the decline, which could accelerate moves if the price slips further.
My take: without a daily close above $600, the August zone remains a test, not support. Below $597, the next reference point is the July zone ($555–$575), followed by the 2026 low of $537.25 (01/07). A quick move back above $622 would change the tone.
Do you see $600 as a base like in August, or just a stop on the way to a long squeeze?
#BNB #Binance
Sources: Binance API, BNBUSDT and BTCUSDT (spot, open interest, long/short ratio, funding, 14/11 14:40 UTC). Not financial advice.